1. Introduction
Education is critical in determining success in various fields and professions, so the education sector is essential to any country’s development. Paying attention to the education system as a national investment is vital. It is one of the most valuable pieces of capital stored in human existence and contributes to production [
1]. The educational system of any nation reflects the nation’s inner and mental prowess, as well as its governing philosophy. On the one hand, it fosters the internal skills and abilities of society’s members, and on the other, it can pave the way for the nation’s independence, advancement, and development [
2]. Quality education ensures a nation’s future and accelerates its progress and development; therefore, evaluating performance and increasing efficiency in schools as the primary educational institution is of utmost importance [
3].
Regardless of their mission, objectives, and vision, institutions and executive bodies must eventually operate in the national or international territory and answer to consumers, clients, and beneficiaries; high schools in the education system are not an exception to this rule [
4,
5]. Moreover, evaluating the performance of schools and ranking them to choose the best alternative is also extremely essential because, after the family, schools play a large part in raising children and directing them to the proper route in life. Because educational institutions play a crucial role in advancing societies’ economic and cultural goals, both qualitatively and quantitatively, evaluating their performance to identify points that can be improved and their quality can be one of society’s most fundamental challenges [
6].
About the topic under discussion, two significant challenges will be addressed in this research: (1) Normally, in this field, the four axis of educational activities, human resources, space and equipment, and administrative-financial indicators, are used to evaluate the schools’ activities [
7]. Despite the importance and effectiveness, the above four indicators in evaluating schools are not comprehensive and do not include effective indicators such as social environment, students, health, etc. (2) Specifically, in Iran (and most likely in some other countries), the evaluation of schools is carried out quantitatively and only by the upstream institutions. In contrast, the view of different stakeholders of this system, namely the students’ parents, are ignored in this process and, perhaps more importantly, qualitative-judgmental indicators do not affect the school evaluation results.
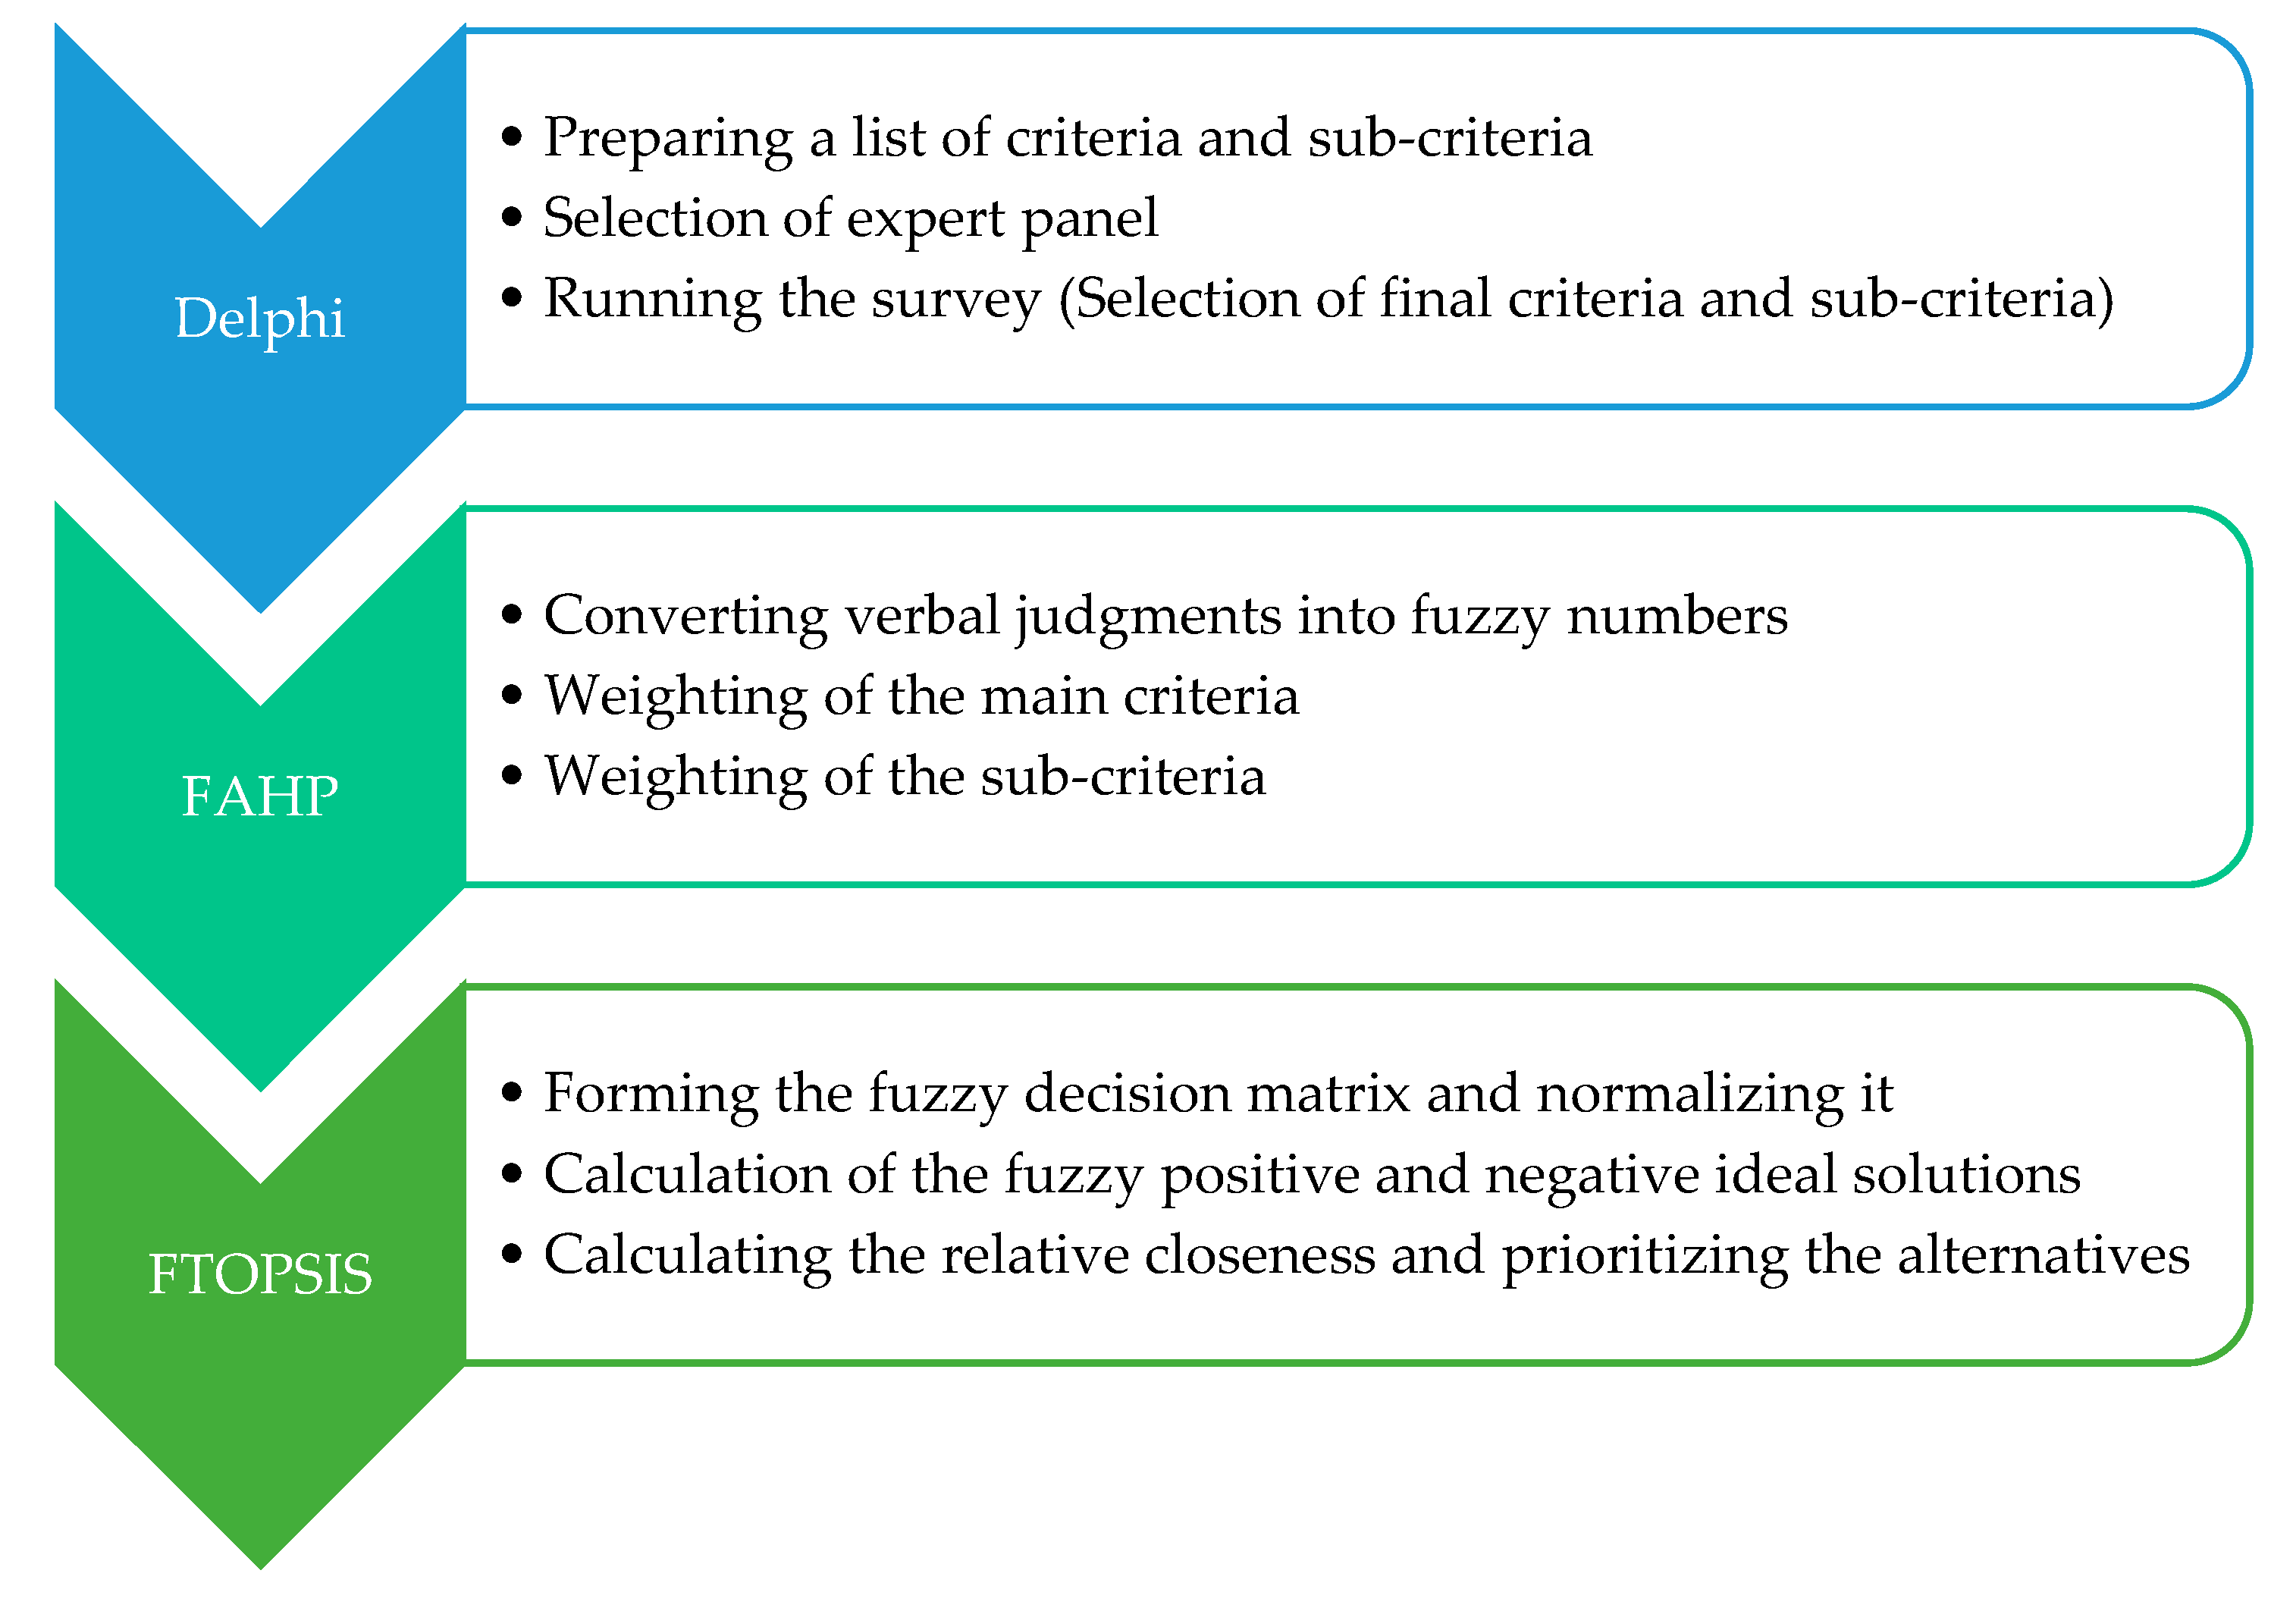
Considering the previously mentioned challenges, in this study, we first use the research background and the views of the experts to identify effective indicators for evaluating and ranking schools. Our two main goals at this stage are that the practical and critical indicators, compared to previous studies, are more comprehensive and the other is that the views of both key stakeholders of this system (experts and parents of students) are considered in the evaluation. In the decision-making literature, the next issue is determining their weights after identifying the indicators. As expected, in a problem of this size, the number of leading indicators and sub-indices is large. Recently, it has been suggested that in facing big problems, simplifying the problem is a suitable solution [
8]. Based on this, we remove the less essential sub-indices using the Delphi technique and then determine the weights using one of the most well-known weighting tools, i.e., the AHP. The next matter concerns how to face the ambiguities in the verbal judgments of experts. When the evaluation is vague and ambiguous in certain aspects, fuzzy multi-criteria decision-making methods are preferred. They are the most appropriate answer, which has recently attracted the attention of many researchers [
9,
10,
11,
12,
13,
14,
15,
16,
17,
18]. Based on this, we also use fuzzy AHP in this research. Finally, we use another widely applied method in this field to rank the alternatives, i.e., fuzzy TOPSIS. It should be noted that combining the above two methods for evaluating and ranking options is the most frequent combination researchers use to solve decision-making problems compared to other possible combinations [
19,
20,
21,
22].
This being the case, the proposed approach is a simple and well-known hybrid in the field of decision making and prioritization of schools, which uses more comprehensive indicators than previous studies and considers the views of the two primary stakeholders of the system. To introduce the proposed approach more precisely, we investigated high schools in Tehran, Iran. The other sections of the article are organized as follows: In the next section, the research methodology, including the method and type of research, the sample under review, data collection methods, and questionnaire preparation, is described. Next,
Section 3 explains the proposed process, data analysis, and results. Finally,
Section 4 includes the conclusions and discussions.
2. Literature Review
In this section, some studies related to the subject are briefly examined. The first part of the background is dedicated to the studies from which the relevant indicators for ranking were adopted. The other part of this section refers to the review of the methods used for ranking in some previous investigations. To generate knowledge, identify gaps, and then point out potential future contributions to the area of expertise, Valmorbida et al. [
23] analyzed the characteristics of international scientific publications that address the literature fragment of evaluating the performance of university rankings. For more details, see also [
24,
25,
26,
27,
28,
29,
30,
31,
32,
33].
Moore et al. [
34] examined the connection between college students’ impressions of teachers’ accessibility and their evaluations of those teachers’ classes. They administered instruments to 266 students to gauge the frequency of teachers’ verbal and nonverbal immediacy behaviors and to collect students’ assessments of the quality of instruction. It was revealed that student evaluations of education were significantly positively correlated with the degree to which the material was immediately applicable. Yeşil [
35] investigated the relationship between the communication abilities of prospective teachers and their attitude regarding teaching performance in the Turkish Republic of Northern Cyprus. Tunçeli [
36] investigated how prospective preschool teachers’ communication ability and overall outlook on the field were connected. Findings showed no significant differences in communication skills and attitudes among future teachers based on gender or grade level. It was also revealed that the value sub-dimension of the scale correlates positively and significantly with the communication skills of prospective instructors. Certa et al. [
37] presented a systematic approach to assess a graduate-level training program’s efficacy. The evaluation process determined the program’s overall effectiveness by contrasting the course’s broad goals with the outcomes most valued by the students. The evaluation process has been streamlined through linguistic variable modeling applied to the responses. Brusca et al. [
38] analyzed the method IC disclosed on the universities’ websites in three European countries to evaluate how universities communicate intellectual capital (IC) to their stakeholders and discover potential patterns and trends. The correlation between university rankings as a surrogate for performance and the amount and nature of IC Web disclosure is also investigated. Nicol et al. [
39] investigated academic success and open exposure of intellectual capital in the setting of Italian public universities. The content analysis results demonstrate that Italian public universities highly value the disclosure of human capital information.
Multivariate analysis results corroborate that better-performing Italian public universities tend to provide more detail about IC and its constituent parts. To assess the impact of the COVID-19 pandemic on educational outcomes, Gardas and Navimipour [
6] presented empirical research to determine the constructs (latent variables) affected primarily by the pandemic. The findings indicate that “compatibility with online mode” and “new opportunities” substantially impact students’ academic success. Wanke et al. [
40] looked into the performance and effectiveness of Brazil’s Federal Institute of Education, which comprises schools nationwide and caters to students of various ages and stages. They built and examined a covariance matrix that included efficiency measurements and performance indicators employed by the Brazilian Ministry of Education. Using the TOPSIS, they maximized the values in the covariance matrix. Researchers found no correlation between official performance indicators and the study’s preferred metrics of optimal solution effectiveness.
Wu et al. [
41] studied the performance evaluation indices for higher education based on the official performance evaluation structure developed by the Taiwan assessment. They ranked 12 private universities that the Ministry of Education listed as a case study. They adopted the analytic hierarchy process (AHP) and VIKOR model to help universities optimize their performances efficiently. Das et al. [
42] presented the evaluation system for technical institutes in Indian states. Their research focuses on how a systematic process can be used in a MADM setting to evaluate and rank a group of engineering schools. Their work’s innovative aspect is combining the fuzzy AHP approach and MOOSRA into a single framework for assessing the effectiveness of India’s technical institutions. Musani and Jemain [
43] developed a methodology for objectively evaluating educational institutions based on linguistic data. They mentioned five possible performance measures in linguistics, excellent, honors, mediocre, pass and fail, and the level of academic achievement can be approximated by a fuzzy number based on linguistic features. The outcomes proved that fuzzy set theory could deal with the data uncertainty problems that hinder the usefulness of MADM. Ranjan and Chakraborty [
44] evaluated twenty Indian National Institutes of Technology (NITs) using a PROMETHEE and GAIA techniques hybrid. They employed faculty strength, teacher-student ratio, number of conferences held in the last five years, number of papers published in journals in the previous five years, research grants, campus area, placement of students, number of books and online journals available in the library and the course fees to rank the alternatives. Al Qubaisi et al. [
45] developed an AHP model to assess the quality of educational institutions and conduct school inspections. The group worked to identify the school’s weighting criteria and create a performance system using the AHP model as a foundation. The school administration can use the proposed structure to address its competitive advantages concerning competing institutions on various fronts. Adhikari et al. [
46] suggested an integrated MADM regression-based methodology to evaluate the schools’ input-level performance and explore the influence of this performance combined with contextual factors. West Bengal, India, is home to 82,930 primary and secondary schools, all evaluated using the proposed technique to measure performance at the input level. Their results implied that all these factors significantly affect boys’ passing rate, but girls’ passing rate is affected only by input-level performance and school location. Gul and Yucesan [
47] created university rankings in Turkey using metrics based on institutional effectiveness. The Bayesian best-worst method is used here to assign relative importance to the thirty-four criteria that fall within the five overarching criteria. Then, the TOPSIS approach determines how the 189 mentioned public and private universities should be rated.
4. Case Study
This research used 15 Iranian secondary high schools in Tehran to explain the proposed methodology.
In the first step of the proposed methodology, it was necessary to prepare a list of the problem criteria and sub-criteria. Criteria, including management staff, credits and costs, educational equipment, library, educational leadership, teaching and learning process, and administrative affairs, were acquired from the background of the research. Because these criteria were not comprehensive, we proposed three criteria, social environment, health, and students (along with their sub-criteria), to perform a more detailed analysis (see
Table 3).
Furthermore, a total of 108 sub-criteria have been identified for the main criteria as follows:
For the management staff (C1), we have the following 14 sub-criteria:
S11: The proportion of teachers with a bachelor’s degree or higher to the total number of teachers;
S12: The proportion of teachers with a field of study related to the subject;
S13: The ratio of teaching to all teachers;
S14: The average age of teachers;
S15: The average service history of teachers;
S16: The average teaching hours of teachers per week;
S17: The training courses completed by teachers;
S18: The manager’s degree;
S19: The manager’s field;
S110: The amount of service history of the manager in management or deputy positions;
S111: The training courses (specialized) completed by the managers and deputies;
S112: The degree of deputies;
S113: The field of study of deputies;
S114: The average service history of deputies.
For the credits and costs (C2), we have the following 9 sub-criteria:
S21: The per capita student;
S22: The ratio of income from extracurricular and public assistance, etc., to the student;
S23: The ratio of incurred expenses to approved expenses;
S24: The ratio of costs incurred to motivate teachers to the total budget;
S25: The ratio of educational expenses to total costs;
S26: The ratio of breeding expenses to total expenses;
S27: Cost per student;
S28: The proportion of expenditures with the approved budget;
S29: The quality of positive documents of costs.
For the educational equipment (C3), we have the following 12 sub-criteria:
S31: Per capita student space;
S32: The ratio of the number of students to the toilets;
S33: The ratio of breeding space to the total area;
S34: The sports space per capita;
S35: The ratio of the number of students to the classroom space;
S36: The ratio of printers and photocopying machines to the needs of the school;
S37: The ratio of the number of computers to students;
S38: Suitability of educational tools and materials to students’ needs;
S39: The degree of up-to-date educational equipment and materials;
S310: Quality of teaching materials and tools;
S311: Variety of educational materials and tools;
S312: Suitability of tables, benches, and chairs to the needs of students.
For the library (C4), we have the following 5 sub-criteria:
S41: The ratio of available books to students;
S42: The ratio of the number of CDs, educational videos, and tapes to students;
S43: The ratio of books, journals, and teaching guides to teachers;
S44: The average of teachers who use up-to-date books and publications;
S45: The average number of students using the updated library.
For educational leadership (C5), we have the following 25 sub-criteria:
S51: Number of training programs held for teachers;
S52: The ratio of the number of encouraged teachers to the total number of teachers;
S53: The ratio of the number of encouraged students to the total number of students;
S54: The quality of setting annual school programs;
S55: How to implement annual programs;
S56: The quality of compiling quarterly reports and sending them to the regional management;
S57: The reopening of the school on time and the preparation of teachers and students;
S58: Formation of school councils on time;
S59: The quality of council meetings;
S510: Registering and maintaining records and minutes of council meetings;
S5111: How to implement council approvals;
S512: The quality of actions performed in national and religious celebrations;
S513: How to perform the morning ceremony;
S514: The quality of congregational prayers;
S515: How to use leisure time;
S516: Actions were taken to identify the strengths and weaknesses of teachers;
S517: The number of training programs held for teachers;
S518: The ability of the manager to evaluate the performance of teachers;
S519: How to inform broadcast programs and instructions;
S520: The level of familiarity of the manager with the description of the duties of the employees;
S521: The manager’s familiarity with the principles and skills of educational management;
S522: The extent of the manager’s familiarity with the principles and philosophy of education;
S523: The manager’s familiarity with the principles of psychology;
S524: The degree of the manager’s familiarity with the laws and regulations of education;
S525: The quality of transportation service for students.
For health (C6), we have the following 3 sub-criteria:
S61: The number of students examined in terms of health and treatment;
S62: The quality of Bogue food;
S63: Health quality of the school environment.
For the students (C7), we have the following 16 sub-criteria:
S71: Average GPA of incoming students;
S72: The ratio of students to teachers;
S73: The ratio of students to classes;
S74: The ratio of students participating in camps and scientific trips to all students;
S75: The ratio of students participating in scientific, laboratory, Olympiads, artistic, and sports competitions to the total number of students;
S76: The ratio of students participating in extracurricular classes to total students;
S77: The number of exhibitions held of students’ scientific, cultural, and artistic activities;
S78: The rate of students who have completed their education within the official period;
S79: The average annual grade point average of students;
S710: The middle passing grade of each semester;
S711: Pass percentage of each semester;
S712: Annual acceptance rate;
S713: The amount of students’ participation in class management;
S714: The amount of student participation in group work;
S715: The level of student participation in decision making and planning;
S716: The condition of students’ appearance.
For the teaching and learning process (C8), we have the following 14 sub-criteria:
S81: The amount of use of educational technology in the teaching process;
S82: Status of planning to improve educational quality;
S83: Analysis of the results of academic progress;
S84: Providing feedback on the results of academic achievement tests;
S85: The number of teachers using the plan;
S86: The amount of teachers’ use of educational tools and materials;
S87: The amount of teachers’ use of various teaching strategies;
S88: The extent to which teachers use multiple methods of evaluating academic progress;
S89: The level of familiarity of teachers with the goals and content of lessons;
S810: The level of collaboration and exchange of teachers’ experiences with each other;
S811: The level of teachers’ familiarity with educational goals, regulations, and guidelines;
S812: The level of teachers’ participation in decision making and planning;
S813: How to schedule teachers’ meetings with parents;
S814: The amount of teachers’ use of laboratories and workshops.
For administrative affairs (C9), we have the following 6 sub-criteria:
S91: How to register students;
S92: The quality of student’s academic records;
S93: The quality of personnel and job files of employees;
S94: Quality office property;
S95: The quality of the examination book;
S96: The quality of the statistical office.
For the social environment (C10), we have the following 4 sub-criteria:
S101: Cultural status of parents of students;
S102: Economic status of parents of students;
S103: Educational level of students’ parents;
S104: Parents’ satisfaction with the school.
In the next step, we created a panel of research experts. Since in this research, in addition to the views of organizational experts, we wanted to include the opinions of another primary beneficiary of this system, i.e., the parents of the students, we selected five people from each group. Five school principals with at least five years of continuous school management were determined among the organizational experts. Among the students’ parents, those who continuously had at least three years of membership in the Parents-Teachers Association were selected.
In the following step, each group member was first given a questionnaire including the sub-criteria. We asked the experts to rate each sub-criteria’s importance on a scale of 0 (completely unimportant) to 10 (completely important). In the initial screening, the points assigned by experts for all sub-criteria were between 3 and 10. For example, the first-round results for the social environment (C
10) are shown in
Table 4 and
Table 5.
After reviewing the answers provided by the experts in the first round, to reduce the sub-criteria which are less important, we suggested to the experts that the sub-criteria that scored less than seven be removed. With the acceptance of this proposal by all the research experts, these sub-criteria were excluded from further investigation, as shown in
Table 5, and 53 sub-criteria were considered for further studies in the second round. It should be noted that all the research experts participated in both survey rounds and completely analyzed the points.
In the second round, based on the same previous scale from 0 to 10, the experts determined the importance of each sub-criteria, an example of which is shown in
Table 6.
It should be noted that Kendall’s coefficient of concordance [
58] was used to calculate the agreement of experts’ views, and the results are shown in
Table 7.
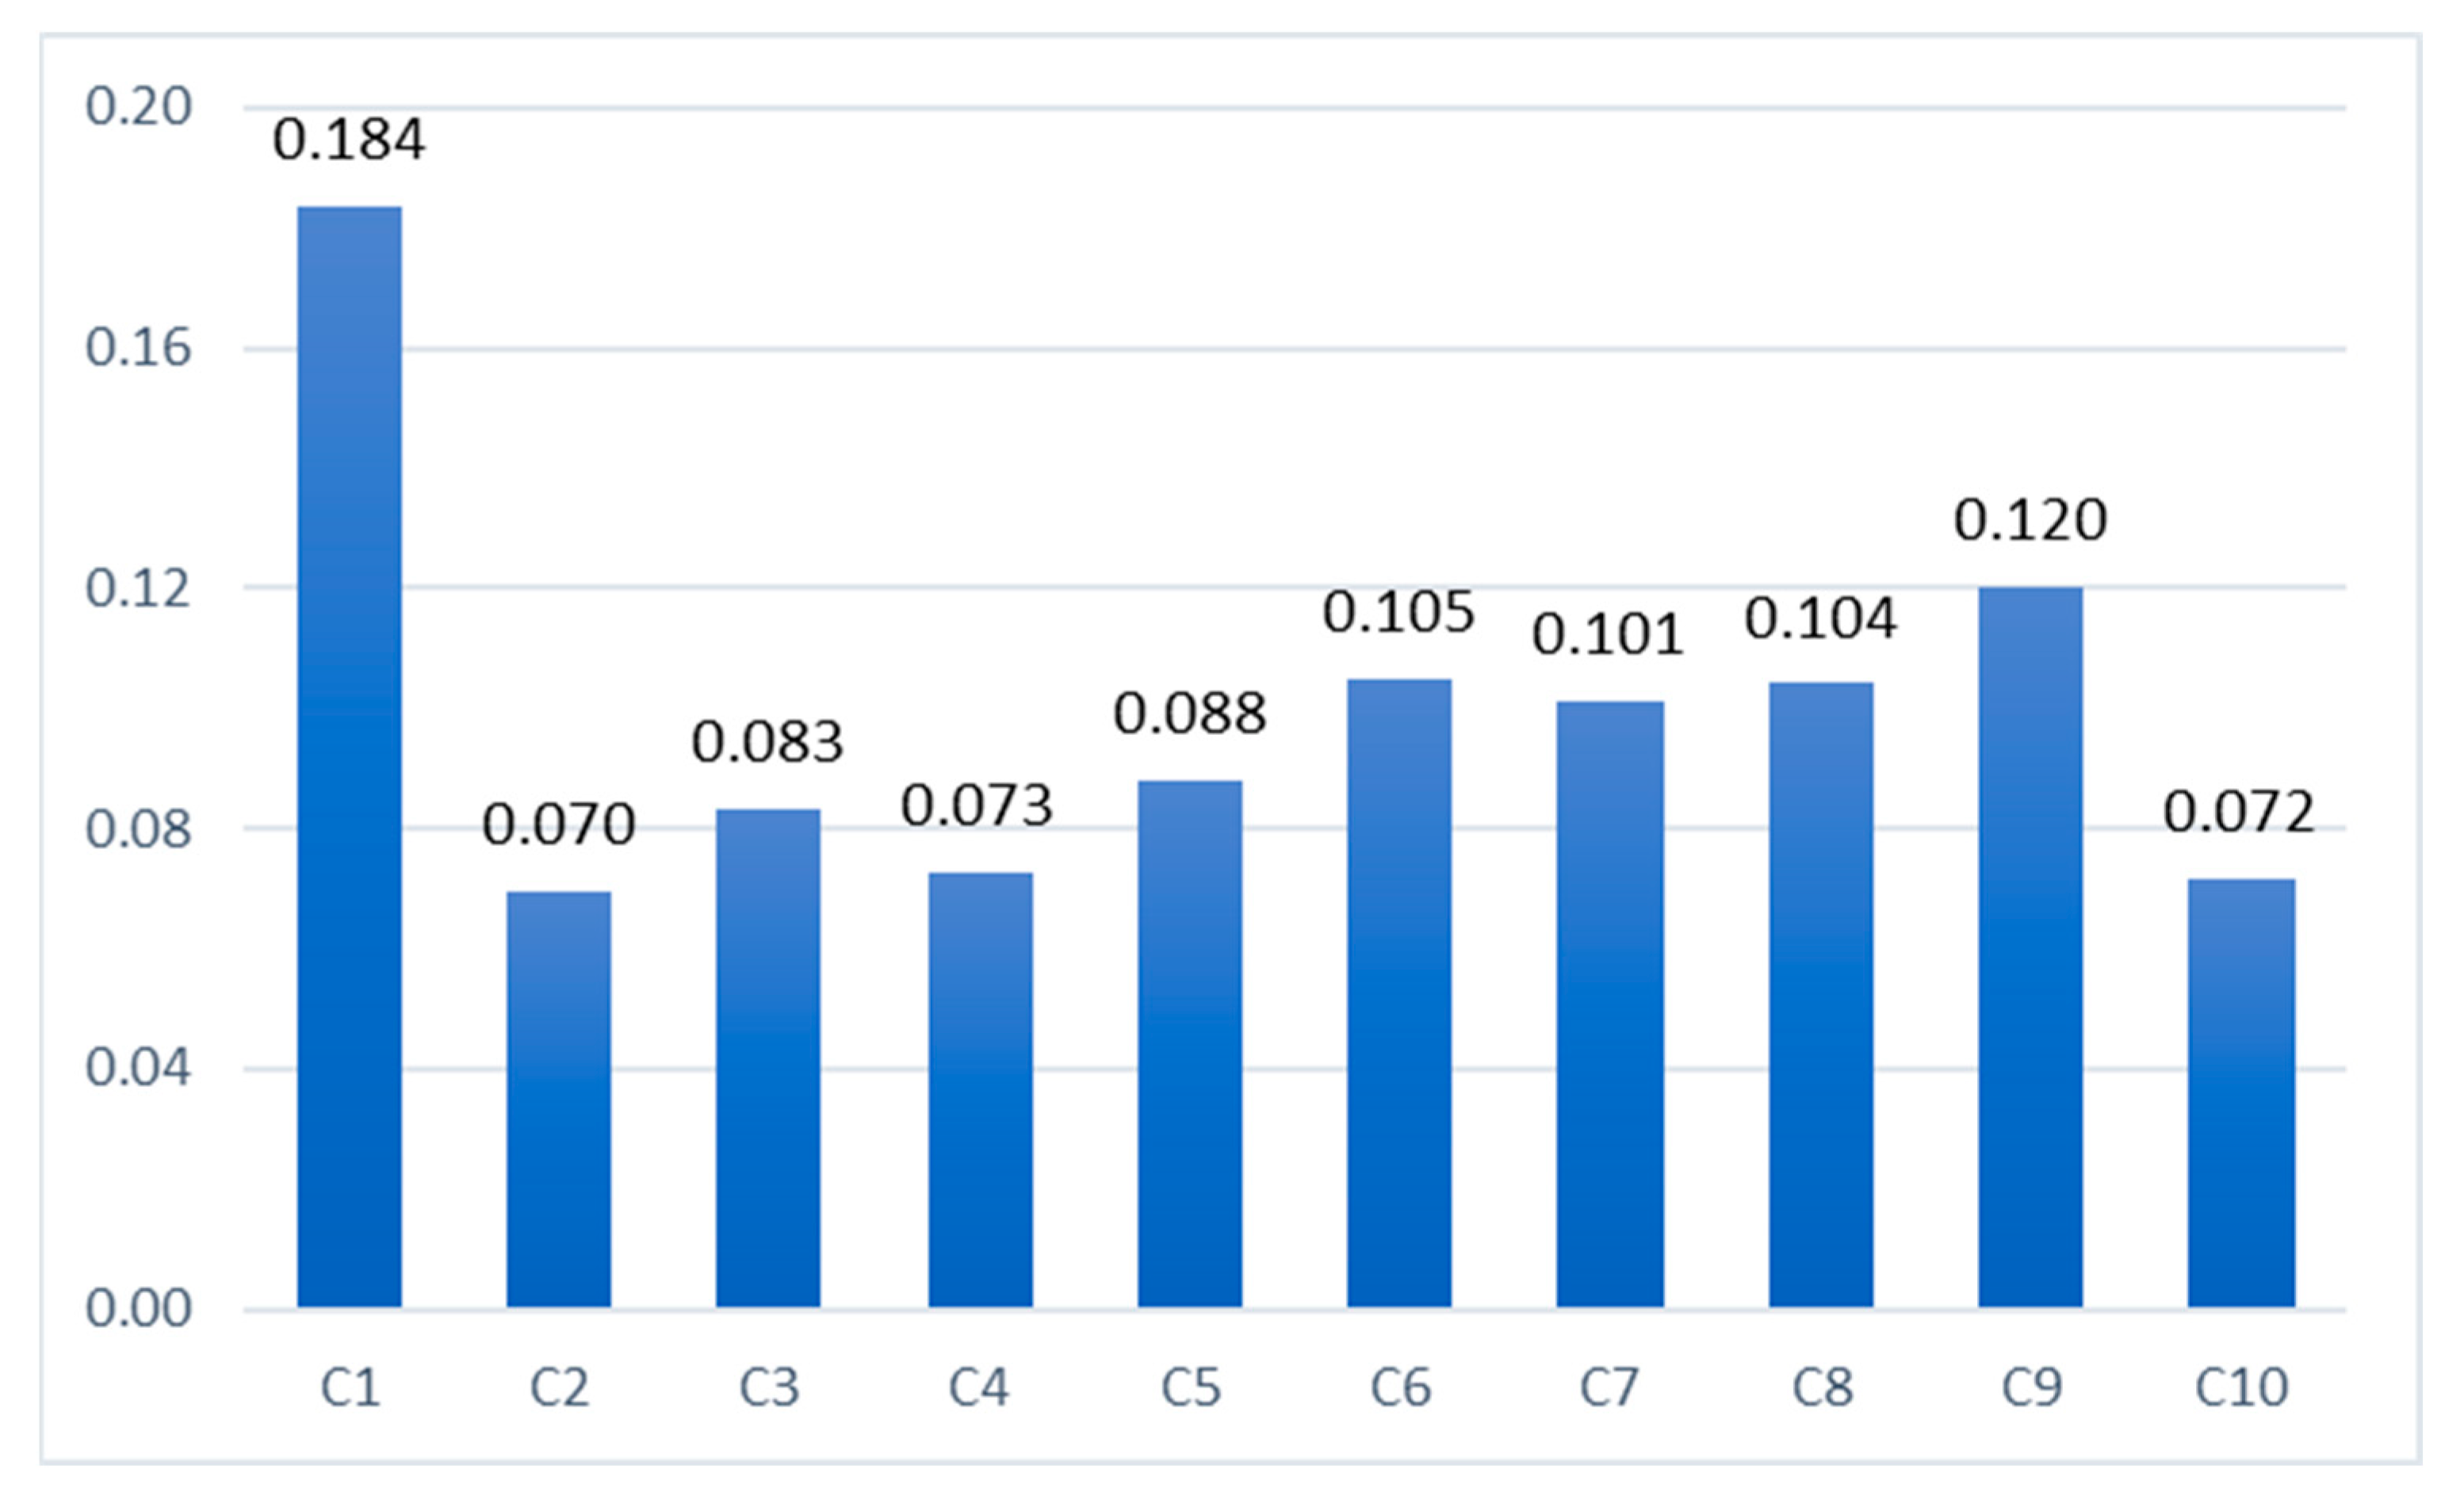
In the second phase of the proposed methodology, the AHP technique was used to determine the weight of indicators. First, the thoughts of experts were collected with Saati’s spectrum. Then, the ideas of the experts were fuzzified according to
Table 1. The geometric mean method was used to gather the views of experts in the fuzzy AHP method. According to the results from summarizing the experts’ opinions, the pairwise comparison matrix is presented in
Table 8.
For normalization, the sum of the values of each criterion should be divided by Equation (1). Because the values are fuzzy numbers, the fuzzy sum of each row is multiplied by the inverse of Equation (1). Applying Equation (2) in the next step, the obtained values are de-fuzzified. The normal weights of the main criteria are shown in
Table 9.
The inconsistency rate of the comparisons was found to be 0.094, which is smaller than 0.1; therefore, the comparisons can be trusted.
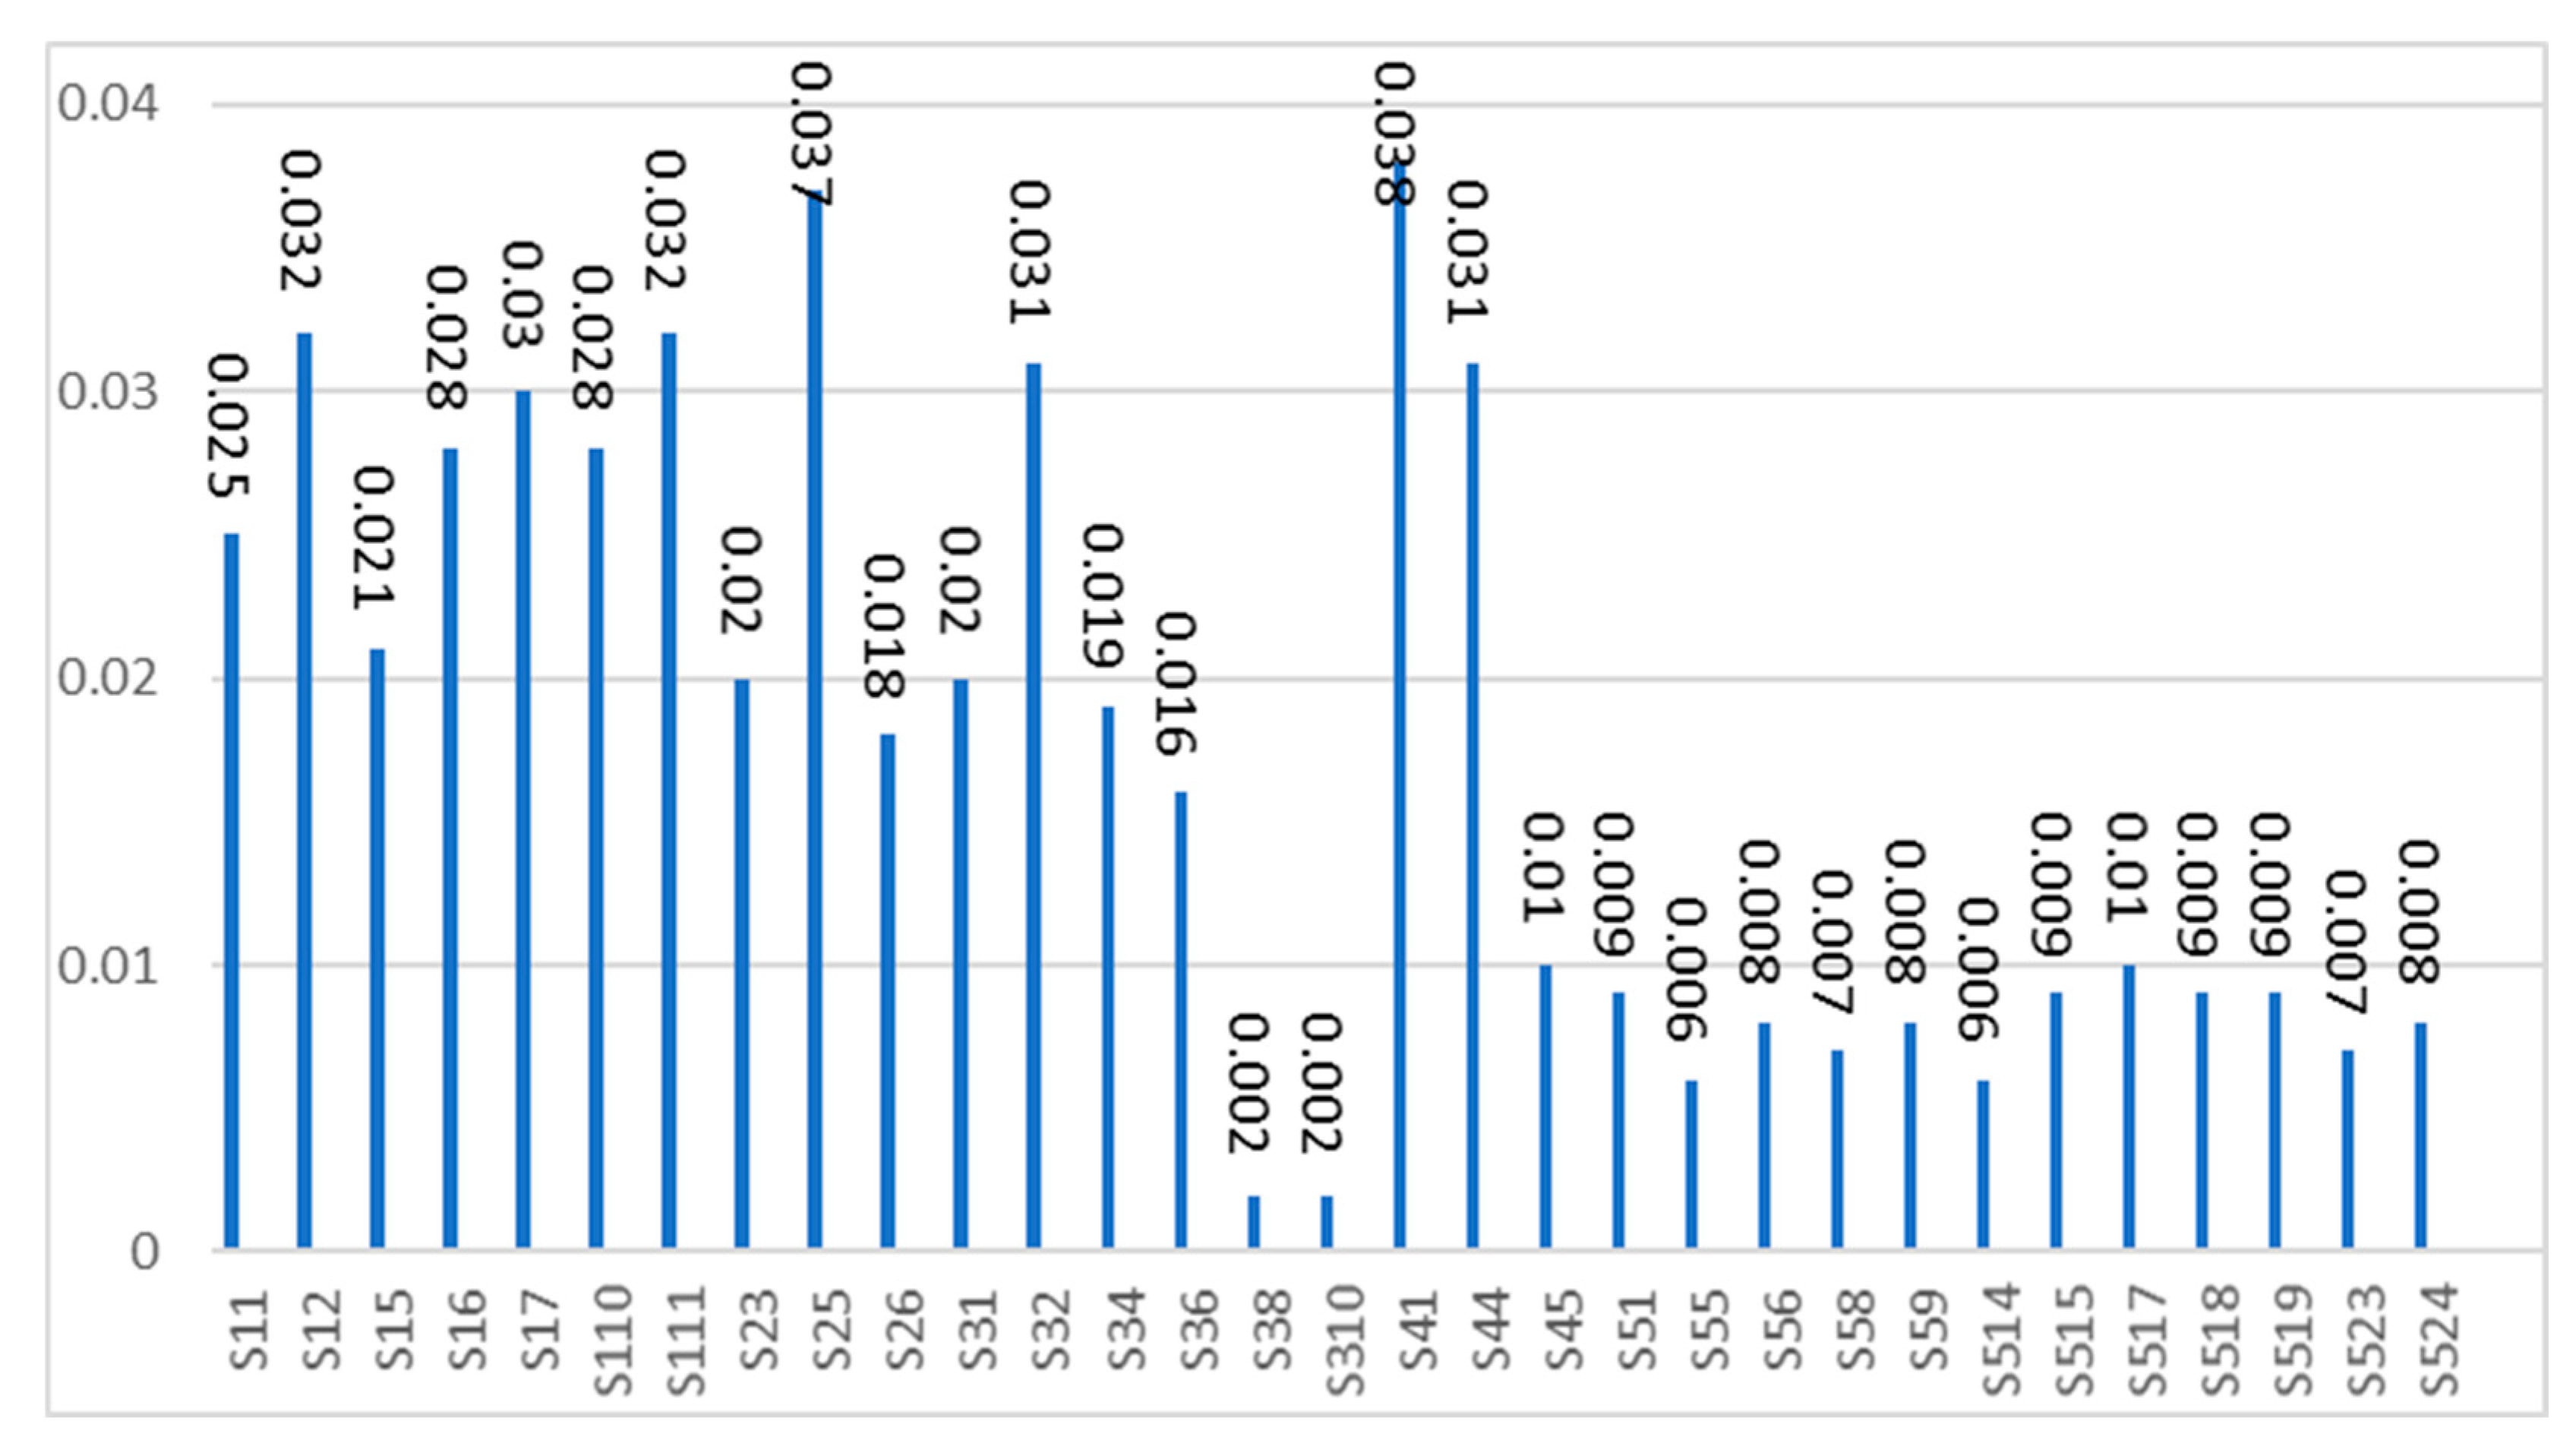
The inconsistency rate of the comparisons made for the sub-criteria of the management staff was found to be 0.011.
Table 11.
The calculated weights of the sub-criteria for C2.
Table 11.
The calculated weights of the sub-criteria for C2.
| Criteria | | | | De-Fuzzy | Normal W |
|---|
| S23 | 0.275 | 0.275 | 0.273 | 0.275 | 0.271 |
| S25 | 0.492 | 0.492 | 0.487 | 0.492 | 0.484 |
| S26 | 0.249 | 0.249 | 0.247 | 0.249 | 0.245 |
The inconsistency rate of the comparisons made for the sub-criteria of C2 was found to be 0.049.
Table 12.
The calculated weights of the sub-criteria for C3.
Table 12.
The calculated weights of the sub-criteria for C3.
| Criteria | | | | De-Fuzzy | Normal W |
|---|
| S31 | 0.228 | 0.225 | 0.223 | 0.228 | 0.218 |
| S32 | 0.357 | 0.354 | 0.351 | 0.357 | 0.342 |
| S34 | 0.226 | 0.223 | 0.221 | 0.226 | 0.216 |
| S36 | 0.183 | 0.181 | 0.178 | 0.183 | 0.175 |
| S38 | 0.023 | 0.023 | 0.023 | 0.023 | 0.022 |
| S310 | 0.028 | 0.028 | 0.028 | 0.028 | 0.027 |
The inconsistency rate of the comparisons made for the sub-criteria of C3 was found to be 0.081.
Table 13.
The calculated weights of the sub-criteria for C4.
Table 13.
The calculated weights of the sub-criteria for C4.
| Criteria | | | | De-Fuzzy | Normal W |
|---|
| S41 | 0.499 | 0.496 | 0.493 | 0.499 | 0.487 |
| S44 | 0.399 | 0.396 | 0.394 | 0.399 | 0.389 |
| S45 | 0.127 | 0.127 | 0.126 | 0.127 | 0.124 |
The inconsistency rate of the comparisons made for the sub-criteria of C4 was found to be 0.077.
Table 14.
The calculated weights of the sub-criteria for C5.
Table 14.
The calculated weights of the sub-criteria for C5.
| Criteria | | | | De-Fuzzy | Normal W |
|---|
| S51 | 0.102 | 0.101 | 0.100 | 0.102 | 0.097 |
| S55 | 0.067 | 0.066 | 0.065 | 0.067 | 0.064 |
| S56 | 0.089 | 0.088 | 0.087 | 0.089 | 0.085 |
| S58 | 0.074 | 0.073 | 0.072 | 0.074 | 0.070 |
| S59 | 0.086 | 0.085 | 0.084 | 0.086 | 0.082 |
| S514 | 0.068 | 0.067 | 0.066 | 0.068 | 0.065 |
| S515 | 0.101 | 0.100 | 0.099 | 0.101 | 0.097 |
| S517 | 0.105 | 0.104 | 0.103 | 0.105 | 0.101 |
| S518 | 0.096 | 0.095 | 0.094 | 0.096 | 0.091 |
| S519 | 0.097 | 0.096 | 0.95 | 0.097 | 0.093 |
| S523 | 0.078 | 0.077 | 0.076 | 0.078 | 0.074 |
| S524 | 0.085 | 0.085 | 0.085 | 0.085 | 0.081 |
The inconsistency rate of the comparisons made for the sub-criteria of C5 was found to be 0.037.
Table 15.
The calculated weights of the sub-criteria for C6.
Table 15.
The calculated weights of the sub-criteria for C6.
| Criteria | | | | De-Fuzzy | Normal W |
|---|
| S61 | 0.357 | 0.348 | 0.339 | 0.357 | 0.350 |
| S62 | 0.349 | 0.341 | 0.332 | 0.349 | 0.342 |
| S63 | 0.296 | 0.313 | 0.330 | 0.313 | 0.307 |
The inconsistency rate of the comparisons made for the sub-criteria of C6 was found to be 0.076.
Table 16.
The calculated weights of the sub-criteria for C7.
Table 16.
The calculated weights of the sub-criteria for C7.
| Criteria | | | | De-Fuzzy | Normal W |
|---|
| S72 | 0.148 | 0.147 | 0.145 | 0.148 | 0.142 |
| S76 | 0.217 | 0.214 | 0.212 | 0.217 | 0.208 |
| S77 | 0.160 | 0.158 | 0.156 | 0.160 | 0.153 |
| S79 | 0.182 | 0.180 | 0.178 | 0.182 | 0.174 |
| S712 | 0.172 | 0.170 | 0.169 | 0.172 | 0.165 |
| S715 | 0.166 | 0.165 | 0.163 | 0.166 | 0.159 |
The inconsistency rate of the comparisons made for the sub-criteria of C7 was found to be 0.021.
Table 17.
The calculated weights of the sub-criteria for C8.
Table 17.
The calculated weights of the sub-criteria for C8.
| Criteria | | | | De-Fuzzy | Normal W |
|---|
| S81 | 0.149 | 0.148 | 0.146 | 0.149 | 0.143 |
| S82 | 0.212 | 0.210 | 0.208 | 0.212 | 0.203 |
| S83 | 0.159 | 0.157 | 0.155 | 0.159 | 0.152 |
| S86 | 0.180 | 0.178 | 0.177 | 0.180 | 0.172 |
| S89 | 0.198 | 0.196 | 0.194 | 0.198 | 0.190 |
| S814 | 0.146 | 0.145 | 0.143 | 0.146 | 0.140 |
The inconsistency rate of the comparisons made for the sub-criteria of C8 was found to be 0.097.
Table 18.
The calculated weights of the sub-criteria for C9.
Table 18.
The calculated weights of the sub-criteria for C9.
| Criteria | | | | De-Fuzzy | Normal W |
|---|
| S92 | 0.187 | 0.186 | 0.184 | 0.187 | 0.181 |
| S93 | 0.274 | 0.271 | 0.269 | 0.274 | 0.265 |
| S94 | 0.284 | 0.282 | 0.280 | 0.284 | 0.275 |
| S95 | 0.150 | 0.148 | 0.146 | 0.150 | 0.145 |
| S96 | 0.139 | 0.138 | 0.137 | 0.139 | 0.134 |
The inconsistency rate of the comparisons made for the sub-criteria of C9 was found to be 0.075.
Table 19.
The calculated weights of the sub-criteria for C10.
Table 19.
The calculated weights of the sub-criteria for C10.
| Criteria | | | | De-Fuzzy | Normal W |
|---|
| S102 | 0.290 | 0.288 | 0.287 | 0.290 | 0.282 |
| S103 | 0.737 | 0.732 | 0.723 | 0.737 | 0.718 |
The inconsistency rate of the comparisons made for the sub-criteria of C10 was found to be 0.084.
In the last step of phase 2, the final priority of the criteria is calculated. To determine the final weights, it is enough to multiply the weight of each sub-criteria (W
2) by the weight of the main criteria (W
1). For example, for C
1 and the related sub-criteria, we have the final weight in
Table 20.
In phase three of the proposed methodology, we used FTOPSIS to select the best option. Considering 53 sub-criteria and their final weights, 15 options were prioritized by applying Equations (3)–(8). Due to the table length, the scores obtained from the decision matrix for this problem are not presented here. Therefore, the fuzzy TOPSIS algorithm’s output for ranking the mentioned high schools is given in
Table 21.
According to
Table 21, it can be concluded that School 2 receives the first rank.
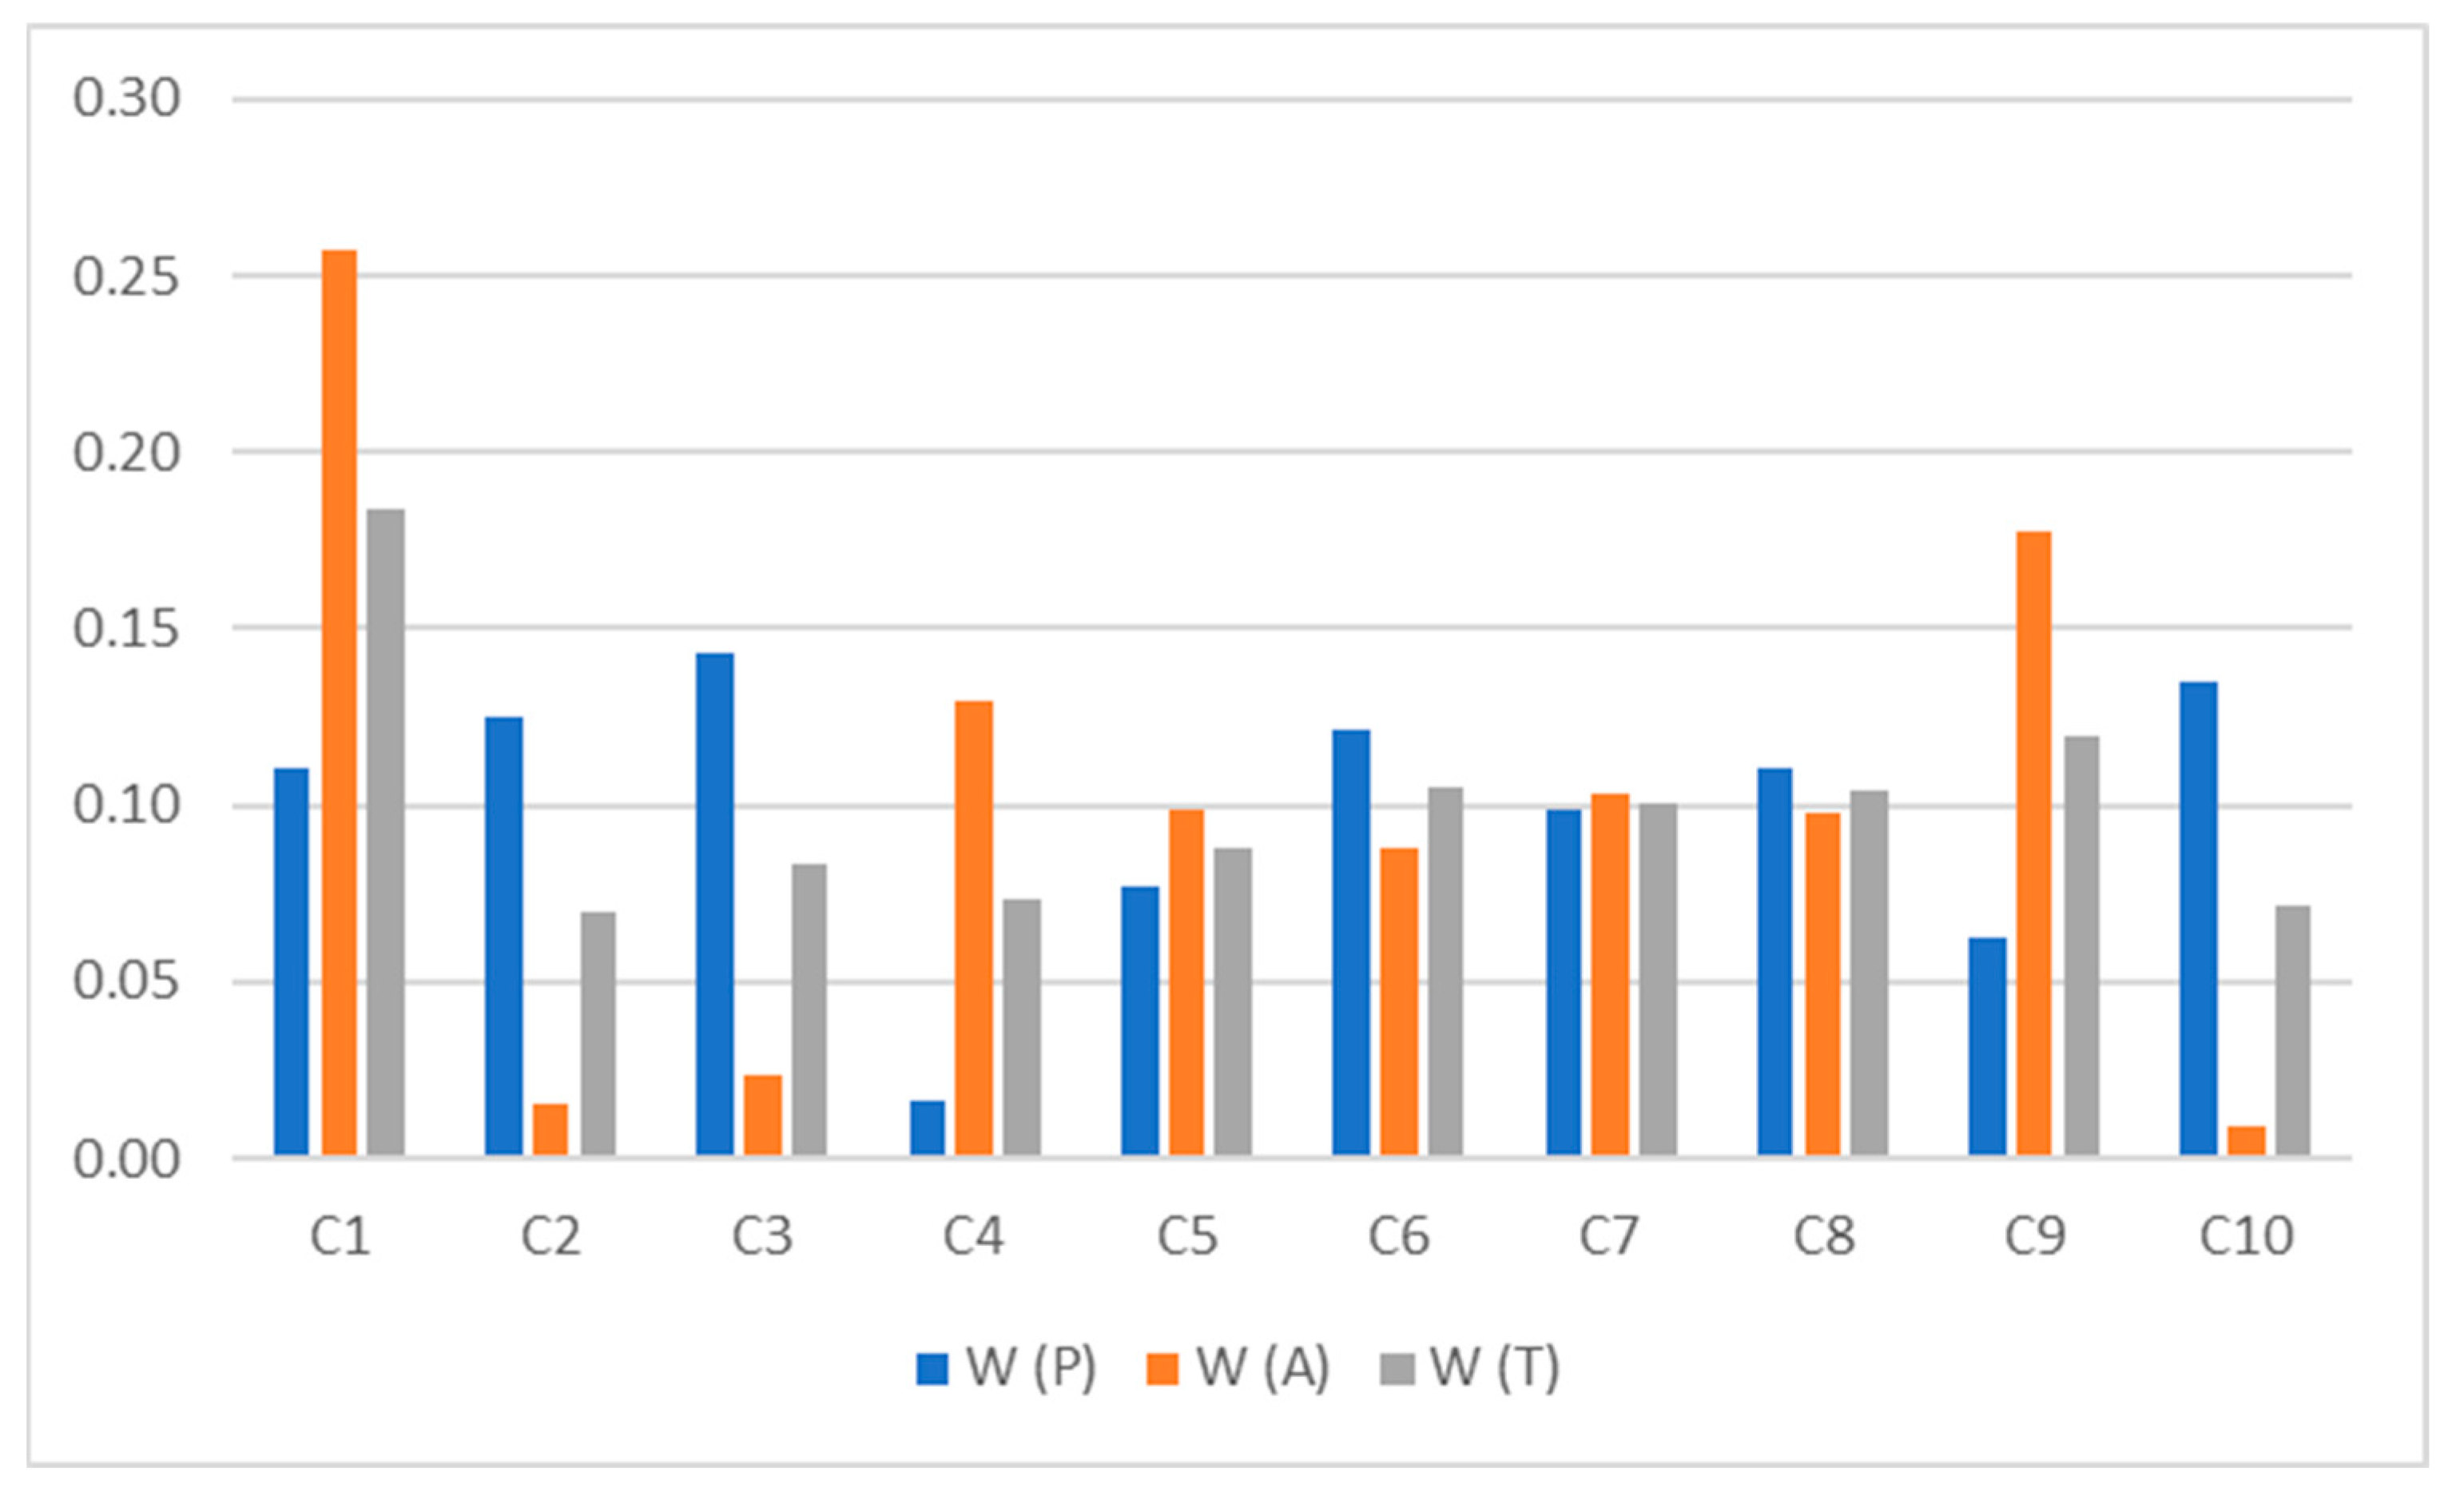
Sensitivity Analysis
In sensitivity analysis, one common method is to change the criteria weights and review their effects on the final outputs. Considering that in this study we used two key stakeholders of the problem in the panel of experts, we used the split-half method for sensitivity analysis. Based on this, we calculate the main criteria weights separately based on the views of the parents and school administrators and compare them with the weights obtained by summing up the two views (see
Table 9). The main criteria weights according to the opinions of parents (P), administrators (A), and their combination (T) are shown in
Figure 5 and
Table 22.
The sensitivity analysis carried out in this study brings significant results. As mentioned in the introduction section, in Iran, schools are evaluated based on the regulations compiled by the Ministry of Education, with inadequate and non-weighted criteria. The first point is that the criteria added in this study, according to research experts, were all important; in total, health is the third, students are the fifth, and social environment is the ninth influential criterion on the school prioritization process.
The second point, and of course more noteworthy, is that not paying attention to the views of other system stakeholders can distort the results and thus lose their reliability because of the exploitation of a particular stakeholder. As shown in
Figure 5 and
Table 22, the criterion of management staff (C
1) in combination (T) and in the view of administrators (A) ranks 1st; in contrast, from the parents’ point of view (P), this criterion ranks fifth in importance. The three most important criteria from the principals’ point of view are management staff (C
1), administrative affairs (C
9), and library (C
4), respectively; this ranking shows that they consider most of the system’s internal factors, especially those directly related to themselves, to be important. On the other hand, the three most important criteria from the point of view of parents are educational equipment (C
3), social environment (C
10), and credits and costs (C
2), respectively. Considering that the fourth most important criterion from the parent’s point of view is health (C
6), it is clear that they consider a combination of internal and external factors of the system to be important in their analysis.
Regarding the final ranking of the schools, it should be declared that although based on the combination of views and the principals’ views, School 2 is the best, according to parents’ opinion, while School 11 is the best option. Finally, it should be kept in mind that the bias of the principals in determining the weights of the criteria (see the weight of the first criterion in
Table 22) greatly impacted the choice of School 2 as the best option.
5. Conclusions
In light of schools’ crucial role in advancing society’s goals, both qualitatively and quantitatively, evaluating their performance and quality can pose a fundamental importance to society, especially to parents and policymakers. Schools in Iran, for example, are assessed by upstream institutions quantitatively, on inadequate criteria, and without regard to the views of another stakeholder, namely, students’ parents. Consequently, the purpose of this study was to provide an answer to the challenges within the school evaluation and ranking process by establishing a three-phase methodology. Based on this, a case study was conducted to rank 15 schools in one of the districts of Tehran, Iran. By employing the Delphi, fuzzy AHP, and fuzzy TOPSIS techniques, ten criteria, including three new ones proposed in this study, and 53 sub-criteria were weighted by experts, and the priority of the schools was determined. Performing a sensitivity analysis of the problem data showed that ignoring the viewpoints of other stakeholders of the problem can distort the results. In this research, along with the quantitative criteria, three qualitative criteria less noticed in the literature, including the social environment, health, and students, were considered in evaluating schools. The results of this research indicated that considering qualitative and quantitative criteria has a decisive role in evaluating schools and probably other educational systems. In addition, it was shown that in the evaluation of schools, it is better to consider the perspective of other stakeholders of this system because, without it, the analysis results will be associated with one-sidedness.
Even though more comprehensive quantitative and qualitative criteria were considered in the current research compared to the previous studies, and in addition to maintaining methodological simplicity, the views of both the main stakeholders of the system were also obtained, there are weaknesses in it that other researchers can consider in the future. The first weakness relates to how to deal with qualitative criteria (verbal judgments). The literature review shows that different approaches can be used for this case. For example, Intuitionistic fuzzy sets (IFSs) [
59], Pythagorean fuzzy sets (PFSs) [
60], and Neutrosophic sets (NSs) [
61], or the full consistency method (FUCOM) and its combination with the rough sawn method [
62], and the interval type-2 fuzzy sets (IT2FS) in a combination of DEMATEL-AHP-TOPSIS [
63], may have brought more reliable results. Therefore, one of the future directions for researchers can be to use fuzzy set extensions and compare their results with the results of the present study.
Another limitation of the proposed approach is how the criteria are weighted. While we used the well-known AHP approach to maintain the simplicity of the methodology, other developed methods may yield more accurate results. For example, fuzzy pivot pairwise relative criteria importance assessment (FPIPRECIA) [
64], intuitionistic fuzzy decision-making trial and evaluation laboratory (IFDEMATEL) [
65], the criteria importance through intercriteria correlation (CRITIC) method [
66], the new level-based weight assessment (LBWA) model [
67], and the best-worst method (BWM) are some approaches recently recommended by researchers to determine the weights (importance) of problem criteria. In the same way, researchers have recommended the use of VIseKriterijumska Optimizacija I Kompromisno Resenje (VIKOR) [
68], evaluation based on distance from average solution (EDAS) [
69], data envelopment analysis (DEA) [
70], and multi-attributive border approximation area comparison (MABAC) [
71] methods in the phase of ranking the alternatives as an alternative to the TOPSIS method. Accordingly, another research direction can be analyzing the problem data with the above approaches and comparing them with the current research results.


 ,
, 


