Article

Factors Influencing Investment Decisions in Financial Investment Companies

by
Ahmed Amer Abdul kareem
1,*,
Zaki T. Fayed
1,
Sherine Rady
1,
Salsabil Amin El-Regaily
1 and
Bashar M. Nema
2
1
Faculty of Computer and Information Sciences, Ain Shams University, Cairo 11566, Egypt
2
Department of CS, College of Science, Mustansiriyah University, Baghdad 10001, Iraq
*
Author to whom correspondence should be addressed.
Systems 2023, 11(3), 146; https://doi.org/10.3390/systems11030146
Submission received: 6 February 2023 / Revised: 4 March 2023 / Accepted: 7 March 2023 / Published: 10 March 2023

Abstract

:
For making the most favorable financial decisions possible, it is essential to have an understanding of aspects and the factors which can play a role in the decision-making. In contrast to previous research on the subject, which has only examined a single factor in making investment decisions, our study takes a more holistic approach by looking at several factors. The purpose of this study was to discover the elements that influence investment decisions made by financial organizations that are listed on Iraqi stock exchanges (ISX). The research was carried out on the six companies that made up the study’s sample size. For the purpose of data collection, the researcher utilized a structured questionnaire that was delivered to the respondents in an individual capacity. The questionnaire contained eight items. The factors of the questionnaire were analyzed with respect to normal distribution, the problem of linear multiplicity, the validity of the questionnaire in terms of content and appearance, the stability of the questionnaire by the split-half method, and the test and re-test method. In addition, the research hypotheses were tested on both the independent variables and the dependent variables. We calculated the mean, standard deviation, weight percentile, and coefficient of variance from the collected data. The significance of the connection between the dimensions of the decision-making factors was clarified through the use of Spearman’s correlation coefficient and the t test. We concluded that in the last step of the proposed model there is an increase in coefficients of determination and it reaches a value of (0.98), which is a very excellent and almost complete interpretation of the impact of dimensions extracted in the model and their impact on investment decision. As is noted, a slight decline in the value of the regression coefficient for all variables occurred, and also we noticed that the signs for the coefficients for the five variables are positive, meaning that they reflect the extent of the direct effect of those variables in making the investment decision. The response rate for the questionnaire was 97.7%.

1. Introduction

The Multi Criteria Decision Analysis (MCDA) is a tool that helps people make decisions when there are many factors to consider. This is because decision-making procedures have become more complicated as more people become involved, each with their own set of priorities and concerns. As a result, MCDA has gained traction in a wide variety of fields and gained the attention of the scientific community as a means to synthesize the various expertise present in the decision-making process through collaborative arrangements. Most financial models are founded on a regulatory theory that prioritizes company indebtedness. The existing credit scoring systems rely heavily on inaccessible financial data. Most credit rating models also make the assumption that rating signs have a normal distribution. Existing credit rating systems for the SCI are built on singular indicators, which has significant drawbacks in terms of information content or discriminatory power. Altman (1968) was an early innovator in developing a credit scoring indicator method. The model employs the Z-score to determine the financial factors useful for differentiating “bad firms” from “good firms”, and thus the ZETA credit scoring models founded upon these indicators. Return on assets and earnings before interest and taxes are two such signs that can shed light on the probability of default by a borrower. While this may be true, Gu et al. (2017) use a mixture of AHP and DEA to forecast default risk [1], with indicators drawn from financial health, creditworthiness, business growth, and online financial standing.
Making wise investment choices is essential to effective financial management and future planning. Investing wisely entails assessing various investment possibilities and selecting one with the highest expected return. Investment choices can be impacted by a wide range of external and internal variables, such as the economy, market trends, and one’s own personal situation [2].
One of the key factors that can influence investment decision-making is the state of the economy. Economic conditions can affect the performance of different investment types, such as stocks, bonds, and real estate. For example, during times of economic growth, stock prices tend to rise as companies earn more profits and investors are more confident about the future. In contrast, during times of economic downturn, stock prices may fall as companies struggle to earn profits and investors become more cautious [3].
In addition, individual circumstances can also play a role in investment decision-making. For instance, an investor’s age, risk tolerance, and financial goals can all affect the types of investments they choose. It is possible that a younger investor may be more willing to take on risk in order to earn higher returns, while an older investor may be more focused on preserving their wealth. Other factors that can influence investment decision-making include the investor’s knowledge and experience, as well as the investment options available to them [4].
Making investment decisions can be a challenging task, as there are many factors to consider and no guarantees of success. However, by staying informed about economic conditions, market trends, and personal circumstances, investors can make more informed and effective decisions. This can help them achieve their financial goals and secure their financial future [5,6].
Cohn et al. (1975) [7] showed some suggestive proof that an investor’s risk aversion decreases as their wealth does. Risk taking tends to decrease with age, wealth, and education, according to the study of Riley and Chow [8]. LeBaron, Farrelly, and Gula (1989) contributed to this conversation by contending that individuals’ risk aversion is driven more by instinct than reason [9]. To counter this, Baker and Haslem (1974) argued that dividends, expected returns, and the firm’s financial stability are all crucial investment factors for individual investors [10]. Even further, Baker, Haargrove, and Haslem (1977) proposed that investors act sensibly by considering the risk/reward tradeoff [11].
Even though investors use a wide variety of criteria when selecting stocks, the results of a study by Nagy and Obenberger (1994) imply that conventional wealth-maximization criteria are essential to investors. Modern issues such as how the company treats its employees, whether it operates domestically or abroad, how it treats the environment, and how it treats ethics are being given short shrift. Many people disregard the advice of brokerage firms, individual stock brokers, relatives, and friends. There are many people who invest who do not see the value in using valuation models to analyze equities [12].
Other research concludes that investors are influenced by accounting information, neutral information, and advocate suggestions [13]. Research has been conducted on the Indian stock market and authors claimed its findings were applicable to investing in the Indian stock market [14,15].
Souza and Aste (2019) conducted a study in the UK into the make-up of social-media financial market information and how it might be utilized to anticipate investment outcomes. Specifically, this was accomplished by combining historical financial data with sentimental social media data based on an experiment. It was determined that the makeup of financial markets is more dependable than social media opinions. According to the results, the composition of financial markets performed better than the difficulties of projecting social perspective structure using the available financial information [16].
In 2017, Yeşilda, Atasever, Kuduz, and Coşkun looked at the characteristics of stock investors in Afyon and Kütahya, Turkey, as well as the variables that influence their choices. It was found that investors lacked the rationality and knowledge necessary to make informed stock market decisions. Furthermore, it was observed that factors such as age, gender, occupation, level of education, number of families, and income were influential in investing choices [17].
COVID-19 has had a significant impact on business investment decisions and has thereby affected people’s quality of life. Research by Bernard suggests that companies with big cash reserves during COVID-19 may decide to keep such reserves intact and instead use the period to make more informed investment decisions, which can give them a competitive edge in the long run [18].
Investors’ emotions and cognitive biases are just two examples of the kind of psychological traits studied by behavioral finance [19].
Thought leaders in the field of finance assumed a positive correlation between risk and return, but studies in the field of strategic management have discovered more nuanced relationships. While some researchers have discovered that there is a negative relationship between corporate risk and return for all or some firms, others have claimed that there is a positive relationship between the two. Since empirical findings differ greatly between studies, even the most fundamental questions about risk-return relations have no conclusive answers [20].
Wang and Lou examined panel data from 421 S&P (Standard & Poor’s, U.S.-based) 500 companies and concluded that past performance and social performance influence marketing investments differently. The investment decision will continue if the company’s targets are met or exceeded. Thus, it is assumed that the firm has improved its investment performance. An investment strategy may need to be reconsidered if the outcome is lower than expected. There is a possibility that the company will increase its product-buying budget. Furthermore, the business will examine issues and increase ideas that can boost its efficiency. Because of this, there will be a large sum of money put toward creating new things. The interaction between social performance and historical performance can also lead to erratic performance feedback [21].
Investment decisions are of great importance in the financial markets for investors, as there are many factors that need to be studied, which will affect the effectiveness of the investment decision, hence the importance of this article. In this study, we are using a questionnaire because we want to know which variables have the most impact on the investment decision from the investor’s perspective. Making an investment is not a one-and-done deal. Decisions made by public and private sector leaders on a regular basis, or consistently, can have far-reaching effects on investment patterns and long-term development objectives. Taking this class will help you picture how you would move through the various levels of the financial decision-making procedure. The quality and outcomes of ongoing and future investment operations are proposed to be improved via a phased strategy. There are four stages to the pattern as shown in Figure 1. These phases have been further subdivided by various groups and methodologies, but in general they cover the same ground and follow a similar order. Investment plans, which establish primary (sub)investment priorities, as well as investment programs and projects, all benefit from the cycle because they share fundamental ideas [22].
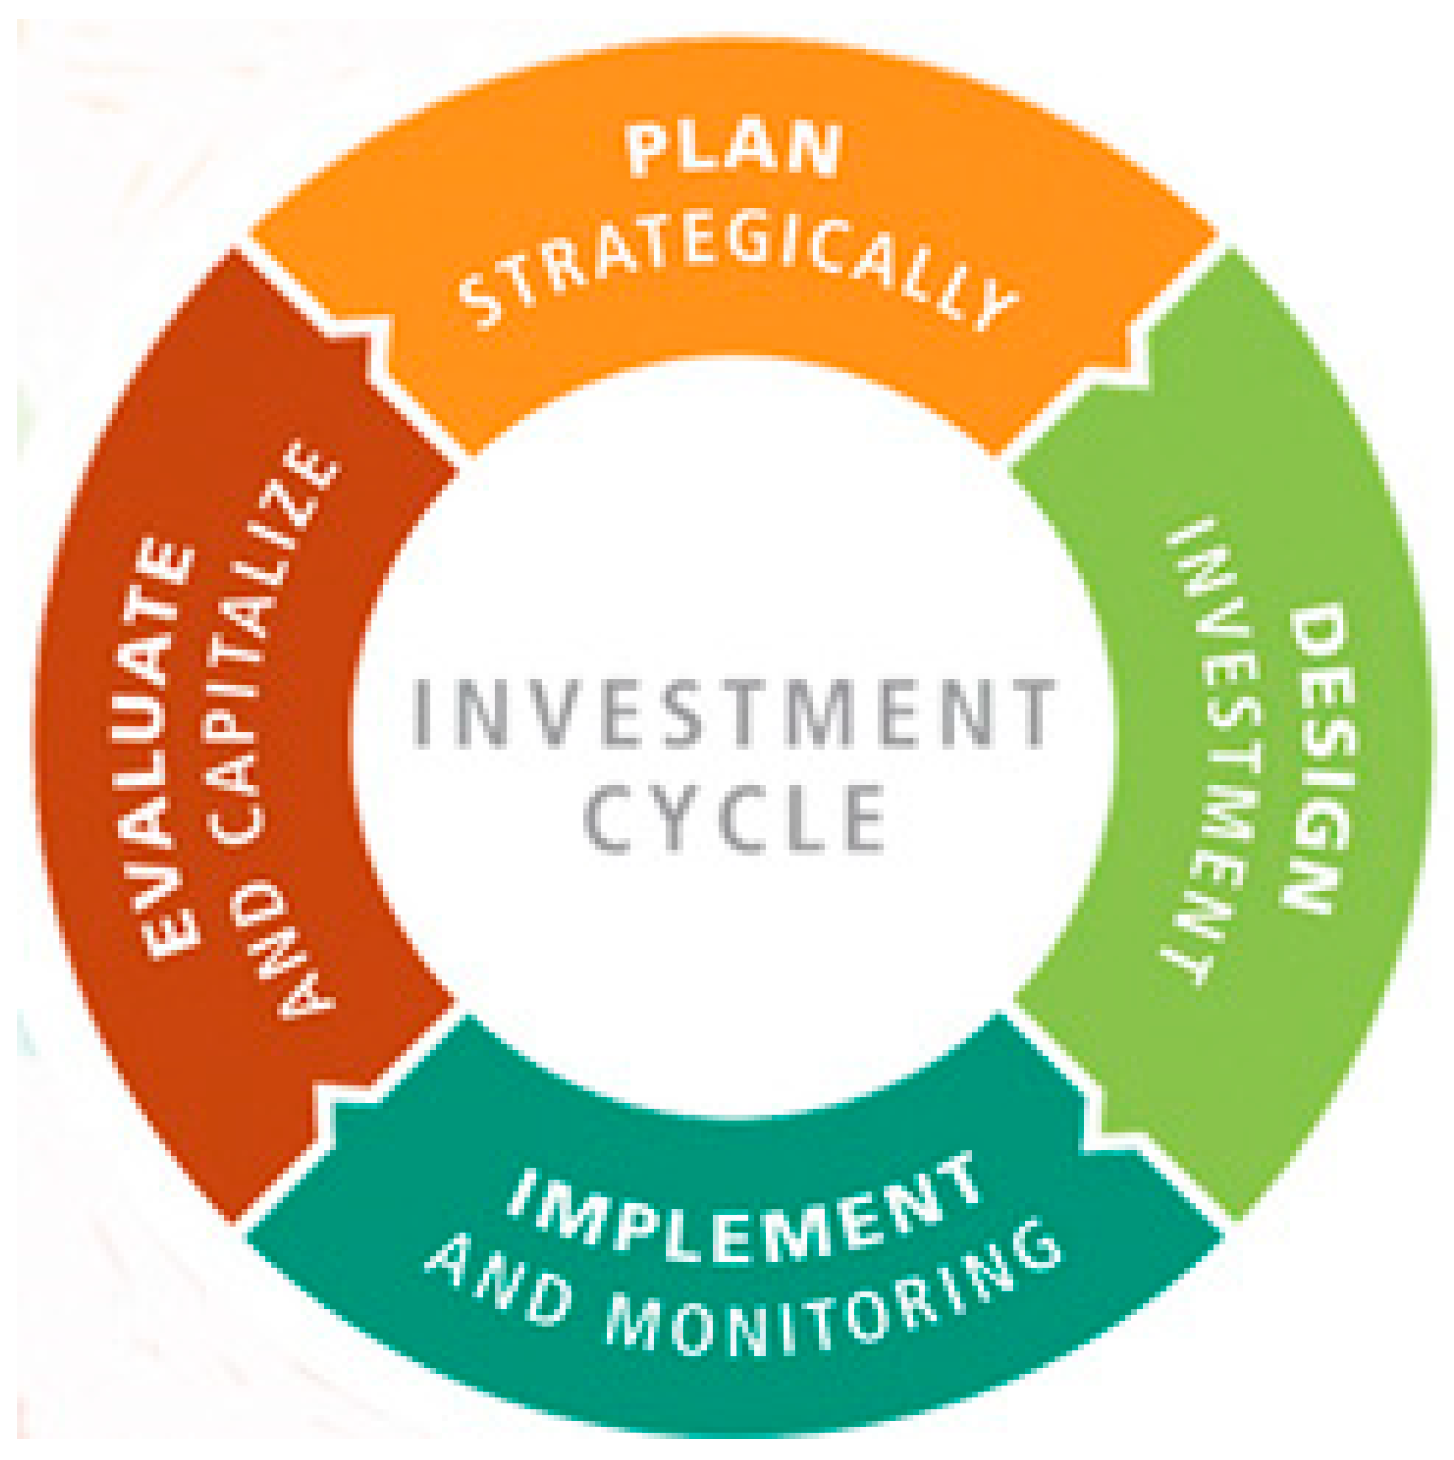
  • Strategic planning: Determine which projects should be undertaken and share your findings with the industry.
  • Investment design: Analyze context and alternatives and implement detailed project design.
  • Implementation and monitoring: Carry out the assignment, track and report your progress toward your objectives, and adjust as needed.
  • Evaluation and benefit: Assess past initiatives’ successes and failures in order to better shape future endeavors.
The previous studies focused on only one of the factors that influence investment decisions (such as internal factors or external factors, etc.); thus, there is still a need for more research and study of the impact of several combined factors in making the appropriate investment decision (including Information Nature, Disclosure, Perception, Internal factors, External factors, and Information Technology). Hence the significance of this study.
The rest of the paper is organized as follows: we present the conceptual framework for the study in the Section 2. The hypothesis of the study is explained in Section 3. In Section 4, the research sample characteristics are listed. Analysis of research community data is in Section 5. Section 6 is devoted to the poly-linearity problem test. In Section 7, the research sample is described and analyzed. The research hypotheses have been tested in Section 8. Finally, discussions and conclusions are introduced in Section 9.

2. Conceptual Framework of Study

The conceptual framework of study shows the idea of the research, and the nature of the relationship between the main and sub-variables, as shown in Figure 2, in order to measure the relationship of correlation and influence between them, for a clear understanding of the scheme, as it was explained according to the following:
  • The independent variable: is the factors affecting the investment decision (Nature of information, Disclosure, Perception, Internal factors, External factors, Information Technology).
  • The dependent variable: is the appropriate investment decision.
Information Nature: It is information about the company’s financial situation, and it is highly valuable because it increases the decision-knowledge maker’s and influences them, and it decreases the uncertainty associated with the decision-making process and predicting the future, which reflects favorably on the accuracy and validity of the decisions taken.
Disclosure: It is to show the financial statements of the basic information about the company, which is of interest to external groups, so that it is useful in making rational decisions.
Perception: It is for the investor to be aware that the use of future financial information affects the nature, quality, and size of the investments in which he intends to invest, as this leads to achieving a higher degree of integration and interdependence between investment decisions in the case of adopting more than one investment option at the same time. It provides sufficient capabilities and skills that help the investor to choose the optimal investment.
Internal factors: a set of factors specific to the investor himself and which play a major role in influencing investment decisions in the stock markets.
External factors: It is a set of factors outside the control of the investor that can play a major role in influencing investment decisions in the stock markets.
Information Technology: It is a group of computers, supporting equipment, programs, services, and resources associated with and applied to support the stages of work and which thus contribute to the speed and accuracy of collection, entry and processing when preparing financial statements and lead to speed in making investment decisions.

3. Hypothesis of the Study

In accordance with the research topic, the goals, and the hypothesis scheme, the following hypotheses have been developed to answer the survey questions and test whether or not they are significant in establishing a relationship between the independent and dependent variables:

3.1. Examine the Correlation between the Researched Factors

3.1.1. Main Hypothesis 1

The variables that matter most in making sound financial investments are strongly correlated. Here, the relationship between the independent variables (Information Nature, Disclosure, Perception, Internal factors, External factors, and Information Technology) and the dependent variable (appropriate investment decision) will be found by calculating the Spearman correlation coefficient for the correlation of ranks between each dimension of the independent variables, and then testing that. The first main hypothesis of the research consists of six subhypotheses.

3.1.2. Sub Hypotheses of Correlation

  • The quality of information significantly correlates with selecting the best investment option.
  • Disclosing relevant information is highly correlated with making a good financial investment.
  • The correct investment decision is strongly correlated with how things are perceived.
  • Internal considerations are strongly correlated with making the right investment choice.
  • There is a strong link between considering relevant outside issues and making the best possible financial investment.
  • Information technology has a strong link to choosing the right investment.

3.2. Test the Effect between the Variables Studied

3.2.1. Main Hypothesis 2, “the Factors Impacting the Right Investment Decision-Making Have a Considerable Influence Link.”

The simple linear regression is used for measuring how the dimensions of independent variables (Information Nature, Disclosure, Perception, Internal factors, External factors, and Information Technology) are effect on the dependent variable (appropriate investment decision). The significance of a regression equation (influence) is then evaluated with the test (F), and the coefficient of determination (R2) is used to account for the variance that remains after controlling for the variables that affect the suitable investment decision-making variable.

3.2.2. Sub-Hypotheses of Effect

  • The type of the proactive information plays a crucial role in determining the best investing strategy.
  • The disclosure dimension has a substantial effect on the variable that measures how well one decides to invest.
  • An important impact link exists between the perception dimension and the variable representing sound financial planning and investment choices.
  • The optimal investment decision is a variable whose impact increases with the size of the internal elements involved.
  • The proper investment decision-making variable is heavily influenced by the external factors dimension.
  • The IT dimension has a considerable effect on the appropriate investment decision-making variable.

3.3. Test Main Hypothesis 3 of the Sequential or Sequential Regression

A model of multiple and general linear regression that includes the most prominent dimensions that contribute to building that effect as a whole will be used to demonstrate the most prominent influences of all independent variables in the dependent variable at the same time.

4. Research Sample Characteristics

The research data were obtained through the design of a questionnaire after reviewing a number of studies and previous research in this field, the questionnaire consists of a set of questions (57) a question through which it is possible to identify the most important factors that may affect the behavior of investors in the investment companies, and the questionnaire was designed using a Likert scale quintet.
A group of financial investment companies listed in the Iraq Stock Exchange was adopted as a research community, and the size of the community of (6) researched companies was determined. Then, 133 respondents were selected in order to survey their opinions on what is related to the subject of the research, and when subjecting the questionnaires to the audit stage, it was found that there were three questionnaires that were not suitable for entering the statistical analysis stage, so they were excluded, and thus the size of the research sample became 130 respondents from among the targets in the research. The most important characteristics of research community can be clarified through Table 1.
As a result of the previous table, we found the following:
  • The age group (35–less than 40) years topped the ranking of the distribution of age groups, as it constituted slightly more than a third of the sample, with a rate of (36.9%), followed by the age group (30–less than 35) years, with a representation similar to the previous one, amounting to 32.3%, then the age group (40–less than 45 years) ranked third with a representation rate of 13.1% of the total research sample, and the age group (25–less than 30 years) ranked fourth with a representation rate of 9.2%. As for the remaining percentage (8.5%), it represented the sample whose age was 45 years and over, and these results reflect the diversity in the ages of the sample and the presence of a great youthful character in it.
  • With regard to academic qualification, the results of Table 1 showed that slightly more than half of the respondents, at a rate of 50.8%, hold a bachelor’s degree, and nearly a quarter of the respondents (23.1%) hold a master’s degree, and the percentage was 21.5%. They hold a doctorate degree, while the remaining percentage (4.6%) of the total sample holds a higher diploma. It is noted from the results that holders of a bachelor’s degree emerged from those sample members, as well as a diversity in the educational attainment of the respondents, especially holders of higher degrees.
  • When inquiring from the research sample about their scientific specialization, based on Table 1, it can be seen that nearly a third of the sample (28.5%) of the respondents specialize in accounting, 21.5% of the respondents specialize in various other specializations, 20% of the respondents specialize in business administration, and 19.2% of those respondents specialize in banking and financial sciences, while the remaining 10.8% of the respondents specialize in statistics. These results indicate a diversity in the specialization of the sample, with some leadership in the financial and accounting disciplines.
  • With regard to the work of the respondents in the researched sample, as shown in Table 1, nearly a third of the respondents (32.3%) are investors, and 26.1% of the respondents work in various other jobs, and (24.6%) of those surveyed work. Their views were as certified public accountants, financial managers accounted for (10.8%) of the total research sample, while the remaining small percentage of the respondents (6.2%) represented those who work as financial analysts.
  • By inquiring about the years of work experience among the respondents, as stated in Table 1, nearly a third of the respondents (29.2%) have work experience ranging from 1 to less than 5 years; 24.6% of the respondents have work experience ranges between 10 and less than 15 years; 22.3% of the respondents have work experience ranging from 5–less than 10 years; and 14.6% of the respondents have work experience estimated as 20 years or more, while the remaining percentage, amounting to 9.3%, represented the respondents who have work experience ranging between 15 and less than 20 years. These results reflect closeness or great compatibility with what was stated in the analysis of the ages of the sample in terms of the presence of a group of youthful participants trying to gain experience, as well as the elderly and experienced who give young people an opportunity to learn and gain more of those experiences at work.

5. Analysis of Research Community Data

This section is where the results are presented and analyzed, and the study’s hypotheses are put to the proof. For this study, we used a questionnaire with six tables to collect information about the variables (including Information Nature, Disclosure, Perception, Internal Factors, External Factors, and Information Technology) that might influence the rationalization. Researchers used the pre-packaged statistical software SPSS to input and analyze data pertaining to the investment choices made by clients of financial investment firms.

5.1. Methodology

Prior to displaying the practical side of the research, which depended on personal interviews and a questionnaire, we hereby declare that all participants in this study have given their informed consent to the questionnaire questions.
  • Personal interviews: Although there are a variety of interview forms (such as structured, semi-structured, and open), analysts agree that they all share a common framework and differ mostly in the degree to which they adhere to that pattern. Moreover, there are a variety of interviewing techniques (e.g., active, neutral, formal, informal, controlled, and free) from which to choose. It is also possible for interviews to vary in formality (i.e., formal vs. casual) [23,24,25,26,27].
In-depth interviews with high-ranking investors at investment firms were undertaken to glean their insights into the study’s independent variables. How does your business stand out from the rest of the pack? When thinking about your business, what factors do you think are most important? What do you think are the most important considerations while making an investing decision? For what reasons do you choose to invest? The financier prefers to be well-versed in and knowledgeable about the industry. How do you plan to invest the money you have available, and what means do you use to gather the most up-to-date information? Do you employ computers and advanced technologies to analyze the information you gather? If any, what is it? Explain the significance of the three most critical financial statements to me. If you were given the chance, how would you evaluate the company’s financial stability?
Sample of the answers will be provided in Appendix A.
B.
Questionnaire: The questionnaire will be used extensively as it will serve as the primary method for gathering the data and information needed for the study. The study literature was used to inform the structure of its paragraphs. It was modified to fit the needs of the study. It had two major axes, which included Experience, and the second axis highlighted the primary study variables and the dimensions of those variables, which are:
  • The first: the factors influencing appropriate investment decision-making, which included six dimensions (Information Nature, Disclosure, Perception, Internal Factors, External Factors, Information Technology). A different number of questions were put for each dimension, and the total number of questions was 51.
  • The second: on “making the right investment choice”, included six questions, for a total of fifty-seven; all questions used the same five-point Likert scale (very much, somewhat, somewhat, not at all, or none) and weights (1, 2, 3, 4, 5) to ensure comparability.

5.2. Test of Normal Distribution of Study Measures

The normal distribution represents one of the most important and prominent continuous probability distributions, which have wide applications in various phenomena of life, and it is known that most of the phenomena and measures are supposed to devolve into the normal distribution. In order to know the nature of any measure in studies in terms of its belonging to a specific distribution, it is necessary to conduct the normal distribution test for that scale, and the test is carried out according to the statistical test called (Kolmogorov–Smirnov test).

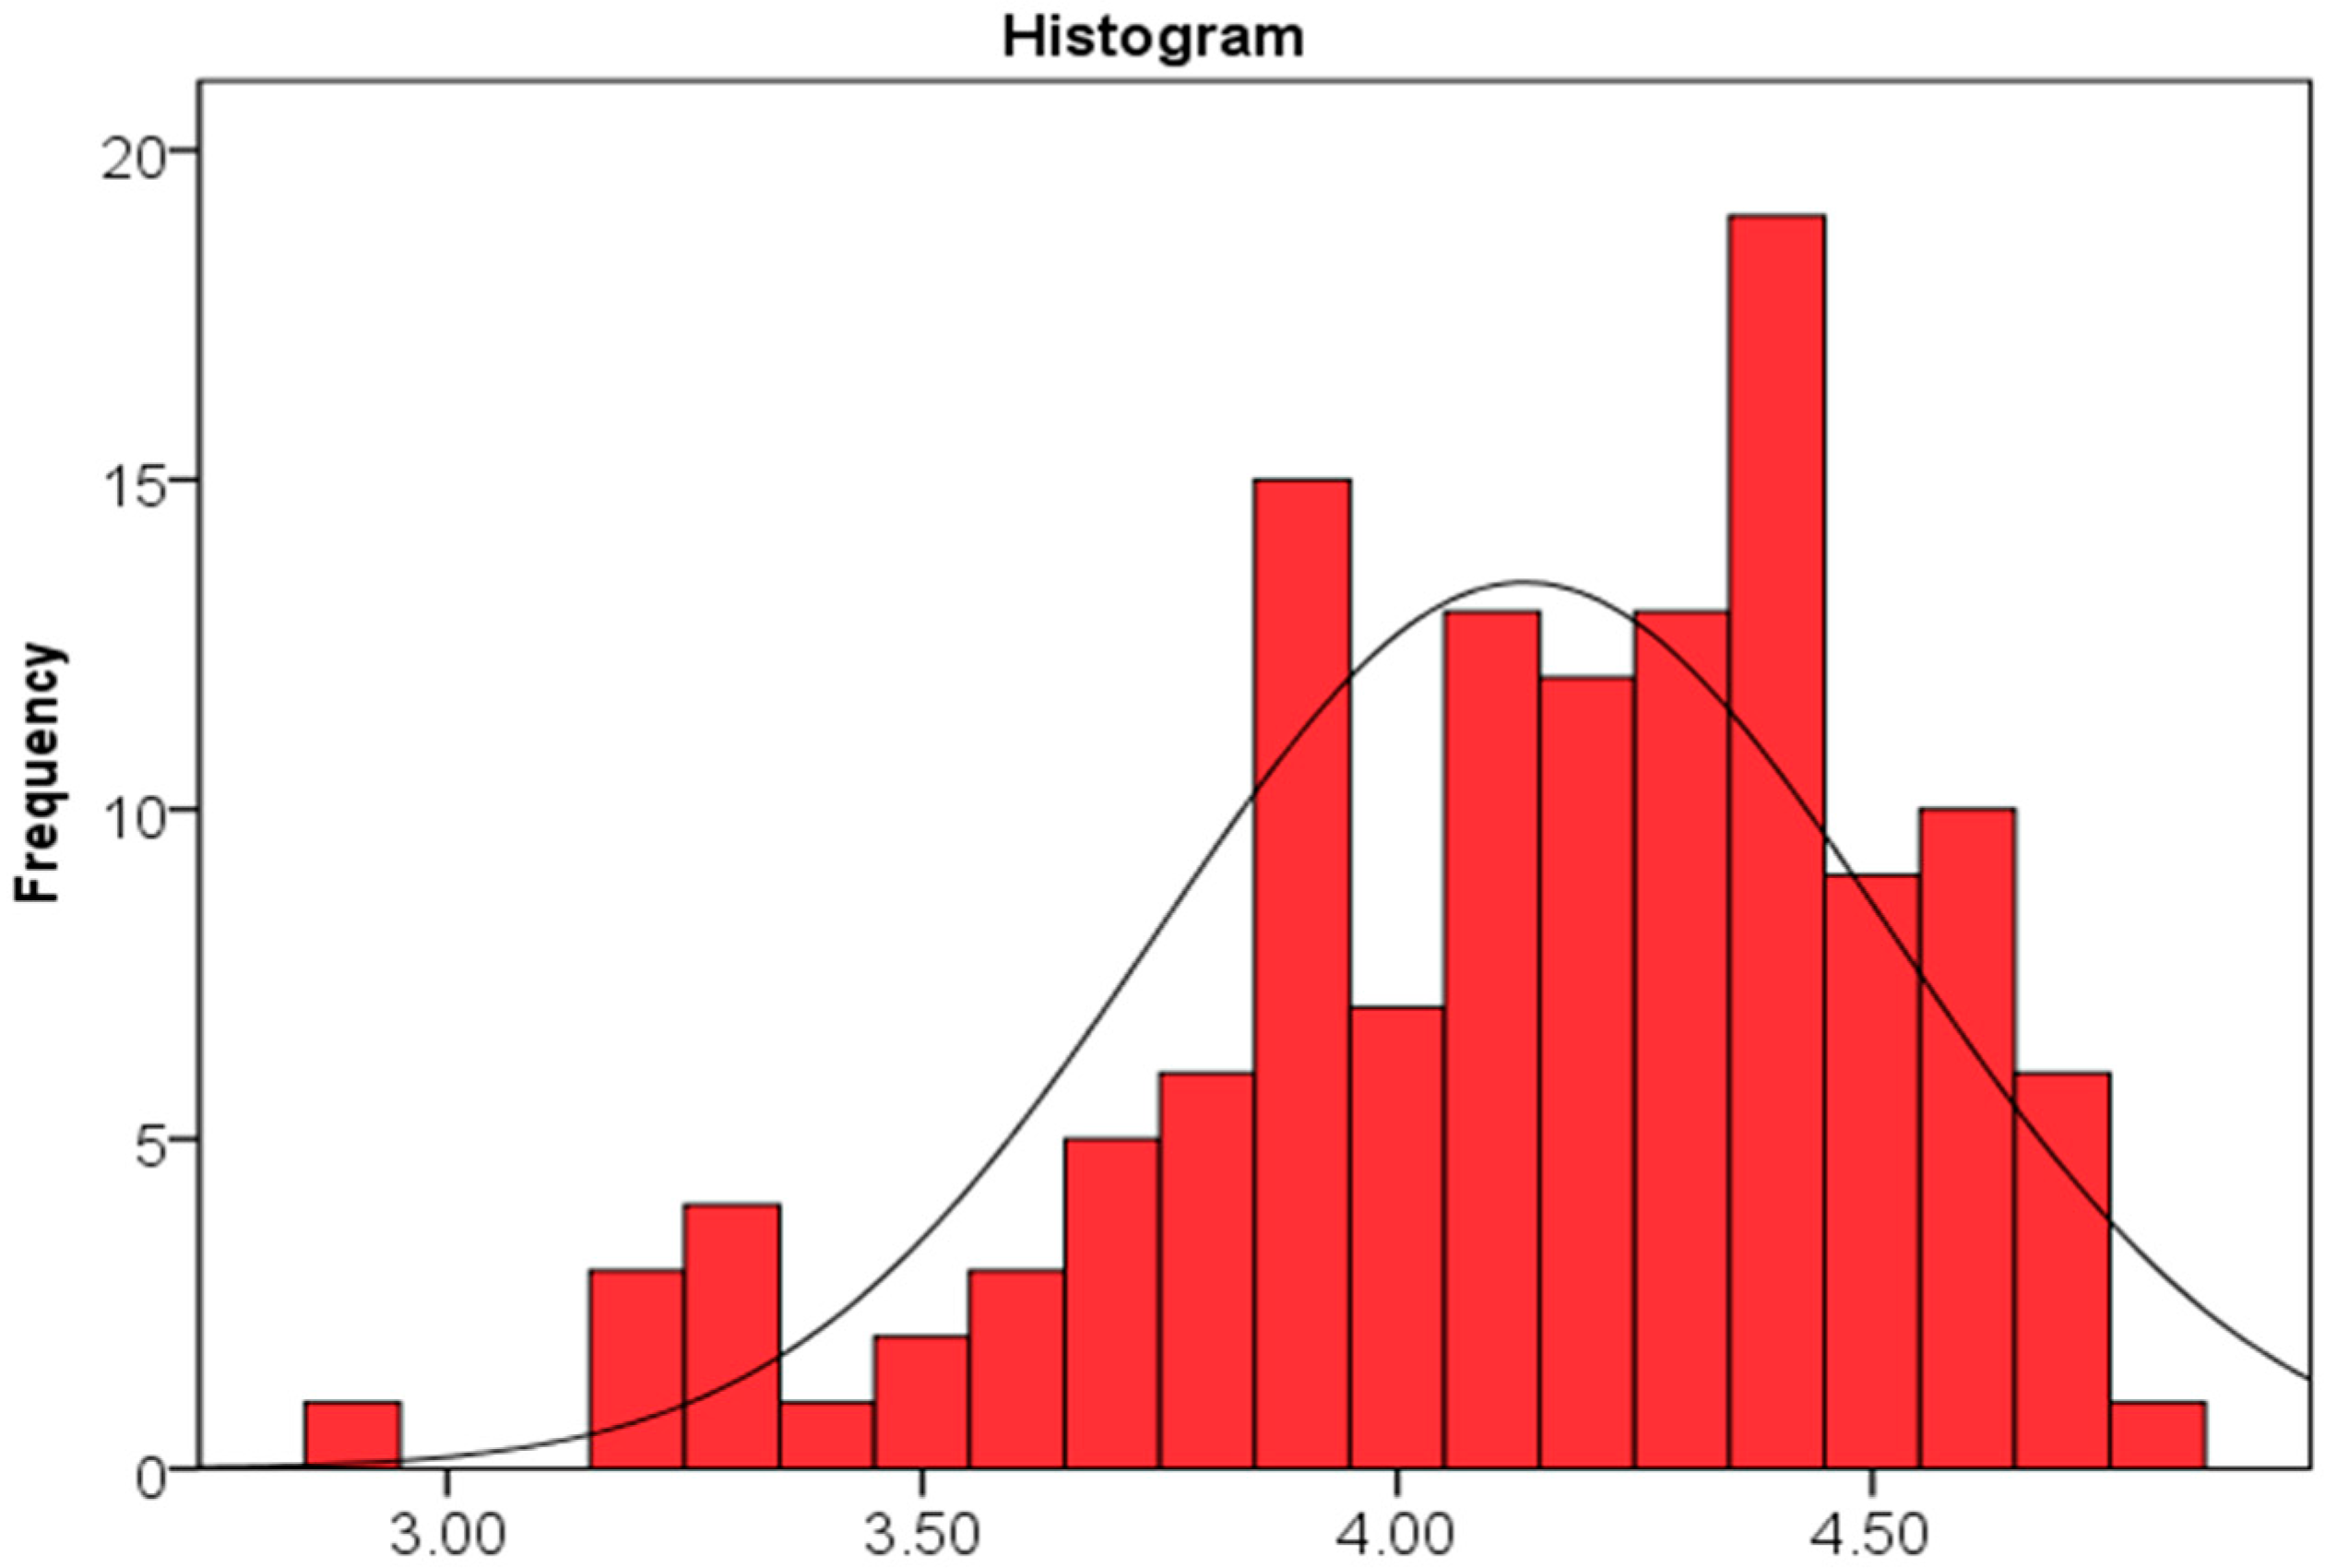
5.2.1. Testing the Normal Distribution of the Factors Affecting Appropriate Investment Decision-Making

In order to test the extent of data distribution in the measure of the factors influencing the decision making of the appropriate investment naturally, the following two hypotheses are put forward:
  • The null hypothesis: the data on the axis of the factors influencing the appropriate investment decision-making are distributed normally.
  • Alternative hypothesis: The data of the factors influencing the appropriate investment decision-making are not distributed normally.
Based on results of Table 2, the calculated value of the (Kolmogorov–Smirnov) test, totaling to 1.297, is less than the tabular (Z) value of 1.96, while a significance value (Sig) in a test was 0.073, which is more than the value of the level of significance, which is 0.05, and this means that the null hypothesis is accepted and an alternative hypothesis is rejected; this means that the data on the axis of the factors influencing the appropriate investment decision are distributed approximately (not 100% normal, but rather approximately) according to the normal distribution, as the normal data curve on the axis of the factors influencing on making the appropriate investment decision is consistent (as shown in Figure 3), indicating the null hypothesis is correct.

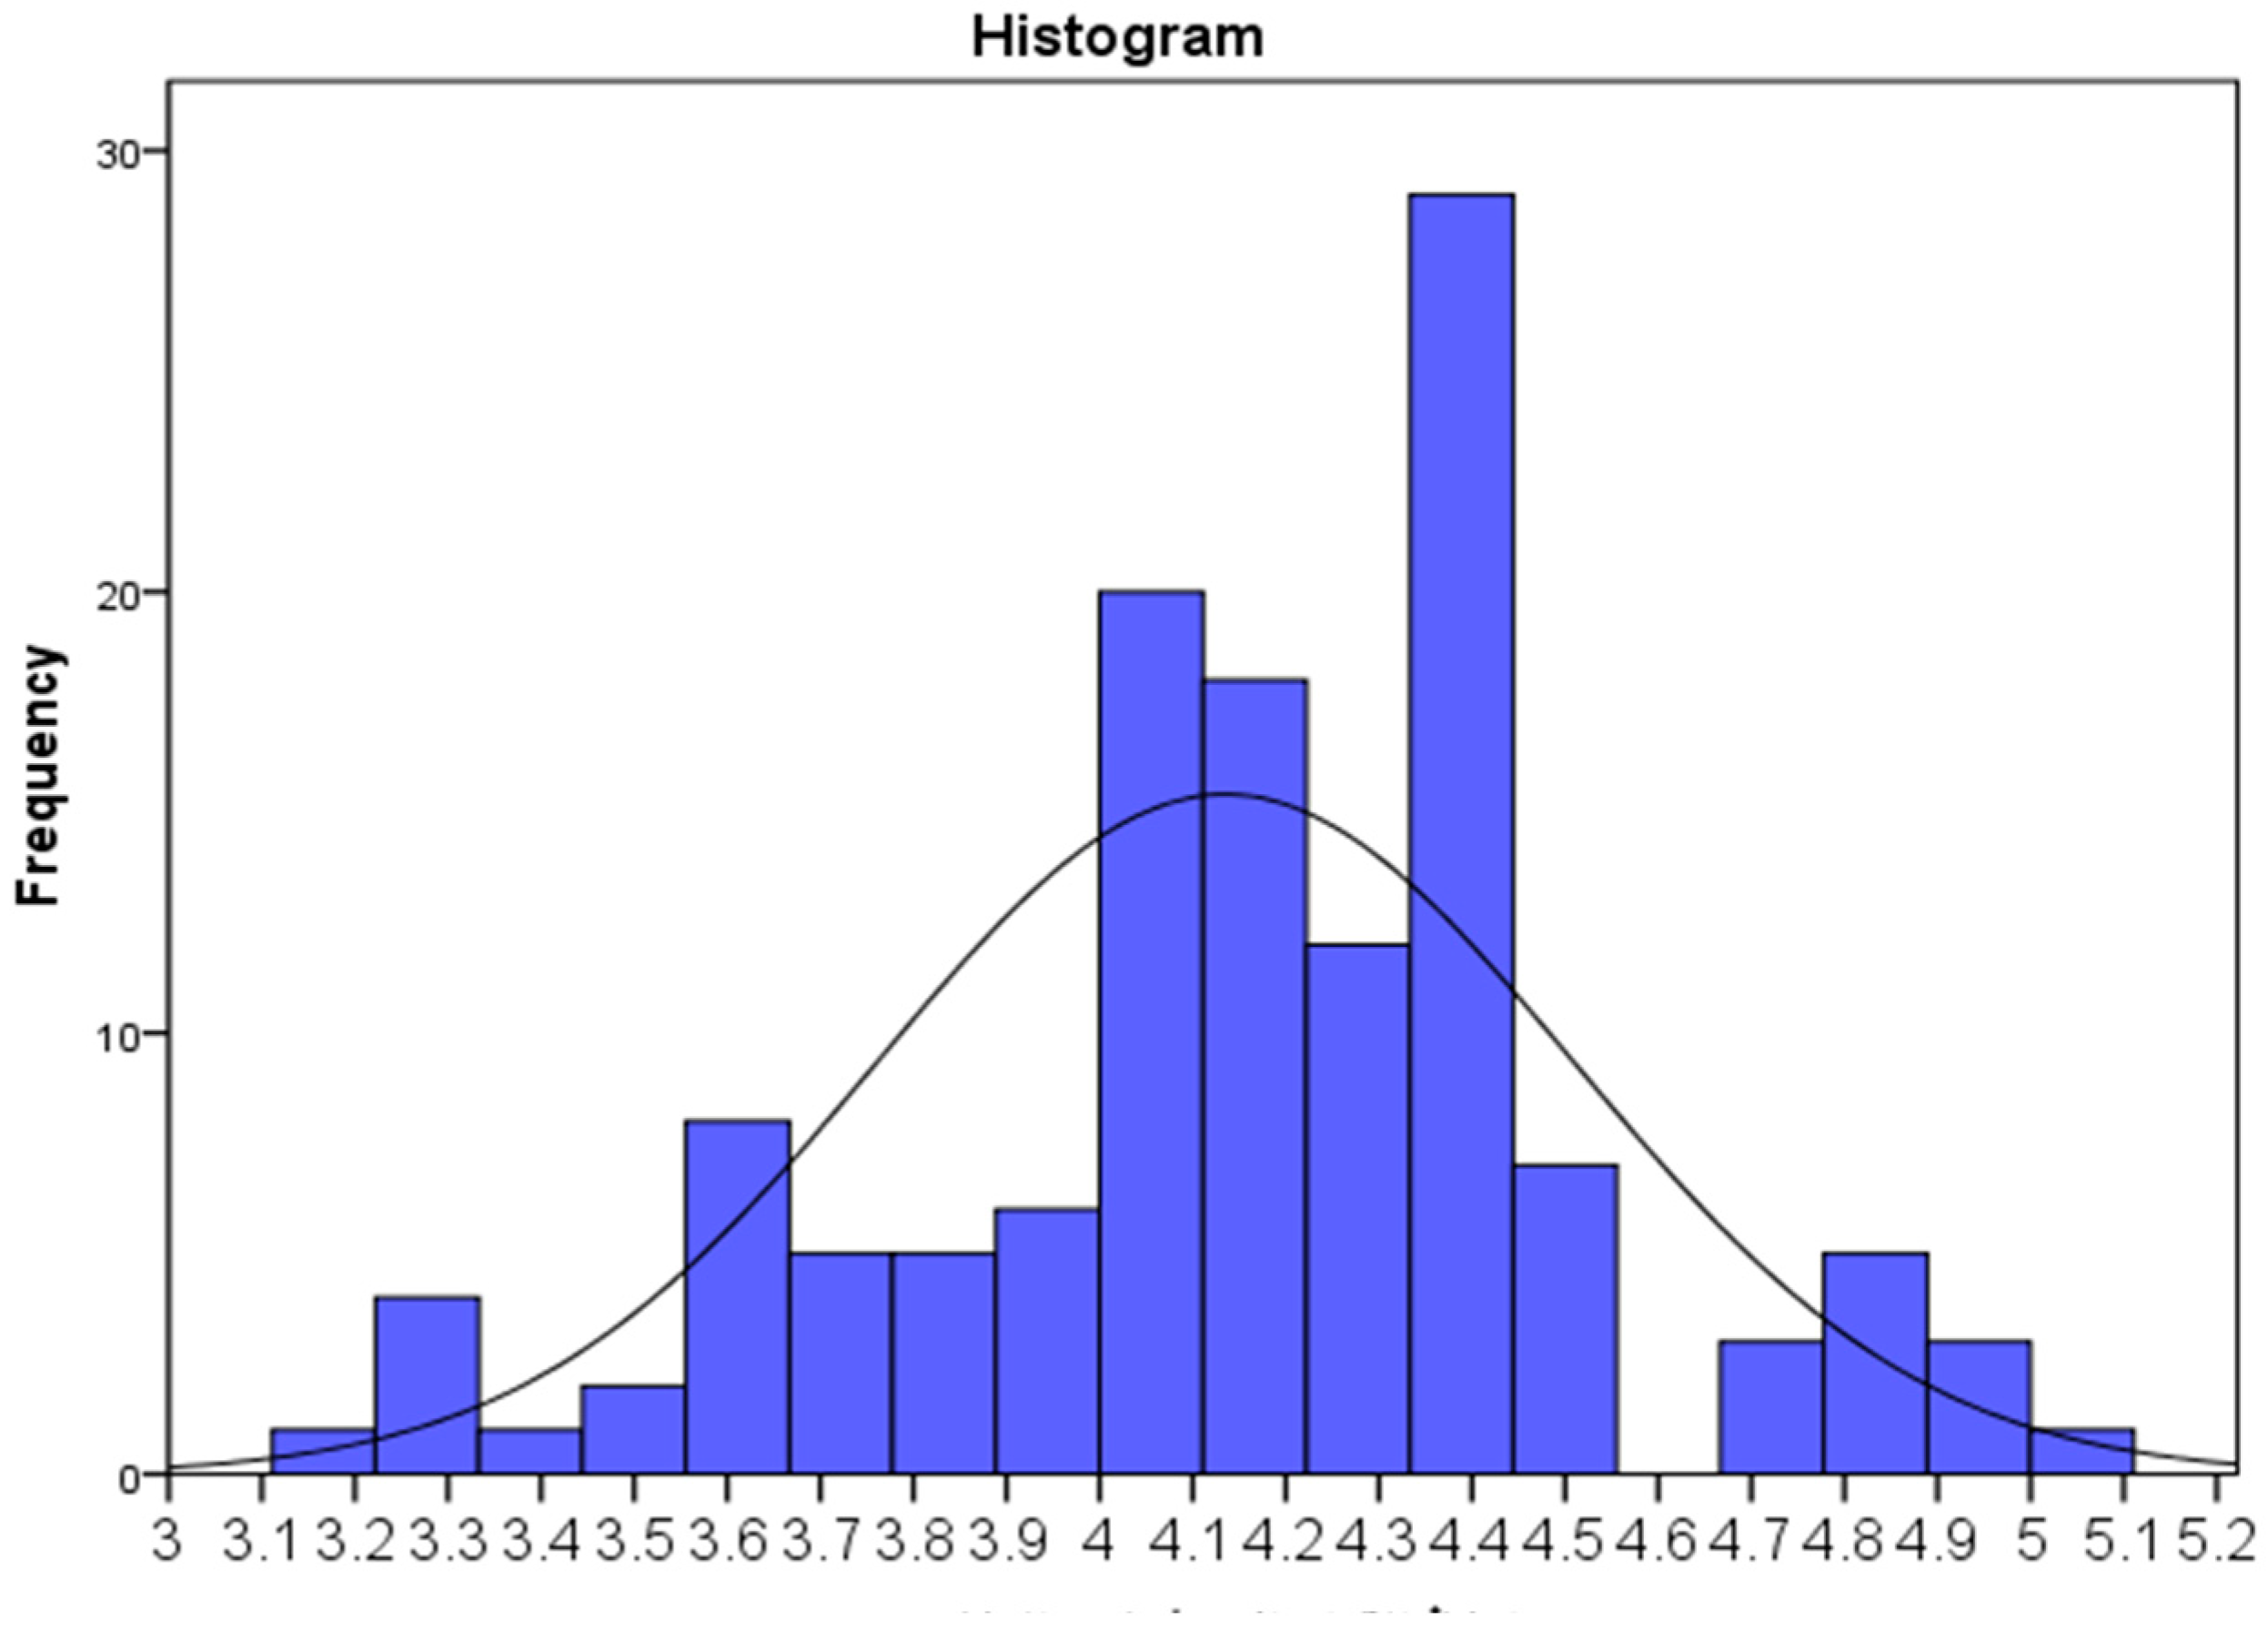
5.2.2. The Normal Distribution Test for Making the Appropriate Investment Decision

In order to test the extent to which the data are distributed in the appropriate investment decision-making scale naturally, the following two hypotheses are proposed:
  • The null hypothesis: The data on the axis of making the appropriate investment decision are distributed normally.
  • The alternative hypothesis: The data on the axis of making the appropriate investment decision are not distributed normally.
According to the data in the Table 3, the estimated value of the Kolmogorov–Smirnov test was 1.282, which is less than the tabular (Z) value of (1.96), and the significance value (Sig) was 0.068, which is higher than the value of (Sig). Acceptance of the null hypothesis and rejection of the alternative hypothesis at the (0.05) level of significance indicates that the data on the axis of making the appropriate investment decision are distributed approximately according to the normal distribution; the normal distribution curve for the data on the axis of making the appropriate investment decision is illustrated in Figure 4, which also shows the degree of consistency of the normal distribution curve.

6. Poly-Linearity Problem Test

The problem of multi-linearity occurs when two or more explanatory variables (independent) are associated with a strong linear relationship, as it is difficult to separate the effect of each independent variable from the response variable in the applied reality. If the value of variance inflation factor, which is abbreviated as (VIF), is greater than (4), this indicates the existence of the problem of multi-linearity, while if the value of that factor exceeds (10), it means that the problem exists and is well established. In the studied model, in order to test the existence of a poly-linear problem with respect to an axis or a variable (the factors affecting making the appropriate investment decision), the program (SPSS) was used, and the consequences are as in the Table 4.
The above table shows that the variance inflation factor (VIF) for all the variables of the axis of the factors affecting the appropriate investment decision making is less than (10), as it originally did not exceed (3), indicating that there is no problem of linear multiplicity, and the value of (Tolerance) did not exceed (1), confirming that the model for the study is valid for statistical analysis without trebling.

6.1. Validity and Reliability

The following tests were conducted on the questionnaire to verify its validity and reliability, as follows:

6.1.1. Testing the Questionnaire Content Validity

This measure was determined using the terminal comparison approach, which involved adding up the questions on the questionnaire and sorting the results in descending order. The data were split in half, with one quarter coming from the top and the other from the bottom. The statistical analysis revealed that there is a significant difference between the upper and lower parties’ means after comparing their means and testing the difference between their means; the computed T value of 8.845 is significantly higher than the tabular T value of 995.1, at the 5% significance level, in addition to a significant amount of leeway (68) which indicates the scale is reliable.

6.1.2. Stability of the Questionnaire Content

The concept of stability refers to the extent of consistency in the results of the scale, as the strength of stability in the questionnaire indicates the convergence or equality of the results of the application in two different time periods on the same targeted individuals in the research. For this reason, the stability coefficient was calculated according to two methods:
  • The half-partition method: The (61) items of the questionnaire were divided into two homogeneous equal halves, and for all the (130) questionnaires, the first half included the individual items, while the second half included the even items, with the exception of the middle paragraph. By calculating the correlation coefficient (Pearson) between the value of the two halves as 801.0 and using the corrective (Spearman–Brown) equation, the value of the stability coefficient according to the split-half method was (86.0) for the first half and (81.0) for the second half, which are very good stability values that call for the adoption of the research results and their generalization in future studies.
  • Test and re-test method: This method depends on the consistency of the answers of the same respondent from one paragraph to another, as it used an intentional sample of the respondents amounting to 38 respondents who polled their opinions on the subject of the research, and the questionnaire was returned to them after a period of three weeks. Then the alpha-Cronbach coefficient was calculated for each axis of the questionnaire axes and the general stability coefficient for all the paragraphs of the questionnaire, and the test results showed that the value of the stability coefficient (alpha-Cronbach) reached 88.0, which is a good percentage that confirms the adoption of these results in this research and subsequent future studies, and Table 5 illustrates the value of stability coefficient for the research questionnaire.

7. Description and Analysis of the Response of the Research Sample

The results will be analyzed by identifying the reality of the research variables in investment companies from the perspective of the research sample. Additionally, the questionnaire data will be tabulated for the answers of the sample members in order to determine the weighted arithmetic medians of the factor affecting the appropriate investment decision-making and the appropriate investment decision-making, to indicate the extent of awareness and support of the sample research in each of the paragraphs and compare it with the hypothetical mean of (3) as in the following Table 6:

7.1. Describing Participant Reaction to the Scales of Factors Which Should Be Considered When Making a Sound Investment Choice

This paragraph aims to analyze the dimensions of the requirements of the factors influencing the appropriate investment decision-making from the viewpoint of the sample studied. As appear in Table 7, the results indicated the following:
The preceding chart displays means, standard deviations, coefficients of variation, and the arrangement of the dimensions of axes of factors influencing prudent investment decision-making. The total arithmetic mean for this variable was 4.13, higher than the hypothetical mean value of 3 on the measurement area and falling within the range 67.3–5, which indicates a high degree of response shown by the respondents within the research sample towards all dimensions (axes) of the variable factors affecting the appropriate in-vestment decision-making, and the value of the total standard deviation for it is 0.341, indicating a small amount of the research looks into the factors that investors should consider in order to make smart choices.
To show which of several dimensions of the elements impacting the right investment choice was most important, we used a coefficient of difference weighted by the geometric mean and standard deviation. Afterwards, the dimension of external factors came in at number four with a coefficient of difference of 11.13, and this was after the value of 9.35 was assigned to the nature of future financial information, which ranked second with a coefficient of difference of 10.40, and information technology ranked third with a coefficient of difference of 10.98. A convergence between the rate of dispersion (coefficient of difference) for all the dimensions was observed after the disclosure, placing the dimension of internal factors at the sixth position with a coefficient of difference of 16.54, the largest coefficient of difference compared to other dimensions, as perceived and realized by the research sample working in the companies under study.

7.2. Describe the Response of the Research Sample to the Appropriate Investment Decision-Making Variable

This section will examine, from the perspective of the study’s subjects, the most important factor in making sound financial investments. According to the Table 8, the data showed that there was much enthusiastic feedback and backing for all of the paragraphs in this dimension. In the sample of investment firms used for this analysis, the average arithmetic mean for the relevant investment decision-making variable over all paragraphs was 25.4, with an average percentage weight of 85. The value of the standard deviation reached the general variable for the variable 0.604, indicating a dispersion in the opinions of the respondents, and thus a somewhat homogeneous perception of the content of the variable as a whole, indicating that this variable has achieved high intensity support expressed by those included in the research.

8. Research Hypothesis Testing

The following paragraphs will be discussed in this part as they pertain to testing study hypotheses concerning the relationship and influence.

8.1. Correlation Test:

8.1.1. Main Hypothesis 1: “There Is a Significant Correlation among the Factors Influencing and the Decision-Making of the Appropriate Investment.”

Information Nature, Disclosure, Perception, Internal Factors, External Factors, and Information Technology will all be measured for their rank correlation with the proper investment decision-making variable using the Spearman correlation coefficient. Six smaller hypotheses make up the study’s first, overarching theory.
We used the t test to determine if the correlation coefficients computed by SPSS were statistically significant, and the results are shown in the table below along with our interpretation of them.
Table 9 shows that the value of the Spearman correlation coefficient among the factors influencing and the appropriate investment decision-making variable was 724.0, a positive value which reflects the presence of a strong direct relationship with significance at the significant level (05.0) and (0.01) due to the value of (T) calculated for it, as a statistician, I can tell you with absolute certainty (0.01).
This result lends credence to the study’s first primary hypothesis, which states that “there is a significant correlation between the factors influencing the appropriate investment decision-making in the investment companies and their development as a whole”, implying that attending to these factors will enhance the quality of investment choices made by these institutions.

8.1.2. Testing Sub-Hypotheses of Correlation

  • Sub-hypothesis 1: According to this theory, “the nature of the knowledge is significantly correlated with making the optimal investment decision”.
According to Table 9, the value of the Spearman correlation coefficient between the information dimension and the appropriate investment decision-making variable was 0.638, which is a positive, direct value with significance at the significant level 05.0 and 0.01 due to the fact that the value of (T) the calculated value of 9.373 is greater than its tabular counterpart, which is equal to 1.979 and 2.615 at the same level of significance.
This will aid in making better investment choices and enhancing efficiency. Therefore, the initial null hypothesis is correct.
  • Sub-hypothesis 2: The “significant correlation between disclosure and making the appropriate investment decision” hypothesis states that this relationship exists.
Increases in prudent financial decision-making appear to be linked to the proactive disclosure of information, as the calculated (T) value of 9.423 is larger than its tabular counterpart of 1.979 and 2.615, respectively. This is supported by the fact that there is a positive, direct, and statistically significant value of 0.640 for the Spearman correlation coefficient between the proactive information disclosure dimension and the suitable investment decision-making variable (at the 5% significance level) (0.01).
  • Sub-hypothesis 3: which asserts, “There is a strong link between how things appear and making the right financial choice”.
The value of (T) calculated and reached (11.027) is greater than its tabular counterpart, which is equal to 1.979 and 2.615, respectively, as shown in Table 9. This indicates that the value of the Spearman correlation coefficient between the perception dimension of proactive information and the appropriate investment decision-making variable is 0.698, a positive direct directional value which is significant at the level of 0.05 and 0.01, respectively. Given the preceding, we accept the third null hypothesis, which states that investment firms will be able to make the best investment decision if they give priority to the perception of proactive information and work to establish it as an important detail.
  • Sub-hypothesis 4: Internal aspects are highly correlated with making the right investment decision, as stated by this hypothesis.
Spearman’s correlation coefficient between the internal-factors dimension and the suitable investment decision-making variable was calculated to be 0.525, a positive, direct value which is significant at the 5% level, because the calculated (T) value of 6.978 was greater than its tabular counterpart amounting to (1.979) and (2.615): (0.01).
This result lends credence to the fourth null hypothesis, which states that investment firms will improve their chances of making the best investment choice if they focus on internal factors in their work.
  • Sub-hypothesis 5: which asserts that “there is a considerable association between external factors and making the optimal investment decision”.
Since the calculated (T) value of (8.097) exceeds the tabular (T) value of 8.005, the value of the Spearman correlation coefficient between the external factors dimension and the suitable investment decision-making variable is 0.582, which is a positive direct directional value which is significant at the (05.0) and (0.01) levels of significance (0.01). In other words, if you split that number by, you obtain (2.615): (1.979). Finally, we accept the fifth null hypothesis at both the 5% and 90% levels of significance because we believe that investment firms can increase their probability of making the best possible investment choice by improving their internal processes and paying attention to external circumstances.
  • Sub-hypothesis 6: which claims, “There is a strong link between IT and picking the right investment”.
According to Table 9, the value of the Spearman correlation coefficient between the information technology dimension and the appropriate investment decision-making variable was (0.326), which is a positive, direct significant value at the significant levels of (05.0) and (0.01), since the calculated (T) value reached (3.901) is greater than its tabular counterpart, which amounts to (1.979) and (2.615), for both levels of significance. This finding suggests that investment firms will make smarter investments as a result of a greater focus on IT and its development. This provides support for accepting the null hypothesis.

8.2. Effect Test

8.2.1. Testing Main Hypothesis 2 of the Effect Relationship

”There is a strong influence relationship for the variables influencing the correct investment decision-making,’ says the study’s second main hypothesis”.
The simple linear regression equation is the formula for measuring how the dimensions of the factors influencing the appropriate investment decision-making influence the appropriate investment decision-making variable, and it must be computed before a decision can be made on the second main hypothesis, from which the six supporting hypotheses stem.
y = a + β i X i
The significance of a regression equation (influence) is then evaluated with the test (F), and the coefficient of determination (R2) is used to account for the variance that remains after controlling for the variables that affect the suitable investment decision-making variable. The following findings from using SPSS are shown in Table 10:
Table 10′s statistical analysis revealed a significant effect at the 0.05 significance level for the variable (Take appropriate investment choice), as the value of (F) calculated indicated that there was a correlation between the two variables. For both degrees of significance (05.0) and (6.736), the numerical value (146.821) exceeds its tabular analogue (3.915) and (6.837): (0.01). The independent variable (factors influencing the appropriate investment decision-making) was able to explain 53%, that is, slightly more than half of the total changes that occur in the values of the approved variable (making the appropriate investment decision) in the surveyed companies, as reflected in the value of the coefficient of determination, while the remaining percentage (47%) is attributed to the contribution of other variables not included in t.

Making the Appropriate Investment Decision = 1.93 + (0.73) Factors Affecting Making the Appropriate Investment Decision

With an effect size of (0.73), the preceding equation shows that a 100% increase in interest in the factors affecting investment companies’ appropriate investment decision-making will be accompanied by a 73% increase in appropriate investment decisions. Limit value suggests there is a significant sign because the calculated (t) value of 12.117 is greater than its tabular equivalent of 1.979, which is equal to 2.615 at the significant level 05.0 and 0.01, respectively. The value of the correct investment decision cannot be less than the constant value if the value of the factors affecting the correct investment decision is zero (1.93).
The critical importance of the variables should be considered while making a sound financial investment. The factors that play a role in deciding what constitutes an adequate investment are depicted in a diffusion form and a regression line in Figure 5A.

8.2.2. Testing the Effect Sub-Hypotheses

From the second main hypothesis, the sub-hypotheses branched out as follows:
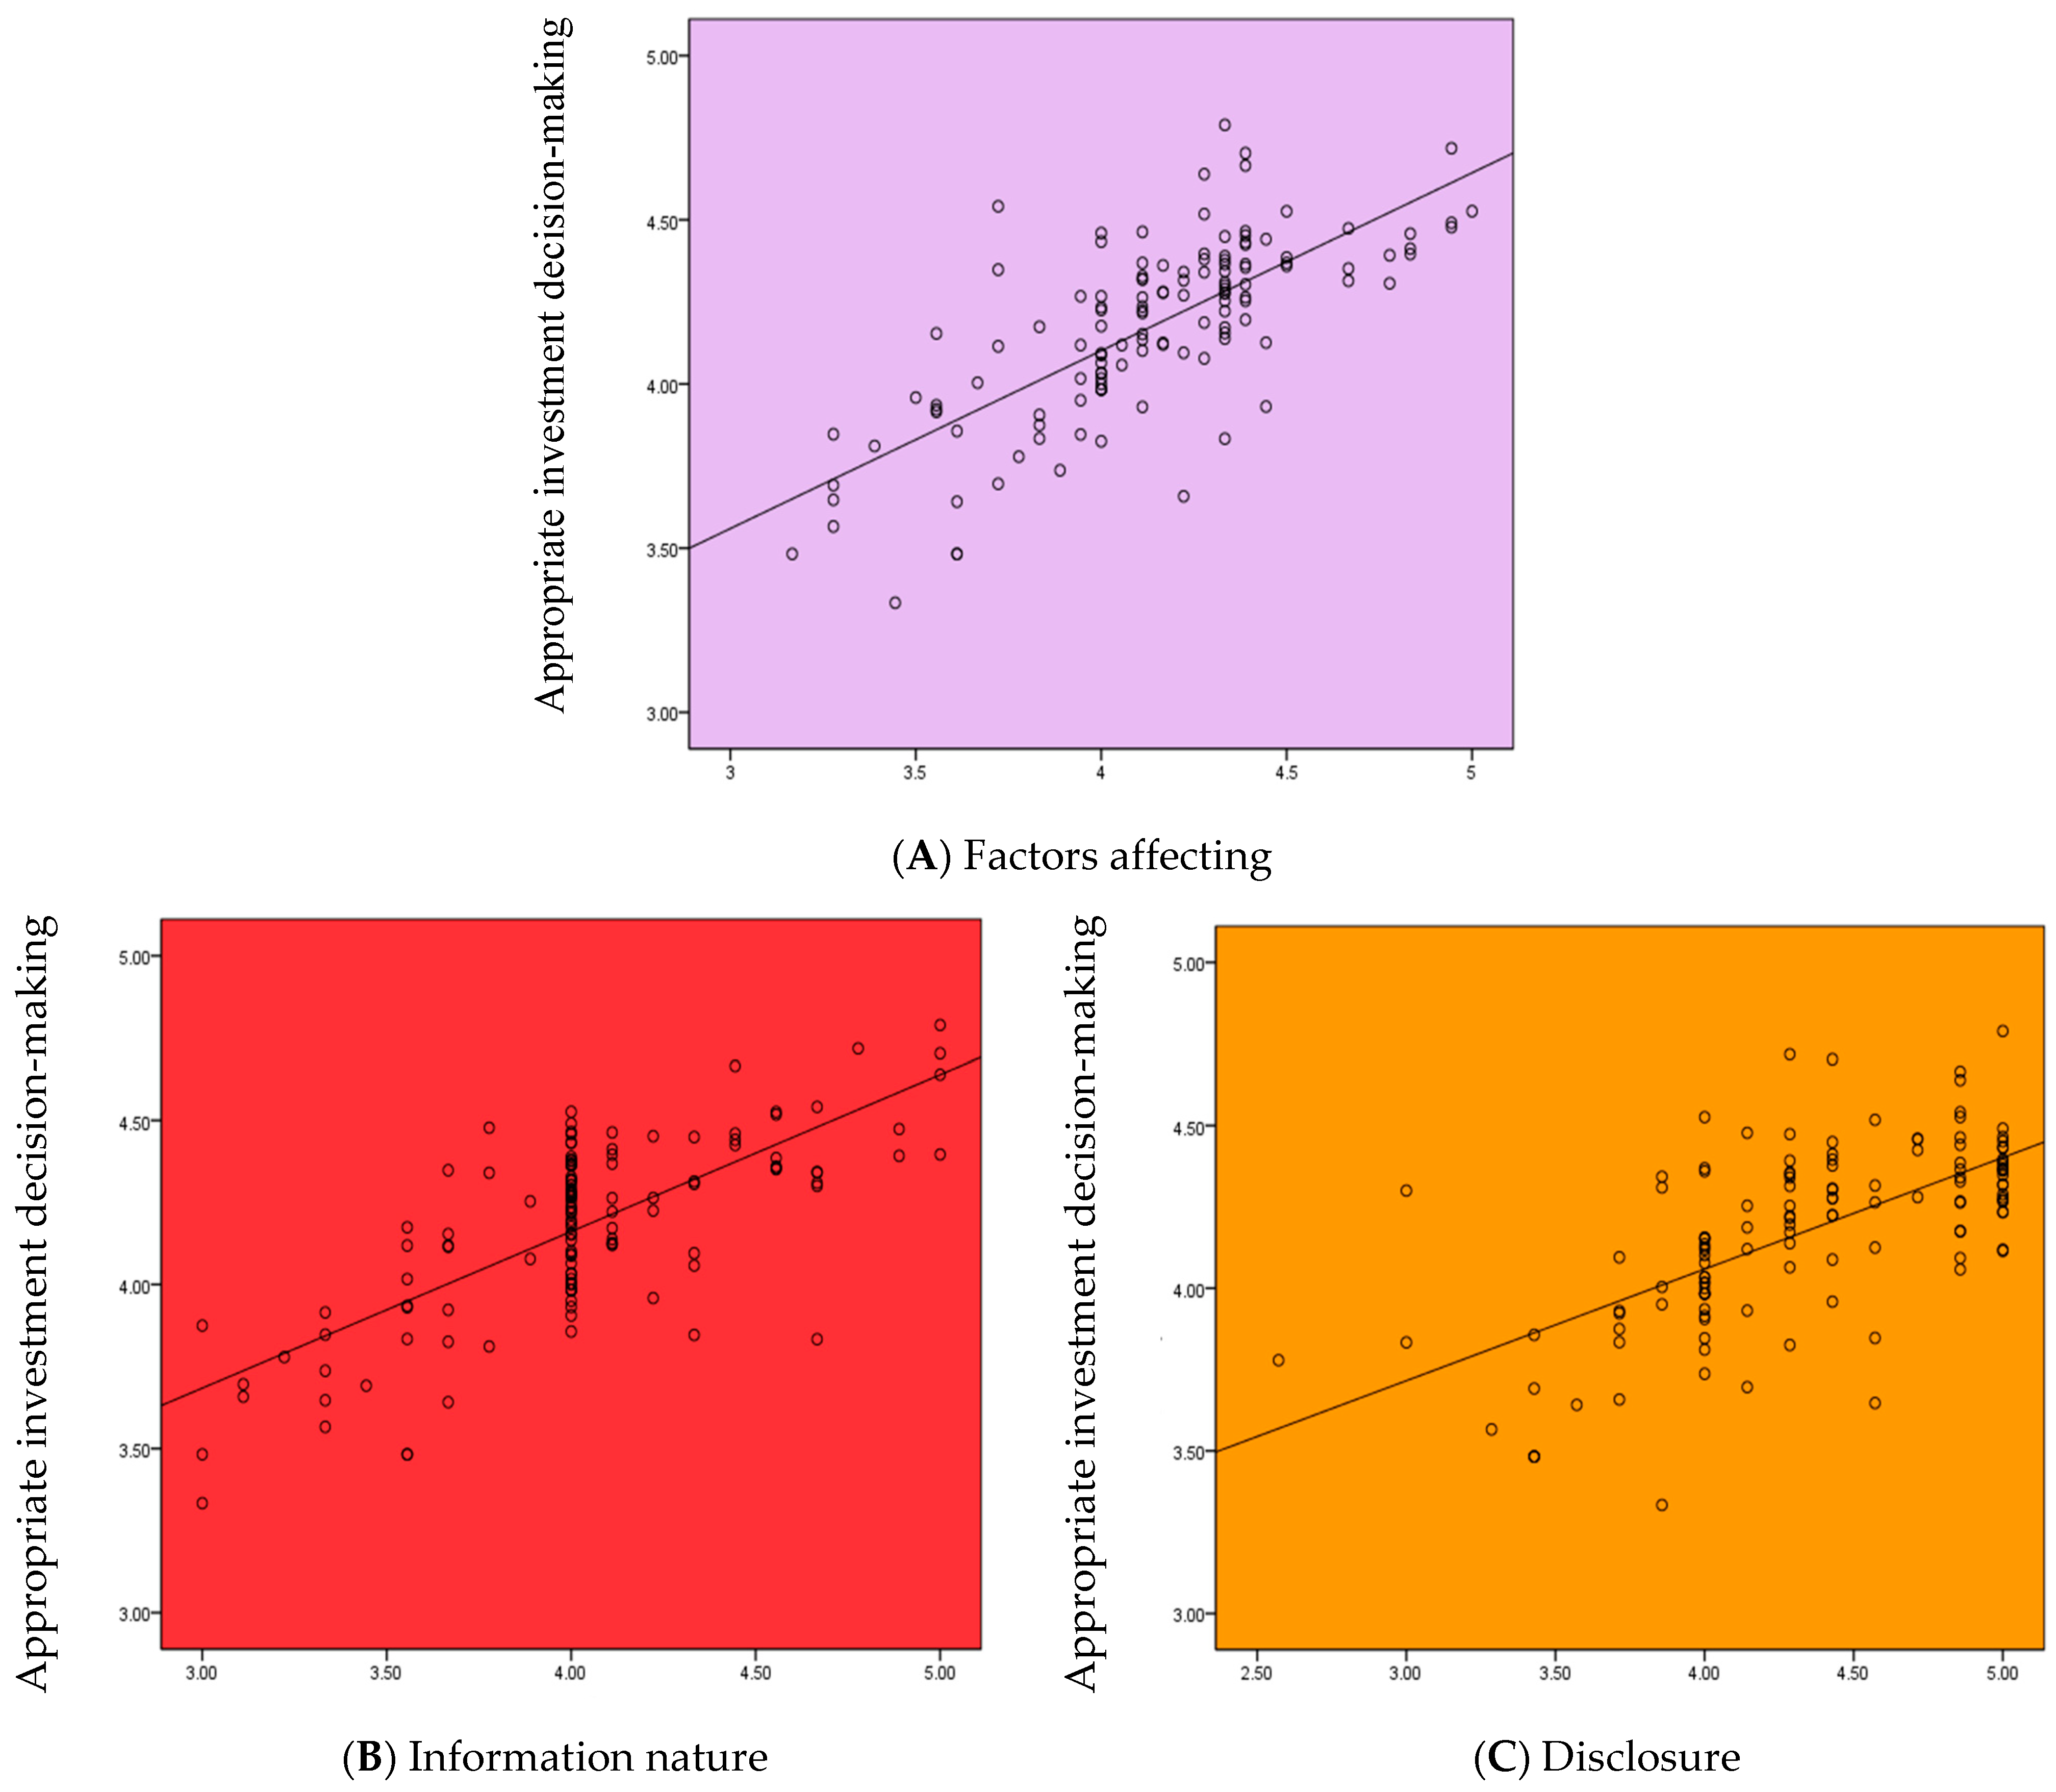
  • Sub-hypothesis 1 states that “there is a significant effect relationship of the nature of the proactive in-formation in making the appropriate investment decision”.
Table 10 displays that the calculated (F) value of (79.097) is larger than its tabular counterpart, which is equal to (3.915) and (6.837), indicating the presence of a significant effect at the (0.05) and (0.01) level of significance for the dimension of the Information Nature in the relevant investment decision-making variable. There was a low correlation between the independent variable (correct investment decision-making) and the dependent variable (variation or change in worth) (the Information Nature). Approximately 40% of the variance can be attributed to the value of the determination coefficient, while the remaining 60% can be attributed to the impact of other variables. This leads to the following regression equation, which describes the effect of the information dimension on the relevant financial decision-making variable:

Making the Appropriate Investment Decision = 2.25 + (0.62) Information Nature

Since the regression coefficient (or impact or tendency) in the aforementioned equation is (0.62), we can deduce that an increase of one unit in the type of information dimension is accompanied by an increase of (62%). The first null hypothesis is rejected, and the second is accepted, because the calculated (t) value of (8.794) is larger than its tabular counterpart, which is equal to (1.979) and (2.615) at the significant level (0.05) and (0.01), respectively; and because the fixed limit value of (2.25) indicates that if the value of the nature of proactive information is equal to zero, then the value of making the appropriate investment decision will not be less than that value (2.25). Figure 5B is a diffusion shape and regression line depicting the effect of the nature of the proactive knowledge on choosing the best investment option.
II.
Sub-hypothesis 2 states that “there is a significant effect relationship of the disclosure dimension on the appropriate investment decision-making variable”.
Table 10 shows that the computed (F) value of (85.529) is larger than its tabular equivalent of (0.013), showing the existence of a substantial impact at the 0.05 and 0.01 levels of significance (0.01): (85.529). Lower-level significance is at (3.915), while higher-level importance is at (6.837). Depending on the coefficient value, the independent variable (Disclosure) accounted for less than half of the variance in the dependent variable’s values (41%) (proper investment decision-making). The remainder (59%), it is hypothesized, results from causes beyond the purview of this paradigm. Following is a formulation of the estimated regression equation for the effect of disclosure on the pertinent investment decision-making variable.

Making the Appropriate Investment Decision = 2.08 + (0.64) Disclosure

Given the value of (0.64) for the regression coefficient in the above equation, it can be deduced that a +1 increment on the disclosure dimension will result in a +64 increment on the relevant financial decision-making variable. For these reasons, we accept the second null hypothesis, which states that “there is a positive relationship between the value of (t) and the level of significance” (t = 1.979, t = 2.615, t = 0.01). The fixed limit value of (2.08) indicates that if the disclosure value is equal to zero, the value of appropriate investment decision-making will not be less than that value (2.08). Figure 5C is a diffusion shape and regression line depicting the effect of openness on making a sound financial purchase.
III.
Sub-hypothesis 3 states that “there is a significant impact relationship of the perception dimension on the appropriate investment decision-making variable”.
The calculated (F) value (118.253) for the perception dimension in the appropriate investment decision-making variable is larger than the tabular (F) value (3.915) (Table 10), indicating a significant impact at the (0.01) and (5.0) levels of significance. The value of the determination coefficient (4.837) is significant at the 0.05 and 0.01% levels of significance, indicating that the independent variable (perception) explains nearly half of the variation in the values of the dependent variable. Five-and-a-half percent of the variation cannot be accounted for because it stems from factors that were not included in the model. The estimated regression equation for the influence of the Perception dimension on the important business decision-making variable is as follows:

Making the Appropriate Investment Decision = (2.11) + (0.69) Perception

A one-unit increase in the perception dimension predicts a 69% increase in the pertinent investment decision-making variable (given that the regression coefficient in the aforementioned equation is 0.69). Thirdly, we accept the null hypothesis that “There is a significant influence relationship for the dimension of perception in the variable of making the appropriate investment decision”, since the calculated (t) (amounting to 10.874) is greater than its tabular counterpart, which is equal to (1.979) and (2.615) at the significant level (0.05) and (0.01), respectively, equal to zero. Perspective’s effect on selecting the optimal investment strategy is shown graphically in Figure 5D as a diffusion shape and a regression line.
IV.
Sub-hypothesis 4 states that “there is a significant impact relationship of the dimension of internal factors in the variable of making the appropriate investment decision”.
Table 10 shows that the calculated (F) value of (54.626) for the Internal Factors dimension of the appropriate investment decision-making variable is bigger than its tabular counterpart, indicating a significant impact at the level of significance (0.05) and (0.01). (27.938): (3.915). Six point eight hundred thirty-seven, five point zero-hundred, and zero point one (significant).
The estimated regression equation shows that the independent variable (Internal Factors) accounts for one-third of the variance in the dependent variable (the variable used to make investment decisions), while the remaining two-thirds can be attributed to the contribution of other variables outside of the scope of the model.

Making the Appropriate Investment Decision = 3.18 + (0.40) Internal Factors

Taking the value of (t) in the above equation as an example, we can infer that the regression coefficient is a significant function, with a value of (0.40) indicating that a one-unit increase in the dimension of the internal factors will lead to a 40% increase in the appropriate investment decision-making variable. When compared to its tabular representation, (8.962) is larger than (1.979), which is equal to (0.05) and (0.01), which is equivalent to (2.615). Because the value of the fixed limit is greater than 3, the fourth null hypothesis, which states that “there is a significant influence relationship for the dimension of internal factors in the variable of making the appropriate investment decision”, is accepted. In Figure 5E, we see the dispersion around the regression line, which represents the impact of internal factors on selecting the right investment choice.
V.
Sub-hypothesis 5 states that “there is a significant influence relationship for the dimension of External Factors in the appropriate investment decision-making variable”.
When looking at the dimension of External Factors in the relevant investment decision-making variable, the estimated (F) value of (74.254) is higher than its tabular equivalent of (3.915), showing the presence of a significant impact at the level of significance (0.05) and (0.01). A total of 37 or 6.837 percentage points of the total changes or deviations in the values of the dependent variable (correct investment decision-making) can be attributed to the independent variable (external effects), depending on the value of the coefficient. Additional variables whose impact was overlooked during model development account for the remaining 63%. Therefore, the following can be expressed as the estimated regression equation for the effect of external factor dimension on the important investment decision-making variable:

Making the Appropriate Investment Decision = 2.69 + (0.61) External Factors

The significance of the regression coefficient (or influence or tendency) is indicated by the fact that the calculated (t) value of (8.617) is larger than its tabular counterpart, which is equal to (1.979) and (2.615) at the significant level, and that this difference is statistically significant. We accept the fifth null hypothesis, which states that “there is a significant influence relationship for the dimension of external factors in the variable of making the appropriate investment decision”, because the fixed limit value of (2.69), which indicates that if the value of the external factors is equal to zero, then the value of making the appropriate investment decision will not be less than that value (2.69), which is greater than zero. The diffusion form and regression line of the impact of exogenous factors on making the right investment choice are shown in Figure 5F.
VI.
Sub-hypothesis 6 states that “there is a significant impact relationship of the information technology dimension on the appropriate investment decision-making variable”.
The estimated (F) value of (28.643) for the information technology dimension in the appropriate investment decision-making variable is greater than its tabular counterpart of (0.035), suggesting a significant impact at the (0.05, 0.01) level of significance, as shown in Table 10 (3.915). The value of the determination coefficient indicates that the independent variable (Information Technology) explains eighteen percent of the variance in the dependent variable (variable appropriate investment decision), while the remaining eighty-two percent is attributed to the influence of other variables n. This is the regression equation we calculated to describe the effect of IT on the soundness of financial commitments.

Making the Right Investment Decision = 3.09 + (0.43) Information Technology

Using the above number for t, we find that the regression coefficient is −0.43, which indicates that a one-unit increase in the IT dimension predicts a 43.0% increase in the relevant investment decision-making variable. The numerical value (5.253) exceeds its tabulated counterparts (1.979 and 2.615 at the 0.05 and 0.01% significance levels, respectively). Since the fixed limit value of (3.09) indicates that if the value of the internal factors is equal to zero, then the value of making the appropriate investment decision will not be less than that value, and we accept the sixth null hypothesis that “there is a significant influence relationship of the information technology dimension in the variable of making the appropriate investment decision” (3.09). The shape and regression line of information technology’s diffusion in determining the best investment choice are shown in Figure 5G.

8.3. Regression Test

After the effect of the dimensions of the factors influencing the appropriate investment decision-making on the appropriate investment decision-making variable was identified separately, the most prominent influences of all independent variables in the dependent variable must be shown at once by building a model multiple and general linear regression that includes the most prominent of those dimensions that will contribute to building that effect as a whole through steps through which these dimensions are filtered as if there is competition between the dimensions or factors to enter that model, where any independent variable is nominated through criteria, the most important of which is the extent of the strong correlation of any dimension with the appropriate investment decision-making variable with a significance of the variance analysis table represented by the (F) test, as this method is known as serial regression.
The SPSS was used to calculate and choose the best model that illustrates the extent to which the dimensions of the factors influencing the appropriate investment decision-making (Information nature, Disclosure, Perception, Internal factors, External factors, and Information technology) in the variable take an appropriate investment decision, and the results are in Table 11:
The above table illustrates the steps for nomination and fixing the dimensions of the factors influencing the appropriate investment decision-making as independent variables in the model which illustrates their effect on the appropriate investment decision-making in the institutions under study.
Step 1: Inputting the predictive model as the most important variable and the most influential in making the correct investment choice came after the nature of the proactive information, where it was found that there was a statistically significant impact at the significant level (0.05) and (0.01). The calculated value of (F) is (139.09), which exceeds its tabular counterpart at two degrees of freedom (128.1) with the same levels of significance (0.05) and (0.01). The tabular value of (F) was equal to (3.91) and (6.83), the value of the determination coefficient was (0.52), and the value of the regression coefficient was (0.72).
Step 2: In this step, the disclosure dimension was entered, in addition to the nature of the proactive information dimension, as they are really influential in making the appropriate investment decision, as it was observed that there was a statistically significant effect for both because the calculated value of (F) amounted to (167.84), which is greater than its tabular counterpart at two degrees freedom (127.2), and for the same levels of significance (0.05) and (0.01), the tabular value of (F) was equal to (3.06) and (4.77), and the value of the determination coefficient had increased to be (0.73) from what it was in the first step, and the value of the regression coefficient for the dimension nature proactive information was (0.59) and for the disclosure dimension it was (0.47).
Step 3: In this step, the dimension of external factors was entered in addition to the dimension of the nature of proactive information and disclosure, as they are the independent variables most influential in making the appropriate investment decision, as a statistically significant effect was recorded at a significant level (0.05) and (0.01) due to the fact that the calculated value of (F) which amounted to (284.97) was greater than its tabular counterpart with two degrees of freedom (126.3), with two levels of significance (0.05) and (0.01) and amounting to (2.67) and (3.94), respectively. It is noted that each step rises with significance in the regression model that resulted within all steps. A rise was also observed in the determination coefficient to reach (0.87), which is an excellent interpretation of the effect of the three dimensions extracted in the model and its impact on making the appropriate investment decision in the institutions under study. The value of the regression coefficient was (0.50) for the Information Nature dimension, (0.42) for the Disclosure dimension, and (0.39) for the External factors dimension, as it is noted a slight decline in the value of the regression coefficient for the variables of the Information Nature and Disclosure, and we also note that the signs of the coefficients for the three variables are positive, meaning that they reflect the extent of the direct effect of that variable in making the appropriate investment decision.
Step 4: Within this step, the Information Technology dimension was included in addition to the dimensions after the nature of proactive information, Disclosure, and External factors, as they are the independent variables that are the most influential and most prominent in making the appropriate investment decision. The calculated (F) value, which amounted to (346.29), is greater than its tabular counterpart with two degrees of freedom (125.4) at the same levels of significance (0.05) and (0.01), amounting to (2.44) and (3.47), respectively. It has been observed that there is an increase in coefficients of determination and it reaches its value of (0.92), which is a very excellent interpretation of the effect of the four dimensions extracted in the model and their impact on making the appropriate investment decision in the institutions under study. The value of the regression coefficient was (0.47) for the nature of the information dimension, (0.41) for the disclosure dimension, and (0.37). For the external factors dimension and (0.22) for the information technology dimension.
Step 5: Within this step, the perception dimension is included in addition to the dimensions of the nature of proactive information, disclosure, external factors, and information technology, as they are the independent variables that are the most prominent and influential in making the appropriate investment decision. Because the calculated (F) value of (973.57) is greater than its tabular counterpart with two degrees of freedom (124.5) at the same levels of significance (0.05) and (0.01), which are (2.29) and (3.17), respectively. It has been observed an increase in coefficients of determination and reaches its value of (0.98), which is a very excellent and almost complete interpretation of the impact of the four dimensions extracted in the model and their impact on making the appropriate investment decision in the institutions under study. The value of the regression coefficient was (0.37) for the information dimension nature, (0.32) for the disclosure dimension, (0.35) for the external factors dimension, (0.25) for the information technology dimension, and (0.30) for the perception dimension.
As it is noted, a slight decline in the value of the regression coefficient for all variables (and the reason for the decline is that in each step a new factor or variable is added that shares the influence with them and reduces their shares), and also we notice that the signs for the coefficients for the five variables are positive, meaning that they reflect the extent of the direct effect of those variables in making the investment decision the appropriate. Thus, the program stopped finding other steps, as the other remaining variables represented by one variable (internal factors) did not show any significant effects in making the appropriate investment decision, while the variables included in the extracted model were (Information Nature, Disclosure, External factors, Information technology, Perception), and thus the general linear regression equation to influence the appropriate investment decision-making is as follows:

Making the Appropriate Investment Decision = 0.15 + (0.34) Information Nature + (0.32) Disclosure + (0.35) External Factors + (0.25) Information Technology + (0.30) Perception

It is noted from the extracted model that the nature of the effect of all variables or the five extracted dimensions (the Information Nature, Disclosure, External factors, Information technology, Perception) in making the appropriate investment decision in the researched companies was a direct trend. Additionally, the non-appearance of the (internal factors) dimension does not necessarily mean that it is not important, as we noted in the previous paragraph that it had a significant effect, but lost its significant effect here because the five extracted variables have important greater than the significance of a variable or dimension of internal factors excluded from the model.

9. Conclusions and Future Work

The examination of the factors that influence investment decisions made by financial organizations that are listed on Iraqi stock exchanges was a significant part of the purpose of this research. In order to acquire data, the researcher filled out an organized questionnaire. The questionnaire consisted of a total of eight different questions. As part of the analysis of the questionnaire, the following factors were taken into consideration: split-half stability, test-and-retest reliability, normal distribution, linear multiplicity, validating the questionnaire in terms of both its content and its appearance, testing and retesting the questionnaire, and test-and-retest reliability. In addition to this, the research hypotheses were evaluated with regard to both the independent and the dependent variables. The results were used to derive several statistics, including a mean, standard deviation, weight percentile, and coefficient of variation. In order to elucidate the significance of the relationship that exists between the dimensions of the variables that have an impact on decision-making, the Spearman’s correlation coefficient and the test of significance (T) were both computed. Out of a total of 133, 130 individuals were considered for inclusion in the study. Using evaluations on a Likert scale, the factors that influence investment decisions were ranked in order of importance. Due to the fact that the value of (T) calculated for it is greater than its tabular counterpart, the value of the Spearman correlation coefficient between the factors influencing and the appropriate investment decision-making variable was found to be a positive value. This positive value reflects the existence of a strong and significant direct positive relationship at the significant level (0.05) and (0.01). Therefore, the first main hypothesis of the re-search is accepted, which states that “there is a significant correlation between the factors influencing the decision-making of the appropriate investment and the decision-making of the appropriate investment”. This hypothesis states that “there is a significant correlation between the factors influencing the decision-making of the appropriate investment”. In conclusion, this research looked at the effect of variables along several dimensions on good judgment using sequential regression. In a noteworthy development, the regression coefficients have been decreasing across the board for all of the variables (and the reason for this decline is that each step involves adding new factors that share their influence with them and reduce their influence shares). Additionally, we notice that each of the five variables has a positive coefficient, which demonstrates that they each have an indirect influence on the decision regarding the expenditure. The software eventually gave up its search for further stages because the remaining variables, each of which was represented by a single variable (internal factors), did not have an appreciable impact on the choice of the best investment option. The extracted model demonstrates a direct relationship between the nature of the impact of all variables or the five extracted dimensions, which is helpful in determining how to make the best investment decision in the businesses that were researched (Information Nature, Disclosure, External factors, Information technology, and Perception). As we saw in the previous paragraph, it had a significant effect but lost that significance here because the significance of the five extracted variables was higher than that of the dimension of internal factors that was left out of our final model. In addition, the fact that a specific dimension of internal factors did not make it into our final model does not mean that it is of no importance.
This line of inquiry can be expanded upon in a number of different ways in the course of future study. To begin, it would be desirable to carry out an explanatory study to test the findings of our survey while also including additional instances such as industry, banking, and credit. Next, in order to enhance the quality of the investment selection, it would be beneficial to include additional factors, such as behavioral factors.

Author Contributions

Conceptualisation, A.A.A.k. and Z.T.F.; formal analysis, A.A.A.k.; funding acquisition, A.A.A.k.; investigation, Z.T.F., S.R., S.A.E.-R. and B.M.N.; methodology, A.A.A.k. and Z.T.F.; supervision, Z.T.F., S.R., S.A.E.-R. and B.M.N.; validation, Z.T.F. and S.R.; writing—original draft, A.A.A.k.; writing—review and editing, A.A.A.k., Z.T.F. and S.R. All authors have read and agreed to the published version of the manuscript.

Funding

This research received no external funding.

Institutional Review Board Statement

Not applicable.

Informed Consent Statement

Not applicable.

Data Availability Statement

Data will be accessible upon request.

Acknowledgments

The author would like to extend their gratitude to the instructors and supervisions who arbitrated the questionnaire.

Conflicts of Interest

The authors certify that there is no overlap between their personal and professional interests.

Appendix A

Q1: What is the general activity of your company? What distinguishes your company from competitors?
A brokerage company in the sale and purchase of securities. The company is characterized by the quality of services provided to investors. The research department provides periodic reports on the market, listed companies, and the only company that has branches in the governorates, in addition to providing excellent customer service.
Q2: What are the determinants that affect the decision-making process?
Knowledge and experience, competence, skills, values, ethics, and relatively few persons cited selfishness as the most important personal characteristic impacting decision making.
Business resources, business goals, economic accounts, competition, and organizational goals are cited as the most influential economic elements on decision making. Managers ranked leadership style as one of the most important organizational elements because of its impact on decision-making. Another key factor is the formal structure of the business, which includes the components that make up the corporation and the relationships between them. There was then some expanded discussion on topics including job roles, organizational structure, and ethos.
Decisions are made based on the respondent’s personality and intuitive processes. As revealed by studies [28], the decision maker’s character and background knowledge play a major role in the final outcome. In contrast, intuitive reasoning facilitates speedy processing of complicated information [29,30]. Managers that succeed in high-stakes circumstances and have limited time use both their analytical skills and their gut instincts [31].
Emotions, mood, feelings, and prejudices were also cited as psychological factors that influenced their choices. To dig deeper into the subject, we questioned respondents if and to what extent they rely on their gut feelings and emotions when making important life choices. In response, some respondents said they don’t let them affect their decision-making at all, while others said it happens rarely or never. Contrarily, there were just seven yes votes. The point was made that individuals may not even realize they are being influenced in this way. Decisions are made in a certain emotional condition. Emotions can have both a positive and a negative impact on decision making, so it’s vital to keep that in mind. Emotional intelligence was also discussed; it has been found that such a person is more effective in management roles. Several participants said that they make decisions under the influence of intuition, but not emotion. People rely on their intuition when faced with ambiguity, when data is few, when time is of the essence (particularly when engaging in creative endeavors), and when they are under pressure. Thus, these replies diverge from those to an earlier question about the psychological elements that play a role in the decision-making process. Intuition was the next response given by some.
The interviews shed light on the social aspects most essential to understanding the impact of decision making, including the decision maker’s level of education, their age, and the stress level of the circumstance. The decision-making process is impacted less by the other elements stated, such as gender or location.
Q3: From your view point, identify the problems and barriers that arise in the decision-making process?
Uncertainty owing to a lack of information, data, and time was the most common issue brought up by respondents. The survey’s management respondents frequently mentioned issues with securing adequate financing and other resources. Respondents also mentioned stress, procrastination, the multithreading and complexity of the issue, the occurrence of unanticipated events, challenges linked to the calculation of profitability, and legal restraints as factors that hampered the decision-making process.
Participants were then asked to describe the difficulties they have encountered when trying to make a decision. Here, respondents were practically unanimous and most often pointed to information barriers relating to a lack of information. In addition, managers detect financial constraints, competency barriers, barriers relating to time pressure, uncertainty and risk, lack of resources and legal barriers. Signs of stress, organizational hurdles, and the paralyzing fear of making a mistake were all present. One responder cites emotional hurdles and two cite knowledge overload as additional causes for frustration. Next, in a follow-up question, respondents were asked to identify which of the barriers described affect the decision-making process the most. Most respondents highlighted information hurdles due to lack of information, financial barriers and time pressure as the most significant barriers. Respondents attributed less emphasis to limitations such as availability of resources, uncertainty and risk, stress or organizational and legal barriers.
Q4: What do you base your investment decision on?
The respondents were almost unanimous and most often pointed to the financial position of the joint-stock company, the degree of transparency by presenting the financial statements on time for the activities carried out by the joint-stock company and the contracts it signs, and foreign investment.
Q5: The investor would like to be fully informed and aware of the field of work. what methods do you use to collect recent data related to the investment work that you intend to do?
The respondents were almost unanimous and most often pointed to search the Internet for the company’s activities and follow up on the companies’ financial reports.
Q6: Are smart systems and computers used to analyze the collected data? And what it’s, if any?
The decision-making process and its meaning were first examined. Individuals provided a variety of definitions for the term. Decision-making was described as “daily reality” and “a duty on account of the position held” in the majority of respondents. The surveyed managers also adopted a process-based definition, stating that it is, among other things, “the process of studying variables under specific pressure”, “data analysis”, “issue analysis”, “risk-reward analysis”, and “analysis of multiple alternatives of choices and situations”. A few of the comments labeled the decision-making procedure as “effective management tool” or “organizational strategy implementation”. Some respondents described this idea as “a mechanism that permits the information resources and other aspects at hand to be steered towards a final conclusion”, while others said it meant “collecting the essential data to come up with the best answer” or “progressing from a problem to a solution”. One respondent called making decisions “a task”, another called it “a responsibility”, while still another called it “the next stage in the evolution of the organization”.
After that, we probed for details on how respondents’ workplaces made use of IT resources in making decisions. A few of them gave unfavorable feedback. While some may dispute the existence of such resources, others have confirmed the existence of digital resources that aid in decision-making, such as spreadsheets, ERP systems, databases, and data visualization programs; online communication tools that enhance the decision-making system; an intranet; and a wide range of planners, compilations, reports, and other internal programs for managing the organization.
Q7: Tell me about the three most important financial statements and what is their importance?
The respondents were almost unanimous and often referred to the following financial statements:
  • General budget.
  • Profit and loss statement.
  • Cash flow statement.

References

  1. Locurcio, M.; Tajani, F.; Morano, P.; Anelli, D.; Manganelli, B. Credit Risk Management of Property Investments through Multi-Criteria Indicators. Risks 2021, 9, 106. [Google Scholar] [CrossRef]
  2. Jain, J.; Walia, N.; Gupta, S. Evaluation of behavioral biases affecting investment decision making of individual equity investors by fuzzy analytic hierarchy process. Rev. Behav. Financ. 2020, 12, 297–314. [Google Scholar] [CrossRef]
  3. Niyozovna, N.I.; Azimov, O.O. The role of investment and modernization in the development of the uzbek economy. Res. J. Anal. Invent. 2021, 2, 140–145. [Google Scholar]
  4. Naqvi, M.H.A.; Jiang, Y.; Miao, M.; Naqvi, M.H. Linking biopsychosocial indicators with financial risk tolerance and satisfaction through macroeconomic literacy: A structural equation modeling approach. Cogent Econ. Financ. 2020, 8, 1730079. [Google Scholar] [CrossRef]
  5. Gill, S.; Khurshid, M.K.; Mahmood, S.; Ali, A. Factors effecting investment decision making behavior: The mediating role of information searches. Eur. Online J. Nat. Soc. Sci. 2018, 7, 758. [Google Scholar]
  6. Gardi, B.; Abdalla Hamza, P.; Sabir, B.Y.; Mahmood Aziz, H.; Sorguli, S.; Abdullah, N.N.; Al-Kake, F. Investigating the effects of financial accounting reports on managerial decision making in small and medium-sized enterprises. Turk. J. Comput. Math. Educ. (TURCOMAT) 2021, 12, 2134–2142. [Google Scholar] [CrossRef]
  7. Cohn, R.A.; Lewellen, W.G.; Lease, R.C.; Schlarbaum, G.G. Individual Investor Risk Aversion and Investment Portfolio Composition. J. Financ. 1975, 30, 605–620. [Google Scholar] [CrossRef]
  8. Riley, W.B., Jr.; Chow, K.V. Asset allocation and individual risk aversion. Financ. Anal. J. 1992, 48, 32–37. [Google Scholar] [CrossRef]
  9. LeBaron, D.; Farrelly, G.; Gula, S. Facilitating a dialogue on risk: A questionnaire approach. Financ. Anal. J. 1989, 45, 19–24. [Google Scholar] [CrossRef]
  10. Baker, H.K.; Haslem, J.A. Information needs of individual investors. J. Account. 1973, 136, 64–69. [Google Scholar]
  11. Baker, H.K.; Hargrove, M.B.; Haslem, J.A. An empirical analysis of the risk-return preferences of individual investors. J. Financ. Quant. Anal. 1977, 12, 377–389. [Google Scholar] [CrossRef]
  12. Nagy, R.A.; Obenberger, R.W. Factors influencing individual investor behavior. Financ. Anal. J. 1994, 50, 63–68. [Google Scholar] [CrossRef]
  13. Merilkas, A.; Prasad, D. Factors influencing Greek investor behavior on the Athens stock exchange. J. Bus. 2003, 66, 1–20. [Google Scholar]
  14. Bhagyasree, N.; Kishori, B. A study on performance evaluation of mutual funds schemes in India. Int. J. Innov. Res. Sci. Technol. 2016, 2, 812–816. [Google Scholar]
  15. Mutswenje, V.S. A Survey of the Factors Influencing Investment Decisions: The Case of Individual Investors at the NSE. Ph.D. Thesis, University of Nairobi, Nairobi, Kenya, 2009. [Google Scholar]
  16. Souza, T.T.; Aste, T. Predicting future stock market structure by combining social and financial network information. Phys. A Stat. Mech. Its Appl. 2019, 535, 122343. [Google Scholar] [CrossRef] [Green Version]
  17. Yeşildağ, E.; Atasever, M.; Kuduz, N.; Coşkun, A. Afyonkarahisar ve Kütahya illerindeki hisse senedi yatırımcılarının profili ve yatırım kararlarını etkileyen faktörlerin analizi [Afyonkarahisar and Kütahya illusions of stock investors’ analysis of the factors affecting the profile and investment decisions]. Akad. Sos. Araştırmalar Derg. 2017, 5, 257–277. [Google Scholar]
  18. Bernard, T. Cash Holdings and Corporate Investment: Evidence from COVID 19; Victoria University of Wellington: Wellington, New Zealand, 2020. [Google Scholar] [CrossRef]
  19. Khan, I.; Afeef, M.; Adil, M.; Ullah, W. Behavioral factors influencing investment decisions of institutional investors: Evidence from asset management industry in Pakistan. Ilkogr. Online 2021, 20, 603–614. [Google Scholar]
  20. Jones, T. Business Economics and Managerial Decision Making; John Wiley & Sons, Inc.: Hoboken, NJ, USA, 2022. [Google Scholar]
  21. Wang, X.; Lou, T. The effect of performance feedback on firms’ unplanned marketing investments. J. Bus. Res. 2020, 118, 441–451. [Google Scholar] [CrossRef]
  22. Mohseni, S.; Brent, A.C.; Kelly, S.; Browne, W.N. Demand response-integrated investment and operational planning of renewable and sustainable energy systems considering forecast uncertainties: A systematic review. Renew. Sustain. Energy Rev. 2022, 158, 112095. [Google Scholar] [CrossRef]
  23. Edwards, R.; Holland, J. What Is Qualitative Interviewing? Bloomsbury: London, UK, 2013. [Google Scholar]
  24. Stuckey, H.L. Three types of interviews: Qualitative research methods in social health. J. Soc. Health Diabetes 2013, 1, 56–59. [Google Scholar] [CrossRef] [Green Version]
  25. Gill, P.; Stewart, K.; Treasure, E.; Chadwick, B. Methods of data collection in qualitative research: Interviews and focus groups. Br. Dent. J. 2008, 204, 291–295. [Google Scholar] [CrossRef] [PubMed]
  26. Jamshed, S. Qualitative research method-interviewing and observation. J. Basic Clin. Pharm. 2014, 5, 87–88. [Google Scholar] [CrossRef] [PubMed] [Green Version]
  27. DiCicco-Bloom, B.; Crabtree, B.F. The qualitative research interview. Med. Educ. 2006, 40, 314–321. [Google Scholar] [CrossRef] [PubMed]
  28. Erjavec, J.; Popovič, A.; Trkman, P. The effect of personality traits and knowledge on the quality of decisions in supply chains. Econ. Res.-Ekon. Istraživanja 2019, 32, 2269–2292. [Google Scholar] [CrossRef] [Green Version]
  29. Miller, C.C.; Ireland, R.D. Intuition in strategic decision making: Friend of foe in the fast-paced 21st century. Acad. Manag. Exec. 2005, 19, 19–30. [Google Scholar]
  30. Pretz, J. Intuition versus analysis: Strategy and experience in complex everyday problem solving. Mem. Cogn. 2008, 36, 554–566. [Google Scholar] [CrossRef] [Green Version]
  31. Woiceshyn, J. Lessons from “Good Minds”: How CEOs Use Intuition, Analysis and Guiding Principles to Make Strategic Decisions. Long Range Plan. 2009, 42, 298–319. [Google Scholar] [CrossRef]
Figure 1. Investment Cycle.
Systems 11 00146 g001
Figure 2. The selected factors which affect the appropriate investment decisions-making.
Systems 11 00146 g002
Figure 3. A normal distribution curve of the data of the axis of the factors influencing appropriate investment decision-making.
Systems 11 00146 g003
Figure 4. A normal distribution curve for the data of the axis of making the appropriate investment decision.
Systems 11 00146 g004
Figure 5. Diffusion form and regression line of affect factors in appropriate investment decision-making.
Systems 11 00146 g005aSystems 11 00146 g005b
Table 1. Description of the research community.
#DetailsCategoriesNumberPercentage
1Age25–less than 30 years old129.2
30–less than 35 years old4232.3
35–less than 40 years old4836.9
40–less than 45 years old1713.1
45 years and over118.5
Total 130100%
2Qualificationsecondary00
BA6650.8
Higher Diploma64.6
Master’s3023.1
PhD2821.5
Total 130100%
3specializationAccounting3728.5
Finance and Banking2519.2
Business Administration2620.0
Counting1410.8
other2821.5
Total 130100%
4PositionFinancial Manager1410.8
Financial Analyst86.2
Accountant3224.6
Investor4232.3
other3426.1
Total 130100%
5Experience1–less than 5 years old3829.2
5–Less than 10 years old2922.3
10–less than 15 years old3224.6
15–less than 20 years old129.3
20 years and over1914.6
Total 130100%
Table 2. Testing the normal distribution of factors affecting in appropriate investment decision-making.
VariableKolmogorov–Simonov Test
Morale Sig.Sample VolumeTest Statistics
Factors affecting making the right investment decision0.0731301.297
Table 3. Test the normal distribution of the axis of making the appropriate investment decision.
VariableKolmogorov–Simonov Test
Morale Sig.Sample VolumeTest Statistics
Make the right investment decision0.0681301.282
Table 4. Testing the existence of a poly-linear problem for the variable factors affecting in appropriate investment decision-making.
VariablePoly-Linear Statistics
ToleranceVIF
Information Nature0.5671.763
Disclosure0.8061.240
Perception0.5641.774
Internal factors0.4912.036
External factors0.8091.236
Information Technology0.9111.098
Table 5. The value of the stability coefficient for the research.
Questionnaire VariablesThe Value of the Alpha-Cronbach Coefficient
Factors affecting making the appropriate investment decision0.91
Taking the appropriate investment decision0.84
Total0.88
Table 6. The nature of the response according to the five-point Likert scale.
#Response Nature or InteractionScale Range
1High3.67–5
2Medium2.34–3.66
3low1–2.33
Table 7. Ranking the importance of the dimensions of the factors influencing appropriate investment decision-making based on the coefficient of difference.
#FactorsMeanS.D.Weight PercentDifferenceSort
1Information Nature4.030.41980.610.42
2Disclosure4.340.51886.811.945
3Perception4.130.38682.69.351
4Internal factors4.140.68582.816.546
5External factors4.270.48385.411.314
6Information Technology4.150.4558310.963
Total4.130.341
Table 8. Frequency distribution, arithmetic mean, standard deviation, percentage weight, and arrangement of the paragraphs of the appropriate investment decision-making variable for the investment companies under study.
#ParagraphAnswersMeanS.D.Weight PercentDifferenceSort
Very MuchMuchModeratelyWeakVery Weak
1Determining the main objective of the investment contributes to the success of the investment decision.67557104.450.6368914.291
2A successful investment decision depends on identifying the key factors in the investment decision.496514114.230.73284.617.34
3Gathering appropriate information before making an investment decision contributes to making a rational investment decision.556113104.300.7118616.533
4Evaluating the expected returns of the available investment alternatives is a key factor in finding the best alternative.476913104.250.6608515.532
5I consider the financial reports issued by the companies in which I wish to invest, especially the dividend policy, sufficient to make the investment decision.486511514.180.80583.619.265
6The investment strategy is based on achieving a balance between the elements of return and risk416321414.070.81881.420.16
Total 4.250.6048514.21
Table 9. The Spearman correlation values and the significance values of the t test between the dimensions of the factors affecting suitable investment decision-making and the appropriate investment decision-making variable.
YX
Dimensions of the Factors Influencing the Appropriate Investment Decision
Spearman Correlation Coefficient (r)Calculated (T) ValueSignificance
Take the appropriate investment decisionInformation nature** 0.6389.373
Disclosure** 0.6409.423
Perception** 0.69811.027
Internal factors** 0.5256.978
External factors** 0.5828.097
Information Technology** 0.3263.901
Total factors influencing the appropriate investment decision** 0.72411.874
The calculated value of (T) at the chosen significance level (5.0) and number of degrees of freedom (128) = 1.979. When using a significance level of 0.01 and a total of 128 degrees of freedom, the tabulated value of (T) is 2.615. (*) Significant effect at a significance level of 0.05. (**) Significant effect at a significance level of 0.01.
Table 10. Suitable investment decision-making coefficient values, which are used to calculate the relative importance of several elements involved in making sound financial investments.
VariantsFixed Limit ATransactionsSignificance
YX
Dimensions of the Factors Influencing the Appropriate Investment Decision
Regression Parameter BetaCalculated (T) ValueCalculated (F) ValueDetermination Coefficient (R2)
Take the appropriate investment
Decision
Information Nature2.250.628.79479.0970.40
Disclosure2.080.649.46285.5290.41
Perception2.110.6910.874118.2530.48
Internal factors3.180.408.96254.6260.33
External factors2.690.618.61774.2540.37
Information Technology3.090.435.25328.6430.18
Total factors influencing the appropriate investment decision1.93 0.73 12.117 146.821 0.53
The tabular value of (F) at two freedom degree (1.128) and a significant level (0.05) = 3.915. The tabular value of (F) at two freedom degree (1.128) and a significant level (0.01) = 6.837. The tabular value of (T) at the level of significance (0.05) and freedom degree (128) = 1.979. The tabular value of (T) at the level of significance (0.01) and freedom degree (128) = 2.615.
Table 11. Sequential regression of the effect of the dimensions of the factors affecting appropriate decision-making.
StepsVariables Included in the FormFixed Limit ValueRegression Coefficient ValueR2Calculated (F) ValueSIG
(p Value)
Decision
1Information nature2.520.720.52139.090.000There is an effect
2Information nature1.520.590.73167.840.000There is an effect
Disclosure0.47
3Information nature0.890.500.87284.970.000There is an effect
Disclosure0.42
External factors0.39
4Information nature0.520.470.92346.290.000There is an effect
Disclosure0.41
External factors0.37
Information Technology0.22
5Information nature0.150.340.98973.570.000There is an effect
Disclosure0.32
External factors0.35
Information Technology0.25
Perception0.30
Disclaimer/Publisher’s Note: The statements, opinions and data contained in all publications are solely those of the individual author(s) and contributor(s) and not of MDPI and/or the editor(s). MDPI and/or the editor(s) disclaim responsibility for any injury to people or property resulting from any ideas, methods, instructions or products referred to in the content.

