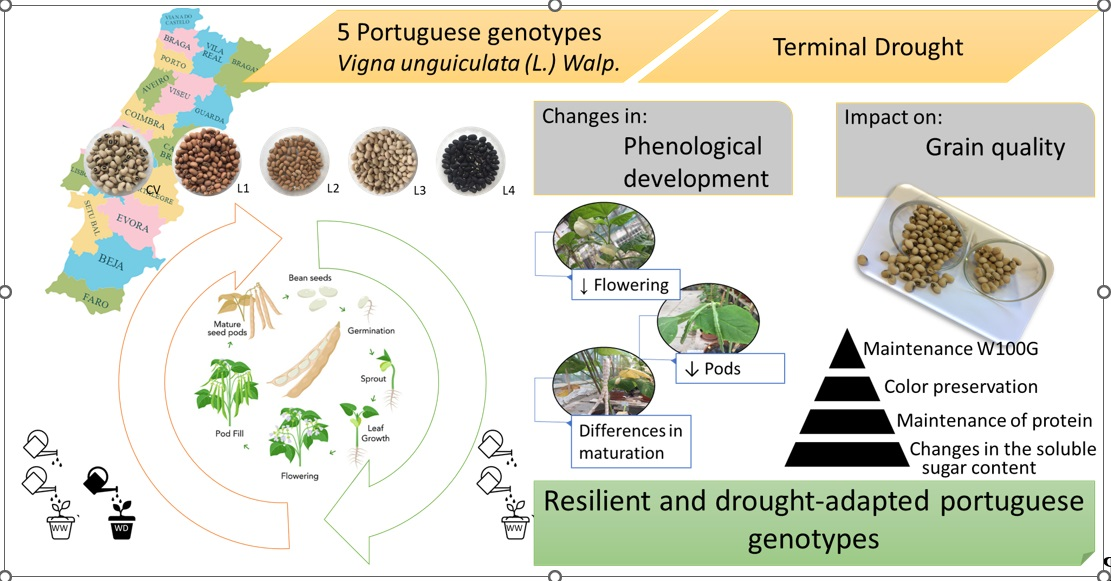
Are Portuguese Cowpea Genotypes Adapted to Drought? Phenological Development and Grain Quality Evaluation

 , , , , and
Abstract
:Simple Summary
Abstract
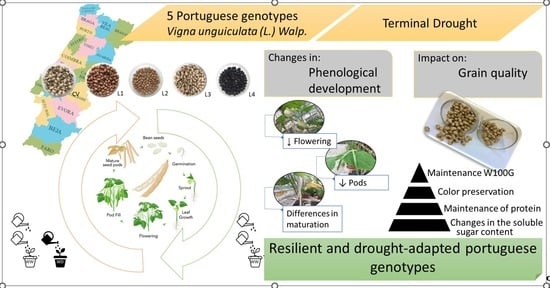
1. Introduction
2. Materials and Methods
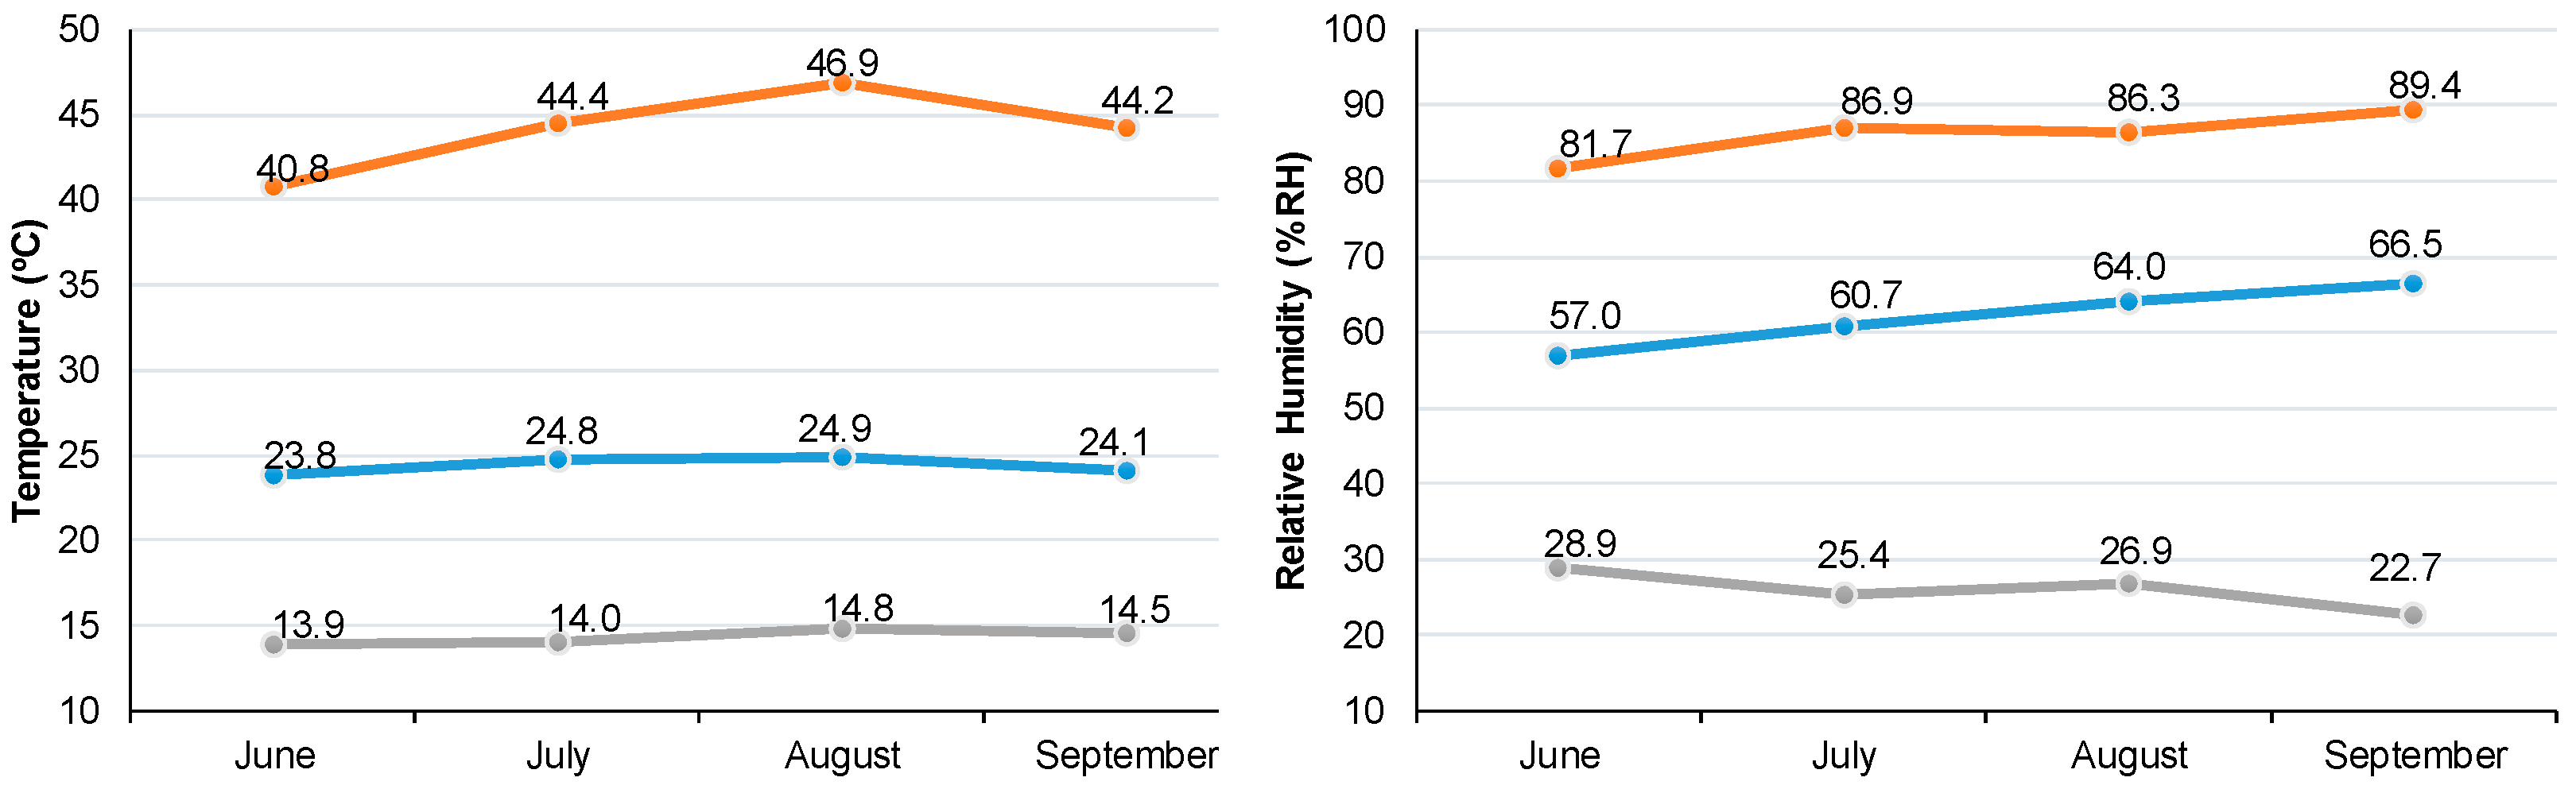
2.1. Plant Material and Growing Conditions
2.2. Phenological Development
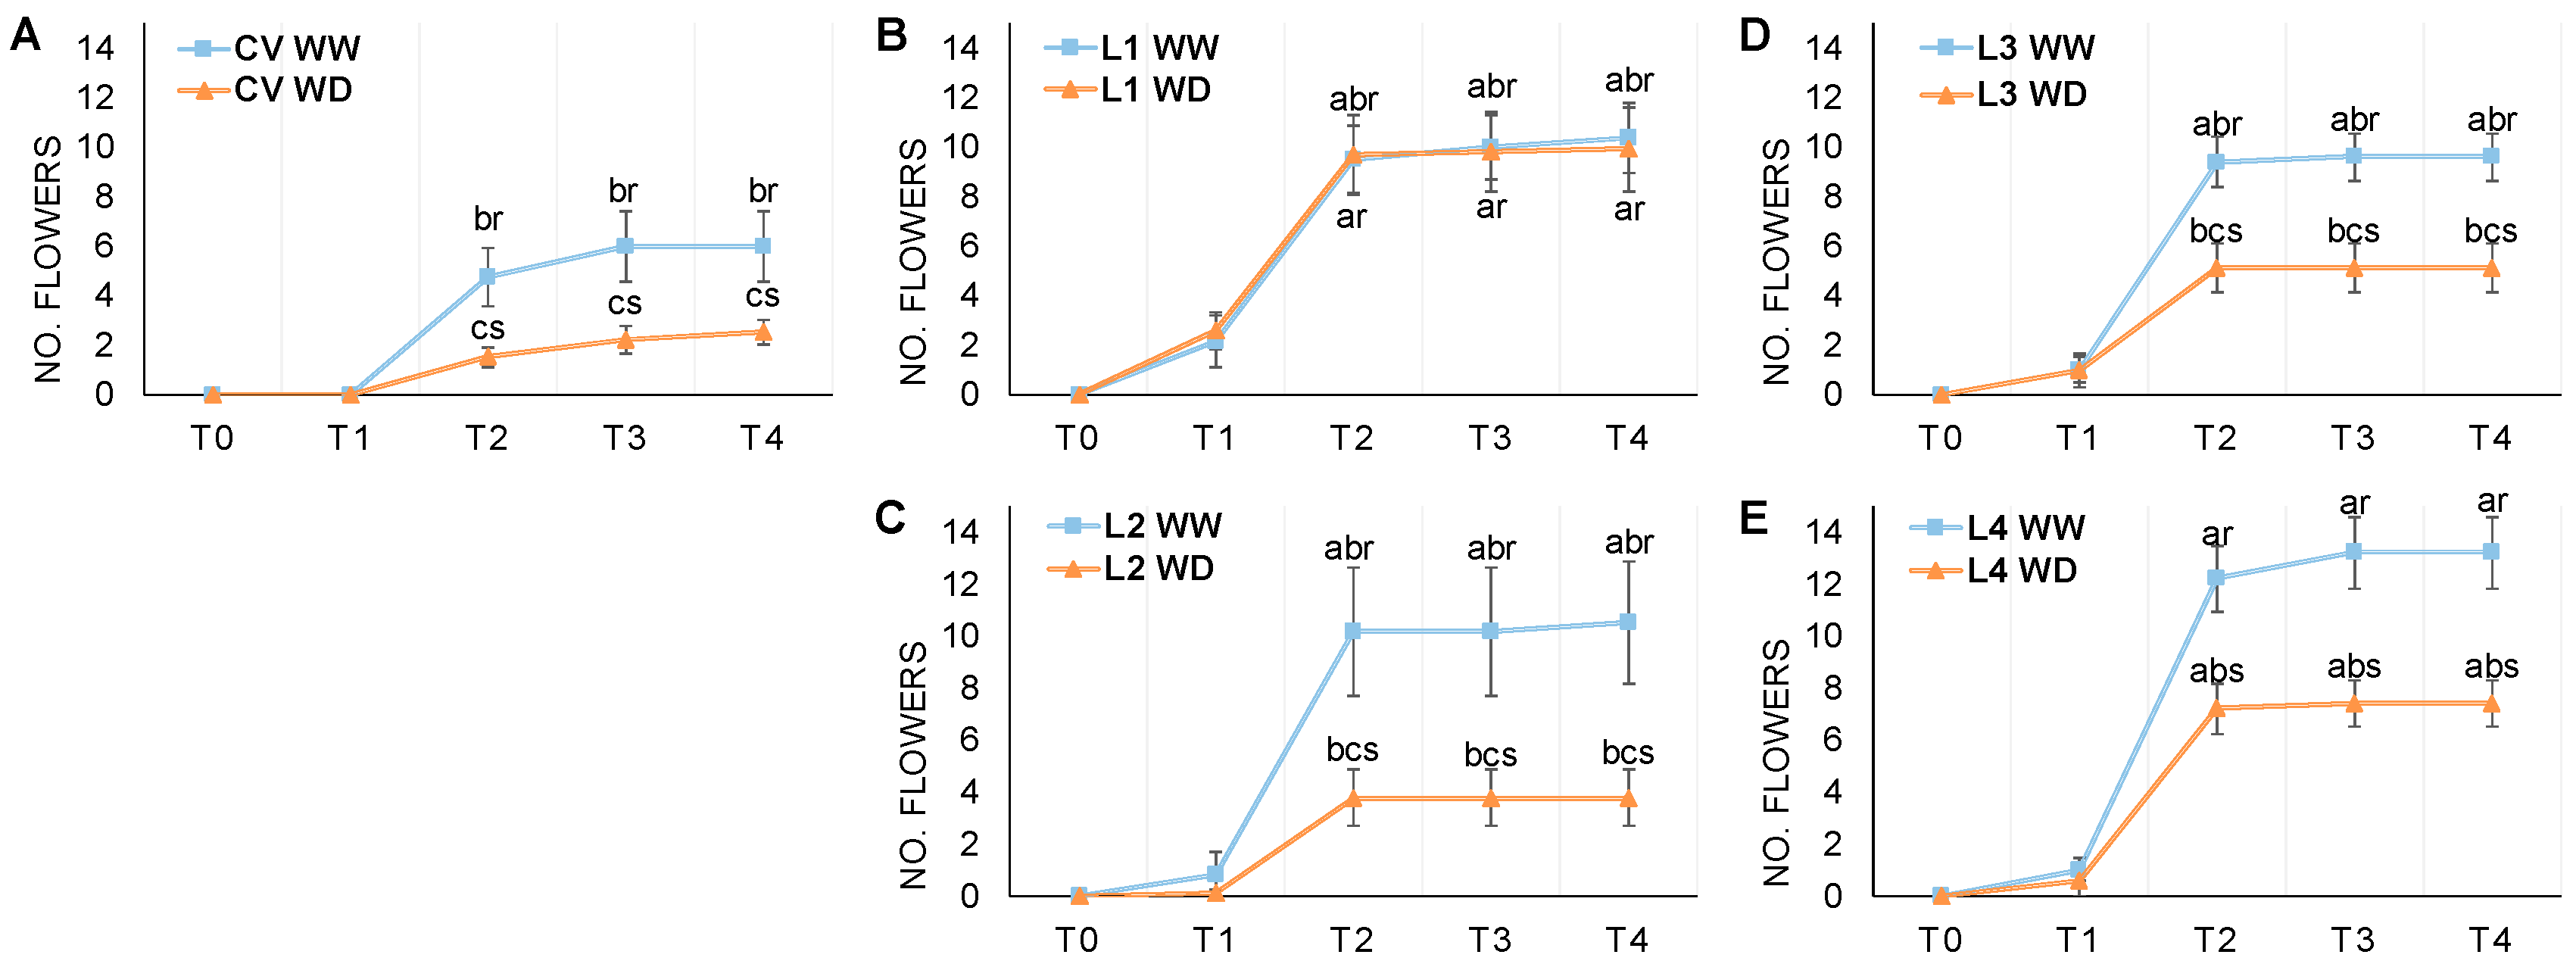
2.3. Flowering and Pod Development
2.4. Weight of 100 Grains
2.5. Colorimetric Analysis of the Grain
2.6. Soluble Sugars in Grain Determination
2.7. Crude Protein in Grain
2.8. Statistical Analysis
3. Results
3.1. Phenological Development
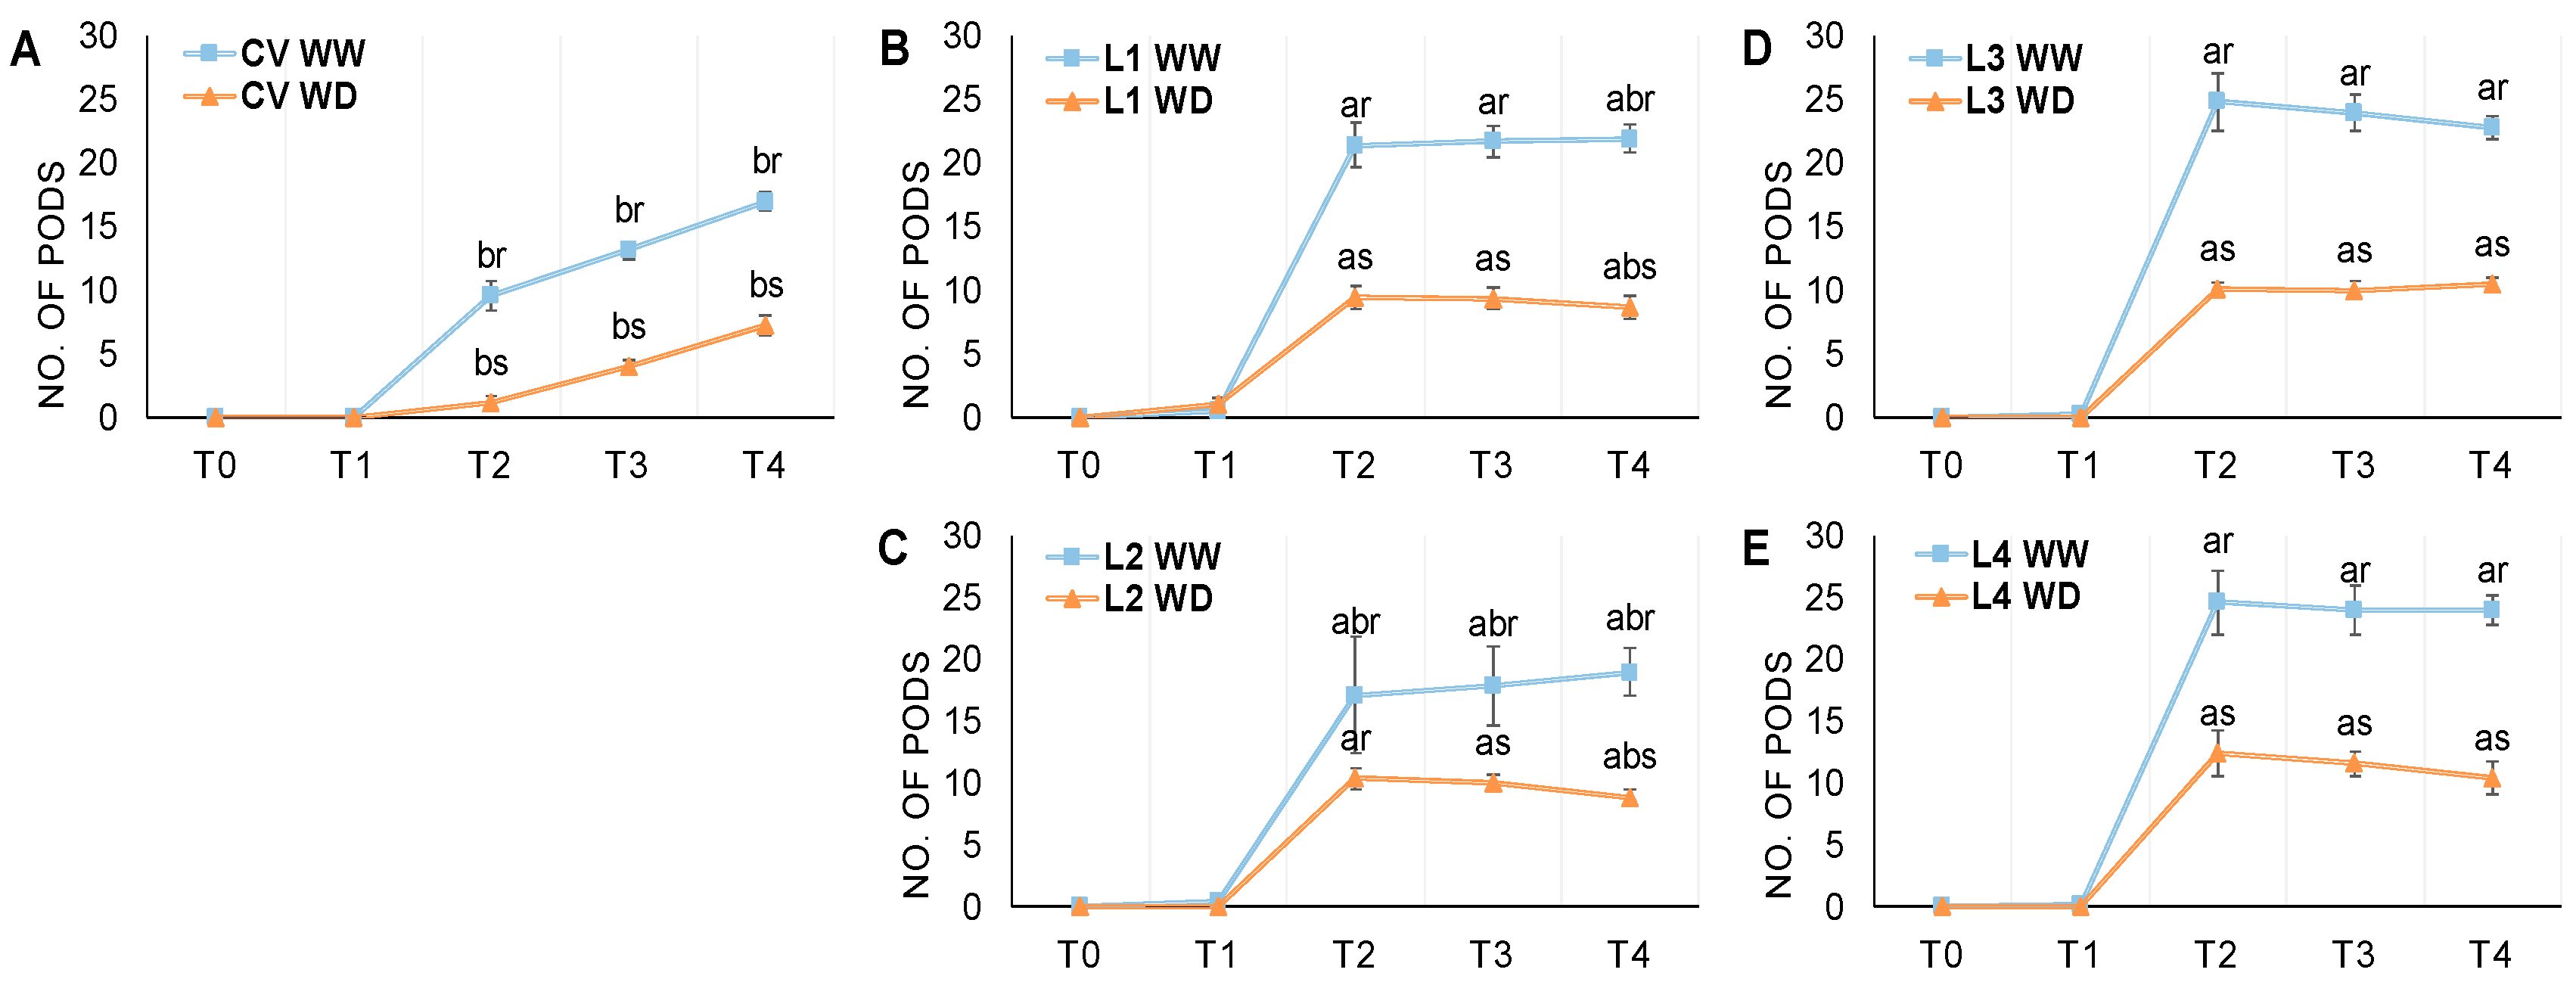
3.2. Flowering and Pod Development
3.3. Weight of 100 Grains
3.4. Colorimetric Analysis of the Grain
3.5. Soluble Sugars in Grain
3.6. Crude Protein Content in the Grain
3.7. Relationships between the Studied Agronomic, Physical, and Quality Parameters
4. Discussion
5. Conclusions
Author Contributions
Funding
Institutional Review Board Statement
Informed Consent Statement
Data Availability Statement
Acknowledgments
Conflicts of Interest
References
- Morel, M.A.; Brana, V.; Castro-Sowinski, S. Legume Crops, Importance and Use of Bacterial Inoculation to Increase Production. In Crop Plant; Goyal, A., Ed.; IntechOpen: London, UK, 2012; Chapter 10; pp. 217–240. [Google Scholar]
- Akibode, S.; Maredia, M. Global and Regional Trends in Production, Trade and Consumption of Food Legume Crops; No. 1099-2016-89/32; Department of Agricultural, Food and Resource Economics, Michigan State University: East Lansing, MI, USA, 2011. [Google Scholar] [CrossRef]
- Nunes, C.; Moreira, R.; Pais, I.; Semedo, J.; Simões, F.; Veloso, M.M.; Scotti-Campos, P. Cowpea Physiological Responses to Terminal Drought—Comparison between Four Landraces and a Commercial Variety. Plants 2022, 11, 593. [Google Scholar] [CrossRef]
- FAOSTAT. Production—Crops—Cow Peas, Dry—2016–2020. FAO Statistics Online Database, Food and Agriculture Organization of the United Nations, Statistics Division, Rome. 2022. Available online: https://fao.org/faostat/en (accessed on 24 April 2022).
- Júnior, A.S.A.; Santos, A.A.; Sobrinho, C.A.; Bastos, E.A.; Melo, F.B.; Viana, F.M.P.; Freire Filho, F.R.; Carneiro, J.S.; Rocha, M.M.; Cardoso, M.J.; et al. Cultivation of Cowpea (Vigna unguiculata (L.) Walp); Production Systems—EMBRAPA Meio-Norte: Teresina, Brazil, 2002; Volume 2. [Google Scholar]
- Tankari, M.; Wang, C.; Ma, H.; Li, X.; Li, L.; Soothar, R.K.; Cui, N.; Zaman-Allah, M.; Hao, W.; Liu, F.; et al. Drought priming improved water status, photosynthesis and water productivity of cowpea during post-anthesis drought stress. Agric. Water Manag. 2021, 245, 106565. [Google Scholar] [CrossRef]
- Ravelombola, W.; Mou, B.; Shi, A.; Qin, J.; Weng, Y.; Bhattarai, G.; Zia, B.; Zhou, W. Investigation on various aboveground traits to identify drought tolerance in cowpea seedlings. HortScience 2018, 53, 1757–1765. [Google Scholar] [CrossRef] [Green Version]
- Santos, C.; Barros, G.; Santos, I.; Ferraz, M. Agronomic and cooking quality of cowpea evaluated in the São Francisco valley, Brazil. Hortic. Bras. 2008, 26, 404–408. [Google Scholar] [CrossRef]
- Bejarano, A.; Ramírez-Bahena, M.H.; Velázquez, E.; Peix, A. Vigna unguiculata is nodulated in Spain by endosymbionts of Genisteae legumes and by a new symbiovar (vignae) of the genus Bradyrhizobium. Syst. Appl. Microbiol. 2014, 37, 533–540. [Google Scholar] [CrossRef] [PubMed] [Green Version]
- Osakabe, Y.; Osakabe, K.; Shinozaki, K.; Tran, L.S.P. Response of plants to water stress. Front. Plant Sci. 2014, 5, 86. [Google Scholar] [CrossRef] [Green Version]
- Gomes, A.M.F.; Nhantumbo, N.; Ferreira-Pinto, M.; Massinga, R.; Ramalho, J.C.; Ribeiro Barros, A. Breeding elite cowpea [Vigna unguiculata (L.) Walp] varieties for improved food security and income in Africa: Opportunities and challenges. In Legume Crops—Characterization and Breeding for Improved Food Security; El-Esawi, M.A., Ed.; IntechOpen: London, UK, 2019; Chapter 8; p. 14. [Google Scholar]
- Gomes, A.M.F.; Rodrigues, A.P.; António, C.; Rodrigues, A.M.; Leitão, A.E.; Batista-Santos, P.; Nhantumbo, N.; Massinga, R.; Ribeiro-Barros, A.I.; Ramalho, J.C. Drought response of cowpea (Vigna unguiculata (L.) Walp.) landraces at leaf physiological and metabolite profile levels. Environ. Exp. Bot. 2020, 175, 104060. [Google Scholar] [CrossRef]
- Ngalamu, T.; Odra, J.; Tongun, N. Cowpea Production Handbook; Genetic Improvement of Cowpea for Earliness and Drought Tolerance College of Natural Resources and Environmental, Studies University of Juba. IFS/AGRA; Afristar Publishing House: Juba, South Sudan, 2014; Available online: https://www.researchgate.net/publication/284900187 (accessed on 24 April 2022).
- Carvalho, M.; Castro, I.; Moutinho-Pereira, J.; Correia, C.; Egea-Cortines, M.; Matos, M.; Rosa, E.; Carnide, V.; Lino-Neto, T. Evaluating stress responses in cowpea under drought stress. J. Plant Physiol. 2019, 241, 153001. [Google Scholar] [CrossRef]
- ElMasry, G.; Mandour, N.; Ejeez, Y.; Demilly, D.; Al-Rejaie, S.; Verdier, J.; Belin, E.; Rousseau, D. Multichannel imaging for monitoring chemical composition and germination capacity of cowpea (Vigna unguiculata) seeds during development and maturation. Crop J. 2021, 10, 1399–1411. [Google Scholar] [CrossRef]
- Silva, V.M.; Nardeli, A.J.; de Carvalho Mendes, N.A.; de Moura Rocha, M.; Wilson, L.; Young, S.D.; Broadley, M.R.; White, P.J.; dos Reis, A.R. Agronomic biofortification of cowpea with zinc: Variation in primary metabolism responses and grain nutritional quality among 29 diverse genotypes. Plant Physiol. Biochem. 2021, 162, 378–387. [Google Scholar] [CrossRef]
- Iqbal, A.; Khalil, I.A.; Ateeq, N.; Sayyar Khan, M. Nutritional quality of important food legumes. Food Chem. 2006, 97, 331–335. [Google Scholar] [CrossRef]
- Agência Europeia do Ambiente (AEA). Climate Change, Impacts and Vulnerability in Europe 2016—An Indicator Based Report; European Environment Agency (Agência Europeia do Ambiente, Füssel, EEA/Hans-Martin): Copenhagen, Denmark, 2017; p. 419. [Google Scholar] [CrossRef]
- Intergovernmental Panel on Climate Change (IPCC). Climate Change 2022: Impacts, Adaptation and Vulnerability; Contribution of Working Group II to the Sixth Assessment Report of the Intergovernmental Panel on Climate, Change; Pörtner, H.-O., Roberts, D.C., Tignor, M., Poloczanska, E.S., Mintenbeck, K., Alegría, A., Craig, M., Langsdorf, S., Löschke, S., Möller, V., Eds.; Cambridge University Press: Cambridge, UK; New York, NY, USA, 2022; 3056p. [Google Scholar] [CrossRef]
- Santos, F.D.; Miranda, P. Climate Change in Portugal. Scenarios, Impacts and Adaptation Measures; SIAM II Project; Gradiva: Lisboa, Portugal, 2001. [Google Scholar]
- Sarkar, S.; Khatun, M.; Era, F.M.; Islam, A.K.M.M.; Anwar, M.P.; Danish, S.; Datta, R.; Islam, A.K.M.A. Abiotic Stresses: Alteration of Composition and Grain Quality in Food Legumes. Agronomy 2021, 11, 2238. [Google Scholar] [CrossRef]
- Food and Agriculture Organization of the United Nations (FAO). Pulses: Nutritious Seeds for a Sustainable Future; Food and Agriculture Organization of the United Nations (FAO): Roma, Italy, 2016; Available online: https://www.fao.org/3/i5528e/i5528e.pdf (accessed on 24 April 2022).
- Food and Agriculture Organization of the United Nations (FAO). Pulses and Climate Change; Food and Agriculture Organization of the United Nations (FAO): Roma, Italy, 2016; Available online: https://www.fao.org/fileadmin/user_upload/pulses-2016/docs/factsheets/Climate_EN_PRINT.pdf (accessed on 24 April 2022).
- Food and Agriculture Organization of the United Nations (FAO). Nutritional Benefits of Pulses; Food and Agriculture Organization of the United Nations (FAO): Roma, Italy, 2016; Available online: https://iyp2016.org/resources/documents/factsheets/178-nutritional-benefits-of-pulses-fao/file (accessed on 24 April 2022).
- Vogt, J.V.; Naumann, G.; Masante, D.; Spinoni, J.; Cammalleri, C.; Erian, W.; Pischke, F.; Pulwarty, R.; Barbosa, P. Drought Risk Assessment. A conceptual Framework; EUR 29464 EN; Publications Office of the European Union: Luxembourg, 2018; ISBN 978-92-79-97469-4. [Google Scholar] [CrossRef]
- Intergovernmental Panel on Climate Change (IPCC). Climate Change and Land; An IPCC Special Report on Climate Change, Desertification, Land Degradation, Sustainable Land Management, Food Security, and Greenhouse gas Fluxes in Terrestrial Ecosystems; Summary for Policymakers; Intergovernmental Panel on Climate Change: Geneva, Switzerland; World Meteorological Organization (WMO): Geneva, Switzerland; United Nations Environment Programme: Nairobi, Kenya, 2019. [Google Scholar]
- European Environment Agency (EEA). Water Resources across Europe—Confronting Water Stress: An Updated Assessment; EEA Report No12/2021; European Environment Agency: Copenhagen, Denmark, 2021; Available online: https://www.eea.europa.eu/publications/water-resources-across-europe-confronting (accessed on 24 April 2022).
- Sánchez-Rodríguez, E.; Rubio-Wilhelmi, M.M.; Cervilla, L.M.; Blasco, B.; Rios, J.J.; Rosales, M.A.; Romero, L.; Ruiz, J.M. Genotypic differences in some physiological parameters symptomatic for oxidative stress under moderate drought in tomato plants. Plant Sci. 2010, 178, 30–40. [Google Scholar] [CrossRef]
- Chaves, M.M.; Maroco, J.P.; Pereira, J.S. Understanding plant responses to drought—From genes to the whole plant. Funct. Plant Biol. 2003, 30, 239–264. [Google Scholar] [CrossRef]
- Ansari, W.A.; Atri, N.; Singh, B.; Pandey, S. Changes in antioxidant enzyme activities and gene expression in two muskmelon genotypes under progressive water stress. Biol. Plant. 2017, 61, 333–341. [Google Scholar] [CrossRef]
- Sail, M.A.; Dahot, M.U.; Mangrio, S.M.; Memon, S. Genotype x environment interaction for grain yield of wheat genotypes tested under water stress conditions. Sci. Int. 2007, 19, 133–137. [Google Scholar]
- Iwuagwu, M.; Ogbonnaya, C.I. Physiological response of cowpea (Vigna unguiculata (L.) Walp) to drought: The osmotic adjustment resistance strategy. Am. J. Sci. 2017, 7, 329–344. Available online: https://www.researchgate.net/publication/326231786 (accessed on 24 April 2022).
- Behboudian, H.M.; Qifu, M.; Turner, N.C.; Palta, J.A. Reactions of chickpea to water stress: Yield and seed composition. J. Sci. Food Agric. 2001, 81, 1288–1291. [Google Scholar] [CrossRef]
- Farooq, M.; Hussain, M.; Usman, M.; Farooq, S.; Alghamdi, S.S.; Siddique, K.H.M. Impact of abiotic stresses on grain composition and quality in food legumes. J. Agric. Food Chem. 2018, 66, 8887–8897. [Google Scholar] [CrossRef] [PubMed]
- Valentine, A.J.; Benedito, V.A.; Kang, Y. Legume nitrogen fixation and soil abiotic stress: From physiology to genomics and beyond. In Annual Plant Reviews. Volume 42: Nitrogen Metabolism in Plants in the Post-Genomic Era; Wiley: Hoboken, NJ, USA, 2018; pp. 207–248. [Google Scholar] [CrossRef]
- Mansourifar, C.; Shaban, M.; Ghobadi, M.; Ajirlu, A.R. Effect of drought stress and N fertilizer on yield, yield components and grain storage proteins in chickpea (Cicer arietinum L.) cultivars. Afr. J. Plant Sci. 2011, 5, 634–642. [Google Scholar]
- Mohammadzadeh, A.; Majnoonhoseini, N.; Moghaddam, H.; Akbari, M. The effect of various water stress and nitrogen levels on the yield and yield components in red beans genotype. J. Agron. Sci. Iran. 2011, 43, 29–38. [Google Scholar]
- Bayat, A.; Ahmadvand, G.; Dorri, H. The effect of water stress on the yield and yield components of spotted beans genotypes. J. Agron. Sci. Iran. 2010, 45, 42–45. [Google Scholar]
- Wagg, C.; O’ Brien, M.J.; Vogel, A.; Scherer-Lorenzen, M.; Eisenhauer, N.; Schmid, B.; Weigelt, A. Plant diversity maintains long-term ecosystem productivity under frequent drought by increasing short-term variation. Ecology 2017, 98, 2952–2961. [Google Scholar] [CrossRef]
- Dumroese, R.K.; Montville, M.E.; Pinto, J.R. Using container weights to determine irrigation needs: A simple method. Nativ. Plants J. 2015, 16, 67–71. [Google Scholar] [CrossRef]
- Meier, U.; Bleiholder, H.; Buhr, L.; Feller, C.; Hack, H.; Heß, M.; Lancashire, P.; Schnock, U.; Stauß, R.; van den Boom, T.; et al. The BBCH system to coding the phenological growth stages of plants-history and publications. J. Kult. 2009, 61, 41–52. [Google Scholar]
- Shimelis, E.A.; Rakshit, S.K. Proximate composition and physico-chemical properties of improved dry bean (Phaseolus vulgaris L.) varieties grown in Ethiopia. LWT—Food Sci. Technol. 2005, 38, 331–338. [Google Scholar] [CrossRef]
- Konica Minolta. Precise Color Communication; Color Control from Perception to Instrumentation. 2007. Available online: https://docslib.org/doc/2079696/precise-color-communication-color-control-from-perception-to-instrumentation-knowing-color (accessed on 24 April 2022).
- McGuire, R.G. Reporting of Objective Color Measurements. HortScience 1992, 27, 1254–1255. [Google Scholar] [CrossRef] [Green Version]
- Yousif, A.M. Soybean grain storage adversely affects grain testa color, texture and cooking quality. J. Food Qual. 2014, 37, 18–28. [Google Scholar] [CrossRef]
- Medlicott, A.P.; Thompson, A.K. Analysis of sugars and organic acids in ripening mango fruits (Mangifera indica L. var Keitt) by high performance liquid chromatography. J. Sci. Food Agric. 1985, 36, 561–566. [Google Scholar] [CrossRef]
- Joint FAO/WHO Codex Alimentarius Commission. Codex Alimentarius: Cereals, Pulses, Legumes and Vegetable Proteins, 1st ed.; World Health Organization: Geneva, Switzerland; Food and Agriculture Organization of the United Nations: Rome, Italy, 2007; ISBN 978-92-5-105842-8. [Google Scholar]
- Singh, B.B.; Mai-Kodomi, Y.; Terao, T. A simple screening method for drought tolerance in cowpea. Indian J. Genet. Plant Breed. 1999, 59, 211–220. [Google Scholar]
- Verbree, D.A.; Singh, B.B.; Payne, W.A. Genetics and heritability of shoot drought tolerance in cowpea seedlings. Crop Sci. 2015, 55, 146–153. [Google Scholar] [CrossRef]
- Farooq, M.; Wahid, A.; Kobayashi, N.; Fujita, D.; Basra, S.M.A. Plant drought stress: Effects, mechanisms, and management. Agron. Sustain. Dev. 2009, 29, 185–212. [Google Scholar] [CrossRef] [Green Version]
- Ansari, W.; Atri, N.; Pandey, M.; Kumar Singh, A.; Singh, B.; Pandey, S. Influence of drought stress on morphological, physiological and biochemical attributes of plants: A review. Biosci. Biotechnol. Res. Asia 2019, 16, 697–709. [Google Scholar] [CrossRef]
- Boukar, O.; Belko, N.; Chamarthi, S.; Togola, A.; Batieno, J.; Owusu, E.; Haruna, M.; Diallo, S.; Umar, M.L.; Olufajo, O.; et al. Cowpea (Vigna unguiculata): Genetics, genomics and breeding. Plant Breed. 2019, 138, 415–424. [Google Scholar] [CrossRef] [Green Version]
- Mwale, S.E.; Ochwo-Ssemakula, M.; Sadik, K.; Achola, E.; Okul, V.; Gibson, P.; Edema, R.; Singini, W.; Rubaihayo, P. Response of cowpea genotypes to drought stress in Uganda. Am. J. Plant Sci. 2017, 8, 720. [Google Scholar] [CrossRef] [Green Version]
- Rollins, J.A.; Habte, E.; Templer, S.E.; Colby, T.; Schmidt, J.; von Korff, M. Leaf proteome alterations in the context of physiological and morphological responses to drought and heat stress in barley (Hordeum vulgare L.). J. Exp. Bot. 2013, 64, 3201–3212. [Google Scholar] [CrossRef] [PubMed] [Green Version]
- Sekhon, H.S.; Singh, G.; Sharma, P.; Bains, T.S. Water Use Efficiency under Stress Environments. In Climate Change and Management of Cool Season Grain Legume Crops; Yadav, S., Redden, R., Eds.; Springer: Dordrecht, The Netherlands, 2010. [Google Scholar] [CrossRef]
- Saxena, N.P.; Krishnamurthy, L.; Johansen, C. Registration of a drought-resistant Chickpea germplasm. Crop Sci. 1993, 33, 1424. [Google Scholar] [CrossRef] [Green Version]
- Silim, S.N.; Saxena, M.C. Adaptation of spring-sown chickpea to the Mediterranean basin. I. Response to moisture supply. Field Crop. Res. 1993, 34, 121–136. [Google Scholar] [CrossRef] [Green Version]
- Fukai, S. Phenology in rainfed lowland rice. Field Crop. Res. 1999, 64, 51–60. [Google Scholar] [CrossRef]
- Ulemale, C.S.; Mate, S.N.; Deshmukh, D. Physiological indices for drought tolerance in Chickpea (Cicer arietinum L.). World J. Agric. Sci. 2013, 9, 123–131. [Google Scholar] [CrossRef]
- Mohammed, M.S.; Russom, Z.; Abdul, S.D. Inheritance of hairiness and pod shattering, heritability and correlation studies in crosses between cultivated cowpea (Vigna unguiculata (L.) Walp.) and its wild (var. pubescens) relative. Euphytica 2010, 171, 397–407. [Google Scholar] [CrossRef]
- Stoilova, T.; Pereira, G. Assessment of the genetic diversity in a germplasm collection of cowpea (Vigna unguiculata (L.) Walp.) using morphological traits. Afr. J. Agric. Res. 2013, 8, 208–215. [Google Scholar] [CrossRef]
- Carvalho, M.; Bebeli, P.J.; Pereira, G.; Castro, I.; Egea-Gilabert, C.; Matos, M.; Lazaridi, E.; Duarte, I.; Lino-Neto, T.; Ntatsi, G.; et al. European cowpea landraces for a more sustainable agriculture system and novel foods. J. Sci. Food Agric. 2017, 97, 4399–4407. [Google Scholar] [CrossRef] [PubMed]
- Gerrano, A.S.; Thungo, Z.G.; Mavengahama, S. Phenotypic description of elite cowpea (Vigna ungiculata L. Walp) genotypes grown in drought-prone environments using agronomic traits. Heliyon 2022, 8, E08855. [Google Scholar] [CrossRef] [PubMed]
- Delmer, D.P. Agriculture in the developing world: Connecting innovations in plant research to downstream applications. Proc. Natl. Acad. Sci. USA 2005, 102, 15739–15746. [Google Scholar] [CrossRef] [Green Version]
- Pushpavalli, R.; Zaman-Allah, M.; Turner, N.C.; Baddam, R.; Rao, M.V.; Vadez, V. Higher flower and seed number leads to higher yield under water stress conditions imposed during reproduction in chickpea. Funct. Plant Biol. 2015, 42, 162–174. [Google Scholar] [CrossRef]
- Deikman, J.; Petracek, M.; Heard, J.E. Drought tolerance through biotechnology: Improving translation from the laboratory to farmers’ fields. Curr. Opin. Biotechnol. 2012, 23, 243–250. [Google Scholar] [CrossRef]
- Organisation for Economic Co-Operation and Development (OECD). Consensus Document of the Biology of COWPEA (Vigna unguiculata (L.) Walp.); Series on Harmonisation of Regulatory Oversight in Biotechnology Report No. 60, Environment Directorate; Organisation for Economic Co-Operation and Development (OECD): Paris, France, 2015; Available online: http://www.oecd.org/officialdocuments/publicdisplaydocumentpdf/?cote=env/jm/mono(2015)48&doclanguage=en (accessed on 24 April 2022).
- Oluwatosin, O.B. Genetic and environmental variability in starch, fatty acids and mineral nutrients composition in cowpea (Vigna unguiculata (L) Walp). J. Sci. Food Agric. 1998, 78, 1–11. [Google Scholar] [CrossRef]
- Silveira, J.A.G.; Melo, A.R.B.; Viégas, R.A.; Oliveira, J.T.A. Salinity-induced effects on nitrogen assimilation related to growth in cowpea plants. Environ. Exp. Bot. 2001, 46, 171–179. [Google Scholar] [CrossRef]
- Murdock, L.L.; Seck, D.; Ntoukam, G.; Kitch, L.; Shade, R.E. Preservation of cowpea grain in sub-Saharan Africa—Bean/Cowpea CRSP contributions. Field Crop. Res. 2003, 82, 169–178. [Google Scholar] [CrossRef]
- Gonçalves, A.; Goufo, P.; Barros, A.; Domínguez-Perles, R.; Trindade, H.; Rosa, E.A.S.; Ferreira, L.; Rodrigues, M. Cowpea (Vigna unguiculata L. Walp), a renewed multipurpose crop for a more sustainable agri-food system: Nutritional advantages and constraints. J. Sci. Food Agric. 2016, 96, 2941–2951. [Google Scholar] [CrossRef]
- Culver, C.A.; Wrolstad, R.E. Color Quality of Fresh and Processed Foods; ACS Symposium Series; American Chemical Society, Foundations for Microwave Engineering: Washington, DC, USA, 2008; Volume 983. [Google Scholar] [CrossRef]
- Hou, A.; Chen, P.; Shi, A.; Zhang, B.; Wang, Y.-J. Sugar variation in soybean seed assessed with a rapid extraction and quantification method. Int. J. Agron. 2009, 2009, 1–8. [Google Scholar] [CrossRef] [Green Version]
- Tchiagam, N.; Baptiste, J.; Youmbi, E.; Njintang, N.Y. Generation means analysis of seed sucrose content in Cowpea (Vigna unguiculata L.). Asian J. Agric. Food. Sci. 2011, 3, 475–480. Available online: https://www.researchgate.net/publication/287823196 (accessed on 24 April 2022).
- Teixeira, A.I.; Ribeiro, L.F.; Rezende, S.T.; Barros, E.G.; Moreira, M.A. Development of a method to quantify sucrose in soybean grains. Food Chem. 2012, 130, 1134–1136. [Google Scholar] [CrossRef] [Green Version]
- Weng, Y.; Ravelombola, W.S.; Yang, W.; Qin, J.; Zhou, W.; Wang, Y.-J.; Mou, B.; Shi, A. Screening of Seed Soluble Sugar Content in Cowpea (Vigna unguiculata (L.) Walp). Am. J. Plant Sci. 2018, 9, 1455–1466. [Google Scholar] [CrossRef] [Green Version]
- Rosa, M.; Prado, C.; Podazza, G.; Interdonato, R.; González, J.A.; Hilal, M.; Prado, F.E. Soluble sugars-metabolism, sensing, and abiotic stress a complex network in the life of plants. Plant Signal. Behav. 2009, 4, 388–393. [Google Scholar] [CrossRef] [PubMed] [Green Version]
- Küchenmeister, K.; Küchenmeister, F.; Kayser, M.; Wrage-Mönnig, N.; Isselstein, J. Influence of drought stress on nutritive value of perennial forage legumes. Int. J. Plant Prod. 2013, 7, 693–710. [Google Scholar]
- Kitch, L.W.; Boukar, O.; Endondo, C.; Murdock, L.L. Farmer acceptability criteria in breeding cowpea. Exp. Agric. 1998, 34, 475–486. [Google Scholar] [CrossRef]
- Aguilera, Y.; Díaz, M.F.; Jiménez, T.; Benítez, V.; Herrera, T.; Cuadrado, C.; Martín-Pedrosa, M.; Martín-Cabrejas, M.A. Changes in non-nutritional factors and antioxidant activity during germination of nonconventional legumes. J. Agric. Food Chem. 2013, 61, 8120–8125. [Google Scholar] [CrossRef]
- Singh, B.B. Cowpea: The Food Legume of the 21st Century; Singh, B., Ed.; Crop Science Society of America, Wiley: Hoboken, NJ, USA, 2014; Volume 164. [Google Scholar]
- Food and Agriculture Organization of the United Nations (FAO). Health Benefits of Pulses; Food and Agriculture Organization of the United Nations (FAO): Roma, Italy, 2016; Available online: https://www.fao.org/fileadmin/user_upload/pulses-2016/docs/factsheets/Health_EN_PRINT.pdf (accessed on 24 April 2022).
- Chibarabada, T.P.; Modi Albert, T.; Mabhaudhi, T. Expounding the value of grain legumes in the semi- and arid tropics. Sustainability 2017, 9, 60. [Google Scholar] [CrossRef] [Green Version]
- Chakraborty, K.; Mahatma, M.K.; Thawait, L.K.; Bishi, S.K.; Kalariya, K.A.; Singh, A.L. Water deficit stress affects photosynthesis and the sugar profile in source and sink tissues of groundnut (Arachis hypogaea L.) and impacts kernel quality. J. Appl. Bot. Food Qual. 2016, 89, 98–104. [Google Scholar] [CrossRef]
- Hou, A.; Chen, P.; Alloatti, J.; Li, D.; Mozzoni, L.; Zhang, B.; Shi, A. Genetic variability of seed sugar content in worldwide soybean germplasm collections. Crop Sci. 2009, 49, 903–912. [Google Scholar] [CrossRef]
- Sugimoto, M.; Goto, H.; Otomo, K.; Ito, M.; Onuma, H.; Suzuki, A.; Sugawara, M.; Abe, S.; Tomita, M.; Soga, T. Metabolomic profiles and sensory attributes of edamame under various storage duration and temperature conditions. J. Agric. Food Chem. 2010, 58, 8418–8425. [Google Scholar] [CrossRef] [PubMed]
- Faye, M.D.; Jooste, A.; Lowenberg-De Boer, J.; Fulton, J. Impact of sucrose contents and cooking time on cowpea prices in Senegal. SAJEMS 2006, 9, 207–212. [Google Scholar] [CrossRef] [Green Version]
- Sehgal, A.; Sita, K.; Kumar, J.; Kumar, S.; Singh, S.; Siddique, K.H.M.; Nayyar, H. Effects of drought, heat and their interaction on the growth, yield and photosynthetic function of lentil (Lens culinaris Medikus) genotypes varying in heat and drought sensitivity. Front. Plant Sci. 2017, 8, 1776. [Google Scholar] [CrossRef] [PubMed] [Green Version]
- Boukar, O.; Massawe, F.; Muranaka, S.; Franco, J.; Maziya-Dixon, B.; Singh, B.; Fatokun, C. Evaluation of cowpea germplasm lines for protein and mineral concentrations in grains. Plant Genet. 2011, 9, 515–522. [Google Scholar] [CrossRef]
- Ntatsi, G.; Gutiérrez-Cortines, M.E.; Karapanos, I.; Barros, A.; Weiss, J.; Balliu, A.; dos Santos Rosa, E.A.; Savvas, D. The quality of leguminous vegetables as influenced by preharvest factors. Sci. Hortic. 2018, 232, 191–205. [Google Scholar] [CrossRef]
- Vasconcelos, I.M.; Maia, F.M.M.; Farias, D.F.; Campello, C.C.; Carvalho, A.F.U.; de Azevedo Moreira, R.; de Oliveira, J.T.A. Protein fractions, amino acid composition and antinutritional constituents of high-yielding cowpea cultivars. J. Food Compos. Anal. 2010, 23, 54–60. [Google Scholar] [CrossRef]
- Henshaw, F.O. Varietal differences in physical characteristics and proximate composition of cowpea (Vigna unguiculata). World J. Agric. Sci. 2008, 4, 302–306. [Google Scholar]
- Mamiro, P.; Mbwaga, A.; Mamiro, D.; Mwanri, A.; Mwanri, A.; Kinabo, J. Nutritional quality and utilization of local and improved cowpea varieties in some regions in Tanzania. AJFAND 2011, 11, 4490–4506. [Google Scholar] [CrossRef] [Green Version]
- Antova, G.A.; Stoilova, T.D.; Ivanova, M.M. Proximate and lipid composition of cowpea (Vigna unguiculata L.) cultivated in Bulgaria. J. Food Compos. Anal. 2014, 33, 146–152. [Google Scholar] [CrossRef]
- Jayathilake, C.; Visvanathan, R.; Deen, A.; Bangamuwage, R.; Jayawardana, B.C.; Nammi, S.; Liyanage, R. Cowpea: An overview on its nutritional facts and health benefits. J. Sci. Food Agric. 2018, 98, 4793–4806. [Google Scholar] [CrossRef] [PubMed]
- Muranaka, S.; Shono, M.; Myoda, T.; Takeuchi, J.; Franco, J.; Nakazawa, Y.; Boukar, O.; Takagi, H. Genetic diversity of physical, nutritional and functional properties of cowpea grain and relationships among the traits. Plant Genet. 2016, 14, 67–76. [Google Scholar] [CrossRef] [Green Version]
- Chibarabada, T.P.; Modi, A.T.; Mabhaudhi, T. Nutrient content and nutritional water productivity of selected grain legumes in response to production environment. Int. J. Environ. 2017, 14, 1300. [Google Scholar] [CrossRef] [Green Version]
- Farooq, M.; Gogoi, N.; Barthakur, S.; Baroowa, B.; Bharadwaj, N.; Alghamdi, S.S.; Siddique, K.H.M. Drought stress in grain legumes during reproduction and grain filling. J. Agron. Crop Sci. 2017, 203, 81–102. [Google Scholar] [CrossRef]


| Designation | Photo | Variety | Origin | Region | Main Features |
|---|---|---|---|---|---|
| CV |  | Commercial variety “Fradel” | INIAV—breeding program | Elvas— Alto Alentejo | Cream grain color, black eye around hilum, white flower |
| L1 |  | Landrace | BPGV * 13,100 | Guarda— Beira Alta | Brown grain, small black eye around hilum, violet flower |
| L2 |  | Landrace | Directly from the farmer | Satão— Beira Alta | Light brown grain color, small greenish-brown eye around hilum, violet flower |
| L3 |  | Landrace | Directly from the farmer | Lardosa— Castelo Branco, Beira Baixa | Grain is rounder than the other accessions, cream color and light green eye around hilum, white flower |
| L4 |  | Landrace | Directly from the farmer | Vila Maior— Douro Litoral | Black grain, black eye around hilum, violet flower |
| Growth Stage | BBCH Code | Description of the Growth Stage |
|---|---|---|
| Vegetative | 05 | Hypocotyl emergence |
| 20 | Formation of secondary branches | |
| 50 | Inflorescence emergence | |
| Reproductive | 60 | First flowers open |
| 80 | Beginning of fruit and seed ripening | |
| 88 | 80% of mature pods |
| Variety | Treatment | DAS (28 May 2021) | ||||||
|---|---|---|---|---|---|---|---|---|
| Vegetative Phase | Reproductive Phase | |||||||
| BBCH 05 | BBCH 20 | BBCH 50 | BBCH 60 | BBCH 80 | BBCH 88 | |||
| CV | WW | 4 ± 0 a | 32 ± 0 a | 39 ± 1 a | Water deficit imposition | 60 ± 4 ar | 77 ± 0 as | 84 ± 0 ar |
| WD | 61 ± 2 ar | 81 ± 1 ar | 89 ± 3 ar | |||||
| L1 | WW | 4 ± 0 a | 32 ± 0 a | 39 ± 0 a | 50 ± 1 br | 71 ± 4 ar | 81 ± 1 ar | |
| WD | 49 ± 1 br | 64 ± 0 br | 77 ± 1 bs | |||||
| L2 | WW | 4 ± 0 a | 32 ± 0 a | 40 ± 1 a | 52 ± 1 br | 77 ± 0 ar | 91 ± 6 ar | |
| WD | 53 ± 1 br | 62 ± 3 bs | 78 ± 1 bs | |||||
| L3 | WW | 4 ± 0 a | 32 ± 0 a | 40 ± 1 a | 51 ± 1 br | 73 ± 2 ar | 81 ± 2 ar | |
| WD | 51 ± 1 br | 69 ± 2 abr | 78 ± 1 br | |||||
| L4 | WW | 4 ± 0 a | 32 ± 0 a | 40 ± 1 a | 51 ± 1 br | 77 ± 0 ar | 81 ± 2 ar | |
| WD | 51 ± 1 br | 74 ± 3 abr | 80 ± 2 br | |||||
| Variety | Treatment | Attribute | ||||
|---|---|---|---|---|---|---|
| L* | a* | b* | C* | h° | ||
| CV | WW | 60.1 ± 0.5 ar | −0.9 ± 0.1 cr | 19.4 ± 0.5 abr | 19.5 ± 0.5 ar | 92.8 ± 0.4 abr |
| WD | 61.8 ± 0.7 ar | −0.4 ± 0.2 bcs | 19.7 ± 0.3 ar | 19.7 ± 0.3 abr | 91.1 ± 0.5 bs | |
| L1 | WW | 48.5 ± 0.7 cr | 5.7 ± 0.5 ar | 16.9 ± 0.6 br | 17.9 ± 0.7 ar | 71.6 ± 1.5 dr |
| WD | 48.7 ± 0.6 cr | 6.3 ± 0.4 ar | 17.3 ± 0.4 br | 18.4 ± 0.5 br | 70.2 ± 0.8 cr | |
| L2 | WW | 53.7 ± 1.6 br | 3.1 ± 0.4 bs | 19.3 ± 1.4 abr | 19.6 ± 1.4 ar | 80.3 ± 1.8 cdr |
| WD | 53.1 ± 1.2 br | 5.2 ± 0.5 ar | 19.9 ± 0.8 ar | 20.7 ± 0.7 ar | 74.9 ± 1.9 cr | |
| L3 | WW | 62.6 ± 0.3 ar | 0.3 ± 0.2 cr | 20.6 ± 0.2 ar | 20.6 ± 0.2 ar | 89.1 ± 0.5 bcr |
| WD | 63.9 ± 0.5 ar | 0.6 ± 0.2 br | 20.6 ± 0.2 ar | 20.6 ± 0.2 ar | 88.4 ± 0.5 br | |
| L4 | WW | 40.3 ± 4.7 dr | −0.7 ± 0.7 cr | 7.8 ± 2.7 cr | 8.0 ± 2.5 br | 103.9 ± 13.6 as |
| WD | 31.0 ± 0.1 ds | −1.9 ± 0.2 cr | 2.3 ± 0.1 cs | 3.0 ± 0.1 cs | 129.3 ± 3.0 ar | |
| Variety | Treatment | Soluble Sugars in Grain (mg g−1) | |||||||||||
|---|---|---|---|---|---|---|---|---|---|---|---|---|---|
| Stachyose | Raffinose | Sucrose | Glucose | Fructose | Sum of Soluble Sugars | ||||||||
| CV | WW | 48.6 ± 3.5 | ar | 9.0 ± 0.9 | abr | 27.9 ± 0.7 | ar | 2.9 ± 0.2 | ar | 2.8 ± 0.8 | ar | 91.3 ± 4.6 | abr |
| WD | 54.7 ± 1.2 | ar | 10.5 ± 0.5 | ar | 32.5 ± 2.0 | ar | 3.9 ± 0.7 | ar | 3.0 ± 0.7 | ar | 104.6 ± 2.7 | ar | |
| L1 | WW | 32.3 ± 0.8 | bs | 7.1 ± 0.2 | br | 33.9 ± 1.8 | ar | 1.5 ± 0.2 | as | 0.4 ± 0.1 | abs | 75.1 ± 2.4 | bs |
| WD | 52.3 ± 2.8 | ar | 6.2 ± 0.6 | br | 28.1 ± 1.2 | as | 2.7 ± 0.2 | abr | 1.9 ± 0.6 | abr | 91.1 ± 4.9 | abr | |
| L2 | WW | 53.3 ± 2.1 | ar | 8.4 ± 0.6 | br | 33.1 ± 2.1 | ar | 3.0 ± 1.1 | ar | 1.5 ± 0.9 | abr | 99.4 ± 5.4 | ar |
| WD | 34.1 ± 1.6 | bs | 4.2 ± 0.4 | bs | 29.3 ± 1.6 | ar | 1.5 ± 0.2 | br | 0.2 ± 0.2 | bcr | 69.3 ± 2.4 | cs | |
| L3 | WW | 49.8 ± 2.6 | ar | 4.0 ± 0.4 | cs | 35.1 ± 4.5 | ar | 1.5 ± 0.5 | ar | 0.0 ± 0.0 | br | 90.4 ± 6.5 | abr |
| WD | 31.5 ± 0.8 | bs | 12.7 ± 0.6 | ar | 31.0 ± 2.1 | ar | 2.5 ± 0.3 | abr | 0.0 ± 0.0 | cr | 77.7 ± 2.9 | bcr | |
| L4 | WW | 48.8 ± 1.5 | ar | 10.9 ± 0.4 | ar | 32.0 ± 2.8 | ar | 0.3 ± 0.1 | as | 0.0 ± 0.0 | br | 92.1 ± 4.3 | abr |
| WD | 50.2 ± 0.7 | ar | 12.9 ± 1.1 | ar | 32.8 ± 1.8 | ar | 1.5 ± 0.1 | br | 0.0 ± 0.0 | cr | 97.4 ± 2.9 | ar | |
| Pearson Correlation | L* | a* | b* | C* | h° | Stachyose | Raffinose | Sucrose | Glucose | Fructose | Sum of Soluble Sugars | % Protein | W100G | NPP |
|---|---|---|---|---|---|---|---|---|---|---|---|---|---|---|
| L* | 1 | −0.099 ns | 0.885 ** | 0.845 ** | −0.404 ** | −0.264 ns | −0.050 ns | 0.080 ns | 0.575 * | 0.403 ns | −0.129 ns | −0.410 ns | 0.177 ns | −0.253 ns |
| a* | −0.496 ** | 1 | 0.329 * | 0.411 ** | −0.846 ** | −0.209 ns | −0.856 ** | −0.518 * | −0.092 ns | 0.028 ns | −0.492 * | 0.395 ns | −0.328 * | −0.305 * |
| b* | 0.819 ** | −0.034 ns | 1 | 0.996 ** | −0.729 ** | −0.303 ns | −0.323 ns | −0.217 ns | 0.506 * | 0.409 ns | −0.262 ns | −0.179 ns | 0.010 ns | −0.139 ns |
| C* | 0.762 ** | 0.071 ns | 0.993 ** | 1 | −0.780 ** | −0.302 ns | −0.373 ns | −0.245 ns | 0.490 * | 0.405 ns | −0.282 ns | −0.137 ns | −0.010 ns | −0.112 ns |
| h° | 0.167 ns | −0.880 ** | −0.227 ns | −0.308 ns | 1 | 0.290 ns | 0.728 ** | 0.456 ns | −0.225 ns | −0.249 ns | 0.452 ns | −0.160 ns | 0.140 ns | −0.120 ns |
| Stachyose | 0.441 ns | −0.652 ** | 0.196 ns | 0.114 ns | 0.449 ns | 1 | 0.097 ns | 0.153 ns | 0.410 ns | 0.647 ** | 0.882 ** | 0.403 ns | 0.579 * | −0.490 * |
| Raffinose | −0.456 * | −0.194 ns | −0.480 * | −0.496 * | 0.289 ns | 0.208 ns | 1 | 0.504 * | 0.160 ns | −0.095 ns | 0.462 * | −0.408 ns | 0.283 ns | −0.301 ns |
| Sucrose | 0.015 ns | 0.274 ns | 0.213 ns | 0.225 ns | −0.258 ns | 0.065 ns | −0.187 ns | 1 | 0.257 ns | 0.115 ns | 0.528 * | −0.195 ns | 0.354 ns | −0.195 ns |
| Glucose | 0.473 * | −0.122 ns | 0.563 * | 0.548 * | −0.027 ns | 0.286 ns | 0.102 ns | 0.046 ns | 1 | 0.830 ** | 0.571 ** | −0.008 ns | 0.514 * | −0.485 * |
| Fructose | 0.342 ns | −0.208 ns | 0.332 ns | 0.313 ns | 0.070 ns | 0.164 ns | 0.372 ns | −0.126 ns | 0.669 ** | 1 | 0.640 ** | 0.331 ns | 0.632 ** | −0.561 * |
| Sum of soluble sugars | 0.341 ns | −0.441 ns | 0.252 ns | 0.190 ns | 0.282 ns | 0.862 ** | 0.332 ns | 0.445 ns | 0.459 * | 0.348 ns | 1 | 0.157 ns | 0.633 ** | −0.567 * |
| % Protein | −0.365 ns | 0.566 * | −0.077 ns | −0.026 ns | −0.441 ns | −0.345 ns | 0.432 ns | −0.305 ns | 0.044 ns | 0.034 ns | −0.273 ns | 1 | 0.139 ns | 0.148 ns |
| W100G | 0.257 ns | −0.357 * | 0.078 ns | 0.059 ns | 0.209 ns | −0.077 ns | 0.227 ns | −0.337 ns | 0.216 ns | 0.536 * | −0.069 ns | 0.022 ns | 1 | −0.568 ** |
| NPP | −0.168 ns | 0.208 ns | −0.164 ns | −0.148 ns | −0.088 ns | −0.047 ns | −0.220 ns | 0.274 ns | −0.211 ns | −0.382 ns | −0.030 ns | 0.022 ns | −0.335 * | 1 |
| Significance level | ||||||||||||||
| Treatment | ns | ns | * | * | ns | * | * | ns | ns | ns | ns | * | * | *** |
| Genotype | *** | *** | *** | *** | *** | *** | *** | ns | * | ** | ** | ** | *** | *** |
| Genotype × Treatment | * | * | * | * | * | *** | *** | ns | * | ns | *** | ns | ns | ns |
Disclaimer/Publisher’s Note: The statements, opinions and data contained in all publications are solely those of the individual author(s) and contributor(s) and not of MDPI and/or the editor(s). MDPI and/or the editor(s) disclaim responsibility for any injury to people or property resulting from any ideas, methods, instructions or products referred to in the content. |
© 2023 by the authors. Licensee MDPI, Basel, Switzerland. This article is an open access article distributed under the terms and conditions of the Creative Commons Attribution (CC BY) license (https://creativecommons.org/licenses/by/4.0/).
Share and Cite
Moreira, R.; Nunes, C.; P. Pais, I.; Nobre Semedo, J.; Moreira, J.; Sofia Bagulho, A.; Pereira, G.; Manuela Veloso, M.; Scotti-Campos, P. Are Portuguese Cowpea Genotypes Adapted to Drought? Phenological Development and Grain Quality Evaluation. Biology 2023, 12, 507. https://doi.org/10.3390/biology12040507
Moreira R, Nunes C, P. Pais I, Nobre Semedo J, Moreira J, Sofia Bagulho A, Pereira G, Manuela Veloso M, Scotti-Campos P. Are Portuguese Cowpea Genotypes Adapted to Drought? Phenological Development and Grain Quality Evaluation. Biology. 2023; 12(4):507. https://doi.org/10.3390/biology12040507
Chicago/Turabian StyleMoreira, Rita, Cátia Nunes, Isabel P. Pais, José Nobre Semedo, José Moreira, Ana Sofia Bagulho, Graça Pereira, Maria Manuela Veloso, and Paula Scotti-Campos. 2023. "Are Portuguese Cowpea Genotypes Adapted to Drought? Phenological Development and Grain Quality Evaluation" Biology 12, no. 4: 507. https://doi.org/10.3390/biology12040507