
How Metabolic Rate Relates to Cell Size


Department of Biology, Juniata College, Huntingdon, PA 16652, USA
Biology 2022, 11(8), 1106; https://doi.org/10.3390/biology11081106
Submission received: 24 June 2022
/
Revised: 20 July 2022
/
Accepted: 21 July 2022
/
Published: 25 July 2022
(This article belongs to the Section Cell Biology)
Abstract
:Simple Summary
The metabolic conversion of resources into living structures and processes is fundamental to all living systems. The rate of metabolism (‘fire of life’) is critical for supporting the rates of various biological processes (‘pace of life’), but why it varies considerably within and among species is little understood. Much of this variation is related to body size, but such ‘metabolic scaling’ relationships also vary extensively. Numerous explanations have been offered, but no consensus has yet been reached. Here, I critically review explanations concerning how cell size and number and their establishment by cell expansion and multiplication may affect metabolic rate and its scaling with body mass. Numerous lines of evidence suggest that cell size and growth can affect metabolic rate at any given body mass, as well as how it changes with increasing body mass during growth or evolution. Mechanisms causing negative associations between cell size and metabolic rate may involve reduced resource supply and/or demand in larger cells, but more research is needed. A cell-size perspective not only helps to explain some (but not all) variation in metabolic rate and its body-mass scaling, but may also foster the conceptual integration of studies of ontogenetic development and body-mass scaling.
Abstract
Metabolic rate and its covariation with body mass vary substantially within and among species in little understood ways. Here, I critically review explanations (and supporting data) concerning how cell size and number and their establishment by cell expansion and multiplication may affect metabolic rate and its scaling with body mass. Cell size and growth may affect size-specific metabolic rate, as well as the vertical elevation (metabolic level) and slope (exponent) of metabolic scaling relationships. Mechanistic causes of negative correlations between cell size and metabolic rate may involve reduced resource supply and/or demand in larger cells, related to decreased surface area per volume, larger intracellular resource-transport distances, lower metabolic costs of ionic regulation, slower cell multiplication and somatic growth, and larger intracellular deposits of metabolically inert materials in some tissues. A cell-size perspective helps to explain some (but not all) variation in metabolic rate and its body-mass scaling and thus should be included in any multi-mechanistic theory attempting to explain the full diversity of metabolic scaling. A cell-size approach may also help conceptually integrate studies of the biological regulation of cellular growth and metabolism with those concerning major transitions in ontogenetic development and associated shifts in metabolic scaling.
1. Introduction
Metabolism constitutes the collective biochemical processes by which organisms transform environmental resources into various biological structures and processes. Accordingly, the rate of metabolism relates to the pace of many kinds of biological processes, and thus its variation may have multiple effects on the temporal dynamics of the physiology, development, behavior, evolution, and ecological interactions of organisms [1,2,3,4]. Therefore, factors causing variation in metabolic rate have long interested many kinds of biologists. A major intrinsic factor related to metabolic rate (R) is body mass (M), which has often been described by a simple power function, as follows:
where a is the scaling coefficient (or antilog of the intercept in a log-log plot) and b is the scaling exponent (or loglinear slope). In many species and higher taxa, most of the variation in metabolic rate relates to body mass, but many other intrinsic and extrinsic factors can have significant effects as well (e.g., [2,5,6,7]), for reasons that have been debated for decades [6,7,8,9,10,11,12,13,14,15,16,17,18,19,20]. Many kinds of theories and hypotheses have been proposed, but no consensus has yet been reached, especially with respect to the causes of the body-mass scaling of metabolic rate (see e.g., [8,9,10,13,14,15,17,18,20]). Of these causes, growing interest has been shown regarding how various components of body size in multicellular organisms, such as cell size [9,14,18,20,21,22,23,24,25,26,27,28,29,30,31,32,33,34,35,36,37,38,39,40,41,42] and organ size [9,14,17,18,20,34,43,44,45,46,47,48,49], may influence variation in metabolic rate and its scaling with body mass. Since cells are where metabolism happens, it seems natural to explore how the properties of cells may affect metabolism at the tissue, organ, and whole-body levels. Cells are not only the ‘building blocks of life’, but also the ‘energy factories of life’. Hence, the purpose of my essay is to review critically the many ways (some novel) that variation in whole-body metabolic rate may relate to cell size. By doing so, I hope to stimulate further research that will explicate the mechanisms involved.
R = aMb,
2. Major Ways That Variation in Metabolic Rate May Relate to Cell Size
Variation in metabolic rate may relate to cell size in multiple ways, which are summarized in Table 1. Each of these ways is briefly described in the following sections, including pertinent theory and data, as available.
2.1. Mass-Specific or Mass-Corrected Metabolic Rate
2.1.1. Theory
Simple geometric surface area (SA) theory predicts that organisms with relatively large cells should have lower mass-specific metabolic rates (i.e., lower metabolic rates per unit mass, R/M, derived by simple ratio calculations or other types of mass correction that account for allometric relationships between R and M; for a recent review, see [7]) than organisms with relatively small cells [20,22,23,25,26,27,28]. This hypothesis assumes that metabolically important processes, such as resource uptake and metabolic waste removal, are more limited by the smaller amounts of available cell SA relative to cell or tissue volume (V) in organisms with large vs. small cells, assuming no significant differences in cell shape (i.e., cell isomorphy) [14,22,23,53]. In addition, the energetic costs of maintaining ionic gradients across cell membranes may be smaller per unit cell area in relatively large cells [20,23,25,27]. Other possible mechanisms related to cell size (i.e., intracellular resource transport, and cell composition and multiplication) are considered in Section 2.3.2, Section 2.3.3, Section 3.2, Section 3.3, and Section 3.4.
2.1.2. Interspecific Patterns
As expected from predictions of cell SA theory, multiple studies have reported negative associations between R/M and cell size (or its proxy, genome size) among related animal species, including carabid beetles [41], amphibians [22,28,54], eyelid geckos [32], birds [28,40,55], and mammals [26] (for recent reviews, see [20,56,57]). Most of these studies have focused on the sizes of erythrocytes (red blood cells), which are importantly involved in oxygen exchange in respiratory systems and thus may be linked to R/M for this reason. However, associations between R/M and other types of non-respiratory cells (e.g., in ommatidia and Malphigian tubules of carabid beetles [41]) have also been found, and thus cell size may have a general effect on organismal metabolic rate, which requires further research (see also Section 2.1.3, Section 2.2, Section 2.3, and Section 3).
2.1.3. Intraspecific Patterns
Like interspecific comparisons, intraspecific comparisons of R/M with cell size often show significant negative relationships [33,39,55,58,59,60,61,62,63], but contrary to cell SA theory, nonsignificant [39,61,64,65,66,67] and even positive [42,56,59,60,63,68] relationships have also been frequently reported. Why intraspecific relationships vary so much is little understood, but differences in temperature [28,54,59,61,63], fasting duration [68], developmental stage [39], tissue type [40,60], and duration of laboratory acclimation [61,63] or evolutionary adaptation [54,56,69] may be at least partially involved.
Since cell size for a given tissue type tends to vary less within than among species, predicted cell-size effects may be more difficult to detect within species because they are more easily obscured by the effects of other extraneous factors. However, intraspecific studies of temperature effects largely support cell SA theory, because increasing temperature tends to cause both an increase in metabolic rate and a decrease in cell size (thus increasing cellular SA/V ratios that can better accommodate an increasing metabolic demand) (reviewed in [56]; but see [70]), as predicted.
2.2. ‘Metabolic Level’ or Vertical Elevation of a Body-Mass Scaling Relationship for Metabolic Rate
Cell size may also relate to the overall metabolic rate of conspecific or heterospecific animals with different body masses (=metabolic level, L, as estimated by R/M at the geometric midpoint of a scaling relationship between log R and log M; see e.g., [29,50,51,52]). For example, species-specific L values of non-polyploid teleost fishes are significantly negatively related to red blood cell size [29], as expected by cell SA theory. Similarly, among major taxa of eukaryotic organisms, L appears to be negatively related to mean cell size (Figure 1). Low-L angiosperm plants have cells with average volumes ~80 to 350 times larger than those of high-L endothermic birds and mammals, whereas medium-L ectothermic vertebrates have cells with intermediate volumes. Further research is needed to test the strength and generality of these relationships.
2.3. Slope of a Body-Mass Scaling Relationship for Metabolic Rate
2.3.1. Effects of Cellular Mode of Growth (Cell Expansion versus Multiplication)
Cell size may relate to not only the vertical elevation of a metabolic scaling relationship (L, see Section 2.2), but also its slope (i.e., scaling exponent b in Equation (1)). Cell-size metabolic scaling theory [23,24,27] predicts that if organismal growth occurs entirely through cell expansion (hypertrophy), b should be 2/3 (because total cell surface area supporting metabolic activity should scale with body volume or mass to the 2/3 power). By contrast, if growth occurs entirely through cell multiplication with no change in cell size (hyperplasia and isotrophy), b should be 1, because total cell surface area should scale isometrically with body volume or mass. Therefore, growth by both cell expansion and multiplication should result in b values between 2/3 and 1 (Figure 2). Another possible option not recognized previously by cell-size metabolic scaling theory is cell multiplication coupled with cell-size reduction (hyperplasia and hypotrophy, resulting from cell division with little gain in total biomass), which should cause b > 1 (Figure 2). For all possible options, one can calculate the predicted metabolic scaling slope b by using the equation
where c equals the slope for log cell size (area, volume, or mass) in relation to log total tissue, organ, or body size (area, volume, or mass) [72].
b = 1 − c/3,
Tests of cell-size metabolic scaling theory have involved comparisons of both intra- and interspecific metabolic scaling relationships. Davison pioneered this kind of approach by showing that the b values of the R-M scaling relationship match those expected from the M scaling of muscle cell size in the frog Rana pipiens [23] and of ommatidial and muscle cells in the crayfish Procambarus alleni [24]. As a result, the scaling of metabolic rate paralleled the scaling of total cell surface area in muscle or eye tissues. Scaling exponents in various ant species also appear to vary as expected from the intraspecific scaling of cell size (using eye-facet size as a proxy for cell size) [31]. Other studies have provided mostly positive [9,14,29,32,33,35,36,42,73,74] but sometimes negative [34,75,76] support for effects of cell size on intraspecific ontogenetic metabolic scaling.
Cell-size metabolic scaling theory has even been used to predict b values for extinct pelagic (open-water) and benthic (bottom-dwelling) trilobites (again by using eye-facet size as a proxy for cell size [72], following [24,31]) that parallel those of living aquatic invertebrates and protists with pelagic (b ≈ 1) versus benthic lifestyles (b < 1) (Figure 3). It would be instructive to determine whether cell multiplication generally dominates the ontogenetic growth of pelagic species (whereas cell expansion is more important in benthic species), as appears to have occurred in trilobites [72]. In support, pelagic squid and jellyfish with b values often near 1 tend to grow throughout life largely by cell multiplication [9,77,78,79,80], whereas nematode worms with b values near 2/3 grow chiefly by cell expansion [9,81,82]. In addition, as predicted by cell SA metabolic theory, benthic ascidians (tunicates) with b values between 2/3 and 1 (mean = 0.78 [80]) exhibit both cell multiplication and enlargement during growth [83]. More studies are now needed to determine whether different patterns of the cellular mode of growth are generally related to differences in the metabolic scaling between pelagic and benthic species. However, the observation that even unicellular protists show pelagic versus benthic differences in metabolic scaling (Figure 3) suggests that cellular mode of growth is not the only mechanistic factor underlying these ecological effects. In addition, contrary to cell-size metabolic scaling theory, in aquatic crustaceans, eye-facet size (a proxy for cell size) scales strongly with total eye size (a proxy for body size) in both pelagic species with isometric or near-isometric ontogenetic metabolic scaling (b~1) (e.g., Daphnia [84,85,86]) and largely benthic species with allometric metabolic scaling (b < 1) (e.g., Gammarus [75]). Perhaps natural selection for visual acuity or light sensitivity may obscure relationships between eye-facet size (and thus ommatidial cell size) and metabolic scaling (see e.g., [72,87]). Further work should examine other kinds of cells. Note, however, that parallel scaling of cell size in ommatidia and other tissues has been found in the crayfish Procambarus alleni (muscle tissue [24]) and carabid beetles (Malphigian tubules [41]).
Inverse correlations between the interspecific M scaling of basal metabolic rate and genome size (a proxy for cell size) among various orders of birds and mammals also provide support for cell-size metabolic scaling theory [27]. Further evidence includes a close match between the predicted and observed b values for the interspecific metabolic scaling relationship of insects, based on using the eye-facet size method [72]. In addition, the hypometric scaling of metabolic rate (b < 1) among carabid beetles species appears to be related to larger species having larger cells in their ommatidia and Malphigian tubules than do smaller species [41]. Finally, although not previously recognized, the frequent observation of hypermetric scaling of metabolic rate (b > 1) in embryos and initial postembryonic stages of various kinds of animals and plants [9,14,90,91,92,93,94,95,96,97,98,99] is consistent with cell-size metabolic scaling theory, because embryonic and initial postembryonic development often involves prolific cell multiplication with relatively little or no gain in biomass [100,101], thus generating smaller cells with greater total SA per embryo V that can support a higher R/M (see Figure 2).
2.3.2. Effects of Cellular Mode of Growth (Ontogenetic Shifts in Growth Rate and Metabolic Scaling)
Many kinds of organisms show ontogenetic shifts in metabolic scaling (e.g., [9,72,91,93,95,97,98,99,102,103,104,105,106,107]). Most of these shifts involve relatively steep metabolic scaling during early postembryonic development and shallower scaling during later development (i.e., the Type III metabolic scaling described in [9]). These shifts are commonly attributed to changes in growth rate, a metabolically expensive process [3,9,14,98,102,103,105,108,109,110]. Rapid growth during early postembryonic development should result in steeper increases in metabolic rate than does slower growth during late development (Figure 4). In general, steeper ontogenetic metabolic scaling does tend to be associated with more rapid growth rates (see [75,81,98,102,103,105,108,109,110] and several other studies cited in [3,9,14,18]). Cell-size effects may also be involved, because organisms with small cells tend to grow faster than those with large cells [20], and more rapid growth tends to involve increases in cell multiplication relative to cell expansion ([111,112,113,114,115,116,117,118,119], but see [120]). Somatic growth is enhanced more by cell multiplication than cell expansion, because the former increases the amount of DNA needed for informing biosynthesis, whereas the latter does not, unless accompanied by intracellular DNA replication without cell division (i.e., endoreplication) [121].
Accordingly, early rapid growth should be associated with cell multiplication or a combination of both cell multiplication and expansion, whereas later slower growth should be associated mainly with cell expansion, as is seen in angiosperms, trilobites, tunicates, fishes, and mammals for many kinds of non-regenerating organs [9,72,113,122,123,124,125,126,127,128,129,130,131,132,133].
Consequently, enhanced nutrition in laboratory rats increases early growth by cell multiplication but later growth by cell expansion [125,134,135]. In addition, it has been proposed that selection for rapid early growth in mammals occurs primarily by increases in cell multiplication, whereas selection for increases in later growth occurs chiefly by cell expansion [136,137,138]. However, the generality of such intriguing patterns remains to be determined. Apparent exceptions include fruit flies (Drosophila), where rapid larval growth occurs mainly by cell expansion [81,120], and many cephalopods that grow rapidly throughout life, largely by cell multiplication [77,78] (see also Section 2.3.1).
The cellular mode of growth may not only explain shifts in metabolic scaling from near-isometric (b~1) to hypometric (b < 1) during postembryonic development, but also hypermetric metabolic scaling (b > 1) often observed during embryonic and/or very early postembryonic development (see Section 2.3.1). During the earliest stages of ontogeny, cell multiplication typically occurs with little or no gain in biomass, thus creating many small cells with high SA/V ratios that can sustain high R/M. Therefore, the cellular mode of growth may help to explain variation in metabolic scaling throughout ontogeny from egg to adult (Figure 5).
2.3.3. Effects of Cellular Mode of Growth (Ontogenetic Development of Larger Cells with Large Amounts of Metabolically Inert Materials)
Since the 1930s, a major explanation of the hypometry of intra- and interspecific metabolic scaling (b < 1) has been that increased body size involves a disproportionate increase in the size of organs and tissues with low metabolic rates relative to those with high metabolic rates [9,14,17,18,20,34,43,44,45,46,47,48,49,76,141,142,143,144]. For example, during fish development, the mass of low-energy tissues, such as those composing the musculoskeletal system, increases relative to that of high-energy organs, such as the brain, heart, and gastrointestinal tract [34,44,45,76,144].
Here, I hypothesize that some of the ontogenetic increase in the relative masses of tissues with relatively low metabolic rates may be linked to increases in cell size, as observed during late growth stages of fat, skeletal muscle, and/or structural tissues that have lower energetic costs of maintenance than many other kinds of tissues that are routinely more active metabolically. Consider that skeletal muscle tissue, which has low metabolic costs during resting, makes up a large proportion of total body mass in many kinds of animals (~33–68% in fishes [145], and ~21–61% in mammals [145,146]), and during ontogeny, muscle growth usually initially results mainly from cell multiplication but later chiefly from cell enlargement [81,113,147,148,149,150,151], though animals with indeterminate (post-maturational) growth, such as many fishes, may show substantial cell multiplication throughout life [113,152,153]. Therefore, cell expansion via protein accumulation may be importantly involved in ontogenetic increases in relative muscle mass, and this effect may be enhanced by increased locomotor activity (exercise) [154]. In some muscle types, increased cell size may also be associated with the accumulation of metabolically inert glycogen and lipid deposits [155,156,157], but the generality of this pattern requires further substantiation.
Adipose tissue may also make up a substantial proportion of total body mass in animals (~5–45% in mammals [145,148,158]), and like muscle, its ontogenetic development first largely entails cell multiplication, but later largely cell expansion, as observed in chickens [159] and laboratory rats [160] and mice [161]. The second phase of adipose tissue development involves increased lipid deposition in fat cells (Figure 6) [159,160,161].
Similarly, in woody plants, the ontogeny of structural wood tissue, which makes up a large amount of total biomass, especially in mature individuals (e.g., large trees), involves a two-phase process of cell multiplication followed by cell expansion [162]. Furthermore, cell enlargement in woody plants involves increased lignification and/or the formation of relatively large water-filled vacuoles that provide needed turgor pressure, both of which increase structural support.
Consequently, accumulation of tissues with relatively low metabolic rates during ontogeny may importantly involve cell expansion. This may happen in two ways. First, during late ontogeny, growth in the mass of low-energy fat, muscle, and structural tissues may occur chiefly via cell expansion. Second, cell expansion in animal adipose tissues and woody plant structural tissues further entails the accumulation of metabolically inert materials (e.g., fat, lignin, and water). As a result, cell expansion may contribute to the hypometry of ontogenetic metabolic scaling (b < 1) by being associated with decreased R/M in at least three ways: (1) reduced cellular SA/V ratios (see Section 2.1.1 and Section 2.3.1), (2) slower somatic growth (see Section 2.3.2), and (3) the accumulation of metabolically inert materials (see also Figure 4).
2.3.4. Effects of Total Cellular Surface Area in Body (at Constant Metabolic Level)
Another proposed mechanism by which cell size may affect ontogenetic metabolic scaling is via effects of total cellular surface area in the body (see also Section 2.3.1 and Section 2.3.2, and Figure 5). According to this mechanism, when L is constant, species with small cells, and thus relatively high total cellular SA relative to total body V or M, should exhibit higher metabolic scaling exponents (b) than species with large cells, and thus relatively low total cellular SA relative to body V or M [36]. This hypothesis assumes that SA effects on metabolic scaling will be stronger in species with large cells (with b approaching 2/3), whereas V effects will be stronger in species with small cells (with b approaching 1). This hypothesis is supported by a significant negative relationship between b and cell size observed among cyprinid fish species with similar L [36]. However, this hypothesis assumes that cell size does not affect R/M or L, which it often does (see also Section 2.1, Section 2.2, and Section 2.3.6). Therefore, I consider possible interactive effects of cell size and L on b in the next section.
2.3.5. Effects of Both Cellular and Whole-Body Surface Areas (Mediated by Variable Metabolic Level)
By combining negative effects of cell size on metabolic level (L; see Section 2.2) and of L on the scaling exponent (b) for resting metabolic rate (following the metabolic-level boundaries hypothesis, MLBH, which has received extensive support; see e.g., [9,18,29,50,51,163,164,165,166,167,168]), Glazier [29,72] postulated that b should be positively correlated with cell size among species with different L values, which was verified in an analysis of 22 species of non-polyploid teleost fishes (r = 0.520; p = 0.013 [29]). This hypothesis assumes that lower L is associated with larger cells having reduced SA/V ratios that limit metabolic rate (see Section 2.2). Furthermore, as L decreases, whole-body V effects on metabolic rate should increase relative to SA effects, and thus b should increase from a minimal value of 2/3 to a maximal value of 1 in isomorphic organisms. Therefore, increased cell size should be associated with larger b values, as observed in fishes, and a comparison of the six major taxa of animals and plants depicted in Figure 1 (r = 0.897; p = 0.039; for b vs. log cell area). In short, this hypothesis shows how the combined effects of SA at the cellular and whole-body levels may affect the body-mass scaling of metabolic rate. However, note that this positive correlation is expected only if L varies substantially among species. No correlation or even a negative correlation may arise if L shows little or no variation among species, as also observed in fishes [36] (see also Section 2.3.4). In fact, controlling for variation in L by using a partial correlation analysis, based on the data for 22 fish species presented in [29], reveals that the positive correlation between b and cell size is weaker (r = 0.336) and no longer significant (p = 0.138). According to [36], when L is constant or controlled, b may become more influenced by SA effects at the cellular level relative to those at the whole organism level, a hypothesis that requires testing (see also Section 2.3.6).
2.3.6. Summary of Potential Effects of Cell Size on Metabolic Scaling and Their Logical Consistency
As can be seen, cell size can affect metabolic rate and its scaling with body mass in multiple ways (as summarized in Table 1 and Figure 7). Cell size may affect the R/M of individual species, as well as the slope (b) and vertical elevation (i.e., metabolic level, L) of intra- or interspecific metabolic scaling relationships. As shown in Figure 7, these various effects are logically consistent. Within this conceptual framework, increases in cell size are always associated with decreases in metabolic rate.
However, the cell-SA mechanism proposed by [36], which posits a negative effect of cell size on b when L is constant, is not entirely consistent with the various effects depicted in Figure 7. Consider three hypothetical metabolic scaling relationships with identical L values, but different slopes (b) (Figure 8). According to [36], decreasing b should be associated with larger cells that have reduced SA/V ratios, thus increasing the effects of SA limits on metabolic scaling (see Section 2.3.4). However, although above the common midpoint body mass (as specified by a common L), this mechanism entails decreased metabolic rates in larger cells, as required by simple geometric cell-size theory (see Section 2.1.1), the opposite occurs below this intersection point, which contradicts this theory and the effect of cell size on R/M depicted in Figure 7. Unfortunately, this inconsistency has yet to be resolved.
So far in my review, I have emphasized potentially important SA/V effects at the cellular and whole-body levels on metabolic rate and its scaling with body mass, but other mechanisms may also be involved, as discussed next.
3. Mechanisms Underlying Cell-Size Effects on Metabolic Rate and Its Scaling with Body Mass
In this section, I discuss various mechanisms by which cell size may affect whole-body metabolic rate and its scaling with body mass. These include effects of cellular SA/V constraints, intracellular resource-transport limits, cell composition, and the resource demand of whole-body growth as mediated by the cellular mode of growth. In effect, I use a cellular perspective to apply all four of the major modal mechanisms (SA: surface area; RT: resource transport; SC: system composition; and RD: resource demand) specified by the “contextual multimodal theory” (CMT) of metabolic scaling [14,18] (see also Section 3.6).
3.1. Surface Area/Volume Effects
As briefly described in Section 2.1.1, SA/V effects may operate via limits on exchange of resources and metabolic wastes between the interior of cells and their external environment. As isomorphic cells increase in size, their SA increases allometrically (b~2/3) with cell V or M, and thus rates of resource uptake, ion exchange, and metabolic waste excretion that affect metabolic rate (R) should also scale allometrically (b~2/3). Although plausible, the cell SA theory of metabolic scaling requires further testing. Comparative tests of how unicellular metabolic scaling is affected by changes in cell size and shape (and thus SA/V ratios) would be especially useful in this regard. One can make two predictions. First, although allometric metabolic scaling should be exhibited in relatively large cells because of SA limits on supplying resources to large volumes of metabolically active cytoplasm and organelles, these limits should be minimal or nonexistent in very small cells with very high SA/V ratios where cellular demand is amply met by resource supply [169]. Indeed, as expected, very small cells often exhibit steep metabolic scaling possibly related to resource demand rather than supply (b ≥ 1) [169,170,171]. Second, increased SA/V ratios made possible by increased flattening or elongation of cell shape and/or increased folding of the cell membrane surface should facilitate the support of metabolism by resource uptake and waste removal [53,172]. Shape-shifting-related increases in SA may allow metabolic scaling exponents (b) to exceed 2/3 and even approach 1 in unicellular organisms [14,53,164,172]. Increases in the SA of intracellular membranes may also affect cellular R and its scaling with cell V or M [53,172,173,174,175,176].
Furthermore, one may ask whether cell shape affects R and its scaling with M in multicellular organisms as well. Given the current lack of relevant data, I can only offer some speculation to stimulate further research. Consider that in most animals, a major part of their body mass constitutes muscle tissue consisting of elongated cell ‘fibers’, which are required for effective muscular contraction and extension, and thus locomotor movement. It is therefore reasonable to suppose that the high SA/V ratios of muscle fibers may contribute to whole-body metabolic scaling exponents (b) that exceed 2/3. In support, many studies have shown that as locomotor activity increases, and muscular metabolism becomes an increasingly greater portion of total body metabolism, the scaling of whole-body metabolism also becomes significantly steeper (b approaching 1) [9,29,50,163,175,177,178]. As expected, the steepening of metabolic scaling during strenuous exercise is especially enhanced in athletic (muscular) species [14,104,163,177].
In addition, many cells in the extensive structural and vascular tissues of the roots, stems, and leaves of tracheophytes (vascular plants) are elongated, with relatively high SA/V ratios. Therefore, one may ask how much an elongated cell shape contributes to the relatively steep ontogenetic metabolic scaling of many plants (see Figure 1 legend and [105,141,142,143]). During the ontogeny of vascular plants, many cells not only expand in size (see Section 2.3.2) but also become more elongated [179]. According to the cell SA theory of metabolic scaling, increased cell expansion relative to cell multiplication should cause metabolic scaling exponents (b) to decrease (see Section 2.3.1, Figure 2 and Figure 7), but this may be mitigated by cell elongation that helps maintain relatively high SA/V ratios. In short, future tests of the cell SA theory of metabolic scaling should consider not only cell size, as emphasized in this review, but also cell shape.
Another explanation for the common observation that large cells exhibit lower R/M values than do smaller cells is that they require less metabolic energy to maintain ionic gradients across their membranes, because of their low SA relative to cell V [20,23,25,27]. However, is ionic regulation costly enough to make a difference in the R/M of small versus large cells? In various kinds of mammal tissues, the metabolic costs of ion transport (Na+-K+-ATPase activity) makes up 1–70% of the total oxygen consumption of their cells [180,181]. Clearly, the energetic cost of cross-membrane ion transport varies greatly among cell types, and thus could greatly affect analyses examining relationships between cell size and R/M. In addition, the proportional costs of cellular ion transport in other kinds of organisms remains to be determined. Nevertheless, the cost of ion transport relative to cell membrane SA in various crustaceans, fishes, and birds has been shown to be less in larger muscle cells, as predicted [182,183].
3.2. Intracellular Resource-Transport Effects
Several investigators have suggested that the ability of cells to meet their metabolic demand by resource supply may become increasingly limited as they increase in size, not only because of SA/V constraints, but also because intracellular resource transport (RT) to all regions of a cell may become more difficult as they become larger [38,184,185]. This explanation represents a cellular version of RT theory proposed to explain hypometric metabolic scaling at the organismal level [14,184,186,187]. This RT explanation is plausible but has yet to be supported with direct evidence. Problematically, the relative importance of SA and RT mechanisms in causing correlations between cell size and R/M and/or the metabolic scaling exponent (b) are difficult to distinguish [18]. Methods should be developed to distinguish the effects of cellular SA and RT mechanisms on metabolic scaling, as has been carried out by analyzing the geometry of body shape in aquatic animals with cutaneous respiration [107,188,189,190,191].
3.3. Cell and Body Composition Effects
As suggested in Section 2.3.3, hypometric metabolic scaling arising from ontogenetic increases in the relative proportion of body mass consisting of tissues with relatively low metabolic activity (i.e., system composition (SC) theory; see [14]) may often be largely the result of cell expansion. Furthermore, this SC effect may occur at not only the organismal level but also the cellular level, as in animal adipose tissue and plant structural tissues that accumulate large amounts of metabolically inert materials during cell expansion (see Section 2.3.3). The range of applicability of these cellular and organismal SC effects of cell expansion across taxa and tissue types now needs to be tested.
3.4. Effects of Resource Demand by Growth, as Mediated by the Cellular Mode of Growth
As supported by evidence presented in Section 2.3.2, somatic growth rate may relate to cell size and its covariation with body size. Organisms with large cells often grow slower than those with smaller cells [20]. This pattern is supported by negative associations between genome size (a proxy for cell size) and rates of growth and development in a variety of organisms (reviewed in [28,56]). In addition, rapid growth tends to be associated with cell multiplication, whereas slow growth often involves cell expansion (see Section 2.3.2). Since steep ontogenetic metabolic scaling is often associated with rapid postembryonic growth (see Section 2.3.2), it follows logically that cell size and growth during ontogeny should importantly affect metabolic scaling, a mechanism requiring further testing in a variety of organisms.
3.5. Cell-Size Variation in Time and Space
So far, most of my discussion regarding mechanisms has assumed homogeneity of cell size and how it changes during development in different tissue types. This seems reasonable as a first approximation because several studies have shown coordinated evolutionary and phenotypically plastic changes in cell size among multiple tissue types in animals [20,40] and plants [192,193], possibly mediated at least in part by genome size [56,192]. Nevertheless, cell-size changes in relation to increasing body size across ontogeny or phylogeny may differ significantly among some tissue types [40,193,194]. Furthermore, different tissue types [60] and developmental stages [39] may show different relationships between R/M and cell size. Therefore, future research should consider possible heterogeneity of effects among tissue types. A recent theoretical model posits that cell-size heterogeneity affects metabolic scaling [37], but it is limited by only considering fractal variation in cell size, a hypothetical pattern that has yet to be supported with empirical data.
3.6. A Holistic Hierarchical View: Linking Mechanisms at the Cell, Organ, and Whole-Organism Levels
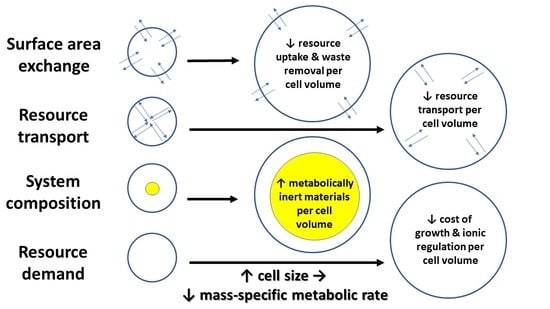
A focus on cell size and its relationship to body size presents a promising way of synthesizing the SA, RT, SC, and RD modal mechanisms causing metabolic scaling, especially within species during ontogeny, but perhaps, at least in part, across species as well. Developmental cell expansion may cause decreases in R/M, and thus hypometric ontogenetic metabolic scaling (b < 1) via (1) decreased resource supply to metabolizing cells, as a result of greater SA- and RT-related limits in larger cells; and (2) decreased mass-specific resource demand because of (a) increases in both intracellular deposits of metabolically inert materials and relative masses of tissues with relatively low metabolic activity (SC effects) and (b) an association of larger cells and/or cell expansion with lower relative costs of ionic regulation and slower rates of energetically expensive growth (RD effects) (summarized in Figure 9). In short, a cell-size perspective nicely shows how a comprehensive understanding of metabolic scaling requires an examination of mechanisms related to both resource supply and demand (see also [9,14,20,50,163,195,196,197]).
In addition, a comprehensive understanding of metabolic scaling requires a hierarchical view involving effects not only at the cellular level, as emphasized in this review, but also the intracellular, organ, and whole-organism levels (see also [14,30]). Such a perspective situates cell-size effects on metabolic rate in a holistic context, thereby helping to explain variation in the magnitude of these effects as a result of variation in the countervailing influences of other intrinsic (biological) or extrinsic (environmental) factors. After all, metabolic scaling may be affected by both cellular and whole-body systemic effects [30].
For example, it is a challenge for future research to determine how much metabolic scaling relates to cellular versus organismal SA/V constraints. Consider that although metabolic scaling in largely ectothermic insects appears to follow cell-size theory [31,41,72], metabolic scaling in endothermic birds and mammals, as a whole, does not [18,29]. Systemic thermoregulation (involving the compensation of whole-body SA-related heat dissipation by metabolic heat production) appears to dominate the metabolic scaling of endothermic birds and small mammals, causing the scaling exponent (b) to be near 2/3 under thermoneutral conditions [50,163] or near 0.5 under cold stress [166], rather than nearly 1 (due to variation in body size being related much more to cell number than to cell size), as predicted by cell-size theory [18,29]. In particular, the scaling exponent for cell size in mammals is only ~0.03–0.05 [5,145], which predicts a metabolic scaling exponent of ~0.98–0.99 (calculated using Equation (2)), far greater than that actually observed [6,50,163,166]. Furthermore, the allometric body-mass scaling of cellular metabolic rate across species of birds and mammals disappears when cells are cultured in vitro, thus suggesting that systemic effects predominate over cellular effects (reviewed in [30]). However, differences in metabolic scaling among orders of birds and mammals appear to be at least partially related to differences in the scaling of genome size (a proxy for cell size) [27]. A recent theoretical model also shows how one may integrate cell-size effects and systemic thermoregulatory effects related to heat dissipation to understand some of the diversity of metabolic exponents (b) that have been observed [38].
Organismal SA effects (and associated developmental shifts in body shape) also appear to be of major importance for understanding ontogenetic metabolic scaling in several species of aquatic skin-breathing animals [107,188,189,190,191]. Other organismal factors that may override cell-size effects on metabolic rate and its scaling with body mass include regulated activity level and strong size-selective mortality. Consider that metabolic rate can change drastically in animals based on their activity level (from torpor to rest to strenuous exercise) without any change in cell size. Regulated changes in activity may also affect the body-mass scaling of metabolic rate, being allometric in resting animals, but approaching isometry in torpid and strenuously exercising animals [50,163]. In addition, the freshwater amphipod Gammarus minus shows evolutionary and phenotypically plastic changes in ontogenetic metabolic scaling in response to long-term variation in size-selective predation regimes [75,199] or short-term variation in predator cues [200], without any significant change in the scaling of cell size (as indicated by eye-facet size) with eye size (a proxy for body size) [75].
An important intracellular trait that should be considered in the context of relationships between cell size and metabolic rate is genome size. As a rule, cell size so strongly correlates with genome size [28,56] that genome size is often used as a proxy for cell size (as I have done in this review). Increasing genome size is also frequently associated with slower rates of metabolism, development, and cell division (reviewed in [20,28,56,201]). However, it remains to be determined whether these associations involve direct causation or are indirectly mediated by effects of cell size. The latter interpretation has received some support from studies showing that metabolic rate is more related to cell size than genome size [29,32,56]. An increased understanding of relationships between cell size and metabolic rate may also be gained by exploring how both of these traits relate to nucleus size [71] and the numbers and sizes of ATP-producing mitochondria and other organelles critically involved in biosynthesis (e.g., ribosomes) [30,174]. Growing knowledge of how organelle size and number scale with cell size (see e.g., [101,202,203,204,205,206,207,208]) may provide valuable insight into how metabolic rate scales with body size. Even if metabolic scaling is dominated by systemic effects, they must ultimately be manifested “at the cellular level, for example, including induced variation in the function, structure and intracellular densities of mitochondria” [30] (p. 189). Interestingly, nucleus–cell volume ratios decrease with increasing cell size among many kinds of eukaryotic species, a pattern that may be linked to declines in R/M (hypometric metabolic scaling, b < 1), a hypothesis requiring testing [71]. However, this hypothetical pattern is not observed in prokaryotes, which show decreasing nucleoid–cell volume ratios (like eukaryotes [71]), but increasing R/M (unlike eukaryotes), with increasing cell size (hypermetric metabolic scaling, b > 1 [170,171]).
Clearly, a multi-mechanistic, hierarchical approach is required to understand completely the full diversity of metabolic scaling in the living world. The CMT, which embraces multiple theoretical approaches to metabolic scaling, including dynamic energy budget theory [209,210], offers a potentially useful conceptual framework for achieving a comprehensive synthesis [14,18]. The relative expression of the SA, RT, SC, and RD modal mechanisms may be orchestrated by various types of biological regulation, which is briefly discussed next.
4. Effects of Biological Regulation on Metabolic Rate and Its Scaling with Body Mass
Early leaders in the study of metabolic scaling believed that systemic regulatory factors are importantly involved [211,212], but this perspective has been neglected until recently [3,14,18,20,109,196,213]. For example, the neuroendocrine system plays an important role in regulating activity level and body temperature, which can in turn profoundly influence the scaling of metabolic rate (as reviewed in [9,14,29,50,163,166,167,177,178]; see also Section 3.6). Given the various ways that cell size and the relative expansion and multiplication of cells during ontogenetic growth can affect metabolic scaling, as documented or hypothesized in this review, it now seems imperative to explore how biological regulation at the cellular level plays a role in these effects. Knowledge of how cell expansion and multiplication are controlled by various hormones, growth factors, cell signaling systems, and genes (including their controlled expression) in both animals and plants has grown rapidly in recent years (see e.g., [3,129,131,132,214,215,216,217,218,219,220,221]). However, this mechanistic knowledge at the cellular level has yet to be applied to our understanding of ontogenetic metabolic scaling at the organismal level, which I believe is a major frontier awaiting highly rewarding exploration.
5. Conclusions
Variation in cell size and number in organisms and how it is achieved by cell expansion and multiplication may help explain much (but certainly not all) variation in metabolic rate and its scaling with body mass (see also Section 3.6). A multi-mechanistic approach is required to understand completely the diversity of metabolic scaling [14,18,20]. Nevertheless, the cell-size perspective deserves more attention than it has been given, because it offers a potentially fruitful way to link regulatory and metabolic machinery at the cellular level to the physiology of metabolic scaling at the organismal level (see also Section 4). Future research on metabolic scaling would benefit from integrating biological regulatory mechanisms operating at the cell, tissue, organ, and organismal levels. I recommend that this hierarchical perspective include multidirectional cause and effect relationships, including upward, downward, and reciprocal causation between metabolism, cell size, nucleus size, genome size, body size, growth rate, and other influential intrinsic (biological) and extrinsic (environmental) factors (see also [3,14,56,71,109,196]).
As a result, we may be able to integrate developmental biology and ontogenetic metabolic scaling in mutually beneficial ways. For example, a holistic conceptual framework embracing both of these fields may shed new light on the old question about why organisms often exhibit strong trade-offs between somatic growth and differentiation [81,100,111,112,218,222,223]. The mechanisms underlying this fundamental developmental trade-off may not only help explain but also be better understood in light of commonly observed ontogenetic shifts in metabolic scaling. Consider that early rapid postembryonic growth depends heavily on cell multiplication, which contributes to steep metabolic scaling, whereas later slower growth and cell differentiation are often associated with cell expansion and relatively shallow metabolic scaling (see also Section 2.3.2, Figure 4). The energetic demand of rapid growth and cell proliferation may not only dictate metabolic rate but also depend strongly on metabolic support and control [3,221] and thus the availability of metabolites [3,218]. Shifts from cell multiplication to cell differentiation are sensitive to nutrient availability (as observed in fission yeast, Schizosaccharomyces pombe [218], and fruit fly ovaries [224]). Therefore, the body-mass scaling of metabolic rate may serve as a useful energetic indicator of major transitions during ontogenetic development (see also [9,98,99,104,225,226]). Rapid growth associated with cell multiplication is very expensive energetically, thus requiring large increases in metabolic rate, whereas the relatively slow growth associated with cell differentiation and/or expansion appears to be less costly energetically, thus requiring relatively small increases in metabolic rate (cf. [102,223]).
In addition, a cell-size perspective may help bridge the fields of life-history evolution and ontogenetic metabolic scaling. For example, genome size (a proxy for cell size) often correlates positively with propagule size but negatively with propagule number in a variety of animals and plants [56]. Since cell size also often relates to mass-specific metabolic rate, as shown in this review, further research should explore how variation in cell size may cause covariation between metabolic rate and reproductive strategies in organisms. As another example, senescent tissues are often associated with enlarged cells (e.g., [227,228,229,230,231]), which may help explain why aging often involves a reduction in mass-specific metabolic rate (see e.g., [212,232,233,234,235,236]).
In short, a cellular perspective promises to enlighten our understanding of whole-organism development and life histories in multiple ways, including their metabolic (energetic and biochemical), informational (regulatory), structural (histological, anatomical, and morphological), and functional (physiological and biomechanical) aspects.
Funding
This research received no external funding directly supporting it. However, financial support from the Company of Biologists enabled me to present some of the ideas discussed herein at a workshop.
Institutional Review Board Statement
Not applicable.
Informed Consent Statement
Not applicable.
Data Availability Statement
Not applicable.
Acknowledgments
I wish to acknowledge valuable feedback that I received from participants at the Company of Biologists workshop “Cell size and growth, from single cells to the tree of life”, organized by Clotilde Cadart and Matthew Swaffer. I also thank Rebecca Heald, Clotilde Cadart and two anonymous reviewers for their helpful comments on a previous version of this manuscript. Heald, in particular, encouraged me to think about how cell multiplication coupled with cell-size reduction may affect metabolic scaling, especially in animal embryos.
Conflicts of Interest
The author declares no conflict of interest.
References
- Ricklefs, R.E.; Wikelski, M. The physiology/life-history nexus. Trends Ecol. Evol. 2002, 17, 462–468. [Google Scholar] [CrossRef]
- Brown, J.H.; Gillooly, J.F.; Allen, A.P.; Savage, V.M.; West, G.B. Toward a metabolic theory of ecology. Ecology 2004, 85, 1771–1789. [Google Scholar] [CrossRef]
- Glazier, D.S. Is metabolic rate a universal ‘pacemaker’ for biological processes? Biol. Rev. 2015, 90, 377–407. [Google Scholar] [CrossRef]
- Montiglio, P.O.; Dammhahn, M.; Dubuc Messier, G.; Réale, D. The pace-of-life syndrome revisited: The role of ecological conditions and natural history on the slow-fast continuum. Behav. Ecol. Sociobiol. 2018, 72, 116. [Google Scholar] [CrossRef]
- Peters, R.H. The Ecological Implications of Body Size; Cambridge University Press: Cambridge, UK, 1983. [Google Scholar]
- McNab, B.K. An analysis of the factors that influence the level and scaling of mammalian BMR. Comp. Biochem. Physiol. A Mol. Integr. Physiol. 2008, 151, 5–28. [Google Scholar] [CrossRef]
- Glazier, D.S. Complications with body-size correction in comparative biology: Possible solutions and an appeal for new approaches. J. Exp. Biol. 2022, 225 (Suppl. 1), jeb243313. [Google Scholar] [CrossRef]
- Agutter, P.S.; Wheatley, D.N. Metabolic scaling: Consensus or controversy? Theor. Biol. Med. Model. 2004, 1, 13. [Google Scholar] [CrossRef] [Green Version]
- Glazier, D.S. Beyond the “3/4-power law”: Variation in the intra- and interspecific scaling of metabolic rate in animals. Biol. Rev. 2005, 80, 611–662. [Google Scholar] [CrossRef]
- Agutter, P.S.; Tuszynski, J.A. Analytic theories of metabolic scaling. J. Exp. Biol. 2011, 214, 1055–1062. [Google Scholar] [CrossRef] [PubMed] [Green Version]
- Burton, T.; Killen, S.S.; Armstrong, J.D.; Metcalfe, N.B. What causes intraspecific variation in resting metabolic rate and what are its ecological consequences? Proc. R. Soc. B Biol. Sci. 2011, 278, 3465–3473. [Google Scholar] [CrossRef] [Green Version]
- Konarzewski, M.; Książek, A. Determinants of intra-specific variation in basal metabolic rate. J. Comp. Physiol. B 2013, 183, 27–41. [Google Scholar] [CrossRef] [PubMed] [Green Version]
- White, C.R.; Kearney, M.R. Determinants of inter-specific variation in basal metabolic rate. J. Comp. Physiol. B 2013, 183, 1–26. [Google Scholar] [CrossRef] [PubMed]
- Glazier, D.S. Metabolic scaling in complex living systems. Systems 2014, 2, 451–540. [Google Scholar] [CrossRef] [Green Version]
- White, C.R.; Kearney, M.R. Metabolic scaling in animals: Methods, empirical results, and theoretical explanations. Compr. Physiol. 2014, 4, 231–256. [Google Scholar] [CrossRef]
- Killen, S.S.; Glazier, D.S.; Rezende, E.L.; Clark, T.D.; Atkinson, D.; Willener, A.S.; Halsey, L.G. Ecological influences and morphological correlates of resting and maximal metabolic rates across teleost fish species. Am. Nat. 2016, 187, 592–606. [Google Scholar] [CrossRef] [Green Version]
- Harrison, J.F. Do performance-safety tradeoffs cause hypometric metabolic scaling in animals? Trends Ecol. Evol. 2017, 32, 653–664. [Google Scholar] [CrossRef]
- Glazier, D.S. Rediscovering and reviving old observations and explanations of metabolic scaling in living systems. Systems 2018, 6, 4. [Google Scholar] [CrossRef] [Green Version]
- Pettersen, A.K.; Marshall, D.J.; White, C.R. Understanding variation in metabolic rate. J. Exp. Biol. 2018, 221, jeb166876. [Google Scholar] [CrossRef] [Green Version]
- Kozłowski, J.; Konarzewski, M.; Czarnoleski, M. Coevolution of body size and metabolic rate in vertebrates: A life-history perspective. Biol. Rev. 2020, 95, 1393–1417. [Google Scholar] [CrossRef]
- Pfaundler, M. Über die energetische Flächenregel. Pflüger’s Arch. Gesamte Physiol. Menschen Tiere 1921, 188, 273–280. [Google Scholar] [CrossRef] [Green Version]
- Smith, H.M. Cell size and metabolic activity in Amphibia. Biol. Bull. 1925, 48, 347–378. [Google Scholar] [CrossRef]
- Davison, J. Body weight, cell surface, and metabolic rate in anuran Amphibia. Biol. Bull. 1955, 109, 407–419. [Google Scholar] [CrossRef]
- Davison, J. An analysis of cell growth and metabolism in the crayfish (Procambrus alleni). Biol. Bull. 1956, 110, 264–273. [Google Scholar] [CrossRef]
- Szarski, H. Cell size and the concept of wasteful and frugal evolutionary strategies. J. Theor. Biol. 1983, 105, 201–209. [Google Scholar] [CrossRef]
- Vinogradov, A.E. Nucleotypic effect in homeotherms: Body-mass-corrected basal metabolic rate of mammals is related to genome size. Evolution 1995, 49, 1249–1259. [Google Scholar] [CrossRef]
- Kozłowski, J.; Konarzewski, M.; Gawelczyk, A.T. Cell size as a link between noncoding DNA and metabolic rate scaling. Proc. Natl. Acad. Sci. USA 2003, 100, 14080–14085. [Google Scholar] [CrossRef] [Green Version]
- Gregory, T.R. Genome size evolution in animals. In The Evolution of the Genome; Gregory, T.R., Ed.; Elsevier Academic Press: Burlington, MA, USA, 2005; pp. 3–87. [Google Scholar]
- Glazier, D.S. Scaling of metabolic scaling within physical limits. Systems 2014, 2, 425–450. [Google Scholar] [CrossRef] [Green Version]
- Glazier, D.S. Body-mass scaling of metabolic rate: What are the relative roles of cellular versus systemic effects? Biology 2015, 4, 187–199. [Google Scholar] [CrossRef] [Green Version]
- Chown, S.L.; Marais, E.; Terblanche, J.S.; Klok, C.J.; Lighton, J.R.B.; Blackburn, T.M. Scaling of insect metabolic rate is inconsistent with the nutrient supply network model. Funct. Ecol. 2007, 21, 282–290. [Google Scholar] [CrossRef]
- Starostová, Z.; Kubička, L.; Konarzewski, M.; Kozłowski, J.; Kratochvíl, L. Cell size but not genome size affects scaling of metabolic rate in eyelid geckos. Am. Nat. 2009, 174, E100–E105. [Google Scholar] [CrossRef]
- Maciak, S.; Janko, K.; Kotusz, J.; Choleva, L.; Boroń, A.; Juchno, D.; Kujawa, R.; Kozłowski, J.; Konarzewski, M. Standard metabolic rate (SMR) is inversely related to erythrocyte and genome size in allopolyploid fish of the Cobitis taenia hybrid complex. Funct. Ecol. 2011, 25, 1072–1078. [Google Scholar] [CrossRef]
- Huang, Q.; Zhang, Y.; Liu, S.; Wang, W.; Luo, Y. Intraspecific scaling of the resting and maximum metabolic rates of the crucian carp (Carassius auratus). PLoS ONE 2013, 8, e82837. [Google Scholar] [CrossRef] [PubMed]
- Zhang, Y.; Huang, Q.; Liu, S.; He, D.; Wei, G.; Luo, Y. Intraspecific mass scaling of metabolic rates in grass carp (Ctenopharyngodon idellus). J. Comp. Physiol. B 2014, 184, 347–354. [Google Scholar] [CrossRef]
- Luo, Y.; He, D.; Li, G.; Xie, H.; Zhang, Y.; Huang, Q. Intraspecific metabolic scaling exponent depends on red blood cell size in fishes. J. Exp. Biol. 2015, 218, 1496–1503. [Google Scholar] [CrossRef] [Green Version]
- Takemoto, K. Heterogeneity of cells may explain allometric scaling of metabolic rate. Biosystems 2015, 130, 11–16. [Google Scholar] [CrossRef] [Green Version]
- Shestopaloff, Y.K. Metabolic allometric scaling model: Combining cellular transportation and heat dissipation constraints. J. Exp. Biol. 2016, 219, 2481–2489. [Google Scholar] [CrossRef] [Green Version]
- Hermaniuk, A.; Rybacki, M.; Taylor, J.R. Metabolic rate of diploid and triploid Edible Frog Pelophylax esculentus correlates inversely with cell size in tadpoles but not in frogs. Physiol. Biochem. Zool. 2017, 90, 230–239. [Google Scholar] [CrossRef] [PubMed]
- Czarnoleski, M.; Labecka, A.M.; Dragosz-Kluska, D.; Pis, T.; Pawlik, K.; Kapustka, F.; Kilarski, W.M.; Kozłowski, J. Concerted evolution of body mass and cell size: Similar patterns among species of birds (Galliformes) and mammals (Rodentia). Biol. Open 2018, 7, bio029603. [Google Scholar] [CrossRef] [Green Version]
- Schramm, B.W.; Labecka, A.M.; Gudowska, A.; Antoł, A.; Sikorska, A.; Szabla, N.; Bauchinger, U.; Kozlowski, J.; Czarnoleski, M. Concerted evolution of body mass, cell size and metabolic rate among carabid beetles. J. Insect Physiol. 2021, 132, 104272. [Google Scholar] [CrossRef]
- Zhu, Y.; Xiong, W.; Xu, Y.; Zhang, P.; Zhang, J.; Luo, Y. Comparison of metabolic scaling between triploid and diploid common carp. J. Comp. Physiol. B 2021, 191, 711–719. [Google Scholar] [CrossRef]
- Kestner, O. Metabolism and size of organs. J. Physiol. 1936, 87, 39P–41P. [Google Scholar]
- Oikawa, S.; Itazawa, Y. Relative growth of organs and parts of the carp, Cyprinus carpio, with special reference to the metabolism-size relationship. Copeia 1984, 1984, 800–803. [Google Scholar] [CrossRef]
- Oikawa, S.; Itazawa, Y. Tissue respiration and relative growth of parts of body of a marine teleost, porgy Pagrus major, during early life stages with special reference to the metabolism-size relationship. Comp. Biochem. Physiol. A Physiol. 1993, 105, 741–744. [Google Scholar] [CrossRef]
- Daan, S.; Masman, D.; Groenewold, A. Avian basal metabolic rates: Their association with body composition and energy expenditure in nature. Am. J. Physiol. Regul. Integr. Comp. Physiol. 1990, 259, R333–R340. [Google Scholar] [CrossRef]
- Wang, Z.; O’Connor, T.P.; Heshka, S.; Heymsfield, S.B. The reconstruction of Kleiber’s law at the organ-tissue level. J. Nutr. 2001, 131, 2967–2970. [Google Scholar] [CrossRef] [Green Version]
- Kutschera, U.; Niklas, K.J. Organ-specific rates of cellular respiration in developing sunflower seedlings and their bearing on metabolic scaling theory. Protoplasma 2012, 249, 1049–1057. [Google Scholar] [CrossRef]
- Antoł, A.; Kozłowski, J. Scaling of organ masses in mammals and birds: Phylogenetic signal and implications for metabolic rate scaling. ZooKeys 2020, 982, 149. [Google Scholar] [CrossRef]
- Glazier, D.S. A unifying explanation for diverse metabolic scaling in animals and plants. Biol. Rev. 2010, 85, 111–138. [Google Scholar] [CrossRef]
- Killen, S.S.; Atkinson, D.; Glazier, D.S. The intraspecific scaling of metabolic rate with body mass in fishes depends on lifestyle and temperature. Ecol. Lett. 2010, 13, 184–193. [Google Scholar] [CrossRef]
- Glazier, D.S. Commentary: On the interpretation of the normalization constant in the scaling equation. Front. Ecol. Evol. 2020, 8, 90. [Google Scholar] [CrossRef] [Green Version]
- Okie, J.G. General models for the spectra of surface area scaling strategies of cells and organisms: Fractality, geometric dissimilitude, and internalization. Am. Nat. 2013, 181, 421–439. [Google Scholar] [CrossRef] [PubMed]
- Licht, L.E.; Lowcock, L.A. Genome size and metabolic rate in salamanders. Comp. Biochem. Physiol. B Comp. Biochem. 1991, 100, 83–92. [Google Scholar] [CrossRef]
- Pis, T. Resting metabolic rate and erythrocyte morphology in early development of thermoregulation in the precocial grey partridge (Perdix perdix). Comp. Biochem. Physiol. A Mol. Integr. Physiol. 2008, 151, 211–218. [Google Scholar] [CrossRef] [PubMed]
- Glazier, D.S. Genome size covaries more positively with propagule size than adult size: New insights into an old problem. Biology 2021, 10, 270. [Google Scholar] [CrossRef]
- Gardner, J.D.; Laurin, M.; Organ, C.L. The relationship between genome size and metabolic rate in extant vertebrates. Philos. Trans. R. Soc. Lond. B Bio. Sci. 2020, 375, 20190146. [Google Scholar] [CrossRef] [Green Version]
- Stillwell, E.J.; Benfey, T.J. Hemoglobin level, metabolic rate, opercular abduction rate and swimming efficiency in female triploid brook trout (Salvelinus fontinalis). Fish Physiol. Biochem. 1996, 15, 377–383. [Google Scholar] [CrossRef]
- Atkins, M.E.; Benfey, T.J. Effect of acclimation temperature on routine metabolic rate in triploid salmonids. Comp. Biochem. Physiol. A Mol. Integr. Physiol. 2008, 149, 157–161. [Google Scholar] [CrossRef]
- Maciak, S.; Bonda-Ostaszewska, E.; Czarnołęski, M.; Konarzewski, M.; Kozłowski, J. Mice divergently selected for high and low basal metabolic rates evolved different cell size and organ mass. J. Evol. Biol. 2014, 27, 478–487. [Google Scholar] [CrossRef] [Green Version]
- Bowden, A.J.; Andrewartha, S.J.; Elliott, N.G.; Frappell, P.B.; Clark, T.D. Negligible differences in metabolism and thermal tolerance between diploid and triploid Atlantic salmon (Salmo salar). J. Exp. Biol. 2018, 221, jeb166975. [Google Scholar] [CrossRef] [Green Version]
- Lahnsteiner, F.; Lahnsteiner, E.; Kletzl, M. Differences in metabolism of triploid and diploid Salmo trutta f. lacustris under acclimation conditions and after exposure to stress situations. Aquac. Res. 2019, 50, 2444–2459. [Google Scholar] [CrossRef]
- Hermaniuk, A.; van de Pol, I.L.; Verberk, W.C. Are acute and acclimated thermal effects on metabolic rate modulated by cell size? a comparison between diploid and triploid zebrafish larvae. J. Exp. Biol. 2021, 224, jeb.227124. [Google Scholar] [CrossRef] [PubMed]
- Ellenby, C. Oxygen consumption and cell size. A comparison of the rate of oxygen consumption of diploid and triploid prepupae of Drosophila melanogaster Meigen. J. Exp. Biol. 1953, 30, 475–491. [Google Scholar] [CrossRef]
- Kamel, S.; Marsden, J.E.; Pough, F.H. Diploid and tetraploid grey treefrogs (Hyla chrysoscelis and Hyla versicolor) have similar metabolic rates. Comp. Biochem. Physiol. A Comp. Physiol. 1985, 82, 217–220. [Google Scholar] [CrossRef]
- Licht, L.E.; Bogart, J.P. Comparative rates of oxygen consumption and water loss in diploid and polyploid salamanders (genus Ambystoma). Comp. Biochem. Physiol. A Physiol. 1990, 97, 569–572. [Google Scholar] [CrossRef]
- Scott, M.A.; Dhillon, R.S.; Schulte, P.M.; Richards, J.G. Physiology and performance of wild and domestic strains of diploid and triploid rainbow trout (Oncorhynchus mykiss) in response to environmental challenges. Can. J. Fish. Aquat. Sci. 2015, 72, 125–134. [Google Scholar] [CrossRef]
- O’Donnell, K.M.; MacRae, K.L.; Verhille, C.E.; Sacobie, C.F.D.; Benfey, T.J. Standard metabolic rate of juvenile triploid brook charr, Salvelinus fontinalis. Aquaculture 2017, 479, 85–90. [Google Scholar] [CrossRef]
- Cavalier-Smith, T. Cell volume and the evolution of eukaryotic genome size. In The Evolution of Genome Size; Cavalier-Smith, T., Ed.; Wiley: Chichester, UK, 1985; pp. 104–184. [Google Scholar]
- Xiong, W.; Zhu, Y.; Zhang, P.; Xu, Y.; Zhou, J.; Zhang, J.; Luo, Y. Effects of temperature on metabolic scaling in silver carp. J. Exp. Zool. A Ecol. Integr. Physiol. 2022, 337, 141–149. [Google Scholar] [CrossRef]
- Malerba, M.E.; Marshall, D.J. Larger cells have relatively smaller nuclei across the Tree of Life. Evol. Lett. 2021, 5, 306–314. [Google Scholar] [CrossRef]
- Glazier, D.S.; Powell, M.G.; Deptola, T.J. Body-size scaling of metabolic rate in the trilobite Eldredgeops rana. Paleobiology 2013, 39, 109–122. [Google Scholar] [CrossRef]
- Starostová, Z.; Konarzewski, M.; Kozłowski, J.; Kratochvíl, L. Ontogeny of metabolic rate and red blood cell size in eyelid geckos: Species follow different paths. PLoS ONE 2013, 8, e64715. [Google Scholar] [CrossRef] [Green Version]
- Johnston, I.A.; Kristjansson, B.K.; Paxton, C.G.; Vieira, V.L.; Macqueen, D.J.; Bell, M.A. Universal scaling rules predict evolutionary patterns of myogenesis in species with indeterminate growth. Proc. R. Soc. B Biol. Sci. 2012, 279, 2255–2261. [Google Scholar] [CrossRef] [PubMed] [Green Version]
- Glazier, D.S.; Butler, E.M.; Lombardi, S.A.; Deptola, T.J.; Reese, A.J.; Satterthwaite, E.V. Ecological effects on metabolic scaling: Amphipod responses to fish predators in freshwater springs. Ecol. Monogr. 2011, 81, 599–618. [Google Scholar] [CrossRef]
- Lv, X.; Xie, H.; Xia, D.; Shen, C.; Li, J.; Luo, Y. Mass scaling of the resting and maximum metabolic rates of the black carp. J. Comp. Physiol. B 2018, 188, 591–598. [Google Scholar] [CrossRef] [PubMed]
- Jackson, G.; O’Dor, R. Time, space and the ecophysiology of squid growth, life in the fast lane. Vie Milieu 2001, 51, 205–215. [Google Scholar]
- Moltschaniwskyj, N.A. Understanding the process of growth in cephalopods. Mar. Freshw. Res. 2004, 55, 379–386. [Google Scholar] [CrossRef]
- Fujita, S.; Kuranaga, E.; Nakajima, Y.I. Cell proliferation controls body size growth, tentacle morphogenesis, and regeneration in hydrozoan jellyfish Cladonema pacificum. PeerJ 2009, 7, e7579. [Google Scholar] [CrossRef] [Green Version]
- Glazier, D.S. The 3/4-power law is not universal: Evolution of isometric, ontogenetic metabolic scaling in pelagic animals. BioScience 2006, 56, 325–332. [Google Scholar] [CrossRef] [Green Version]
- O’Farrell, P.H. How metazoans reach their full size: The natural history of bigness. In Cell Growth: Control of Cell Size; Hall, M., Raff, M., Thomas, G., Eds.; Cold Spring Harbor Laboratory Press: New York, NY, USA, 2004; pp. 1–11. [Google Scholar]
- Swire, J.; Fuchs, S.; Bundy, J.G.; Leroi, A.M. The cellular geometry of growth drives the amino acid economy of Caenorhabditis elegans. Proc. R. Soc. B Biol. Sci. 2009, 276, 2747–2754. [Google Scholar] [CrossRef] [Green Version]
- Berrill, N.J. The development of the bud in Botryllus. Biol. Bull. 1941, 80, 169–184. [Google Scholar] [CrossRef]
- Brandon, C.S.; Dudycha, J.L. Ecological constraints on sensory systems: Compound eye size in Daphnia is reduced by resource limitation. J. Comp. Physiol. A 2014, 200, 749–758. [Google Scholar] [CrossRef]
- Glazier, D.S. Separating the respiration rates of embryos and brooding females of Daphnia magna: Implications for the cost of brooding and the allometry of metabolic rate. Limnol. Oceanogr. 1991, 36, 354–361. [Google Scholar] [CrossRef]
- Glazier, D.S.; Calow, P. Energy allocation rules in Daphnia magna: Clonal and age differences in the effects of food limitation. Oecologia 1992, 90, 540–549. [Google Scholar] [CrossRef] [PubMed]
- Keskinen, E.; Takaku, Y.; Meyer-Rochow, V.B.; Hariyama, T. Postembryonic eye growth in the seashore isopod Ligia exotica (Crustacea, Isopoda). Biol. Bull. 2002, 202, 223–231. [Google Scholar] [CrossRef] [PubMed]
- Laybourn, J. Respiratory energy losses in the protozoan predator Didinium nasutum Müller (Ciliophora). Oecologia 1977, 27, 305–309. [Google Scholar] [CrossRef]
- Laybourn, J. Respiratory energy losses in Stentor coeruleus Ehrenberg (Ciliophora). Oecologia 1975, 21, 273–278. [Google Scholar] [CrossRef] [PubMed]
- Giguère, L.A.; Côté, B.; St-Pierre, J.F. Metabolic rates scale isometrically in larval fishes. Mar. Ecol. Progr. Ser. 1988, 50, 13–19. [Google Scholar] [CrossRef]
- Oikawa, S.; Itazawa, Y.; Gotoh, M. Ontogenetic change in the relationship between metabolic rate and body mass in a sea bream Pagrus major (Temminck & Schlegel). J. Fish Biol. 1991, 38, 483–496. [Google Scholar] [CrossRef]
- Kamler, E. Early Life History of Fish: An Energetics Approach; Chapman & Hall: London, UK, 1992. [Google Scholar]
- Radzinskaya, L.I.; Nikol’skaya, I.S.; Alekseeva, T.A.; Vladimirova, I.G.; Kovalenko, P.I.; Ozernyuk, N.D. Changes in the intensity of respiration during ontogenesis of some invertebrates. Russ. J. Dev. Biol. 2003, 34, 317–320. [Google Scholar] [CrossRef]
- Hulbert, A.J.; Else, P.L. Membranes and the setting of energy demand. J. Exp. Biol. 2005, 208, 1593–1599. [Google Scholar] [CrossRef] [Green Version]
- Kutschera, U.; Niklas, K.J. Ontogenetic changes in the scaling of cellular respiration with respect to size among sunflower seedlings. Plant Signal. Behav. 2011, 6, 72–76. [Google Scholar] [CrossRef] [Green Version]
- Rombough, P. The energetics of embryonic growth. Resp. Physiol. Neurobiol. 2011, 178, 22–29. [Google Scholar] [CrossRef] [PubMed]
- Gaitán-Espitia, J.D.; Bruning, A.; Mondaca, F.; Nespolo, R.F. Intraspecific variation in the metabolic scaling exponent in ectotherms: Testing the effect of latitudinal cline, ontogeny and transgenerational change in the land snail Cornu aspersum. Comp. Biochem. Physiol. A Mol. Integr. Physiol. 2013, 165, 169–177. [Google Scholar] [CrossRef] [PubMed]
- Matoo, O.B.; Julick, C.R.; Montooth, K.L. Genetic variation for ontogenetic shifts in metabolism underlies physiological homeostasis in Drosophila. Genetics 2019, 212, 537–552. [Google Scholar] [CrossRef] [PubMed] [Green Version]
- Hu, T.M. A general biphasic bodyweight model for scaling basal metabolic rate, glomerular filtration rate, and drug clearance from birth to adulthood. AAPS J. 2022, 24, 1–19. [Google Scholar] [CrossRef] [PubMed]
- Tadros, W.; Lipshitz, H.D. The maternal-to-zygotic transition: A play in two acts. Development 2009, 136, 3033–3042. [Google Scholar] [CrossRef] [PubMed] [Green Version]
- Wesley, C.C.; Mishra, S.; Levy, D.L. Organelle size scaling over embryonic development. Wiley Interdiscip. Rev. Dev. Biol. 2020, 9, e376. [Google Scholar] [CrossRef]
- Vleck, C.M.; Hoyt, D.F.; Vleck, D. Metabolism of avian embryos: Patterns in altricial and precocial birds. Physiol. Zool. 1979, 52, 363–377. [Google Scholar] [CrossRef]
- Riisgård, H.U. No foundation of a ’3/4 power scaling law’ for respiration in biology. Ecol. Lett. 1998, 1, 71–73. [Google Scholar] [CrossRef]
- Killen, S.S.; Costa, I.; Brown, J.A.; Gamperl, A.K. Little left in the tank: Metabolic scaling in marine teleosts and its implications for aerobic scope. Proc. R. Soc. B Biol. Sci. 2007, 274, 431–438. [Google Scholar] [CrossRef] [Green Version]
- Peng, Y.; Niklas, K.J.; Reich, P.B.; Sun, S. Ontogenetic shift in the scaling of dark respiration with whole-plant mass in seven shrub species. Funct. Ecol. 2010, 24, 502–512. [Google Scholar] [CrossRef]
- Callier, V.; Nijhout, H.F. Supply-side constraints are insufficient to explain the ontogenetic scaling of metabolic rate in the tobacco Hornworm, Manduca sexta. PLoS ONE 2012, 7, e45455. [Google Scholar] [CrossRef] [Green Version]
- Glazier, D.S.; Hirst, A.G.; Atkinson, D. Shape shifting predicts ontogenetic changes in metabolic scaling in diverse aquatic invertebrates. Proc. R. Soc. B Biol. Sci. 2015, 282, 20142302. [Google Scholar] [CrossRef] [PubMed] [Green Version]
- Czarnołęski, M.; Kozłowski, J.; Dumiot, G.; Bonnet, J.C.; Mallard, J.; Dupont-Nivet, M. Scaling of metabolism in Helix aspersa snails: Changes through ontogeny and response to selection for increased size. J. Exp. Biol. 2008, 211, 391–400. [Google Scholar] [CrossRef] [PubMed] [Green Version]
- Glazier, D.S.; Borrelli, J.J.; Hoffman, C.L. Effects of fish predators on the mass-related energetics of a keystone freshwater crustacean. Biology 2020, 9, 40. [Google Scholar] [CrossRef] [PubMed] [Green Version]
- Norin, T. Growth and mortality as causes of variation in metabolic scaling among taxa and taxonomic levels. Integr. Comp. Biol. 2022, 62, icac038. [Google Scholar] [CrossRef]
- Arendt, J.D. Adaptive intrinsic growth rates: An integration across taxa. Quart. Rev. Biol. 1997, 72, 149–177. [Google Scholar] [CrossRef]
- Arendt, J.D. Allocation of cells to proliferation vs. differentiation and its consequences for growth and development. J. Exp. Zool. 2000, 288, 219–234. [Google Scholar] [CrossRef]
- Higgins, P.J.; Thorpe, J.E. Hyperplasia and hypertrophy in the growth of skeletal muscle in juvenile Atlantic salmon, Salmo salar L. J. Fish Biol. 1990, 37, 505–519. [Google Scholar] [CrossRef]
- Gillaspy, G.; Ben-David, H.; Gruissem, W. Fruits: A developmental perspective. Plant Cell 1993, 5, 1439. [Google Scholar] [CrossRef]
- Alami-Durante, H.; Fauconneau, B.; Rouel, M.; Escaffre, A.M.; Bergot, P. Growth and multiplication of white skeletal muscle fibres in carp larvae in relation to somatic growth rate. J. Fish Biol. 1997, 50, 1285–1302. [Google Scholar] [CrossRef]
- Beemster, G.T.; Baskin, T.I. Analysis of cell division and elongation underlying the developmental acceleration of root growth in Arabidopsis thaliana. Plant Physiol. 1998, 116, 1515–1526. [Google Scholar] [CrossRef] [PubMed] [Green Version]
- Galloway, T.F.; Kjorsvik, E.; Kryvi, H. Muscle growth and development in Atlantic cod larvae (Gadus morhua L.), related to different somatic growth rates. J. Exp. Biol. 1999, 202, 2111–2120. [Google Scholar] [CrossRef] [PubMed]
- Harada, T.; Kurahashi, W.; Yanai, M.; Wakasa, Y.; Satoh, T. Involvement of cell proliferation and cell enlargement in increasing the fruit size of Malus species. Sci. Hortic. 2005, 105, 447–456. [Google Scholar] [CrossRef]
- Zhang, C.; Tanabe, K.; Wang, S.; Tamura, F.; Yoshida, A.; Matsumoto, K. The impact of cell division and cell enlargement on the evolution of fruit size in Pyrus pyrifolia. Ann. Bot. 2006, 98, 537–543. [Google Scholar] [CrossRef]
- Johnston, L.A.; Gallant, P. Control of growth and organ size in Drosophila. Bioessays 2002, 24, 54–64. [Google Scholar] [CrossRef] [PubMed]
- Shu, Z.; Row, S.; Deng, W.M. Endoreplication: The good, the bad, and the ugly. Trends Cell Biol. 2018, 28, 465–474. [Google Scholar] [CrossRef] [PubMed]
- Winick, M.; Noble, A. Quantitative changes in DNA, RNA, and protein during prenatal and postnatal growth in the rat. Dev. Biol. 1965, 12, 451–466. [Google Scholar] [CrossRef]
- Goss, R.J. Hypertrophy versus Hyperplasia: How much organs can grow depends on whether their functional units increase in size or in number. Science 1966, 153, 1615–1620. [Google Scholar] [CrossRef]
- Zak, R. Cell proliferation during cardiac growth. Am. J. Cardiol. 1973, 31, 211–219. [Google Scholar] [CrossRef]
- Rozovski, S.J.; Winick, M. Nutrition and cellular growth. In Nutrition: Pre- and Postnatal Development; Winick, M., Ed.; Plenum Press: New York, NY, USA, 1979; Volume 1, pp. 61–101. [Google Scholar]
- Johns, P.R. Growth of fish retinas. Am. Zool. 1981, 21, 447–458. [Google Scholar] [CrossRef] [Green Version]
- Riska, B.; Atchley, W.R.; Rutledge, J.J. A genetic analysis of targeted growth in mice. Genetics 1984, 107, 79–101. [Google Scholar] [CrossRef]
- Weatherley, A.H. Approaches to understanding fish growth. Trans. Am. Fish. Soc. 1990, 119, 662–672. [Google Scholar] [CrossRef]
- Gonzalez, N.; Vanhaeren, H.; Inzé, D. Leaf size control: Complex coordination of cell division and expansion. Trends Plant Sci. 2012, 17, 332–340. [Google Scholar] [CrossRef] [PubMed]
- Fanwoua, J.; de Visser, P.H.; Heuvelink, E.; Yin, X.; Struik, P.C.; Marcelis, L.F. A dynamic model of tomato fruit growth integrating cell division, cell growth and endoreduplication. Funct. Plant Biol. 2013, 40, 1098–1114. [Google Scholar] [CrossRef]
- Takatsuka, H.; Umeda, M. Hormonal control of cell division and elongation along differentiation trajectories in roots. J. Exp. Bot. 2014, 65, 2633–2643. [Google Scholar] [CrossRef] [Green Version]
- Mauxion, J.P.; Chevalier, C.; Gonzalez, N. Complex cellular and molecular events determining fruit size. Trends Plant Sci. 2021, 26, 1023–1038. [Google Scholar] [CrossRef]
- Granier, C.; Tardieu, F. Spatial and temporal analyses of expansion and cell cycle in sunflower leaves: A common pattern of development for all zones of a leaf and different leaves of a plant. Plant Physiol. 1998, 116, 991–1001. [Google Scholar] [CrossRef] [Green Version]
- Winick, M.; Noble, A. Cellular response in rats during malnutrition at various ages. J. Nutr. 1966, 89, 300–306. [Google Scholar] [CrossRef] [PubMed]
- Winick, M.; Noble, A. Cellular response with increased feeding in neonatal rats. J. Nutr. 1967, 91, 179–182. [Google Scholar] [CrossRef] [PubMed] [Green Version]
- Riska, B.; Atchley, W.R. Genetics of growth predict patterns of brain-size evolution. Science 1985, 229, 668–671. [Google Scholar] [CrossRef]
- Atchley, W.R.; Wei, R.; Crenshaw, P. Cellular consequences in the brain and liver of age-specific selection for rate of development in mice. Genetics 2000, 155, 1347–1357. [Google Scholar] [CrossRef] [PubMed]
- Arendt, J. Ecological correlates of body size in relation to cell size and cell number: Patterns in flies, fish, fruits and foliage. Biol. Rev. 2007, 82, 241–256. [Google Scholar] [CrossRef] [PubMed]
- Sebastes_goodei_larvae_drawing.gif. Available online: https://commons.wikimedia.org/wiki/File:Sebastes_goodei_larvae_drawing.gif (accessed on 19 June 2022).
- Drawing Fish #1416367. Available online: http://clipart-library.com/clipart/piode7j6T.htm (accessed on 19 June 2022).
- Mori, S.; Yamaji, K.; Ishida, A.; Prokushkin, S.G.; Masyagina, O.V.; Hagihara, A.; Hoque, A.R.; Suwa, R.; Osawa, A.; Nishizono, T.; et al. Mixed-power scaling of whole-plant respiration from seedlings to giant trees. Proc. Natl. Acad. Sci. USA 2010, 107, 1447–1451. [Google Scholar] [CrossRef] [PubMed] [Green Version]
- Cheng, D.L.; Li, T.; Zhong, Q.L.; Wang, G.X. Scaling relationship between tree respiration rates and biomass. Biol. Lett. 2010, 6, 715–717. [Google Scholar] [CrossRef] [Green Version]
- Huang, H.; Ran, J.; Ji, M.; Wang, Z.; Dong, L.; Hu, W.; Deng, Y.; Hou, C.; Niklas, K.J.; Deng, J. Water content quantitatively affects metabolic rates over the course of plant ontogeny. New Phytol. 2020, 228, 1524–1534. [Google Scholar] [CrossRef] [PubMed]
- Ye, X.; Lu, L.; Jiang, M.; Jia, J.; Li, W.; Wu, H.; Liao, Y.; Li, J. Metabolic scaling: Individual versus intraspecific scaling of Nile tilapia (Oreochromis niloticus). J. Comp. Physiol. B 2021, 191, 721–729. [Google Scholar] [CrossRef]
- Calder, W.A. Size, Function and Life History; Harvard University Press: Cambridge, MA, USA, 1984. [Google Scholar]
- Muchlinski, M.N.; Snodgrass, J.J.; Terranova, C.J. Muscle mass scaling in primates: An energetic and ecological perspective. Am. J. Primatol. 2012, 74, 395–407. [Google Scholar] [CrossRef]
- Stickland, N. Growth and development of muscle fibres in the rainbow trout (Salmo gairdneri). J. Anat. 1983, 137, 323–333. [Google Scholar] [PubMed]
- Owens, F.N.; Dubeski, P.; Hanson, C.F. Factors that alter the growth and development of ruminants. J. Anim. Sci. 1993, 71, 3138–3150. [Google Scholar] [CrossRef]
- Rehfeldt, C.; Fiedler, I.; Stickland, N.C. Number and size of muscle fibres in relation to meat production. In Muscle Development of Livestock Animals: Physiology, Genetics, and Meat Quality; Te Pas, M.F.W., Everts, M.E., Haagsman, H.P., Eds.; CABI Publishing: Wallingford, UK, 2004; pp. 1–37. [Google Scholar]
- White, R.B.; Biérinx, A.S.; Gnocchi, V.F.; Zammit, P.S. Dynamics of muscle fibre growth during postnatal mouse development. BMC Dev. Biol. 2010, 10, 21. [Google Scholar] [CrossRef] [Green Version]
- Chal, J.; Pourquié, O. Making muscle: Skeletal myogenesis in vivo and in vitro. Development 2017, 144, 2104–2122. [Google Scholar] [CrossRef] [PubMed] [Green Version]
- Johnston, I.A. Muscle development and growth: Potential implications for flesh quality in fish. Aquaculture 1999, 177, 99–115. [Google Scholar] [CrossRef]
- Biga, P.R.; Goetz, F.W. Zebrafish and giant danio as models for muscle growth: Determinate vs. indeterminate growth as determined by morphometric analysis. Am. J. Physiol. Reg. Integr. Comp. Physiol. 2006, 291, R1327–R1337. [Google Scholar] [CrossRef] [PubMed] [Green Version]
- Figueiredo, V.C. Revisiting the roles of protein synthesis during skeletal muscle hypertrophy induced by exercise. Am. J. Physiol. Reg., Integr. Comp. Physiol. 2019, 317, R709–R718. [Google Scholar] [CrossRef] [PubMed]
- Dingboom, E.G.; Weijs, W.A. The effect of growth and exercise on muscle characteristics in relation to meat quality. In Muscle Development of Livestock Animals: Physiology, Genetics and Meat Quality; te Pas, M.F.W., Everts, M.E., Haagsman, H.P., Eds.; CABI Publishing: Wallingford, UK, 2004; pp. 83–102. [Google Scholar]
- Huo, W.; Weng, K.; Gu, T.; Zhang, Y.; Zhang, Y.; Chen, G.; Xu, Q. Effect of muscle fiber characteristics on meat quality in fast-and slow-growing ducks. Poult. Sci. 2021, 100, 101264. [Google Scholar] [CrossRef]
- Cieri, R.L.; Dick, T.J.; Morris, J.S.; Clemente, C.J. Scaling of fibre area and fibre glycogen concentration in the hindlimb musculature of monitor lizards: Implications for locomotor performance with increasing body size. J. Exp. Biol. 2022, 225 (Suppl. 1), jeb243380. [Google Scholar] [CrossRef]
- Krebs, C.J.; Singleton, G.R. Indexes of condition for small mammals. Aust. J. Zool. 1993, 41, 317–323. [Google Scholar] [CrossRef] [Green Version]
- Everaert, N.; Decuypere, E.; Buyse, J. Adipose tissue and lipid metabolism. In Sturkie’s Avian Physiology, 7th ed.; Scanes, C.G., Dridi, S., Eds.; Academic Press: San Diego, CA, USA, 2022; pp. 627–640. [Google Scholar] [CrossRef]
- Hirsch, J.; Han, P.W. Cellularity of rat adipose tissue: Effects of growth, starvation, and obesity. J. Lipid Res. 1969, 10, 77–82. [Google Scholar] [CrossRef]
- Dipali, S.S.; Ferreira, C.R.; Zhou, L.T.; Pritchard, M.T.; Duncan, F.E. Histologic analysis and lipid profiling reveal reproductive age-associated changes in peri-ovarian adipose tissue. Reprod. Biol. Endocrinol. 2019, 17, 1–13. [Google Scholar] [CrossRef] [Green Version]
- Cartenì, F.; Deslauriers, A.; Rossi, S.; Morin, H.; De Micco, V.; Mazzoleni, S.; Giannino, F. The physiological mechanisms behind the earlywood-to-latewood transition: A process-based modeling approach. Front. Plant Sci. 2018, 9, 1053. [Google Scholar] [CrossRef]
- Glazier, D.S. Effects of metabolic level on the body size scaling of metabolic rate in birds and mammals. Proc. R. Soc. B Biol. Sci. 2008, 275, 1405–1410. [Google Scholar] [CrossRef] [PubMed] [Green Version]
- Glazier, D.S. Metabolic level and size scaling of rates of respiration and growth in unicellular organisms. Funct. Ecol. 2009, 23, 963–968. [Google Scholar] [CrossRef]
- Glazier, D.S. Ontogenetic body-mass scaling of resting metabolic rate covaries with species-specific metabolic level and body size in spiders and snakes. Comp. Biochem. Physiol. A Mol. Integr. Physiol. 2009, 153, 403–407. [Google Scholar] [CrossRef] [PubMed]
- Glazier, D.S. Effects of contingency versus constraints on the body-mass scaling of metabolic rate. Challenges 2018, 9, 4. [Google Scholar] [CrossRef] [Green Version]
- Glazier, D.S. Activity alters how temperature influences intraspecific metabolic scaling: Testing the metabolic-level boundaries hypothesis. J. Comp. Physiol. B 2020, 190, 445–454. [Google Scholar] [CrossRef]
- Gavrilov, V.M.; Golubeva, T.B.; Bushuev, A.V. Evolution of metabolic scaling among the tetrapod: Effect of phylogeny, the geologic time of class formation, and uniformity of species within a class. Integr. Zool. 2021, 17. [Google Scholar] [CrossRef]
- Dao, M.H. Reassessment of the cell surface area limitation to nutrient uptake in phytoplankton. Mar. Ecol. Prog. Ser. 2013, 489, 87–92. [Google Scholar] [CrossRef] [Green Version]
- Makarieva, A.M.; Gorshkov, V.G.; Li, B.L.; Chown, S.L.; Reich, P.B.; Gavrilov, V.M. Mean mass-specific metabolic rates are strikingly similar across life’s major domains: Evidence for life’s metabolic optimum. Proc. Natl. Acad. Sci. USA 2008, 105, 16994–16999. [Google Scholar] [CrossRef] [Green Version]
- DeLong, J.P.; Okie, J.G.; Moses, M.E.; Sibly, R.M.; Brown, J.H. Shifts in metabolic scaling, production, and efficiency across major evolutionary transitions of life. Proc. Natl. Acad. Sci. USA 2010, 107, 12941–12945. [Google Scholar] [CrossRef] [Green Version]
- Phillipson, J. Bioenergetic Options and Phylogeny. In Physiological Ecology: An Evolutionary Approach to Resource Use; Townsend, C.R., Calow, P., Eds.; Sinauer Associates: Sunderland, MA, USA, 1981; pp. 20–45. [Google Scholar]
- Else, P.L.; Hulbert, A.J. Mammals: An allometric study of metabolism at tissue and mitochondrial level. Am. J. Physiol. Regul. Integr. Comp. Physiol. 1985, 248, R415–R421. [Google Scholar] [CrossRef] [PubMed]
- Porter, R.K. Allometry of mammalian cellular oxygen consumption. Cell. Mol. Life Sci. 2001, 58, 815–822. [Google Scholar] [CrossRef] [PubMed]
- Weibel, E.R.; Hoppeler, H. Exercise-induced maximal metabolic rate scales with muscle aerobic capacity. J. Exp. Biol. 2005, 208, 1635–1644. [Google Scholar] [CrossRef] [Green Version]
- Snelling, E.P.; Seymour, R.S.; Runciman, S.; Matthews, P.G.; White, C.R. Symmorphosis and the insect respiratory system: Allometric variation. J. Exp. Biol. 2011, 214, 3225–3237. [Google Scholar] [CrossRef] [PubMed] [Green Version]
- Weibel, E.R.; Bacigalupe, L.D.; Schmitt, B.; Hoppeler, H. Allometric scaling of maximal metabolic rate in mammals: Muscle aerobic capacity as determinant factor. Resp. Physiol. Neurobiol. 2004, 140, 115–132. [Google Scholar] [CrossRef] [PubMed]
- Glazier, D.S. Activity affects intraspecific body-size scaling of metabolic rate in ectothermic animals. J. Comp. Physiol. B 2009, 179, 821–828. [Google Scholar] [CrossRef]
- Obroucheva, N.V. Cell elongation as an inseparable component of growth in terrestrial plants. Russ. J. Dev. Biol. 2008, 39, 13–24. [Google Scholar] [CrossRef]
- Milligan, L.P.; McBride, B. Energy costs of ion pumping by animal tissues. J. Nutr. 1985, 115, 1374–1382. [Google Scholar] [CrossRef]
- Rolfe, D.F.; Brown, G.C. Cellular energy utilization and molecular origin of standard metabolic rate in mammals. Physiol. Rev. 1997, 77, 731–758. [Google Scholar] [CrossRef] [Green Version]
- Jimenez, A.G.; Dillaman, R.M.; Kinsey, S.T. Large fibre size in skeletal muscle is metabolically advantageous. Nat. Comm. 2013, 4, 1–7. [Google Scholar] [CrossRef] [Green Version]
- Jimenez, A.G.; Williams, J.B. Differences in muscle fiber size and associated energetic costs in phylogenetically paired tropical and temperate birds. Physiol. Biochem. Zool. 2014, 87, 752–761. [Google Scholar] [CrossRef]
- West, G.B.; Brown, J.H. The origin of allometric scaling laws in biology from genomes to ecosystems: Towards a quantitative unifying theory of biological structure and organization. J. Exp. Biol. 2005, 208, 1575–1592. [Google Scholar] [CrossRef] [PubMed] [Green Version]
- Niklas, K.J.; Kutschera, U. Kleiber’s law: How the fire of life ignited debate, fueled theory, and neglected plants as model organisms. Plant Signal. Behav. 2015, 10, e1036216. [Google Scholar] [CrossRef] [PubMed]
- West, G.B.; Brown, J.H.; Enquist, B.J. A general model for the origin of allometric scaling laws in biology. Science 1997, 276, 122–126. [Google Scholar] [CrossRef] [PubMed]
- Banavar, J.R.; Moses, M.E.; Brown, J.H.; Damuth, J.; Rinaldo, A.; Sibly, R.M.; Maritan, A. A general basis for quarter-power scaling in animals. Proc. Natl. Acad. Sci. USA 2010, 107, 15816–15820. [Google Scholar] [CrossRef] [Green Version]
- Hirst, A.G.; Glazier, D.S.; Atkinson, D. Body shape shifting during growth permits tests that distinguish between competing geometric theories of metabolic scaling. Ecol. Lett. 2014, 17, 1274–1281. [Google Scholar] [CrossRef] [Green Version]
- Tan, H.; Hirst, A.G.; Glazier, D.S.; Atkinson, D. Ecological pressures and the contrasting scaling of metabolism and body shape in coexisting taxa: Cephalopods versus teleost fish. Philos. Trans. R. Soc. B 2019, 374, 20180543. [Google Scholar] [CrossRef]
- Sánchez-González, J.R.; Niciez, A.G. Declining metabolic scaling parallels an ontogenetic change from elongate to deep-bodied shapes in juvenile Brown trout. Curr. Zool. 2022, 68, zoac042. [Google Scholar] [CrossRef]
- Forlenza, A.; Galbraith, H.S.; Blakeslee, C.J.; Glazier, D.S. Ontogenetic changes in body shape and scaling of metabolic rate in the American eel (Anguilla rostrata). Physiol. Biochem. Zool. 2022, 95. [Google Scholar] [CrossRef]
- Brodribb, T.J.; Jordan, G.J.; Carpenter, R.J. Unified changes in cell size permit coordinated leaf evolution. New Phytol. 2013, 199, 559–570. [Google Scholar] [CrossRef]
- John, G.P.; Scoffoni, C.; Sack, L. Allometry of cells and tissues within leaves. Am. J. Bot. 2013, 100, 1936–1948. [Google Scholar] [CrossRef] [Green Version]
- Savage, V.M.; Allen, A.P.; Brown, J.H.; Gillooly, J.F.; Herman, A.B.; Woodruff, W.H.; West, G.B. Scaling of number, size, and metabolic rate of cells with body size in mammals. Proc. Natl. Acad. Sci. USA 2007, 104, 4718–4723. [Google Scholar] [CrossRef] [PubMed] [Green Version]
- Darveau, C.-A.; Suarez, R.K.; Andrews, R.D.; Hochachka, P.W. Allometric cascade as a unifying principle of body mass effects on metabolism. Nature 2002, 417, 166–170. [Google Scholar] [CrossRef] [PubMed]
- Suarez, R.K.; Darveau, C.-A. Multi-level regulation and metabolic scaling. J. Exp. Biol. 2005, 208, 1627–1634. [Google Scholar] [CrossRef] [Green Version]
- Glazier, D.S. Resource supply and demand both affect metabolic scaling: A response to Harrison. Trends Ecol. Evol. 2018, 33, 237–238. [Google Scholar] [CrossRef]
- Plant-Cell-cl-lula-Animal-Biology-Cells-Transparent-Background-png-Clipart. Available online: https://png.is/f/plant-cell-cl-lula-animal-biology-cells-transparent-background-png-clipart/comhiclipartbipqm-201909141105.html (accessed on 19 June 2022).
- Glazier, D.S.; Gring, J.P.; Holsopple, J.R.; Gjoni, V. Temperature effects on metabolic scaling of a keystone freshwater crustacean depend on fish-predation regime. J. Exp. Biol. 2020, 223, jeb232322. [Google Scholar] [CrossRef] [PubMed]
- Gjoni, V.; Basset, A.; Glazier, D.S. Temperature and predator cues interactively affect ontogenetic metabolic scaling of aquatic amphipods. Biol. Lett. 2020, 16, 20200267. [Google Scholar] [CrossRef]
- Bennett, M.D.; Leitch, I.J. Genome size evolution in plants. In The Evolution of the Genome; Gregory, T.R., Ed.; Elsevier Academic Press: Burlington, MA, USA, 2005; pp. 89–162. [Google Scholar]
- Chan, Y.H.M.; Marshall, W.F. Scaling properties of cell and organelle size. Organogenesis 2010, 6, 88–96. [Google Scholar] [CrossRef] [Green Version]
- Levy, D.L.; Heald, R. Mechanisms of intracellular scaling. Annu. Revi. Cell Dev. Biol. 2012, 28, 113–135. [Google Scholar] [CrossRef] [Green Version]
- Reber, S.; Goehring, N.W. Intracellular scaling mechanisms. Cold Spring Harb. Perspect. Biol. 2015, 7, a019067. [Google Scholar] [CrossRef] [Green Version]
- Miettinen, T.P.; Björklund, M. Mitochondrial function and cell size: An allometric relationship. Trends Cell Biol. 2017, 27, 393–402. [Google Scholar] [CrossRef]
- Heald, R.; Gibeaux, R. Subcellular scaling: Does size matter for cell division? Curr. Opin. Cell Biol. 2018, 52, 88–95. [Google Scholar] [CrossRef] [PubMed]
- Marshall, W.F. Scaling of subcellular structures. Annu. Rev. Cell Dev. Biol. 2020, 36, 219. [Google Scholar] [CrossRef] [PubMed]
- Chen, P.; Levy, D.L. Regulation of organelle size and organization during development. Semin. Cell Dev. Biol. 2022. [Google Scholar] [CrossRef]
- Kooijman, S.A.L.M. Dynamic Energy and Mass Budgets in Biological Systems; Cambridge University Press: Cambridge, UK, 2000. [Google Scholar]
- Maino, J.L.; Kearney, M.R.; Nisbet, R.M.; Kooijman, S.A. Reconciling theories for metabolic scaling. J. Anim. Ecol. 2014, 83, 20–29. [Google Scholar] [CrossRef] [Green Version]
- von Bertalanffy, L.; Pirozynski, W.J. Tissue respiration, growth, and basal metabolism. Biol. Bull. 1953, 105, 240–256. [Google Scholar] [CrossRef]
- Kleiber, M. The Fire of Life; Wiley: New York, NY, USA, 1961. [Google Scholar]
- Chaui-Berlinck, J.G.; Navas, C.A.; Monteiro, L.H.A.; Bicudo, J.E.P.W. Control of metabolic rate is a hidden variable in the allometric scaling of homeotherms. J. Exp. Biol. 2005, 208, 1709–1716. [Google Scholar] [CrossRef] [Green Version]
- Hill, D.J.; Han, V.K.M. Control of cellular multiplication and differentiation. In Fetal Growth; Sharp, F., Fraser, R.B., Milner, R.D.G., Eds.; Springer: London, UK, 1989; pp. 83–98. [Google Scholar]
- Neufeld, T.P.; De La Cruz, A.F.A.; Johnston, L.A.; Edgar, B.A. Coordination of growth and cell division in the Drosophila wing. Cell 1998, 93, 1183–1193. [Google Scholar] [CrossRef] [Green Version]
- Conlon, I.; Raff, M. Size control in animal development. Cell 1999, 96, 235–244. [Google Scholar] [CrossRef] [Green Version]
- Mizukami, Y.; Fischer, R.L. Plant organ size control: AINTEGUMENTA regulates growth and cell numbers during organogenesis. Proc. Natl. Acad. Sci. USA 2000, 97, 942–947. [Google Scholar] [CrossRef] [Green Version]
- Álvarez, B.; Moreno, S. Fission yeast Tor2 promotes cell growth and represses cell differentiation. J. Cell Sci. 2006, 119, 4475–4485. [Google Scholar] [CrossRef] [Green Version]
- Horvath, B.M.; Magyar, Z.; Zhang, Y.; Hamburger, A.W.; Bako, L.; Visser, R.G.; Bachem, C.W.; Bögre, L. EBP1 regulates organ size through cell growth and proliferation in plants. EMBO J. 2006, 25, 4909–4920. [Google Scholar] [CrossRef] [PubMed]
- Breuer, C.; Ishida, T.; Sugimoto, K. Developmental control of endocycles and cell growth in plants. Curr. Opin. Plant Biol. 2010, 13, 654–660. [Google Scholar] [CrossRef] [PubMed]
- Zhu, J.; Thompson, C.B. Metabolic regulation of cell growth and proliferation. Nat. Rev. Mol. Cell Biol. 2019, 20, 436–450. [Google Scholar] [CrossRef] [PubMed]
- Ricklefs, R.E.; Shea, R.E.; Choi, I.H. Inverse relationship between functional maturity and exponential growth rate of avian skeletal muscle: A constraint on evolutionary response. Evolution 1994, 48, 1080–1088. [Google Scholar] [CrossRef] [PubMed]
- Mueller, C.A.; Augustine, S.; Kooijman, S.A.; Kearney, M.R.; Seymour, R.S. The trade-off between maturation and growth during accelerated development in frogs. Comp. Biochem. Physiol. A Mol. Integr. Physiol. 2012, 163, 95–102. [Google Scholar] [CrossRef]
- Drummond-Barbosa, D.; Spradling, A.C. Stem cells and their progeny respond to nutritional changes during Drosophila oogenesis. Dev. Biol. 2001, 231, 265–278. [Google Scholar] [CrossRef] [PubMed] [Green Version]
- Post, J.R.; Lee, J.A. Metabolic ontogeny of teleost fishes. Can. J. Fish. Aquat. Sci. 1996, 53, 910–923. [Google Scholar] [CrossRef]
- Glazier, D.S. Biological scaling analyses are more than statistical line fitting. J. Exp. Biol. 2021, 224, jeb241059. [Google Scholar] [CrossRef]
- Rubin, H. Cell aging in vivo and in vitro. Mech. Ageing Dev. 1997, 98, 1–35. [Google Scholar] [CrossRef]
- Yang, J.; Dungrawala, H.; Hua, H.; Manukyan, A.; Abraham, L.; Lane, W.; Mead, H.; Wright, J.; Schneider, B.L. Cell size and growth rate are major determinants of replicative lifespan. Cell Cycle 2011, 10, 144–155. [Google Scholar] [CrossRef] [Green Version]
- Patra, K.C.; Bardeesy, N. A cell size theory of aging. Dev. Cell 2018, 45, 665–666. [Google Scholar] [CrossRef] [PubMed] [Green Version]
- Zadrag-Tecza, R.; Kwolek-Mirek, M.; Alabrudzińska, M.; Skoneczna, A. Cell size influences the reproductive potential and total lifespan of the Saccharomyces cerevisiae yeast as revealed by the analysis of polyploid strains. Oxid. Med. Cell. Longev. 2018, 2018, 1898421. [Google Scholar] [CrossRef] [PubMed] [Green Version]
- Neurohr, G.E.; Terry, R.L.; Lengefeld, J.; Bonney, M.; Brittingham, G.P.; Moretto, F.; Miettinen, T.P.; Vaites, L.P.; Soares, L.M.; Paulo, J.A.; et al. Excessive cell growth causes cytoplasm dilution and contributes to senescence. Cell 2019, 176, 1083–1097. [Google Scholar] [CrossRef] [PubMed] [Green Version]
- De Cuyper, C.; Vanfleteren, J.R. Oxygen consumption during development and aging of the nematode Caenorhabditis elegans. Comp. Biochem. Physiol. A Physiol. 1982, 73, 283–289. [Google Scholar] [CrossRef]
- Sutcliffe, D.W. Quantitative aspects of oxygen uptake by Gammarus (Crustacea, Amphipoda): A critical review. Freshw. Biol. 1984, 14, 443–489. [Google Scholar] [CrossRef]
- Poehlman, E.T.; Goran, M.I.; Gardner, A.W.; Ades, P.A.; Arciero, P.J.; Katzman-Rooks, S.M.; Montgomery, S.M.; Toth, M.J.; Sutherland, P.T. Determinants of decline in resting metabolic rate in aging females. Am. J. Physiol. Endocrinol. Metab. 1993, 264, E450–E455. [Google Scholar] [CrossRef]
- Piers, L.S.; Soares, M.J.; McCormack, L.M.; O’Dea, K. Is there evidence for an age-related reduction in metabolic rate? J. Appl. Physiol. 1998, 85, 2196–2204. [Google Scholar] [CrossRef]
- Sukhotin, A.A.; Abele, D.; Pörtner, H.O. Growth, metabolism and lipid peroxidation in Mytilus edulis: Age and size effects. Mar. Ecol. Prog. Ser. 2002, 226, 223–234. [Google Scholar] [CrossRef]
Figure 1.
Means (red dots) and ranges (dark vertical bands) of cell size (log10 µm2; data from [71]) in relation to metabolic level (L) of six major taxonomic groups of multicellular organisms. Mean cell sizes (number of species sampled in parentheses) are indicated (based on epidermal cells in the angiosperms, and erythrocytes in the animal taxa). Low L ≈ −2.3; medium L ≈ −1.5 to −1.1; high L ≈ 0 to −0.5 (L = log10 mL O2 g−1 h−1 at midpoint of log10 body-mass range; data from Figure 3 in [29]). Note the apparent negative correlation between cell size and L, as expected from cell-size surface area theory (see text). The especially small cell sizes observed for mammals may be in part due to their erythrocytes having no nuclei. Cell size also appears to be positively related to the metabolic scaling exponents (b) of these taxa (angiosperms: 1.06; fishes: 0.88; amphibians: 0.88; reptiles: 0.76; birds: 0.64; mammals: 0.68; data from [29,50]; see also Section 2.3.5).

Figure 2.
Schematic representation of how various cellular modes of body growth (cell-size expansion, cell multiplication, and cell multiplication with cell-size reduction) should affect the ontogenetic scaling of metabolic rate with body volume or mass (scaling exponent b = loglinear slope), according to cell-size metabolic scaling theory (see text and [23,24,27]). If both cell expansion and multiplication occur during growth, b should be between 2/3 and 1.

Figure 3.
Means (±95% confidence intervals) of intraspecific metabolic scaling exponents (b) for various taxa of pelagic and benthic animals and protists. The trilobite b values were estimated using the eye-facet method of [24,31] and cell-size metabolic theory [23,24,27] (data from [72]). The b values for various taxa of invertebrates [80] and for the pelagic protist Didinium nasutum [88] and the benthic protist Stentor coeruleus [89] at two different temperatures are based on actual measurements of oxygen consumption rate, a proxy for metabolic rate. Note that the b values for pelagic species tend to be near 1, whereas those for the benthic species tend to be closer to 2/3. Some of these differences may relate to extensive use of cell multiplication during growth of pelagic species versus extensive use of cell expansion during growth of benthic species, a hypothesis that requires testing (see also text).

Figure 4.
Ontogenetic shifts in metabolic scaling tend to be associated with rapid growth in early postembryonic development and slower growth in later development [9,14]. Additional possible processes involved in these ontogenetic shifts are changes from mainly cell multiplication to cell expansion and increases in proportions of tissues with relatively low metabolic rates [9,14]. These two processes may be linked, at least in part, by the ontogenetic development of larger cells with more metabolically inert materials, as in animal adipose tissues and structural tissues in vascular plants (see also Figure 6).

Figure 5.
Ontogenetic shifts in metabolic scaling from egg to adult may relate to changes in the cellular mode of growth. During embryonic development, cell multiplication proceeds rapidly with little or no gain in biomass, thus causing large increases in total cellular SA relative to total biomass, thus enabling increases in mass-specific metabolic rate that result in hypermetric metabolic scaling (metabolic scaling exponent b > 1: red line). During early postembryonic development, rapid cell multiplication continues, but with parallel rapid gains in biomass, which enables total cellular SA relative to total biomass to stay approximately constant, thus supporting isometric metabolic scaling (b~1, brown line). During late postembryonic development, cell multiplication ceases or diminishes greatly, whereas cell expansion dominates somatic growth, such that total cellular SA relative to total biomass decreases, thus resulting in hypometric metabolic scaling (b < 1: blue line). See also Figure 2. Fish larva drawing from [139]. Adult fish drawing from [140].

Figure 6.
Schematic representation of the two-phase ontogeny of adipocytes (fat cells). Early in ontogeny, many small fat cells are produced, which according to cell surface area theory should have relatively high mass-specific metabolic rates (see Section 2.1.1). Later in ontogeny, these small fat cells enlarge as they become filled with lipid deposits, which should have a relatively low mass-specific metabolic rate due to their reduced surface area per volume and the accumulation of metabolically inert fat deposits (see Section 2.3.3). Hypothetically, the development of many large adipocytes with metabolically inert fat deposits should help cause a lower whole-body mass-specific metabolic rate, and thus contribute to a hypometric ontogenetic body-mass scaling of metabolic rate (slope b < 1).

Figure 7.
Schematic representation of how cell size (depicted by sizes of circles) may affect R/M (metabolic rate of an individual organism or species at a specific body mass), L (metabolic level or log mass-specific metabolic rate at the midpoint of the log body-mass range; as such, this measure represents the vertical elevation of a metabolic scaling relationship) and b (the loglinear slope of the scaling relationship). Note that all of the effects depicted are logically consistent and thus compatible with each other.

Figure 8.
Schematic representation of how cell size (depicted by sizes of circles) may affect the metabolic scaling slope (b) when comparing scaling relationships with the same L (metabolic level or log mass-specific metabolic rate at the midpoint of the log body-mass range) and thus common midpoint (according to the mechanism posited by [36]). Note the discrepancy between the effects of cell size on R/M (mass-specific metabolic rate) above versus below the midpoint of the scaling lines.

Figure 9.
Summary of effects of cell size and expansion on mass-specific organismal metabolic rate, classified according to the major modal mechanisms of the contextual multimodal theory (CMT) of metabolic scaling [14,18], including surface area (SA) theory, resource transport (RT) theory, system composition (SC) theory, and resource demand (RD) theory. SA and RT mechanisms limit resource supply, whereas SC and RD mechanisms relate to resource demand. Cell picture from [198].


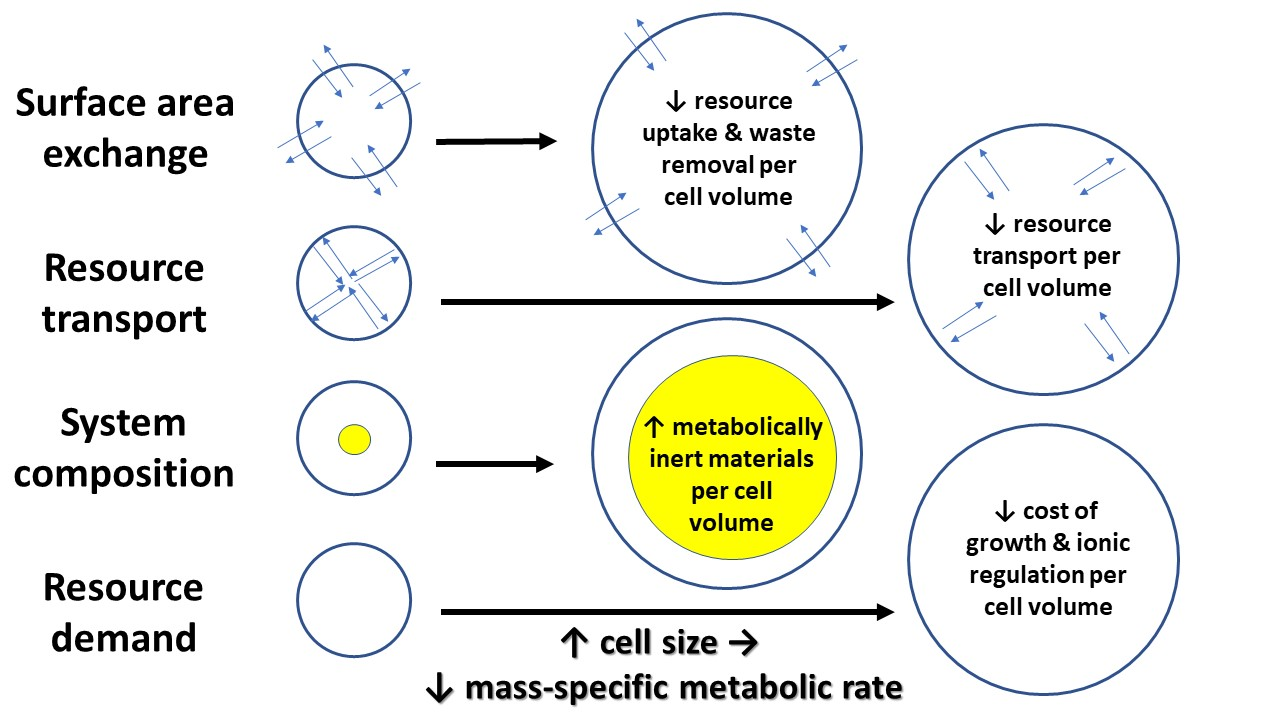
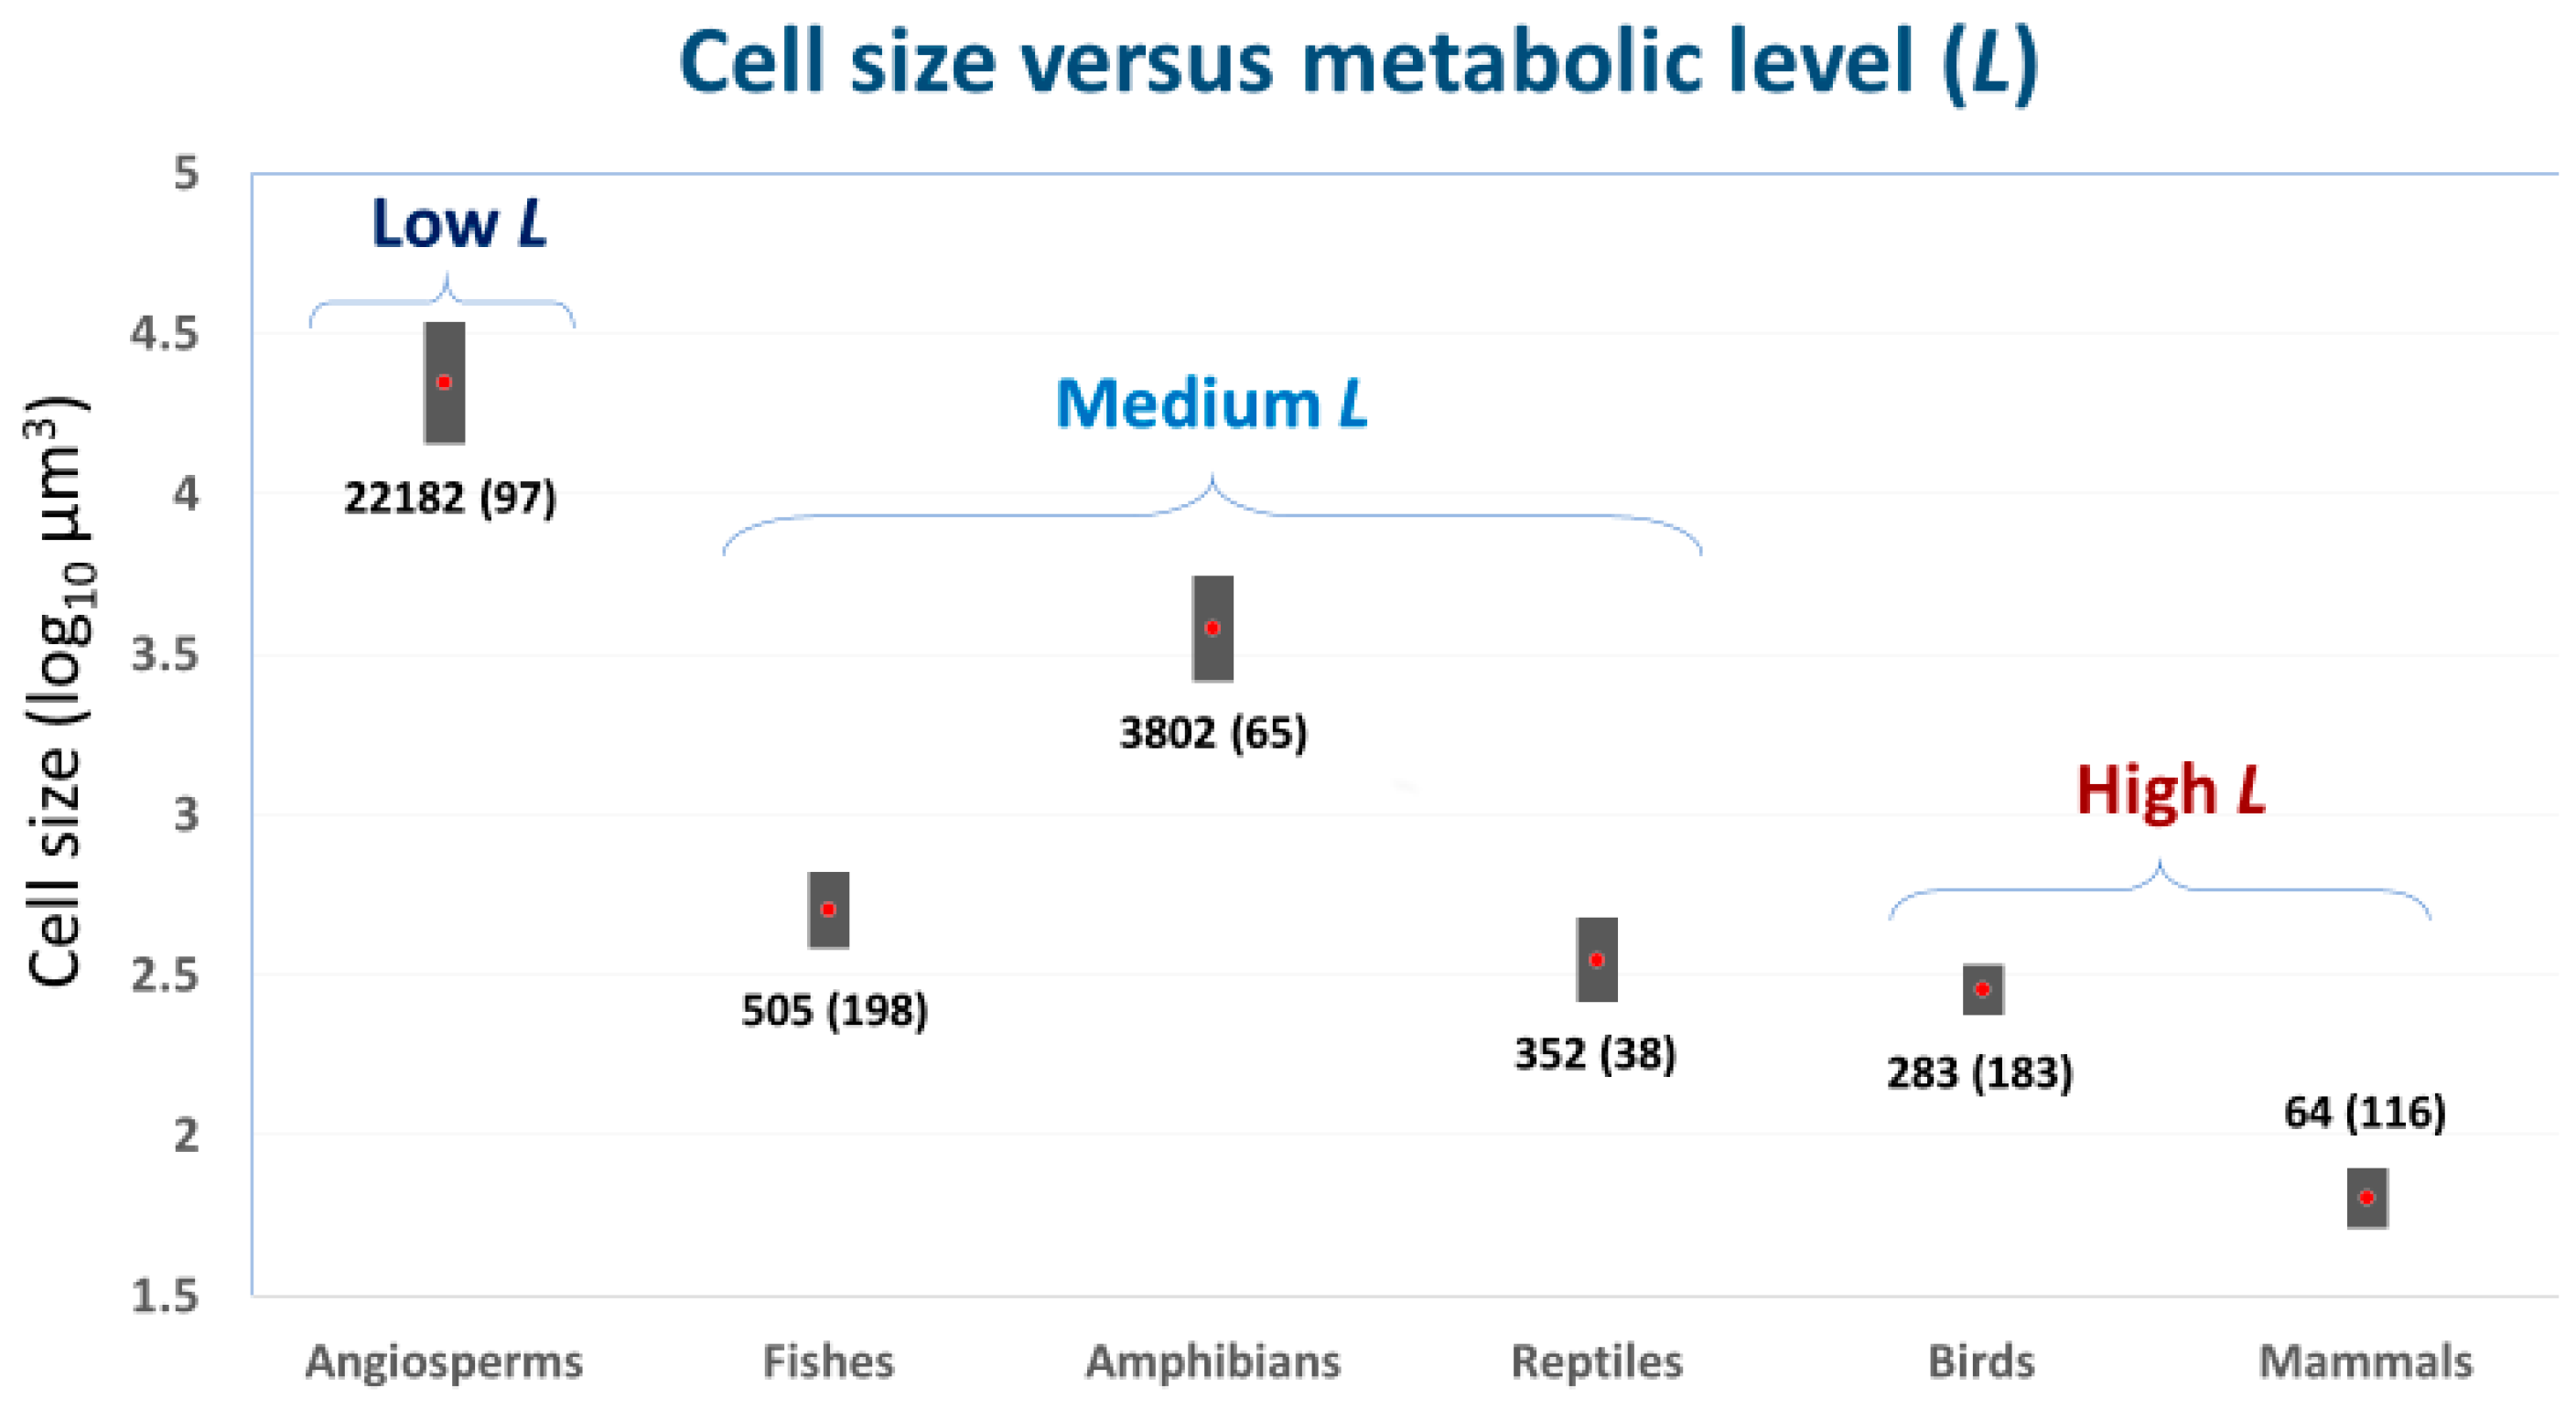
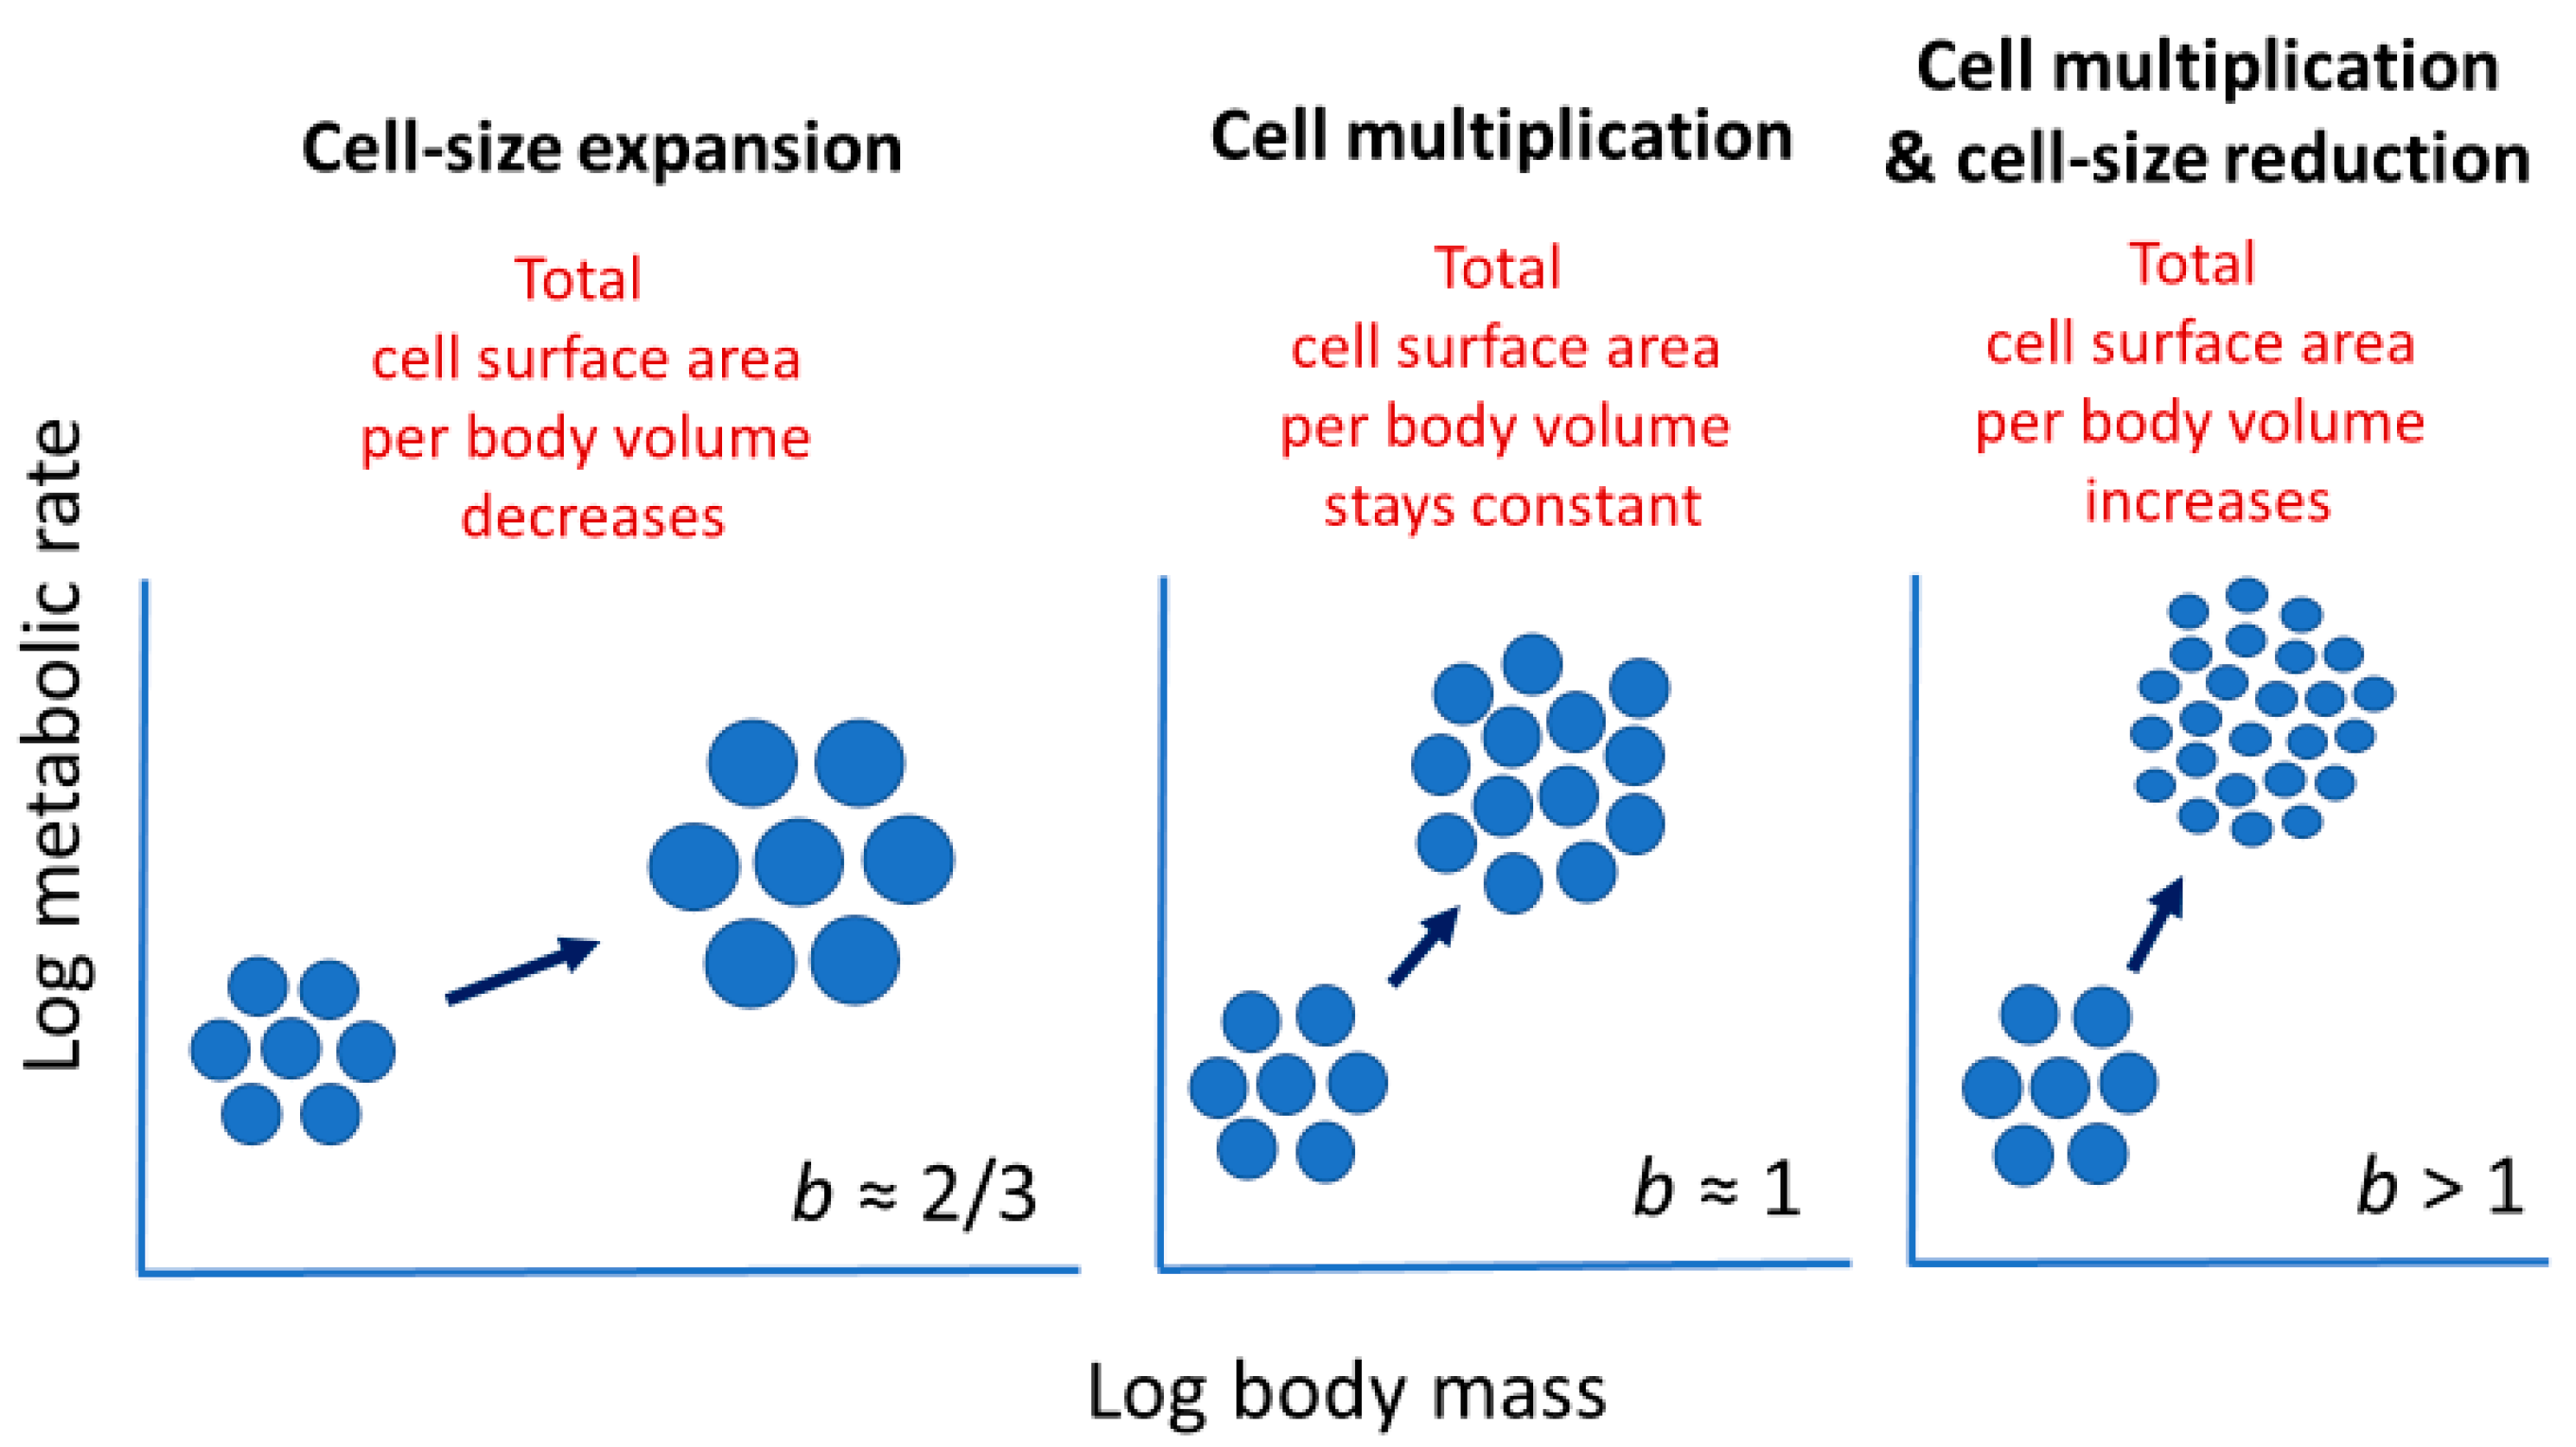
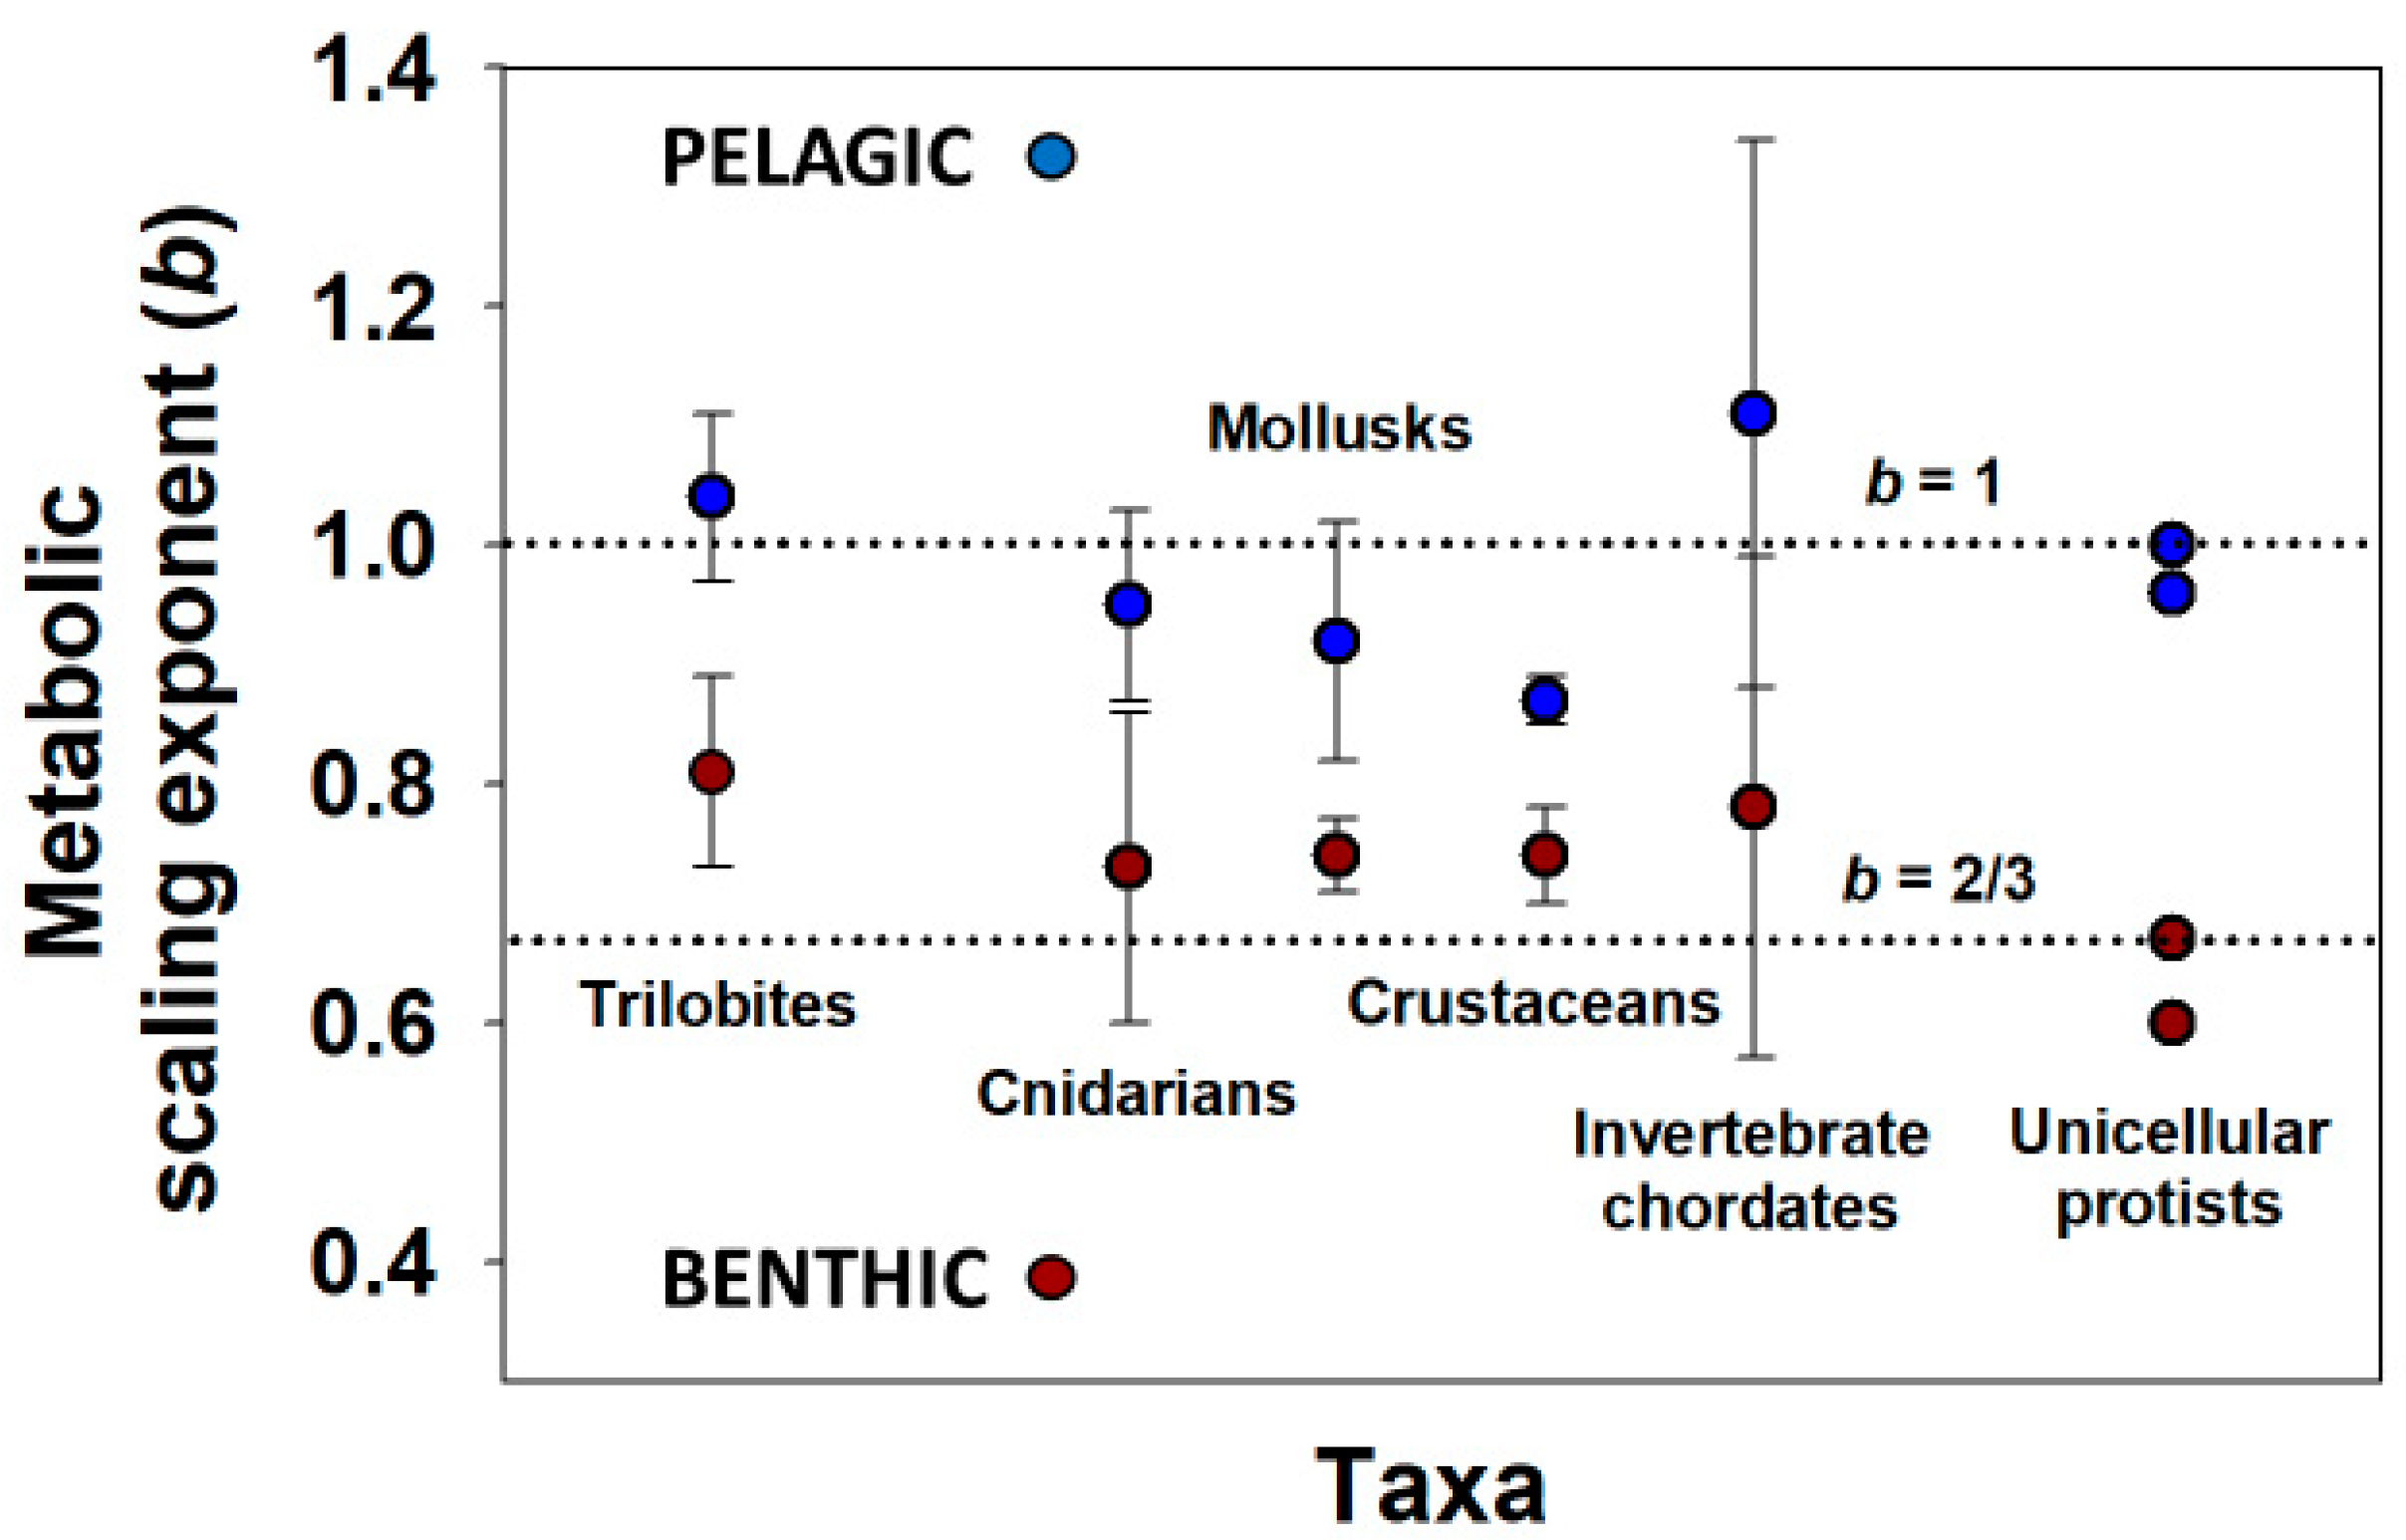
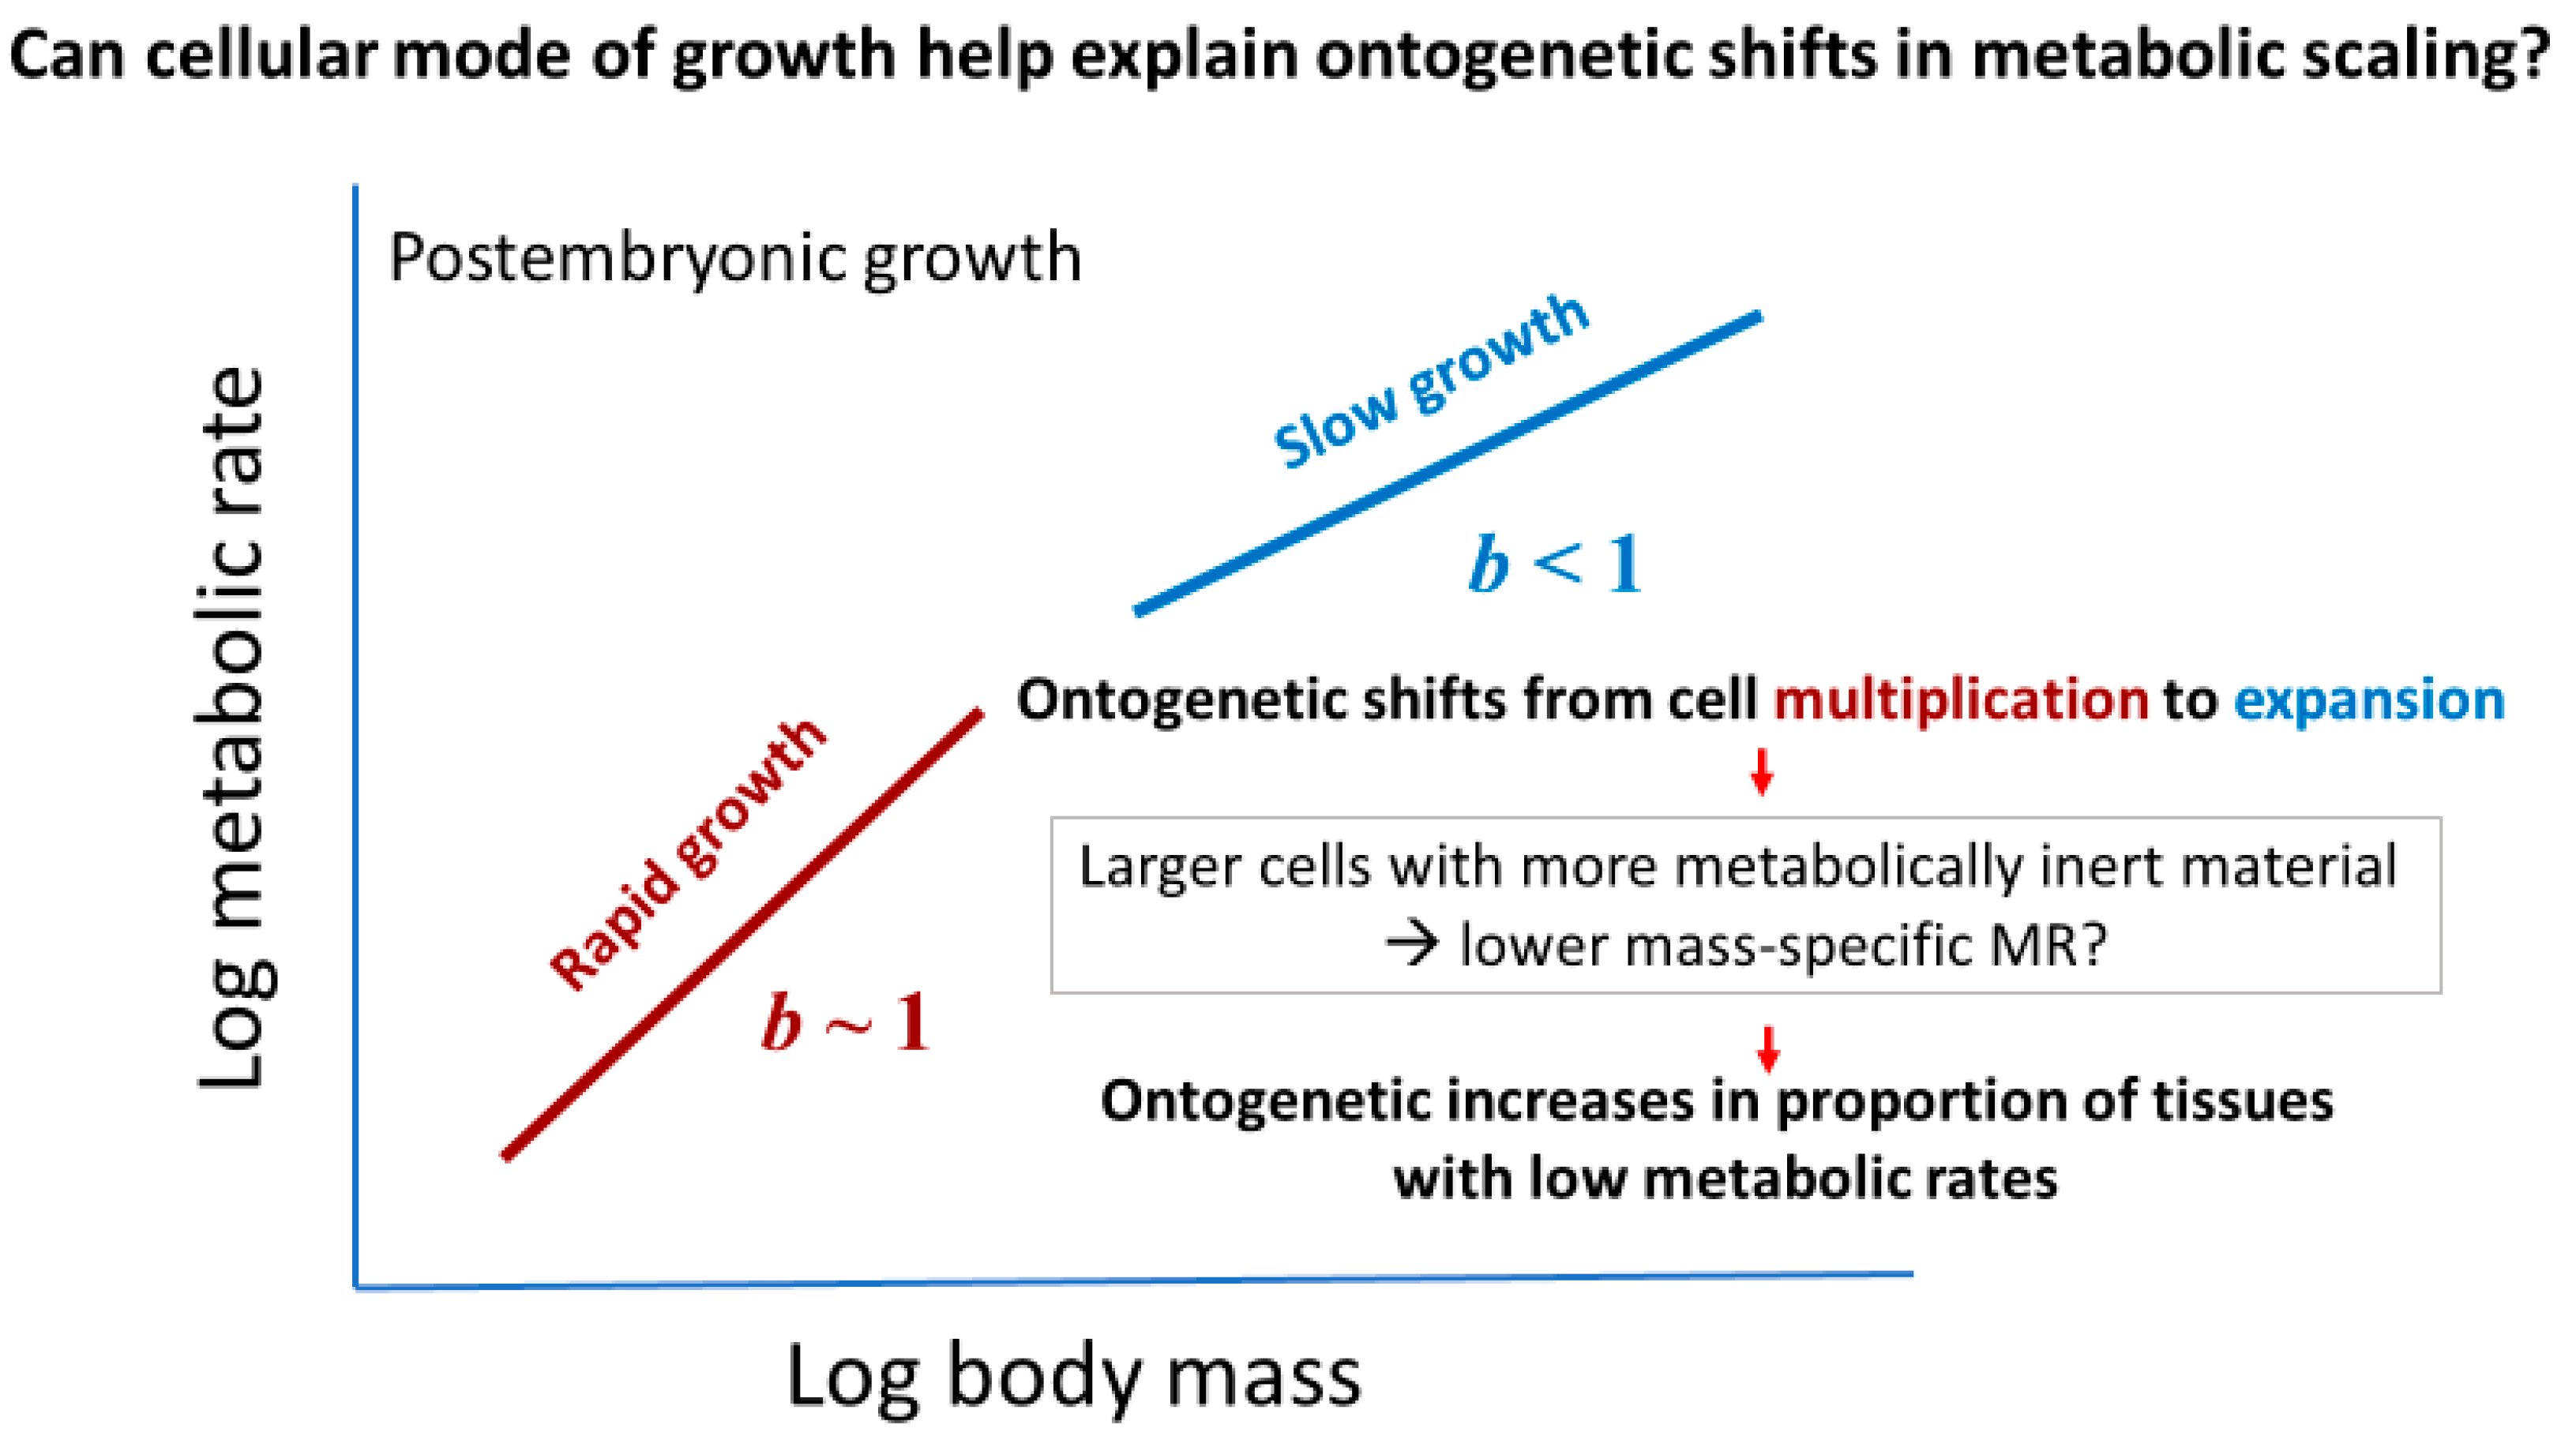
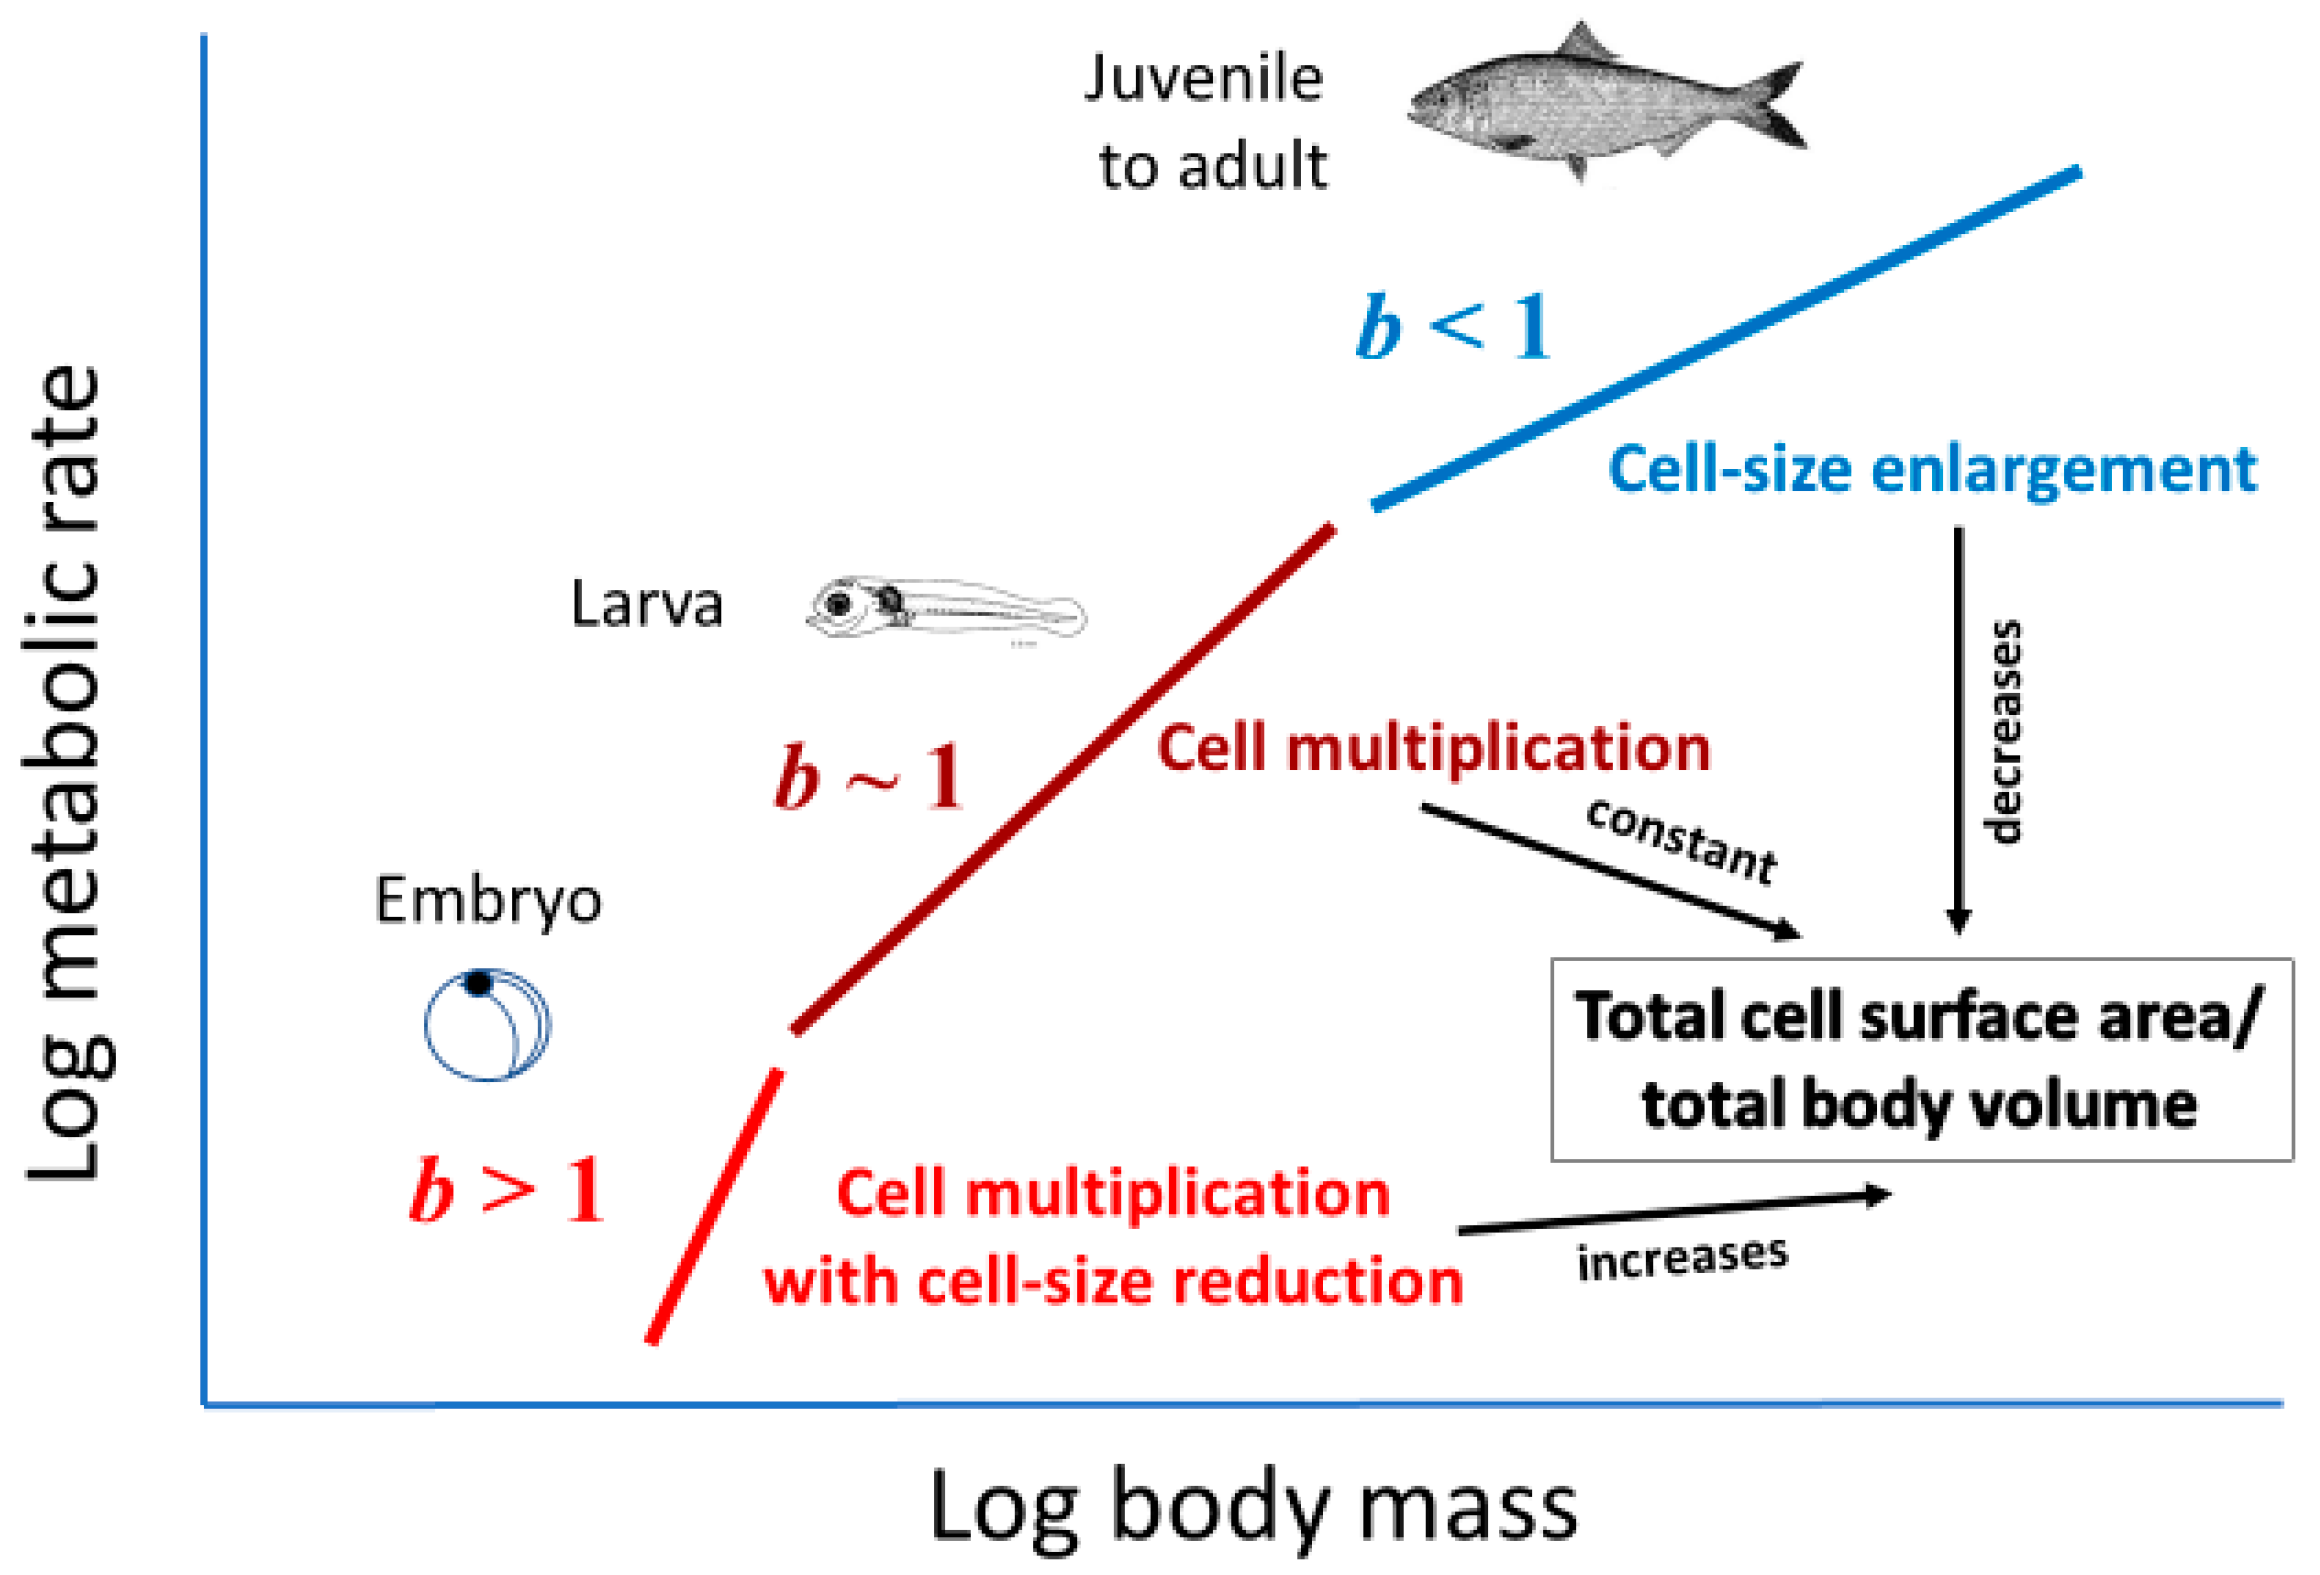
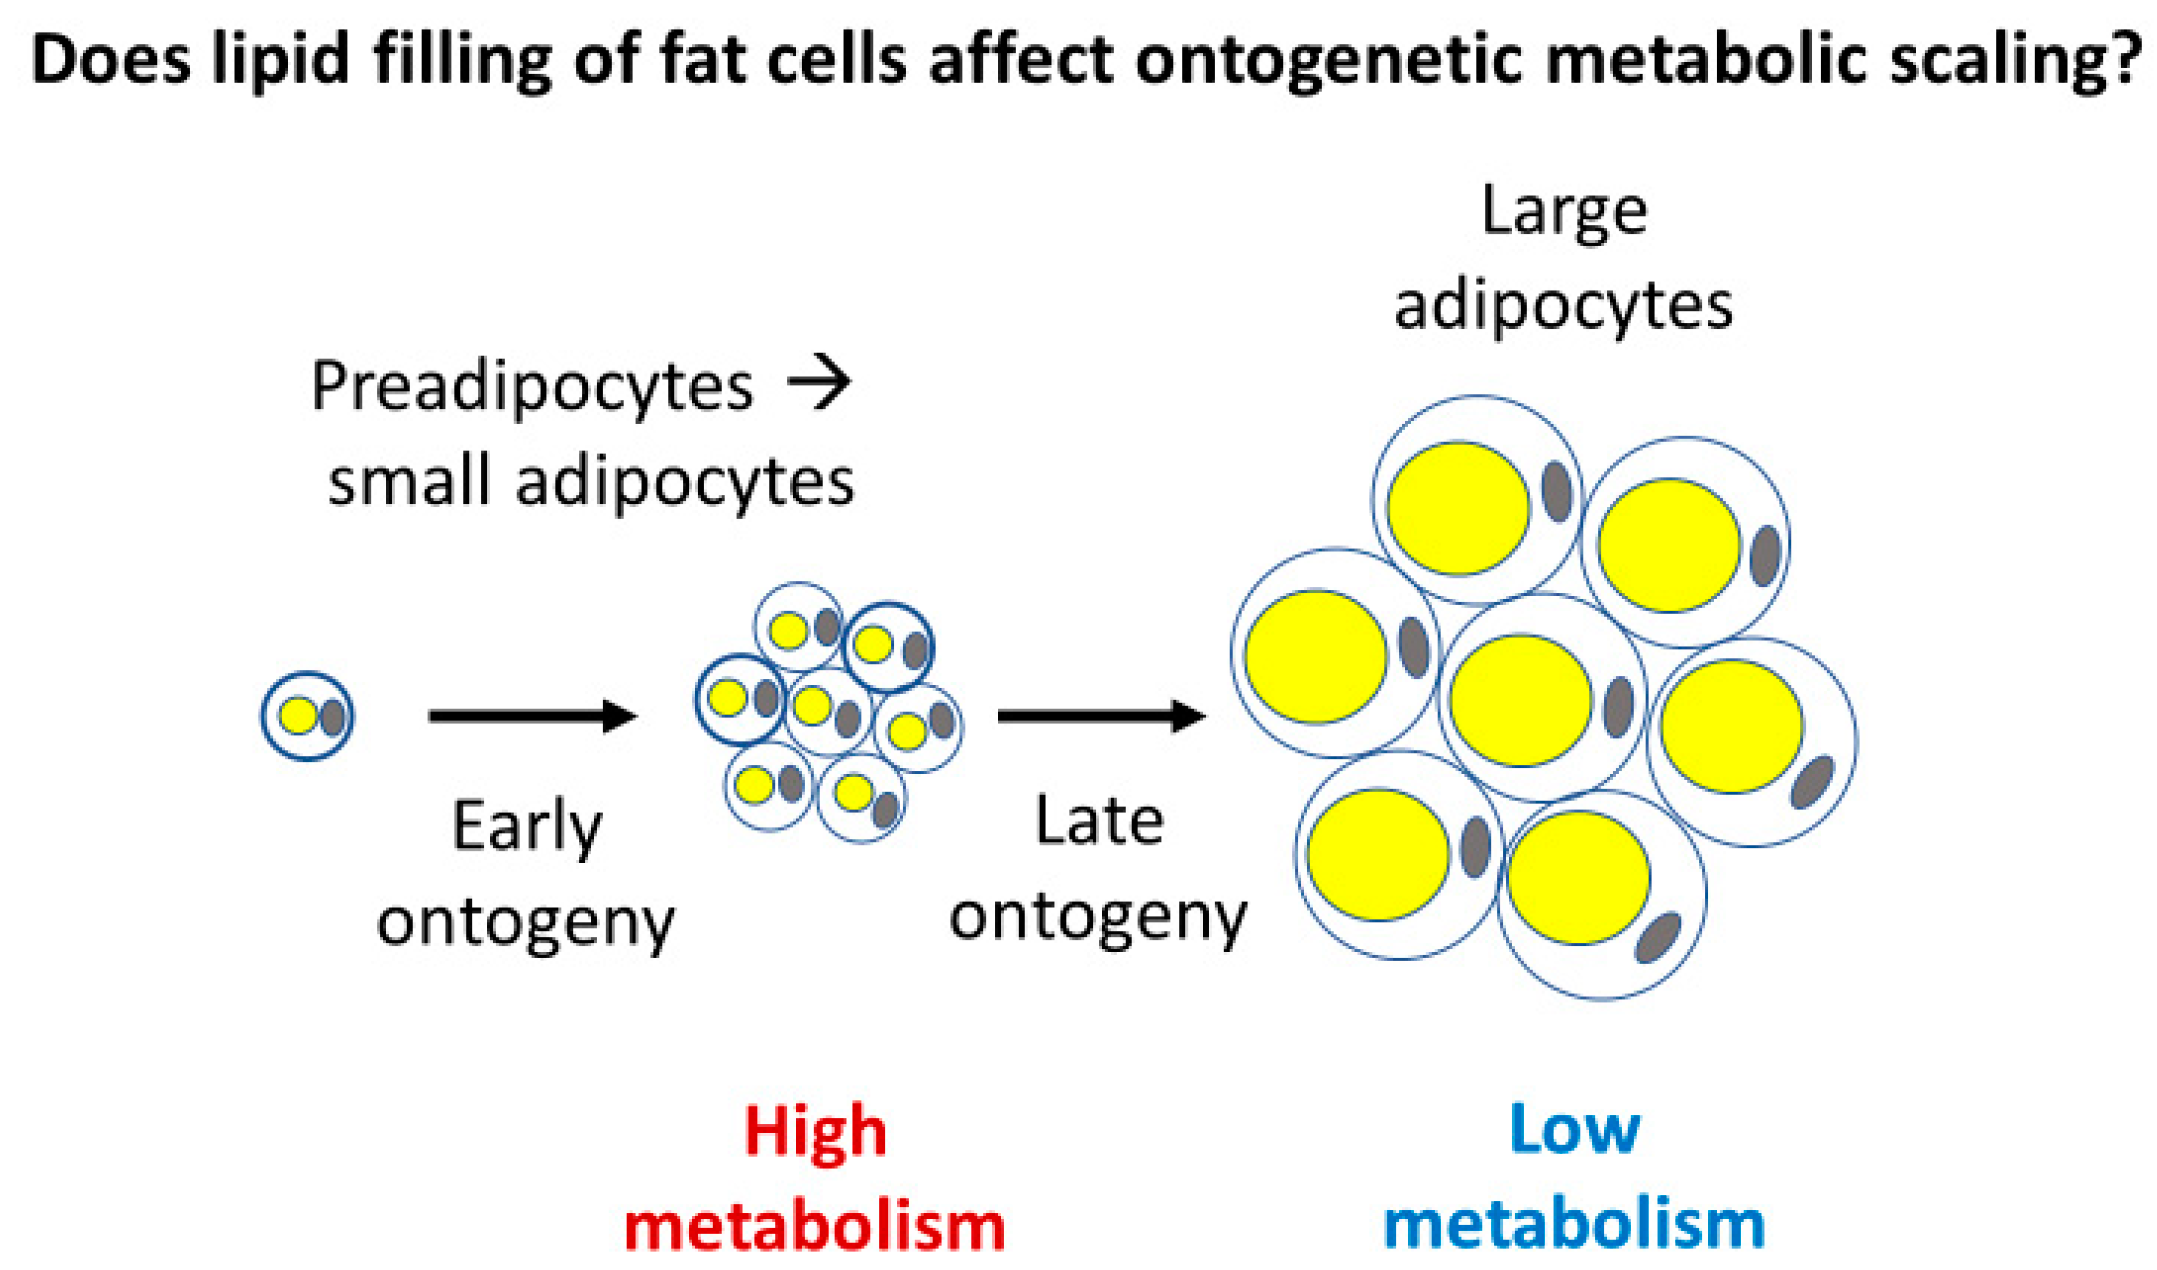
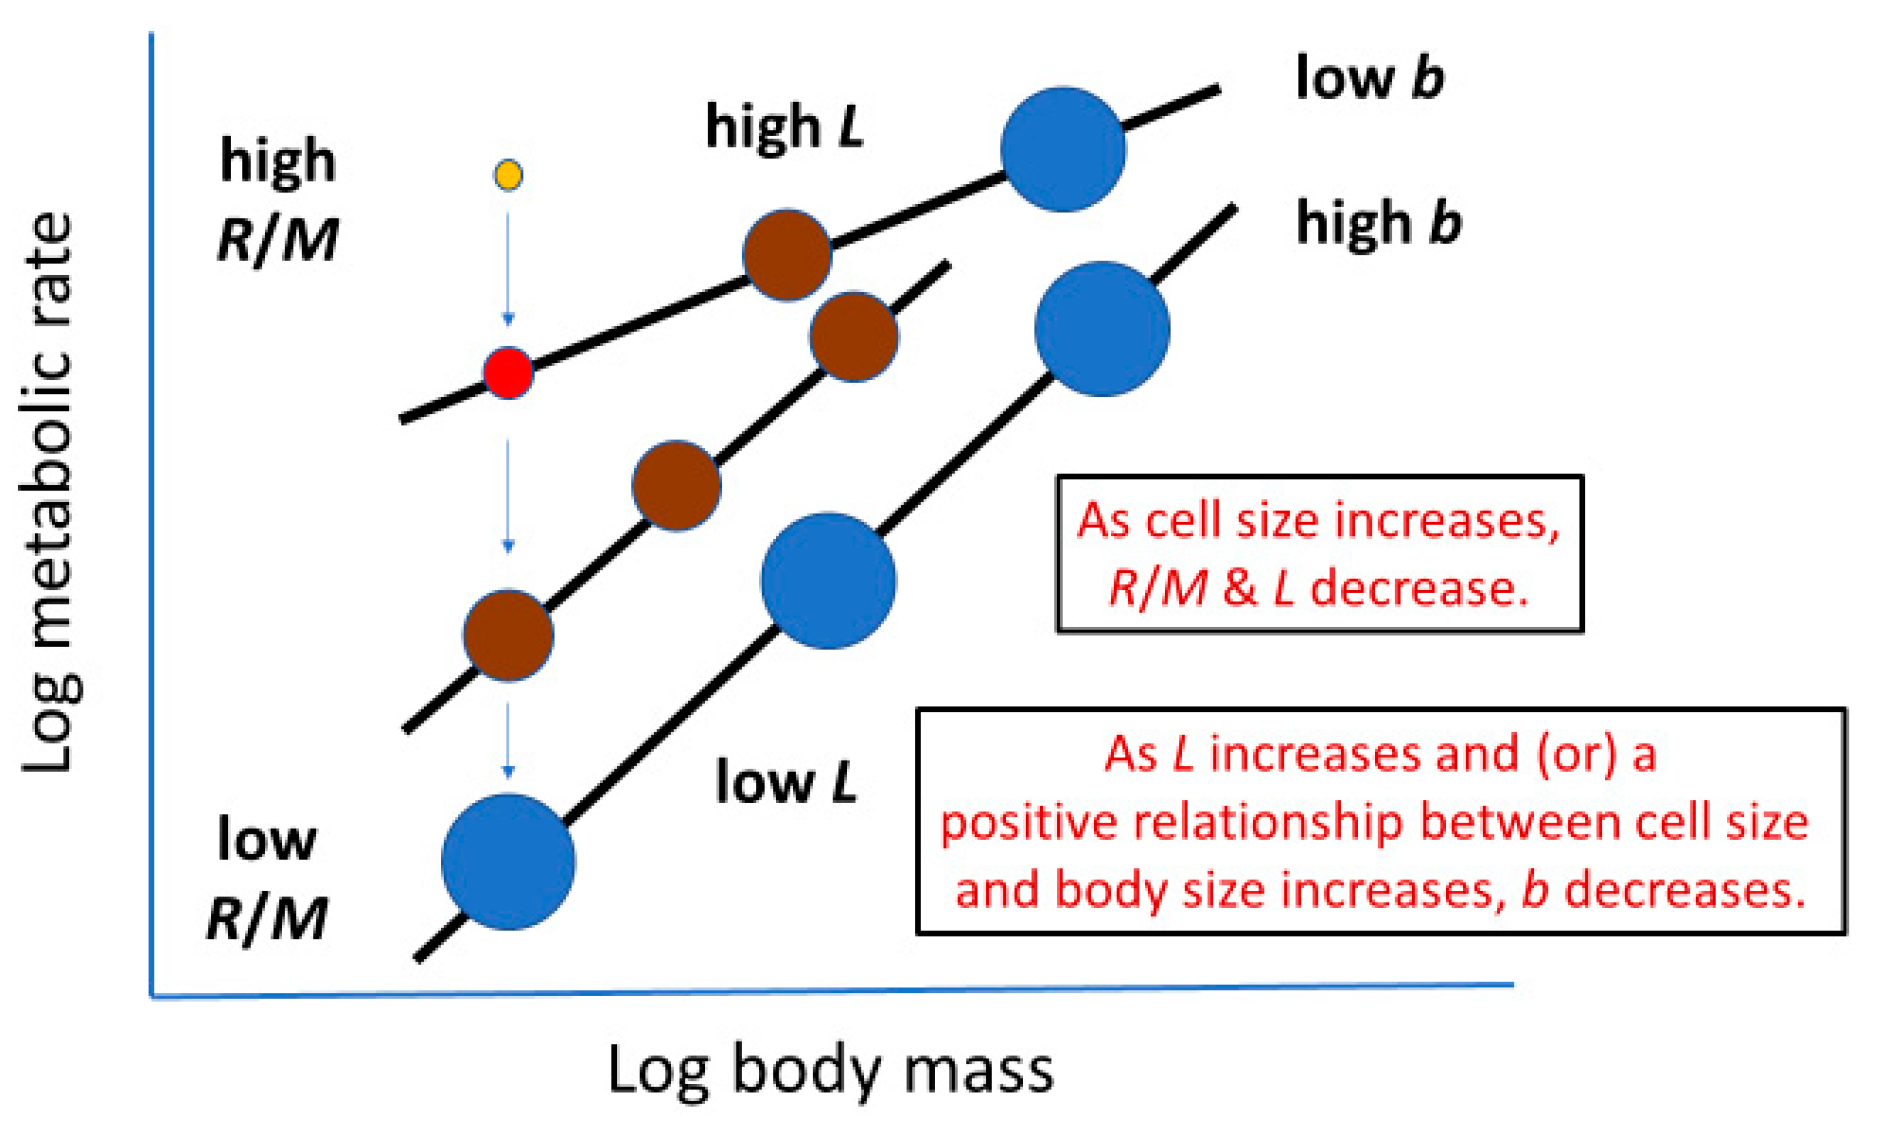
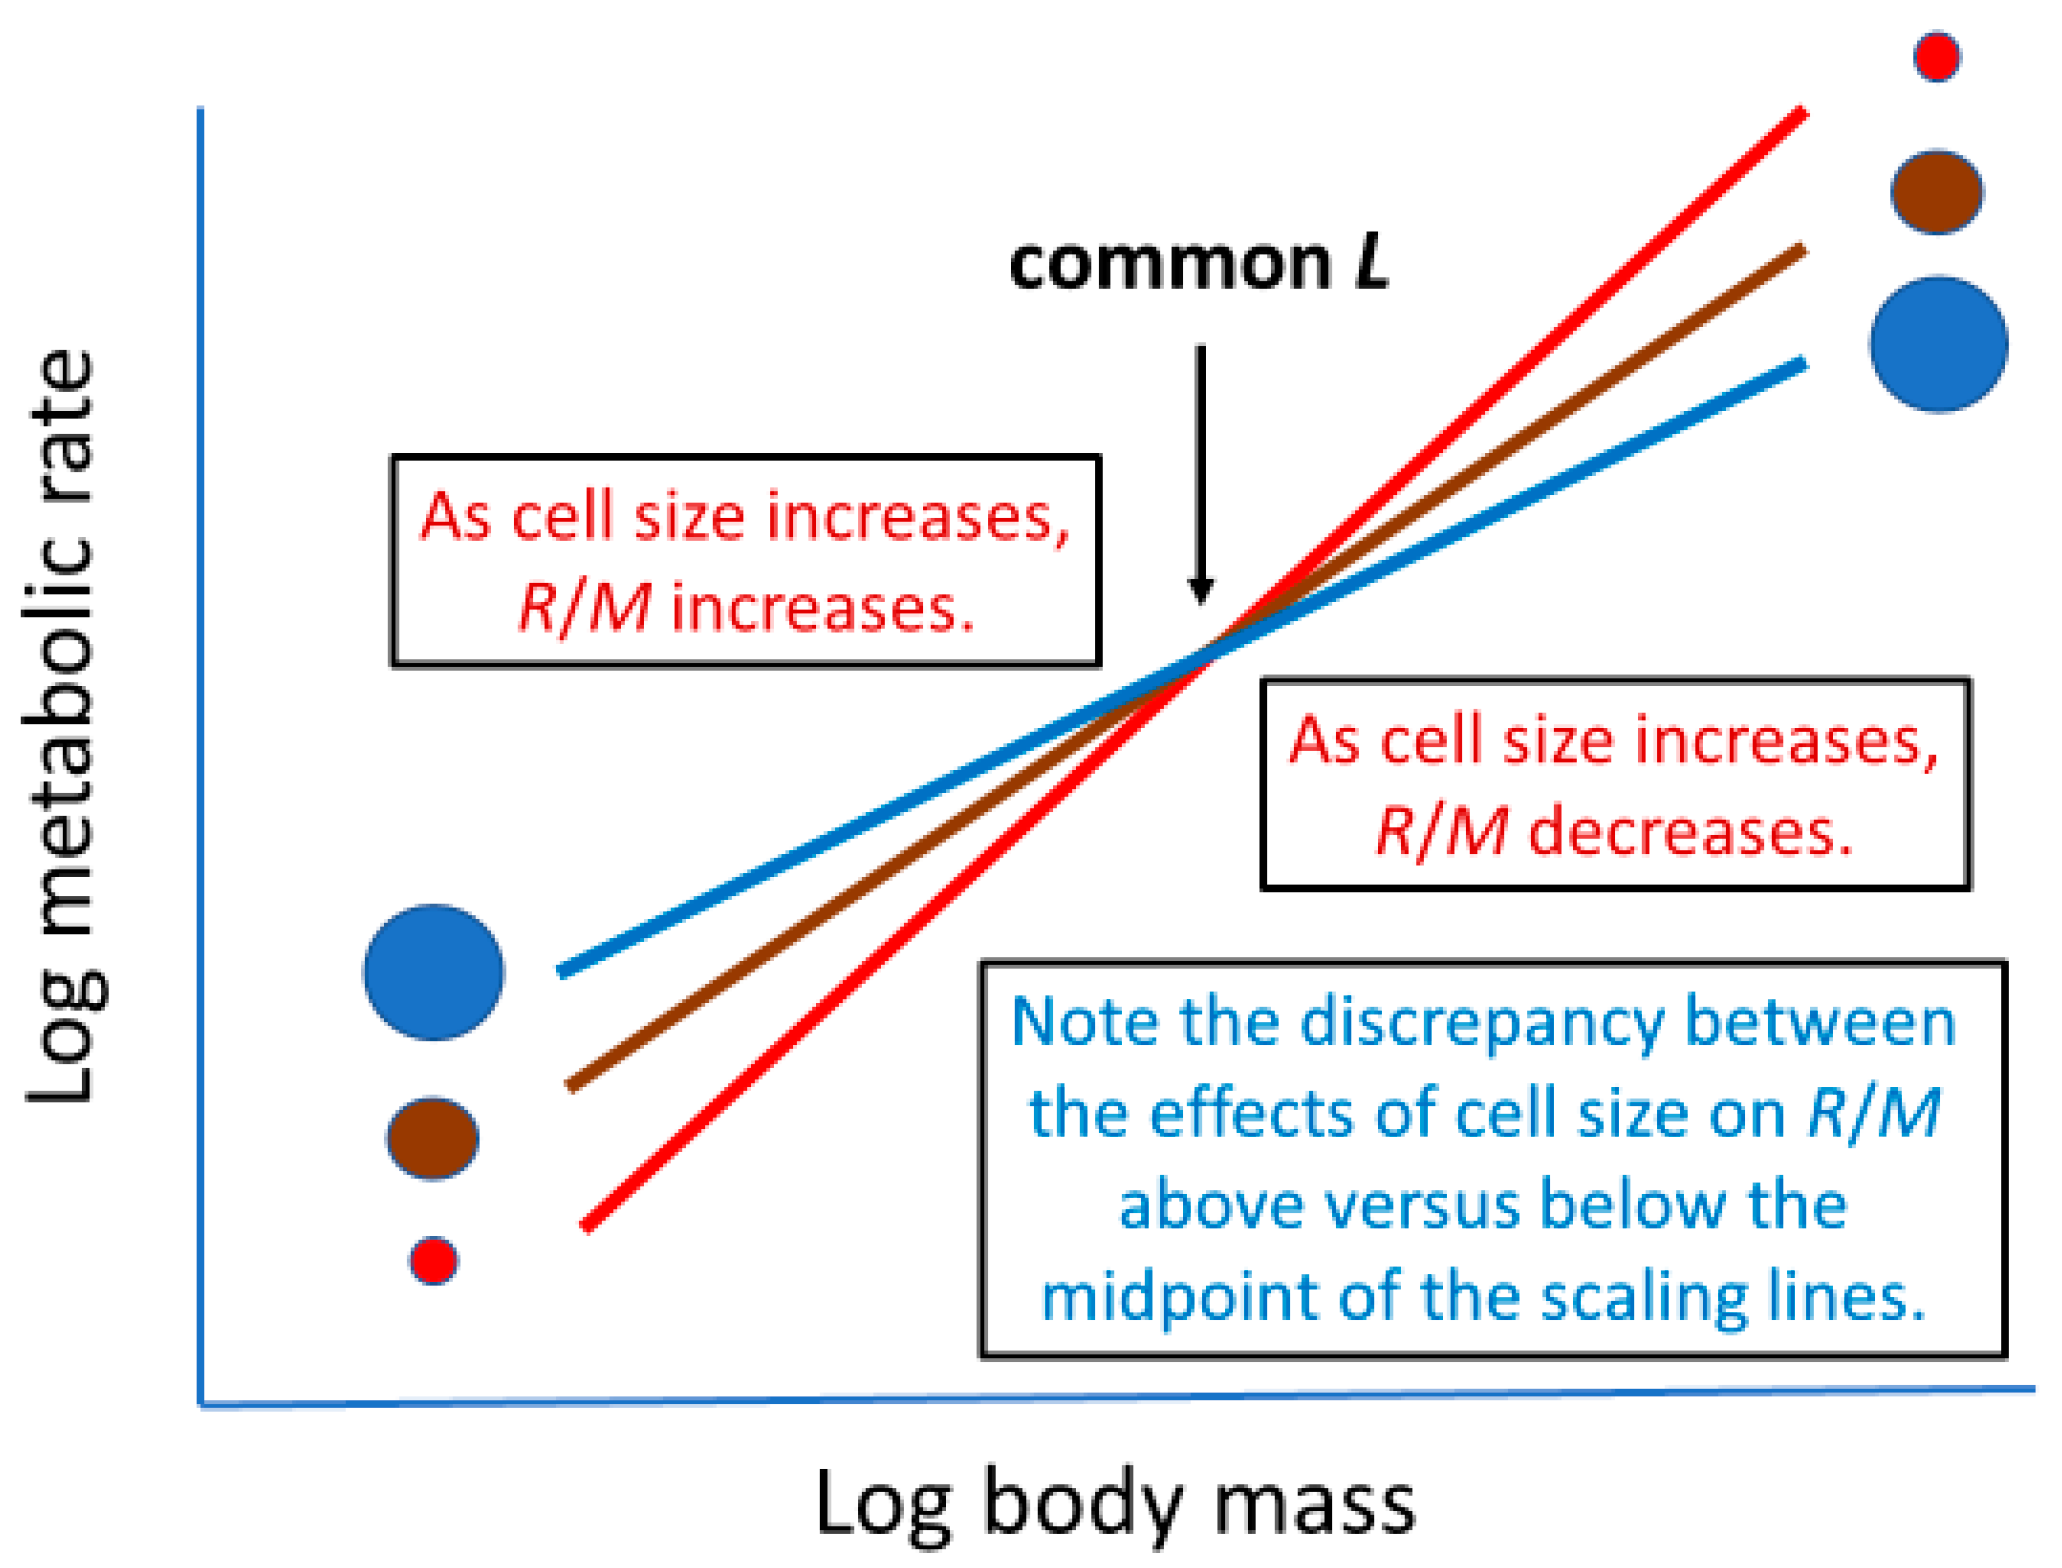
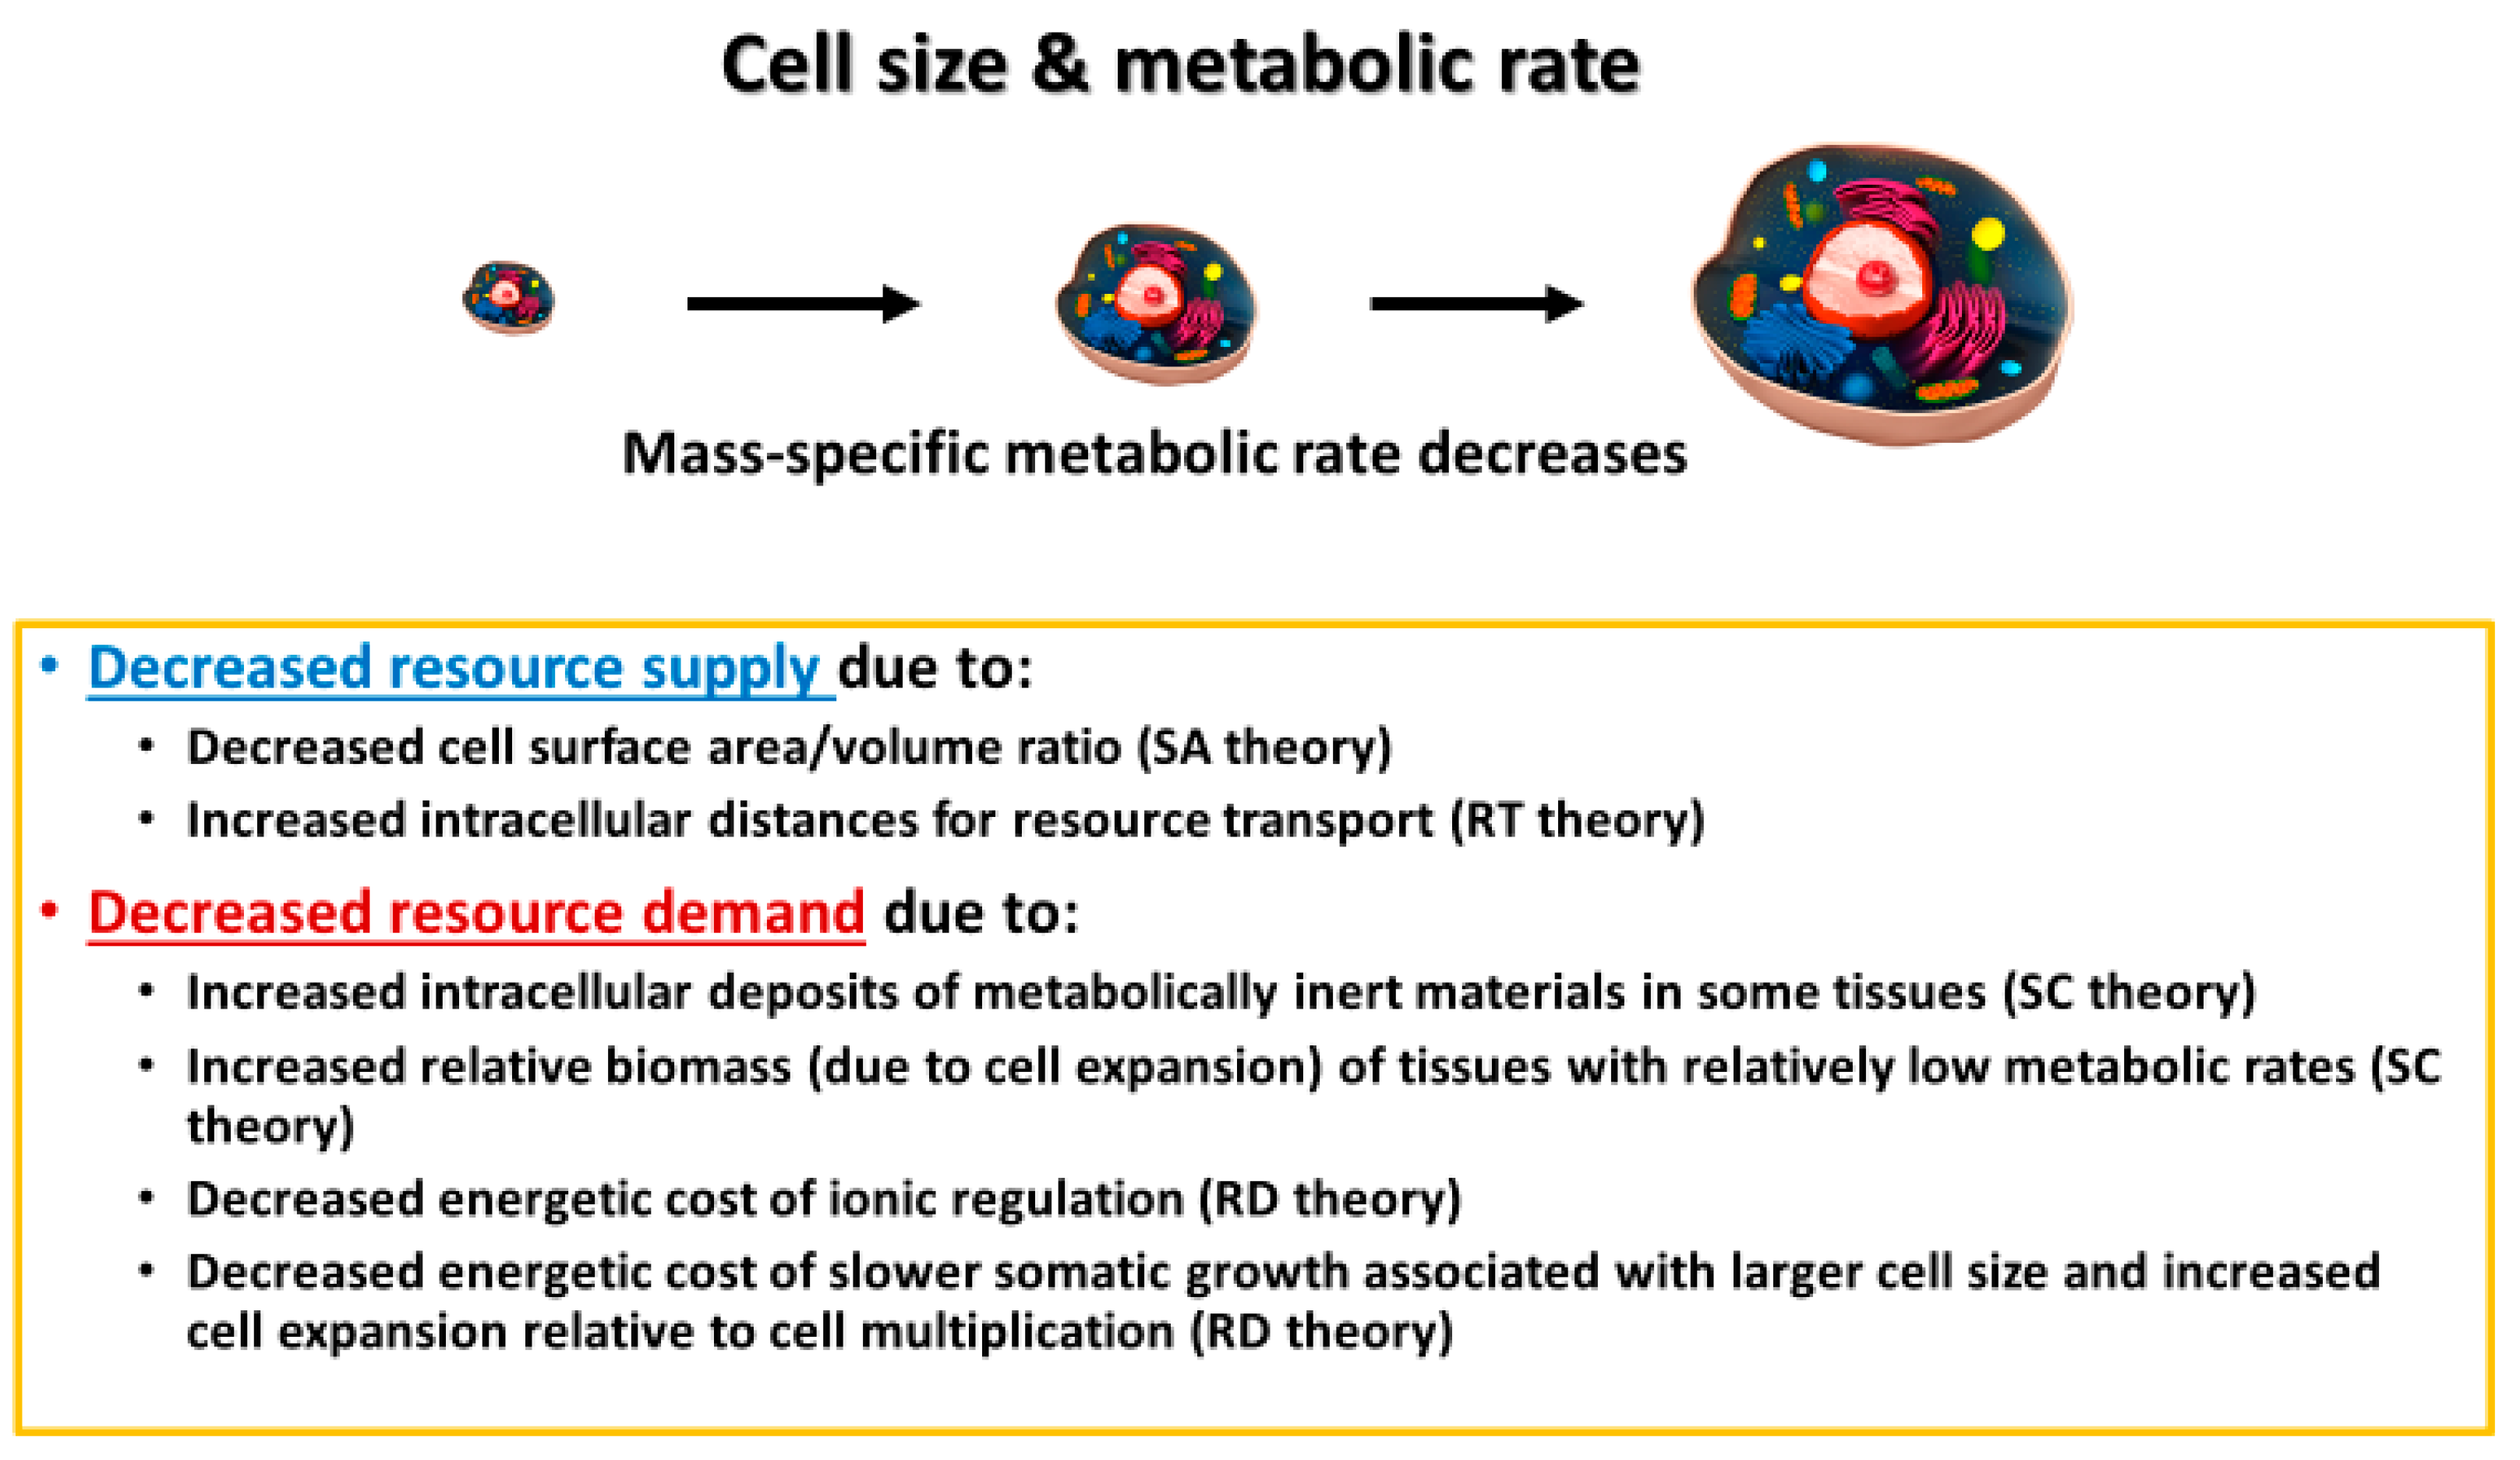
Table 1.
Multiple ways that whole-body metabolic rate and its scaling with body mass may relate to cell size.
Table 1.
Multiple ways that whole-body metabolic rate and its scaling with body mass may relate to cell size.
| Metabolic Effect | Possible Mode of Effect | Sources |
|---|---|---|
| Mass-specific or mass-corrected metabolic rate | Cellular SA/V geometry 1,2 | [22,23,25,26,27,28] |
| Metabolic level (L) of body-mass scaling relationship 3 | Cellular SA/V geometry 2 | [29] [present study] |
| Metabolic scaling slope (b) | Cellular mode of growth and/or changes in cell composition | [23,24,27] [present study] |
| Total cellular SA of body | [21,36] | |
| Relative influences of cellular and organismal SA vs. organismal V, as mediated by metabolic level (L) | [29,36] |
1 SA = surface area; V = volume. 2 Other possible mechanisms (e.g., cell composition, intracellular resource transport, and heterogeneity in cell size) are discussed in Section 3.2 and Section 3.3. 3 L = mass-specific metabolic rate at the geometric midpoint of the log body-mass range of a metabolic scaling relationship [29,50,51,52].
Publisher’s Note: MDPI stays neutral with regard to jurisdictional claims in published maps and institutional affiliations. |
© 2022 by the author. Licensee MDPI, Basel, Switzerland. This article is an open access article distributed under the terms and conditions of the Creative Commons Attribution (CC BY) license (https://creativecommons.org/licenses/by/4.0/).
Share and Cite
MDPI and ACS Style
Glazier, D.S. How Metabolic Rate Relates to Cell Size. Biology 2022, 11, 1106. https://doi.org/10.3390/biology11081106
AMA Style
Glazier DS. How Metabolic Rate Relates to Cell Size. Biology. 2022; 11(8):1106. https://doi.org/10.3390/biology11081106
Chicago/Turabian StyleGlazier, Douglas S. 2022. "How Metabolic Rate Relates to Cell Size" Biology 11, no. 8: 1106. https://doi.org/10.3390/biology11081106
Note that from the first issue of 2016, this journal uses article numbers instead of page numbers. See further details here.