
Rapid Response to Experimental Warming of a Microbial Community Inhabiting High Arctic Patterned Ground Soil
 , , and
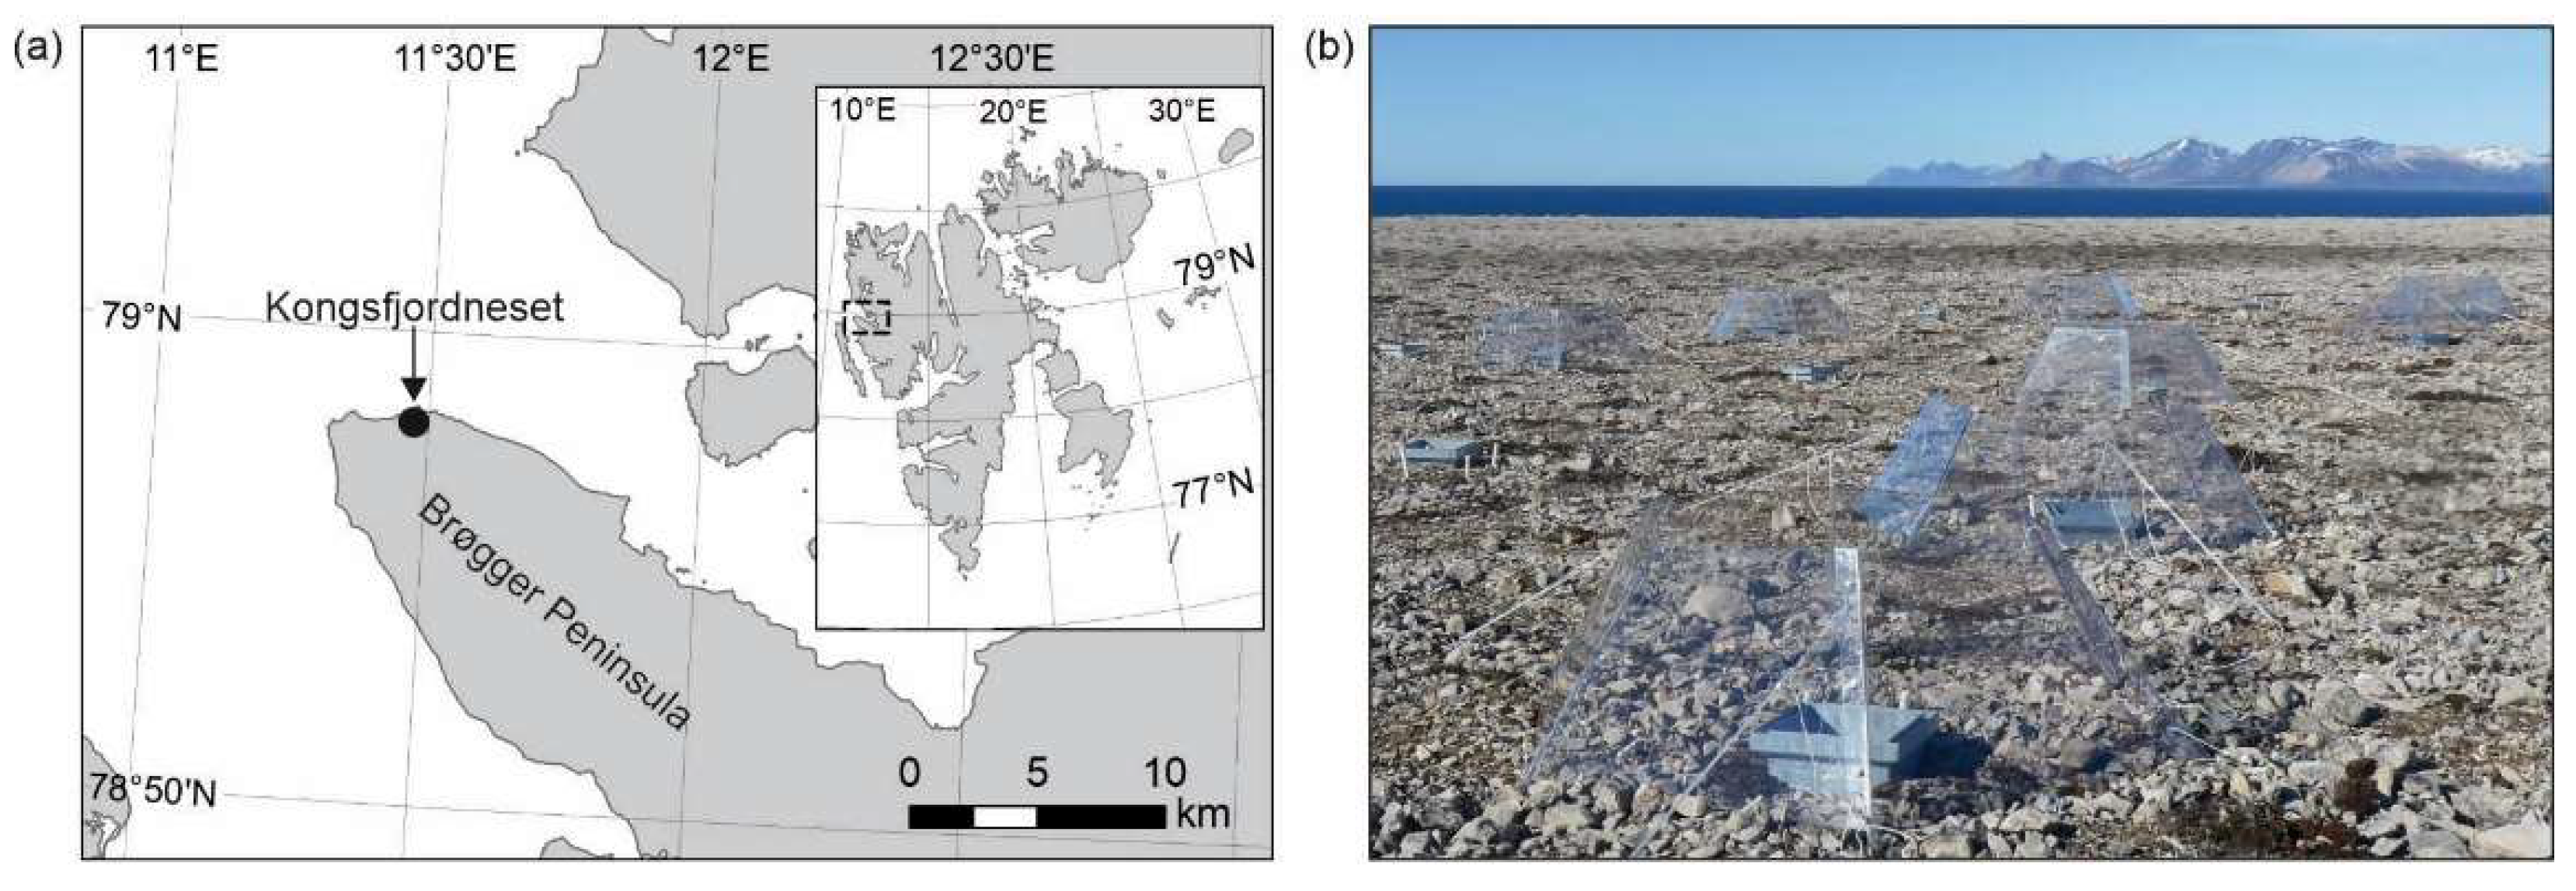
Abstract
:Simple Summary
Abstract
1. Introduction
2. Materials and Methods
2.1. Site Description and Field Experiment
2.2. Long-Term Soil Temperature Measurements
2.3. Gas Exchange and Instantaneous Soil Temperature and Soil Water Content Measurements
2.4. Soil Sampling
2.5. DNA Extractions
2.6. Q-PCR Assays
2.7. Barcoding of Bacterial 16S Ribosomal RNA Genes
2.8. Statistical Analyses
3. Results
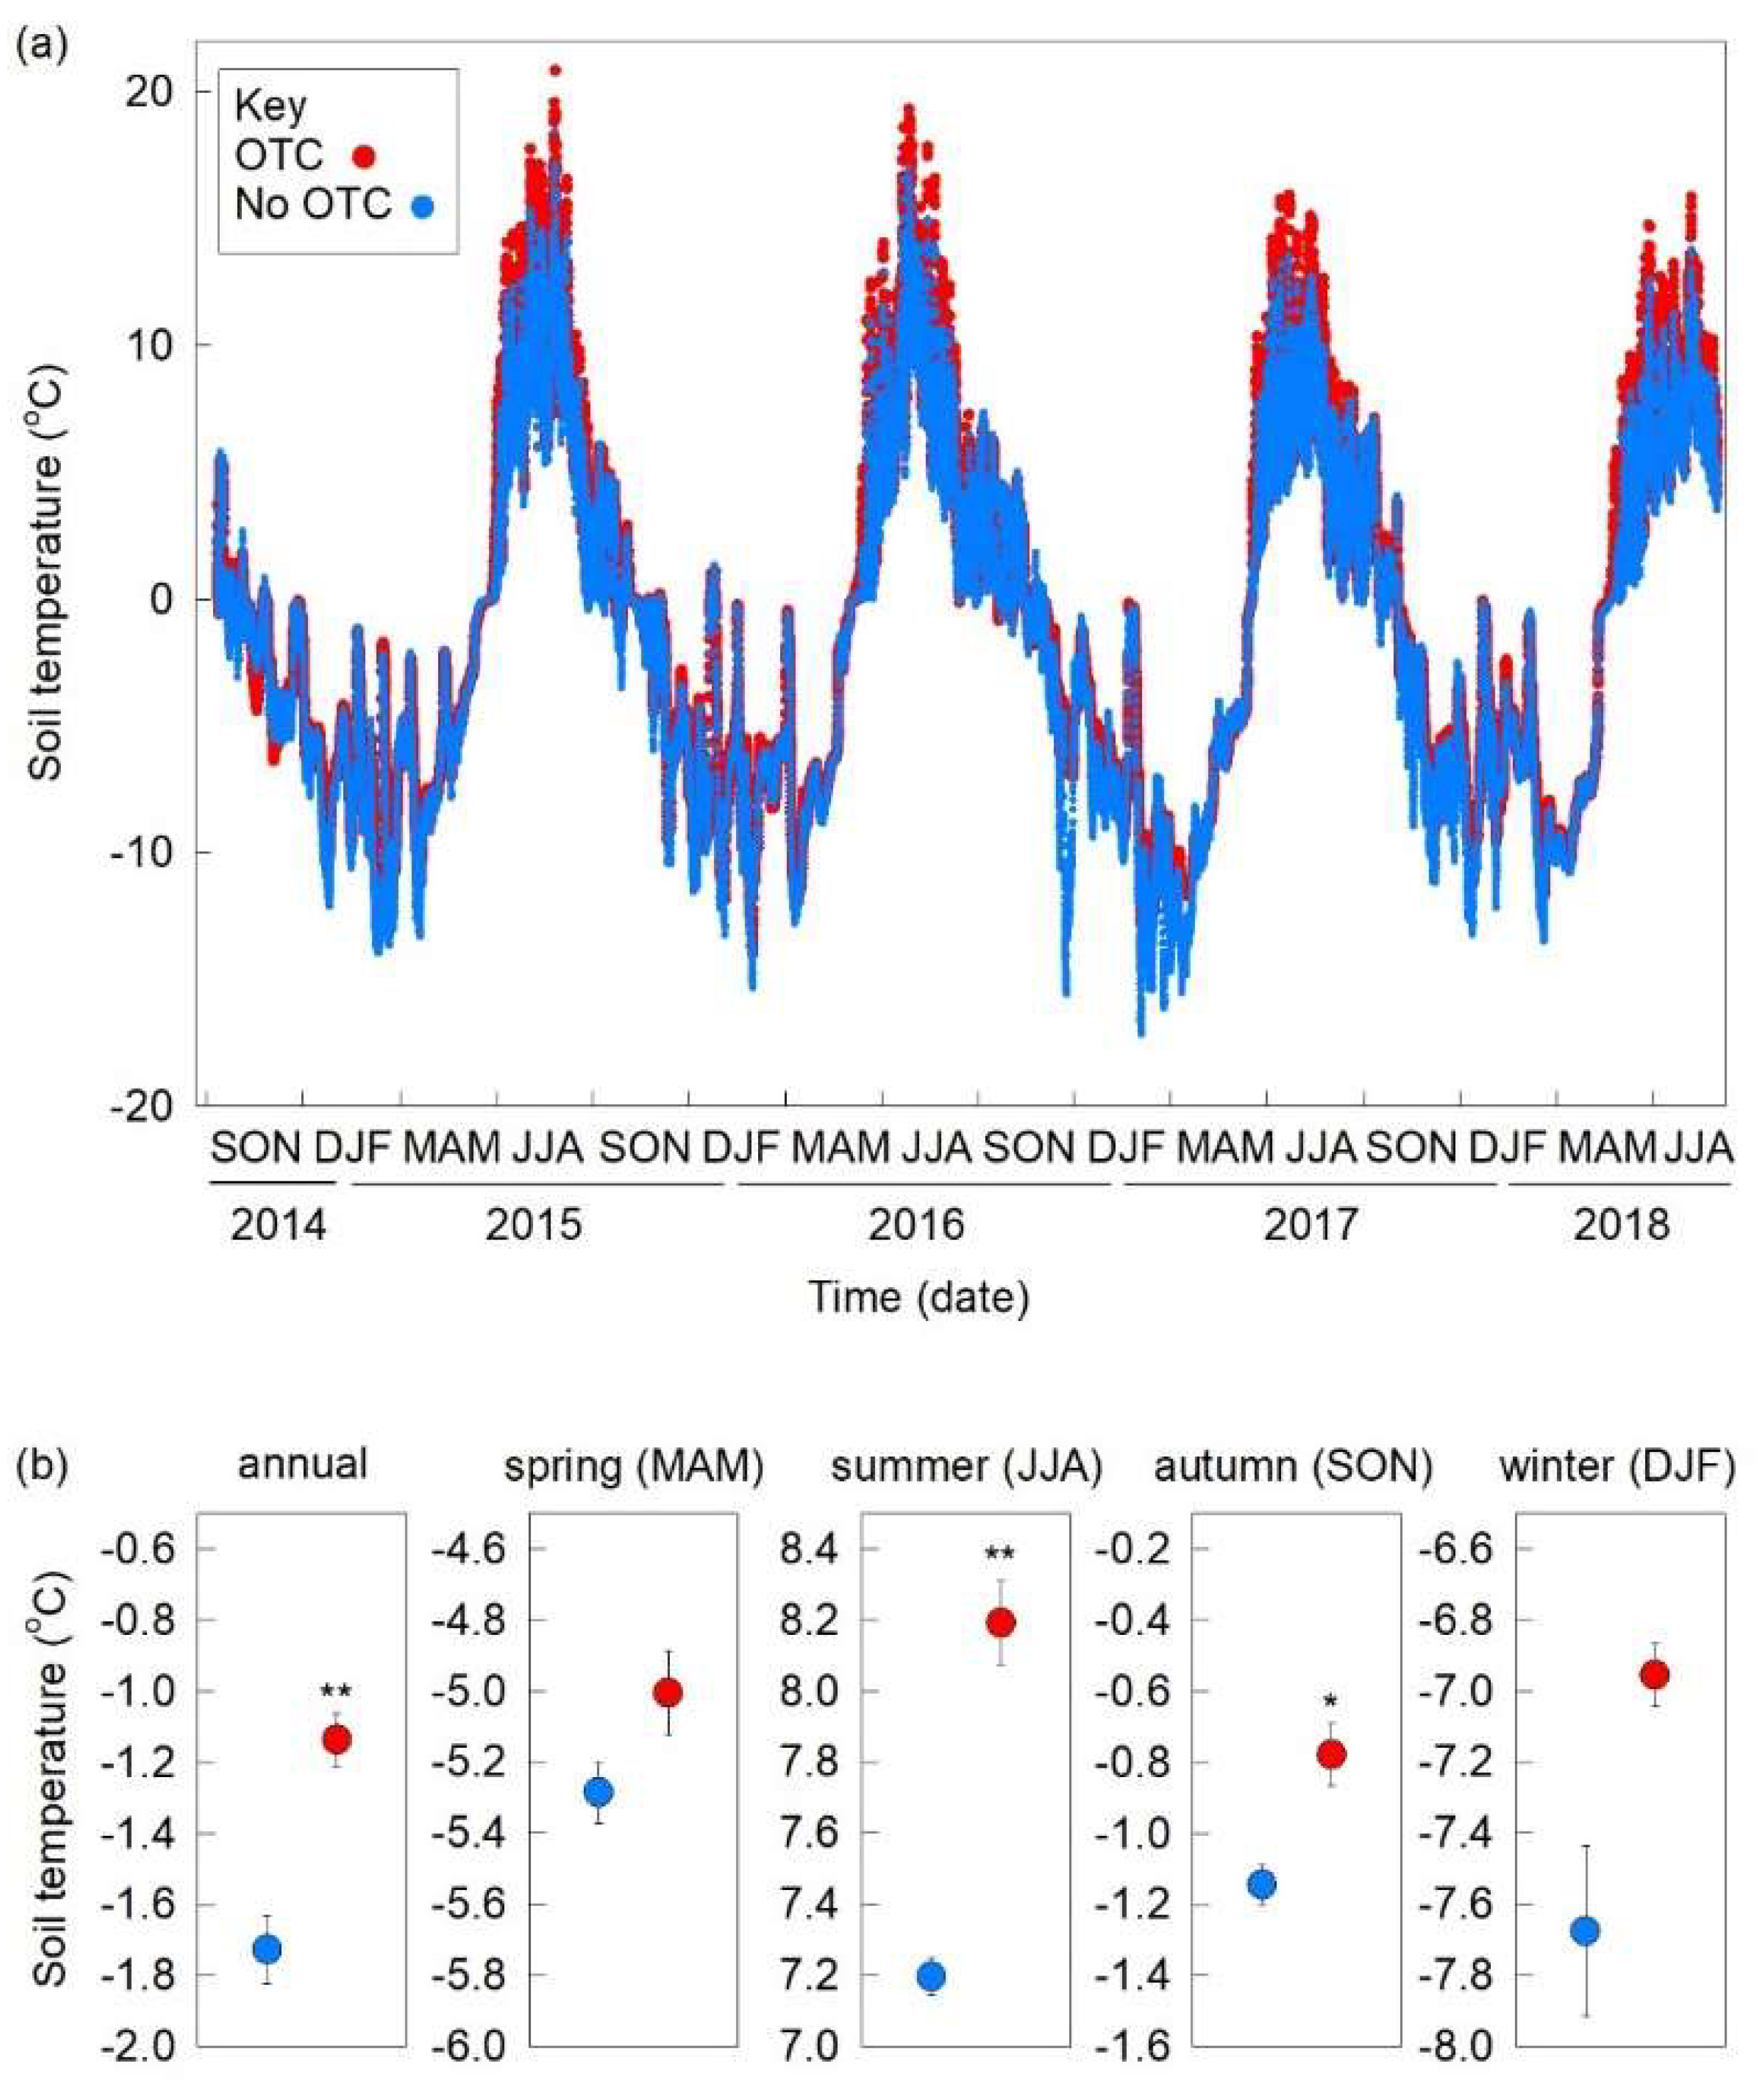
3.1. Soil Temperatures
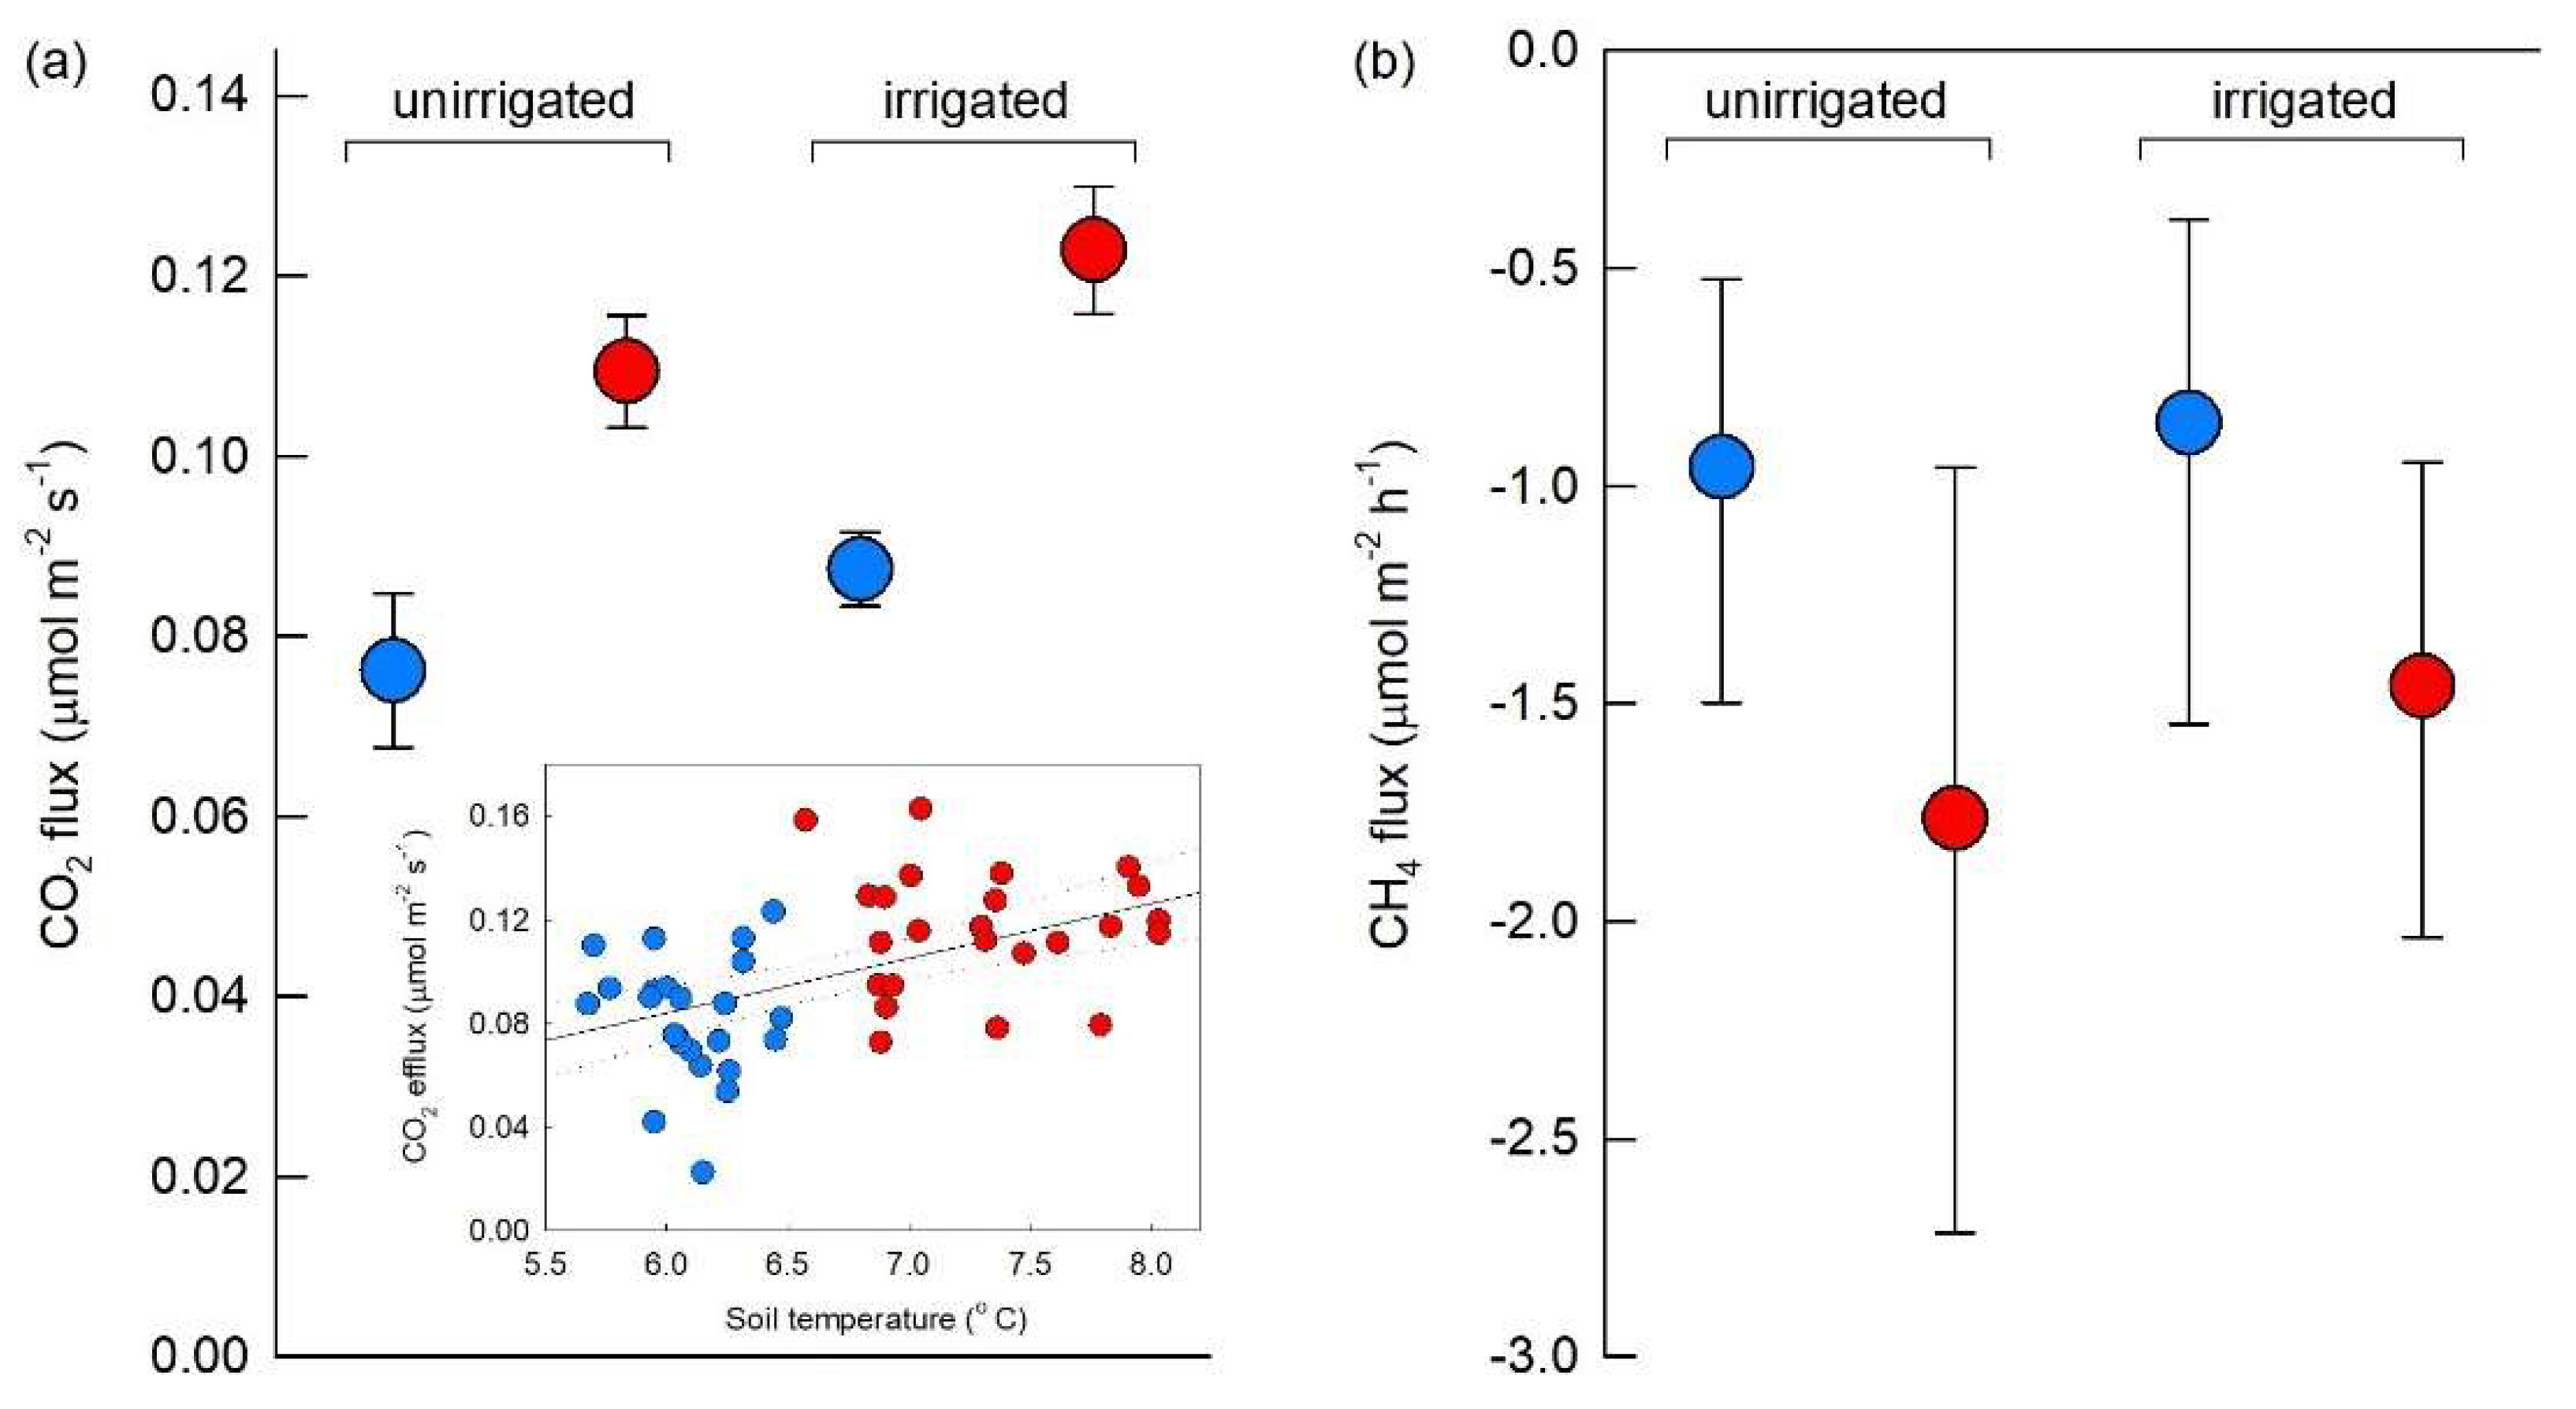
3.2. Gas Fluxes and Associations with Soil Temperature and VSWC
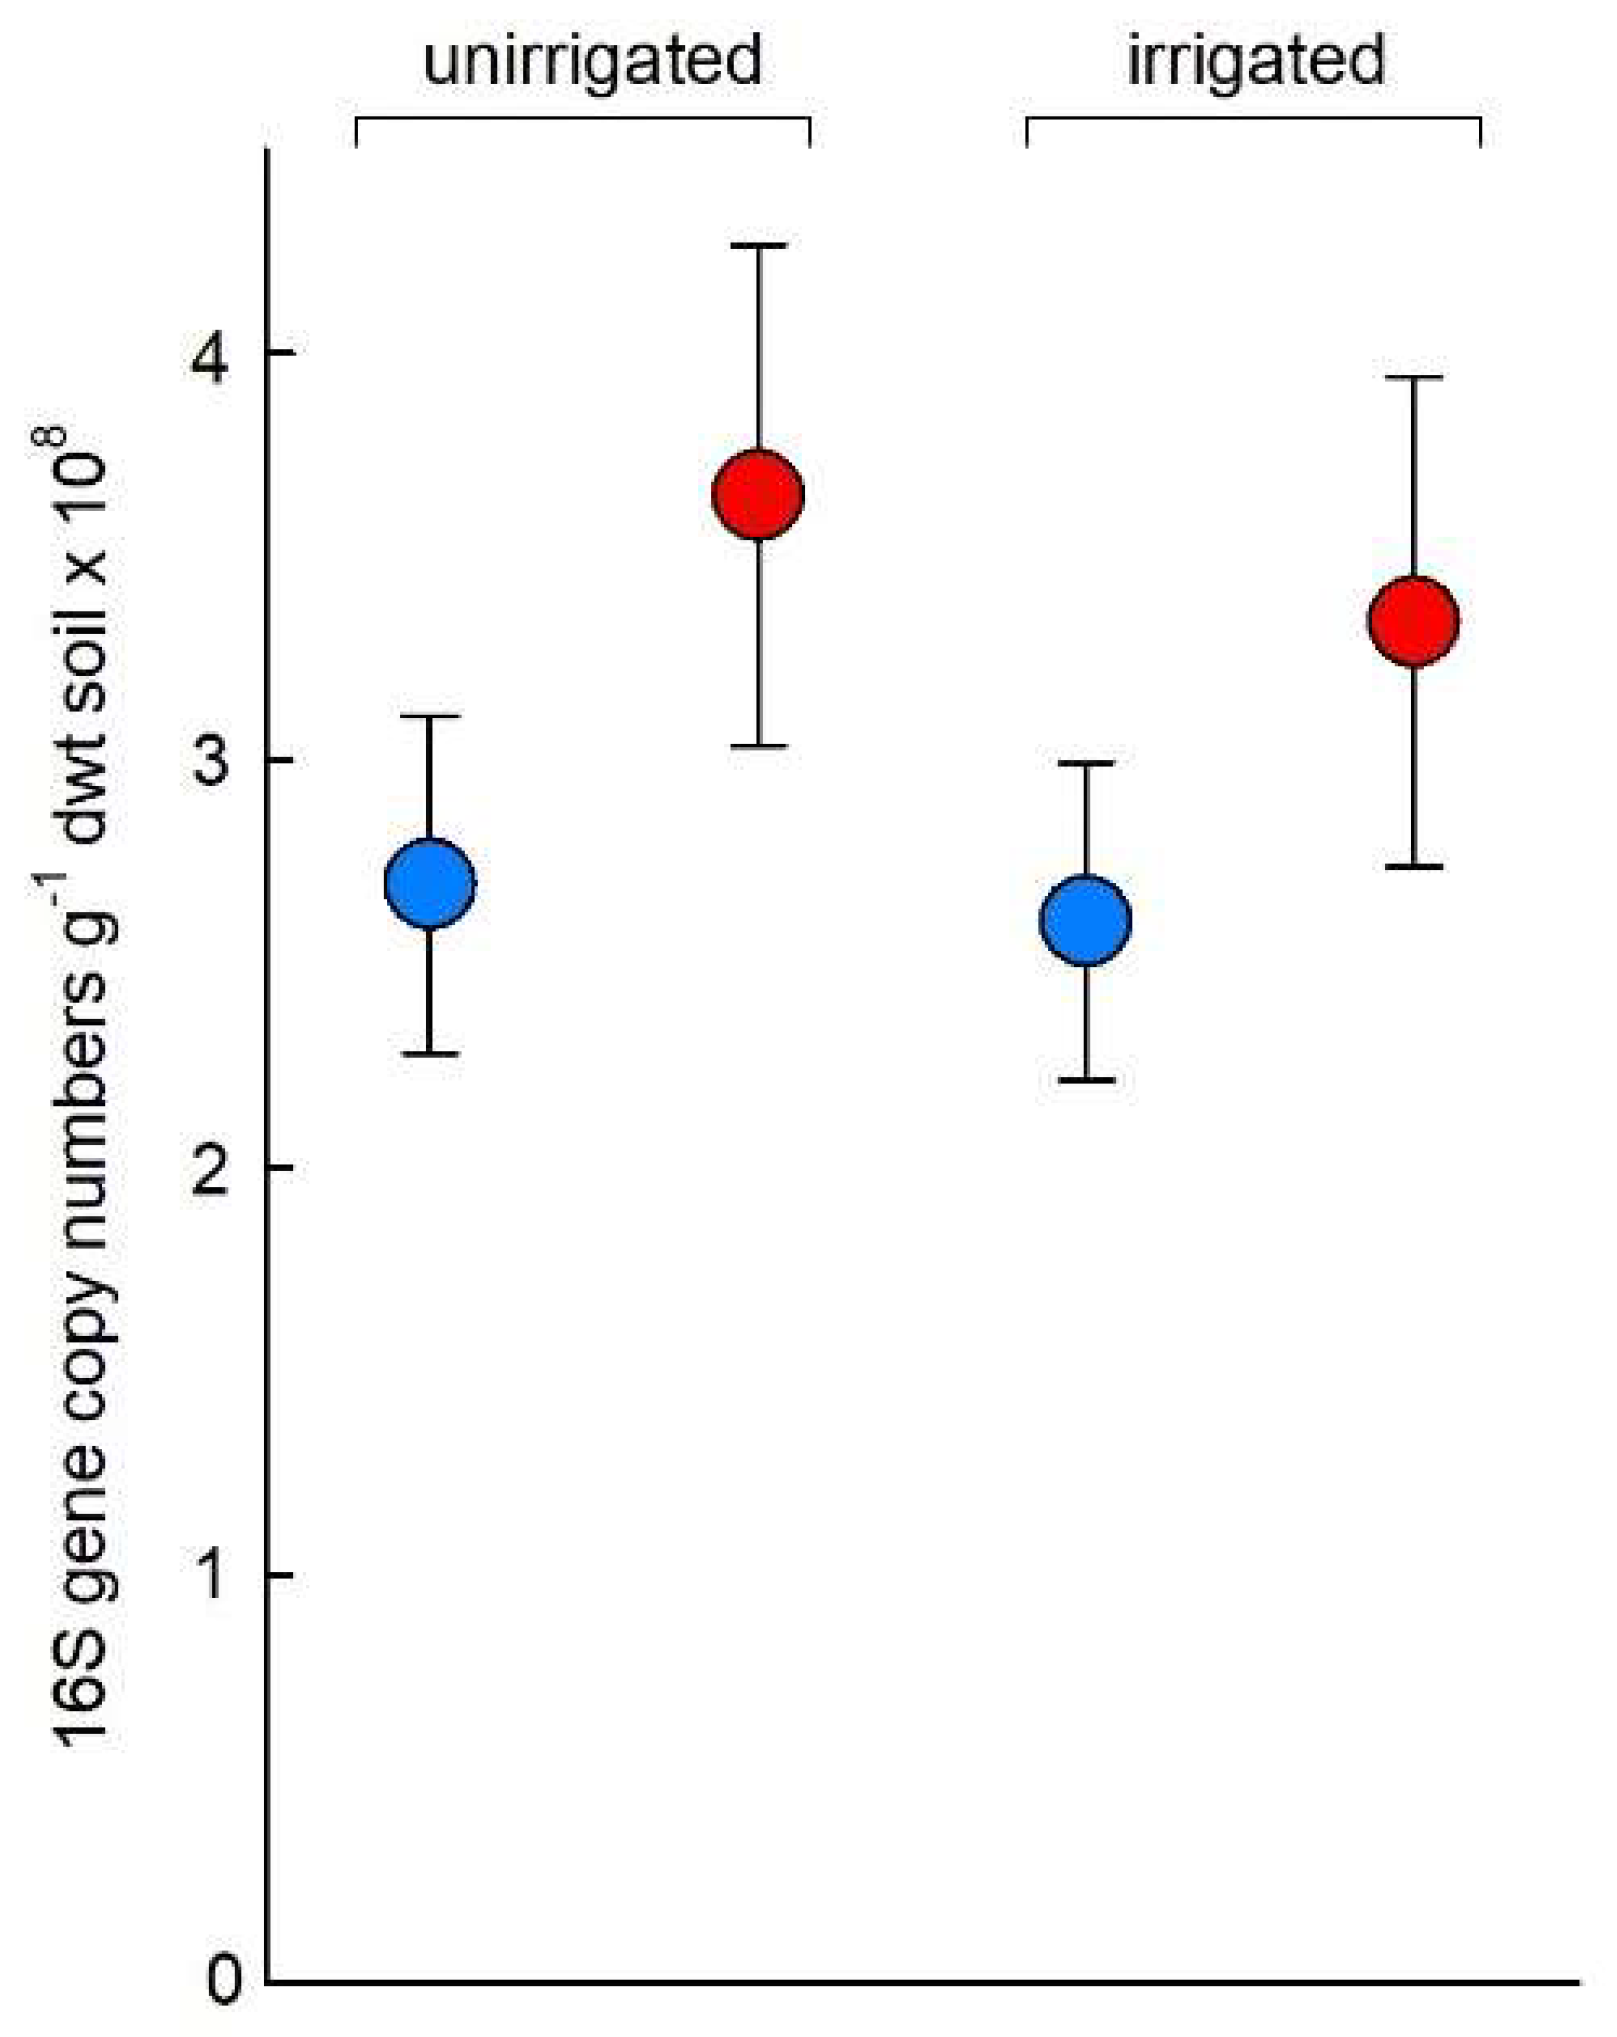
3.3. Q-PCR Assays
3.4. Soil Bacterial Community Composition and Alpha Diversity
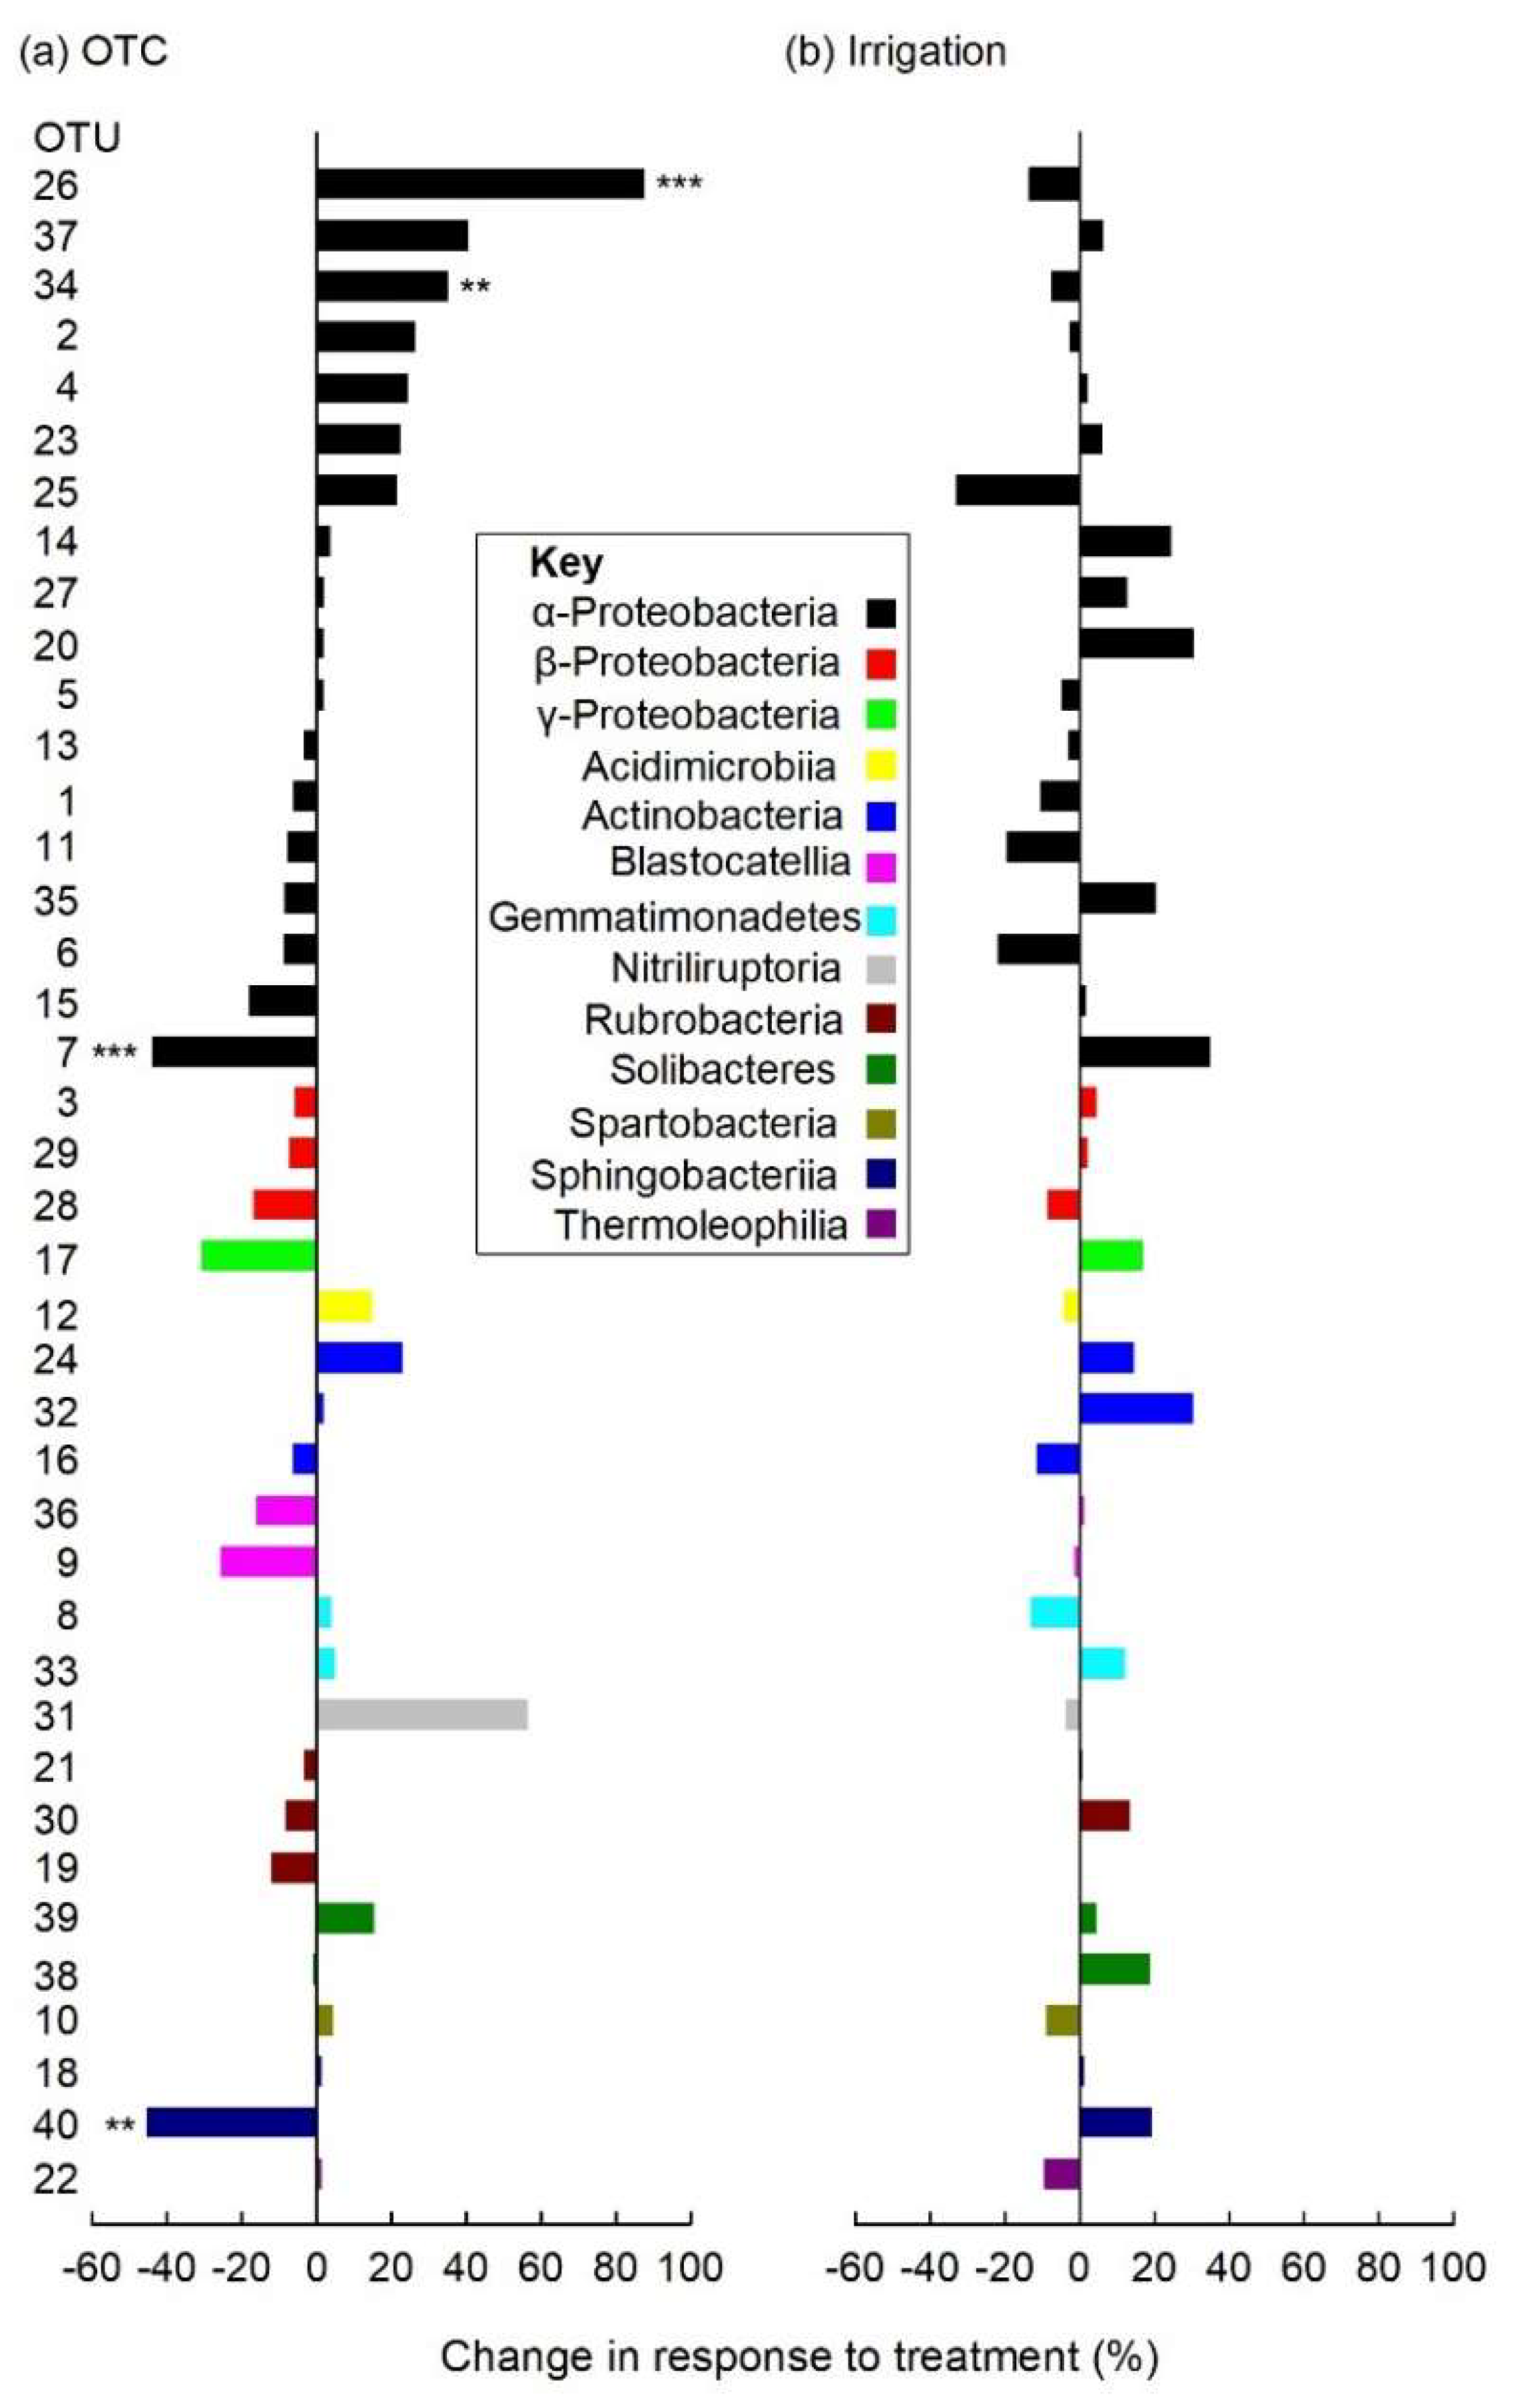
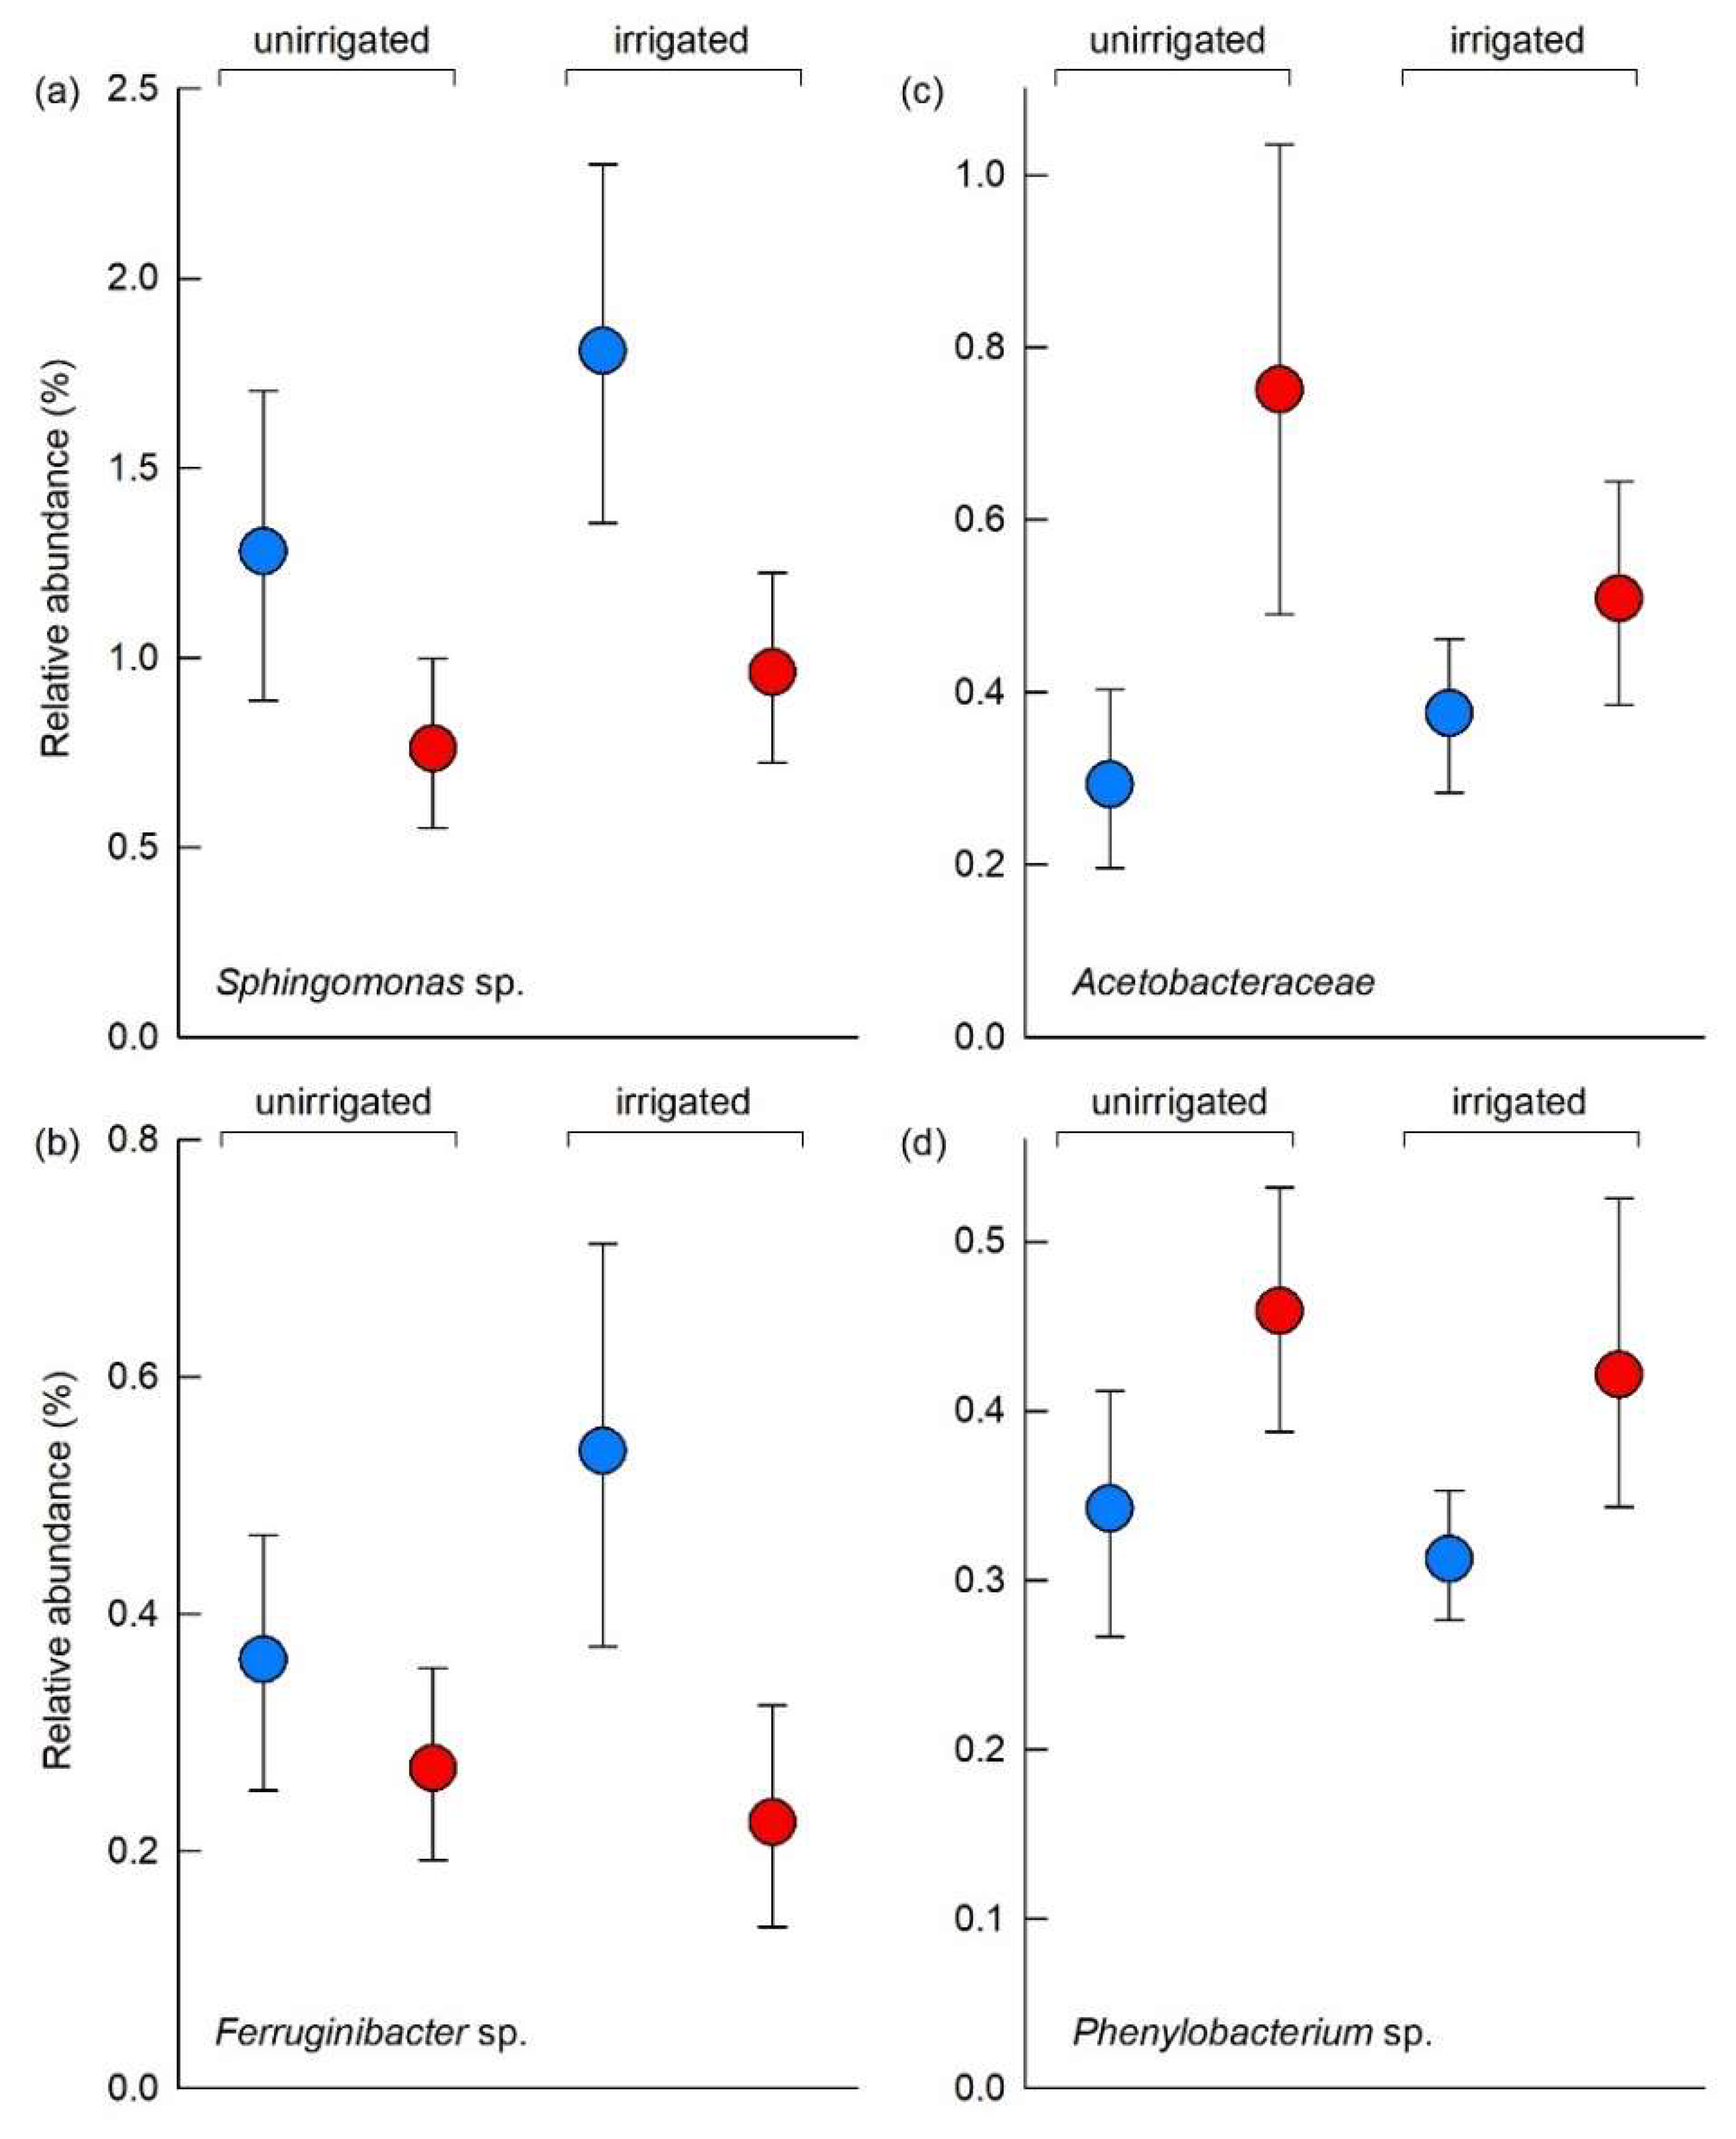
3.5. Individual Soil Bacterial Taxa
4. Discussion
4.1. Increased CO2 Efflux from Warmed High Arctic Patterned Ground Soil
4.2. Increased CH4 Consumption by Warmed High Arctic Patterned Ground Soil
4.3. Soil Microbial Community Responses to Warming
4.4. Responses of Individual Soil Bacterial Taxa to Warming
4.5. Delayed Response of the Soil Fungal Community to Warming
4.6. Sparse Effects of Irrigation on Gas Fluxes and the Soil Microbial Community
4.7. Predicted Effects of Warming on Brøgger Peninsula Soils
5. Conclusions
Supplementary Materials
Author Contributions
Funding
Institutional Review Board Statement
Informed consent statement
Data Availability Statement
Acknowledgments
Conflicts of Interest
References
- Box, J.E.; Colgan, W.T.; Christensen, T.R.; Schmidt, N.M.; Lund, M.; Parmentier, F.J.W.; Brown, R.; Bhatt, U.S.; Euskirchen, E.S.; Romanovsky, V.E.; et al. Key indicators of Arctic climate change: 1971–2017. Environ. Res. Lett. 2019, 14, 045010. [Google Scholar] [CrossRef]
- Post, E.; Alley, R.B.; Christensen, T.R.; Macias-Fauria, M.; Forbes, B.C.; Gooseff, M.N.; Iler, A.; Kerby, J.T.; Laidre, K.L.; Mann, M.E.; et al. The polar regions in a 2 °C warmer world. Sci. Adv. 2019, 5, eaaw9883. [Google Scholar] [CrossRef] [PubMed] [Green Version]
- Arctic Monitoring and Assessment Programme. Arctic Climate Change Update 2021: Key Trends and Impacts; AMAP Secretariat: Tromsø, Norway, 2021. [Google Scholar]
- Hanssen-Bauer, I.; Førland, E.J.; Hisdal, H.; Mayer, S.; Sandø, A.B.; Sorteberg, A. (Eds.) Climate in Svalbard 2100—A Knowledge Base for Climate Adaptation; Norwegian Centre for Climate Services: Oslo, Norway, 2019. [Google Scholar] [CrossRef]
- Nordli, Ø.; Wyszyński, P.; Gjelten, H.M.; Isaksen, K.; Łupikasza, E.; Niedźwiedź, T.; Przybylak, R. Revisiting the extended Svalbard Airport monthly temperature series, and the compiled corresponding daily series 1898–2018. Polar Res. 2020, 39, 3614. [Google Scholar] [CrossRef]
- Boike, J.; Juszak, I.; Lange, S.; Chadburn, S.; Burke, E.; Overduin, P.P.; Roth, K.; Ippisch, O.; Bornemann, N.; Stern, L.; et al. A 20-year record (1998–2017) of permafrost, active layer and meteorological conditions at a high Arctic permafrost research site (Bayelva, Spitsbergen). Earth Syst. Sci. Data 2018, 10, 355–390. [Google Scholar] [CrossRef] [Green Version]
- Bintanja, R.; Andry, O. Towards a rain-dominated Arctic. Nat. Clim. Chang. 2017, 7, 263–267. [Google Scholar] [CrossRef]
- Dobler, A.; Førland, E.J.; Isaksen, K. Present and Future Heavy Rainfall Statistics for Svalbard. Background—Report for Climate in Svalbard 2100; Norwegian Centre for Climate Services: Oslo, Norway, 2019. [Google Scholar]
- Swift, M.J.; Heal, O.W.; Anderson, J.M. Decomposition in Terrestrial Ecosystems; Blackwell Scientific Publications: Oxford, UK, 1979. [Google Scholar]
- Pedersen, Å.Ø.; Convey, P.; Newsham, K.K.; Mosbacher, J.B.; Fuglei, E.; Ravolainen, V.; Hansen, B.B.; Jensen, T.C.; Augusti, A.; Biersma, E.M.; et al. Five decades of terrestrial and freshwater research at Ny-Ålesund, Svalbard. Polar Res. 2022, 41, 6310. [Google Scholar] [CrossRef]
- Rinnan, R.; Michelsen, A.; Bååth, E.; Jonasson, S. Fifteen years of climate change manipulations alter soil microbial communities in a subarctic heath ecosystem. Glob. Chang. Biol. 2007, 13, 28–39. [Google Scholar] [CrossRef]
- Walker, J.K.M.; Egger, K.N.; Henry, G.H.R. Long-term experimental warming alters nitrogen-cycling communities but site factors remain the primary drivers of community structure in high arctic tundra soils. ISME J. 2008, 2, 982–995. [Google Scholar] [CrossRef]
- Lamb, E.G.; Han, S.; Lanoil, B.D.; Henry, G.H.R.; Brummell, M.E.; Banerjee, S.; Siciliano, S.D. A High Arctic soil ecosystem resists long-term environmental manipulations. Glob. Chang. Biol. 2011, 17, 3187–3194. [Google Scholar] [CrossRef]
- Deslippe, J.R.; Hartmann, M.; Mohn, W.W.; Simard, S.W. Long-term experimental manipulation of climate alters the ectomycorrhizal community of Betula nana in Arctic tundra. Glob. Chang. Biol. 2011, 17, 1625–1636. [Google Scholar] [CrossRef]
- Sistla, S.A.; Moore, J.C.; Simpson, R.T.; Gough, L.; Shaver, G.R.; Schimel, J.P. Long-term warming restructures Arctic tundra without changing net soil carbon storage. Nature 2013, 497, 615–619. [Google Scholar] [CrossRef]
- Pold, G.; Schimel, J.P.; Sistla, S.A. Soil bacterial communities vary more by season than with over two decades of experimental warming in Arctic tussock tundra. Elem. Sci. Anthr. 2021, 9, 00116. [Google Scholar] [CrossRef]
- Jeanbille, M.; Clemmensen, K.; Juhanson, J.; Michelsen, A.; Cooper, E.J.; Henry, G.H.R.; Hofgaard, A.; Hollister, R.D.; Jónsdóttir, I.S.; Klanderud, K.; et al. Site-specific responses of fungal and bacterial abundances to experimental warming in litter and soil across Arctic and alpine tundra. Arct. Sci. 2022, 8, 992–1005. [Google Scholar] [CrossRef]
- CAVM Team. Circumpolar Arctic Vegetation Map. Scale 1:7,500,000. In Conservation of Arctic Flora and Fauna (CAFF) Map No. 1; U.S. Fish and Wildlife Service: Anchorage, AK, USA, 2003. [Google Scholar]
- Wojcik, R.; Palmtag, J.; Hugelius, G.; Weiss, N.; Kuhry, P. Land cover and landform-based upscaling of soil organic carbon stocks on the Brøgger Peninsula, Svalbard. Arct. Antarct. Alp. Res. 2019, 51, 40–57. [Google Scholar] [CrossRef] [Green Version]
- Michaelson, G.J.; Ping, C.L.; Walker, D.A. Soils associated with biotic activity on frost boils in Arctic Alaska. Soil Sci. Soc. Am. J. 2012, 76, 2265–2277. [Google Scholar] [CrossRef] [Green Version]
- Raynolds, M.K.; Walker, D.A.; Munger, C.A.; Vonlanthen, C.M.; Kade, A.N. A map analysis of patterned-ground along a North American Arctic transect. J. Geophys. Res. 2008, 113, G03S03. [Google Scholar] [CrossRef] [Green Version]
- Schaeffer, S.M.; Sharp, E.; Schimel, J.P.; Welker, J.M. Soil-plant N processes in a High Arctic ecosystem, NW Greenland are altered by long-term experimental warming and higher rainfall. Glob. Chang. Biol. 2013, 19, 3529–3539. [Google Scholar] [CrossRef]
- Lupascu, M.; Welker, J.M.; Seibt, U.; Xu, X.; Velicogna, I.; Lindsey, D.S.; Czimczik, C.I. The amount and timing of precipitation control the magnitude, seasonality and sources (14C) of ecosystem respiration in a polar semi-desert, northwestern Greenland. Biogeosciences 2014, 11, 4289–4304. [Google Scholar] [CrossRef] [Green Version]
- Illeris, L.; Michelsen, A.; Jonasson, S. Soil plus root respiration and microbial biomass following water, nitrogen, and phosphorus application at a high arctic semi desert. Biogeochemistry 2003, 65, 15–29. [Google Scholar] [CrossRef]
- Dennis, P.G.; Newsham, K.K.; Rushton, S.P.; Ord, V.J.; O’Donnell, A.G.; Hopkins, D.W. Warming constrains bacterial community responses to nutrient inputs in a southern, but not northern, maritime Antarctic soil. Soil Biol. Biochem. 2013, 57, 248–255. [Google Scholar] [CrossRef] [Green Version]
- Newsham, K.K.; Misiak, M.; Goodall-Copestake, W.P.; Dahl, M.S.; Boddy, L.; Hopkins, D.W.; Davey, M.L. Warming increases fungal alpha diversity in an oligotrophic maritime Antarctic soil. Front. Microbiol. 2022, 13, 1050372. [Google Scholar] [CrossRef]
- Yergeau, E.; Bokhorst, S.; Kang, S.; Zhou, J.; Greer, C.W.; Aerts, R.; Kowalchuk, G.A. Shifts in soil microorganisms in response to warming are consistent across a range of Antarctic environments. ISME J. 2012, 6, 692–702. [Google Scholar] [CrossRef] [Green Version]
- Beck, P.S.A.; Kalmbach, E.; Joly, D.; Stien, A.; Nilsen, L. Modelling local distribution of an Arctic dwarf shrub indicates an important role for remote sensing of snow cover. Remote Sens. Environ. 2005, 98, 110–121. [Google Scholar] [CrossRef]
- Mann, D.H.; Sletten, R.S.; Ugolini, F.C. Soil development at Kongsfjorden, Spitsbergen. Polar Res. 1986, 4, 1–16. [Google Scholar] [CrossRef]
- Misiak, M. Soil Fungal Responses to Warming in Polar Regions. Ph.D. Thesis, Cardiff University, Cardiff, UK, 2018. [Google Scholar]
- Lim, P.P.J.; Newsham, K.K.; Convey, P.; Gan, H.M.; Yew, W.C.; Tan, G.Y.A. Effects of field warming on a High Arctic soil bacterial community: A metagenomic analysis. Curr. Sci. 2018, 115, 30–33. [Google Scholar] [CrossRef]
- Pedersen, E.P.; Elberling, B.; Michelsen, A. Seasonal variations in CH4 fluxes in response to summer warming and leaf litter addition in a subarctic heath ecosystem. J. Geophys. Res. 2017, 122, 2137–2153. [Google Scholar] [CrossRef]
- Hurlbert, S.H. Pseudoreplication and the design of ecological field experiments. Ecology 1984, 54, 187–211. [Google Scholar] [CrossRef] [Green Version]
- Nadkarni, M.A.; Martin, F.E.; Jacques, N.A.; Hunter, N. Determination of bacterial load by real-time PCR using a broad-range (universal) probe and primers set. Microbiology 2002, 148, 257–266. [Google Scholar] [CrossRef] [Green Version]
- Bolger, A.M.; Lohse, M.; Usadel, B. Trimmomatic: A flexible trimmer for Illumina sequence data. Bioinformatics 2014, 30, 2114–2120. [Google Scholar] [CrossRef] [PubMed]
- Schloss, P.D.; Westcott, S.L.; Ryabin, T.; Hall, J.R.; Hartmann, M.; Hollister, E.B.; Lesniewski, R.A.; Oakley, B.B.; Parks, D.H.; Robinson, C.J.; et al. Introducing mothur: Open-source, platform-independent, community-supported software for describing and comparing microbial communities. Appl. Environ. Microbiol. 2009, 75, 7537–7541. [Google Scholar] [CrossRef] [PubMed] [Green Version]
- Quast, C.; Pruesse, E.; Yilmaz, P.; Gerken, J.; Schweer, T.; Yarza, P.; Peplies, J.; Glöckner, F.O. The SILVA ribosomal RNA gene database project: Improved data processing and web-based tools. Nucleic Acids Res. 2012, 41, D590–D596. [Google Scholar] [CrossRef] [PubMed]
- Huse, S.M.; Welch, D.M.; Morrison, H.G.; Sogin, M.L. Ironing out the wrinkles in the rare biosphere through improved OTU clustering. Environ. Microbiol. 2010, 12, 1889–1898. [Google Scholar] [CrossRef] [PubMed] [Green Version]
- Rognes, T.; Flouri, T.; Nichols, B.; Quince, C.; Mahé, F. VSEARCH: A versatile open source tool for metagenomics. PeerJ 2016, 4, e2584. [Google Scholar] [CrossRef] [Green Version]
- Yoon, S.-H.; Ha, S.-M.; Kwon, S.; Lim, J.; Kim, Y.; Seo, H.; Chun, J. Introducing EzBioCloud: A taxonomically united database of 16S rRNA gene sequences and whole-genome assemblies. Int. J. Syst. Evol. Microbiol. 2017, 67, 1613–1617. [Google Scholar] [CrossRef]
- Wang, Q.; Garrity, G.M.; Tiedje, J.M.; Cole, J.R. Naïve Bayesian classifier for rapid assignment of rRNA sequences into the new bacterial taxonomy. Appl. Environ. Microbiol. 2007, 73, 5261–5267. [Google Scholar] [CrossRef] [Green Version]
- Westcott, S.L.; Schloss, P.D. OptiClust, an improved method for assigning amplicon-based sequence data to operational taxonomic units. mSphere 2017, 2, e00073-17. [Google Scholar] [CrossRef] [Green Version]
- Benjamini, Y.; Hochberg, Y. Controlling the false discovery rate: A practical and powerful approach to multiple testing. J. R. Stat. Soc. Ser. B Methodol. 1995, 57, 289–300. [Google Scholar] [CrossRef]
- Jørgensen, C.J.; Johansen, K.M.L.; Westergaard-Nielsen, A.; Elberling, B. Net regional methane sink in High Arctic soils of northeast Greenland. Nat. Geosci. 2015, 8, 20–23. [Google Scholar] [CrossRef]
- Welker, J.M.; Fahnestock, J.T.; Jones, M.H. Annual CO2 flux in dry and moist Arctic tundra: Field responses to increases in summer temperatures and winter snow depth. Clim. Chang. 2000, 44, 139–150. [Google Scholar] [CrossRef]
- Biasi, C.; Meyer, H.; Rusalimova, O.; Hammerle, R.; Kaiser, C.; Baranyi, C.; Daims, H.; Lashchinsky, N.; Barsukov, P.; Richter, A. Initial effects of experimental warming on carbon exchange rates, plant growth and microbial dynamics of a lichen-rich dwarf shrub tundra in Siberia. Plant Soil 2008, 307, 191–205. [Google Scholar] [CrossRef]
- Cannone, N.; Augusti, A.; Malfasi, F.; Pallozzi, E.; Calfapietra, C.; Brugnoli, E. The interaction of biotic and abiotic factors at multiple spatial scales affects the variability of CO2 fluxes in polar environments. Polar Biol. 2016, 39, 1581–1596. [Google Scholar] [CrossRef]
- Cannone, N.; Ponti, S.; Christensen, T.R.; Pirk, N.; Guglielmin, M. Effects of active layer seasonal dynamics and plant phenology on CO2 land atmosphere fluxes at polygonal tundra in the High Arctic, Svalbard. Catena 2019, 174, 142–153. [Google Scholar] [CrossRef]
- Jespersen, R.G.; Leffler, A.J.; Väisänen, M.; Welker, J.M. Resistance and change in a High Arctic ecosystem, NW Greenland: Differential sensitivity of ecosystem metrics to 15 years of experimental warming and wetting. Glob. Chang. Biol. 2021, 28, 1853–1869. [Google Scholar] [CrossRef] [PubMed]
- Weiss, N.; Faucherre, S.; Lampiris, N.; Wojcik, R. Elevation-based upscaling of organic carbon stocks in High-Arctic permafrost terrain: A storage and distribution assessment for Spitsbergen, Svalbard. Polar Res. 2017, 36, 1400363. [Google Scholar] [CrossRef]
- Robinson, C.H.; Wookey, P.A.; Lee, J.A.; Callaghan, T.V.; Press, M.C. Plant community responses to simulated environmental change at a High Arctic polar semi-desert. Ecology 1998, 79, 856–866. [Google Scholar] [CrossRef]
- Magnani, M.; Baneschi, I.; Giamberini, M.; Raco, B.; Provenzale, A. Microscale drivers of summer CO2 fluxes in the Svalbard High Arctic tundra. Sci. Rep. 2022, 12, 763. [Google Scholar] [CrossRef] [PubMed]
- Bockheim, J.G. Importance of cryoturbation in redistributing organic carbon in permafrost-affected soils. Soil Sci. Soc. Am. J. 2007, 71, 1335–1342. [Google Scholar] [CrossRef]
- D’Imperio, L.; Nielsen, C.A.; Westergaard-Nielsen, A.; Michelsen, A.; Elberling, B. Methane oxidation in contrasting dry soil types: Responses to warming with implication for landscape-integrated CH4 budget. Glob. Chang. Biol. 2017, 23, 966–976. [Google Scholar] [CrossRef] [Green Version]
- St Pierre, K.A.; Danielsen, B.K.; Hermesdorf, L.; D’Imperio, L.; Iversen, L.L.; Elberling, B. Drivers of net methane uptake across Greenlandic dry heath tundra landscapes. Soil Biol. Biochem. 2019, 138, 107605. [Google Scholar] [CrossRef]
- Tveit, A.; Schwacke, R.; Svenning, M.M.; Urich, T. Organic carbon transformations in high-Arctic peat soils: Key functions and microorganisms. ISME J. 2013, 7, 299–311. [Google Scholar] [CrossRef] [Green Version]
- Bokhorst, S.; Huiskes, A.; Convey, P.; Sinclair, B.J.; Lebouvier, M.; Van de Vijver, B.; Wall, D.H. Microclimate impacts of passive warming methods in Antarctica: Implications for climate change studies. Polar Biol. 2011, 34, 1421–1435. [Google Scholar] [CrossRef]
- Wartiainen, I.; Hestnes, A.G.; McDonald, I.R.; Svenning, M.M. Methylocystis rosea sp. nov., a novel methanotrophic bacterium from Arctic wetland soil, Svalbard, Norway (78° N). Int. J. Syst. Evol. Microbiol. 2006, 56, 541–547. [Google Scholar] [CrossRef] [Green Version]
- King, G.M.; Adamsen, A.P.S. Effects of temperature on methane consumption in a forest soil and in pure cultures of Methylomonas rubra. Appl. Environ. Microbiol. 1992, 58, 2758–2763. [Google Scholar] [CrossRef] [Green Version]
- Priemé, A.; Christensen, S. Seasonal and spatial variation of methane oxidation in a Danish spruce forest. Soil Biol. Biochem. 1997, 29, 1165–1172. [Google Scholar] [CrossRef]
- Lau, M.C.Y.; Stackhouse, B.T.; Layton, A.C.; Chauhan, A.; Vishnivetskaya, T.A.; Chourey, K.; Ronholm, J.; Mykytczuk, N.C.S.; Bennett, P.C.; Lamarche-Gagnon, G.; et al. An active atmospheric methane sink in high Arctic cryosols. ISME J. 2015, 9, 1880–1891. [Google Scholar] [CrossRef] [Green Version]
- Salazar, A.; Rousk, K.; Jónsdóttir, I.S.; Bellenger, J.-P.; Andrésson, Ó.S. Faster nitrogen cycling and more fungal and root biomass in cold ecosystems under experimental warming: A meta-analysis. Ecology 2020, 101, e02938. [Google Scholar] [CrossRef] [Green Version]
- Chen, J.; Luo, Y.; Xia, J.; Jiang, L.; Zhou, X.; Lu, M.; Liang, J.; Shi, Z.; Shelton, S.; Cao, J. Stronger warming effects on microbial abundances in colder regions. Sci. Rep. 2016, 5, 18032. [Google Scholar] [CrossRef] [Green Version]
- Voříšková, J.; Elberling, B.; Priemé, A. Fast response of fungal and prokaryotic communities to climate change manipulation in two contrasting tundra soils. Environ. Microbiome 2019, 14, 6. [Google Scholar] [CrossRef] [Green Version]
- Mundra, S.; Halvorsen, R.; Kauserud, H.; Bahram, M.; Tedersoo, L.; Elberling, B.; Cooper, E.J.; Eidesen, P.B. Ectomycorrhizal and saprotrophic fungi respond differently to long-term experimentally increased snow depth in the High Arctic. Microbiol. Open 2016, 5, 856–869. [Google Scholar] [CrossRef]
- Xue, K.; Yuan, M.; Shi, Z.; Qin, Y.; Deng, Y.; Cheng, L.; Wu, L.; He, Z.; Van Nostrand, J.D.; Bracho, R.; et al. Tundra soil carbon is vulnerable to rapid microbial decomposition under climate warming. Nat. Clim. Chang. 2016, 6, 595–600. [Google Scholar] [CrossRef] [Green Version]
- Fierer, N.; Jackson, R.B. The diversity and biogeography of soil bacterial communities. Proc. Natl. Acad. Sci. USA 2006, 103, 626–631. [Google Scholar] [CrossRef] [PubMed] [Green Version]
- Jung, J.Y.; Michelsen, A.; Kim, M.; Nam, S.; Schmidt, M.N.; Jeong, S.; Choe, Y.-H.; Lee, B.Y.; Yoon, H.I.; Lee, Y.K. Responses of surface SOC to long-term experimental warming vary between different heath types in the high Arctic tundra. Eur. J. Soil Sci. 2019, 71, 752–767. [Google Scholar] [CrossRef]
- White, D.; Sutton, S.; Ringelberg, D. The genus Sphingomonas: Physiology and ecology. Curr. Opin. Biotechnol. 1996, 7, 301–306. [Google Scholar] [CrossRef] [PubMed]
- Lim, J.H.; Baek, S.-H.; Lee, S.-T. Ferruginibacter alkalilentus gen. nov., sp. nov. and Ferruginibacter lapsinanis sp. nov., novel members of the family ‘Chitinophagaceae’ in the phylum Bacteroidetes, isolated from freshwater sediment. Int. J. Syst. Evol. Microbiol. 2009, 59, 2394–2399. [Google Scholar] [CrossRef] [PubMed] [Green Version]
- Reis, V.M.; Teixeira, K.R.S. Nitrogen fixing bacteria in the family Acetobacteraceae and their role in agriculture. J. Basic Microbiol. 2015, 55, 931–949. [Google Scholar] [CrossRef]
- Lingens, F.; Blecher, R.; Blecher, H.; Blobel, F.; Eberspächer, J.; Fröhner, C.; Görisch, H.; Görisch, H.; Layh, G. Phenylobacterium immobile gen. nov., sp. nov., a Gram-negative bacterium that degrades the herbicide Chloridazon. Int. J. Syst. Bacteriol. 1985, 35, 26–39. [Google Scholar] [CrossRef]
- Fujimura, K.E.; Egger, K.N.; Henry, G.H.R. The effect of experimental warming on the root-associated fungal community of Salix arctica. ISME J. 2008, 2, 105–114. [Google Scholar] [CrossRef] [Green Version]
- Deslippe, J.R.; Hartmann, M.; Simard, S.W.; Mohn, W.W. Long-term warming alters the composition of Arctic soil microbial communities. FEMS Microbiol. Ecol. 2012, 82, 303–315. [Google Scholar] [CrossRef] [Green Version]
- Rousk, J.; Bååth, E. Growth of saprotrophic fungi and bacteria in soil. FEMS Microbiol. Ecol. 2011, 78, 17–30. [Google Scholar] [CrossRef]
- Sistla, S.A.; Rastetter, E.B.; Schimel, J. Responses of a tundra system to warming using SCAMPS: A stoichiometrically coupled, acclimating microbe–plant–soil model. Ecol. Monogr. 2014, 84, 151–170. [Google Scholar] [CrossRef] [Green Version]
- Rinnan, R.; Michelsen, A.; Jonasson, S. Effects of litter addition and warming on soil carbon, nutrient pools and microbial communities in a subarctic heath ecosystem. Appl. Soil Ecol. 2008, 39, 271–281. [Google Scholar] [CrossRef]
- Anthony, M.A.; Knorr, M.; Moore, J.A.M.; Simpson, M.; Frey, S.D. Fungal community and functional responses to soil warming are greater than for soil nitrogen enrichment. Elem. Sci. Anthr. 2021, 9, 000059. [Google Scholar] [CrossRef]
- Fujiyoshi, M.; Yoshitake, S.; Watanabe, K.; Murota, K.; Tsuchiya, Y.; Uchida, M.; Nakatsubo, T. Successional changes in ectomycorrhizal fungi associated with the polar willow Salix polaris in a deglaciated area in the High Arctic, Svalbard. Polar Biol. 2011, 34, 667–673. [Google Scholar] [CrossRef]
- Westermann, S.; Lüers, J.; Langer, M.; Piel, K.; Boike, J. The annual surface energy budget of a high-arctic permafrost site on Svalbard, Norway. Cryosphere 2009, 3, 245–263. [Google Scholar] [CrossRef]


Publisher’s Note: MDPI stays neutral with regard to jurisdictional claims in published maps and institutional affiliations. |
© 2022 by the authors. Licensee MDPI, Basel, Switzerland. This article is an open access article distributed under the terms and conditions of the Creative Commons Attribution (CC BY) license (https://creativecommons.org/licenses/by/4.0/).
Share and Cite
Newsham, K.K.; Danielsen, B.K.; Biersma, E.M.; Elberling, B.; Hillyard, G.; Kumari, P.; Priemé, A.; Woo, C.; Yamamoto, N. Rapid Response to Experimental Warming of a Microbial Community Inhabiting High Arctic Patterned Ground Soil. Biology 2022, 11, 1819. https://doi.org/10.3390/biology11121819
Newsham KK, Danielsen BK, Biersma EM, Elberling B, Hillyard G, Kumari P, Priemé A, Woo C, Yamamoto N. Rapid Response to Experimental Warming of a Microbial Community Inhabiting High Arctic Patterned Ground Soil. Biology. 2022; 11(12):1819. https://doi.org/10.3390/biology11121819
Chicago/Turabian StyleNewsham, Kevin K., Birgitte Kortegaard Danielsen, Elisabeth Machteld Biersma, Bo Elberling, Guy Hillyard, Priyanka Kumari, Anders Priemé, Cheolwoon Woo, and Naomichi Yamamoto. 2022. "Rapid Response to Experimental Warming of a Microbial Community Inhabiting High Arctic Patterned Ground Soil" Biology 11, no. 12: 1819. https://doi.org/10.3390/biology11121819