Article

Andy Warhol and His Amazing Technicolor Shoes: Characterizing the Synthetic Dyes Found in Dr. Ph. Martin’s Synchromatic Transparent Watercolors and Used in À la Recherche du Shoe Perdu

1
The David Booth Conservation Department, The Museum of Modern Art, 11W53rd Street, New York, NY 10019, USA
2
Chemistry Department, The City College of New York, 160 Convent Avenue, New York, NY 10031, USA
3
The Conservation Center at The Institute of Fine Arts, New York University, The Stephen Chan House 14 East 78th Street, New York, NY 10075, USA
4
Ph.D. Program in Chemistry, The Graduate Center, City University of New York, 365 5th Avenue, New York, NY 10016, USA
*
Author to whom correspondence should be addressed.
Colorants 2023, 2(1), 1-21; https://doi.org/10.3390/colorants2010001
Submission received: 10 November 2022 / Revised: 1 December 2022 / Accepted: 4 December 2022 / Published: 22 December 2022

Abstract

:
Synthetic organic dyes were extensively used by artists in the first half of the 20th century, knowingly or otherwise. This included Andy Warhol and his À la Recherche du Shoe Perdu (c. 1955), a major portfolio of hand-colored prints, a copy of which resides in the collection of The Museum of Modern Art (MoMA). Warhol and his friends were known to use Dr. Ph. Martin’s Synchromatic Transparent Water Colors to bring these prints to life. A historical set of Synchromatic Transparent Watercolors were initially investigated by UV-visible spectroscopy, and samples from the historic set were also characterized by µ-Fourier transform infrared spectroscopy for fingerprint identification. To better elucidate the nature of the mixtures present, thin-layer chromatography was coupled with surface-enhanced Raman spectroscopy to separate the components of all colorants in the set. The dyes decisively identified include Acid Red 73, Acid Red 87, Acid Red 17, Acid Red 103, Basic Red 1, Acid Orange 7, Acid Yellow 23, Acid Green 1, Basic Green 4, Acid Blue 3, Acid Blue 93, Basic Violet 3, Basic Violet 10, Basic Violet 17, and Acid Black 2. Overall, Acid Blue 3, along with Acid Orange 7 and Acid Black 2, were found in the greatest number of dyes in the Dr. Ph. Martin’s set. Data from the historic set was subsequently used for direct comparison with reflectance spectra from the Warhol portfolio using principal component analysis. Microfade testing on a Synchromatic Transparent Watercolors brochure was also conducted to identify fugitive colorants, the results of which were extrapolated to each of the prints in the Warhol portfolio. The analysis provided further insight into the dyes used in À la Recherche du Shoe Perdu and confirmed the extreme light sensitivity of some colorants and the fastness of others.

1. Introduction

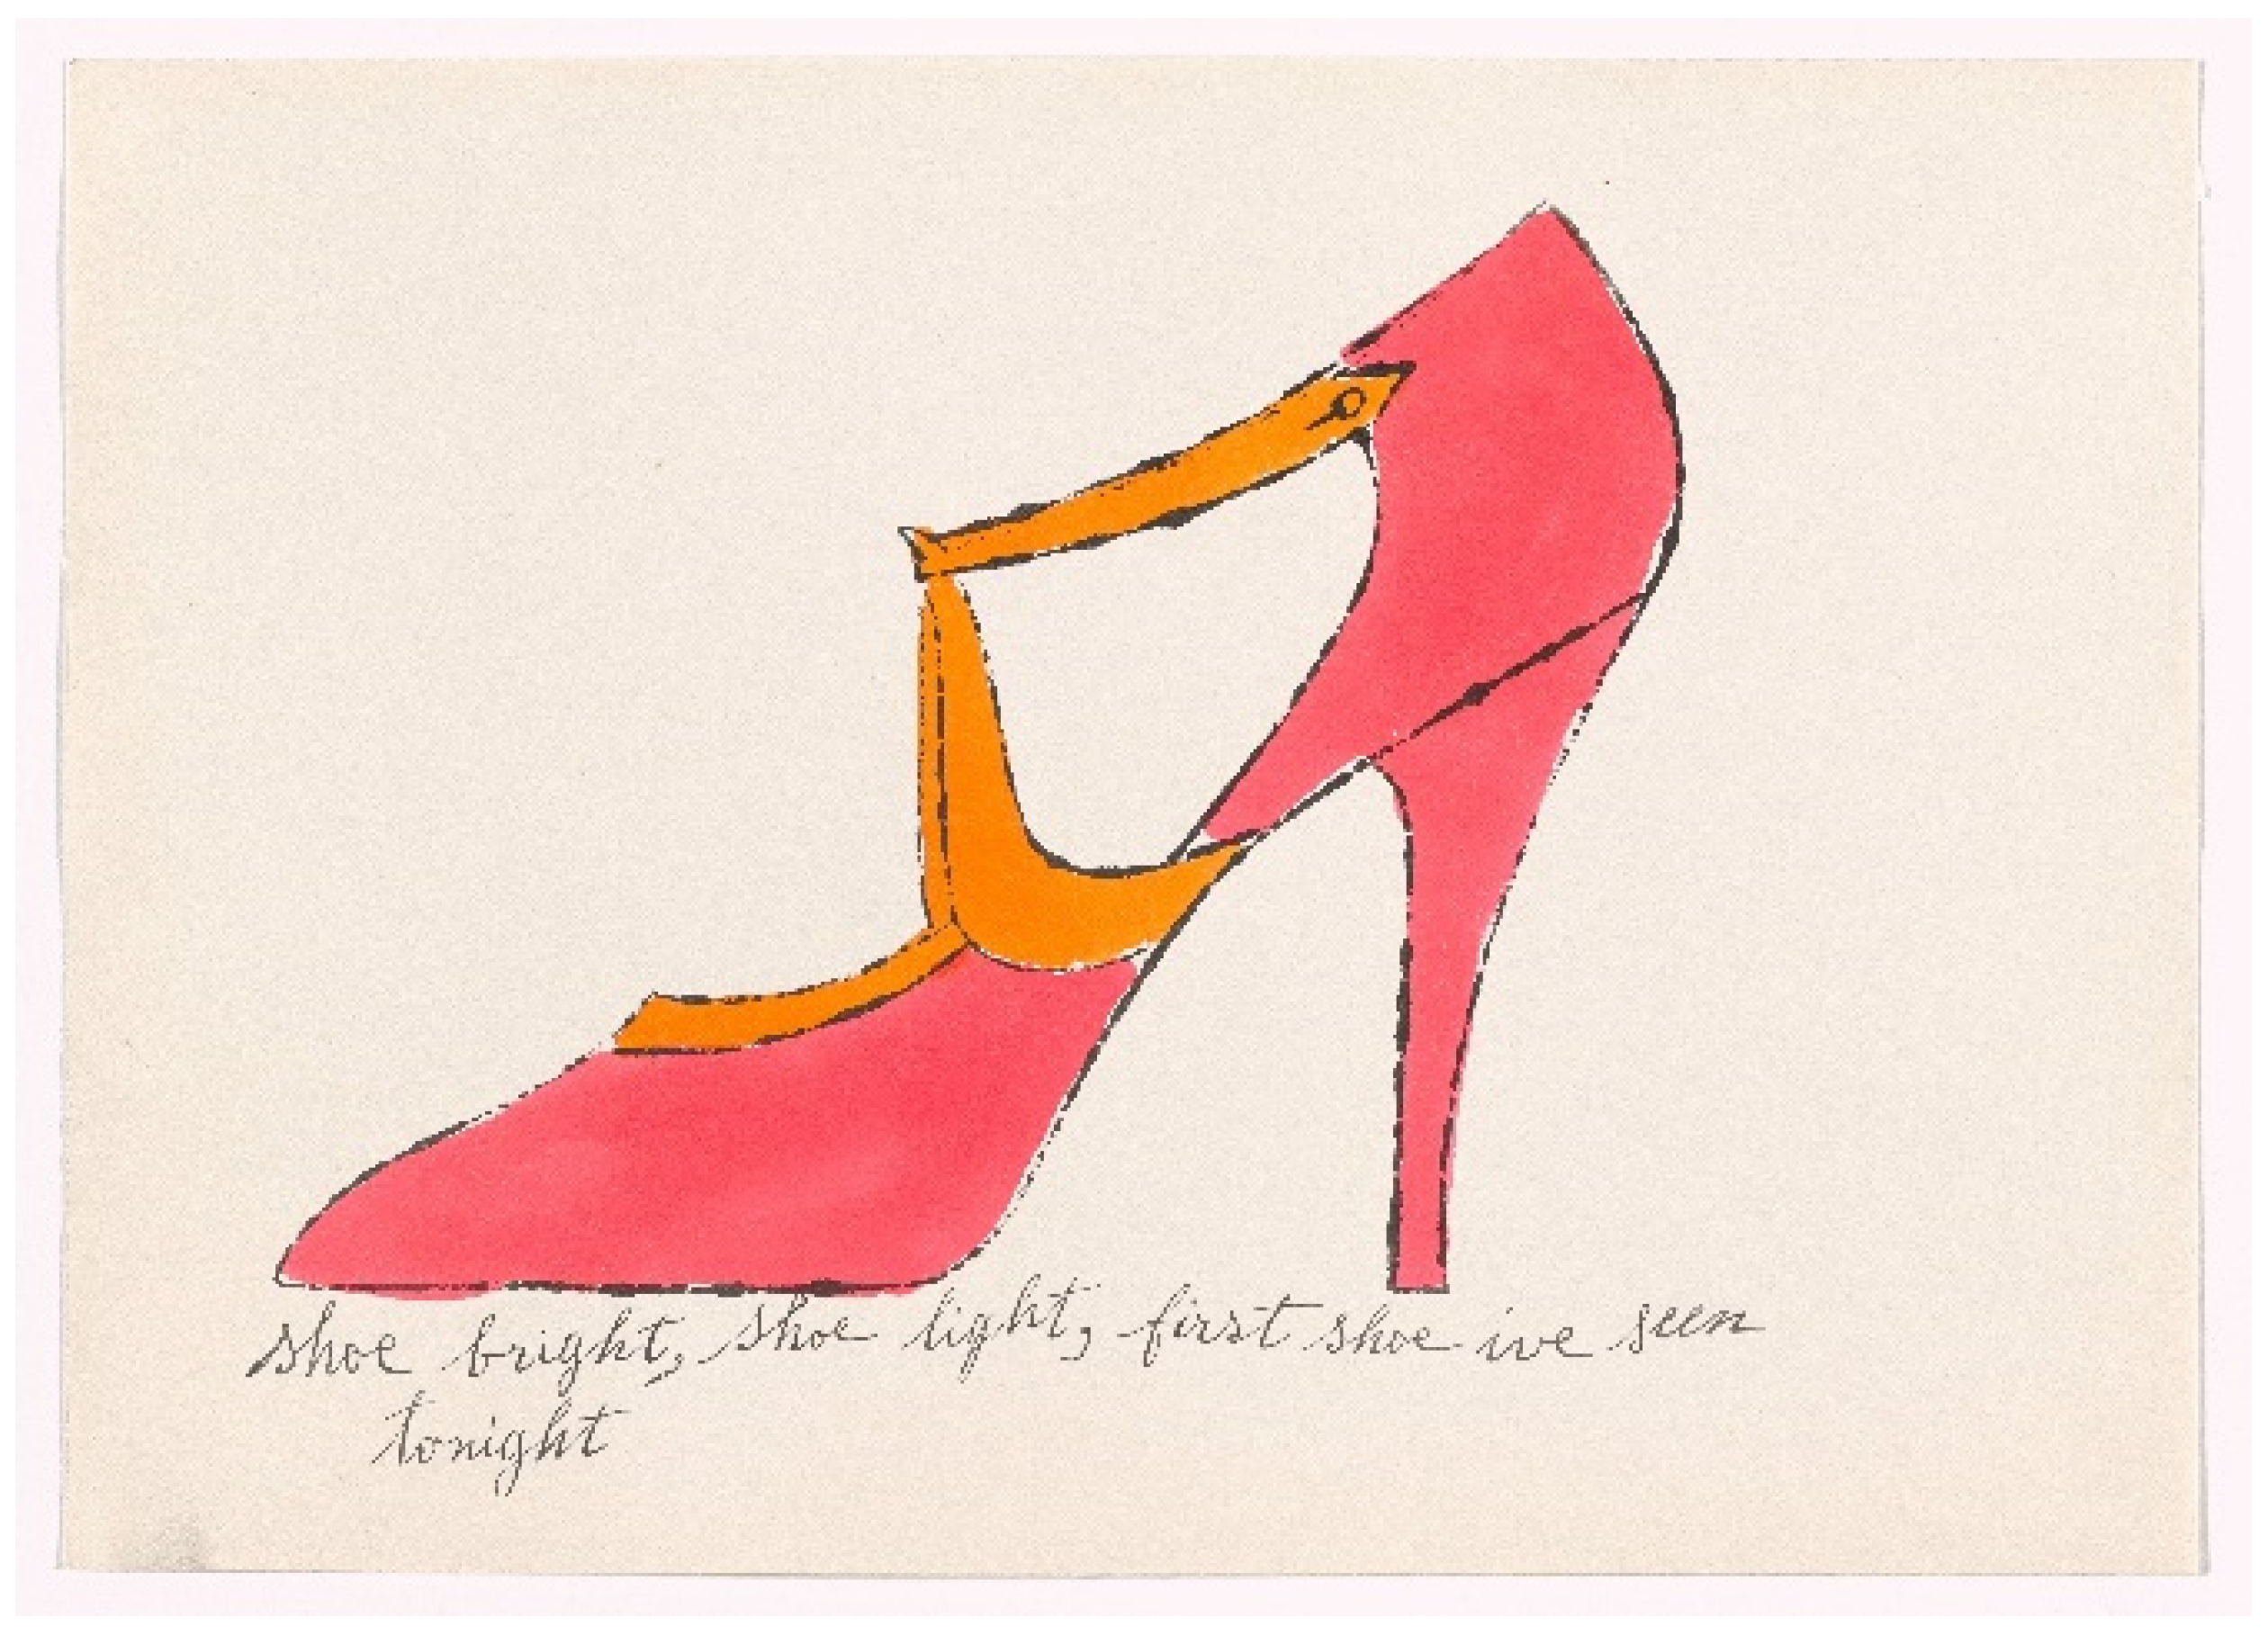
1.1. Art Historical Background

Andy Warhol (1928–1987), a Pittsburgh native, was trained in pictorial design at the Carnegie Institute of Technology in 1949, which included illustration. He quickly moved to New York after graduating, where he found work as a commercial illustrator for advertisers and fashion magazines. He frequently freelanced for the I. Miller Show Company to illustrate their designs with brightly colored advertisements published in the likes of The New York Times and Harper’s Bazaar. Mirroring what will later become his famous Factory in Manhattan, Warhol would gather as many as 20 friends for coloring parties at his favorite hangout, Serendipity ice cream shop. There, the group would brush the brightly colored watercolors onto lithographs of shoes among other designs, which were often used as elaborate gifts to clients and friends. The portfolio under consideration in this paper belongs to the 1955 portfolio À la Recherche du Shoe Perdu (Figure 1; abbreviated to Shoe Perdu for the remainder of this manuscript), a pun on Marcel Proust’s landmark À la Recherche du Temp Perdu. The MoMA portfolio contains all 17 illustrations intended for this series, and they are remarkably bright and in excellent condition. These prints are in stark contrast to some other examples reported in the literature [1] or brought to auction [2], where the colors have but mostly disappeared, rendering large swaths near colorless.
Warhol and friends are reported to have used Dr. Ph. Martin’s Synchromatic Transparent Water Colors to bring these illustrations to life. Concocted in 1934 by B. Arenstein, they are still sold today. They are primarily marketed at commercial artists for their brilliance in reproductions, which was especially important in the pre-digital world of advertisements. However, these watercolors have been noted as incredibly fugitive—a fact included in all product literature—perhaps because they were intended for commercial reproductions. According to interviews with Larry Salis (President & Chief Executive Officer of Salis International Inc, the company that produces Dr. Ph. Martin’s Synchromatic Transparent Water Colors), these watercolors have not changed formulation since their arrival on the market, and are advertised as non-toxic and primarily composed of water, acid, basic, and direct synthetic dyes [1]. It is worth noting that Warhol used this brand of watercolors throughout his career, including in other shoe illustrations, his late 1950s portfolio 25 Cats named Sam, and his 1977 Hammer and Sickle series.

1.2. Analysis of Synthetic Organic Dyes

Various techniques have been implemented for the study of the synthetic organic dyes in the literature, varying in ease and sensitivity. Techniques that require little to no sample preparation, such as Fourier transform infrared spectroscopy (FTIR) [3], Raman spectroscopy [4,5], and ultraviolet–visible absorbance (UV-Vis) spectroscopy [6], can be employed successfully to identify synthetic organic dyes, owing in part to large databases and published literature on the topic. Additionally, beyond single spectra, the creation of robust databases to analyze both pigments and dyes can be paramount for identifying their presence in an art work [7,8,9,10,11,12,13,14,15,16,17]. However, these techniques can have limitations related to separating mixtures in order to distinguish between dyes with comparable molecular structures. More sensitive techniques that offer higher resolution, such as time-of-flight secondary ion mass spectrometry (TOF-SIMS) [18,19] or matrix-assisted laser desorption ionization mass spectrometry (MALDI-MS) [20] can be used to better distinguish small difference in molecular structure among dyes of a similar class. However, data interpretation can prove challenging and mixtures might similarly be difficult to parse through.
Separation techniques are therefore needed to resolve dye mixtures. High-performance liquid chromatography (HPLC), especially when coupled to a diode array detector (DAD) and/or mass spectrometry (MS), has proven useful for the identification of dyes. [21,22] This technique can be challenging in terms of experimental design and maintenance, and few institutions own or maintain access to such instrumentation. On the other hand, Raman spectroscopy, especially portable models, have become more readily available and are more user friendly, but analysis of synthetic organic dyes can be challenging because overwhelming fluorescence can mask spectral features [23]. The use of surface-enhanced Raman spectroscopy (SERS) quenches this fluorescence by coupling the analyte to a metallic substrate, made most commonly of silver or gold [24,25,26,27,28].
Nevertheless, SERS is not inherently a separation technique and coupling it with thin-layer chromatography (TLC) can make for a sensitive and efficient separation technique that reduces the amount of material needed for analysis. TLC-SERS was first reported in 1977 by Henzel [29] and has been since successfully employed for the separation and detection of natural and synthetic dyes [30,31,32,33,34]. While the technique can suffer from what are termed “coffee-ring” effects, where the migration of nanoparticles and analytes can result in poor efficacy and repeatability of SERS [35,36], it remains a formidable technique for dye separation and identification.

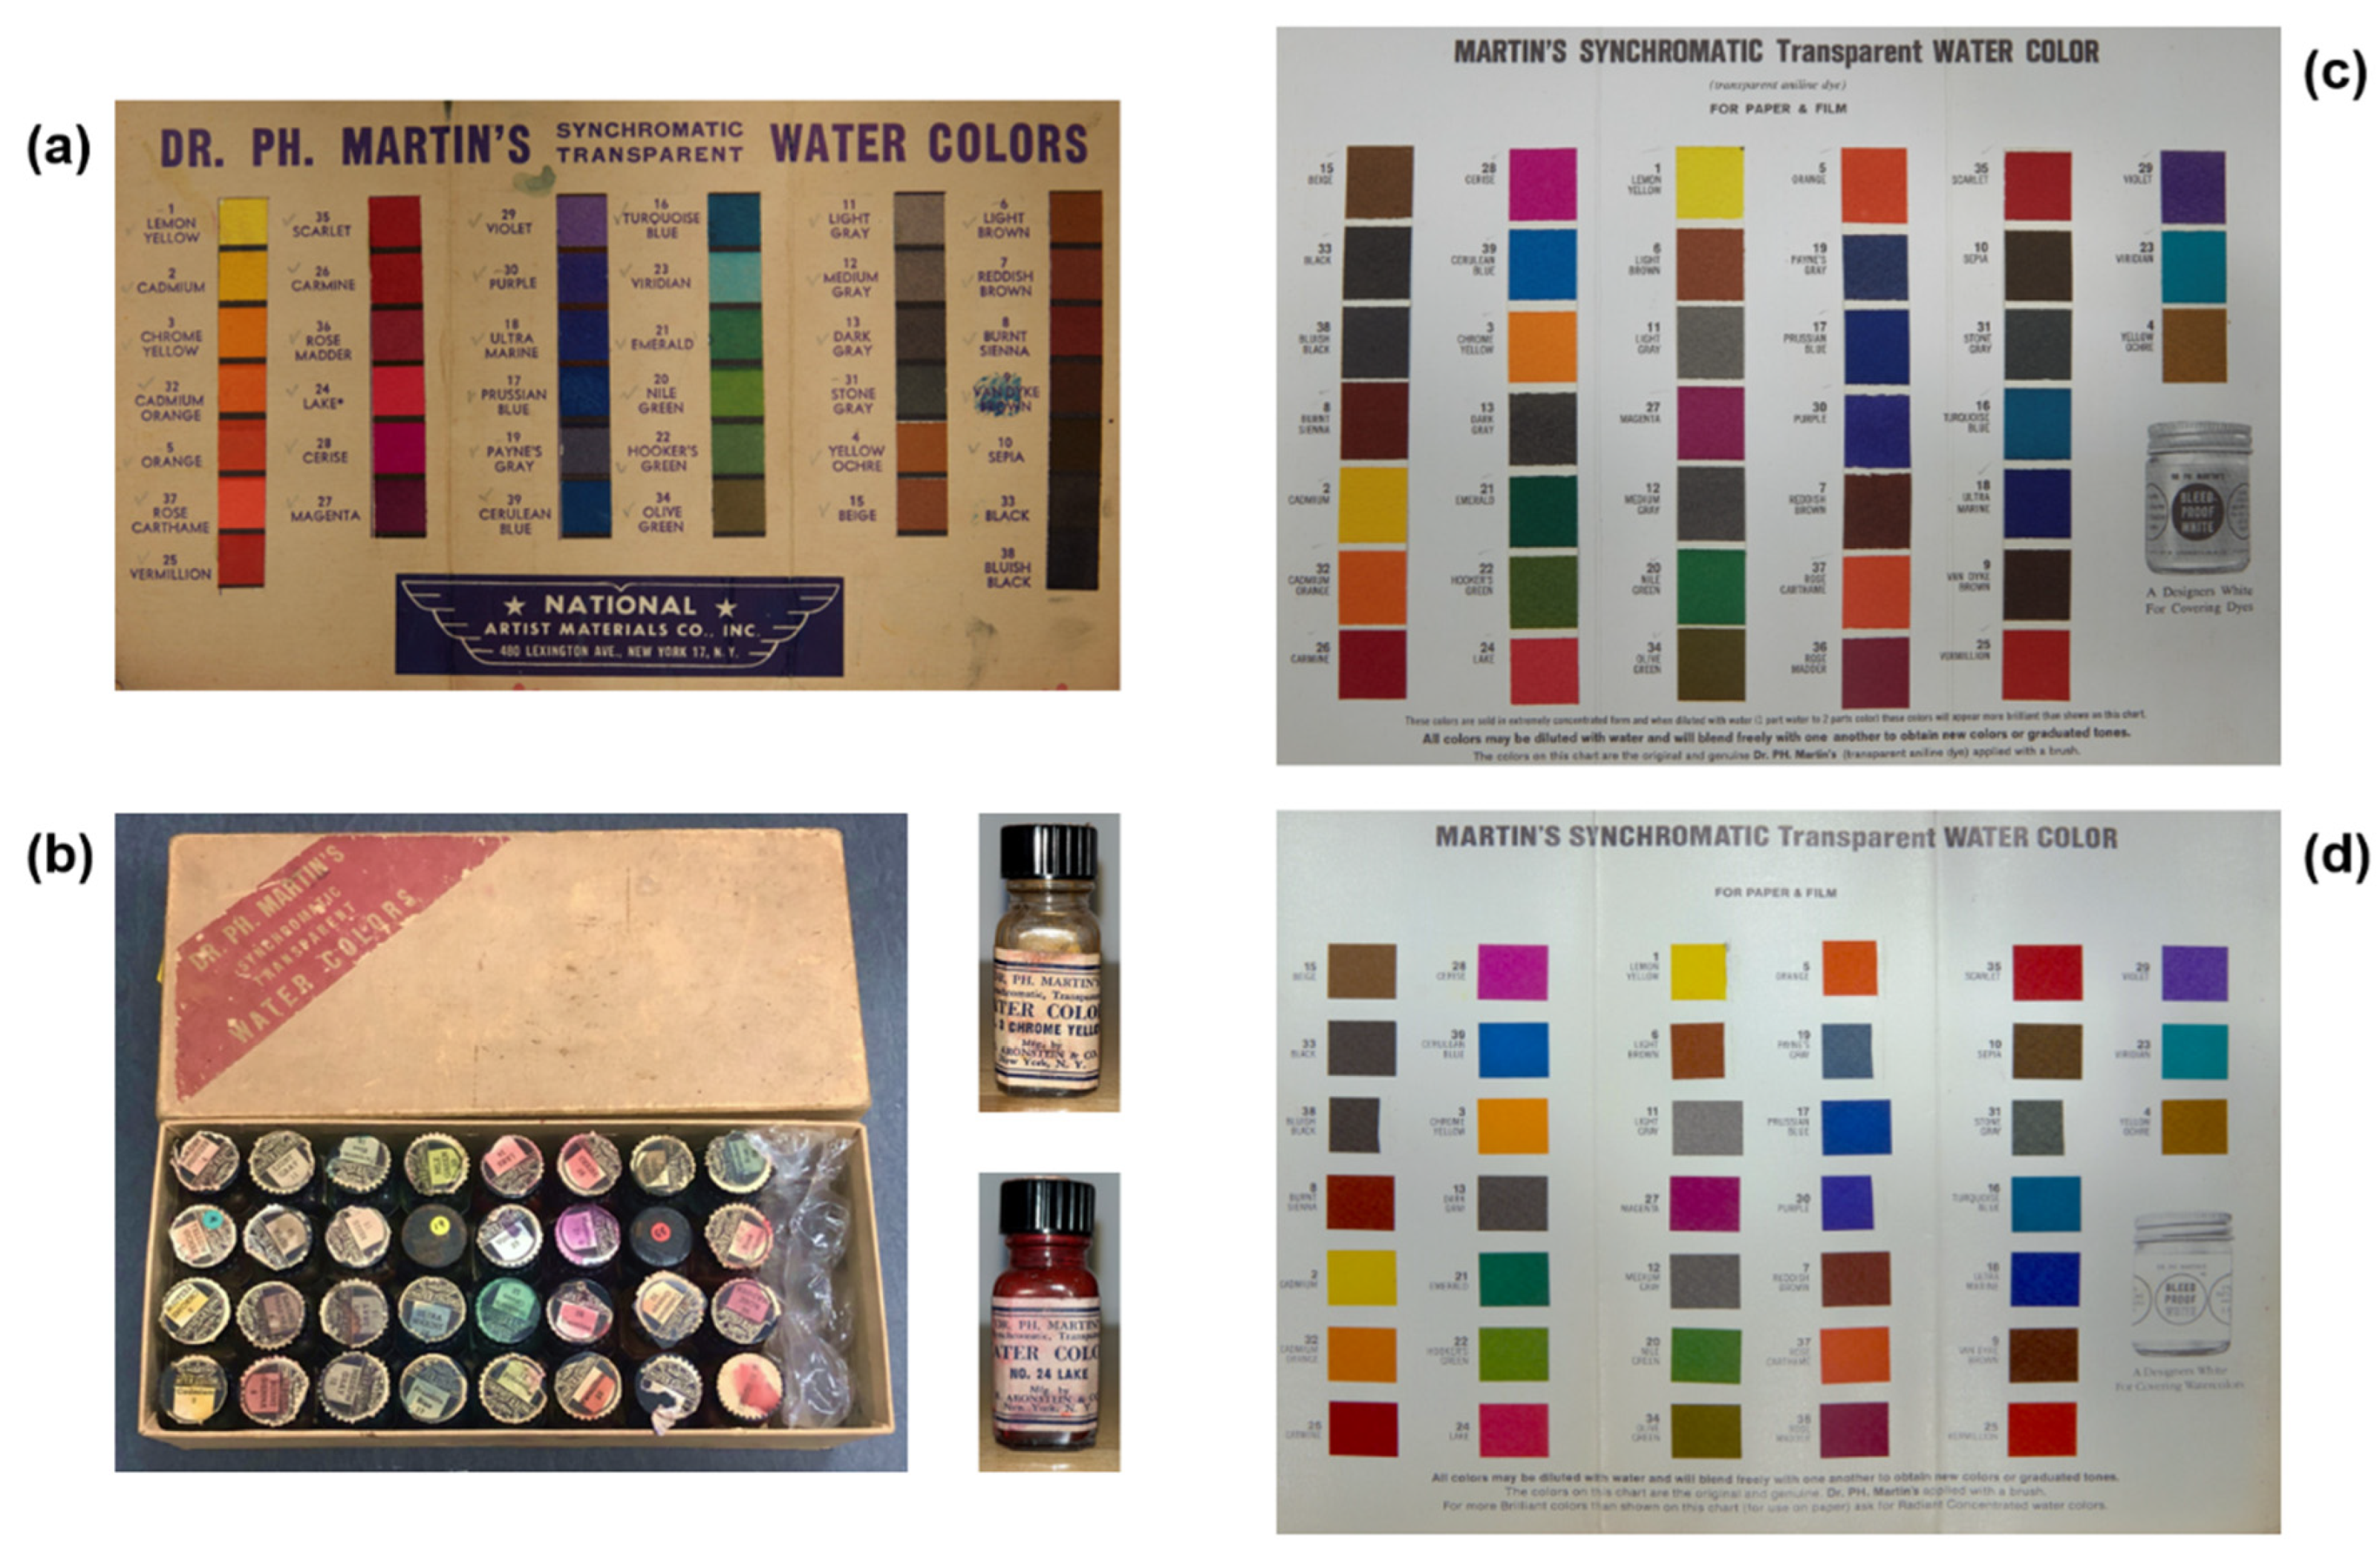
1.3. Dr. Ph. Martin’s Synchromatic Transparent Water Colors: Current Research

The work presented here builds on previous research carried out by Goldmann in 2000 on severely faded lithographs from an edition of Shoe Perdu, and analysis confirmed that the colorants used were Dr. Ph. Martin’s Synchromatic Transparent Water Colors [1]. Preliminary instrumental analysis conducted using µ-FTIR and HPLC characterized the colors as mixtures of various synthetic dyes, and accelerated light aging indicated that some are indeed fugitive. However, µ-FTIR was conducted on a newly acquired set of 14 colors, and while HPLC was carried out on a vintage set of 12 colors, the dyestuff was not characterized beyond indicating the presence of mixtures. Goldmann also performed accelerated aging using a xenon-arc light source, albeit placing the samples behind ultraviolet (UV)-filtering acrylic sheeting.
Other work on a different line of Dr. Ph. Martin’s colors, the Radiant Concentrated Watercolors, was also reported in the literature. Connors-Rowe et al. characterized the emission and fluorescence spectra of all the colors in the set and further explored their light sensitivity using a xenon light source, with both UV included and excluded; a black light was also used to investigate lightfastness [37]. The appearance of the colors was also investigated under light sources with different correlated color temperatures (CCT) to better understand both display and conservation aspects related to daylight fluorescent dyes. Beltran et al. investigated the light stability of these colors when illuminated by halogen lamps under ambient and anoxic conditions using spectrophotometry and noted improvements in lightfastness for all the colors in the set when displayed in a low-oxygen environment [38].
The first phase of the present study focused on determining the total number of Dr. Ph. Martin’s colors used to paint the Shoe Perdu portfolio in MoMA’s holdings using non-invasive techniques. For each of the twenty prints, reflectance spectrophotometry was conducted on two to three distinct spots for each color in each print. Reflectance spectrophotometry was also used on three different brochures: a historic, albeit undated, brochure from the collection of the Getty Conservation Institute (GCI) (Figure 2a) that was included with a near-complete set of the colors (Figure 2b) and two brochures in MoMA’s reference collection, one undated (Figure 2c) and another with a 1983 copyright (Figure 2d). Principal component analysis (PCA) was then used as an exploratory method to identify colors with similar reflectance signatures and help establish the number of colors used in the execution of Shoe Perdu. The historic set in the reference collection of the GCI was further analyzed using a trio of other techniques: ultraviolet–visible absorbance (UV-Vis) spectroscopy, surface-enhanced Raman spectroscopy (SERS), and µ-FTIR. Dye separation was achieved using thin-layer chromatography (TLC) in conjunction with SERS. Microfade testing (MFT) was also carried out on each of the Dr. Ph. Martin’s colors in the undated MoMA brochure to assess their light sensitivity, the results of which were subsequently extrapolated to the Shoe Perdu prints to better classify them for future display. This brochure (Figure 2c) was specifically selected because it labeled the colors as “aniline dyes” and was used for MFT in lieu of analyzing the prints themselves to minimize their exposure to light overall.

2. Materials and Methods

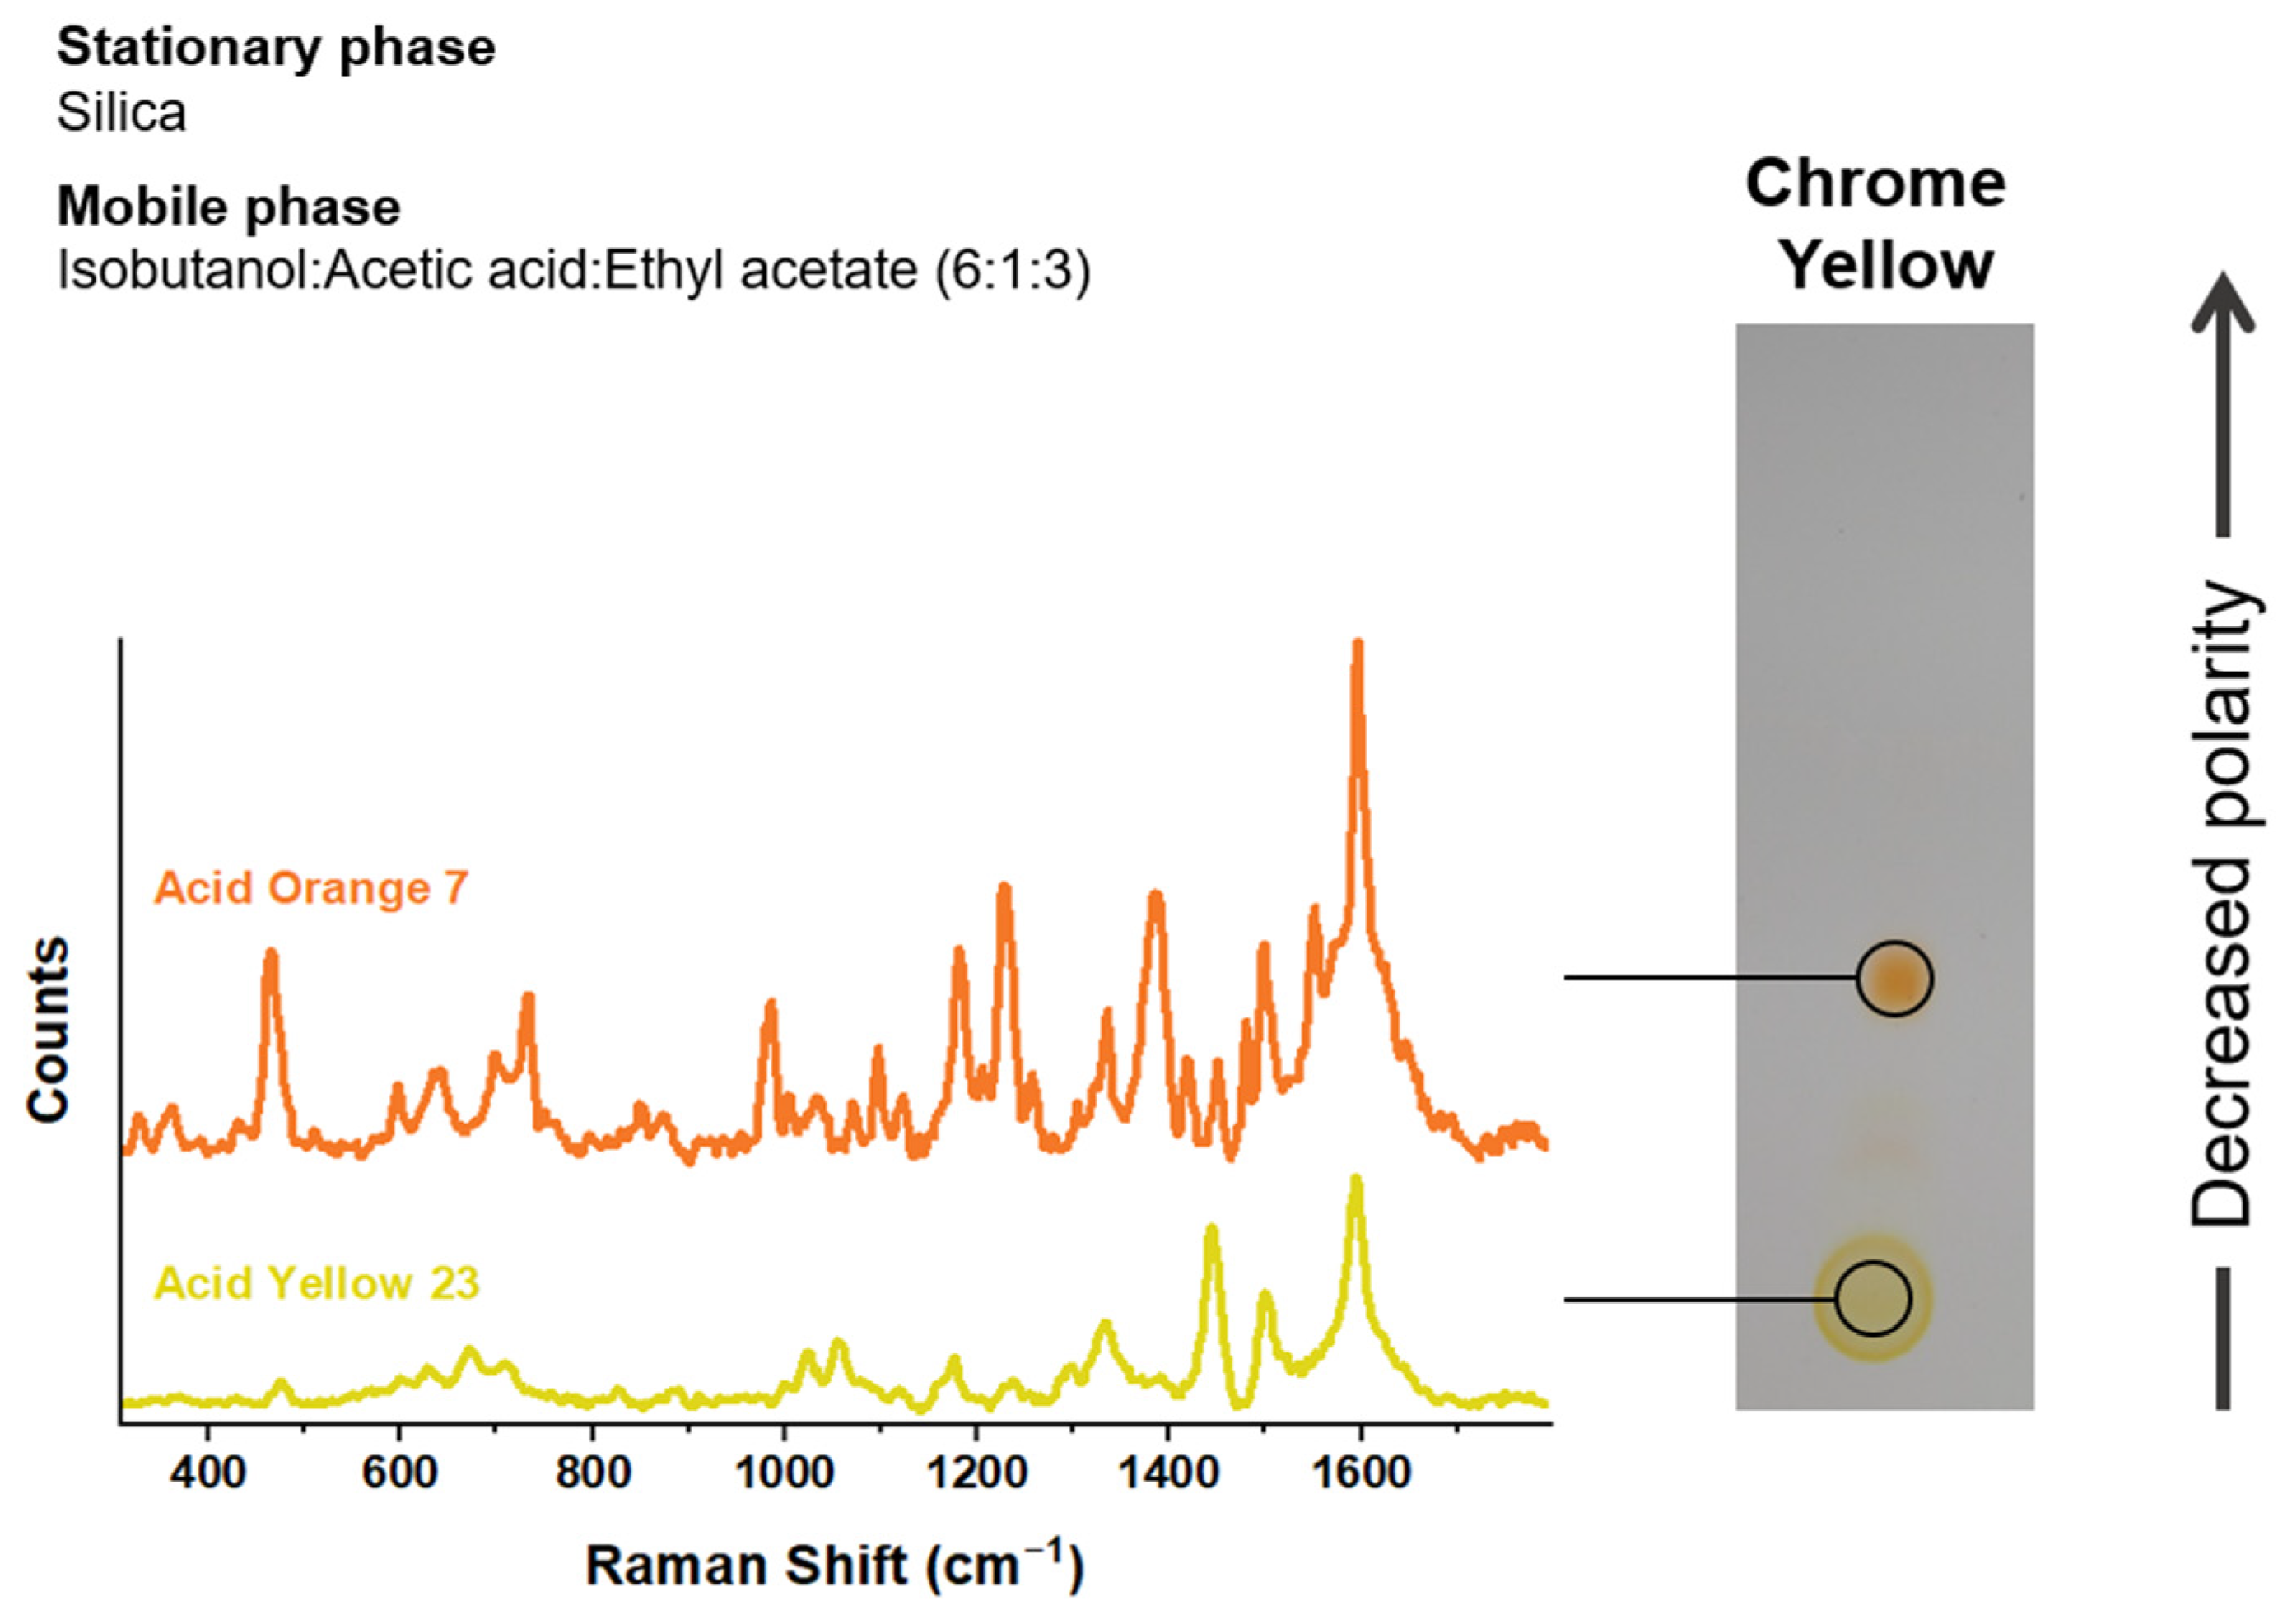
2.1. Dye Characterization

Visible reflectance spectra were taken of three Dr. Ph. Martin’s brochures and all 16 colored prints in Shoe Perdu using an X-rite eXact spectrophotometer. Spectra were acquired in the range of 400–700 nm with a 10 nm resolution and a 4 mm diameter spot size. Each spectrum presented here is the result of three averaged spectra. Analysis of Shoe Perdu involved using a mylar sheet with a small circular cutout to isolate the print from the instrument. Reflectance spectra were converted to pseudo-absorbance spectra using Kubelka–Munk theory [39], which can be described using:
Log ( 1 R )
where R is percent reflectance expressed on a scale from 0 to 1. This was done to identify the absorbance maxima in the visible range for better matching between the Shoe Perdu and Dr. Ph. Martin’s brochures. Principal component analysis (PCA) was performed on a total of 156 averaged spectra to better group the spectra and identify the watercolors used in the execution of this copy of Shoe Perdu. The pseudo-absorbance spectra were normalized for area and mean-centered before extracting the principal components (PCs). PCA was done in Solo + MIA 9.0.
UV-Vis spectroscopy was carried out by reconstituting and subsequently diluting the dried-out watercolors in ultrapure, HPLC Grade water (Thermo Fisher Scientific Inc., Waltham, MA, USA). Spectra were acquired with a Shimadzu UV-2600 Spectrophotometer with a resolution of 1 nm over a range of 190–850 nm. In the case of the seven dyes without bottles in the set, small slivers were cut from the undated MoMA brochure and added to an Eppendorf tube® with 100 µL of ultrapure, HPLC Grade water to extract the dye.
µ-FTIR was carried out in transmission mode using a Nicolet iS50-µ-FTIR coupled with a Thermo Nicolet Continuum infrared microscope equipped with an MCT detector. Spectra were collected of the dried-out, powder samples in the 4000–600 cm−1 range with a 4 cm−1 resolution and 128 scans using the Thermo Scientific OMNIC 9.0 software package. Spectra were examined using the Spectral Search and Multicomponent Search tools available in the Thermo Scientific OMNIC Specta 2.0 software.
Silver nanoparticles (AgNPs) for surface-enhanced Raman spectroscopy (SERS) were prepared according to a method developed by Lux et al. [40]. A solution of 12.5 mL of 0.5 mM silver sulfate (Ag2SO4) (≥99.99%; MilliporeSigma, Burlington, MA, USA), 0.5 mL of 1% sodium citrate dihydrate (C6H9Na3O9·2H2O) (≥99%; Thermo Fisher Scientific Inc., Waltham, MA), and 1 mL of 1% D-glucose (≥99.5%; MilliporeSigma, Burlington, MA, USA) are mixed in a Hydrothermal Synthesis Autoclave Reactor PTFE Tank (Baoshishan, Zhengzhuo, China) previously cleaned with 30% v/v nitric acid in distilled water. The starting solutions were all made with 18 MΩ deionized water. Once closed, the vessel was positioned in the center of a Panasonic model NN-SD372S inverter microwave and heated at 810 W for 2 min. 1.5 mL aliquots of this stock solution of citrate-capped AgNPs were centrifuged at 12,000 rpm for 15 min. The supernatant containing the citrate solution in excess was removed and replaced by 18 MΩ deionized water to avoid sodium citrate interference in the SERS spectra.
TLC was performed on plastic plates coated with 200 µm of Silica 60 with a particle size of 10–12 µm (SiliCycle™ SiliaPlate™, Quebec City, Canada) as the stationary phase. The mobile phase was selected based on a recipe devised by Cañamares et al. for separating different forms of mauveine, an aniline-based dye [33]. It was composed of n-butyl alcohol (99.8% purity; Spectrum Chemical, New Brunswick, NJ, USA), glacial acetic acid (99.7% purity; Thermo Fisher Scientific Inc., Waltham, MA, USA), and HPLC grade ethyl acetate (99.8% purity; Spectrum Chemical, New Brunswick, NJ, USA) in a 6:1:3 ratio, respectively [33]. Small amounts of the dry watercolors were reconstituted in 18 MΩ deionized water. Similar to UV-Vis, clippings of the seven dyes without bottles were placed in water to extract the dyes for TLC-SERS. A 5 µL drop from each dye was added to the bottom of the plate before placement in the developing chamber and allowing separation until the constituent dyes appeared well-resolved.
TLC-SERS was carried out on the plates by first dropping ~1 µL of 1mM KNO3 (reagent grade; Mallinckrodt Specialty Chemicals Company, Paris, KY, USA) on a dye before ~2 µL of AgNPs; this was done to promote aggregation of the nanoparticles and subsequent formation of high-enhancement environments known as “hot-spots” between individual nanoparticles. SERS spectra were acquired using a Renishaw In-via Raman system equipped with a 532 nm diode laser operated between 0.3 to 3 mW, 1800 lines/mm grating, and a Leica confocal microscope with a 50× LWD or 100× objective. Spectra were acquired over 0.1 and 1.5 s and 10 and 100 accumulations. Spectra were examined using the Spectral Search and Multicomponent Search tools available in the Thermo Scientific OMNIC Specta 2.0 software.

2.2. Light Sensitivity

MFT was performed using an automated microfade tester (Instytut Fotonowy, Kraków, Poland) fitted with a 3000 K LED light source operated at 900 µA over 600 s and a spot size of 550 µm. Blue Wool (BW) standard cards were purchased from Talas (USA) and were used as received. The color change was reported using the CIELab ΔE2000 (ΔE00) equation. Data was acquired using the Instytut Fotonowy MFT software version 2.0. This process was repeated three times on different spots of each sample. The average and standard deviation of ΔE00 for the three replicates were calculated and plotted over time.

3. Results and Discussion

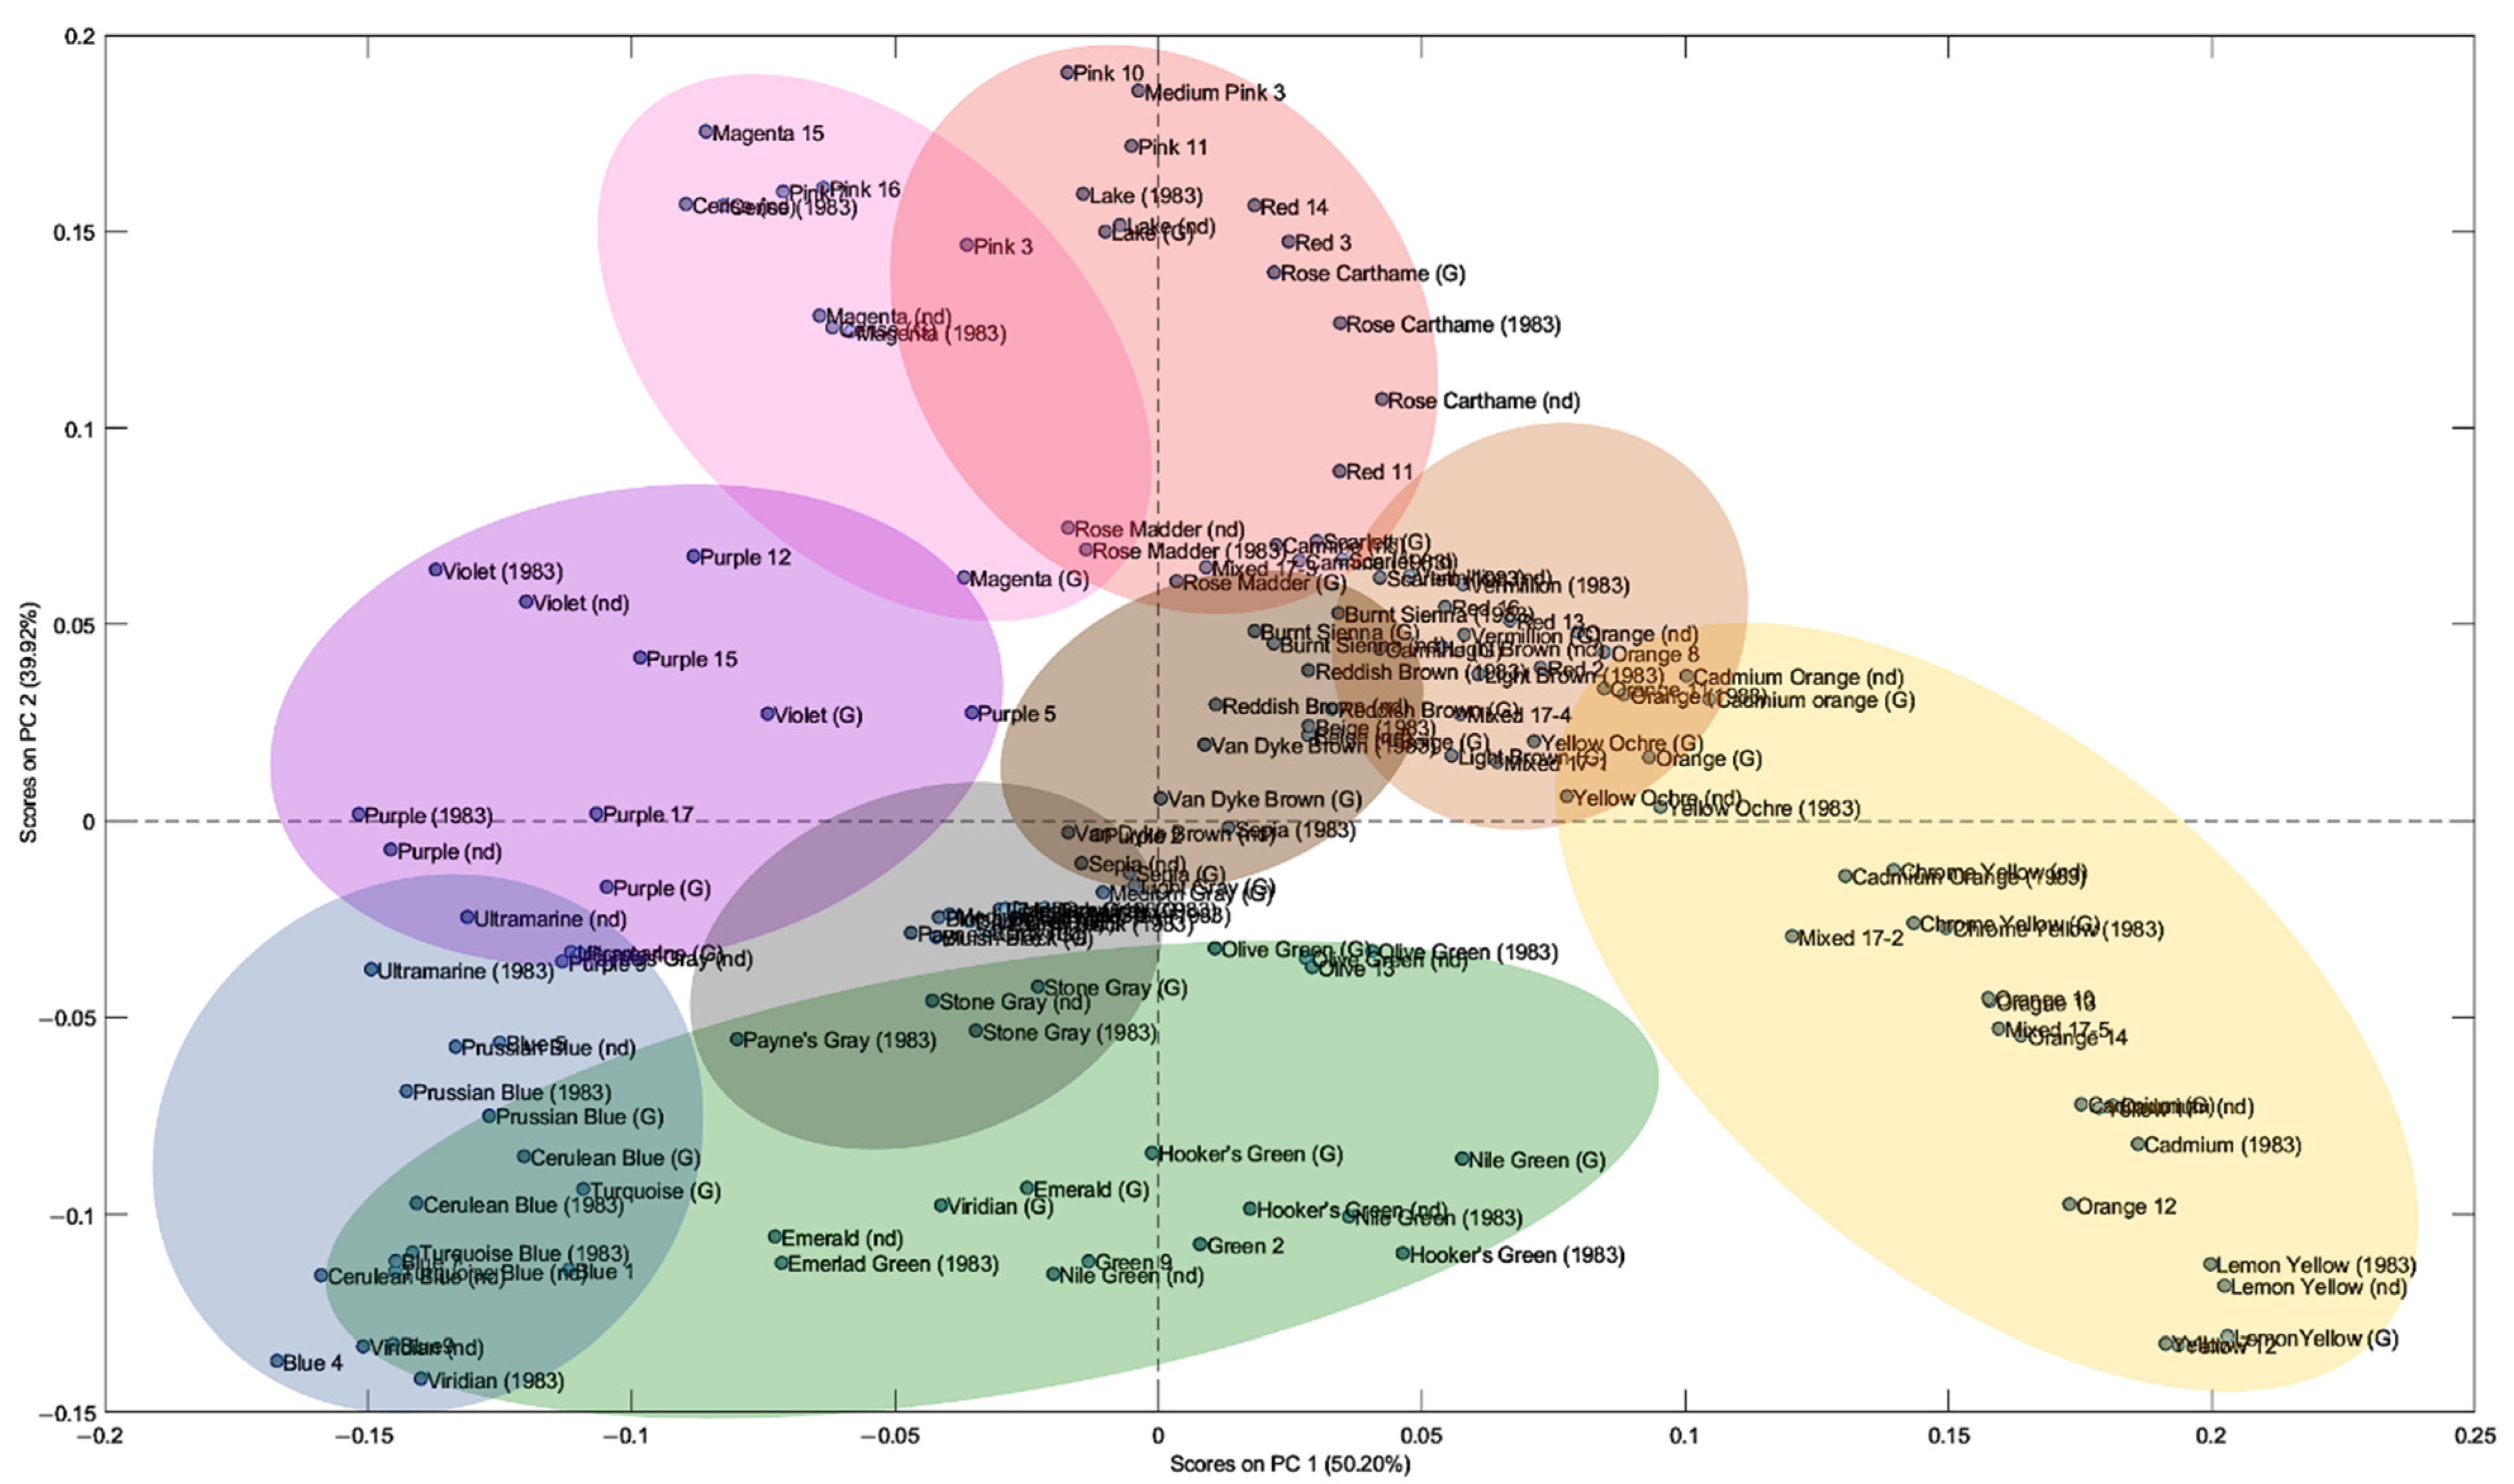
3.1. Characterization of Dr. Ph. Martin’s Synchromatic Transparent Water Colors

PCA was first used as an exploratory technique, which enabled the grouping of the watercolors by hue; two PCs accounted for 90% of the variance observed in the data set (Figure 3). Better separation was achieved for colors on the far ends of each axis, whereas reds, browns, oranges, and grays remained close to the origin. However, all 38 colors in each brochure exhibited similar, if not identical, pseudo-absorbance spectra when investigated individually, supporting the claim laid by Salis in 2000 that the formulation of the Synchromatic Transparent line has remained the same since its inception [1].
While identification of the dyes used in these colors is possible with reflectance spectroscopy, the data collected does not have sufficient resolution to differentiate between closely related species. Furthermore, the data is limited to the visible range of 400–700 nm, and colors such as yellows and reds exhibit absorbance in the UV region, below the cut-off of the instrument. Additionally, the deep shades in the printouts resulted in saturation of pseudo-absorbance for some colors, precluding fingerprint identification of specific dyes. The use of UV-Vis then proved crucial for extending the range over which data can be collected and enabled more conclusive identification of various dyes using data available in the literature. The complete µ-FITR, SERS, and UV-Vis signatures for each dye identified securely are listed in Table 1. In the Supplementary Materials, Figure S1.1–38 present the fingerprint-region µ-FITR spectra and UV-Vis spectra for each color in the set when applicable, Figure S2 illustrates the 38 TLC plates used for TLC-SERS, and Figure S3.1–17 illustrate the individual SERS spectrum per dye identified with the technique. Figure S1.3, 15, 17, 22, 23, 25, and 31 only show UV-Vis spectra obtained from coupon extracts from a MoMA brochure. Each of the following sections will briefly characterize the dyes identified in the Dr. Ph. Martin’s set and brochure clip-outs.
It is worth noting that many of the colloidal SERS spectra taken of the reconstituted dyes before separation were overwhelmed by or showed peaks for Basic Red 1 (C.I. 45160), perhaps due to mixing by its previous owner. Consequently, separation by TLC was essential for the identification of many dyes via SERS, an example of which is shown for Chrome Yellow (Figure 4). Goodman noted the presence of similar dyes among assorted colors in their analysis of a vintage set, but that was not observed in this instance and could also be due to previous mixing during use.

3.1.1. Reds

Four reds are included in the Dr. Ph. Martin’s set: Rose Madder, Carmine, Scarlet, and Vermilion. The first two appeared to only contain a single dye, where Rose Madder was composed of Acid Red 17 (C.I. 16180) and Carmine of Acid Red 103 (C.I. 50090). On the other hand, Vermilion and Scarlet were similar in that they contain the same dye, Acid Red 73 (C.I. 27290). However, Scarlet appeared to also contain an additional dye, Acid Yellow 23 (C.I. 19140), which affords it a more orange shade. The pseudo-absorbance spectra of Scarlet showed a deeper absorbance minimum in the blue region of the spectrum, corresponding to this difference in hue between the two reds. Acid Yellow 23 was decisively identified in Scarlet by separation with TLC-SERS, where it remained at the bottom of the plate.
Both Scarlet and Vermilion also showed an orange-yellow colored component that traveled farthest up the plate. Analysis with SERS showed similar peaks to that of Acid Red 73 in addition to new ones at 997, 1260, 1407, 1433, and a shoulder at ~1610 cm−1, which could point to the presence of the monoazo dye Acid Yellow 36 (C.I. 13065) [53,54], although better separation should be undertaken to decisively confirm the presence of the yellow dye.

3.1.2. Oranges and Yellows

The set contains several shades of yellow and orange; however, only four dyes were identified across all five hues, with two dyes making up the majority of the Dr. Ph. Martin’s watercolors. Only Acid Yellow 23 and Acid Orange 7 (C.I. 15510) were identified in Cadmium and Cadmium orange, respectively.
In contrast, a combination of both Acid Yellow 23 and Acid Orange 7 was identified in Chrome Yellow and Yellow Ochre, where the former contained more Acid Yellow 23 and the latter more Acid Orange 7 as seen by TLC separation. The difference in concentration was also noted in UV-Vis spectra acquired of the dyes: the spectrum for Chrome Yellow was dominated by Acid Yellow 23 with only a peak at 228 nm and a shoulder around 512 nm that corresponds to Acid Orange 7. The inverse was observed for Yellow Ochre, which was dominated by Acid Orange 7 and only showed a broad shoulder around 424 nm corresponding to Acid Yellow 23.
Another Dr. Ph. Martin’s shade called Orange appeared to contain Acid Red 73 and Acid Yellow 23. This was first seen in the UV-Vis spectra, with a prominent shoulder at ~522 nm that corresponds to the broad absorbance in the visible range for Acid Red 73 at 509 nm, and another in the UV at ~324 nm that corresponds to a doublet of the red dye at 317 and 345 nm; further broadening was observed for a peak corresponding to Acid Yellow 23 at 258 nm due to absorbance by Acid Red 73 at 246 nm. The presence of the two dyes was further confirmed by TLC-SERS with good separation, where Acid Yellow 23 remained at the bottom of the plate as seen with Scarlet.
A second yellow dye was tentatively identified by UV-Vis spectroscopy of a coupon extract of Acid Yellow 1 (C.I. 13016), which was found alone in the Dr. Ph. Martin’s Color Lemon Yellow. A SERS spectrum obtained for the dye from fibers sampled from the GCI could not be assigned to the dye; however, further work is needed to securely classify this color. Nevertheless, the SERS spectrum was also obtained for yellow components in Bluish Black and Hooker’s Green when separated by TLC.

3.1.3. Greens and Blues

Several greens and blues make up the palette of this line of watercolors, although only a select number of dyes are used in their manufacture. Nile Green and Emerald were the most similar and contained no green dyes but a combination of Acid Blue 3 and Acid Yellow 23. Reflectance spectra taken from the brochure informed the concentration of each dye in both colors, and in turn, helped differentiate them when correlating the colors to the ones used in Shoe Perdu. Whereas Emerald exhibited far higher pseudo-absorbance for Acid Blue 3 at 630 nm, Nile green exhibited roughly equal pseudo-absorbance at 630 nm and ~420 nm, the latter being indicative of Acid Yellow 23; this was also observed in the UV-Vis spectra for the two colors.
Two other greens were made up of mixtures of Acid Green 1 (C.I. 10020) and other dyes. This includes Olive Green, which was made up of Acid Green 1 and Acid Orange 7, and incidentally, the UV-Vis spectrum of this color was identical to that of Burnt Sienna, which includes both dyes. Hooker’s Green was another color that contained Acid Green 1, in addition to Acid Blue 3 and the yellow dye identified in Lemon Yellow.
Of all the greens, Viridian was the only color made up of a single dye, Basic Green 4 (C.I. 42000). However, this dye was also found in another color, Turquoise, which contained both Basic Green 4 and Acid Blue 3. Close in hue is Cerulean blue, which was only made up of Acid Blue 3. This blue dye was identified in many other colors present in mixtures, including Prussian Blue, which was identified as a combination of Acid Blue 3 and Basic Violet 3 (C.I. 42555).

3.1.4. Pinks and Purples

Among the Dr. Ph. Martin’s colors in this set, pinks were the simplest to identify as they either contained only a single dye, or a combination of dyes, with high-enhancement factors in SERS. Those include Rose Carthame (Acid Red 87; C.I. 45380), Lake (Basic Red 1), and Cerise (Basic Violet 10; 45170). For Magenta, the UV-Vis and µ-FTIR spectra only showed the presence of Basic Violet 17 (C.I. 42685), and separation by TLC-SERS identified a single peak at 1506 cm−1 in the first two spots that possibly corresponds to Basic Red 1. It is possible that the separation of these dyes was not successful with the current method and other mobile and stationary could be explored to better separate them via TLC, or could indicate past use of the set. The UV-Vis spectrum taken of Magenta showed peaks in the visible range at 489 and 549 nm characteristic of Basic Violet 17, but an additional broad and unresolved peak centered at ~516 nm could point to the presence of a second dye, perhaps Basic Red 1, which has an absorbance maximum at 526 nm in the visible range.
Two purple hues are included in this set. The first, Violet, was made exclusively of Basic Violet 3. Interestingly, the µ-FTIR spectra taken of the dried-up watercolor showed a group of peaks (1656, 1448, 1405, 1347, 1115, 1075, 1038, and 715 cm−1) [3] that could be attributed to the leuco-form of the dye, which is colorless and occurs upon photo-reduction in the excited state dye cation [55].
The other purple shade, aptly named Purple, appeared to contain both Basic Violet 3, as detected by both UV-Vis and TLC-SERS, and Acid Blue 3, identified by TLC-SERS and absorbance at 640 nm. Interestingly, this was the same combination seen in the color Prussian Blue. However, UV-Vis further elucidated the concentration of each component that makes up the final color. In Prussian Blue, the spectrum was dominated by the spectrum for Acid Blue 3, with strong absorbance at 640 nm in the visible range. On the other hand, the spectrum of Purple showed the doublet at 552 and 585 nm, with a broad shoulder ~532 nm that pointed to Acid Blue 3. The reflectance spectra in pseudo-absorbance taken from the brochures are also telling, where the spectra showed the presence of both Acid Blue 3 and Basic Violet 3. Those spectra also hinted at the concentration of each component, with stronger absorbance for the blue dye in Prussian Blue and the violet dye in Purple. Again, analysis via TLC-SERS proved crucial for confirming the presence of both constituent dyes, especially in the case of Prussian blue.

3.1.5. Browns

The brown colors were the most varied of all the watercolors in the Dr. Ph. Martin’s line, running the gamut in hue from reddish to yellowish, and from light to dark. In all these colors, Acid Orange 7 was identified conclusively with all techniques. The simplest of these mixtures were found in Beige, Light Brown, Reddish Brown, and Van Dyke Brown, which contained the orange dye and Acid Blue 3, Acid Red 73, Acid Red 17, and Acid Black 2, respectively.
Burnt Sienna and Sepia contained complex mixtures of four different dyes each. TLC separated Burnt Sienna into four dyes, some of which were also observed in the absorbance spectrum obtained by UV-Vis; the dyes include Acid Green1, Acid Blue 3, Acid Red 73, and Acid Orange 7. Sepia also was made of four different dyes: Acid Black 2, Acid Blue 3, Acid orange 7, and a red dye that proved difficult to identify with the techniques used and merits further work.

3.1.6. Blacks and Grays

Acid Black 2 was the only black dye identified in the set. Dark, Medium, and Light Grays all were solely made up of Acid Black 2. Black and Bluish Black were mixtures and separated with TLC, where the former additionally contains Acid Orange 7 and the latter additionally contained the yellow dye identified in Lemon Yellow. Other dark colors in the set that contained Acid Black 2 in addition to other dyes include Payne’s Gray, Stone Gray, Sepia, and Van Dyke Brown.
Payne’s Gray and Stone Gray also appeared to contain mixtures with Acid Black 2 as identified by TLC-SERS: Payne’s Gray contained Acid Blue 93 and Stone Gray contained Acid Green 1. The absorbance spectra of each color also confirmed the mixtures. The absorbance spectrum acquired of Payne’s Gray showed very little absorbance in the visible range, with a weak and broad band centered ~575 nm, a significant blue shift from 609 nm that possibly marks a degradation of the Acid Blue 93 component [56] and only a sharp absorbance at 195 nm could be attributed to the blue dye. In the case of Stone Gray, peaks at 199 and 289 nm and a broad peak extending from 600–800 nm, point to the presence of Acid Green 1.

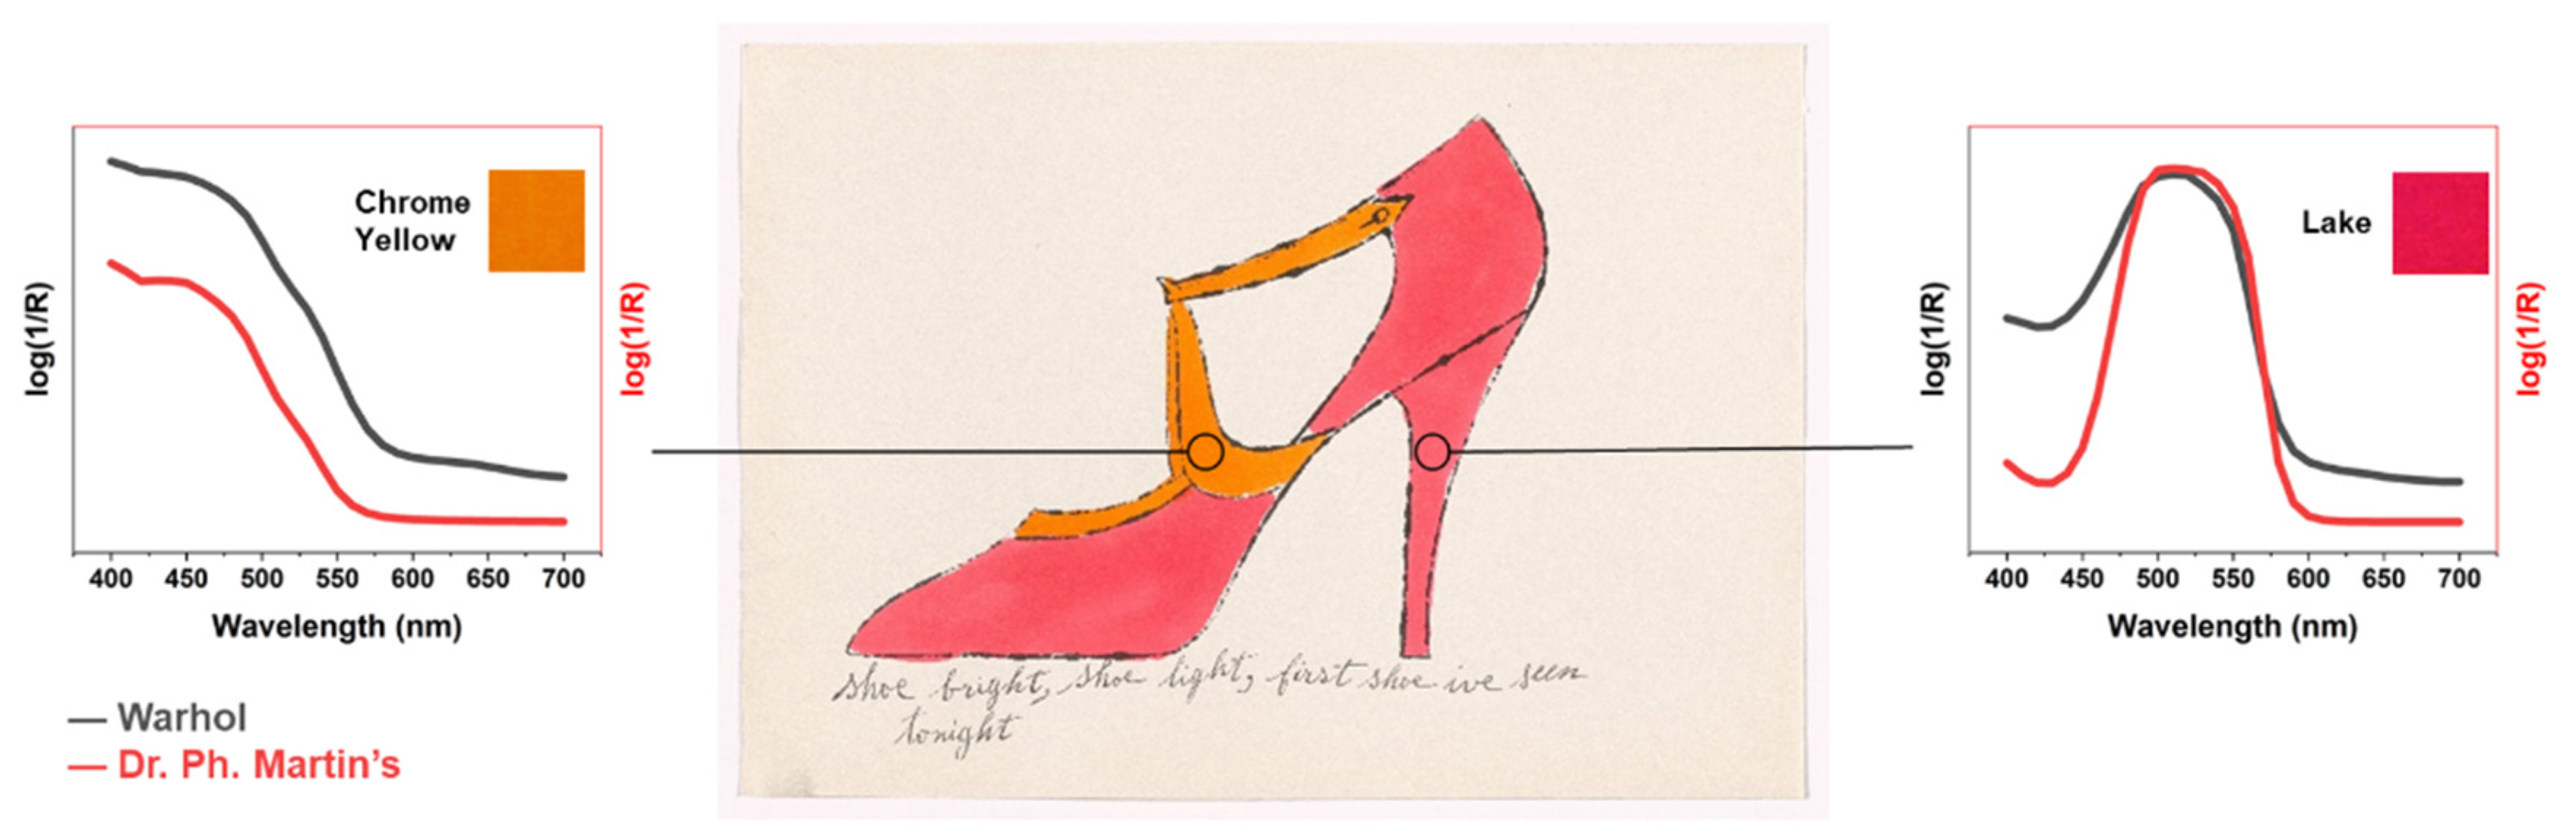
3.2. Correlation between Dyes Identified and Colors Used in Andy Warhol’s À la Recherche du Shoe Perdu

In total, 18 colors were identified by reflectance spectrophotometry (Figure S4) and an example is shown in Figure 5. The results are summarized in Table 2. Mixtures were also identified in reflectance spectrophotometry when one or more peaks that did not belong to the dominant dye were observed. A purple in plates 1, 2 and 12 was made up of Magenta and a color that contained Acid Blue 3, perhaps Cerulean Blue or Turquoise; the yellow in plates 7 and 12 was made up of Lemon Yellow and a green, possibly Nile Green; the orange of plate 8 was made up of Rose Carthame and Lemon yellow; and an orange in plate 12 that was made up of Lemon Yellow and Vermilion. Plate 17, on the other hand, was not an outright mixture, but Cerise laid over Cadmium, which is further illustrated by the mixing of the colors that appears as bleeding. The identification of mixtures is crucial to note, as some colors could exhibit higher sensitivities to light than others in a mixture. Stylistically, it also speaks to the liberties taken by Warhol and his friends in coloring these prints during their gatherings, reflecting the kind of artistic freedom Warhol valued in his acolytes over the years.

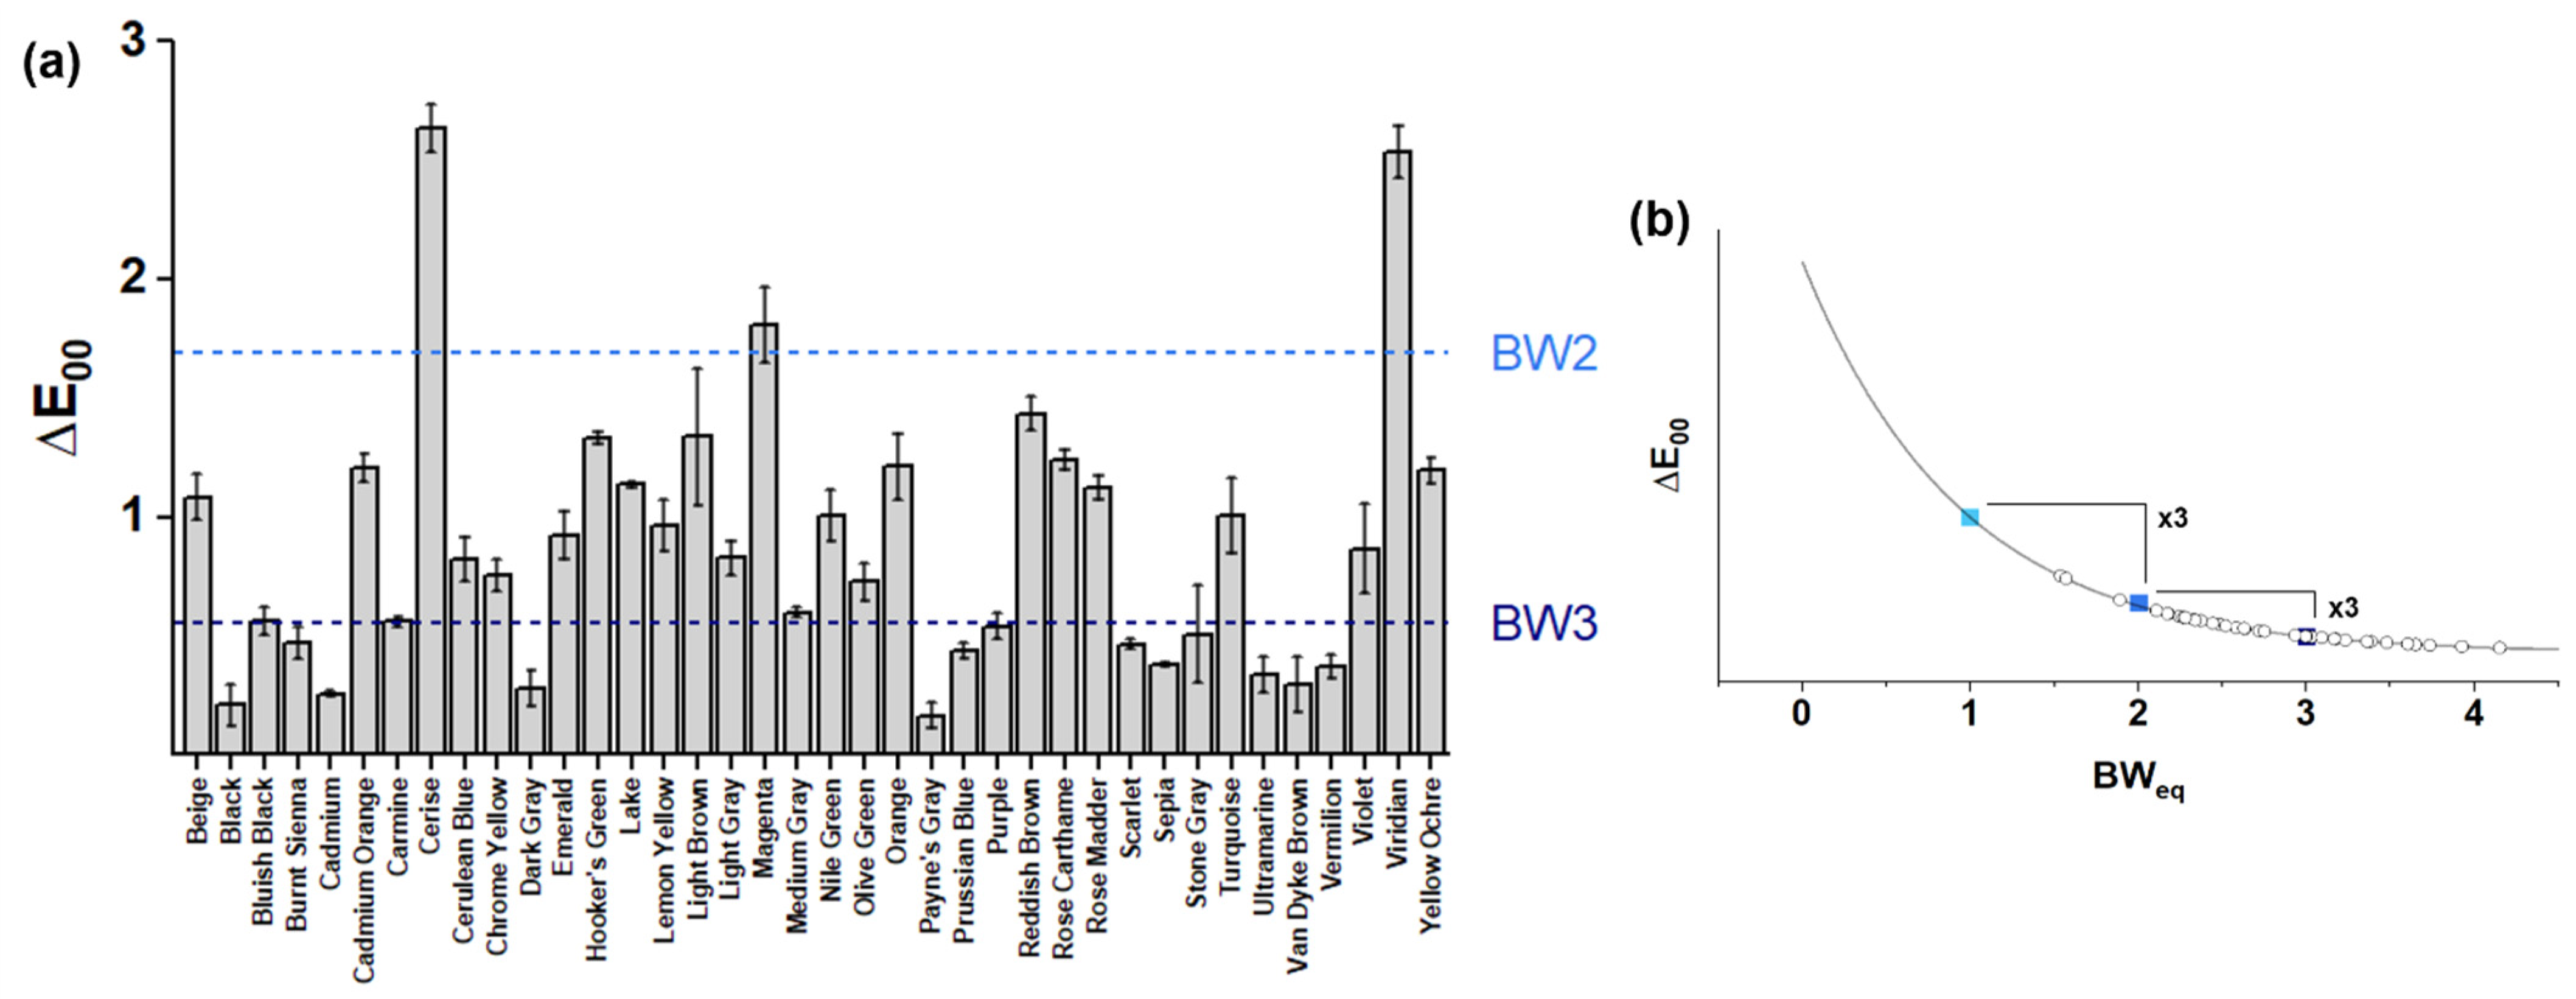
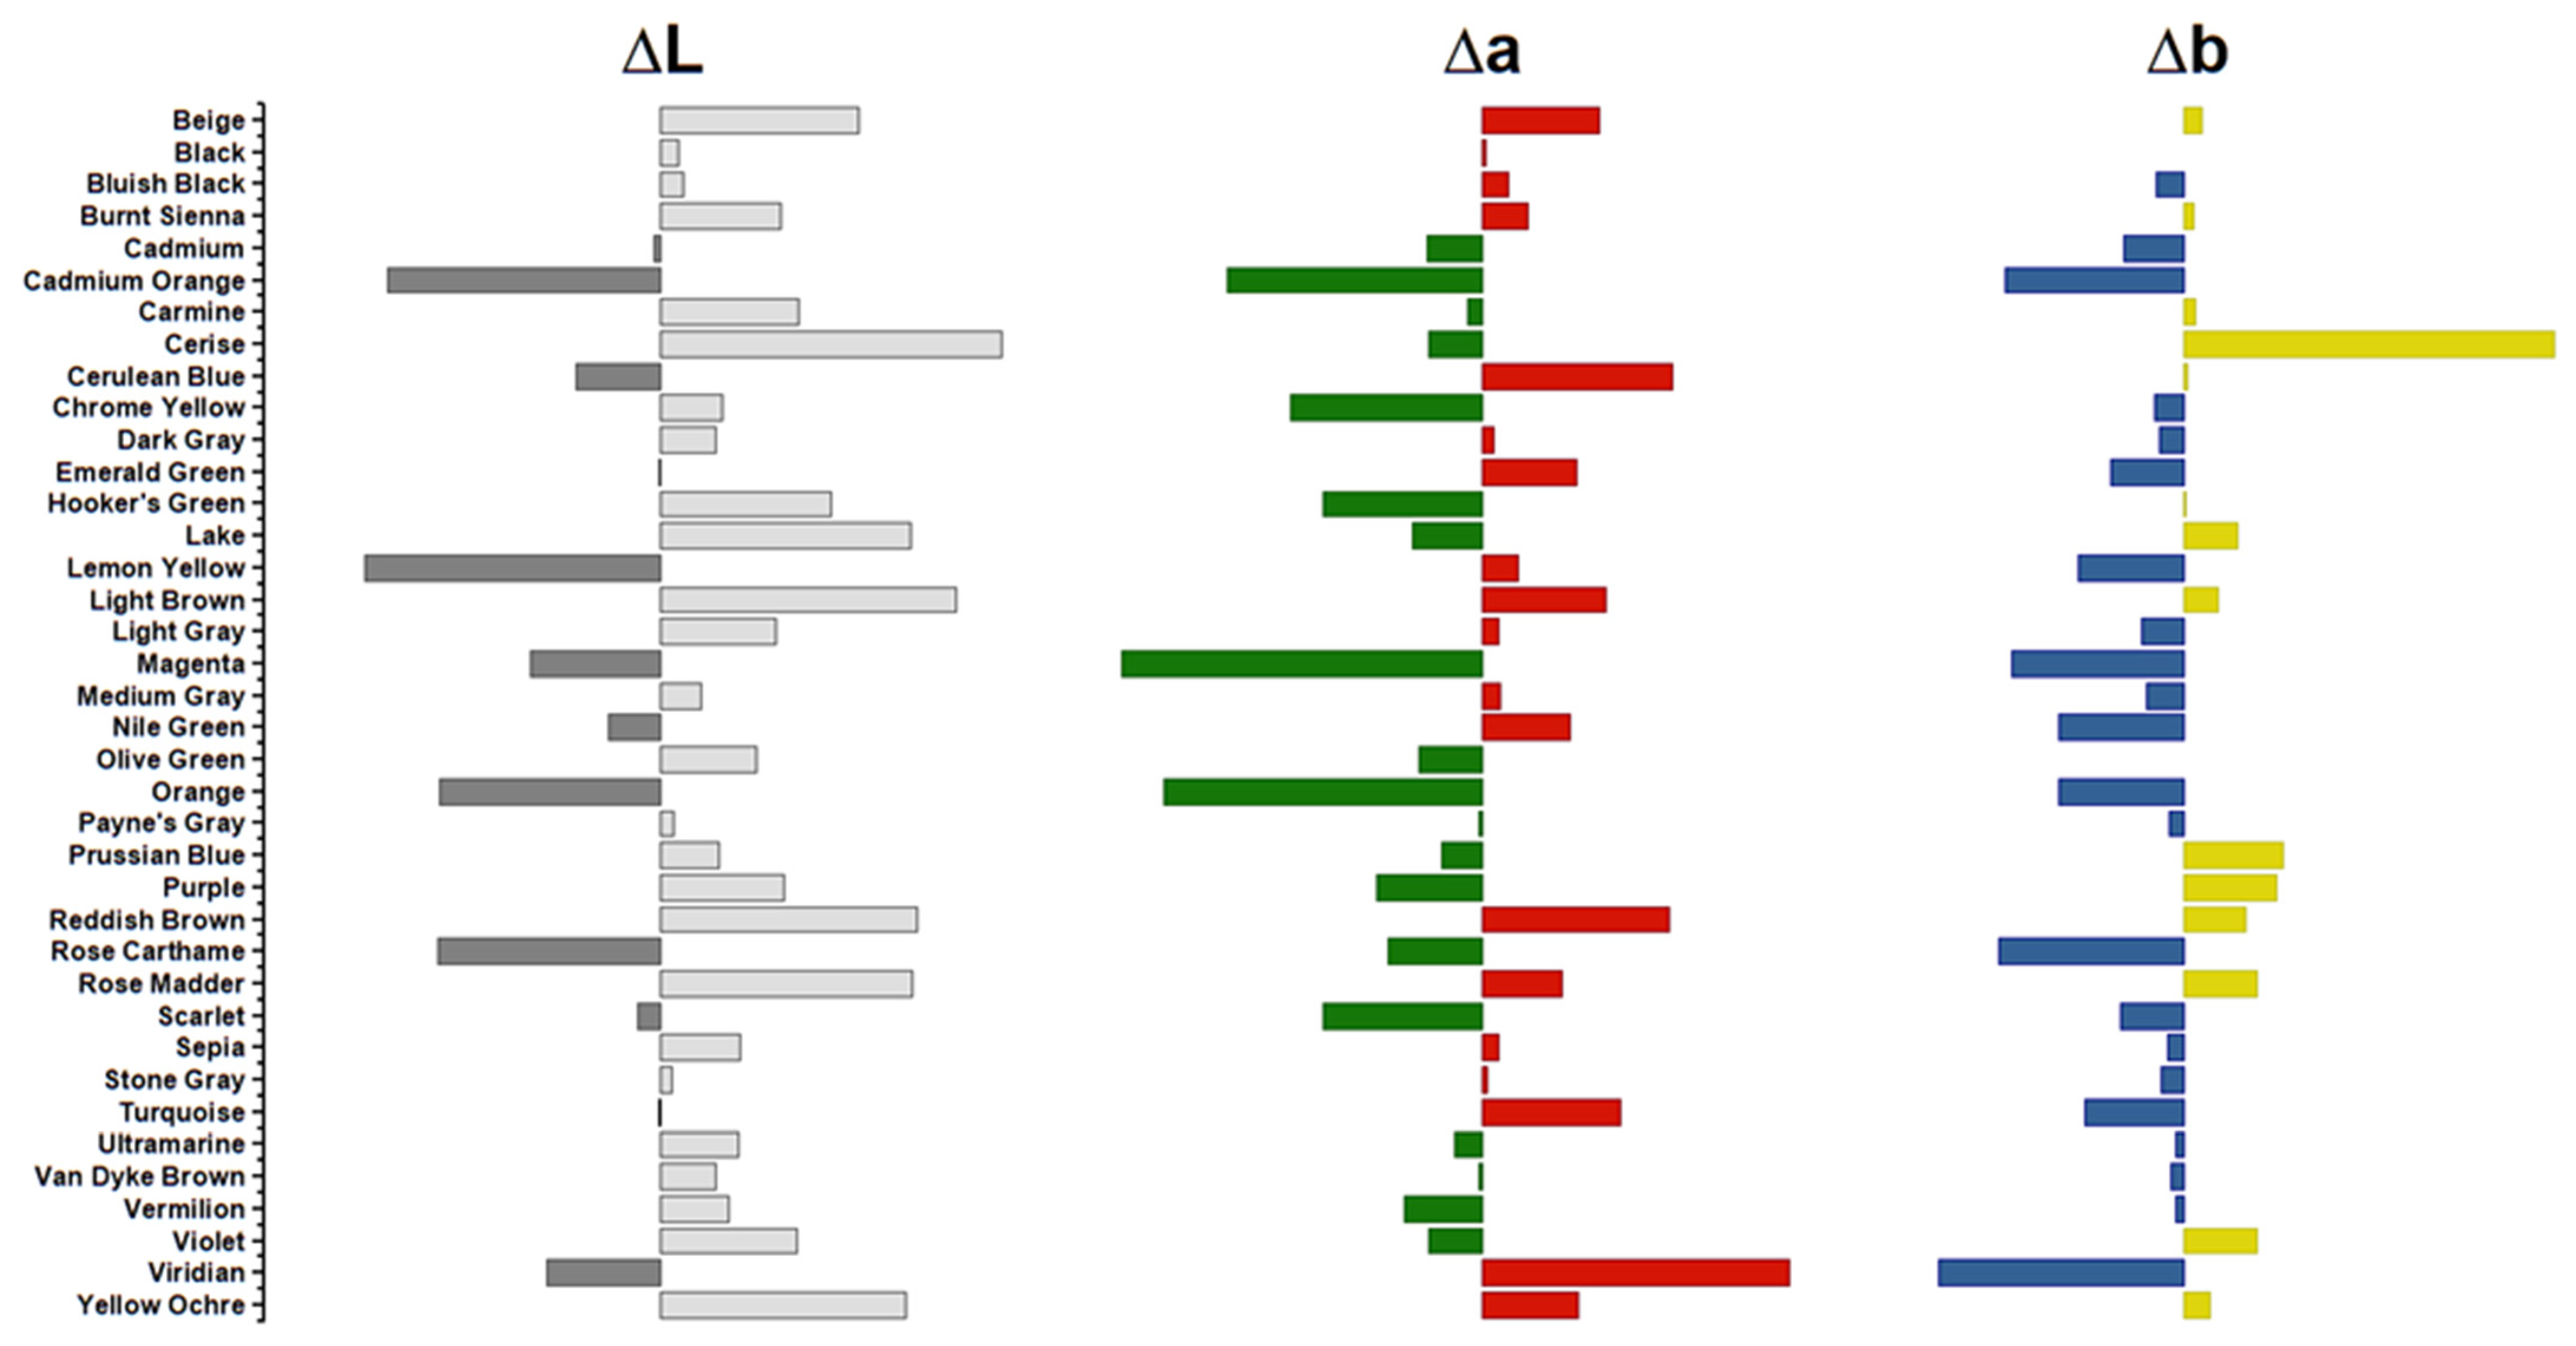
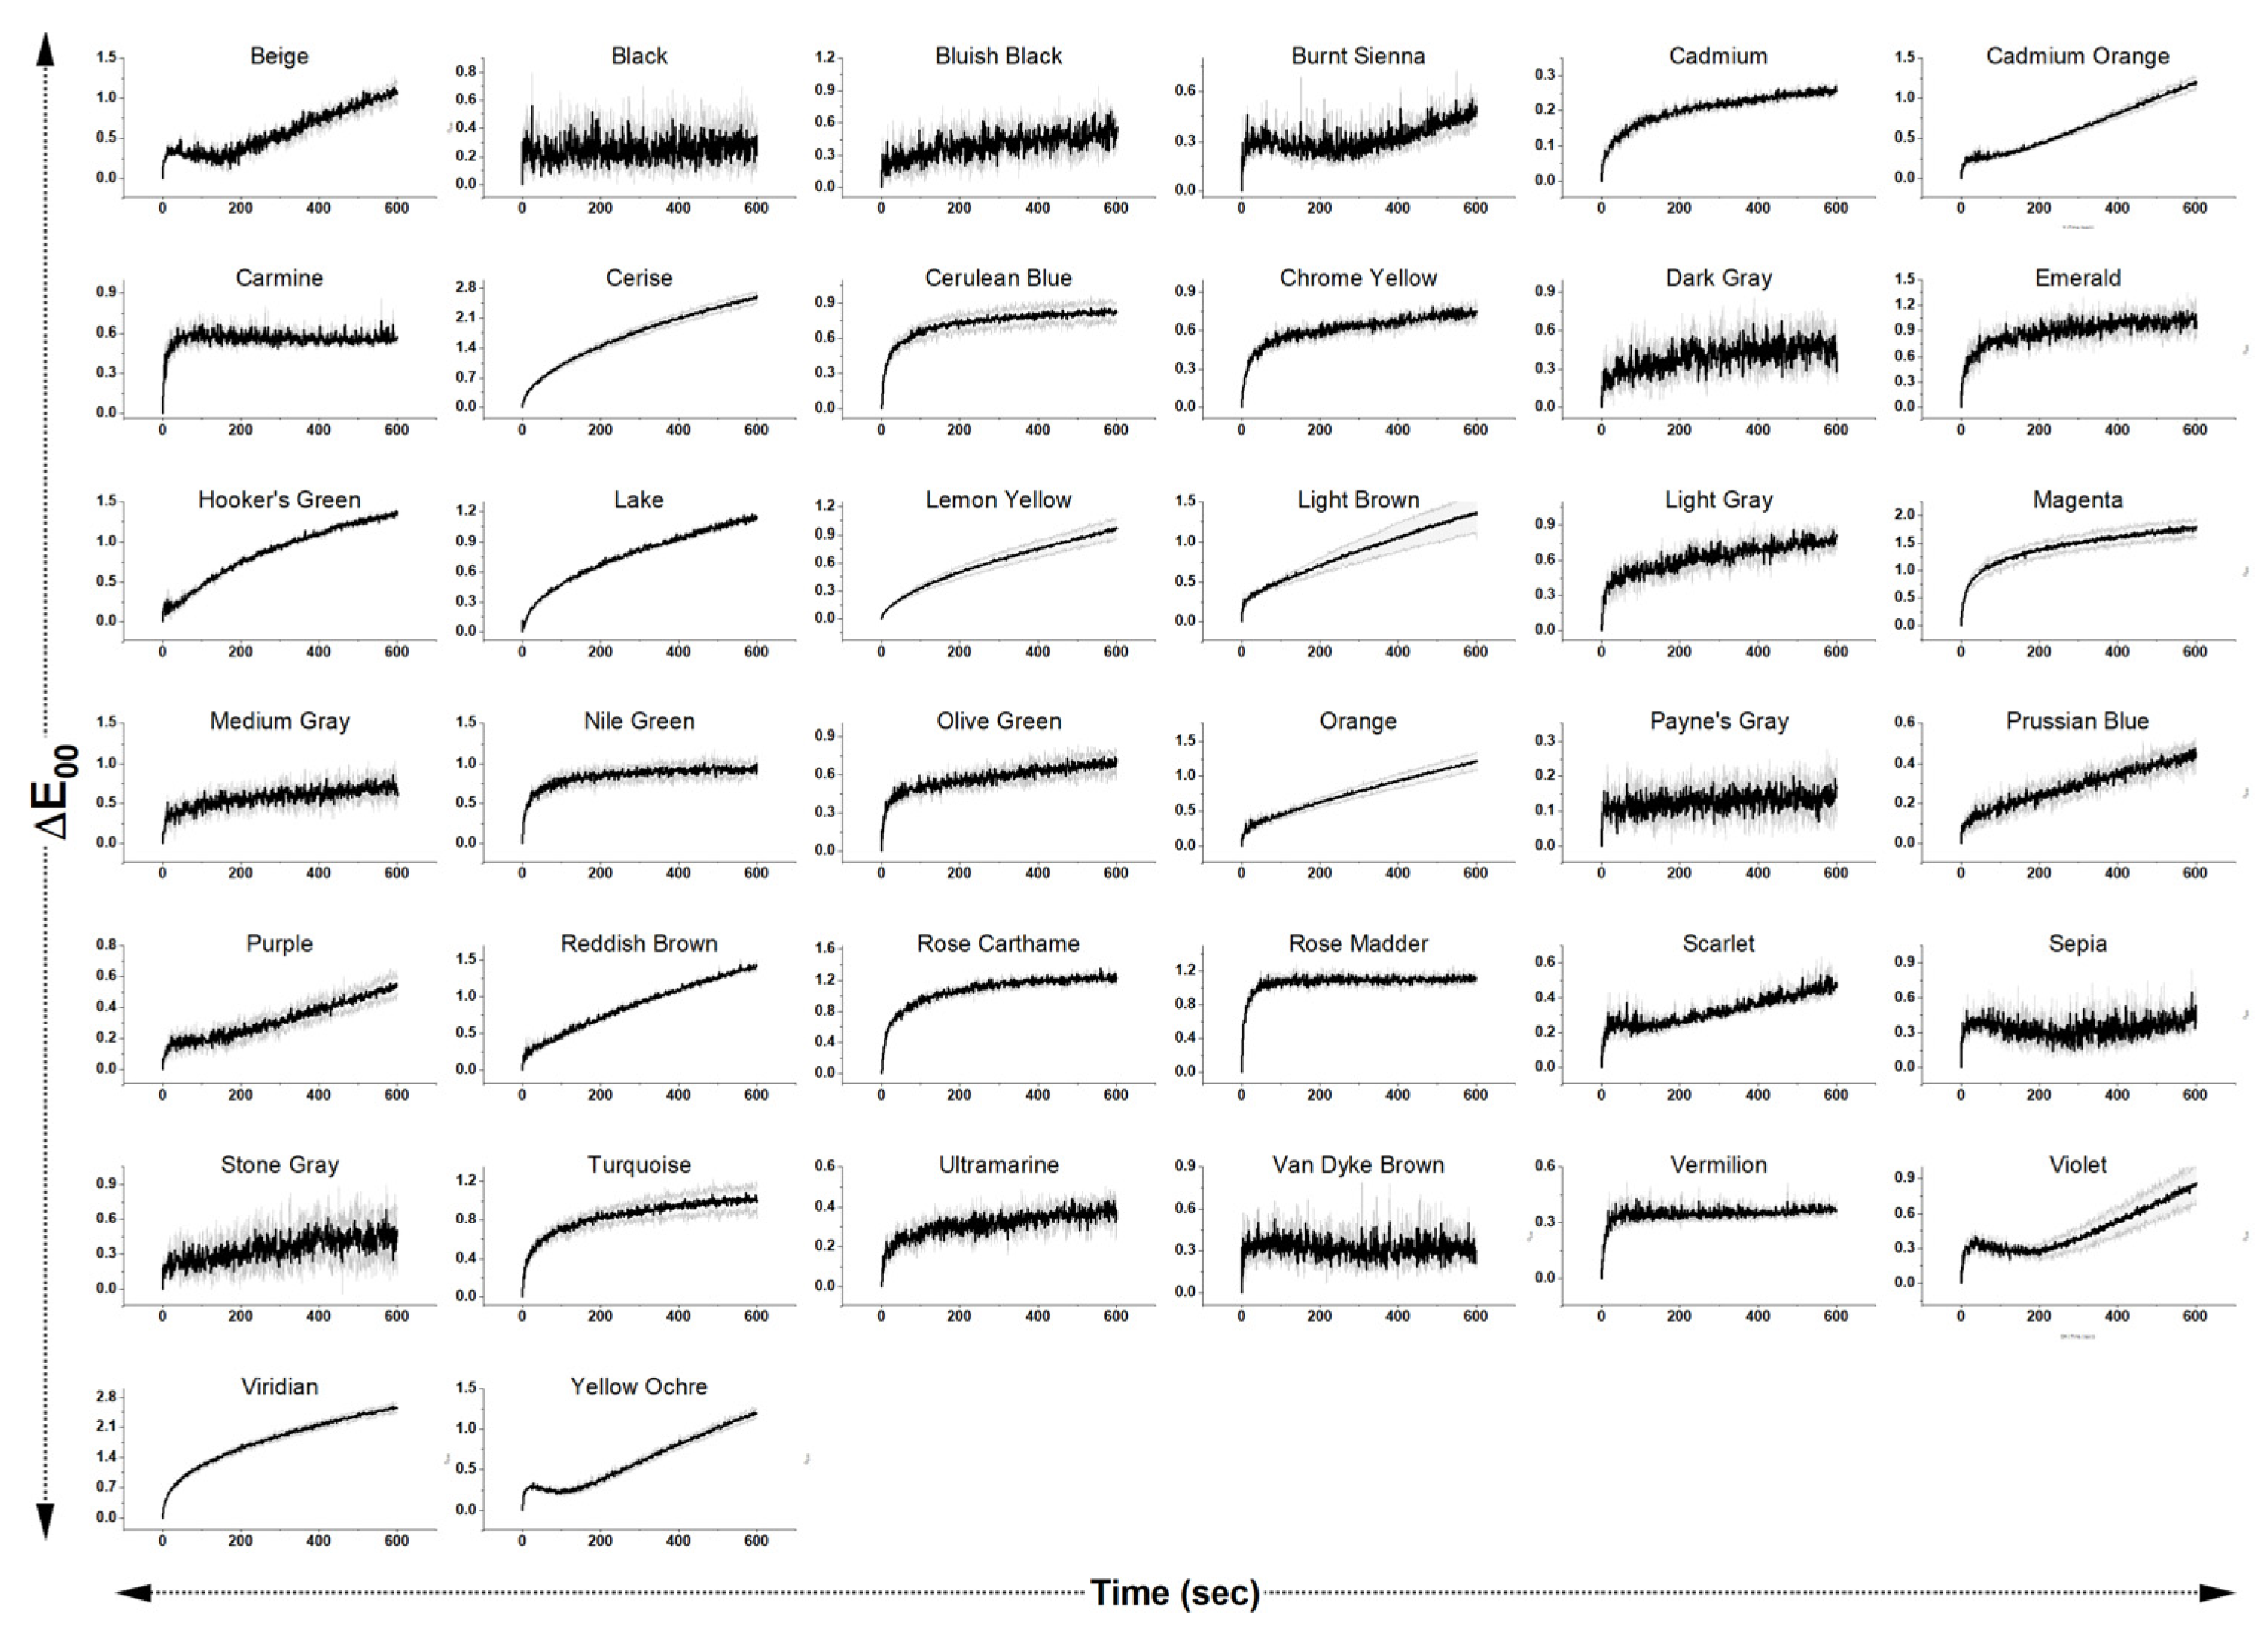
3.3. Light Sensitivity Testing by MFT

3.3.1. Light Sensitivity of Dr. Ph. Martin’s Synchromatic Transparent Water Colors

To categorize the sensitivity of the colorants relative to each other, a fractional BW equivalency (BWeq) classification system was devised to group samples according to their proximity to BW1, 2, or 3. BWeq scores have been reported as ranges that account for intermediate scores (e.g., 1.5, 2.5) [57,58], and Tse reported the use of a more nuanced fractional system in their routine work at the Canadian Conservation Institute (CCI) by fitting ΔE94 values for BW standards at 5 and 10 min to a linear function. However, linear fitting, unlike exponential decay, simplifies the successive changes in sensitivities between BW standards. Here, BWeq was calculated by fitting BW standard ΔE00 values achieved after 600 s to an exponential decay function characterized by
f(x) = abx
where a is a constant and b is the rate of decay. This exponential fitting was also carried out by Martins et al. for a series of Henri Matisse pochoir prints [59]. In this case, it was made possible by exploiting the fact that, when faded using an LED light source, each BW dye has three times the sensitivity as the next one [57]. A great fit was achieved for the three points and their standard deviations with an R2 value of 0.99. BWeq scores were then calculated for each colorant in the set based on the MFT analyses performed on the brochure and fitting those values to the BW standard curve. Figure 6 illustrates the ΔE00 values and fitted curve and Figure 7 illustrates the changes observed in ΔL, Δa, and Δb for each color. Table 3 lists the ΔE00 values and BWeq scores.
Of the 38 colors tested, only three had a BWeq score higher than BW2: Cerise, Magenta, and Viridian. Cerise became lighter and less red and yellowed significantly; this behavior was observed with the photooxidative degradation of the xanthene Basic Violet 10 related to N-de-ethylation and subsequent blue shift in absorbance [60]. Magenta, made up of the triarylmethane Basic Violet 19, was also observed to darken and yellow, and this behavior has been documented in the literature for Basic Violet 17 and other triarylmethane homologs [55]. Viridian was also composed of a triarylmethane dye, Basic Green 4, and like other conventional basic dyes exhibited poor lightfastness [61]. The yellowing observed with MFT for Viridian was also observed in the natural fading of the Marquisette Curtain in the Studio of Cleansing Fragrance at the Palace Museum in Beijing, which was dyed with Basic Green 4 [62].
Surprisingly for colors marketed with a warning related to their light sensitivity, 16 colors showed a BWeq score of 3 or higher. Colors that included azine Acid Black 2 (Black, Bluish Black, Light, Medium, Dark Gray, Payne’s Gray, and Stone Gray) showed some of the highest levels of light fastness. Acid Black 2 has been reported to have moderate light stability as a histological stain [63] and a BW rating of up to 6 when used as a textile dye for aramids [64]. Cadmium, a yellow hue composed of the monoazo dye Acid Yellow 23, was particularly slow to change, and the largest shift was a reduction in Δb, which indicates desaturation. Acid Yellow 23 is particularly lightfast, for example, in the context of autochrome prints [65] and colored felt-tip markers [66]. The two fast reds Vermilion and Scarlet contained Acid Red 73 as their major component. This dye is a stable diazo acid specie used in chromolithography [67] for typewriter ribbons, wood stains, melamine, and nitrocellulose plastics and gives bright shades of good light fastness [43].
In addition to absolute color change in ΔE00, MFT can also identify the fading behavior exhibited by these dyes as classified by Giles in 1965 [68]. All MFT curves are illustrated in Figure 8, where Type II and III curves were seen most frequently. Type II curves are characterized by a steep, almost linear increase in ΔE at the earliest portions of the curve, followed by a plateau of slow and constant change. This behavior can be indicative of a rapid change in color properties followed by a slow plateau upon the extinction of the color matter. In contrast, Type III curves exhibit continuous change at a linear, constant rate.
While Type II and III curves represent the most commonly encountered color change behaviors by MFT users [69,70], a composite-like curve was observed for a few of the colors. A group of these curves was characterized by an initial jump in ΔE00 at the start of the experiment, followed by a gradual decrease in ΔE00 that progressed toward a more linear and constant increase in ΔE00. This combination is akin to initial type IV behavior, which results from the increase in optical density due to the heat of the illumination causing disaggregation of particles, and Type III behavior, which is characterized by an entirely constant rate of fading [68]. This composite curve was observed for Beige, Burnt Sienna, Chrome Yellow, Scarlet, and Violet. One explanation for this behavior could be the presence of mixtures in some of these colorants, where the rapid change in one species leads to the fading of other ones in a mixture, as was the case for Beige, Burnt Sienna, and Chrome Yellow. While Violet appeared to be made up of a single dye, Basic Violet 3 readily undergoes photodegradation into various homologs as a result of consecutive N-de-ethylation [55] and is perhaps likely given the possible identification of a leuco-form of the dye by µ-FITR. Cadmium Orange and Purple also showed composite behavior, with Type II behavior proceeding leading to a plateau in the early portion of the curve before progressing towards constant Type III behavior.
The results presented here ought to also be compared to the work conducted by Goldman [1]. Some consistency in the results was evident, as in the case of Cerise, Viridian, Rose Carthame, and Scarlet. However, several discrepancies were observed. It is important to note the difference in illumination sources used, where the MFT technique used here employed a warm-white LED light of 3000 K that emitted lower amounts of high-energy blue light (Figure 9), whereas the cool xenon lamp of ~5800 K emitted broadband lighting more akin to solar radiation with higher amounts of blue light. Therefore, some wavelength-dependent phenomena might account for the discrepancy in the final results [71] previously reported for Basic Violet 17 [72].
With Magenta and Rose Madder, higher emission by the LED used encompasses much of the absorption regions of both Basic Violet 17 (λmax = 545 nm) and Acid Red 17 (λmax = 524 nm) (Figure 9a). This could account for the relative sensitivity of the two colorants with LED MFT, with BWeq scores of 1.9 and 2.3, respectively. On the other hand, Ultramarine made up of Acid Blue 93 (λmax = 609 nm) appeared lightfast regardless of reflectance minimum (Figure 9b) and in contrast to the results reported by Goldman. Acid Blue 93 has also been noted as not particularly lightfast to sunlight, which is a broadband source of light rich in high-energy radiation [63]. The reason for this inverse relationship between absorbance and LED emission is not clear and requires further investigation. It is worth noting that this type of inverse wavelength-dependent relationship was observed by Lerwill et al. for Prussian blue pigment and a Prussian blue and yellow pigment mixture labeled “Prussian Green.” [72].
A similar inconsistency in the results was also observed for Purple and Prussian Blue, both of which contained Acid Blue 3 (λmax = 640 nm) and Basic Violet 3 (λmax = 552 and 585 nm) (Figure 9b). The two watercolors appeared more lightfast than reported by Goldman. While triphenylmethane acid dyes, such as Acid Blue 3, have reported poor lightfastness, [63,73] conflicting results have been reported for Basic Violet 3, from fugitive [63,74] to relatively light stable [75,76]. While this information is key, seeing that the MoMA prints will only be exhibited under gallery lighting that is identical in spectral distribution, a full investigation into the relationship between fading and absorbance in the visible spectrum is outside the scope of this research and merits further work with monochromatic LED light sources.

3.3.2. Light Sensitivity of À la Recherche du Shoe Perdu (c. 1955)

Rather than performing MFT on the prints themselves, the results of MFT on the brochure were extrapolated to better classify the light sensitivity of Shoe Perdu by assigning each print a BWeq score (Figure 10). This was done by first calculating the percent area that each color covers across a print using Gimp 2.0. This percentage was then used to calculate a total weighted score as follows:
BWeq (print) = Color n (%Area × BWeq) + Color m (%Area × BWeq)
As an example, the calculation for plate 14 is presented here. The print was colored with Lake and Chrome Yellow, and comprised ~82% and ~18% of the total colored area, respectively. Lake had a BWeq score of 2.3, whereas Chrome Yellow had a BWeq score of 2.7; nevertheless, the light sensitivity of Lake was more heavily weighted because of the larger area it occupied. Therefore,
BWeq plate 14 = Lake (0.82 × 2.3) + Chrome Yellow (0.18 × 2.7) = 2.4
where the calculated BWeq was closer to the Lake rather than Chrome Yellow. This equation was adjusted to accommodate the total number of colors used in each print. When a mixture appeared to have been used to color a specific area, the BWeq score for the most sensitive component of a mixture was used to calculate the overall BWeq score for the print for a more conservative approach. As expected, prints that contained large swaths of sensitive colors, such as plate 3 (Cerise, Rose Carthame, and Lake) and plate 9 (Viridian, Prussian Blue, and Nile Green) ranked below BW2, leaving them most vulnerable to change when exhibited. In contrast, prints that contained large swaths of less sensitive colors, such as plate 2 (Scarlet and Nile Green), ranked among the most stable to light.

4. Conclusions

The identification of the dyes used in a historic set of Dr. Ph. Martin’s Synchromatic Transparent colors, one like that used by Andy Warhol and friends, was important to understand the dyes used in À la Recherche du Shoe Perdu and support preventive conservation strategies. Based on the analysis done at MoMA, a total of 18 distinct Dr. Ph. Martin’s colors were used to reproduce this collection of prints. Additionally, the results of this research on a historic set and three brochures of Dr. Ph. Martin’s Synchromatic Watercolors show that colors similar in tonality have different compositions, which has implications for their light stability and display recommendations. The composition of the watercolors appeared consistent across the three copies of the brochures investigated and it is reasonable to assume that this applies to other existing portfolios by Warhol where these dyes are thought to have been employed. While some dyes remained unidentified, especially in the case of Lemon Yellow, overall, this work sheds further light on the fading of sensitive water-based colorants used by a major contemporary artist. The analytical findings are therefore relevant for the study of other hand-colored prints attributed to Warhol, including for dating and authentication purposes.

Supplementary Materials

The following supporting information can be downloaded at: https://www.mdpi.com/article/10.3390/colorants2010001/s1, Figure S1.1–38 Fingerprint-region µ-FITR spectra and UV-Vis spectra for each color; Figure S2. TLC plates developed for TLC-SERS; Figure S3.1–16 Individual SERS spectrum per dye identified with the technique; Figure S4. Dr. Ph. Martin’s Synchromatic Transparent Watercolors used in À la Recherche du Shoe Perdu (MoMA) by reflectance spectrophotometry.

Author Contributions

A.H. carried out µ-FTIR, SERS, and TLC-SERS data acquisition and interpretation. T.N.-M. carried out UV-Vis spectroscopy and TLC-SERS data acquisition. J.B.J. carried out MFT data acquisition and interpretation. G.K. supervised and aided T.N.-M. in data acquisition and experimental design. All authors have read and agreed to the published version of the manuscript.

Funding

This research project received no external funding.

Data Availability Statement

The data is available on reasonable request.

Acknowledgments

A.H. is grateful for guidance and support from Laura Neufeld and Sofia (Sam) Kofodimos at MoMA, Ana Martins, the Van Gogh Museum in Amsterdam, Art Kaplan at the Getty Conservation Institute, and Janka Križanová, Academy of Fine Arts and Design in Bratislava. T.N.M. and G.K. acknowledge the support of the Department of Chemistry and Biochemistry for the use of the instrumentation in the Physical Chemistry Laboratory. J.B.J. would like to thank Hannelore Roemich, formerly at The Conservation Center at The Institute of Fine Arts of New York University, Steven Weintraub of Art Preservation Services, the Mellon Foundation, and Rachel and Jonathan Wilf.

Conflicts of Interest

The authors declare no conflict of interest.

References

  1. Goldmann, M. Examination and Treatment of Early Andy Warhol Hand-Colored Lithographs. Stud. Conserv. 2002, 47, 78–82. [Google Scholar] [CrossRef]
  2. Andy Warhol|À La Recherche Du Shoe Perdu; and Shoe and Leg (See F. & S. Iv.69a-85). Sotheby’s. Available online: https://www.sothebys.com/buy/86d0c302-04b8-4b83-b3b3-854d5d849b02/lots/af57a7be-9324-4cc7-861c-8ec0e7d790f5 (accessed on 12 October 2022).
  3. Price, B.A.; Pretzel, B.; Lomax, S. (Eds.) Infrared and Raman Users Group Spectral Database, 2007th ed.; IRUG: Philadelphia, PA, USA, 2009; Volume 1–2. [Google Scholar]
  4. Casadio, F.; Mauck, K.; Chefitz, M.; Freeman, R. Direct Identification of Early Synthetic Dyes: FT-Raman Study of the Illustrated Broadside Prints of José Gaudalupe Posada (1852–1913). Appl. Phys. A 2010, 100, 885–899. [Google Scholar] [CrossRef]
  5. Dhakal, S.; Chao, K.; Schmidt, W.; Qin, J.; Kim, M.; Huang, Q. Detection of Azo Dyes in Curry Powder Using a 1064-Nm Dispersive Point-Scan Raman System. Appl. Sci. 2018, 8, 564. [Google Scholar] [CrossRef] [Green Version]
  6. Bisulca, C.; Picollo, M.; Bacci, M.; Kunzelman, D. UV-Vis-NIR Reflectance Spectroscopy of Red Lakes in Paintings. In Proceedings of the 9th International Conference on NDT of Art, Jerusalem, Israel, 25–30 May 2008; p. 8. [Google Scholar]
  7. Bell, I.M.; Clark, R.J.H.; Gibbs, P.J. Raman Spectroscopic Library of Natural and Synthetic Pigments (Pre- ≈ 1850 AD). Spectrochim. Acta A Mol. Biomol. Spectrosc. 1997, 53, 2159–2179. [Google Scholar] [CrossRef] [PubMed]
  8. Burgio, L.; Clark, R.J.H. Library of FT-Raman Spectra of Pigments, Minerals, Pigment Media and Varnishes, and Supplement to Existing Library of Raman Spectra of Pigments with Visible Excitation. Spectrochim. Acta A Mol. Biomol. Spectrosc. 2001, 57, 1491–1521. [Google Scholar] [CrossRef] [PubMed]
  9. Castro, K.; Pérez, M.; Rodríguez-Laso, M.D. FTIR Spectra Database of Inorganic Art Materials. Anal. Chem. 2003, 75, 214 A–221 A. [Google Scholar] [CrossRef] [Green Version]
  10. Castro, K.; Pérez-Alonso, M.; Rodríguez-Laso, M.D.; Fernández, L.A.; Madariaga, J.M. On-Line FT-Raman and Dispersive Raman Spectra Database of Artists’ Materials (e-VISART Database). Anal. Bioanal. Chem. 2005, 382, 248–258. [Google Scholar] [CrossRef]
  11. Montagner, C.; Bacci, M.; Bracci, S.; Freeman, R.; Picollo, M. Library of UV-Vis–NIR Reflectance Spectra of Modern Organic Dyes from Historic Pattern-Card Coloured Papers. Spectrochim. Acta A Mol. Biomol. Spectrosc. 2011, 79, 1669–1680. [Google Scholar] [CrossRef]
  12. Fremout, W.; Saverwyns, S. Identification of Synthetic Organic Pigments: The Role of a Comprehensive Digital Raman Spectral Library. J. Raman Spectrosc. 2012, 43, 1536–1544. [Google Scholar] [CrossRef]
  13. Pozzi, F.; Porcinai, S.; Lombardi, J.R.; Leona, M. Statistical Methods and Library Search Approaches for Fast and Reliable Identification of Dyes Using Surface-Enhanced Raman Spectroscopy (SERS). Anal. Methods 2013, 5, 4205. [Google Scholar] [CrossRef]
  14. Cosentino, A. FORS Spectral Database of Historical Pigments in Different Binders. E-Conserv. J. 2014, 2, 54–65. [Google Scholar] [CrossRef]
  15. Pause, R.; van der Werf, I.D.; van den Berg, K.J. Identification of Pre-1950 Synthetic Organic Pigments in Artists’ Paints. A Non-Invasive Approach Using Handheld Raman Spectroscopy. Heritage 2021, 4, 1348–1365. [Google Scholar] [CrossRef]
  16. Festa, G.; Scatigno, C.; Saladino, M.L.; Armetta, F.; Ciaramitaro, V.; Nardo, V.M.; Ponterio, R.C. A Database for Historical Pigments through Handheld Instrumentation. In Proceedings of the 2020 IMEKO TC-4 International Conference on Metrology for Archaeology and Cultural Heritage, Trento, Italy, 22–24 October 2020; pp. 22–24. [Google Scholar]
  17. Festa, G.; Scatigno, C.; Armetta, F.; Saladino, M.L.; Ciaramitaro, V.; Nardo, V.M.; Ponterio, R.C. Chemometric Tools to Point Out Benchmarks and Chromophores in Pigments through Spectroscopic Data Analyses. Molecules 2022, 27, 163. [Google Scholar] [CrossRef] [PubMed]
  18. Pachuta, S.J.; Staral, J.S. Nondestructive Analysis of Colorants on Paper by Time-of-Flight Secondary Ion Mass Spectrometry. Anal. Chem. 1994, 66, 276–284. [Google Scholar] [CrossRef]
  19. Lee, J.; Lee, C.; Lee, K.; Lee, Y. TOF-SIMS Study of Red Sealing-Inks on Paper and Its Forensic Applications. Appl. Surf. Sci. 2008, 255, 1523–1526. [Google Scholar] [CrossRef]
  20. Soltzberg, L.J.; Hagar, A.; Kridaratikorn, S.; Mattson, A.; Newman, R. MALDI-TOF Mass Spectrometric Identification of Dyes and Pigments. J. Am. Soc. Mass Spectrom. 2007, 18, 2001–2006. [Google Scholar] [CrossRef] [Green Version]
  21. Tamburini, D.; Shimada, C.M.; McCarthy, B. The Molecular Characterization of Early Synthetic Dyes in E. Knecht et al.’s Textile Sample Book “A Manual of Dyeing” (1893) by High Performance Liquid Chromatography—Diode Array Detector—Mass Spectrometry (HPLC-DAD-MS). Dyes Pigments 2021, 190, 109286. [Google Scholar] [CrossRef]
  22. Pirok, B.W.J.; den Uijl, M.J.; Moro, G.; Berbers, S.V.J.; Croes, C.J.M.; van Bommel, M.R.; Schoenmakers, P.J. Characterization of Dye Extracts from Historical Cultural-Heritage Objects Using State-of-the-Art Comprehensive Two-Dimensional Liquid Chromatography and Mass Spectrometry with Active Modulation and Optimized Shifting Gradients. Anal. Chem. 2019, 91, 3062–3069. [Google Scholar] [CrossRef] [Green Version]
  23. Cesaratto, A.; Leona, M.; Pozzi, F. Recent Advances on the Analysis of Polychrome Works of Art: SERS of Synthetic Colorants and Their Mixtures With Natural Dyes. Front. Chem. 2019, 7. [Google Scholar] [CrossRef] [Green Version]
  24. Bruni, S.; Guglielmi, V.; Pozzi, F. Historical Organic Dyes: A Surface-Enhanced Raman Scattering (SERS) Spectral Database on Ag Lee–Meisel Colloids Aggregated by NaClO4. J. Raman Spectrosc. 2011, 42, 1267–1281. [Google Scholar] [CrossRef]
  25. Chieli, A.; Sanyova, J.; Doherty, B.; Brunetti, B.G.; Miliani, C. Chromatographic and Spectroscopic Identification and Recognition of Ammoniacal Cochineal Dyes and Pigments. Spectrochim. Acta A Mol. Biomol. Spectrosc. 2016, 162, 86–92. [Google Scholar] [CrossRef] [PubMed]
  26. Ai, Y.; Liang, P.; Wu, Y.; Dong, Q.; Li, J.; Bai, Y.; Xu, B.-J.; Yu, Z.; Ni, D. Rapid Qualitative and Quantitative Determination of Food Colorants by Both Raman Spectra and Surface-Enhanced Raman Scattering (SERS). Food Chem. 2018, 241, 427–433. [Google Scholar] [CrossRef] [PubMed]
  27. Campanella, B.; Botti, J.; Cavaleri, T.; Cicogna, F.; Legnaioli, S.; Pagnotta, S.; Poggialini, F.; Poli, T.; Scalarone, D.; Palleschi, V. The Shining Brightness of Daylight Fluorescent Pigments: Raman and SERS Study of a Modern Class of Painting Materials. Microchem. J. 2020, 152, 104292. [Google Scholar] [CrossRef]
  28. Zhang, D.; Pu, H.; Huang, L.; Sun, D.-W. Advances in Flexible Surface-Enhanced Raman Scattering (SERS) Substrates for Nondestructive Food Detection: Fundamentals and Recent Applications. Trends Food Sci. Technol. 2021, 109, 690–701. [Google Scholar] [CrossRef]
  29. Henzel, U.B. Journal of Chromatography Library; Elsevier: Amsterdam, The Netherlands, 1977; pp. 147–188. [Google Scholar]
  30. Geiman, I.; Leona, M.; Lombardi, J.R. Application of Raman Spectroscopy and Surface-Enhanced Raman Scattering to the Analysis of Synthetic Dyes Found in Ballpoint Pen Inks. J. Forensic Sci. 2009, 54, 947–952. [Google Scholar] [CrossRef]
  31. Brosseau, C.L.; Gambardella, A.; Casadio, F.; Grzywacz, C.M.; Wouters, J.; Van Duyne, R.P. Ad-Hoc Surface-Enhanced Raman Spectroscopy Methodologies for the Detection of Artist Dyestuffs: Thin Layer Chromatography-Surface Enhanced Raman Spectroscopy and in Situ On the Fiber Analysis. Anal. Chem. 2009, 81, 3056–3062. [Google Scholar] [CrossRef]
  32. Pozzi, F.; Shibayama, N.; Leona, M.; Lombardi, J.R. TLC-SERS Study of Syrian Rue (Peganum Harmala) and Its Main Alkaloid Constituents. J. Raman Spectrosc. 2013, 44, 102–107. [Google Scholar] [CrossRef]
  33. Cañamares, M.V.; Reagan, D.A.; Lombardi, J.R.; Leona, M. TLC—SERS of Mauve, the First Synthetic Dye. J. Raman Spectrosc. 2014, 45, 1147–1152. [Google Scholar] [CrossRef] [Green Version]
  34. Sha, X.; Han, S.; Fang, G.; Li, N.; Lin, D.; Hasi, W. A Novel Suitable TLC-SERS Assembly Strategy for Detection of Rhodamine B and Sudan I in Chili Oil. Food Control 2022, 138, 109040. [Google Scholar] [CrossRef]
  35. Minh, D.T.C.; Thi, L.A.; Huyen, N.T.T.; Van Vu, L.; Anh, N.T.K.; Ha, P.T.T. Detection of Sildenafil Adulterated in Herbal Products Using Thin Layer Chromatography Combined with Surface Enhanced Raman Spectroscopy: “Double Coffee-Ring Effect” Based Enhancement. J. Pharm. Biomed. Anal. 2019, 174, 340–347. [Google Scholar] [CrossRef]
  36. Zhu, Q.; Cao, Y.; Li, D.; Fang, F.; Lu, F.; Yuan, Y. A Fast Response TLC-SERS Substrate for on-Site Detection of Hydrophilic and Hydrophobic Adulterants in Botanical Dietary Supplements. New J. Chem. 2019, 43, 13873–13880. [Google Scholar] [CrossRef]
  37. Connors-Rowe, S.A.; Morris, H.R.; Whitmore, P.M. Evaluation of Appearance and Fading of Daylight Fluorescent Watercolors. J. Am. Inst. Conserv. 2005, 44, 75–94. [Google Scholar] [CrossRef]
  38. Beltran, V.L.; Druzik, J.; Maekawa, S. Large-Scale Assessment of Light-Induced Color Change in Air and Anoxic Environments. Stud. Conserv. 2012, 57, 42–57. [Google Scholar] [CrossRef]
  39. Pozzi, F.; Basso, E.; Katz, M. In Search of Humboldt’s Colors: Materials and Techniques of a 17th-Century Lacquered Gourd from Colombia. Herit. Sci. 2020, 8, 101. [Google Scholar] [CrossRef]
  40. Lux, C.; Lubio, A.; Ruediger, A.; Robert, S.; Muehlethaler, C. Optimizing the Analysis of Dyes by Surface-Enhanced Raman Spectroscopy (SERS) Using a Conventional-Microwave Silver Nanoparticles Synthesis. Forensic Chem. 2019, 16, 100186. [Google Scholar] [CrossRef]
  41. Souto, C. High Performance Liquid Chromatography with Diode Array Detector and Coupled Mass Detection Analysis of Early Synthetic Dyes. Master’s Thesis, Universidade NOVA de Lisboa, Lisbon, Portugal, 2010. [Google Scholar]
  42. Moretti, P.; Germinario, G.; Doherty, B.; van der Werf, I.D.; Sabbatini, L.; Mirabile, A.; Sgamellotti, A.; Miliani, C. Disclosing the Composition of Historical Commercial Felt-Tip Pens Used in Art by Integrated Vibrational Spectroscopy and Pyrolysis-Gas Chromatography/Mass Spectrometry. J. Cult. Herit. 2019, 35, 242–253. [Google Scholar] [CrossRef]
  43. Cesaratto, A.; Centeno, S.A.; Lombardi, J.R.; Shibayama, N.; Leona, M. A Complete Raman Study of Common Acid Red Dyes: Application to the Identification of Artistic Materials in Polychrome Prints: A Complete Raman Study of Common Acid Red Dyes. J. Raman Spectrosc. 2017, 48, 601–609. [Google Scholar] [CrossRef]
  44. Xie, Y.; Chen, T.; Guo, Y.; Cheng, Y.; Qian, H.; Yao, W. Rapid SERS Detection of Acid Orange II and Brilliant Blue in Food by Using Fe3O4@Au Core–Shell Substrate. Food Chem. 2019, 270, 173–180. [Google Scholar] [CrossRef]
  45. Caycedo, M. Identification of Fifteen First Priority Textile Dyes from the Schweppe Collection with Raman and Surface Enhanced Raman Spectroscopy (SERS). Ph.D. Thesis, University of Amsterdam, Amsterdam, The Netherlands, 2012. [Google Scholar]
  46. Song, J.; Zhang, Y.; Huang, Y.; Fan, Y.; Lai, K. Rapid Tartrazine Determination in Large Yellow Croaker with Ag Nanowires Using Surface-Enhanced Raman Spectroscopy. Nanomaterials 2018, 8, 967. [Google Scholar] [CrossRef] [Green Version]
  47. Neugebauer, W.; Sessa, C.; Steuer, C.; Allscher, T.; Stege, H. Naphthol Green—A Forgotten Artists’ Pigment of the Early 20th Century. History, Chemistry and Analytical Identification. J. Cult. Herit. 2019, 36, 153–165. [Google Scholar] [CrossRef]
  48. Pettinger, B.; Ren, B.; Picardi, G.; Schuster, R.; Ertl, G. Tip-Enhanced Raman Spectroscopy (TERS) of Malachite Green Isothiocyanate at Au(111): Bleaching Behavior under the Influence of High Electromagnetic Fields. J. Raman Spectrosc. 2005, 36, 541–550. [Google Scholar] [CrossRef]
  49. Ho, Y.C.; Lee, W.W.Y.; Bell, S.E.J. Investigation of the Chemical Origin and Evidential Value of Differences in the SERS Spectra of Blue Gel Inks. Analyst 2016, 141, 5152–5158. [Google Scholar] [CrossRef] [PubMed]
  50. Cañamares, M.V.; Chenal, C.; Birke, R.L.; Lombardi, J.R. DFT, SERS, and Single-Molecule SERS of Crystal Violet. J. Phys. Chem. C 2008, 112, 20295–20300. [Google Scholar] [CrossRef]
  51. Bonacini, I.; Gallazzi, F.; Espina, A.; Cañamares, M.V.; Prati, S.; Mazzeo, R.; Sanchez-Cortes, S. Sensitive ‘on the Fiber’ Detection of Synthetic Organic Dyes by Laser Photoinduced Plasmonic Ag Nanoparticles: Sensitive ‘on the Fiber’ Detection of Synthetic Organic Dyes. J. Raman Spectrosc. 2017, 48, 925–934. [Google Scholar] [CrossRef]
  52. Muehlethaler, C.; Ng, K.; Gueissaz, L.; Leona, M.; Lombardi, J.R. Raman and SERS Characterization of Solvent Dyes: An Example of Shoe Polish Analysis. Dyes Pigments 2017, 137, 539–552. [Google Scholar] [CrossRef] [Green Version]
  53. Dhakal, S.; Chao, K.; Schmidt, W.; Qin, J.; Kim, M.; Chan, D. Evaluation of Turmeric Powder Adulterated with Metanil Yellow Using FT-Raman and FT-IR Spectroscopy. Foods 2016, 5, 36. [Google Scholar] [CrossRef] [Green Version]
  54. Kumar, A.; Santhanam, V. Paper Swab Based SERS Detection of Non-Permitted Colourants from Dals and Vegetables Using a Portable Spectrometer. Anal. Chim. Acta 2019, 1090, 106–113. [Google Scholar] [CrossRef]
  55. Cesaratto, A.; Lombardi, J.R.; Leona, M. Tracking Photo-Degradation of Triarylmethane Dyes with Surface-Enhanced Raman Spectroscopy. J. Raman Spectrosc. 2017, 48, 418–424. [Google Scholar] [CrossRef]
  56. Egzar, H.K.; Mashkour, M.S.; Juda, A.M. Study the Photodegradation of Aniline Blue Dye in Aqueous Phase by Using Different Photocatalysts. Int. J. Eng. 2013, 13, 8. [Google Scholar]
  57. del Hoyo-Meléndez, J.M.; Mecklenburg, M.F. A Survey on the Light-Fastness Properties of Organic-Based Alaska Native Artifacts. J. Cult. Herit. 2010, 11, 493–499. [Google Scholar] [CrossRef]
  58. del Hoyo-Meléndez, J.M.; Mecklenburg, M.F. Micro-Fading Spectrometry: A Tool for Real-Time Assessment of the Light-Fastness of Dye/Textile Systems. Fibers Polym. 2012, 13, 1079–1085. [Google Scholar] [CrossRef]
  59. Martins, A.; Prud’hom, A.C.; Duranton, M.; Haddad, A.; Daher, C.; Genachte-Le Bail, A.; Tang, T. Jazz Colors: Pigment Identification in the Gouaches Used by Henri Matisse. Heritage 2021, 4, 4205–4221. [Google Scholar] [CrossRef]
  60. Sabatini, F.; Giugliano, R.; Degano, I. Photo-Oxidation Processes of Rhodamine B: A Chromatographic and Mass Spectrometric Approach. Microchem. J. 2018, 140, 114–122. [Google Scholar] [CrossRef]
  61. Clark, M. (Ed.) Handbook of Textile and Industrial Dyeing Volume 2; Woodhead Publishing Series in Textiles; Woodhead Publishing Limited: Oxford, UK; Philadelphia, PA, USA, 2011. [Google Scholar]
  62. Wei, L.; Gu, A.; Guo, Z.; Ding, J.; Jin, G.; Lei, Y. An Integrated Study on the Fading Mechanism of Malachite Green Industrial Dye for the Marquisette Curtain in the Studio of Cleansing Fragrance, the Palace Museum (Beijing). Molecules 2022, 27, 4411. [Google Scholar] [CrossRef] [PubMed]
  63. Horobin, R.W.; Kiernan, J.A.; Conn, H.J.; Biological Stain Commission (Eds.) Conn’s Biological Stains: A Handbook of Dyes, Stains and Fluorochromes for Use in Biology and Medicine, 10th ed.; Biological Stain Commission by BIOS: Oxford, UK, 2002. [Google Scholar]
  64. Opwis, K.; Celik, B.; Benken, R.; Knittel, D.; Gutmann, J.S. Dyeing of M-Aramid Fibers in Ionic Liquids. Polymers 2020, 12, 1824. [Google Scholar] [CrossRef]
  65. Casella, L.; Tsukada, M. Effects of Low-Oxygen Environments in the Light Fading of Six Dyes Present in the Autochrome Color Screen. J. Am. Inst. Conserv. 2012, 51, 159–174. [Google Scholar] [CrossRef]
  66. Smith, G.D.; Chen, V.J.; Hostettler, K.F.; Phipps, C.E. Disappearing Ink! Unraveling the Fading of a Contemporary Design Object. Phys. Sci. Rev. 2019, 4, 427–464. [Google Scholar] [CrossRef]
  67. Centeno, S.A.; Buisan, V.L.; Ropret, P. Raman Study of Synthetic Organic Pigments and Dyes in Early Lithographic Inks (1890–1920). J. Raman Spectrosc. 2006, 37, 1111–1118. [Google Scholar] [CrossRef]
  68. Giles, C.H. The Fading of Colouring Matters. J. Appl. Chem. 1965, 15, 541–550. [Google Scholar] [CrossRef]
  69. Mecklenburg, M.F.; del Hoyo-Meléndez, J.M. Development and Application of a Mathematical Model to Explain Fading Rate Inconsistencies Observed in Light-Sensitive Materials: Mathematical Model to Explain Fading Rate Inconsistencies in Light-Sensitive Materials. Color. Technol. 2012, 128, 139–146. [Google Scholar] [CrossRef]
  70. Prestel, T. A Classification System to Enhance Light-Fastness Data Interpretation Based on Microfading Tests and Rate of Colour Change. Color. Technol. 2017, 133, 506–512. [Google Scholar] [CrossRef]
  71. Saunders, D.; Kirby, J. Wavelength-Dependent Fading of Artists’ Pigments. Stud. Conserv. 1994, 39 (Suppl. 2), 190–194. [Google Scholar] [CrossRef]
  72. Lerwill, A.; Brookes, A.; Townsend, J.H.; Hackney, S.; Liang, H. Micro-Fading Spectrometry: Investigating the Wavelength Specificity of Fading. Appl. Phys. A 2015, 118, 457–463. [Google Scholar] [CrossRef] [Green Version]
  73. Clark, M. (Ed.) Handbook of Textile and Industrial Dyeing Volume 1; Woodhead Publishing Series in Textiles; Woodhead Publishing Limited: Oxford, UK; Philadelphia, PA, USA, 2011. [Google Scholar]
  74. Confortin, D.; Neevel, H.; Brustolon, M.; Franco, L.; Kettelarij, A.J.; Williams, R.M.; van Bommel, M.R. Crystal Violet: Study of the Photo-Fading of an Early Synthetic Dye in Aqueous Solution and on Paper with HPLC-PDA, LC-MS and FORS. J. Phys. Conf. Ser. 2010, 231, 012011. [Google Scholar] [CrossRef]
  75. Havlínová, B.; Mináriková, J.; Švorcová, L.; Hanus, J.; Brezová, V. Influence of Fixatives and Deacidification on the Stability of Arylmethane Dyes on Paper during the Course of Accelerated Aging. Restaurator 2005, 26, 1–13. [Google Scholar] [CrossRef]
  76. den Uijl, M.J.; Lokker, A.; van Dooren, B.; Schoenmakers, P.J.; Pirok, B.W.J.; van Bommel, M.R. Comparing Different Light-Degradation Approaches for the Degradation of Crystal Violet and Eosin Y. Dye Pigment. 2022, 197, 109882. [Google Scholar] [CrossRef]
Figure 1. Andy Warhol Untitled from À la Recherche du Shoe Perdu, c. 1955. One from a portfolio of eighteen offset lithographs with synthetic dye-based ink additions. 9 ¾ × 13 11/16” (24.7 cm × 34.8 cm). The Museum of Modern Art. The Print Associates Fund. 2021 The remaining plates can be viewed online. © 2022 Andy Warhol Foundation for the Visual Arts/Artists Rights Society (ARS), New York, All reproductions of this work are excluded from the CC: BY License.
Colorants 02 00001 g001
Figure 2. Different sets and brochures used for the identification of dyes in Dr. Ph. Martin’s colors, the Radiant Concentrated Watercolors. Brochure (a) is from the reference collection of the Getty Conservation Institute (GCI) and corresponds to set (b), two examples of which are also illustrated. Brochures (c,d) are from the reference collection at The Museum of Modern Art (MoMA). © 2022 The Museum of Modern Art, N.Y.
Colorants 02 00001 g002
Figure 3. Principal component analysis (PCA) was performed on a total of 156 averaged spectra to group the spectra and identify the watercolors used in the execution of this copy of Shoe Perdu. The colored ellipses do not represent confidence intervals and are used to better represent grouping based on hue. The GCI brochure is indicated by (G), the undated MoMA brochure is indicated by (nd), and the 1983 MoMA brochure is indicated by (1983). The spots from Shoe Perdu are indicated by their color and plate number.
Colorants 02 00001 g003
Figure 4. Example TLC-SERS analysis on Chrome Yellow from the set of Dr. Ph. Martin’s Synchromatic Transparent Water Colors, which identified Acid Orange 7 and Acid Yellow 23. © 2022 The Museum of Modern Art, N.Y.
Colorants 02 00001 g004
Figure 5. Identification of Dr. Ph. Martin’s Synchromatic Transparent Water Colors in a plate from À la Recherche du Shoe Perdu non-invasively by reflectance spectrophotometry. © 2022 Andy Warhol Foundation for the Visual Arts/Artists Rights Society (ARS), New York, All reproductions of this work are excluded from the CC: BY License.
Colorants 02 00001 g005
Figure 6. ΔE00 values obtained for 38 Dr. Ph. Martin’s Synchromatic Transparent Water Colors after 600 secs of illumination with MFT (a), which were then fitted to an exponential decay function (b) to obtain relative BWeq scores for each color, each BW dye appeared to have three times the sensitivity as the next one.
Colorants 02 00001 g006
Figure 7. Bar graphs that illustrate the changes observed in ΔL, Δa, and Δb for each of the 38 colors in Dr. Ph. Martin’s Synchromatic Transparent Water Colors set.
Colorants 02 00001 g007
Figure 8. MFT curves achieved over 600 sec of illumination for each of the 38 colors in Dr. Ph. Martin’s Synchromatic Transparent Water Colors set.
Colorants 02 00001 g008
Figure 9. Reflectance curves for some of Dr. Ph. Martin’s Synchromatic Transparent Water Colors. Magenta and Rose Madder (a) experienced a direct correlation between reflectance minima and LED spectra distribution. Prussian Blue, Purple, and Ultramarine (b) exhibited an inverse relationship to their reflectance minima.
Colorants 02 00001 g009
Figure 10. Weighted BWeq scores calculated for the plates in Shoe Perdu MoMA portfolio based on the area each color occupied per plate. Plate 6 was not colored.
Colorants 02 00001 g010
Table 1. The dyes identified in Dr. Ph. Martin’s Synchromatic Transparent Water Colors.
C.I. NameCommercial Nameµ-FTIR (cm−1) [3] *SERS (cm−1)UV-Vis (nm) [21,22,41]Dr Martin’s Synchromatic Transparent Water Colors
Acid Red 17Fast Red B3405, 3087, 1637, 1597, 1566, 1517, 1500,
1459, 1438, 1411, 1494, 1369, 1357, 1340,
1303, 1260, 1224, 1170, 1159, 1130, 1081,
1038, 1021, 943, 883, 835, 795, 773, 751,
734, 684, 657
1612, 1595, 1570, 1546, 1509,
1460, 1434, 1405, 1357, 1336,
1301, 1272, 1255, 1036, 1009,
778, 731, 623, 520, 492,
420 [42]
217, 283, 311, 331, 524Rose Madder
Reddish Brown
Acid Red 73Brilliant Crocein3471, 3067, 3041, 1629, 1597, 1557, 1537,
1375, 1330, 1305, 1238, 1215, 1143, 1047,
1039, 982, 845, 833, 812, 782, 766, 722,
685, 661
1596, 1503, 1492, 1446, 1423,
1377, 1329, 1294, 1236, 1219,
1185, 1141, 999, 709, 613,
473 [43]
198, 247, 317 (sh), 345, 511Burnt Sienna
Orange
Scarlet
Vermilion
Light Brown
Acid Red 87Eosin Y3468, 3320, 2942, 2923, 2894, 2864, 1618,
1606, 1585, 1571, 1560, 1520, 1497, 1455,
1416, 1373, 1355, 1314, 1288, 1258, 1241,
1230, 1175, 1160, 1120, 1091, 1060, 1041,
980, 928, 880, 761, 716, 660
1620, 1559, 1507, 1457, 1401,
1330, 1281, 1242, 1179, 1090,
1015, 967, 788, 767, 708, 639,
614, 593, 556, 4667, 400,
348 [23]
195, 240 (sh) 255, 289 (sh), 301, 342, 480 (sh), 516Rose Carthame
Acid Red 103Azocarmine B3444, 3075, 1605, 1575, 1502, 1475, 1460,
1435, 1381, 1336, 1277, 1218, 1197, 1130,
1097, 1048, 1022, 1003, 963, 943, 901, 844,
763, 728, 688, 655
1604, 1591, 1572, 1550, 1514,
1458, 1448, 1436, 1409, 1360,
1291, 1277, 1235, 1003, 729,
681, 529, 503, 484, 468, 416 *
218, 228 242, 291, 339, 323, 510, 550 (sh)Carmine
Basic Red 1Rhodamine 6G3320, 3029, 2977, 2934, 2872, 1717, 1647,
1608, 1567, 1529, 1503, 1498, 1444, 1424,
1367, 1323, 1313, 1282, 1249, 1181, 1142,
1128, 1080, 1041, 1027, 845, 778, 735, 721
1649, 1596, 1572, 1508, 1448,
1431, 1419, 1387, 1362, 1310,
1275, 1223, 1206, 1127, 1084,
928, 772, 758, 636, 611,
403 [23]
201, 247, 275, 294, 347, 491, 526Lake
Magenta?
Acid Orange 7Orange II3641, 3545, 3094, 3096, 3003, 1620, 1597,
1567, 1553, 1507, 1482, 1452, 1417, 1404,
1390, 1337, 1329, 1271, 1255, 1228, 1211,
1190, 1155, 1123, 1036, 1007, 987, 953,
872, 836, 756, 734, 697, 687
1654, 1596, 1549, 1479, 1448,
1417, 1387, 1336, 1303, 1258,
1229, 1206, 1182, 1095, 1036,
1004, 986, 874, 850, 759, 732,
694, 639, 592, 538, 509, 464,
429 [44]
199, 228, 256, 308, 405, 486Beige
Black
Burnt Sienna
Cadmium Orange
Chrome Yellow
Light Brown
Olive Green
Sepia
Van Dyke Brown
Yellow Ochre
Acid Yellow 1?Naphthol Yellow S?n/a1607, 1544, 1469, 1446, 1387,
1374, 1358, 1286, 1247, 1221,
1158, 1133, 1115, 1078, 1047,
1004, 967, 948, 862, 692 [45]
222, 260, 285, 392, 433Bluish Black
Hooker’s Green
Lemon Yellow
Acid Yellow 23Tartrazine3474, 1694, 1636, 1560, 1501, 1476, 1416,
1351, 1272, 1181, 1155, 1127, 1038, 1008,
861, 835, 769, 740, 722, 698
1651, 1597, 1503, 1440, 1342,
1312, 1294, 1176, 1120, 1058,
1006, 885, 876, 780, 770, 709,
679, 610, 477, 426 [46]
194, 251 (sh), 258, 277 (sh), 424Cadmium
Chrome Yellow
Emerald Green
Nile green
Scarlet
Acid Green 1Naphthol Green B2956, 2924, 2853, 1607, 1548, 1499, 1189,
1077, 1039, 909, 835, 802 [47]
1587, 1511, 1530, 1278, 1085,
1040, 909, 804, 753, 744, 673,
620, 543, 488, 471, 425, 362,
311 [47]
199, 229, 289, 324 (sh), 414, 433, 714 (broad)Burnt Sienna
Hooker’s Green
Olive Green
Stone Gray
Basic Green 4Malachite Green1730, 1613, 1117, 800, 7181614, 1588, 1499, 1486, 1466,
1381, 1362, 1293, 1214, 1177,
914, 800, 435 [48]
214 (sh), 258, 618Turquoise
Viridian
Acid Blue 3Patent Blue V3475, 3094, 3058, 2987, 2940, 2874, 1665,
1618, 1578, 1538, 478, 1417, 1390, 1343,
1303, 1278, 1243, 1223, 1182, 1151, 1076,
1034, 1009, 969, 917, 901, 847, 831, 807,
791, 757, 740, 726, 700, 691, 675
1618, 1584, 1548, 1498, 1470,
1429, 1396, 1361, 1346, 1292,
1217, 1180, 1160, 10474, 1025,
1000, 983, 916, 902, 828, 797,
725, 696, 670, 210, 435, 420,
365 [49]
200, 261, 311, 393 (sh), 412, 583, 640Beige
Cerulean Blue
Emerald Green
Hooker’s Green
Nile Green
Purple
Prussian Blue
Turquoise
Acid Blue 93Aniline Blue3451, 3290, 3070, 2929, 2852, 1652, 1604,
1578, 1526, 1509, 1447, 1357, 1342, 1298,
1221, 1172, 1125, 1082, 1035, 1008, 916,
835, 812, 759, 732, 703
1620, 1594, 1578, 1522, 1499,
1462, 1396, 1367, 1348, 1296,
1217, 1180, 1033, 1006, 916,
817, 760, 728, 706, 591, 529,
450, 427 [30]
195, 309, 483, 609Ultramarine
Basic Violet 3Crystal Violet1586, 1525, 1375, 1228, 1176, 829, 792,
770, 760, 756, 727, 667
1644, 1617, 1582, 1481, 1367,
1301, 1178, 1075, 912, 800,
726, 609, 436, 421 [50]
213 (sh), 249, 304, 336 (sh), 380, 552, 585Prussian Blue
Purple
Violet
Basic Violet 17Fuchsine3447, 3347, 3232, 1629, 1583, 1541, 1497,
1460, 1432, 1370, 1300, 1296, 1189, 1131,
1112, 1936, 830, 758, 714, 869
1614, 1585, 1537, 1518, 1457,
1432, 1366, 1332, 1298, 1284,
1240, 1183, 1156, 1142, 1019,
829, 760, 738, 612, 574, 521,
438, 362 [51]
210, 248, 299, 489, 516, 545Magenta
Basic Violet 10Rhodamine B3352, 2974, 2932, 2873, 1710, 1647, 1589,
1555, 1529, 1506, 1482, 1467, 1434, 1413,
1396, 1382, 1339, 1275, 1248, 1197, 1182,
1158, 1134, 1077, 1038, 981, 924, 823, 759,
707, 683
1647, 1599, 1569, 1529, 1507,
1432, 1359, 1280, 1120, 1133,
1075, 934, 772, 736, 620,
611 [34]
199, 254, 284, 351, 519, 553Cerise
Acid Black 2Nigrosine WS3066, 2962, 2926, 2851, 1652, 1590, 1514,
1492, 1417, 1308, 1223, 1189, 1125, 1077,
1034, 1008, 829, 756, 697
1605, 1585, 1563, 1506, 1387,
1342, 1278, 1249, 1155, 1002,
610 [52]
297, 575Black
Bluish Black
Payne’s Gray
Stone Gray
Light Gray
Medium Gray
Dark Gray
Sepia
Van Dyke Brown
* Some reference spectra were obtained from commercial libraries purchased from Thermo Fisher Scientific Inc. and Nicolet Instrument Corp. (sh) indicates unresolved shoulder peak and (?) indicates inconclusive.
Table 2. Colors identified in each plate from À la Recherche du Shoe Perdu.
PlateDr Martin’s Synchromatic Transparent WatercolorsPlateDr Martin’s Synchromatic Transparent Water Colors
1Magenta + Blue (630 nm) *10Lake
Turquoise Chrome yellow
Magenta11Vermilion
2Scarlet Lake
Nile Green Carmine
Magenta + Blue (630 nm) *12Lemon Yellow + Nile Green
3Cerise Magenta + Blue (630 nm) *
Lake Lemon Yellow + Red (510 nm) *
4Rose Carthame13Chrome Yellow
Viridian Olive Green
Prussian Blue Vermilion
5Violet14Lake
Prussian Blue Chrome Yellow
7Lemon Yellow + Nile Green15Violet
Cerulean Blue Cerise
Cerise16Scarlet
8Rose Carthame + Lemon Yellow (450 nm) Cerise
9Viridian17Purple
Prussian Blue Cerise over Cadmium
Cadmium
* Exact dye was not identified in this instance.
Table 3. ΔE00 values obtained for 38 Dr. Ph. Martin’s Synchromatic Transparent Water Colors after 600 secs of illumination with MFT and the resulting BWeq scores from exponential fitting.
ColorΔE00BWeqColorΔE00BWeq
Beige1.12.4Nile Green1.02.4
Black0.23.9Olive Green0.72.8
Bluish Black0.63.0Orange1.22.3
Burnt Sienna0.53.2Payne’s Gray0.24.2
Cadmium0.33.7Prussian Blue0.43.2
Cadmium Orange1.22.3Purple0.53.0
Carmine0.63.0Reddish Brown1.42.1
Cerise2.61.5Rose Carthame1.22.2
Cerulean Blue0.82.6Rose Madder1.12.3
Chrome Yellow0.82.7Scarlet0.53.2
Dark Gray0.33.7Sepia0.43.4
Emerald0.92.5Stone Gray0.53.1
Hooker’s Green1.32.2Turquoise1.02.4
Lake1.12.3Ultramarine0.33.5
Lemon Yellow1.02.5Van Dyke Brown0.33.6
Light Brown1.32.2Vermilion0.43.4
Light Gray0.82.6Violet0.92.6
Magenta1.81.9Viridian2.51.6
Medium Gray0.62.9Yellow Ochre1.22.3
Disclaimer/Publisher’s Note: The statements, opinions and data contained in all publications are solely those of the individual author(s) and contributor(s) and not of MDPI and/or the editor(s). MDPI and/or the editor(s) disclaim responsibility for any injury to people or property resulting from any ideas, methods, instructions or products referred to in the content.

