Article

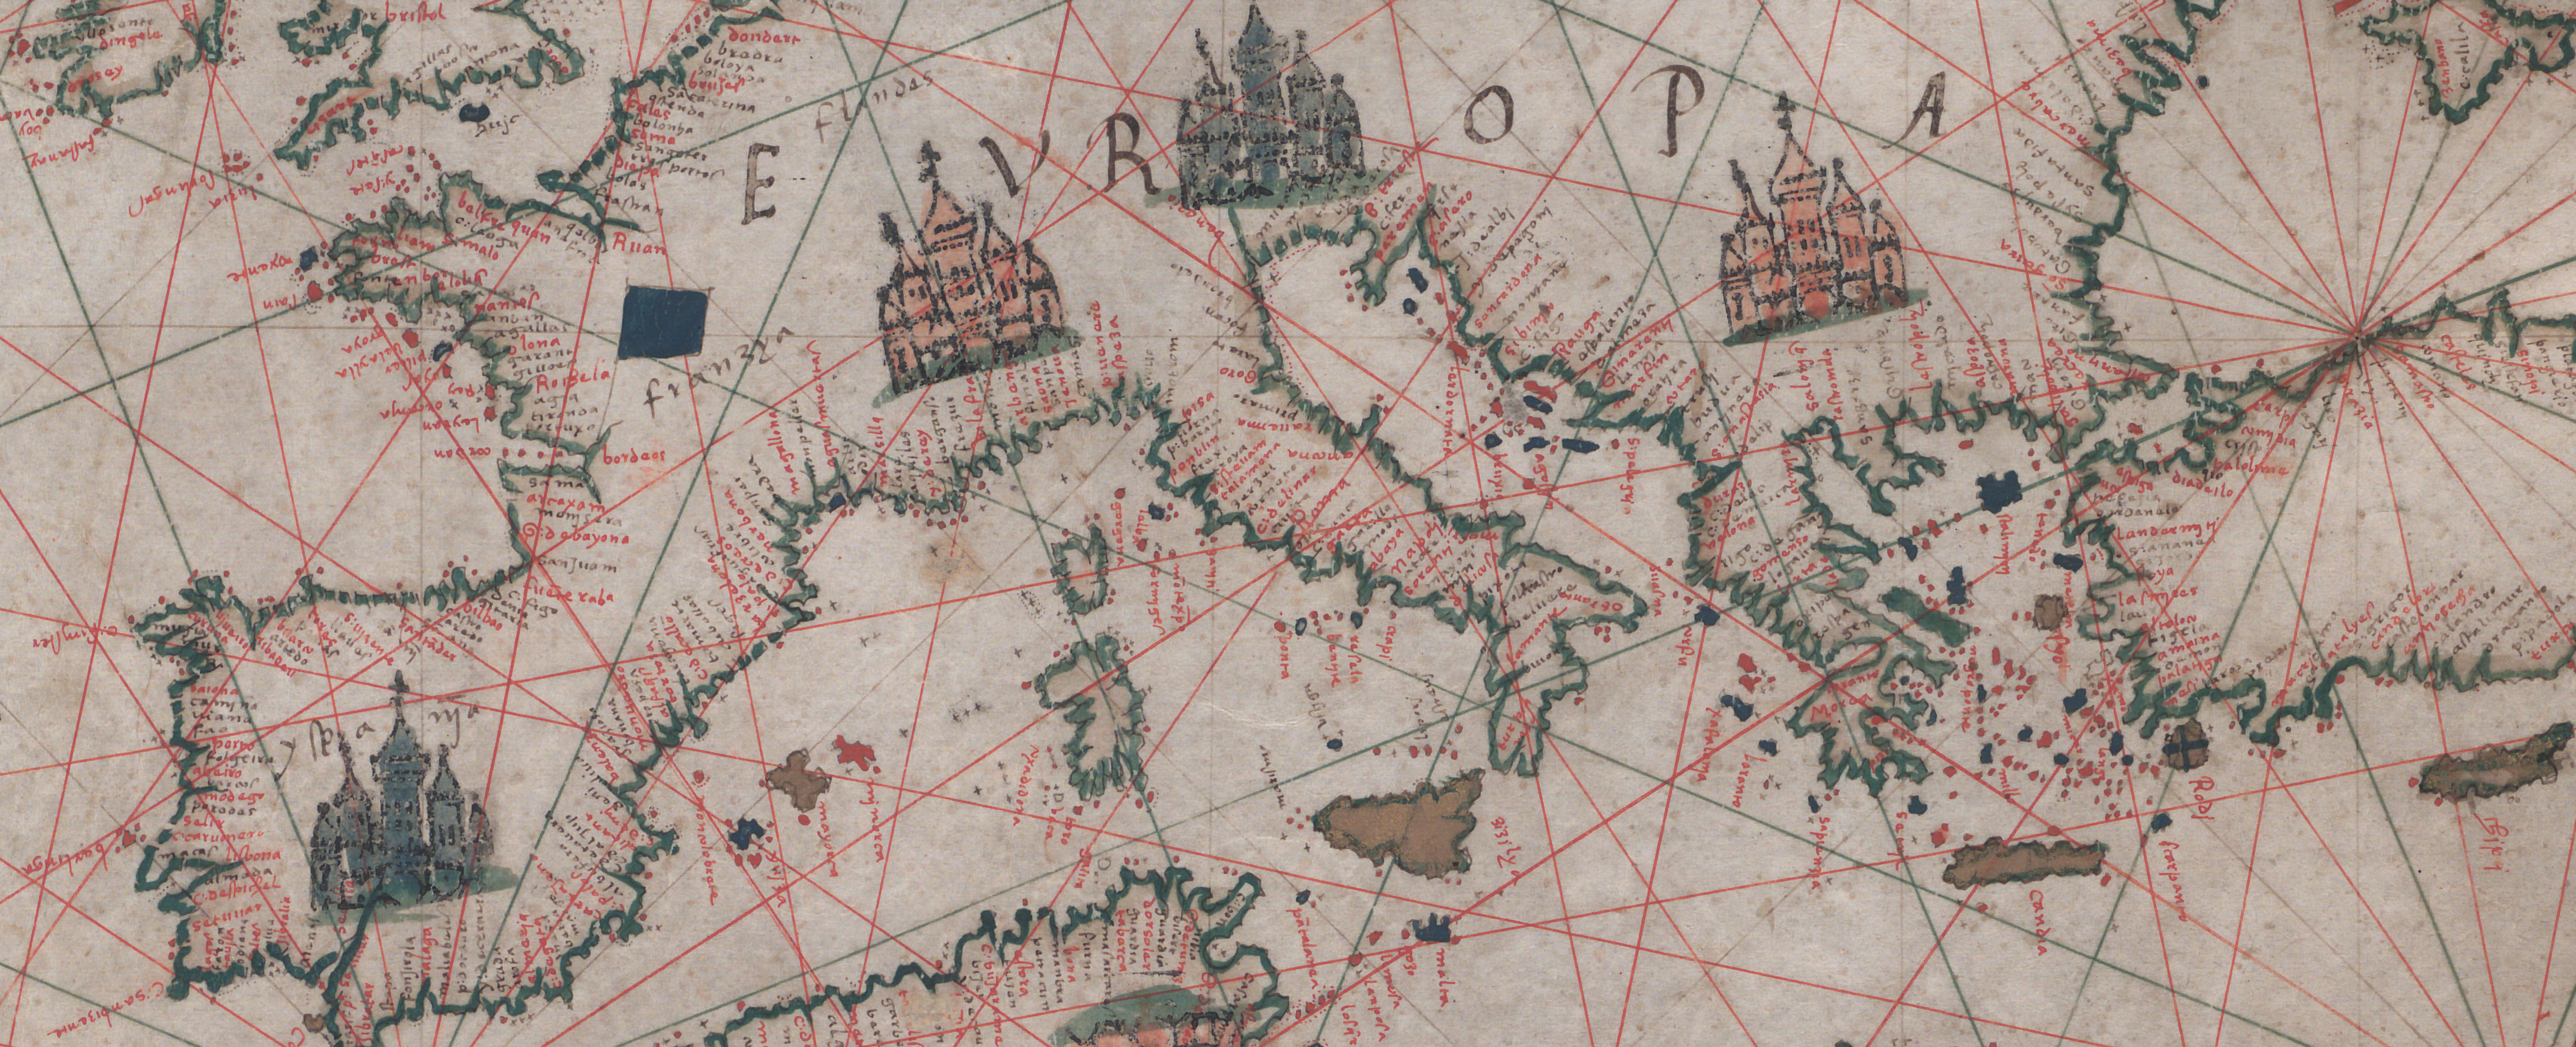
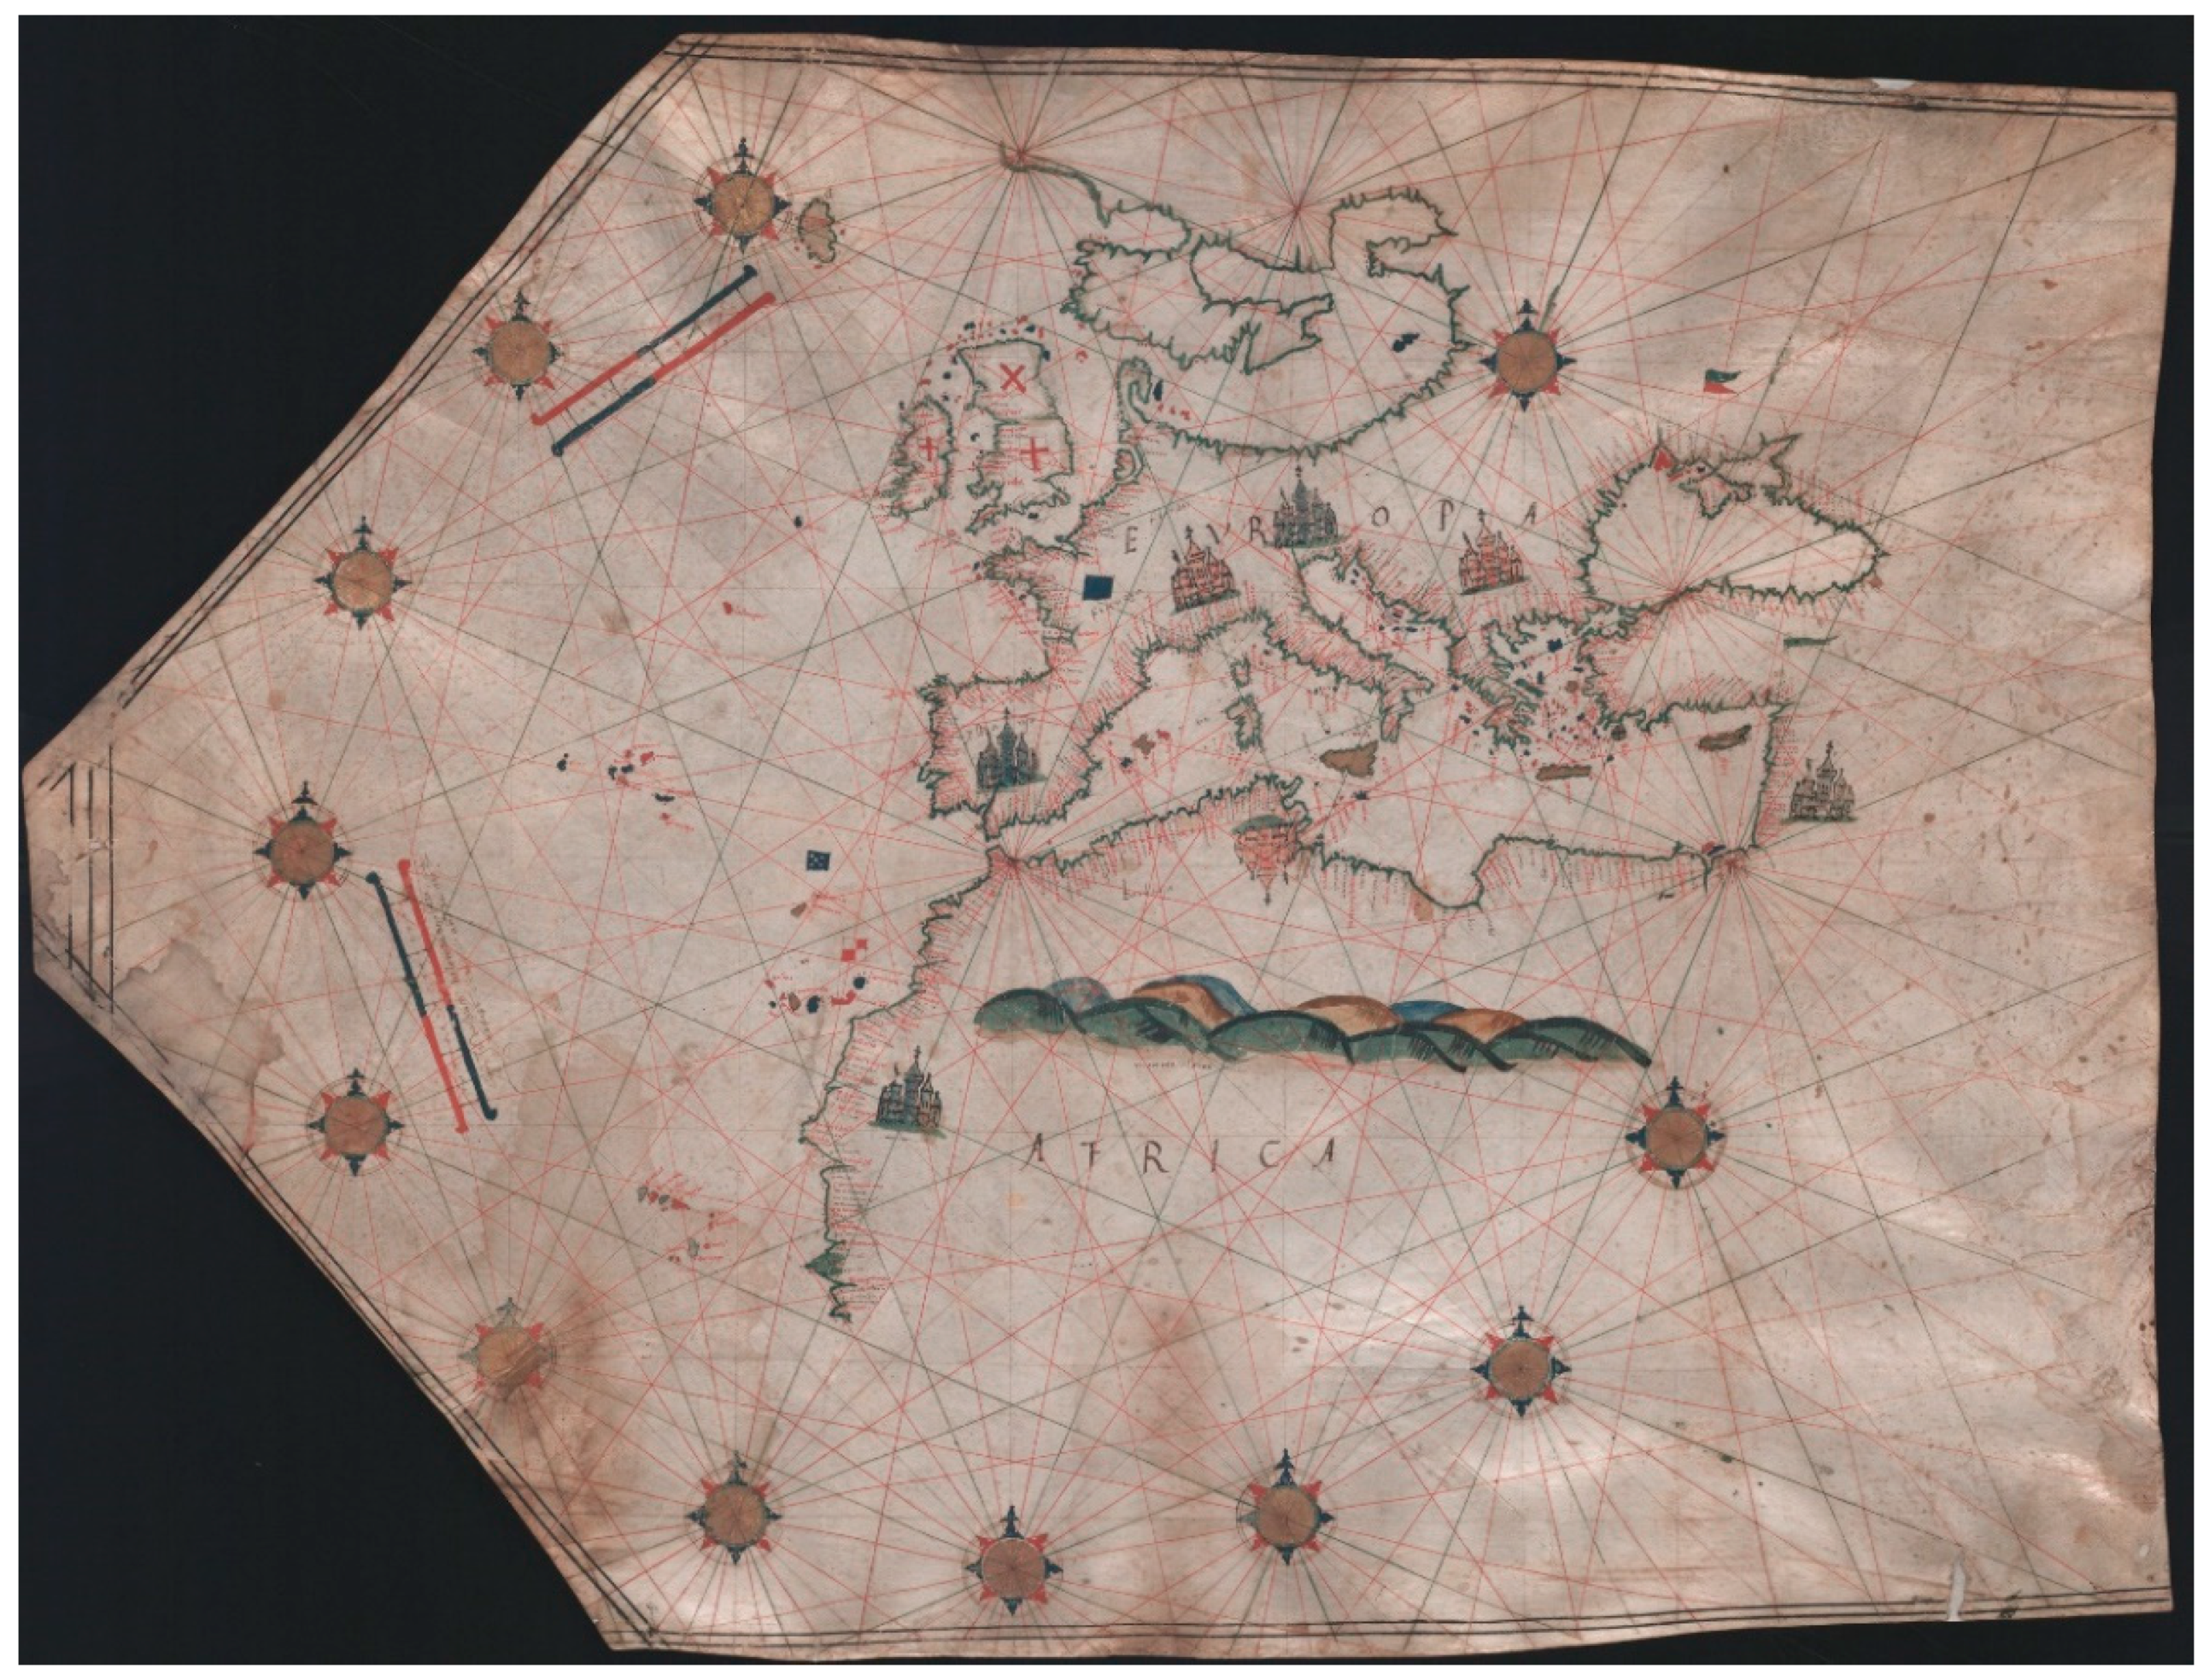
Pigments and Inks Applied in Juan Vespucci’s Portolan Chart (1520)

by
Anabelle Kriznar
1,2,*,
Francisco Ager
2,3,
Luis Robles Macías
4,
Inés Ortega Feliu
2,5,
Blanca Gómez Tubío
2,5 and
Miguel Ángel Respaldiza
2,6
1
Departamento de Escultura e Historia de las Artes Plásticas, Facultad de Bellas Artes, Universidad de Sevilla, C/Laraña 3, 41003 Seville, Spain
2
Centro Nacional de Aceleradores, Universidad de Sevilla-CSIC-Junta de Andalucía, C/Thomas A. Edison 7, 41092 Seville, Spain
3
Departamento de Física Aplicada I, Escuela Politécnica Superior, Universidad de Sevilla, C/Virgen de Africa 7, 41011 Seville, Spain
4
History Department, Université Libre de Bruxelles, Avenue Adolphe Buyl 87, 1050 Brussels, Belgium
5
Departamento de Física Aplicada III, Escuela Técnica Superior de Ingeniería, Universidad de Sevilla, Camino de los Descubrimientos s/n, 41092 Seville, Spain
6
Departamento de Física Atómica, Molecular y Nuclear, Universidad de Sevilla, Av. de Reina Mercedes s/n, 41012 Seville, Spain
*
Author to whom correspondence should be addressed.
Colorants 2022, 1(4), 411-423; https://doi.org/10.3390/colorants1040026
Submission received: 10 November 2022 / Revised: 30 November 2022 / Accepted: 4 December 2022 / Published: 7 December 2022

Abstract

:
Not many manuscript maps have been the object of material analysis so far. A portolan chart, signed and dated by Juan Vespucci in 1520, was studied in this research, conserved at the Archivo General de Indias in Seville (Spain). It is made on parchment and depicts the coasts and islands of Europe and Africa. It is the oldest portolan chart made in Seville, being unusual in applying hand stamp for decorative figures. The map was analysed by different non-invasive techniques: infra-red and ultraviolet light, digital microscope and X-ray fluorescence (XRF). The main goals of this study were to identify the materials used, as well as to detect retouching or restoration work. Results showed that the entire parchment was first covered with a white layer made of lead white (Pb), calcite or gypsum (Ca). The principal pigments used were vermilion (Hg), yellow ochre (Fe), azurite (Cu) and a copper-based green pigment (Cu) and carbon black. The letters were probably written with an iron-gall ink (Fe, Cu). Very thin golden leaves were applied on a mixtion glue for gilded wind roses. Several retouches from the 19th/20th centuries were found using zinc and titanium whites and probably cobalt blue.

Graphical Abstract

1. Introduction

The object analysed in this work is a portolan chart on vellum authored by Juan Vespucci in 1520 in Seville, Spain (Figure 1). Along one of the scale bars, we can read the inscription, “Juan vespuchi piloto de su alteza/me fezit en seuilla año de 1520”, i.e., Juan Vespuchi, pilot of His [or Her] Highness, made me in Seville in the year of 1520. It is preserved at the Archivo General de Indias (AGI) in the same city under the call number: AGI, M. y P. EUROPA Y AFRICA, 125. “Carta portulano del Mediterráneo y de las costas atlánticas de Europa y África” (description from PARES, the online database of Spanish state archives). Portolan charts are a type of manuscript map, made from the 13th to the 18th centuries, which focus on coastal geography and islands and are covered by a network of rhumbs.
Giovanni di Ser Antonio Vespucci, born in Florence in 1487 and called Juan Vespuchi or Vespuche in Spain, was a pilot, mapmaker and merchant who worked for the Casa de la Contratación of Seville from 1512 to 1525 [1]. There is only one other manuscript map signed by this author—A planisphere, now kept at the Hispanic Society of New York (call number K42) [2,3].
The 1520 chart analysed and presented here is the oldest portolan chart made in Seville, and a witness of the time when the city was growing to become one of the main trading hubs of Europe [4].
The chart measures 67 × 89 cm2. Three of its edges are straight, whereas the western edge is trimmed in a trapezoidal form to imitate the natural shape of a whole calf skin, resulting in an irregular pentagon. The map depicts the coasts and islands of Europe and Africa, from the Azores in the west to the Black Sea in the east, and from Scandinavia in the north down to Cape Roxo in the south. A network of wind rhumbs criss-crosses the map, in the tradition of Mediterranean portolan charts. This network consists of one single circle of rhumb nodes: one in the centre and sixteen on the periphery. Twelve of the peripheral nodes were decorated with wind roses. The chart includes two scale bars made as a sequence of alternating black and dotted segments, as was usual in portolan charts. Seven cities or countries are represented by figures, which look like castles, and several polities are highlighted by flags and coats of arms. A range of mountains in Africa completes the chart’s decoration (Figure 2). The verso of the map was originally left blank and now contains the map’s call number written twice in pencil. From an art history point of view, Vespucci’s 1520 chart is unusual because of the use of mechanical means to add part of its decoration, as will be detailed below.
Vespucci’s map was first reported in 1987 by Tony Campbell as being “in private hands” [5]. Three years later, it was auctioned in London [6] and acquired by the Spanish Ministry of Culture. The auction catalogue said nothing about the provenance of the chart. After the purchase, the Spanish government carried out a restoration of the map. The restoration was carried out by the Instituto de Conservación y Restauración de Bienes Culturales (nowadays, Instituto del Patrimonio Cultural de España). The record available at the Institute’s website (registry number 9.967, link) indicates that the chart was received on 3 September 1990 but does not report what intervention was actually performed on it. The restoration was also mentioned by María Luisa Martín-Merás [7]. In August 1992, it was deposited at the AGI, where it remains today.

2. Materials and Methods

Chemical analysis has long been proposed as a tool to obtain new information on old maps to ascertain how they were made, where, when and by whom. However, only a few highly valuable exemplars have been studied so far using different analytical methods, and therefore, the knowledge is still very limited according to Refs. [8,9,10], to mention just a few of them at this point. The present research aims to add new information with three main goals: (a) identification of the materials used in Vespucci’s portolan chart, such as its support, possible priming, as well as pigments and inks; (b) detection of any historic or modern interventions, their location and extension, bearing in mind that no information about retouching or restoration procedures was ever documented; (c) comparison of the obtained results with previous findings about portolan chart materials, contributing to the current knowledge of this specific type of cultural heritage.
The chart was analysed only by non-invasive techniques, which were applied in situ at the AGI. Thanks to a collaboration with the AGI’s restoration team, we were able to study Vespucci’s chart under visible, ultraviolet and infra-red light.

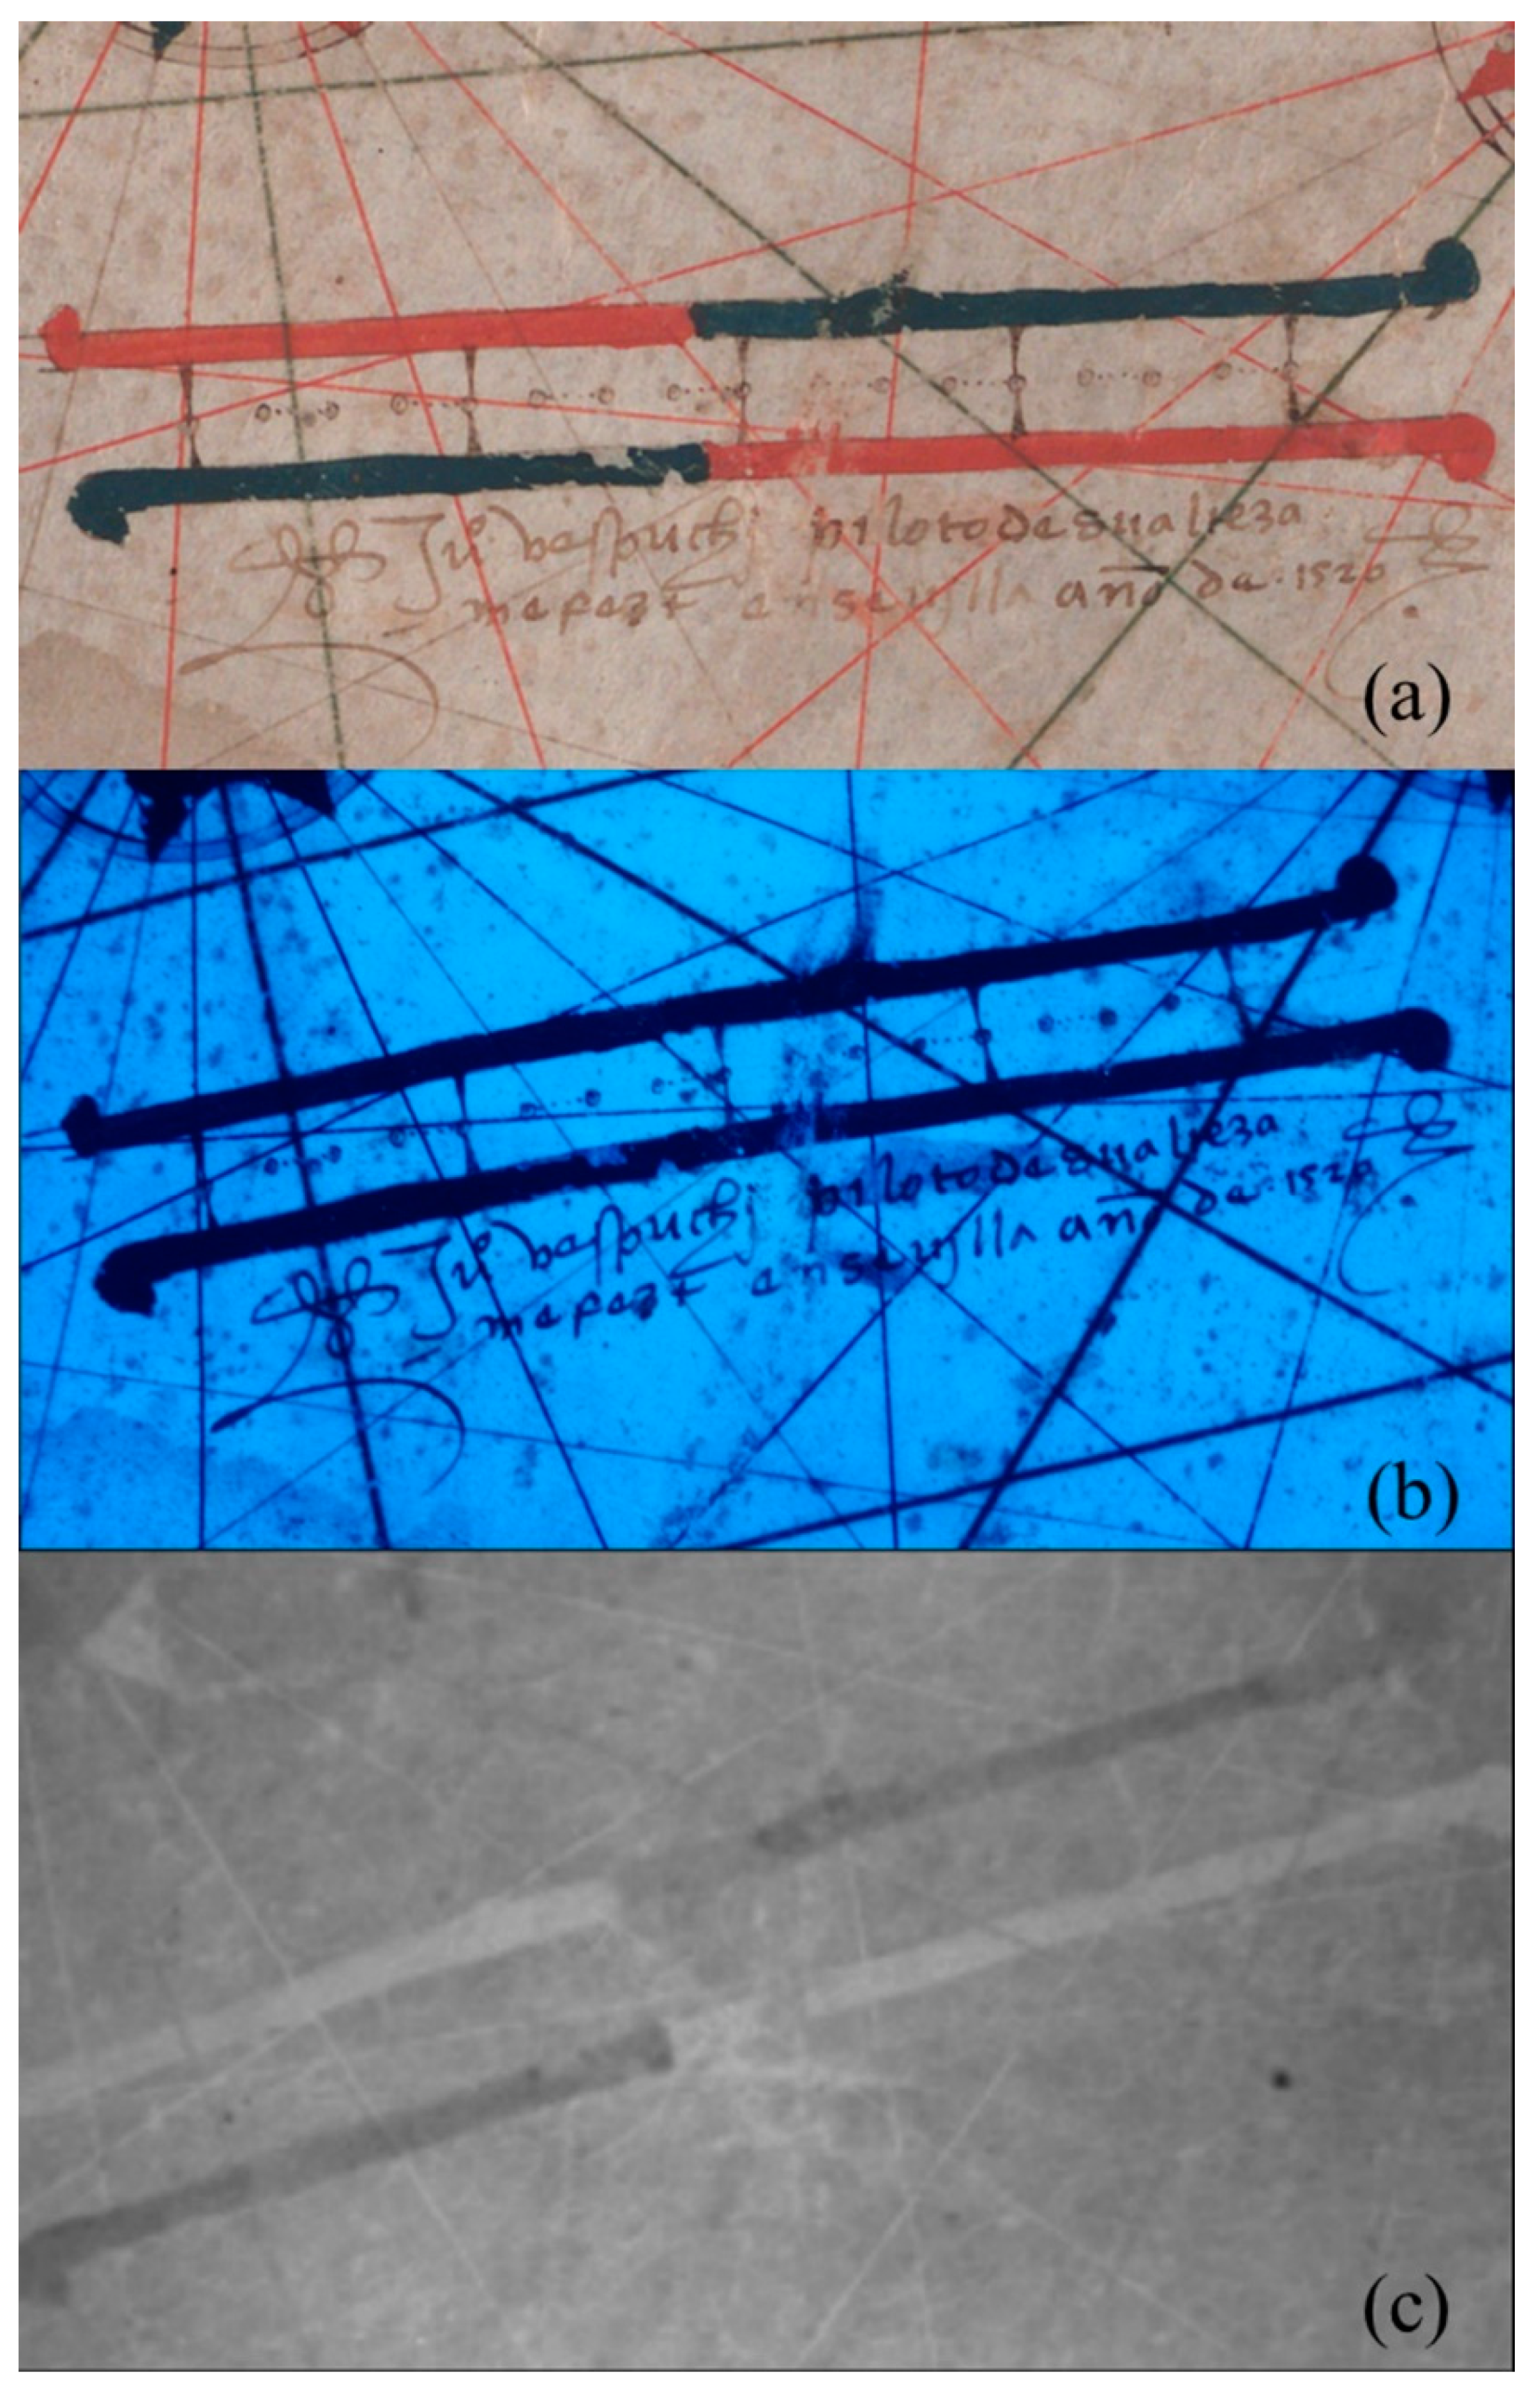
2.1. UV-Induced Visible Fluorescence (UVF)

This method offers quick information on later interventions: overpaintings, repairs, new varnishes or even false signatures [11,12]. Different materials exhibit different colours and intensities of fluorescence, depending on the irradiated material. An important fact is that aged materials fluoresce differently to new ones, which reveals retouched areas. It is a very simple technique but a great support during the next steps of the analytical process. In this study, one hand-held UVP lamp, model UVGL-55 with double band wavelength (254 nm/365 nm), was used for ultraviolet inspection. Visible images were recorded with a Canon digital camera.

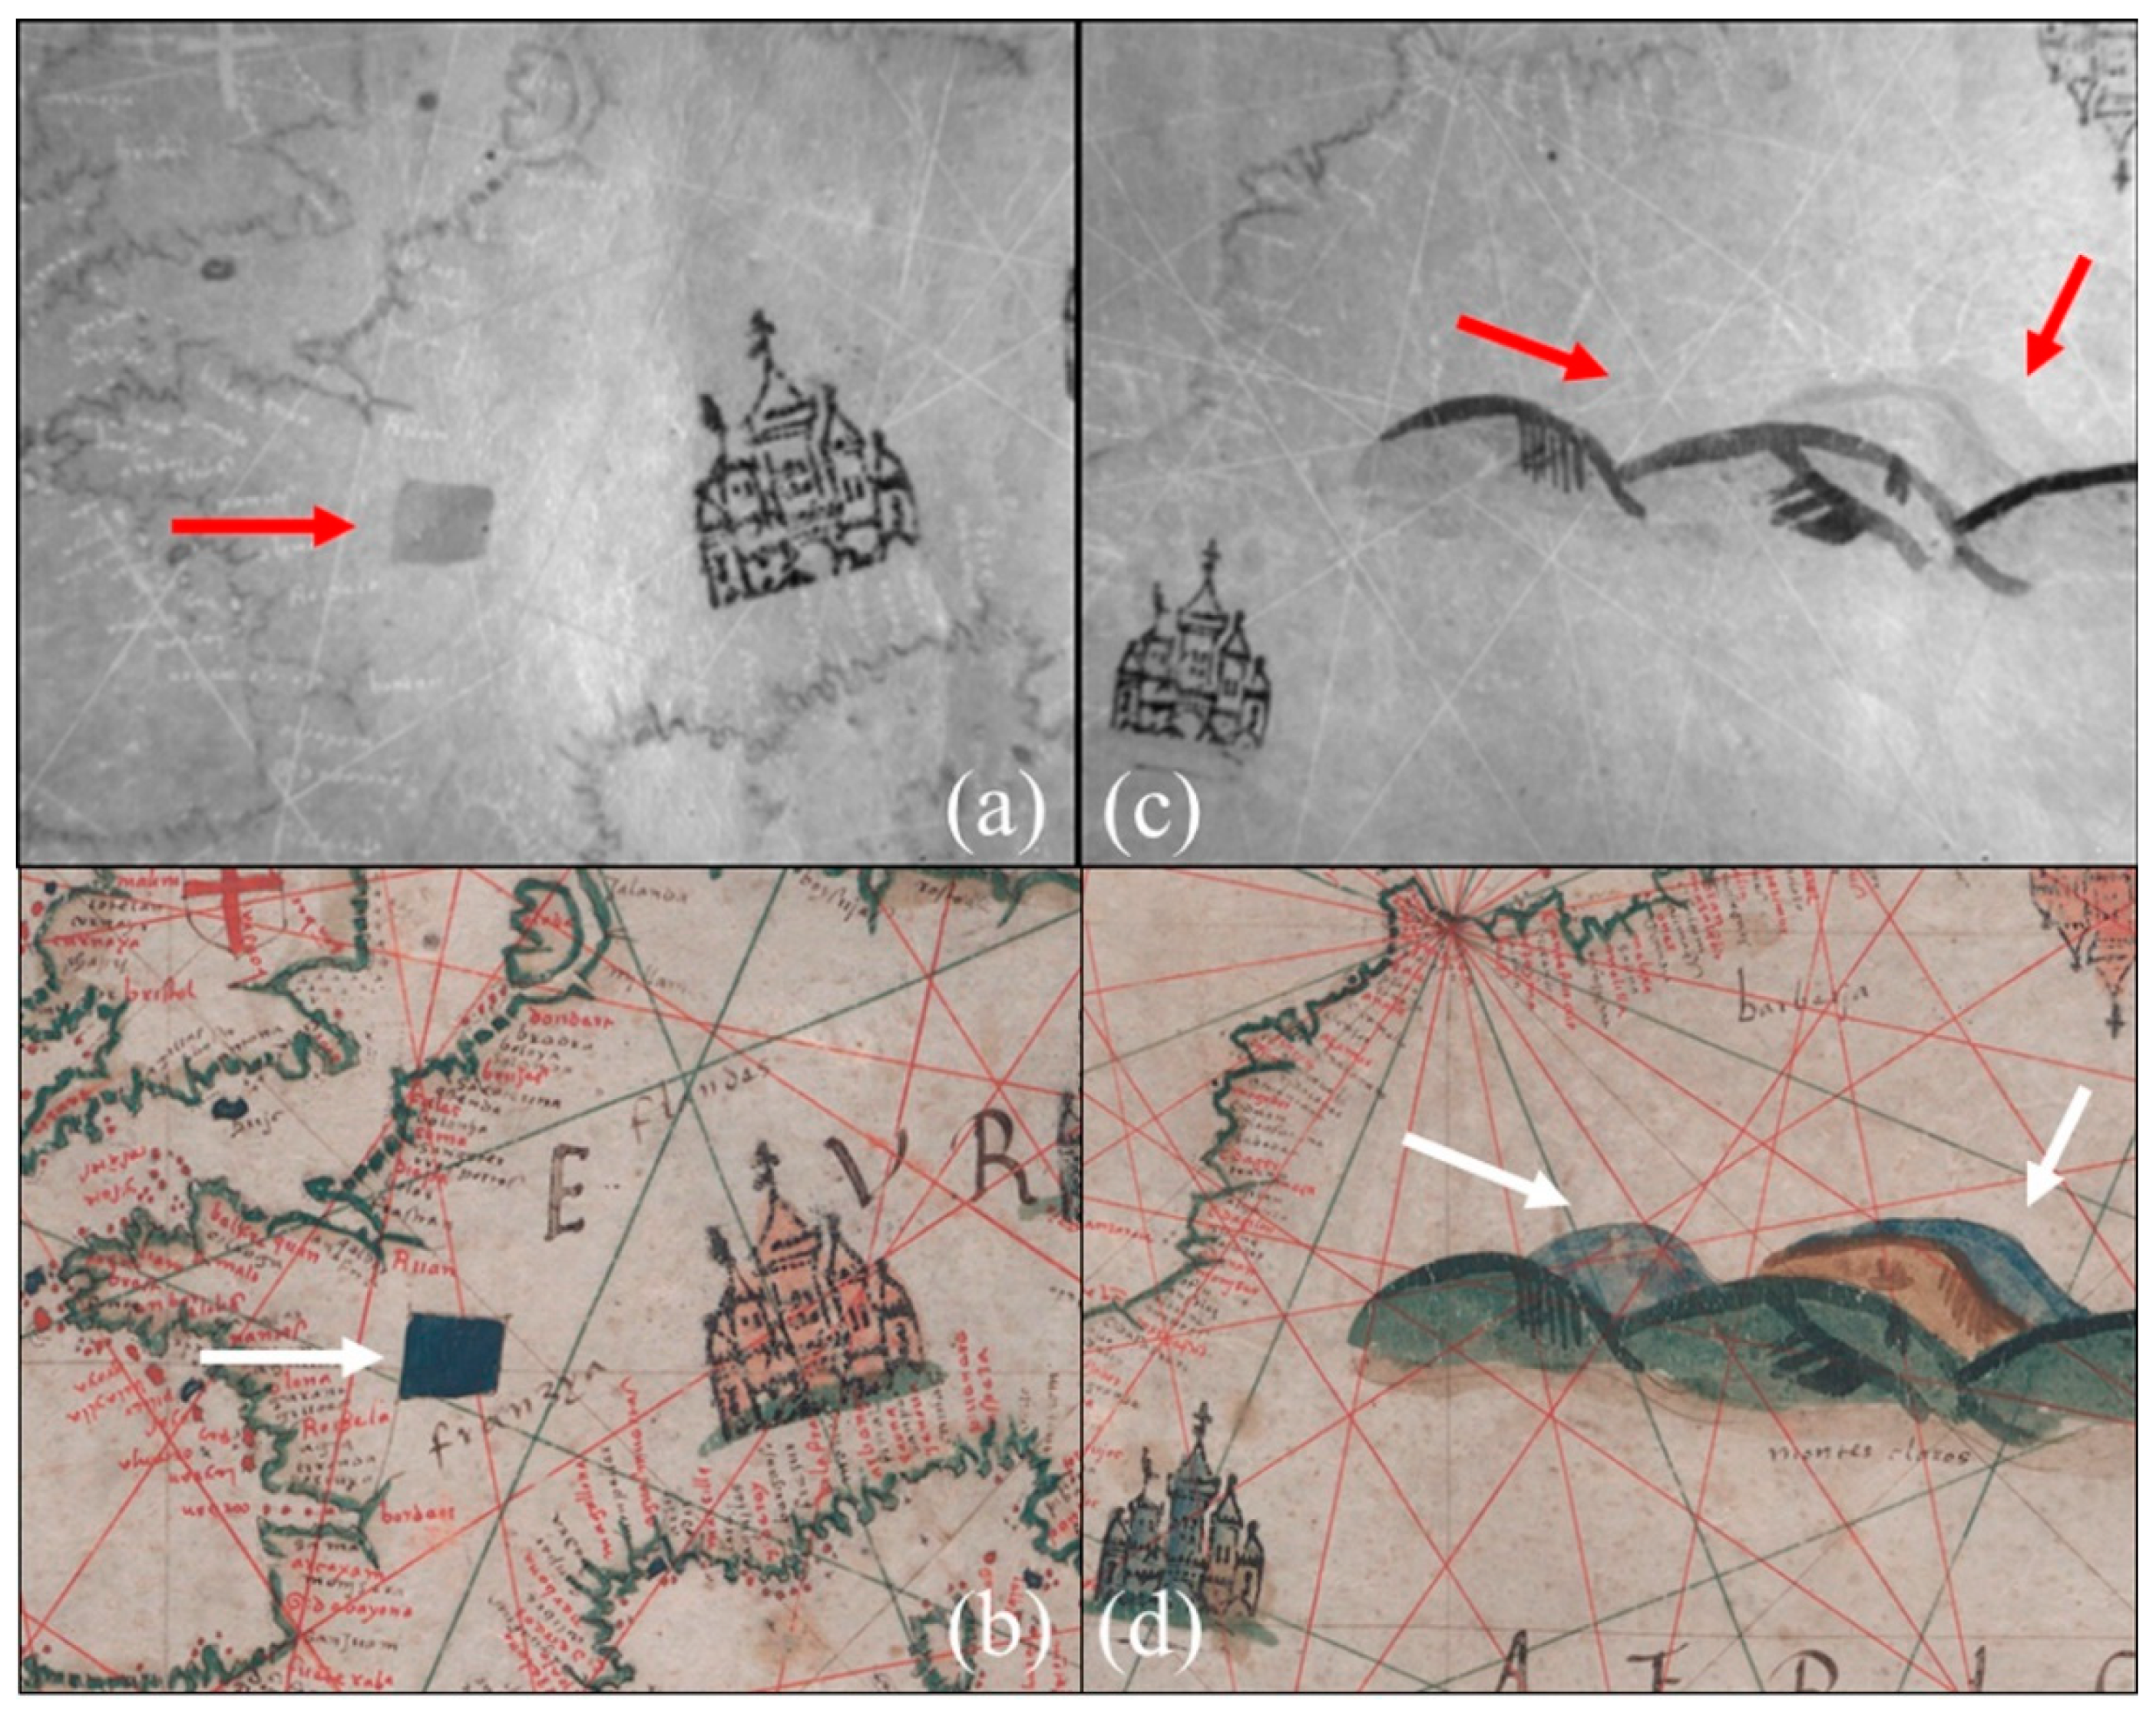
2.2. Infra-Red Reflectography (IRR)

For possible changes in the drawing, interventions and pigment differentiation, infra-red reflectography (IRR) was applied. It is one of the most used image registration methods for the technical examination of art, which detects infra-red no-reflective material (such as carbon black) located under the painted layer (s), invisible to our eyes [11,12]. We used a small 5 cm3 XenICs (Leuven, Belgium) near IR camera Xeva-XS 512 with InGaAs detector and Pentax lens of 16 mm, F/1.4 (320 × 256 pixel resolution) in the range of 900–1700 nm. Two halogen SDI-800W light reflectors illuminated the surface.

2.3. Digital Dino Microscope

Selected areas of the surface were studied with a digital microscope in order to understand its structure and composition, not discerned by the naked eye. The gilded areas were of special interest regarding the technique used. Dino-Lite Premier Digital Microscope AM4113T-FVW(R4) was applied in this study. It was connected to a laptop computer, which allows observing large-scale images and recording them. This model offers 10–70× and 200× magnification and 1280 × 1024 pixel resolution.

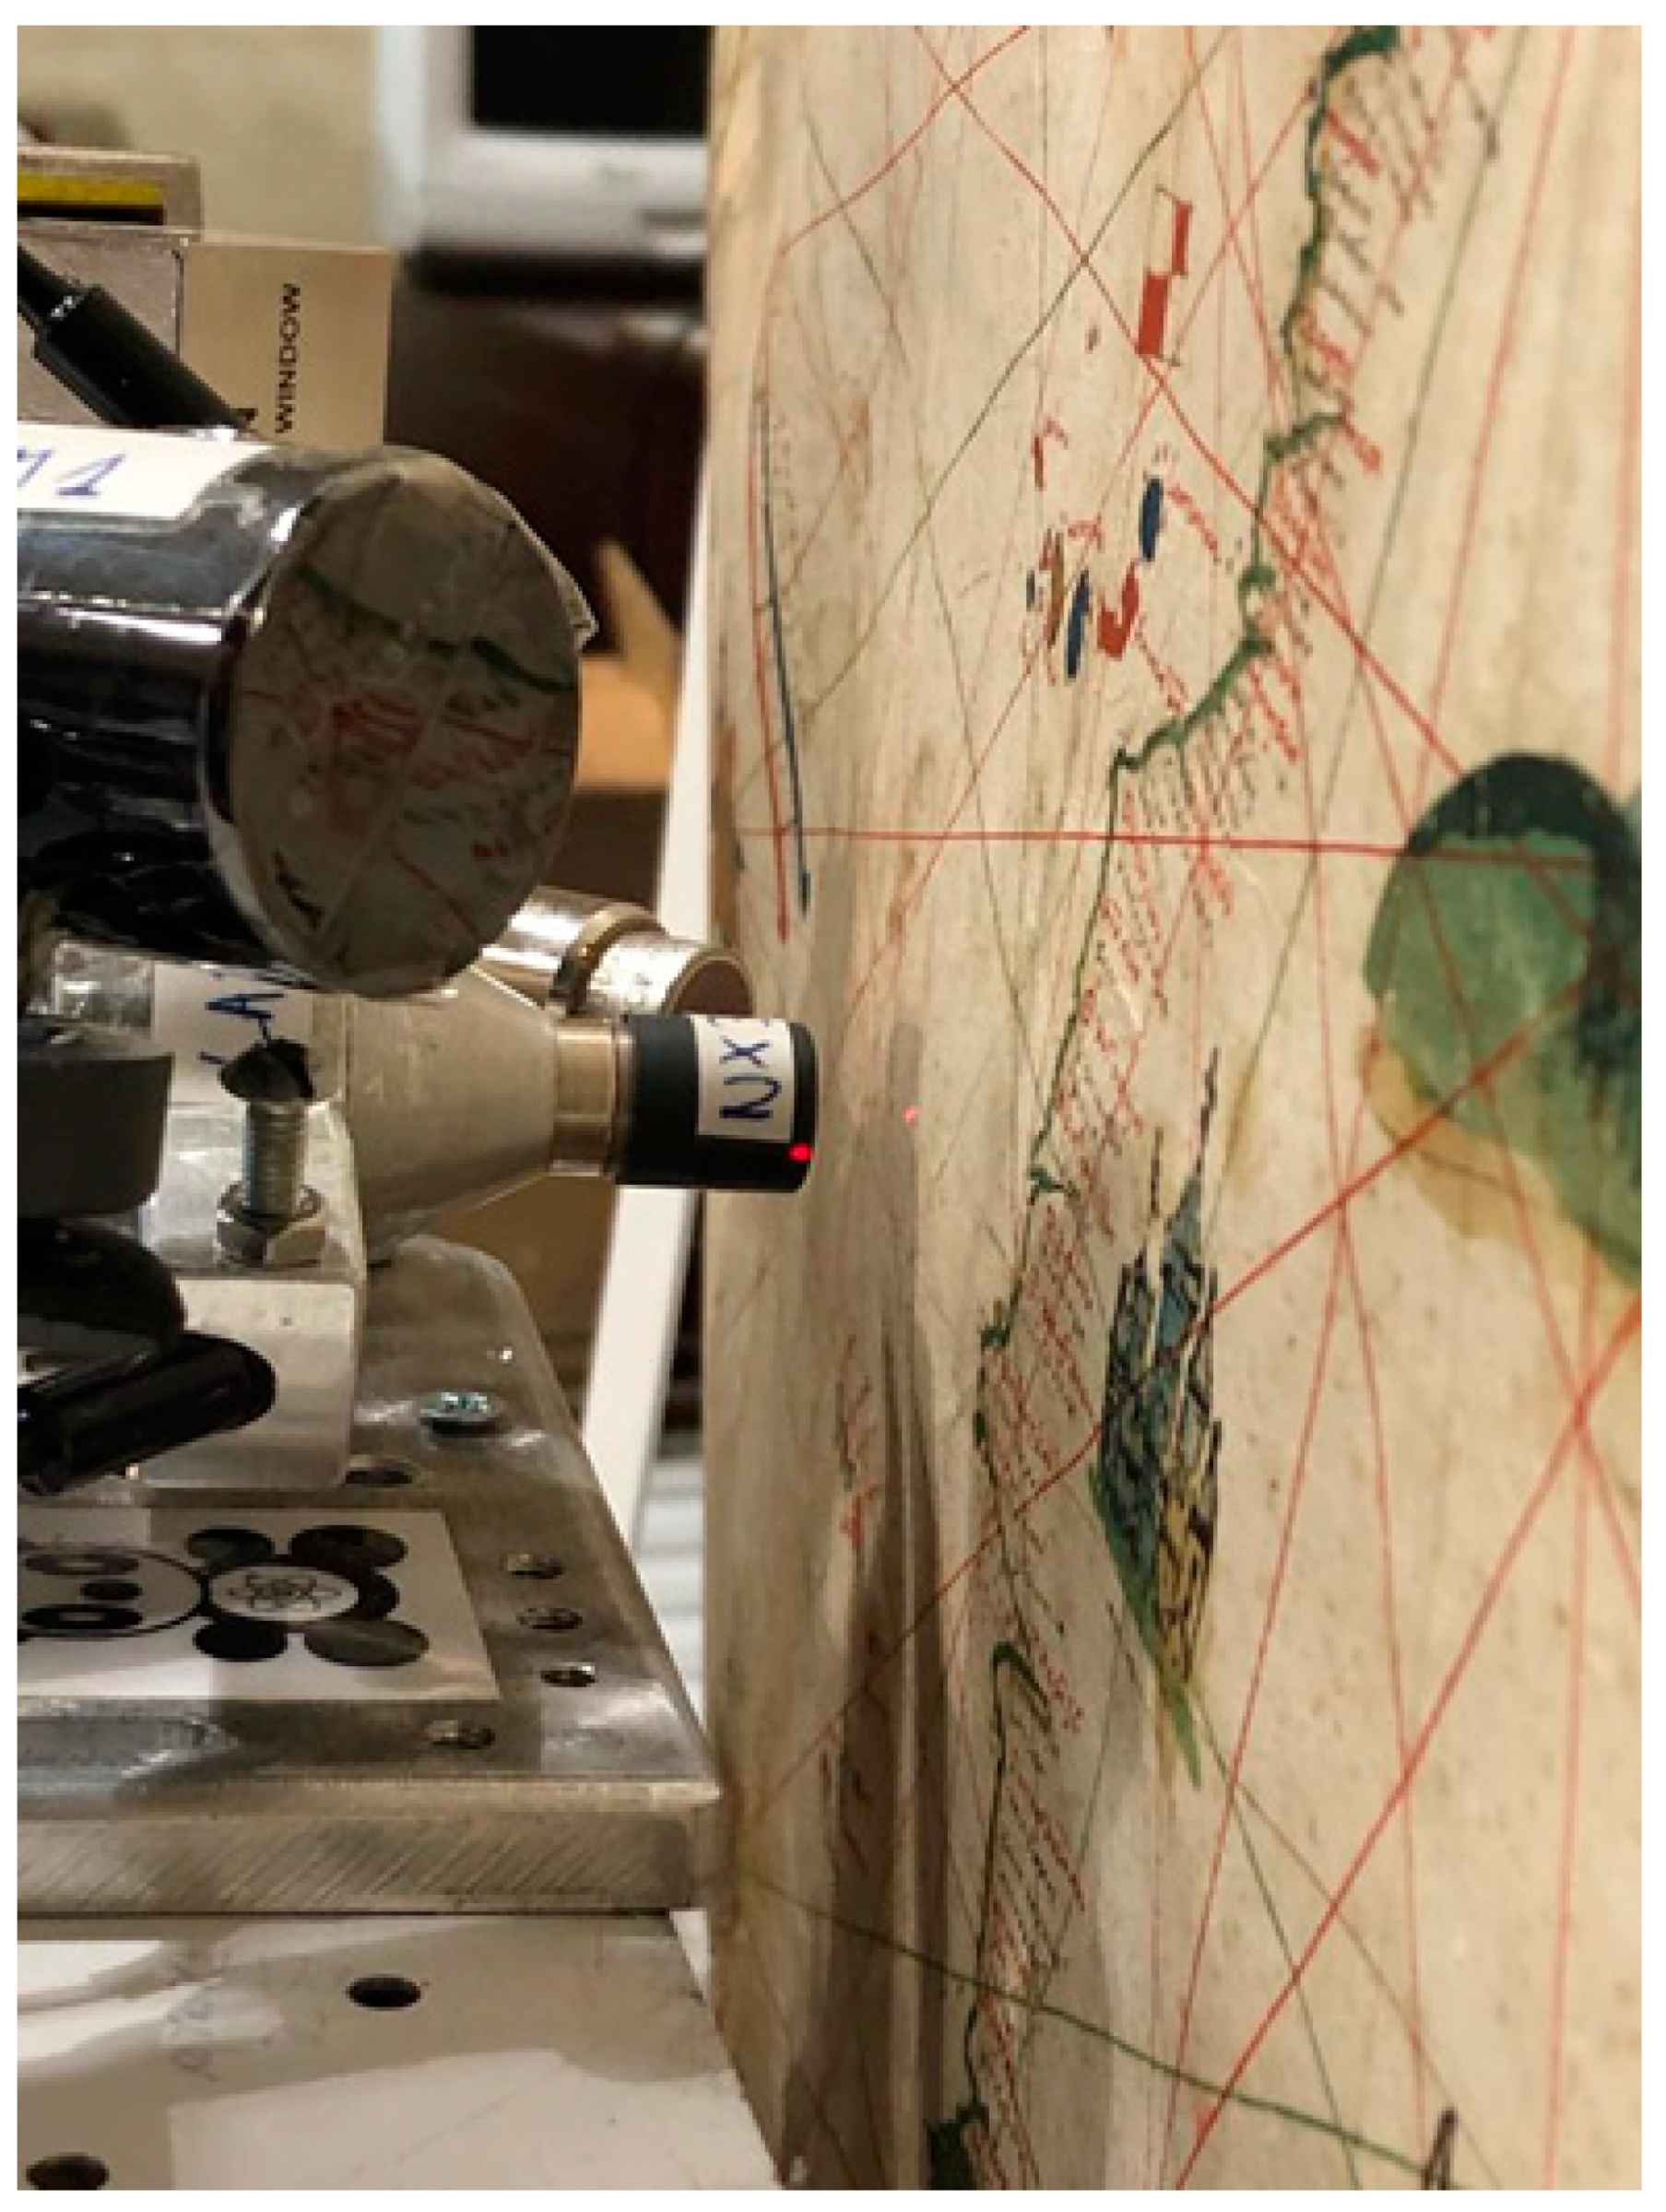
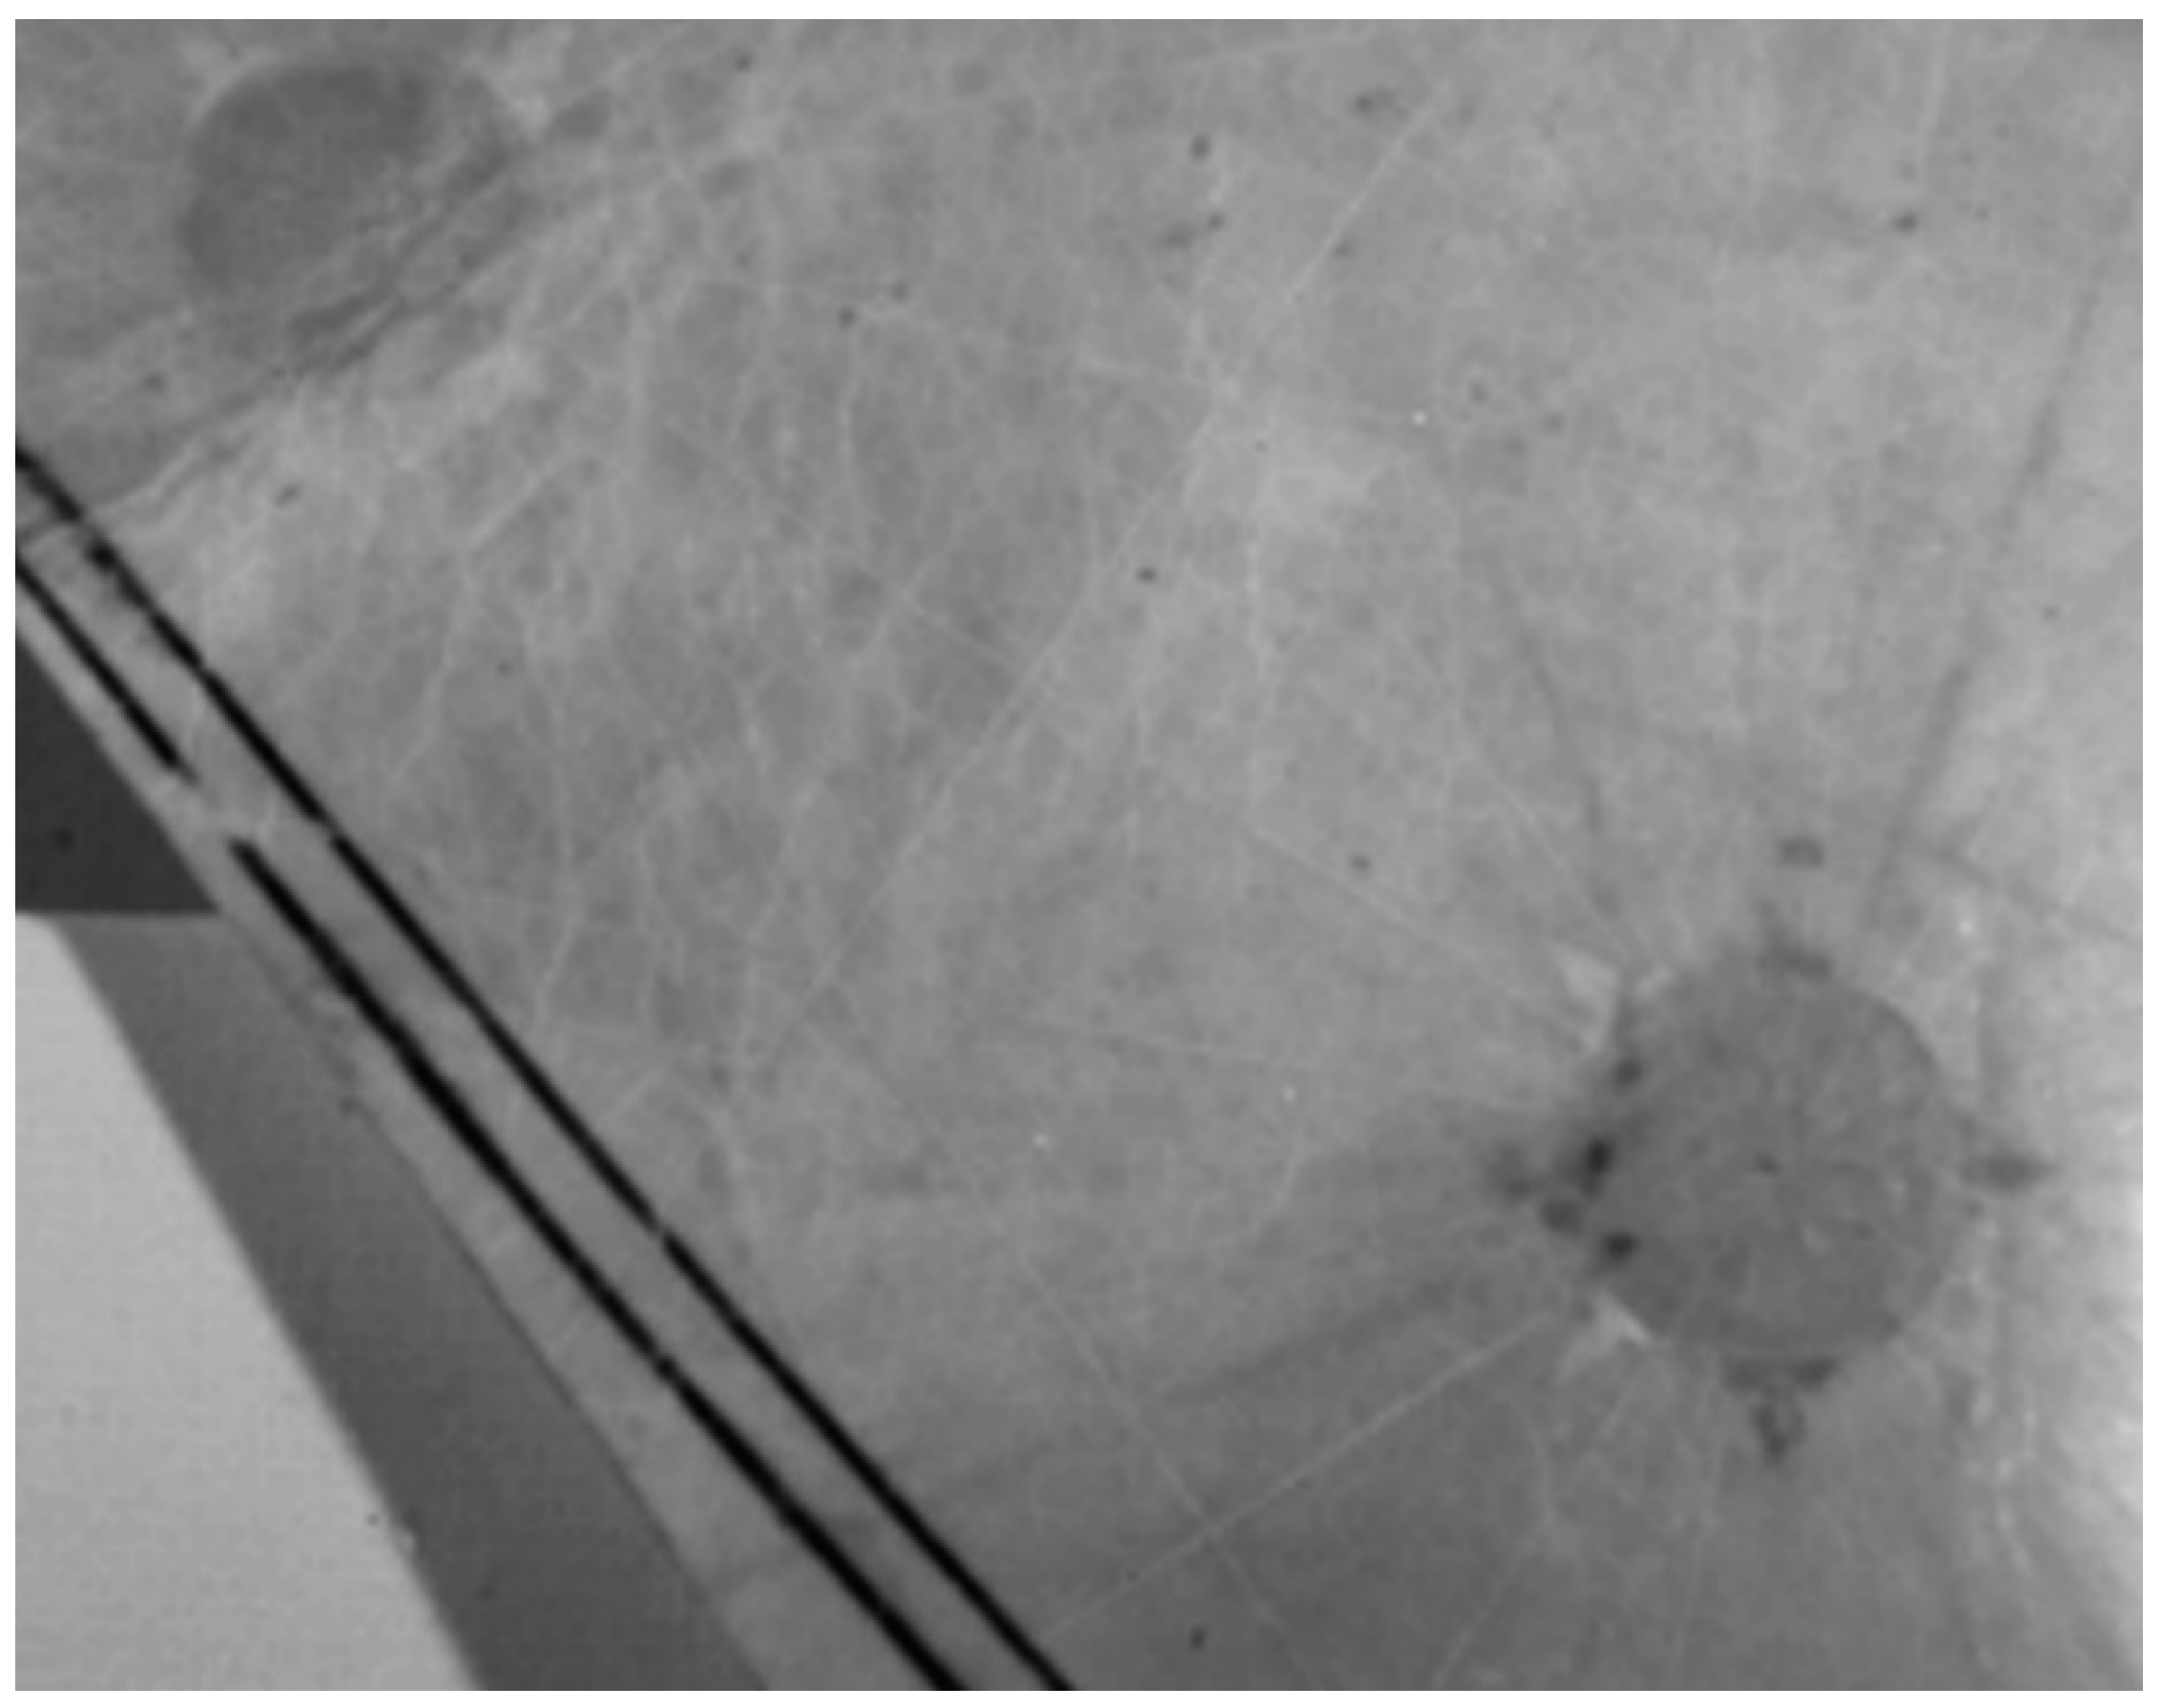
2.4. X-ray Fluorescence (XRF)

For elemental chemical composition, the map was studied by non-invasive X-ray fluorescence (XRF) (Figure 3). We used a portable XRF system composed of Amptek Mini-X (W) X-ray tube and Amptek X-123 silicon drift detector (SDD). It is also equipped with two lasers to position the analysed point at a measuring distance of 10 mm and a PC web camera VMICRO to control and record the analysed points. The primary X-ray beam spot has a 3 mm diameter, which defines the surface of every analysed area. Every spot was measured under the same conditions: 35 kV of current, 100 mA of intensity and 300 s of radiation time. With this technique, chemical elements heavier than Si (Z > 14) can be detected, and, on this basis, most inorganic materials of interest in this study, such as pigments, some inks and preparation, can be identified. The main limitations of XRF are that this technique is insensitive to light chemical elements, and therefore, to organic materials, and its imprecise identification of materials characterised by the same chemical element, like, for example, copper greens or lead pigments, as explained in detail in the literature [13,14].

3. Results

The results obtained from all the above-mentioned analytical techniques reveal an artistically elaborated chart, using a very thin preparation, on which different pigments, ink and gold were applied, as explained further on.

3.1. UV and IRR Analysis

Under UV light, a few small retouches were observed, showing a yellowish fluorescence characteristic of newly applied materials, but no large interventions were discovered. The same can be said for IRR results, which allowed us to discover several small retouches on the chart surface, for example, on one of the wind roses, observed as dark spots (Figure 4). There were no changes in the drawing (pentimenti), and no underlying lines or texts were observed. Different grey hues that range from white to black confirm the use of different pigments. Red lines, areas and letters are seen as white on IRR images; they correspond to vermilion, as confirmed later by XRF analysis. The use of vermilion instead of cinnabar is a hypothesis, as explained further on. Yellow, blue and green colours of the map are of different grey tonality, corresponding to earth and copper pigments characterised by XRF. On the other hand, the dark contours of coasts and especially castles are very intense, pointing towards the use of carbon black. This pigment intensely absorbs IR light and therefore looks black on IRR images [11,12,15]. On the other hand, black wind rhumbs, written numbers of both scale bars and Vespucci’s signature (Figure 5) disappear under IRR, suggesting the use of iron-gall ink that turns invisible under IR wavelength higher than 1200 nm, contrary to carbon or tannin inks [16,17,18]. Nevertheless, there is no evidence of corrosion, which would confirm the use of iron-gall ink.

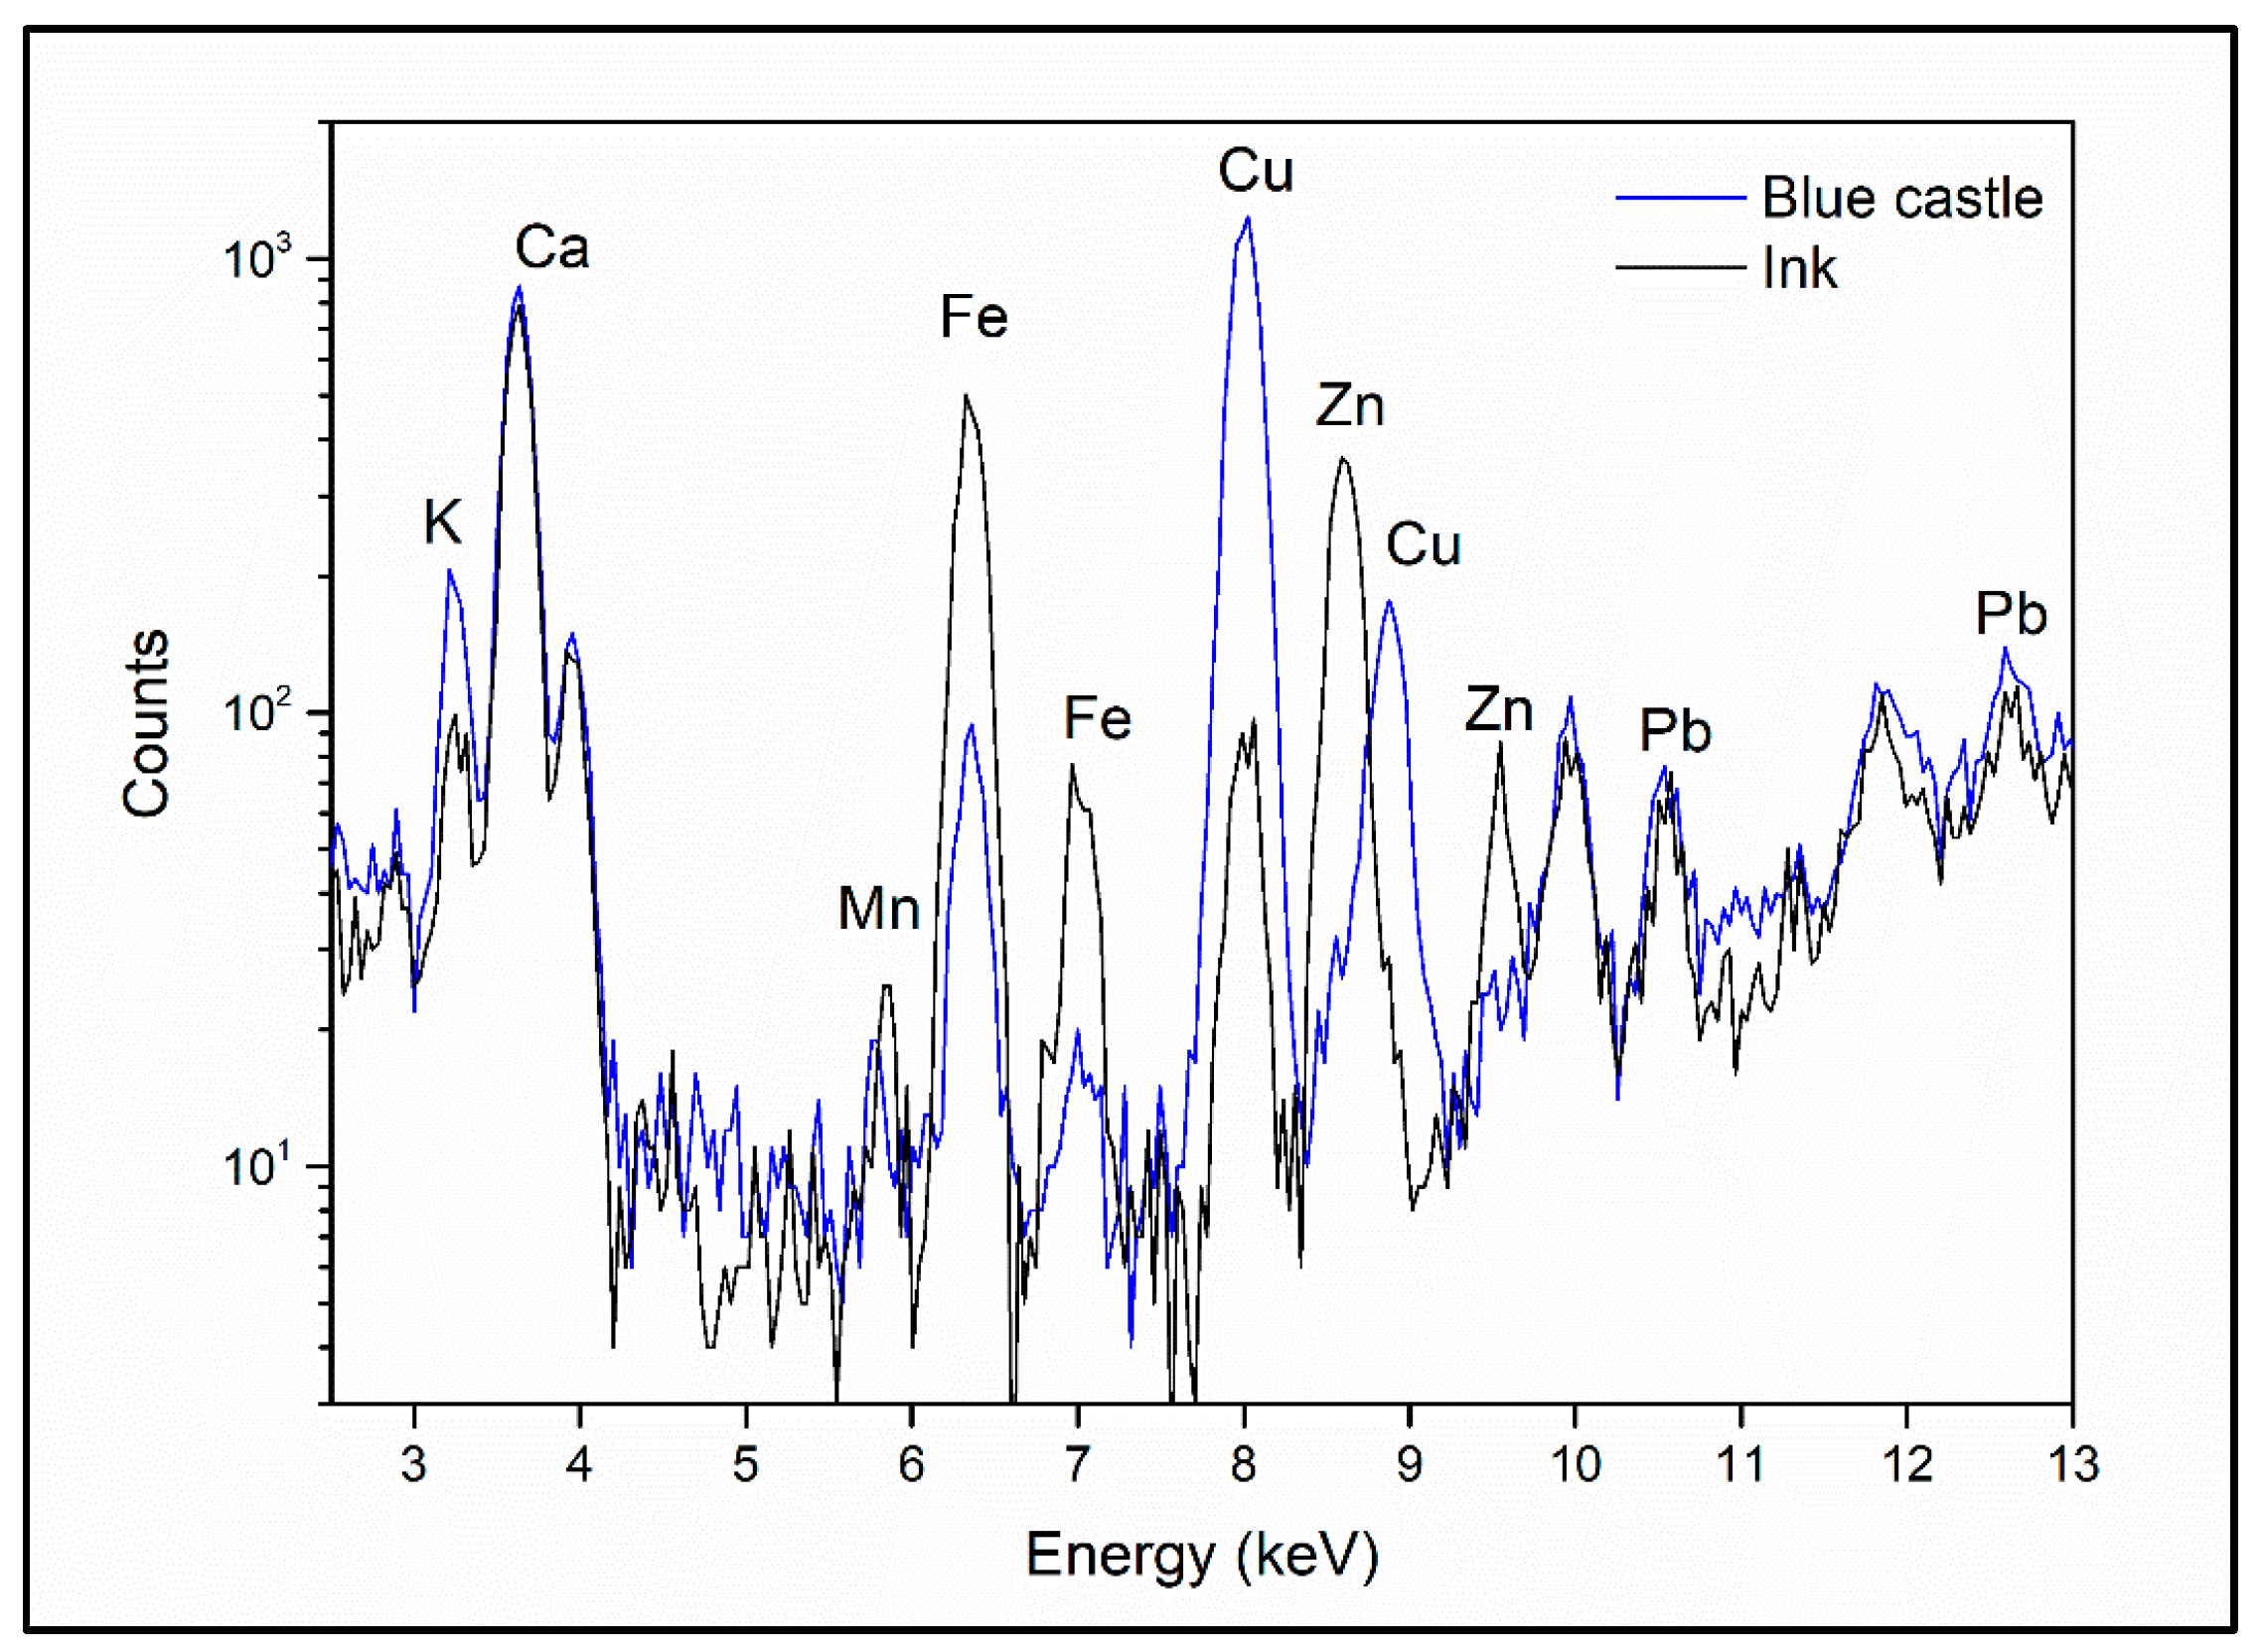
3.2. Preparation Layers and Original Palette through XRF Analysis
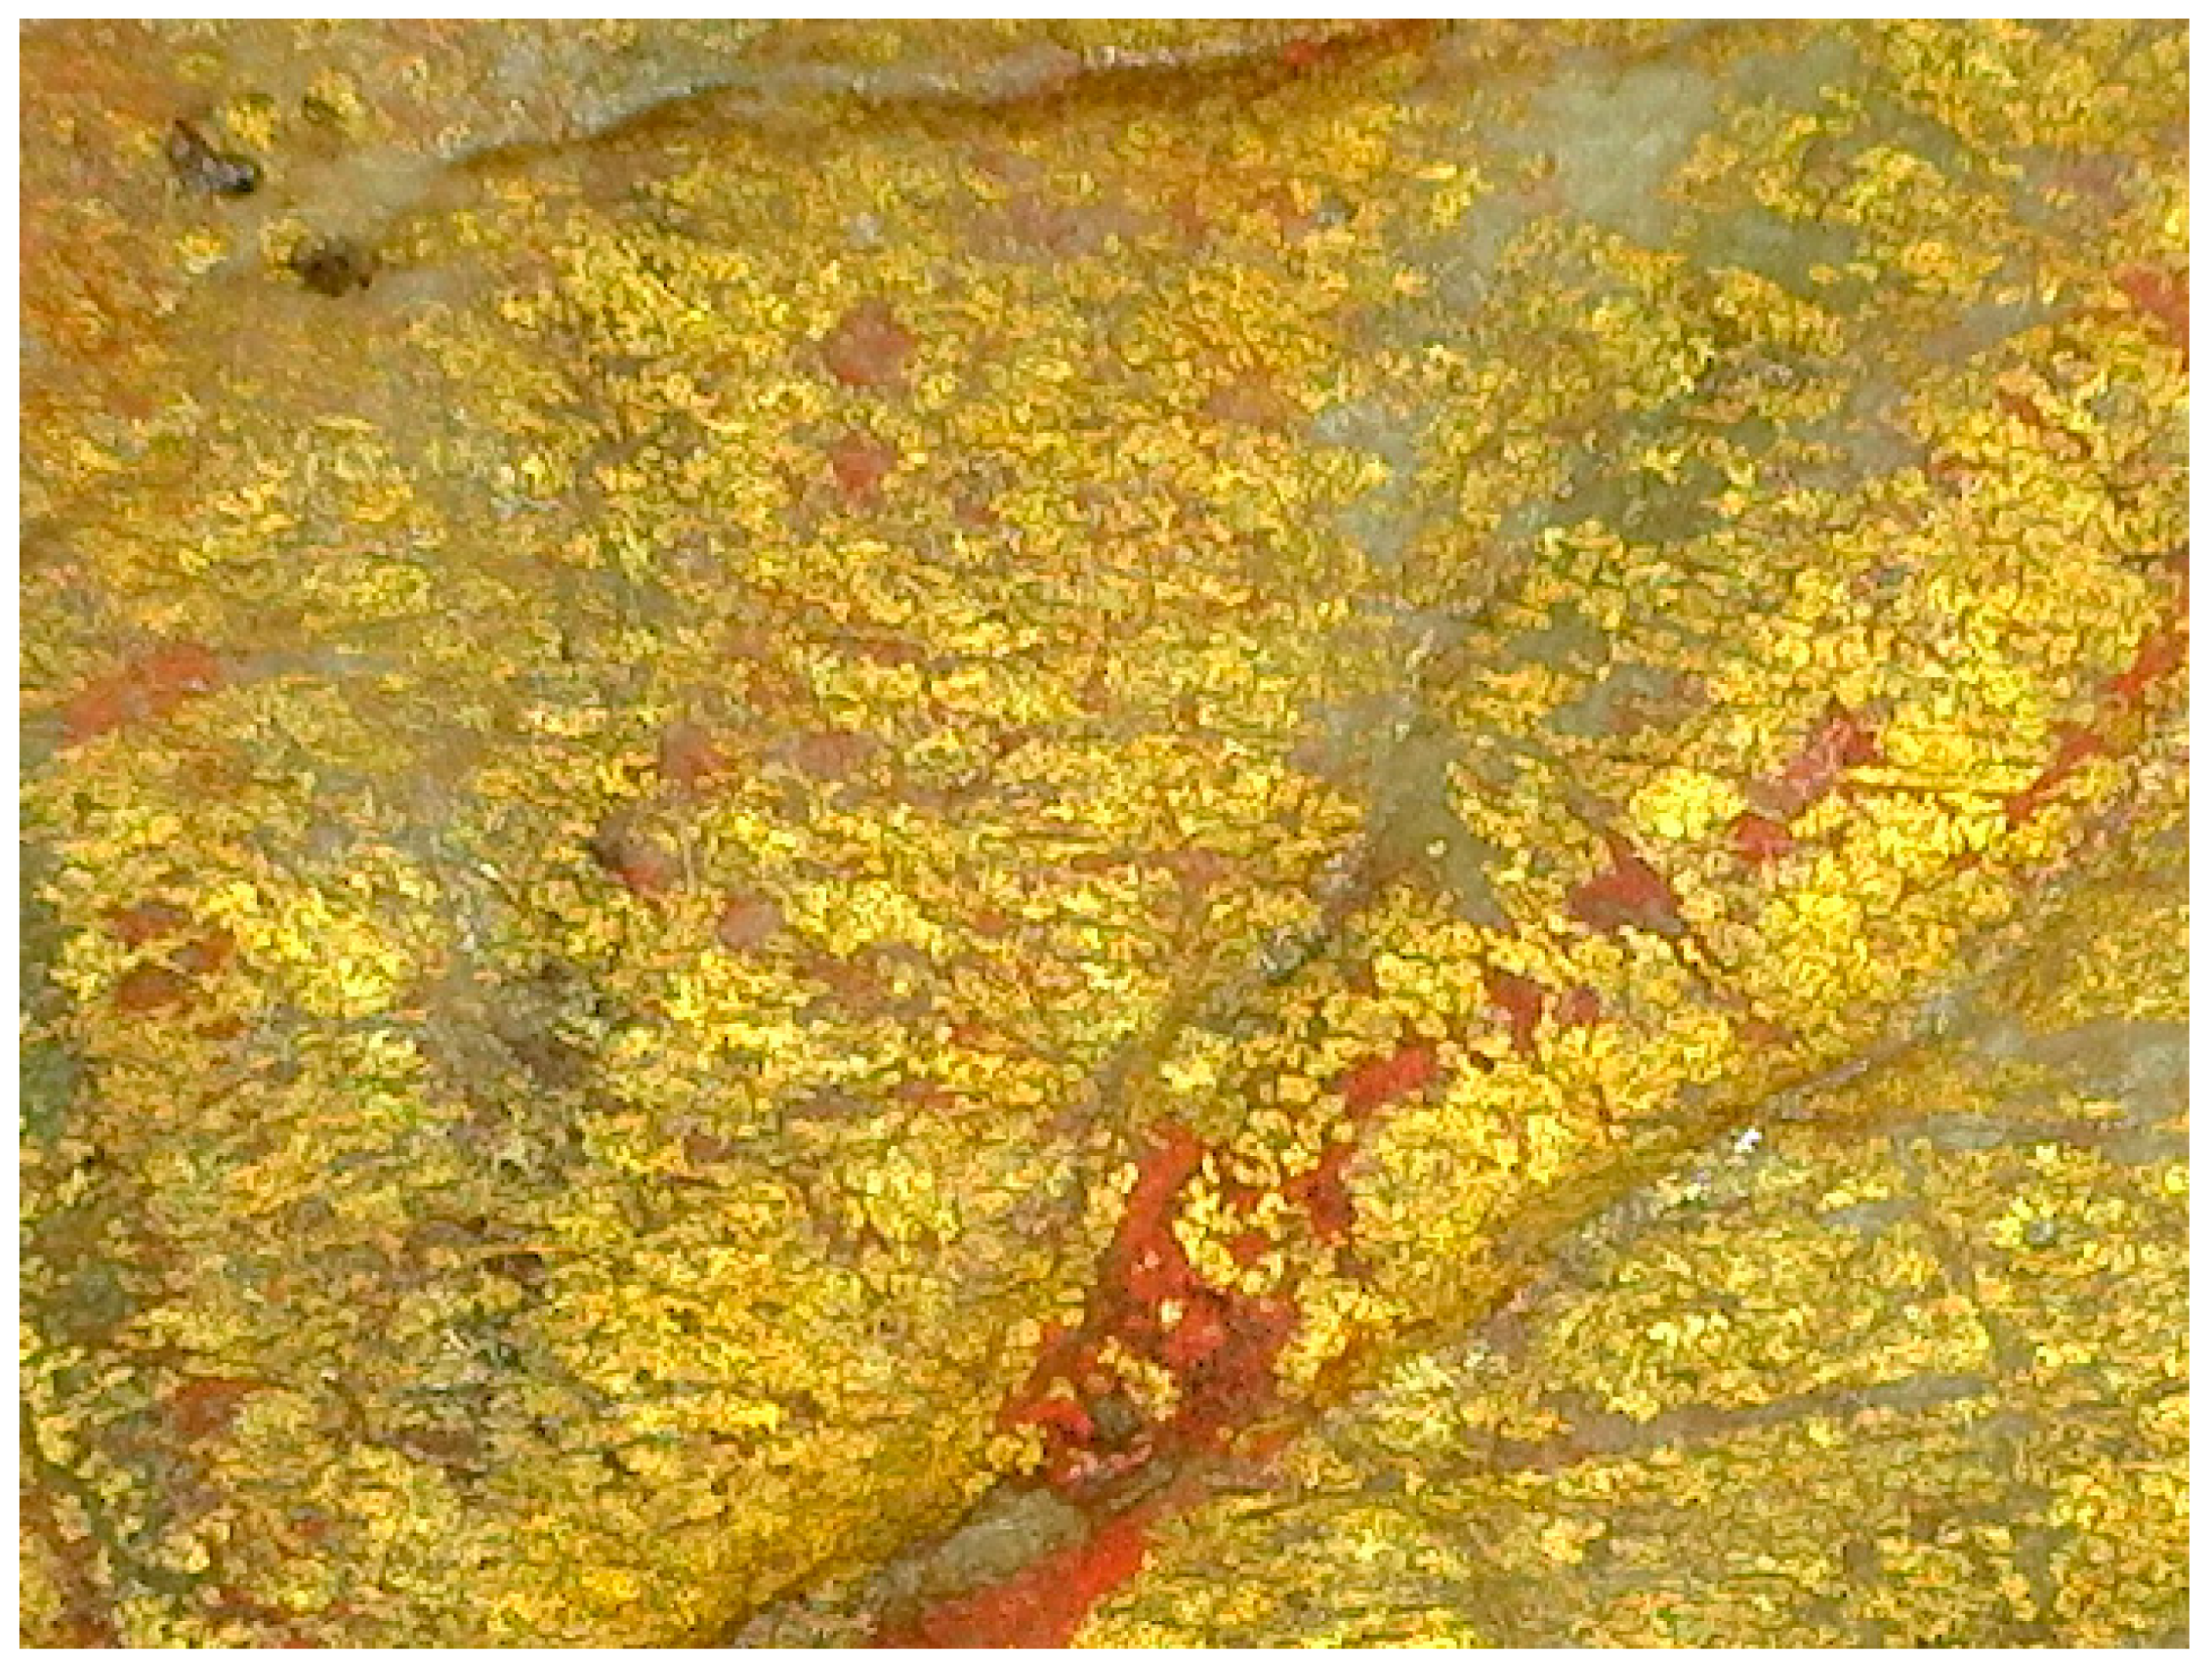
XRF analysis of the background and of different colours applied on the chart identifies the preparation/priming and several inorganic pigments (Table 1), which were common in 16th century painting [19,20]. Already with the naked eye, a thick and uneven white layer can be observed, showing many worn areas with brownish spots, as well as signs of a liquid having been spilled over the chart. The analysis of several points of this layer showed the presence of K, Ca, Fe, Cu, Hg and Pb, with Ca being the major element (the average count rate of Kα peaks is 41 counts per second/cps), while others are minor elements, but still important, such as Pb with 4.6 cps, Fe with 2.2 cps or Cu with 0.7 cps. The preparation was carried out with a calcium-based material, chalk (CaCO3) or gypsum (CaO4), which is not possible to distinguish with XRF due to elemental results only. It was mixed with lead white (2PbCO3·Pb(OH)2), or, perhaps, lead white was overlaid as a primer. The surface is covered with brown spots, which could be lead pigment degradation [21]; however, with XRF, this hypothesis could not be confirmed. In some brown spots, XRF detected more Fe, while in others, more Cu. Nevertheless, there is no correlation; therefore, no conclusions can be drawn. Additionally, the results suggested that very small amounts of iron oxide (ochre, perhaps Fe2O3), vermillion (HgS) and azurite (Cu3(CO3)2(OH)2) or a copper-based green pigment (malachite, verdigris …) were added to the basic white colour. Under magnification with Dino digital microscope, it was not possible to discern the pigment particles; however, the brownish spots are clearly seen (Figure 6). Perhaps the chart’s polychromy became diluted as a result of the accidental liquid spill and spread in small quantities all over the surface.
The colours used for continents, islands, hills, castles, flags, wind roses, wind rhumbs and scale bars are composed of ochre, red, blue, green and black pigments. The analysis identified the dark yellow colour as ochre, an iron oxide (Fe) used for several hills and islands. The red colour is vermillion (Hg), the synthetic version of the natural cinnabar and therefore cheaper [13,19,20], but it is impossible to distinguish between the two using most analytical techniques. Sometimes, iron oxide red (Fe) was added to obtain a darker hue. Red colour was selected for many toponyms, part of both scales, the four intercardinal points of each wind rose and half of the rhumb lines, as well as for some islands, flags and castles. The blue colour is azurite, suggested by high Cu peaks in all the analysed areas. Compared to other investigated areas, the Cu lines are the most intense. Obtained from the semi-precious mineral, copper-based azurite was, at the time, the most important pigment used for representative works, next to very expensive ultramarine (not detectable by XRF) [19,20]. It was applied for other islands, flags, hills, castles, the other part of both scales and the four cardinal points of wind roses. Green colour is also characterised by intense Cu peaks (Figure 7), but with XRF, its composition cannot be precisely determined, since many green pigments are copper based. Perhaps malachite, verdigris or copper resinate, known at that time, was applied [13,19,20]. The green colour was used for several rhumb lines, continent and island contours, one of the castles, castle grounds, flags, one bigger island and the circular interior bands of the wind roses. In some green areas, such as the mountains, one of the castles (Near East) and the flag above the Black Sea, K, Mn and Fe peaks are observed, suggesting the addition of green earth (Figure 7a). Such is also the case of the blue castle in West Africa, where azurite might have been combined with green earth for a different tonality. The black pigment selected for castle contouring (which was stamped on the chart) and for the perimetral double black lines of the chart shows no characteristic feature under XRF; as mentioned above, IRR suggests carbon black. Regarding this observation, carbon black might have also been used as an underlayer in some blue (azurite) areas, such as the flag in France or the blue halves of both scales, which are seen as dark grey on the IRR image, while other blue areas, such as hills or some castles, are almost invisible under IR light (Figure 8). Nevertheless, this difference could also be due to a thicker blue colour layer and/or less diluted pigment for intense blue areas, as suggested by higher Cu peaks on XRF spectra of the flag and the scale bars. XRF analysis of the dark thin wind rhumbs shows very low Fe and Cu peaks. This confirms the IRR results that iron-gall ink with low copper content was used. Fe and Cu peaks are more intense on thicker letters, especially in the words “Europa” and “Africa” (Figure 7b), which also turn invisible under IRR, strongly suggesting the use of iron-gall ink [16,17,18,22].

3.3. Gilding

Gold was confirmed on the central circles of every wind rose with clear Au peaks. A very thin gold foil was observed under Dino digital microscope (Figure 9), revealing that no bole was used as the underlayer, but a transparent adhesive, known as mixtion/missione (an adhesive mixture of oil or egg white, etc.), is painted directly on the substrate before application of the gold foil or leaf [23,24].

3.4. Retouches

In almost all the analysed points, low Zn presence was observed, which, in a few areas, jumped to intense Zn peaks, revealing interventions based on zinc white, a modern pigment used from the end of the 19th century. In several areas, low Ti presence was also detected, which could reveal another, later intervention with titanium white (on the market since the second decade of the 20th century) [13,19,20]; although Ti could also be an impurity of zinc white, it does not always co-occur with zinc white retouches and therefore seems to be an independent element/pigment. Another explanation for the presence of Ti could also be as an impurity of an earth-based pigment. Results indicate that cobalt blue may have also been used in some areas, but the Co peaks are not very clear because they partially overlap with Fe peaks. The wind roses seem to be the most restored parts; in several analysed areas, Ca intensity is much lower (the average cps for Ca Kα is 7.71) in comparison to other parts of the roses (12.9 cps), suggesting another, newer layer on top of the original one, which must have been applied during one of the interventions. UV images do not offer any clarification on the subject.

4. Discussion

The results obtained from Vespucci’s chart show that its pigment palette is similar to those of other late medieval and early modern manuscript or hand-coloured maps and globes [19,20]. The first material studies of these works were based on analysis of microsamples [22]; however, the current tendency is the application of non-invasive techniques, predominantly XRF, which was combined variously with UVF, IRR, PIXE, FORS or Raman spectroscopy [8,9,10,25,26,27]. Recently, multispectral and hyperspectral imaging have also been used [28,29].
As in Vespucci’s chart, lead white, yellow ochre, vermilion, azurite, copper-based green (in some studies identified as atacamite, copper chloride [30]), gold leaves and carbon black were applied [25,29,30,31,32]. Gypsum is present in a Blaeu hand-coloured map from the 17th century printed on paper, but in this case, the substance was used as a filler in the cellulose of the paper [10]. In some maps, the use of organic colourants for violet, yellow [26] and red, identified as cochineal [32], was reported. We could not identify organic materials due to the analytical techniques available. In our study, red ochre was detected too; however, it could be the result of a later intervention.
According to Corradino Astengo [33], the three standard types of ink in early modern nautical charts were probably iron gall for black, verdigris for green and Brazil wood, cinnabar or red lead for red. The analysis of Vespucci’s chart corroborates Astengo’s theory for black and possibly also for green, and it supports cinnabar or vermilion as the composition of red ink. An interesting study by XRF of the black ink in two 16th century manuscript maps on paper [9,34] revealed intense Fe and low Cu peaks, confirming the use of iron-gall ink with low copper content, which is also consistent with our results. On the other hand, the preliminary preparation of the parchment with a white layer had not been documented so far for manuscript maps. Nevertheless, the presence of a Ca-based compound at the level of the parchment support could be due to the manufacturing process; powdered gypsum was used for the removal of excess fat in animal skin processing and for the acceleration of the drying process and ink absorption increase [35].
The seven castles that represent cities are so similar that their outline must have been drawn using some mechanical means. This impression is reinforced by the specks of black dust that can be seen scattered around some of the castles. Attention was first called to the “stamped” city symbols of Vespucci’s chart in 1987 [5]. Since then, the use of stamping in portolan charts has only been documented in the Maggiolo family’s workshop in the 16th century [36] and in the works of two individual mapmakers of the 17th century [37]. Visual inspection of the parchment under the castles of Vespucci’s chart shows it is not deformed, which rules out the use of high-pressure printing techniques and supports the hypothesis that the castles were hand-stamped, as was observed by the restoration team of the AGI. The pigment used for the castles’ outlines was probably carbon black, based on our analysis. This pigment was used elsewhere in the chart. Every castle was subsequently coloured by hand with a variety of pigments.

5. Conclusions

A portolan chart authored by Juan Vespucci in 1520 in Seville was analysed by digital microscope, UV, IRR and XRF to obtain information on its original materials, as well as on later interventions, some of which were documented but had not been detailed. The results identified a calcium-based preparation (probably gypsum, having been made in Spain [38]) and lead white priming, with possibly other pigments added as traces. The pigment palette is composed of lead white, yellow and red ochres, vermillion, azurite, a copper-based green pigment and carbon black. Black ink was probably an iron gall one, while the use of gold leaves applied on mixtion was confirmed for wind roses. All these results are consistent with studies on contemporary portolan charts. Several small retouches were confirmed all over the surface based on zinc and titanium whites with (probably) cobalt blue and perhaps red ochre, but different restorations could not be distinguished. Part of the chart’s decoration was stamped by hand using a black pigment, probably carbon black.
It has been demonstrated that chemical analysis can be a promising source of insights on old maps. However, its use remains rather rare. This has so far prevented the creation of a sufficiently extensive database of knowledge. Hopefully, the other portolan chart signed by Vespucci will be analysed in the future, as well as the contemporary planispheres made at the Casa de la Contratación. Researchers in the history of cartography are encouraged to expand the application of chemical analysis to other types of maps that have not been studied yet and to move from the analysis of individual items to the systematic survey of diverse collections of maps.

Author Contributions

Conceptualisation, A.K., F.A., L.R.M. and M.Á.R.; methodology, F.A., I.O.F., B.G.T. and M.Á.R.; software, F.A., I.O.F., B.G.T.; validation, A.K., F.A. and L.R.M.; formal analysis, A.K., F.A. and I.O.F. and B.G.T.; investigation, L.R.M., A.K. and F.A.; resources, M.Á.R.; data curation, A.K. and F.A.; writing—original draft preparation, A.K. and L.R.M.; writing—review and editing, F.A., I.O.F., B.G.T. and M.Á.R.; visualisation, A.K., F.A. and L.R.M.; supervision, M.Á.R.; project administration, M.Á.R. All authors have read and agreed to the published version of the manuscript.

Funding

This research received no external funding.

Institutional Review Board Statement

Not applicable.

Informed Consent Statement

Not applicable.

Data Availability Statement

Not applicable.

Acknowledgments

The authors would like to thank for the collaboration of the restoration team of the Archivo General de Indias (AGI), Daniel Cano Arroyo, Carmen Molina Pérez, Rosario Villegas Ortiz, and Manuel Álvarez Casado. Author Ortega Feliu wishes to thank the V Plan Propio de Investigación of the University of Seville for the employment support.

Conflicts of Interest

The authors declare no conflict of interest.

References

  1. Hugues, L. Giovanni Vespucci. Note Biografiche e Storiche; Cassone: Casale, Italy, 1897. [Google Scholar]
  2. Almagià, R. Alcune osservazioni sul planisfero di Giovanni Vespucci (1526). Riv. Geogr. Ital. 1952, 59, 253–260. [Google Scholar]
  3. Paladini Cuadrado, A. Mapa Portulano de Juan Vespucci: Mapa del Mundo Conocido: Sevilla 1526; Gria: Valencia, Spain, 1998. [Google Scholar]
  4. Cerezo Martínez, R. La Cartografía Náutica Española en los Siglos XIV, XV y XVI; Consejo Superior de Investigaciones Científicas: Madrid, Spain, 1994. [Google Scholar]
  5. Campbell, T. Portolan Charts from the Late Thirteenth Century to 1500. In Cartog Raphy in Prehistoric, Ancient, and Medieval Europe and the Mediterranean; Harley, J.B., Woodward, D., Eds.; The History of Cartography 1; University of Chicago Press: Chicago, IL, USA, 1987; pp. 371–463 (n. 189). [Google Scholar]
  6. Christie’s. Valuable Travel & Natural History Books & Atlases; Christie, Manson & Woods: London, UK, 1990; pp. 60–62. [Google Scholar]
  7. Martín-Merás, M.L. Cartografía Marítima Hispana: La Imagen de América; Consejo Superior de Investigaciones Científicas: Madrid, Spain, 1993; p. 95. [Google Scholar]
  8. France, F. Scientific and Image Analysis of Portolan Charts: Preliminary Results and Methods. In Proceedings of the Re-Examining the Portolan Chart: History, Navigation and Science, Library of Congress, Washington DC, USA, 23 April 2010. [Google Scholar]
  9. Woodward, D. The Analysis of Paper and Ink in Early Maps. Libr. Trends 1987, 85–107. Available online: https://www.loc.gov/item/webcast-4931 (accessed on 16 October 2022).
  10. Castro, K.; Pessamnha, S.; Proietti, N.; Princi, E.; Capitani, D.; Carvalho, M.L. Noninvasive and Nondestructive NMR, Raman and XRF Analysis of a Blaeu Coloured Map from the Seventeenth Century. Anal. Bioanal. Chem. 2008, 391, 433–441. [Google Scholar] [CrossRef] [PubMed]
  11. Aldrovandi, A.; Picollo, M. Metodi di Documentazione e Indagini non Invasive sui Dipinti; Collana i Talenti, Il Prato: Padova, Italy, 2003. [Google Scholar]
  12. Matteini, M.; Moles, A. Scienza e Restauro: Metodi d’Indagine; Nardini: Firenze, Italy, 1998. [Google Scholar]
  13. Seccaroni, C.; Moioli, P. Fluorescenza X: Prontuario per l’analisi XRF Portatile Applicata a Superfici Policrome; Nardini Editore: Firenze, Italy, 2004. [Google Scholar]
  14. Artioli, G. Scientific Methods and Cultural Heritage: An Introduction to the Application of Materials Science to Archaeometry and Conservation Science; Oxford University Press: Oxford, UK; New York, NY, USA, 2010. [Google Scholar]
  15. Casini, A.; Lotti, F.; Picollo, M.; Stefani, L.; Buzzegoli, E. Image Spectroscopy Mapping Technique for Non-Invasive Analysis of Paintings. Stud. Conserv. 1999, 44, 39–48. [Google Scholar] [CrossRef]
  16. Mrusek, R.; Fuchs, R.; Oltrogge, D. Spektrale Fensetr zur Vergangenheit. Ein neues Reflektographieverfahren zur Untersuchung von Buchmlarerei und historischem Schriftgut. Naturwissenschaften 1995, 82, 68–79. [Google Scholar]
  17. Rabin, I.; Schütz, R.; Kohl, A.; Wolff, T.; Tagle, R.; Pentzien, S.; Hahn, O.; Emmel, S. Identification and Classification of Historical Writing Inks in Spectroscopy: A Methodological Overview. COMS Newsl. 2012, 3, 26–30. [Google Scholar]
  18. Ghigo, T. A Systematic Scientific Study of Coptic Inks from the Late Roman Period to the Middle Ages. Ph.D. Thesis, Sapienza University of Rome, Rome, Italy, University of Hamburg, Hamburg, Germany, 2010. [Google Scholar]
  19. West Fitzhugh, E.; Feller, R.L.; Roy, A.; Berrie, B. (Eds.) . Artists’ Pigments: A Handbook of Their History and Characterisation; Archetype Publication: London, UK, 2012. [Google Scholar]
  20. Schram, H.P.; Herling, B. Historische Malmaterialen und Ihre Identifizierung; Ravensburg Buchverlag: Stuttgart, Germany, 1995. [Google Scholar]
  21. Kotulanová, E.; Bezdicka, P.; Hradil, D.; Hradilová, J.; Svarcová, S.; Grygar, T. Degradation of lead-based pigments by salt solutions. J. Cult. Herit. 2009, 10, 367–378. [Google Scholar] [CrossRef]
  22. Mendoza Cuevas, A.; Correa Jiménez, M.; Quezada Portal, A. Identificación de tintas metalogálicas en manuscritos históricos mediante análisis no destructivo combinado de espectrometría fluorescencia de rayos X y ultravioleta-visible. Rev. Cuba. Quim. 2009, 21, 38–45. [Google Scholar]
  23. Bonaduce, I. A Multianalytical Approach for the Investigation of Materials and Techniques in the Art of Gilding. Ph.D. Thesis, Universita di Pisa, Pisa, Italy, 2005. [Google Scholar]
  24. Darque-Ceretti, E.; Aucouturier, M. Gilding for Matter Decoration and Sublimation. A Brief History of the Artisanal Technical Know-how. Int. J. Conserv. Sci. 2013, 4, 647–660. [Google Scholar]
  25. Stillo, S.E. Putting the World in Its ‘Proper Colour’: Exploring Hand-Coloring in Early Modern Maps. J. Map Geogr. Libr. 2016, 12, 158–186. [Google Scholar] [CrossRef] [Green Version]
  26. Lewincamp, S.; McNaught-Reynolds, A. Pigment Analysis and Treatment of Four Dutch East India Company Vellum Charts. In Contributions to the 6th AICCM Book, Paper & Photographic Materials Symposium; AICCM: Melbourne, Australia, 2010; pp. 34–39. [Google Scholar]
  27. Robinet, L. Analyses Scientifiques sur la Mappemonde d’Albi (Recherches Interdisciplinaires sur la Mappemonde d’Albi, Mémoire du monde de l’Unesco; École Normale Supérieure: Paris, France, 2018. [Google Scholar]
  28. Van Duzer, C. Multispectral Imaging for the Study of Historic Maps: The Example of Henricus Martellus’s World Map at Yale. Imago Mundi 2016, 68, 62–66. [Google Scholar] [CrossRef]
  29. France, F.; Wilson, M.A.; Ghez, A. Spectral Imaging of Portolan Charts. In Proceedings of the 28th International Cartographic Conference, Washington, DC, USA, 2–7 July 2017; International Cartographic Association: Bern, Switzerland, 2018; Volume 1, pp. 1–7. [Google Scholar]
  30. Kogou, S.; Neate, S.; Covee, C. The Origins of the Selden Map of China: Scientific Analysis of the Painting Materials and Techniques Using a Holistic Approach. Herit. Sci. 2016, 4, 1–24. [Google Scholar] [CrossRef] [Green Version]
  31. Hering, B. Die Herstellungstechnik des Behaim-Globus: Neue Ergebnisse. In Focus Behaim-Globus; Bott, G., Willers, J., Eds.; Germanisches Nationalmuseum Nürnberg: Nürnberg, Germany, 1992. [Google Scholar]
  32. Krtalic, S. Materials and Production Methods in 17th-Century Portuguese Illuminated Cartography: A Study of the Maps in António Bocarro’s ‘Book of the Plans of All Fortresses, Towns and Villages of the East Indies’. Master’s Thesis, Universidade de Évora, Évora, Portugal, 2018. [Google Scholar]
  33. Astengo, C. The Renaissance Chart Tradition in the Mediterranean. In Cartography in the European Renaissance; Woodward, D., Ed.; The History of Cartography 3; University of Chicago Press: Chicago, IL, USA, 2007; pp. 174–262. [Google Scholar]
  34. Muller, F. Was Lorenz Fries’s 1525 Strasbourg Ptolemy Atlas Complete? Or Were Two Maps Omitted? Imago Mundi 2018, 70, 1–26. [Google Scholar] [CrossRef]
  35. Ghervase, L.; Ratoiu, L.; Radvan, R. Application of Spectroscopic and Hyperspectral Imaging Techniques for rapid and Nondestructive Investigation of Jewish Ritural Parchment. Front. Mater. 2020, 7, 601339. [Google Scholar]
  36. Van Duzer, C. Print in a Manuscript Realm: The Use of Hand-Stamps in the Decoration of Renaissance Nautical Chart. In Proceedings of the 28th International Conference on the History of Cartography, Amsterdam, The Netherlands, 14–16 July 2019. [Google Scholar]
  37. Delano-Smith, C. Stamped Signs on Manuscript Maps in the Renaissance. Imago Mundi 2005, 57, 59–62. [Google Scholar] [CrossRef]
  38. Kuhn, H.; Roosen-Runge, H.; Straub, R.E.; Koller, M. Farbmittel, Buchmalerei, Tafel und Leinwandmalerei. Reclams Handbuch der künstlerichen Techniken, Bd. 1; Philipp Reclam Jun: Stuttgart, Germany, 1997. [Google Scholar]
Figure 1. Portolan chart signed by Juan Vespucci and dated 1520. Archivo General de Indias, Seville, Spain (reproduced with permission from the image owner Archivo General de Indias/AGI, MP-EUROPA-AFRICA 125).
Colorants 01 00026 g001
Figure 2. Some details of Vespucci’s portolan chart depicting the north-western coast of Africa, with mountains, isles, a flag and a castle painted by hand (reproduced with permission from the image owner Archivo General de Indias, MP-EUROPA-AFRICA 125).
Colorants 01 00026 g002
Figure 3. In situ XRF analysis of the map.
Colorants 01 00026 g003
Figure 4. IRR image of two wind roses; the lower one shows retouches as dark spots.
Colorants 01 00026 g004
Figure 5. (a) Visible image of the scale bar with the signature and the date. (b) UV image of the same area and (c) IRR image of the same area; the inscription is not visible under IR, indicating the use of iron-gall ink. White lines and bands correspond to vermillion; dark bands to azurite, probably underpainted with carbon black; thin black lines to a copper-based green pigment, as confirmed by XRF.
Colorants 01 00026 g005
Figure 6. A detail of the white basic layer observed under the Dino digital microscope with dark brownish spots (reproduced with permission from the AGI).
Colorants 01 00026 g006
Figure 7. Graph with selected XRF spectra. (blue line) The blue castle in West Africa is drawn with azurite (Cu) and green earth (K, Mn, Fe); (black line) High Fe peaks confirm the use of iron-gall ink.
Colorants 01 00026 g007
Figure 8. Comparison of IRR images (a,c) with the corresponding visible details (b,d) of the chart, showing different visibility of the blue colour under IRR, as pointed by the arrows.
Colorants 01 00026 g008
Figure 9. Gilded wind rose observed under digital Dino microscope. Gold foil was placed on a transparent mixtion (reproduced with permission from the AGI).
Colorants 01 00026 g009
Table 1. XRF results identifying materials used in the portolan chart on the basis of their characteristic chemical elements. These are shown as major, minor or traces.
ColourChemical ElementsPigmentApplication
whiteCa
Fe, Cu, Zn, Sr, Hg, Pb
gypsum or chalk, lead whitepreparation, background
yellowFe
Cu, Zn, Sr, Hg, Pb
K, Ca, Ti, Mn
yellow ochreislands, mountains
redHg
Ca, Fe, Cu, Zn, Pb
K, Mn
vermillionflags, islands, castles, crosses, toponyms, wind rhumbs, scale bar, wind roses
blueCu
Ca, Fe, Zn, Sr, Hg, Pb
K, Mn, As
azuriteflags, islands, castles, scale bar, wind roses, mountains, toponyms
greenCu
Ca, Fe, Sr, Hg, Pb
K, Mn, Zn, As
Cu-based greenflags, island, castles, mountains, continents, wind rhumbs
black- carbon black (?)castle contours, large letters
inkFe
Ca, Cu, Sr, Hg, Pb
K, Ti, Mn
iron-gall inkwind rhumbs, toponyms
goldAu
Ca, Fe, Cu, Zn, Hg, Pb
K
gold foilwind roses
Publisher’s Note: MDPI stays neutral with regard to jurisdictional claims in published maps and institutional affiliations.

