Article

Shear Strength Prediction of Steel-Fiber-Reinforced Concrete Beams Using the M5P Model

by
Nadia Moneem Al-Abdaly
1,
Mahdi J. Hussein
2,
Hamza Imran
3,
Sadiq N. Henedy
4,
Luís Filipe Almeida Bernardo
5,* and
Zainab Al-Khafaji
6
1
Department of Civil Engineering, Najaf Technical Institute, Al-Furat Al-Awsat Technical University, Najaf Munazira Str., Najaf 54003, Iraq
2
Construction and Building Engineering Technologies Department, Najaf Engineering Technical College, Al-Furat Al-Awsat Technical University, Najaf Munazira Str., Najaf 54003, Iraq
3
Department of Environmental Science, College of Energy and Environmental Science, Alkarkh University of Science, Baghdad 10081, Iraq
4
Department of Civil Engineering, Mazaya University College, Nasiriya City 64001, Iraq
5
Department of Civil Engineering and Architecture, University of Beira Interior, 6201-001 Covilhã, Portugal
6
Building and Construction Techniques Engineering Department, Al-Mustaqbal University College, Hillah 51001, Iraq
*
Author to whom correspondence should be addressed.
Fibers 2023, 11(5), 37; https://doi.org/10.3390/fib11050037
Submission received: 27 March 2023 / Revised: 20 April 2023 / Accepted: 25 April 2023 / Published: 27 April 2023
(This article belongs to the Special Issue Fibers 10th Anniversary: Past, Present, and Future)

Abstract

:
This article presents a mathematical model developed using the M5P tree to predict the shear strength of steel-fiber-reinforced concrete (SFRC) for slender beams using soft computing techniques. This method is becoming increasingly popular for addressing complex technical problems. Other approaches, such as semi-empirical equations, can show known inaccuracies, and some soft computing methods may not produce predictive equations. The model was trained and tested using 332 samples from an experimental database found in the previous literature, and it takes into account independent variables such as the effective depth d, beam width bw, longitudinal reinforcement ratio ρ, concrete compressive strength fc, shear span to effective depth ratio a/d, and steel fiber factor Fsf. The predictive performance of the proposed M5P-based model was also compared with the one of existing models proposed in the previous literature. The evaluation revealed that the M5P-based model provided a more consistent and accurate prediction of the actual strength compared to the existing models, achieving an R2 value of 0.969 and an RMSE value of 37.307 for the testing dataset. It was found to be a reliable and also straightforward model. The proposed model is likely to be highly helpful in assessing the shear capacity of SFRC beams during the pre-planning and pre-design stages and could also be useful to help for future revisions of design standards.

Graphical Abstract

1. Introduction

Shear failure, a critical type of failure in structural concrete beams, occurs when the applied load exceeds the shear capacity, leading to diagonal cracks and potential catastrophic failure [1,2,3,4]. Shear failure is of particular concern due to its sudden and brittle nature, posing significant safety hazards, unlike the more gradual flexural failure [5].
The design of concrete beams to resist shear failure involves calculating the shear capacity, which depends on factors such as the size and shape of the beam, concrete compressive strength, and reinforcing steel. Design codes and standards provide guidelines for calculating the shear capacity, taking these factors into account [6,7].
The design of concrete beams to resist shear failure can be challenging, especially for beams with complex geometries or unusual loading conditions. However, advances in concrete construction [8] and computational tools have led to the development of new types of reinforcement and analytical techniques that can enhance the shear capacity of beams and improve their performance [9,10,11,12,13]. One of those reinforcing materials is steel fibers.
The addition of steel fibers to concrete can significantly improve its resistance to shear failure. According to several sources [14,15,16,17], the inclusion of fibers in concrete can greatly enhance its behavior after cracking and modify its tensile strength. The addition of steel fibers has been found to significantly affect various properties of concrete members, such as resistance to deformation and cracking, as well as ultimate flexural strength, ductility, toughness, and shear capacity [18,19,20,21,22,23]. In order to enhance the shear strength of reinforced concrete (RC) elements, fibers are sometimes used to substitute partially transverse steel reinforcement (such as vertical stirrups). High-strength concrete is a type of concrete that is commonly used in high-rise buildings because of its ability to reduce section dimensions and dead load. However, it is also known to have a brittle behavior, which can give rise to structural issues. Fortunately, using steel fibers in high-strength concrete can improve its mechanical properties and ductility [24]. This means that the concrete will be less prone to cracking and breaking under stress and will be more flexible and able to deform without failing. By using steel fibers in high-strength concrete, engineers can design structures that are both strong and durable, without sacrificing safety or stability requirements.
The addition of steel fibers to concrete can make the prediction of its shear strength more challenging due to several factors. One of the primary reasons is the complex and nonlinear behavior of the material with the addition of fibers. Two types of machine learning models (ML) were used in predicting the shear strength of steel fiber reinforced concrete (SFRC) beams. These are called black-box [25,26,27,28,29,30,31] and white-box [32,33,34,35,36] ML models. Black-box ML models such as the neural network, random forest, and support vector machine are often highly accurate in making predictions, which is their primary benefit. Despite this, these models are sometimes referred to as “black box” models because they cannot provide a specific mathematical solution to describe how the shear capacity and input parameters are functionally related. On the other side, various evolutionary algorithms have an advantage over “black box” models because they can express the connection between inputs and outputs through explicit formulas. One example of those algorithms is gene expression programming (GEP). GEP is an evolutionary algorithm optimizing functions and coefficients, ideal for uncovering nonlinear system relationships. With GEP, a symbolic model is produced that can be easily comprehended by humans, allowing users to comprehend the solution from the algorithm. This capability for interpretability is especially beneficial in scenarios where human input is critical for decision-making. Evolutionary algorithms have been used by a number of researchers to predict the shear capacity of SFRC beams [37,38,39,40,41].
Although the studies mentioned earlier reported good levels of accuracy, it is still recommended to create novel models and conduct statistical analyses to ascertain the significance of any observed variations in performance and accuracy. The main objective of this research is to develop an accurate model for predicting the shear strength of SFRC slender beams using the M5P tree algorithm. The M5P tree algorithm is a machine learning technique that combines the advantages of decision trees and linear regression models, offering high accuracy and interpretability [42,43,44,45,46]. It builds a decision tree, where each leaf node corresponds to a linear regression model fitted to the data in that node. The algorithm has been widely used in various applications due to its effectiveness in handling nonlinear relationships and ease of understanding the model’s decision-making process. The proposed model will provide an efficient and reliable tool for the design and assessment of SFRC beams, which have been widely used in various civil engineering applications due to their high strength and ductility properties.
While the M5P model itself is not an original proposal, the contribution of this study lies in its application to the prediction of the shear strength for SFRC beams, which has not been previously explored in the literature. In this research, the aim is to achieve the following objectives: establish a comprehensive database for the shear strength of SFRC slender beams by collecting and analyzing data from experimental studies, develop an innovative and interpretable model using the M5P tree algorithm to predict the shear strength of SFRC slender beams with superior performance compared to existing models, and conduct a safety analysis using the Collins scale to assess the safety performance of the proposed model. By developing a more accurate and reliable prediction tool, this research can contribute to the design and optimization of SFRC beams, ensuring that the desired level of shear strength is achieved while optimizing resource utilization and improving safety during the design and construction of SFRC structures.

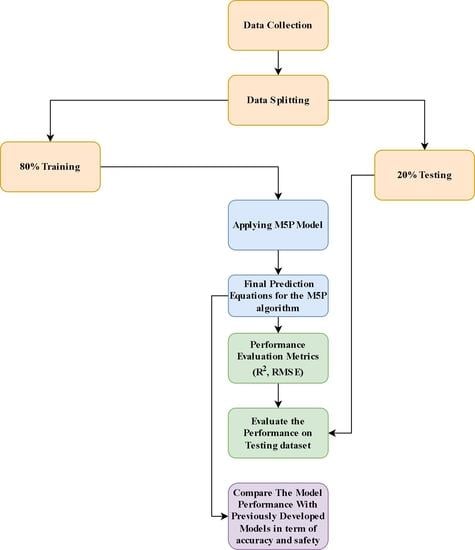
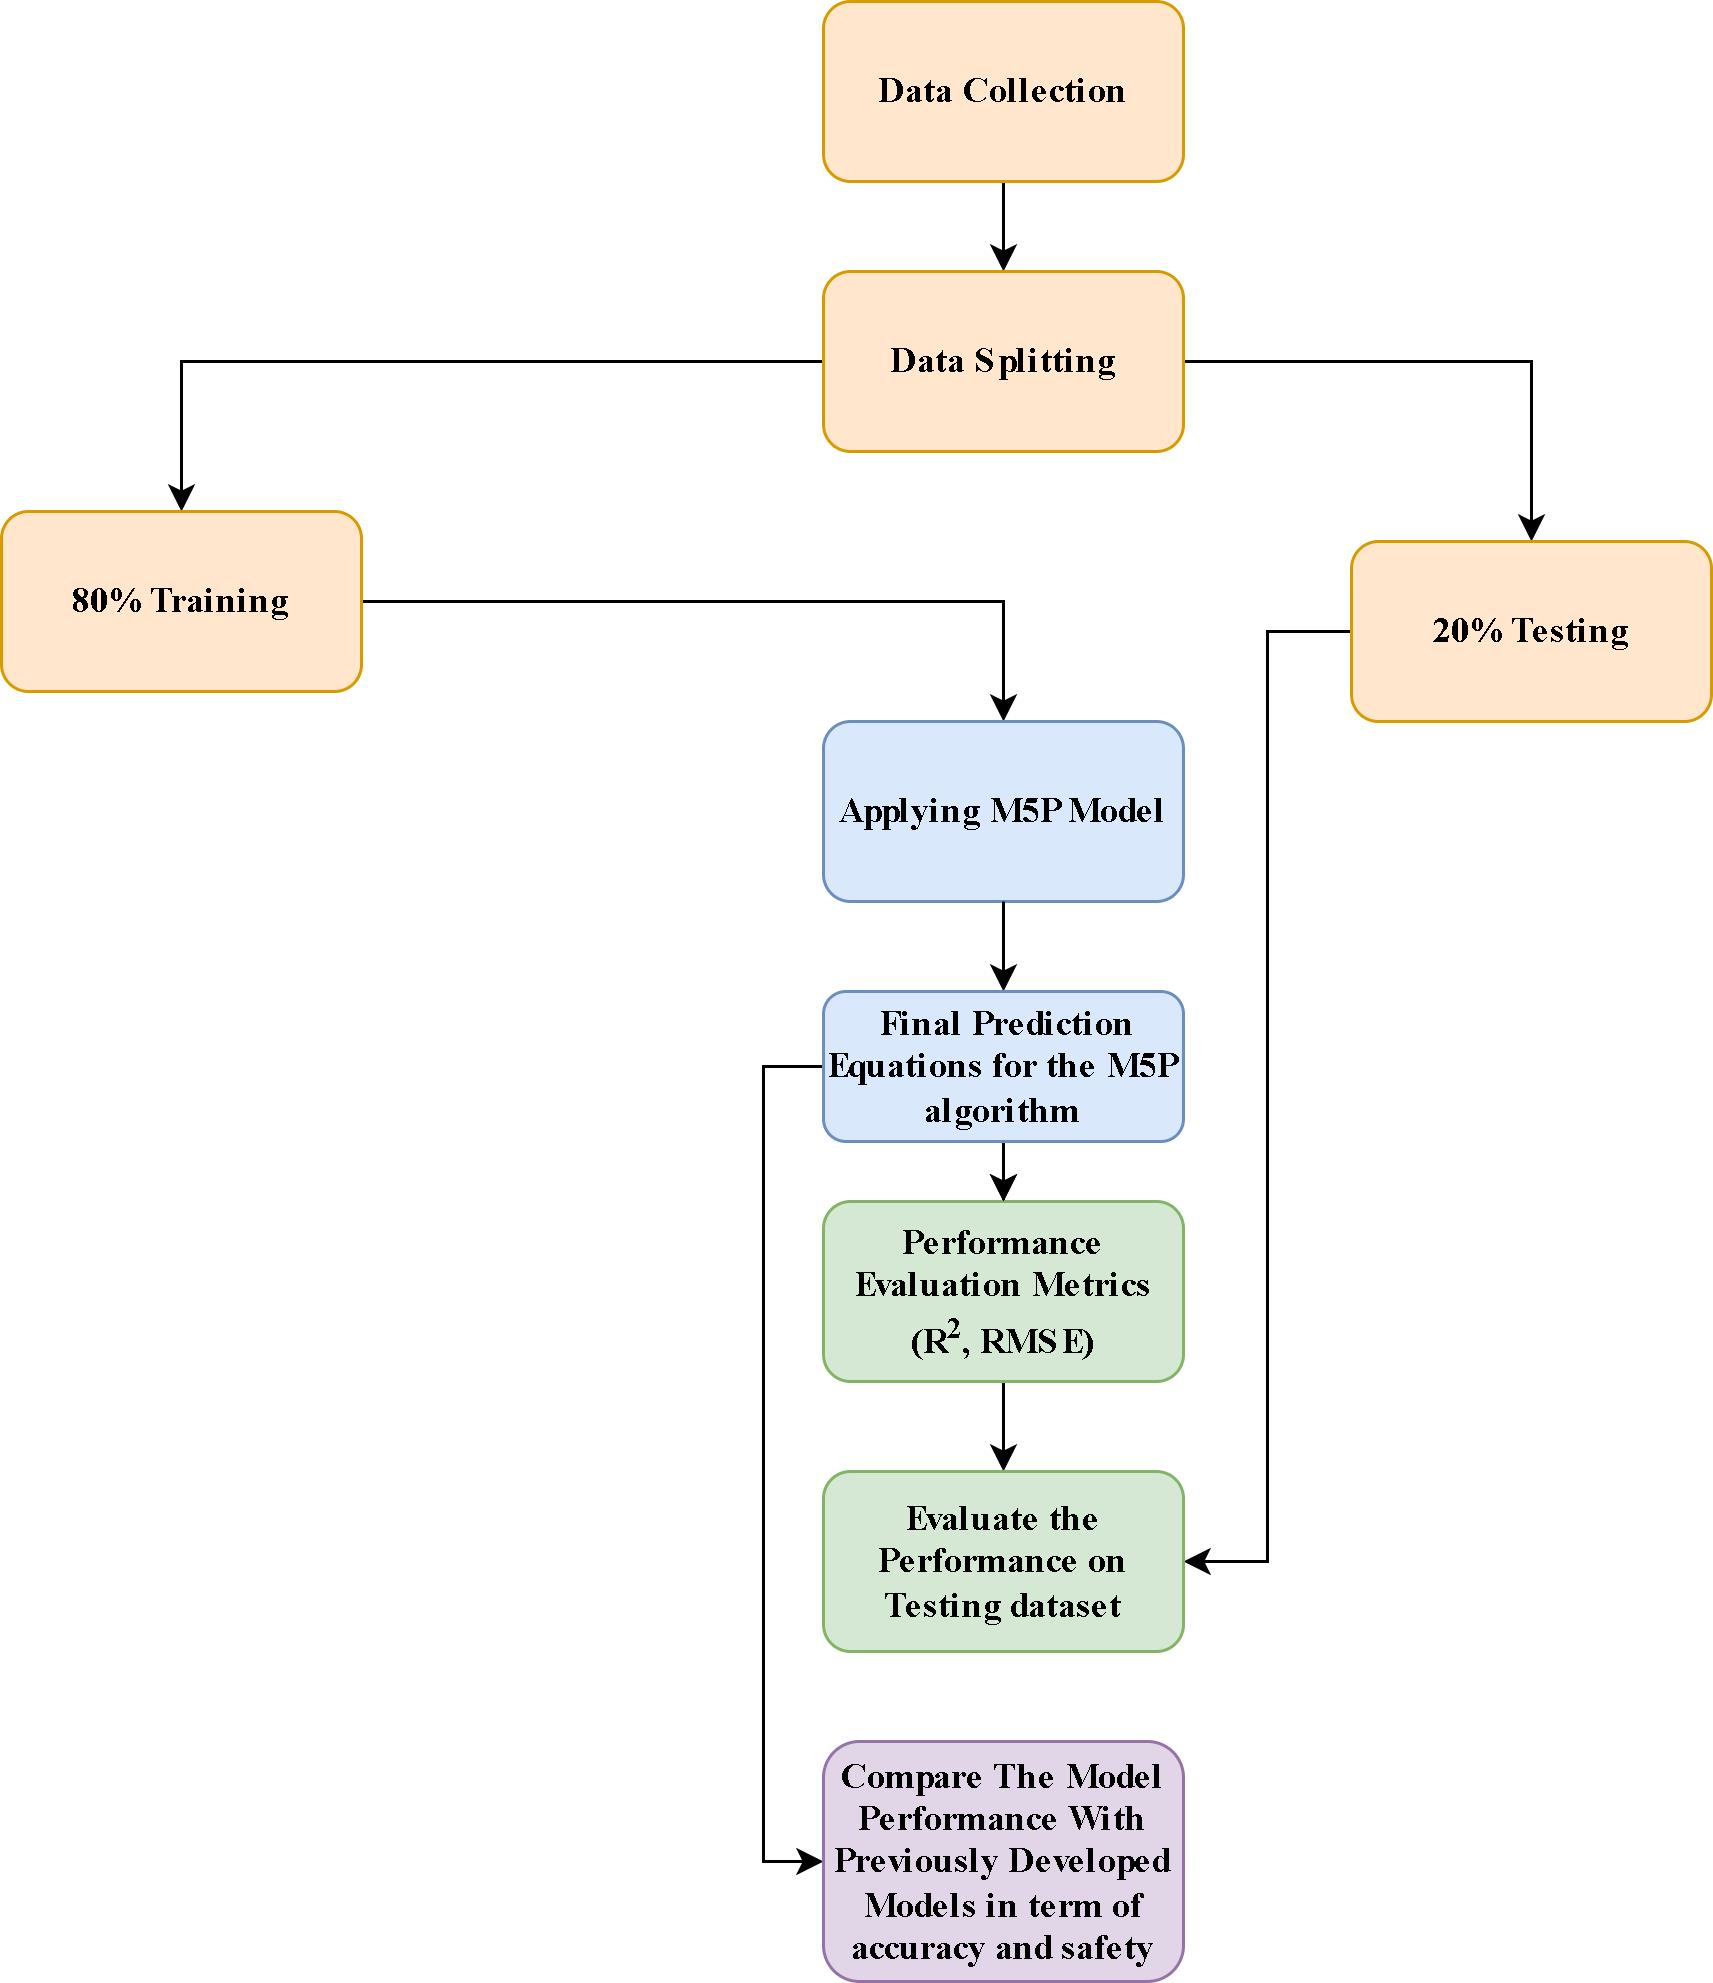
2. Research Methodology

This section provides a detailed description of the methodological strategy utilized to achieve the goals and objectives of this research. The approach includes information about the input parameters, the methodology for gathering data, and the specific actions taken to develop the M5P-based prediction model and to analyze its performance.

2.1. Selection of the Input Parameters

According to previous studies [47,48,49,50] on SFRC beams, the factors that have a significant influence on their shear capacity include the effective depth d and the width bw of the cross-section of the beam, the longitudinal reinforcement ratio ρ, the concrete compressive strength fc, the shear span to the effective depth ratio a/d, and the steel fiber factor Fsf. The individual impact for some of the parameters is discussed in detail below.

2.1.1. Shear Span to Effective Depth Ratio (a/d)

The shear strength of SFRC beams is significantly affected by the shear span-to-effective depth ratio (a/d). As reported by Narayanan and Darwish [51], an exponential relationship exists between the a/d ratio and the shear strength, with strength decreasing as the ratio increases. This is attributed to the arch action effect, which redistributes compressive force within the beam and balances stress distribution between loading points and supports. The effect contributes to increasing the shear resistance and becomes more pronounced with lower a/d ratios, leading to a higher overall shear strength in beams.

2.1.2. Longitudinal Reinforcement Ratio (ρ)

The longitudinal reinforcement has a favorable impact on the shear strength of SFRC beams. However, the positive effect decreases as the reinforcement ratio increases above 3.6%. This was observed by Swami and Bahia [52]. In cases where the reinforcement ratio is lower, the shear strength experiences a higher increase due to the contribution of the dowel action [53].

2.1.3. Concrete Compressive Strength (fc)

The shear strength of SFRC beams is also highly influenced by the concrete compressive strength (fc). The shear strength exhibits a linear growth pattern with an increase in fc. However, some studies have presented contradictory results. It was demonstrated by Khuntia et al. [54] that when fc rises, the shear strength of SFRC beams grows exponentially. This trend is particularly noticeable in high-strength concrete beams, where a robust bond between the concrete matrix and steel fibers exists [55].

2.1.4. Fiber Factor (Fsf)

The shear strength of SFRC beams is also influenced by the fiber factor (Fsf), which is a combination of the aspect ratio (lf/Df), where lf and Df represent the length and diameter of the fiber, respectively, and the fiber volume fraction (Vf) [41]. The fiber factor can be calculated according to the following equation:
F s f = V f L f d f D f
In Narayanan and Darwish’s study from 1987 [51], d f represents the shape factor or bond factor, with 1.0 for indented fibers, 0.75 for crimped fibers, and 0.5 assigned for round fibers.

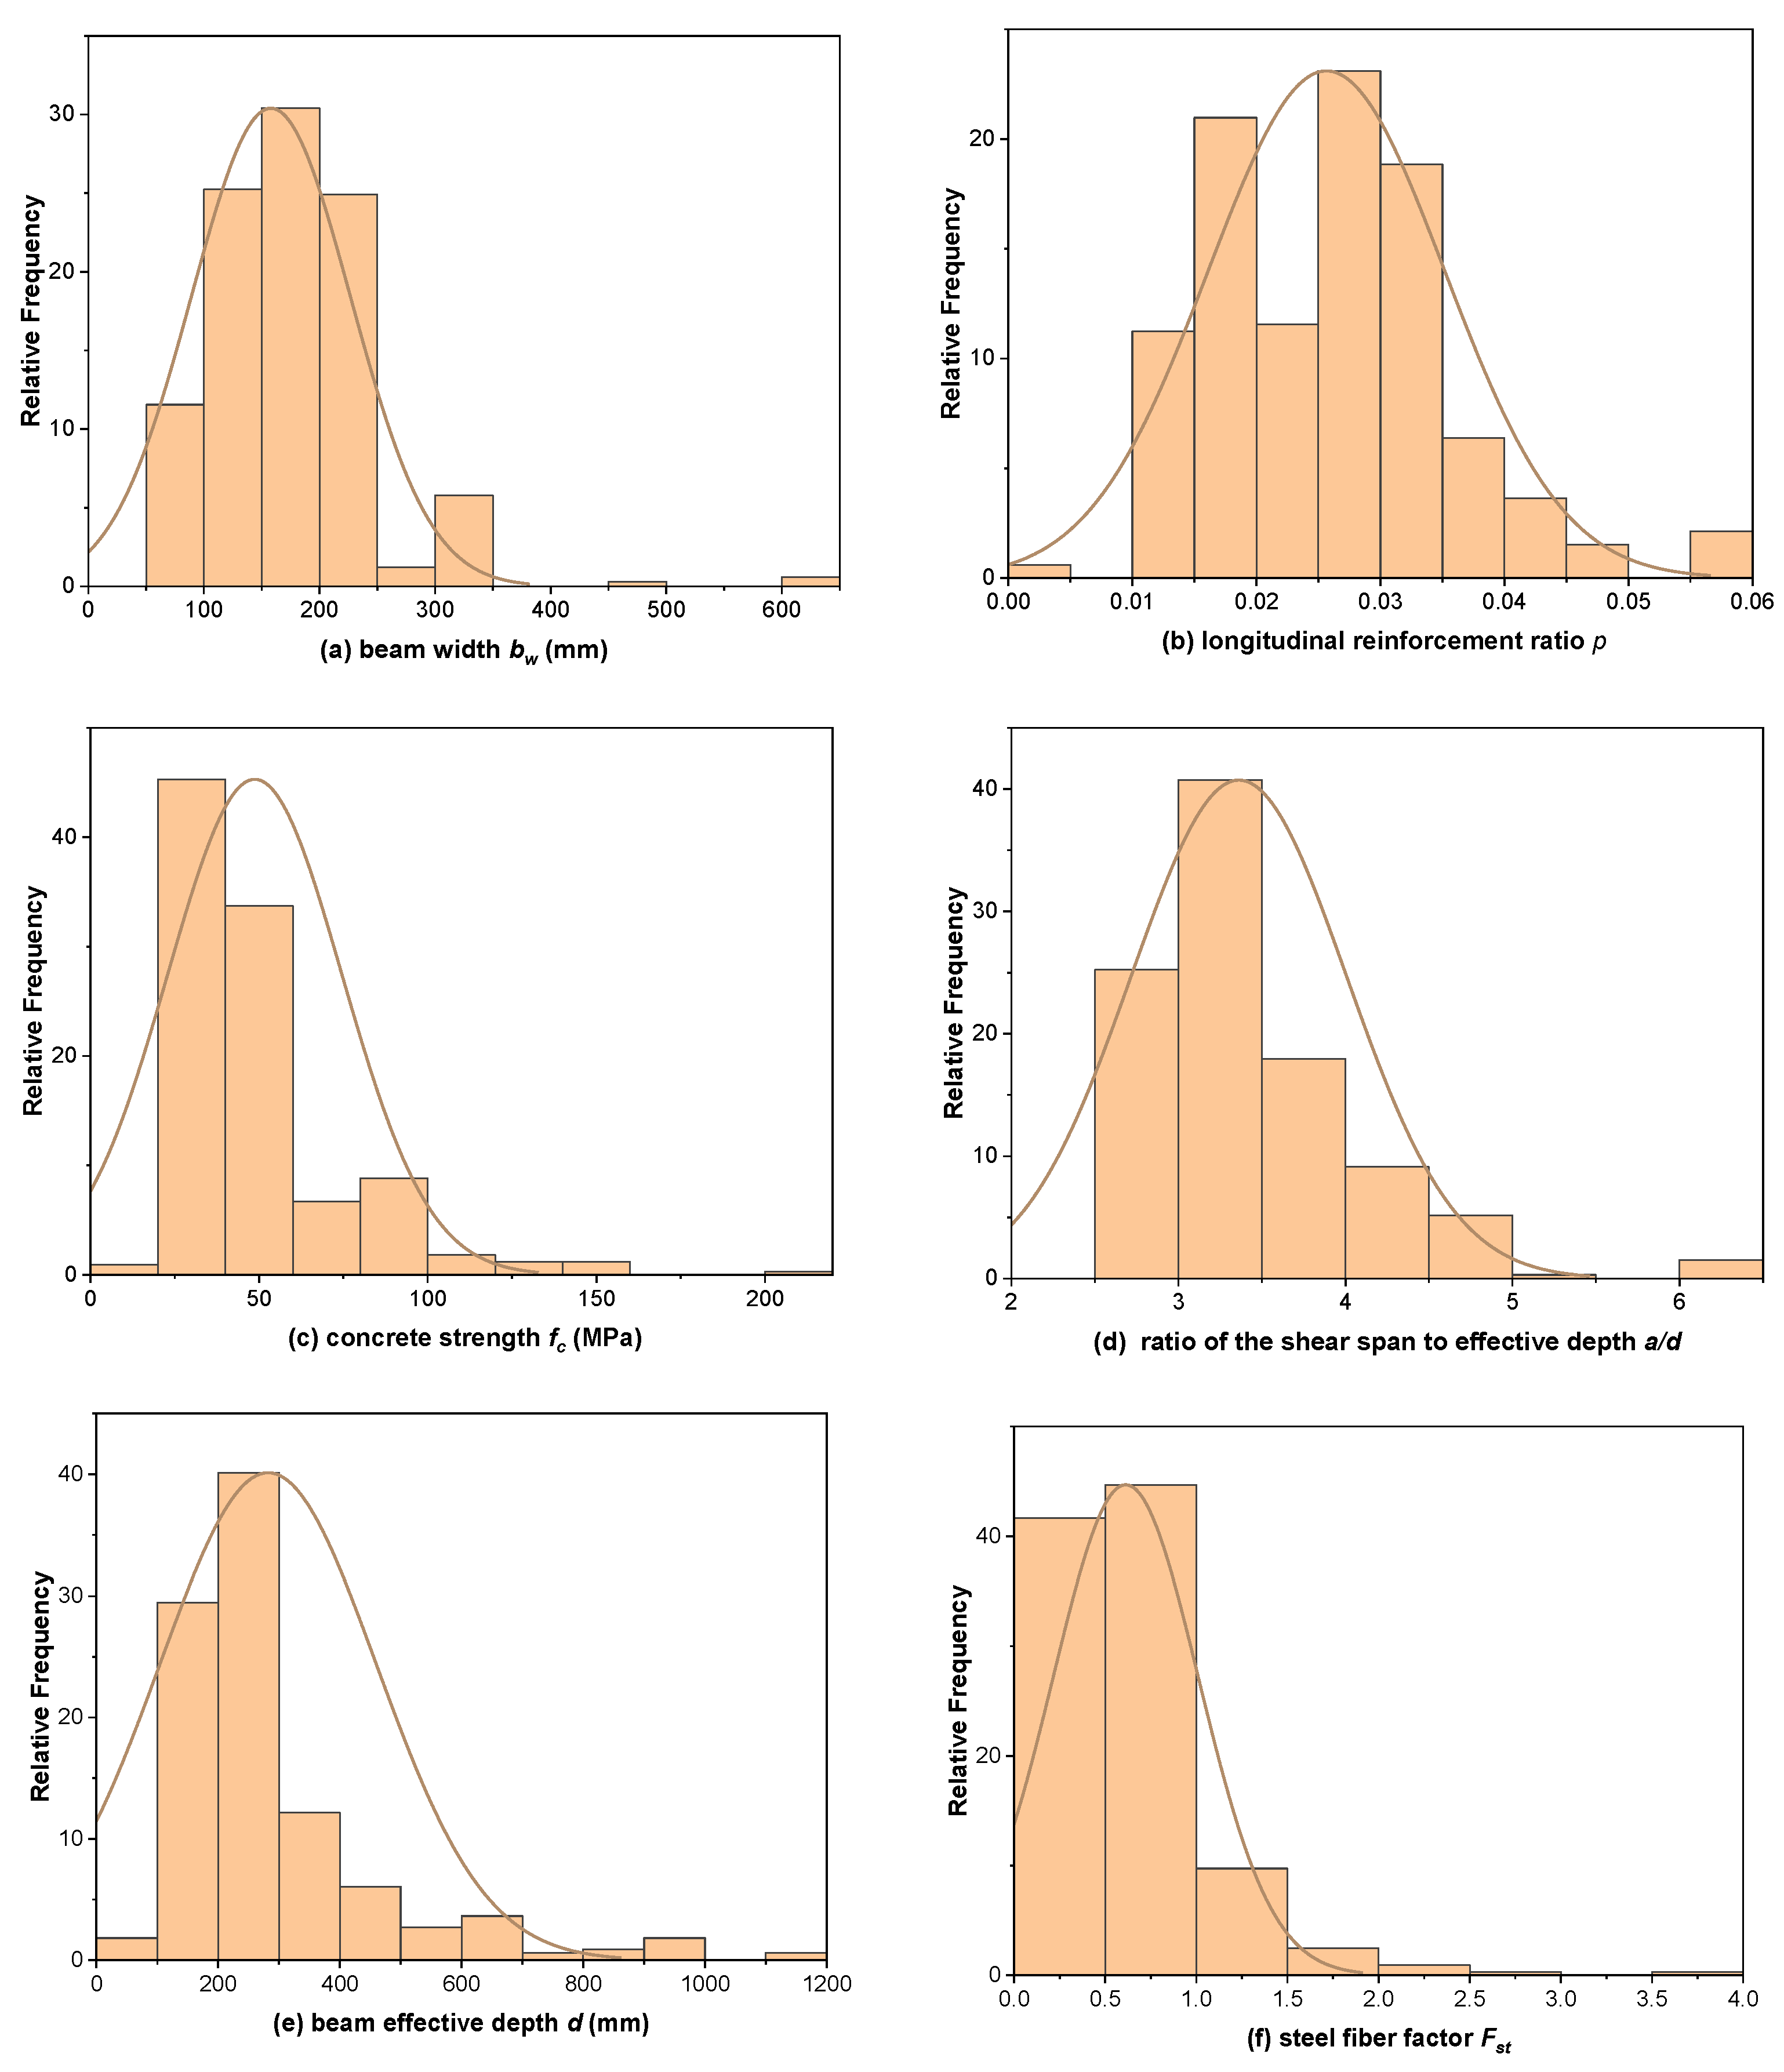
2.2. Data Collection and Pre-Processing

To investigate the impact of the input variables on the mechanical behavior and shear failure mode, the researchers conducted experimental investigations on the shear behavior of SFRCB. Study [49] compiled a comprehensive database of 488 trials on SFRC beams without stirrups. After sifting through the original collection of 488 experiments, a subset of 332 experimental tests were selected for this study after filtering out beams with a shear-span to effective depth ratio (a/d) less than 2.5, which are considered non-slender beams, and beams with a shear-flexure mode of failure. The database that resulted from the 332 experiments was used to develop models. The evaluation database incorporates slender beams with rectangular and flanges cross-sections. Figure 1 (adapted from [26]) presents the distribution of the key parameters within the referred database.
The results from Figure 1 show that most of the values for the concrete compressive strength found in the database fall within the normal strength range, with some outliers for high- and ultra-high-strength concrete. Most of the specimens from the dataset have significant amounts of longitudinal steel, which is typical in shear experiments. The database is also concentrated in the range of small effective depths. The shear span to depth ratio is uniformly distributed, with a/d = 3.5 being the most commonly used. Finally, the histogram of the fiber factor Fsf reflects practical considerations and the workability of SFRC. The database used for experimental evaluation was split into two parts, a training set and a testing set. The purpose of this division was to develop and apply ML algorithms. The testing set was used to assess the performance of the predictive model, while the training set was used to construct M5P models. Care was taken to ensure that the input variables for both sets were statistically consistent. Of the total 332 tests in the evaluation database, 235 (about 70%) were used for training and the remaining 97 (about 30%) were used for testing the model. The input and output parameters for both sets can be found in Table 1.

2.3. M5P Model Tree Techniques

In the current research, a necessary decision tree was constructed using the M5P classifier, a tree model developed by Quinlan [56]. This model tree incorporates the M5 learning algorithm, along with multiple enhancements, and offers an innovative strategy for tackling persistent challenges in the realm of class learning [56]. The M5 algorithm is a decision tree algorithm, but what sets M5P apart from other decision tree algorithms is its foundation in regression [57]. As a result, M5P effectively combines linear regression model techniques with the decision tree algorithm, creating a unique approach for solving problems that benefits from the strengths of both methods. Utilizing the M5P algorithm, the developed model tree features linear models at its leaf level, which assist in generating regression outputs. The precision of the resulting regression model can be assessed through target values of previously unobserved instances. The M5P algorithm showcases a remarkable level of adaptability by being able to accommodate a broad spectrum of data types in various contexts. This includes its ability to handle multiclass and binary target variables, as well as nominal and numeric attributes, all while effectively addressing the presence of missing values within the dataset [58]. M5P’s linear models enable the generation of numeric outputs, and the algorithm accommodates both nominal and continuous input attribute types. When processing a new instance, the traversal begins at the top of the tree and continues down to a leaf. Throughout this journey, decisions must be made at each tree node to determine which branch to follow, based on the test condition associated with the attribute related to that specific node [59]. This step-by-step procedure ensures an accurate and systematic evaluation of the instance in question. Establishing the splitting criteria is the initial stage in constructing an M5 model tree. The M5 algorithm bases its determination of splitting criteria on an analysis of the standard deviation of attribute values, in conjunction with a calculated estimation of error minimization at each respective node, ensuring an optimized decision-making process. The tree root is selected as the attribute that reduces the anticipated error, with the standard deviation reduction (SDR) being calculated accordingly [57,60].
S D R = S D T i = 1 n T i T S D ( T i )
S D ( T ) = 1 n 1 i = 1 n   ( T i T ) 2
T = 1 n i = 1 n   T i
Within this framework, T signifies the collection of instances that reach the node and T i represents the sets derived from splitting the node according to the chosen attribute. The average value of the attribute sets T is denoted by T , while SD(T) indicates the standard deviation of T .

3. Model Result

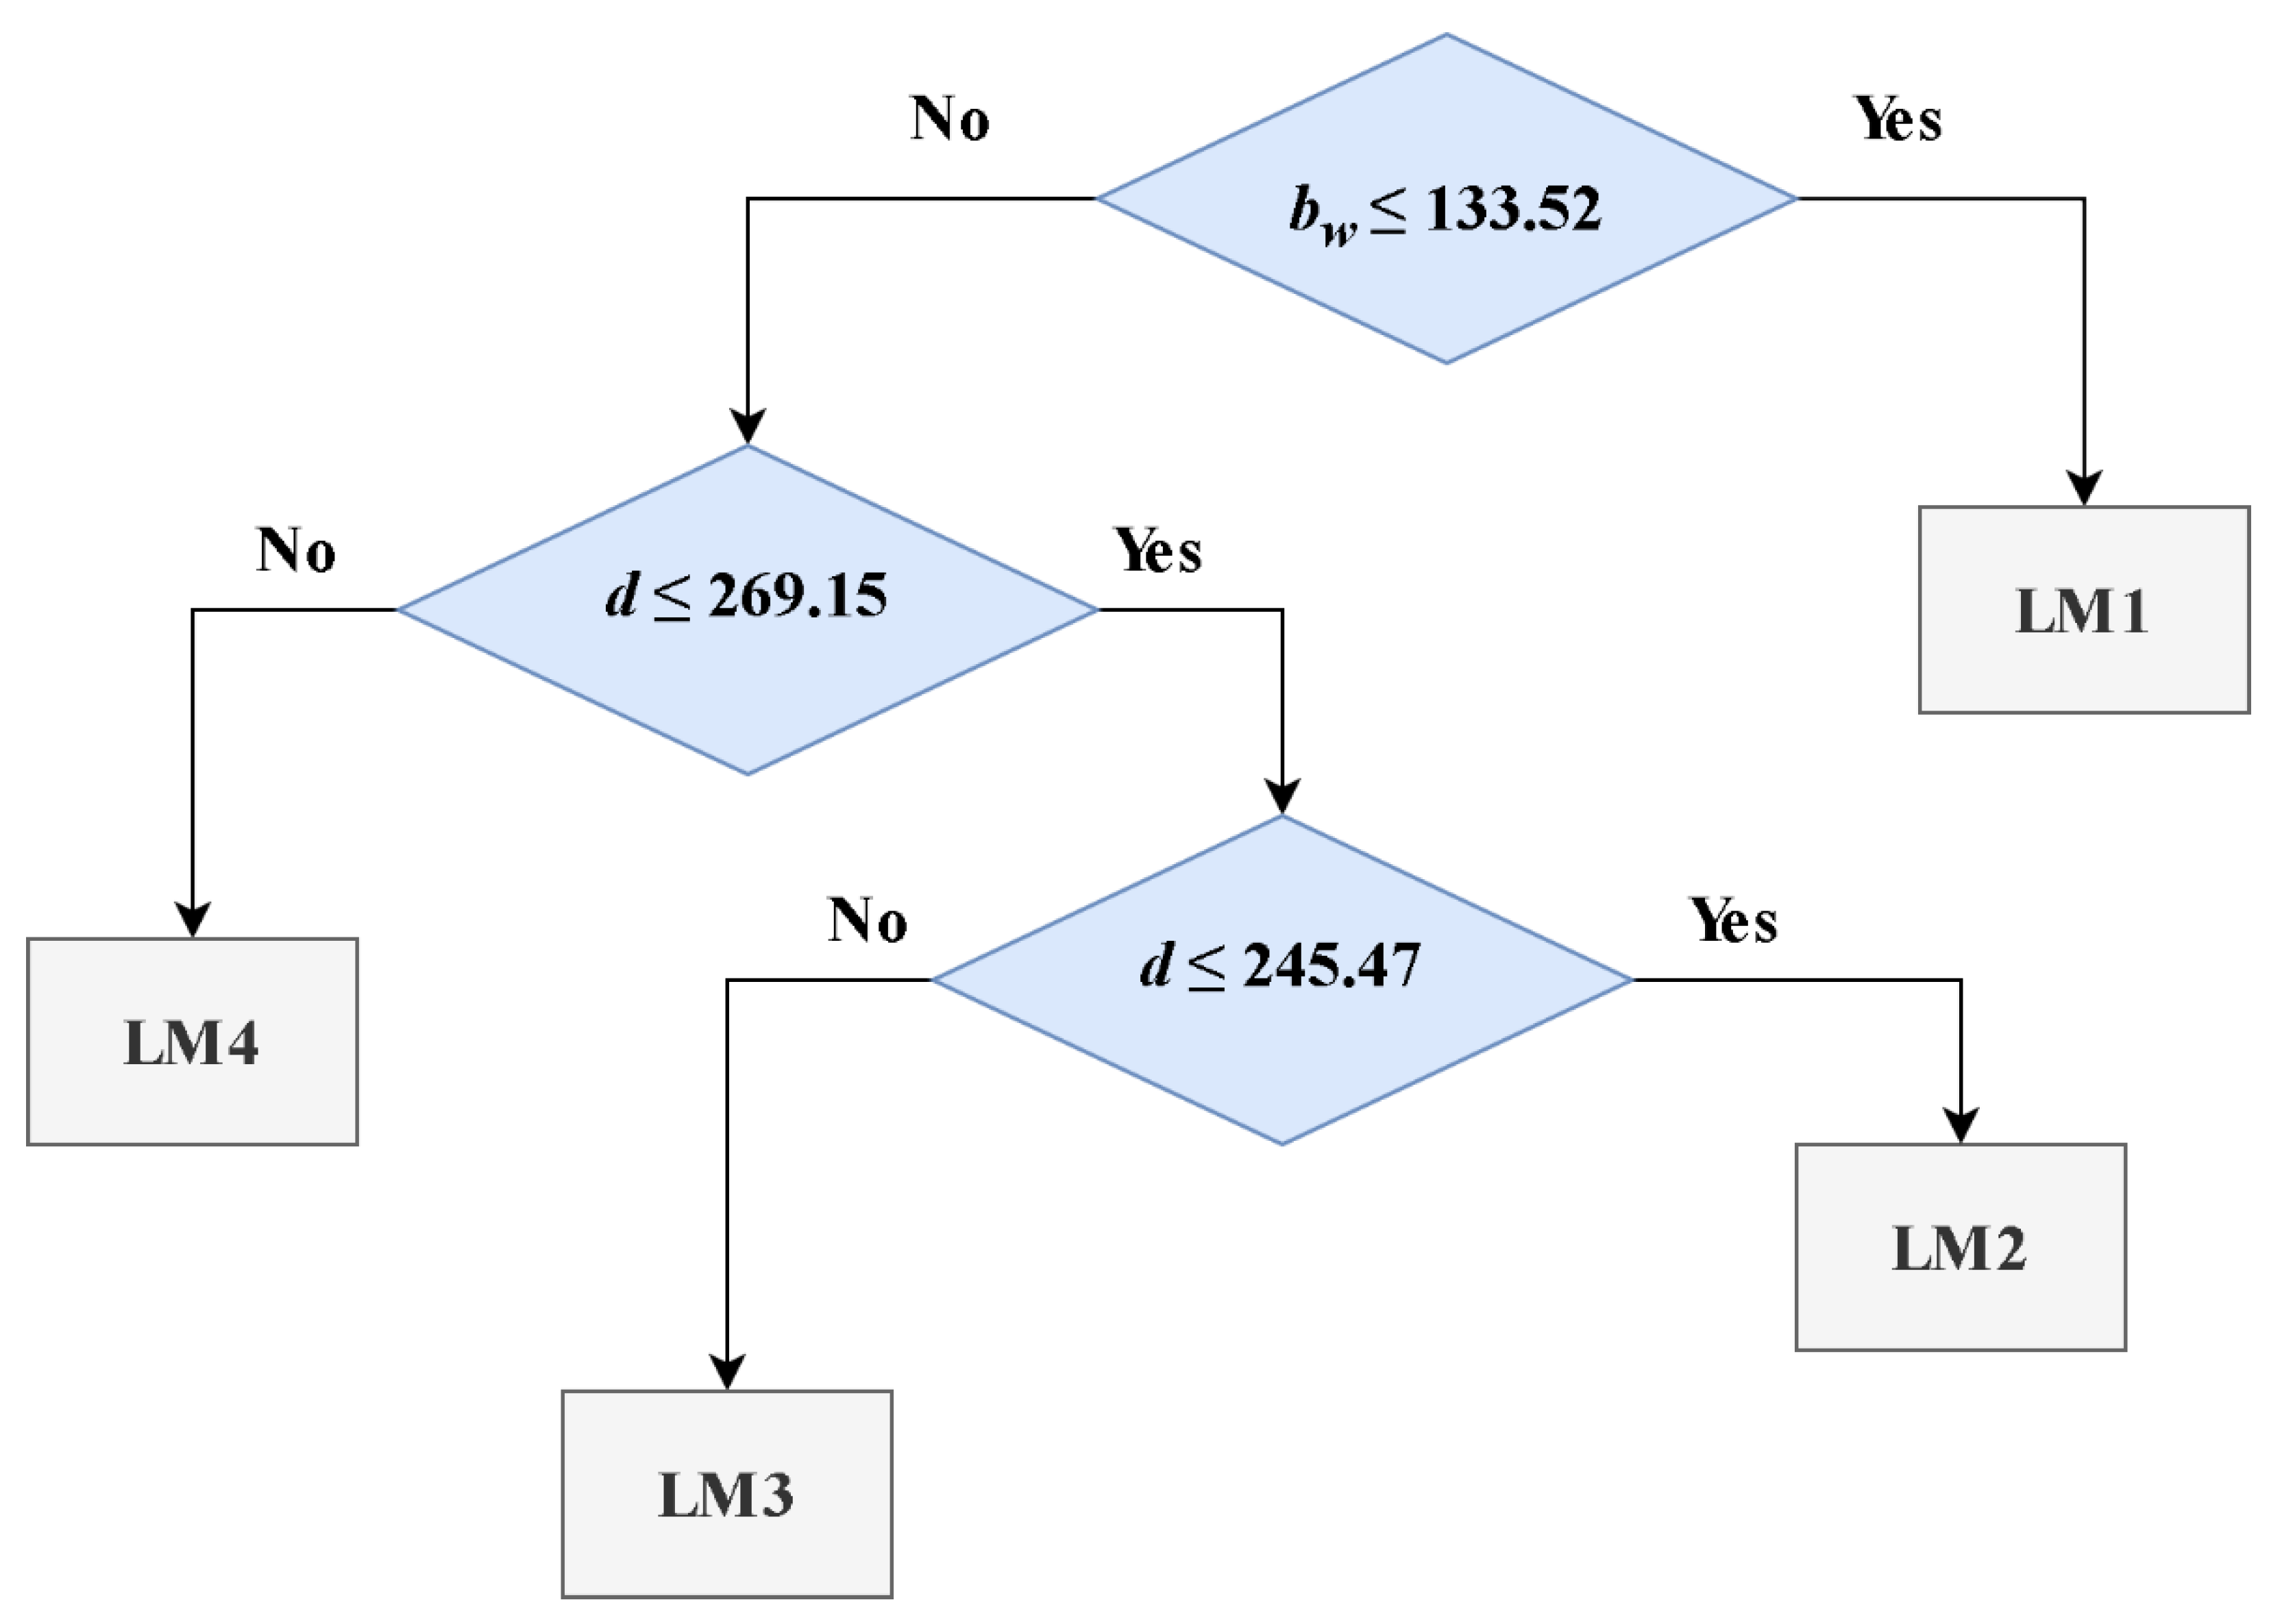
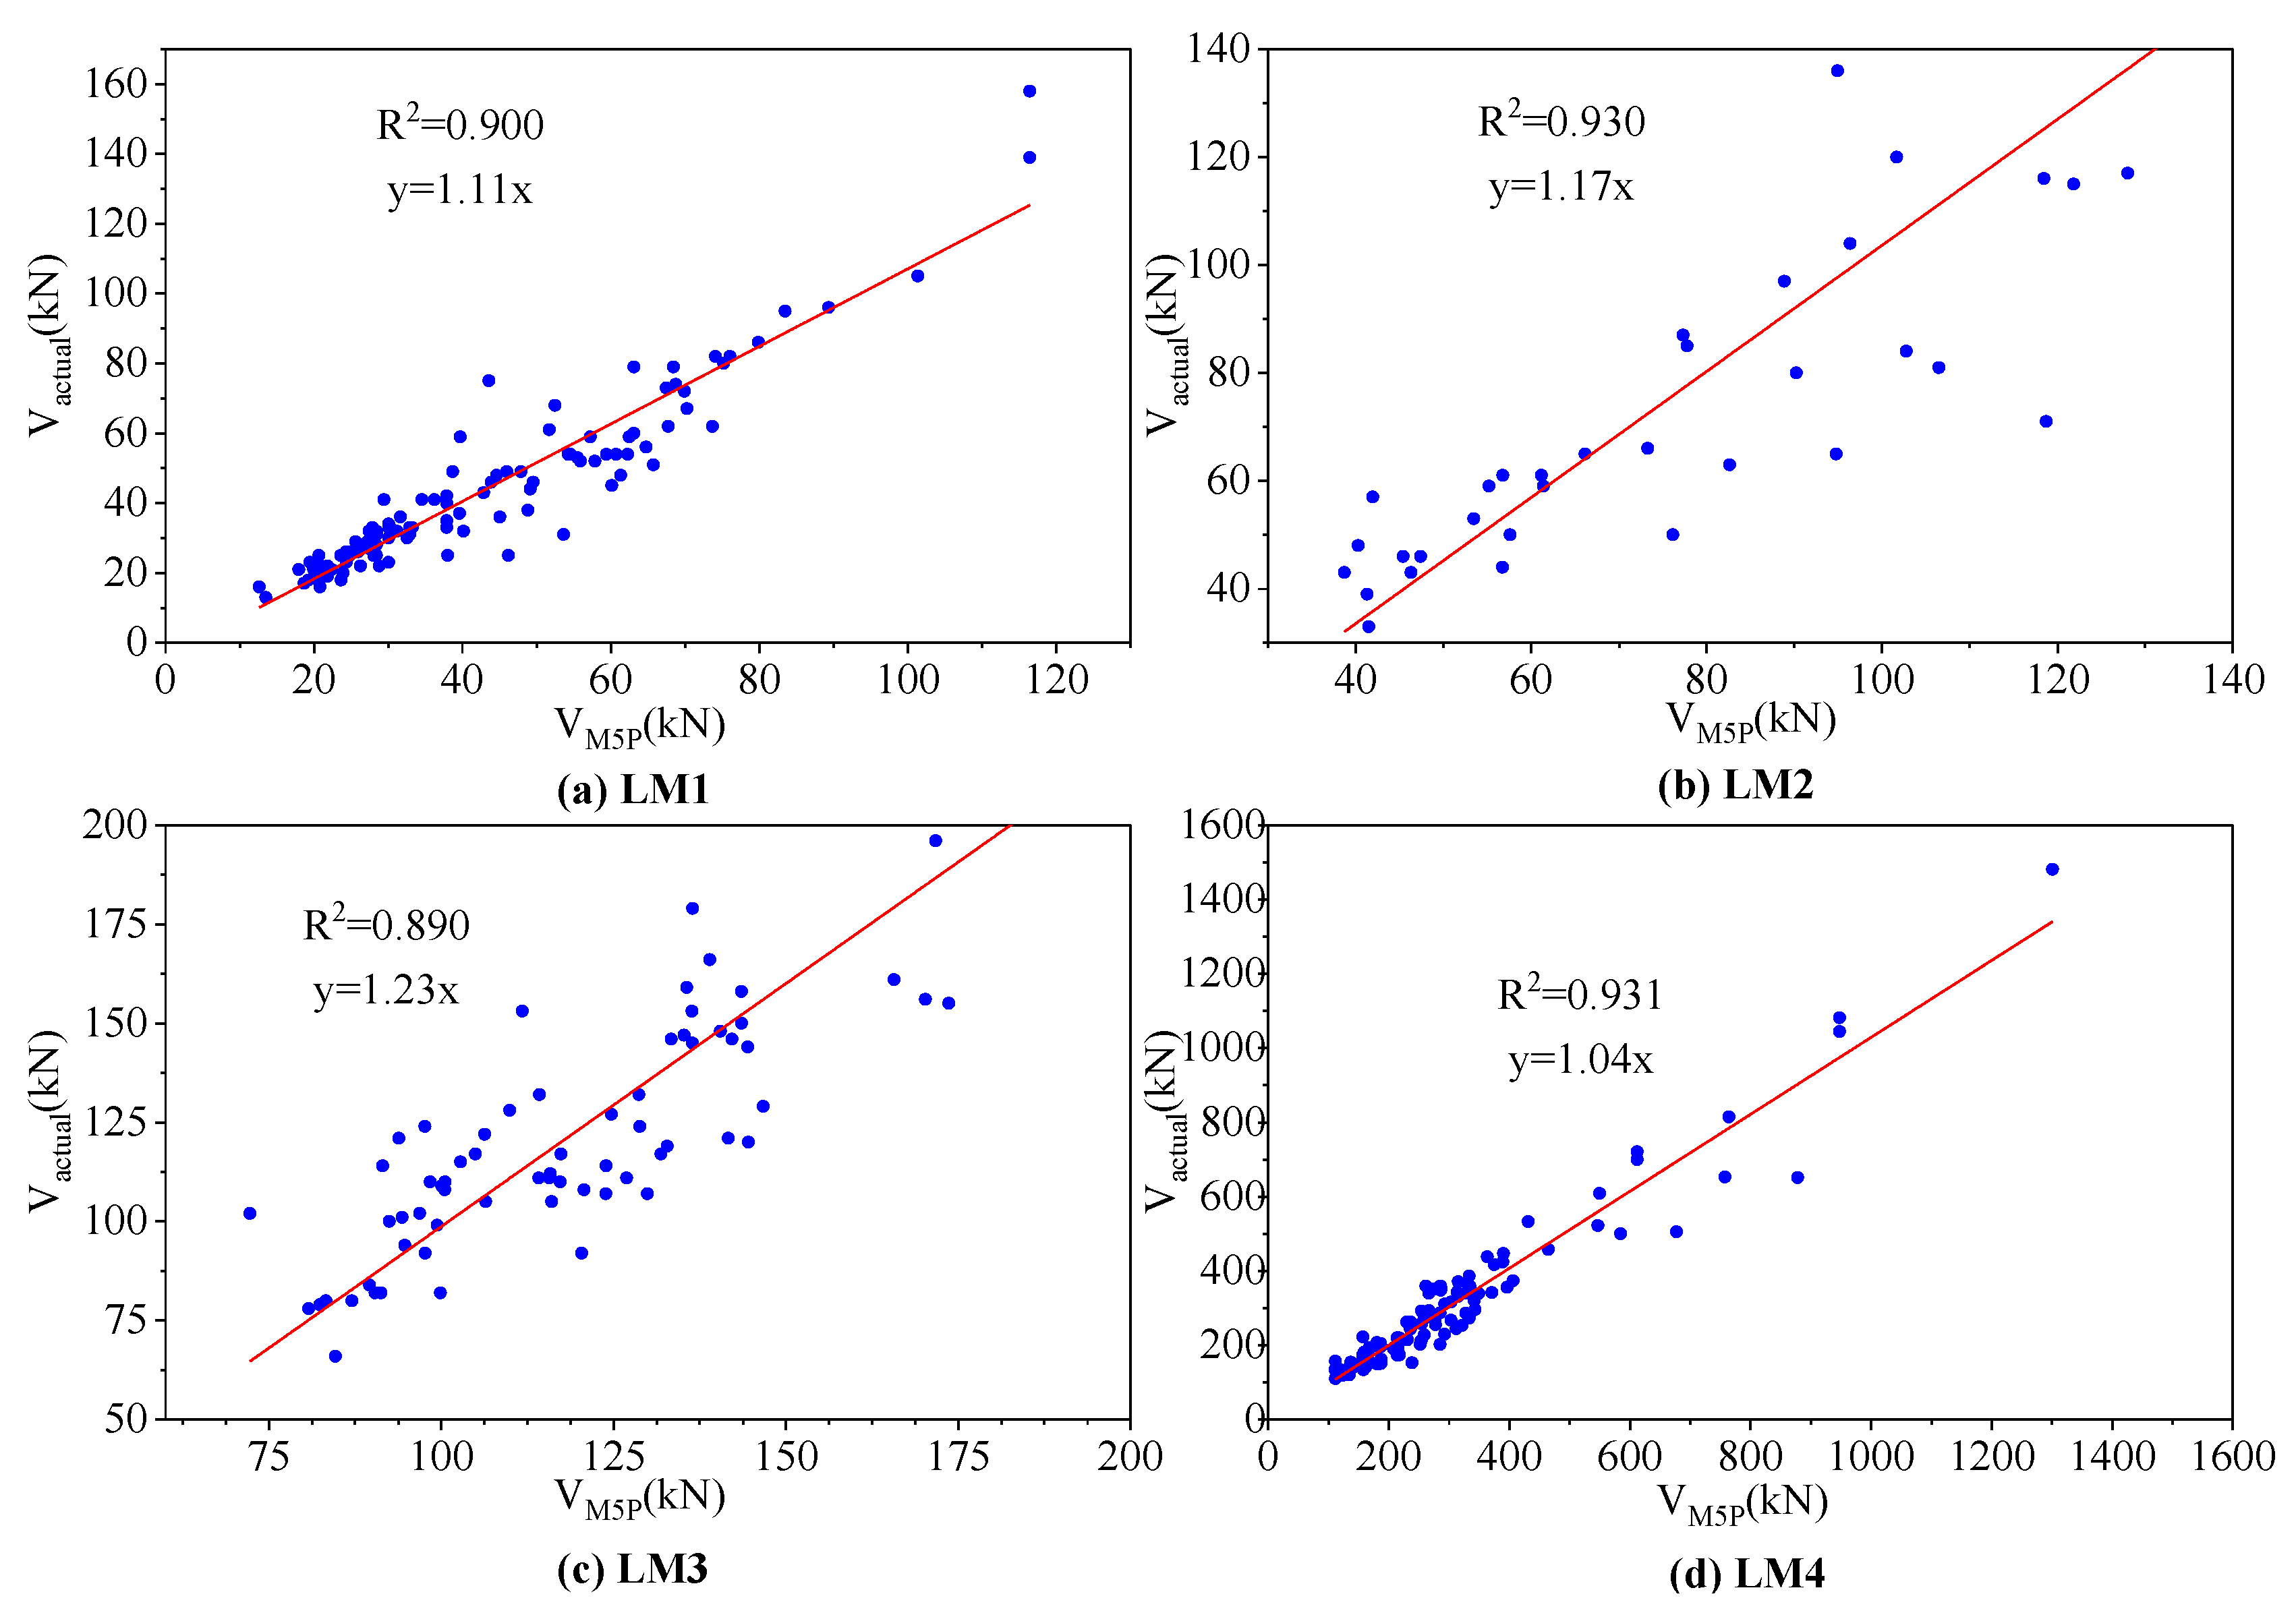
3.1. M5P Derived Models

In the present research, a nonlinear trend was observed in the distribution of a wide range of values, which is indicative of a power law relationship between the input and output parameters. While the M5P model can provide straightforward and efficient guidelines for determining shear capacity, it assumes a linear connection between the input and output parameters. To address this limitation, a new model was developed using log-transformed input and output parameters, based on earlier investigations [1,26]. The obtained results suggest that shear capacity is best described as a power function of the log-transformed inputs and outputs.
V u = a b w b d c ρ d a d e f c f F s f g
where the constants a , b , c , e , f , and g have different values under various circumstances, and all other terms were previously defined.
Figure 2 showcases the developed model tree, formed by employing the M5P approach. Additionally, Table 2 supplies the coefficients pertaining to Equation (4), as forecasted by the M5P algorithm.
The example provided below highlights the process of employing the M5P technique to estimate the shear strength of SFRC beams. We will focus on a reference beam selected from the testing dataset, with its characteristics outlined in Table 3, to effectively illustrate this approach.
Observing Table 3 and Figure 2, it becomes apparent that the beam sample is categorized under the M5P’s LM4 prediction equation, given that bw exceeds 133.52 and d surpasses 269.15. Consequently, by employing the coefficients associated with LM4, the estimated shear strength for the reference beam listed in Table 3 amounts to 218.187 kN. This value demonstrates a strong correlation with the experimentally determined strength, which measures at 220 kN, indicating a high level of agreement between the two results.

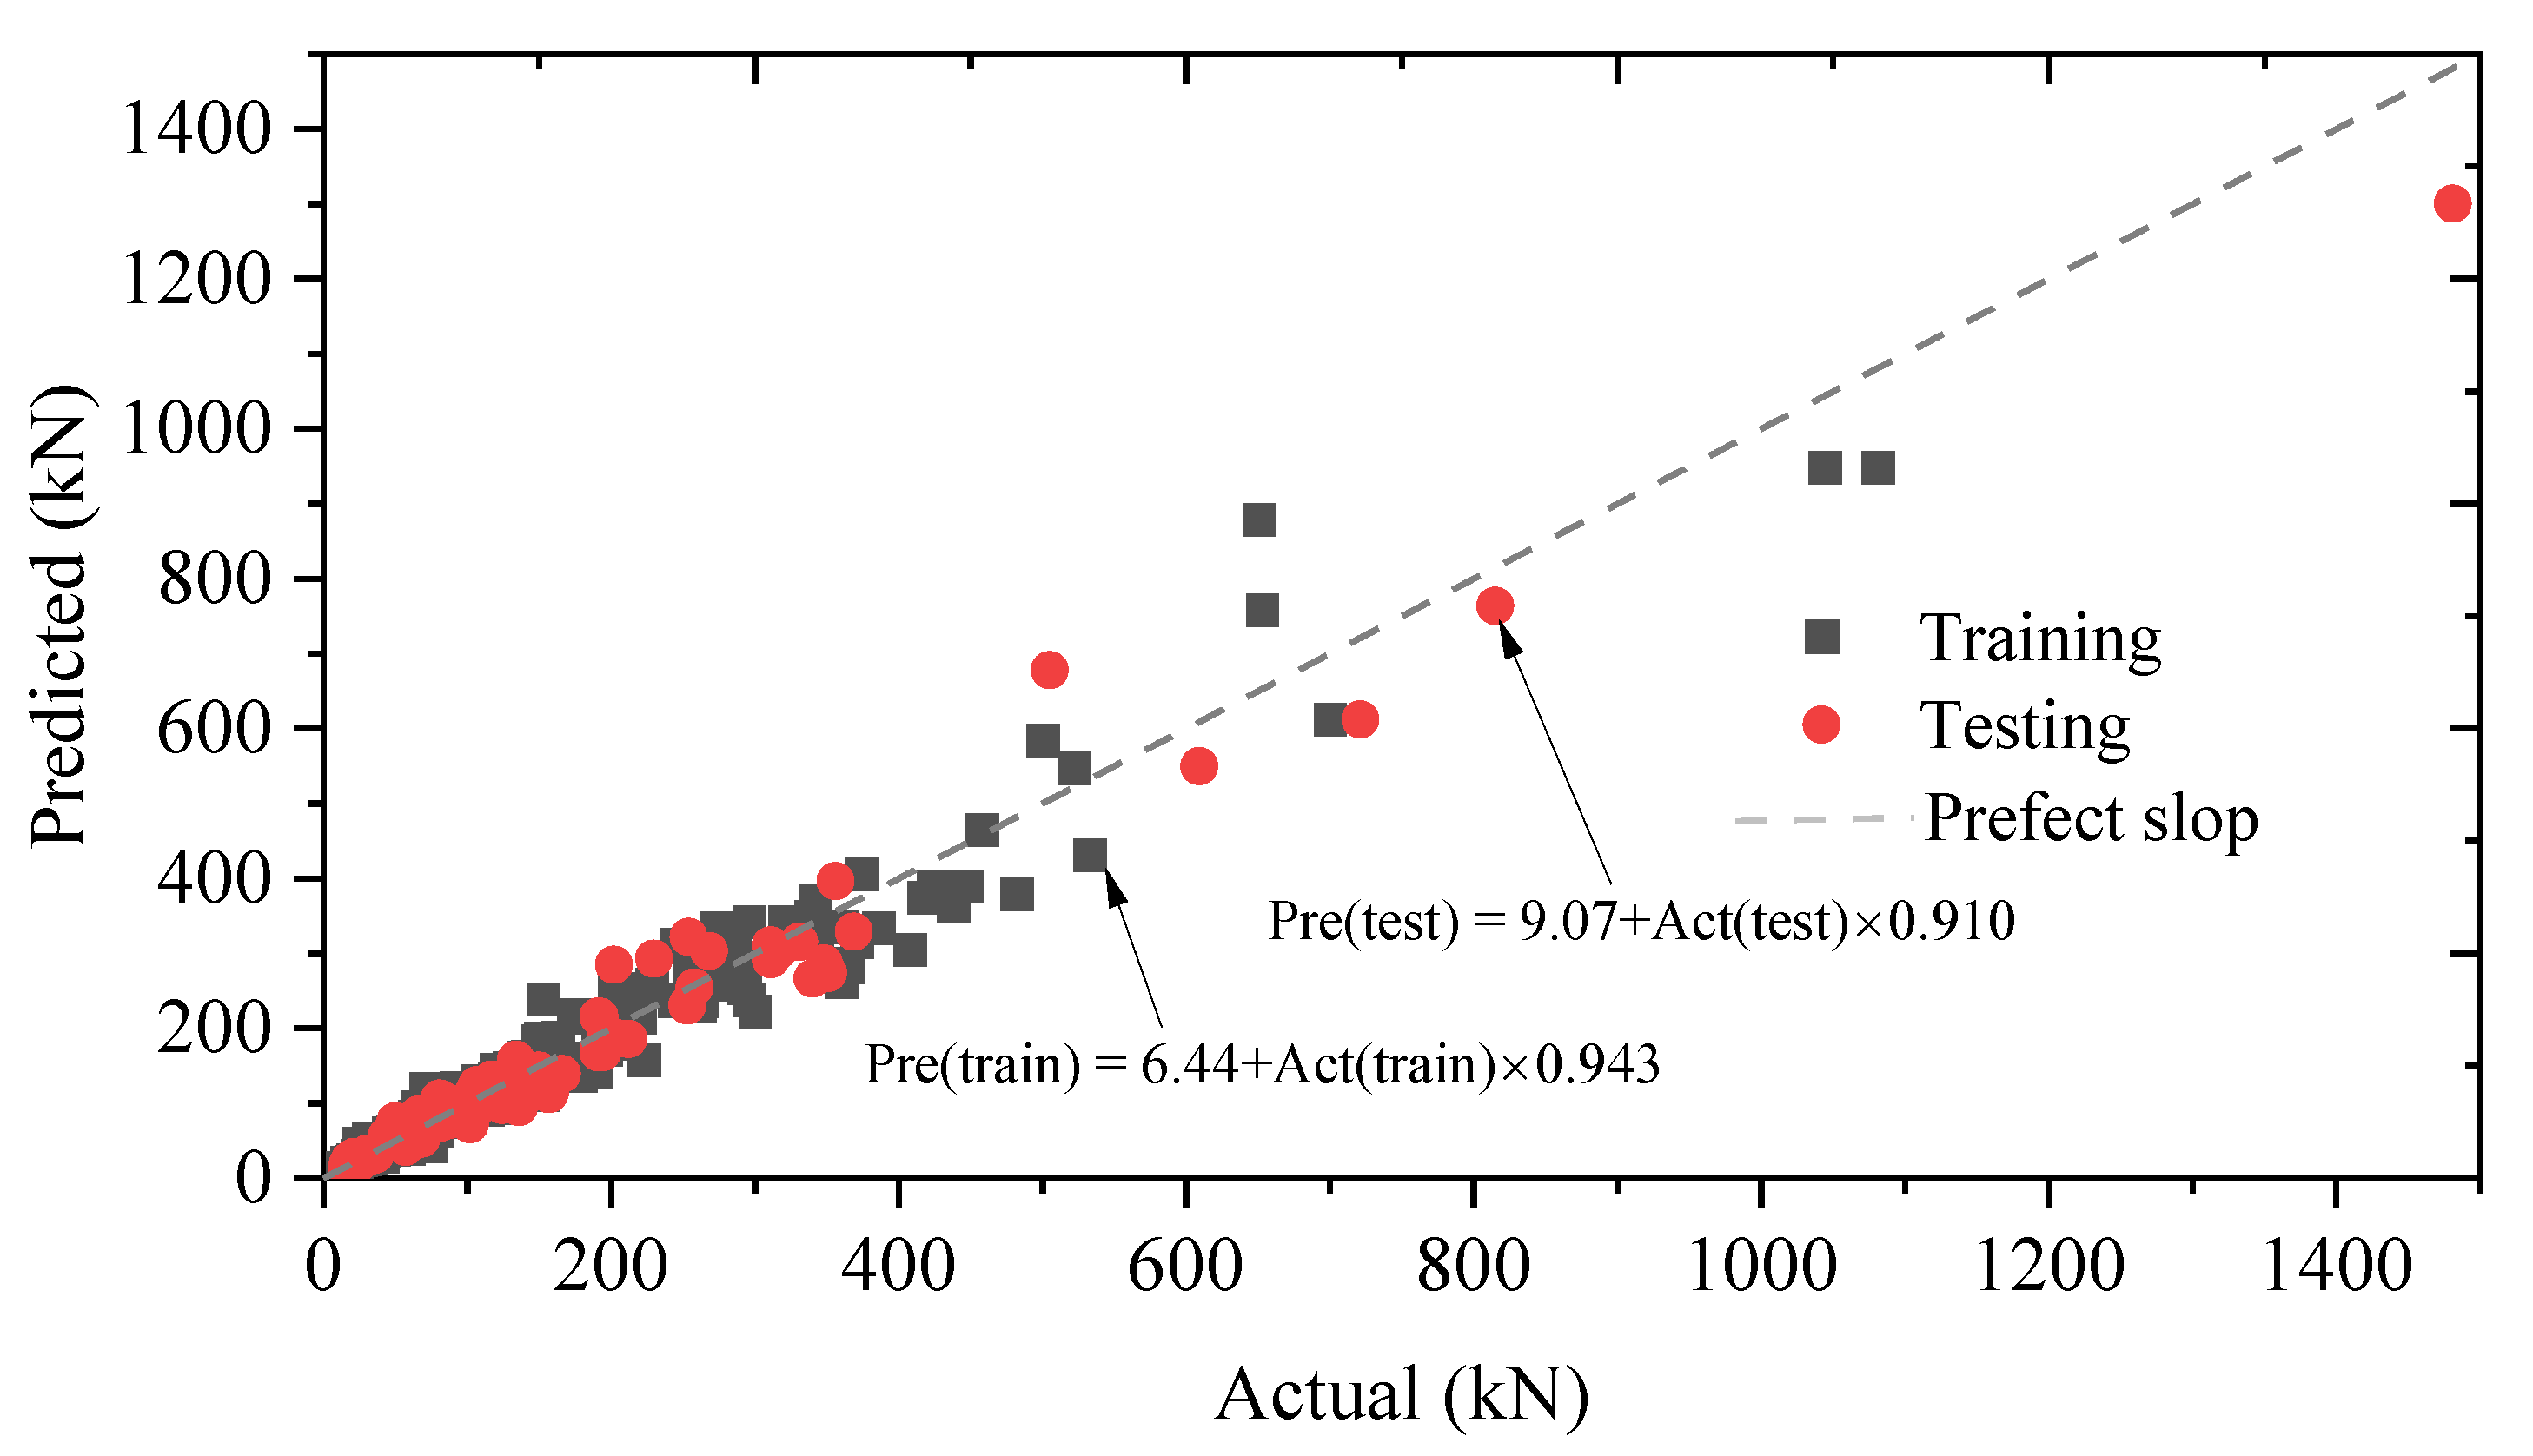
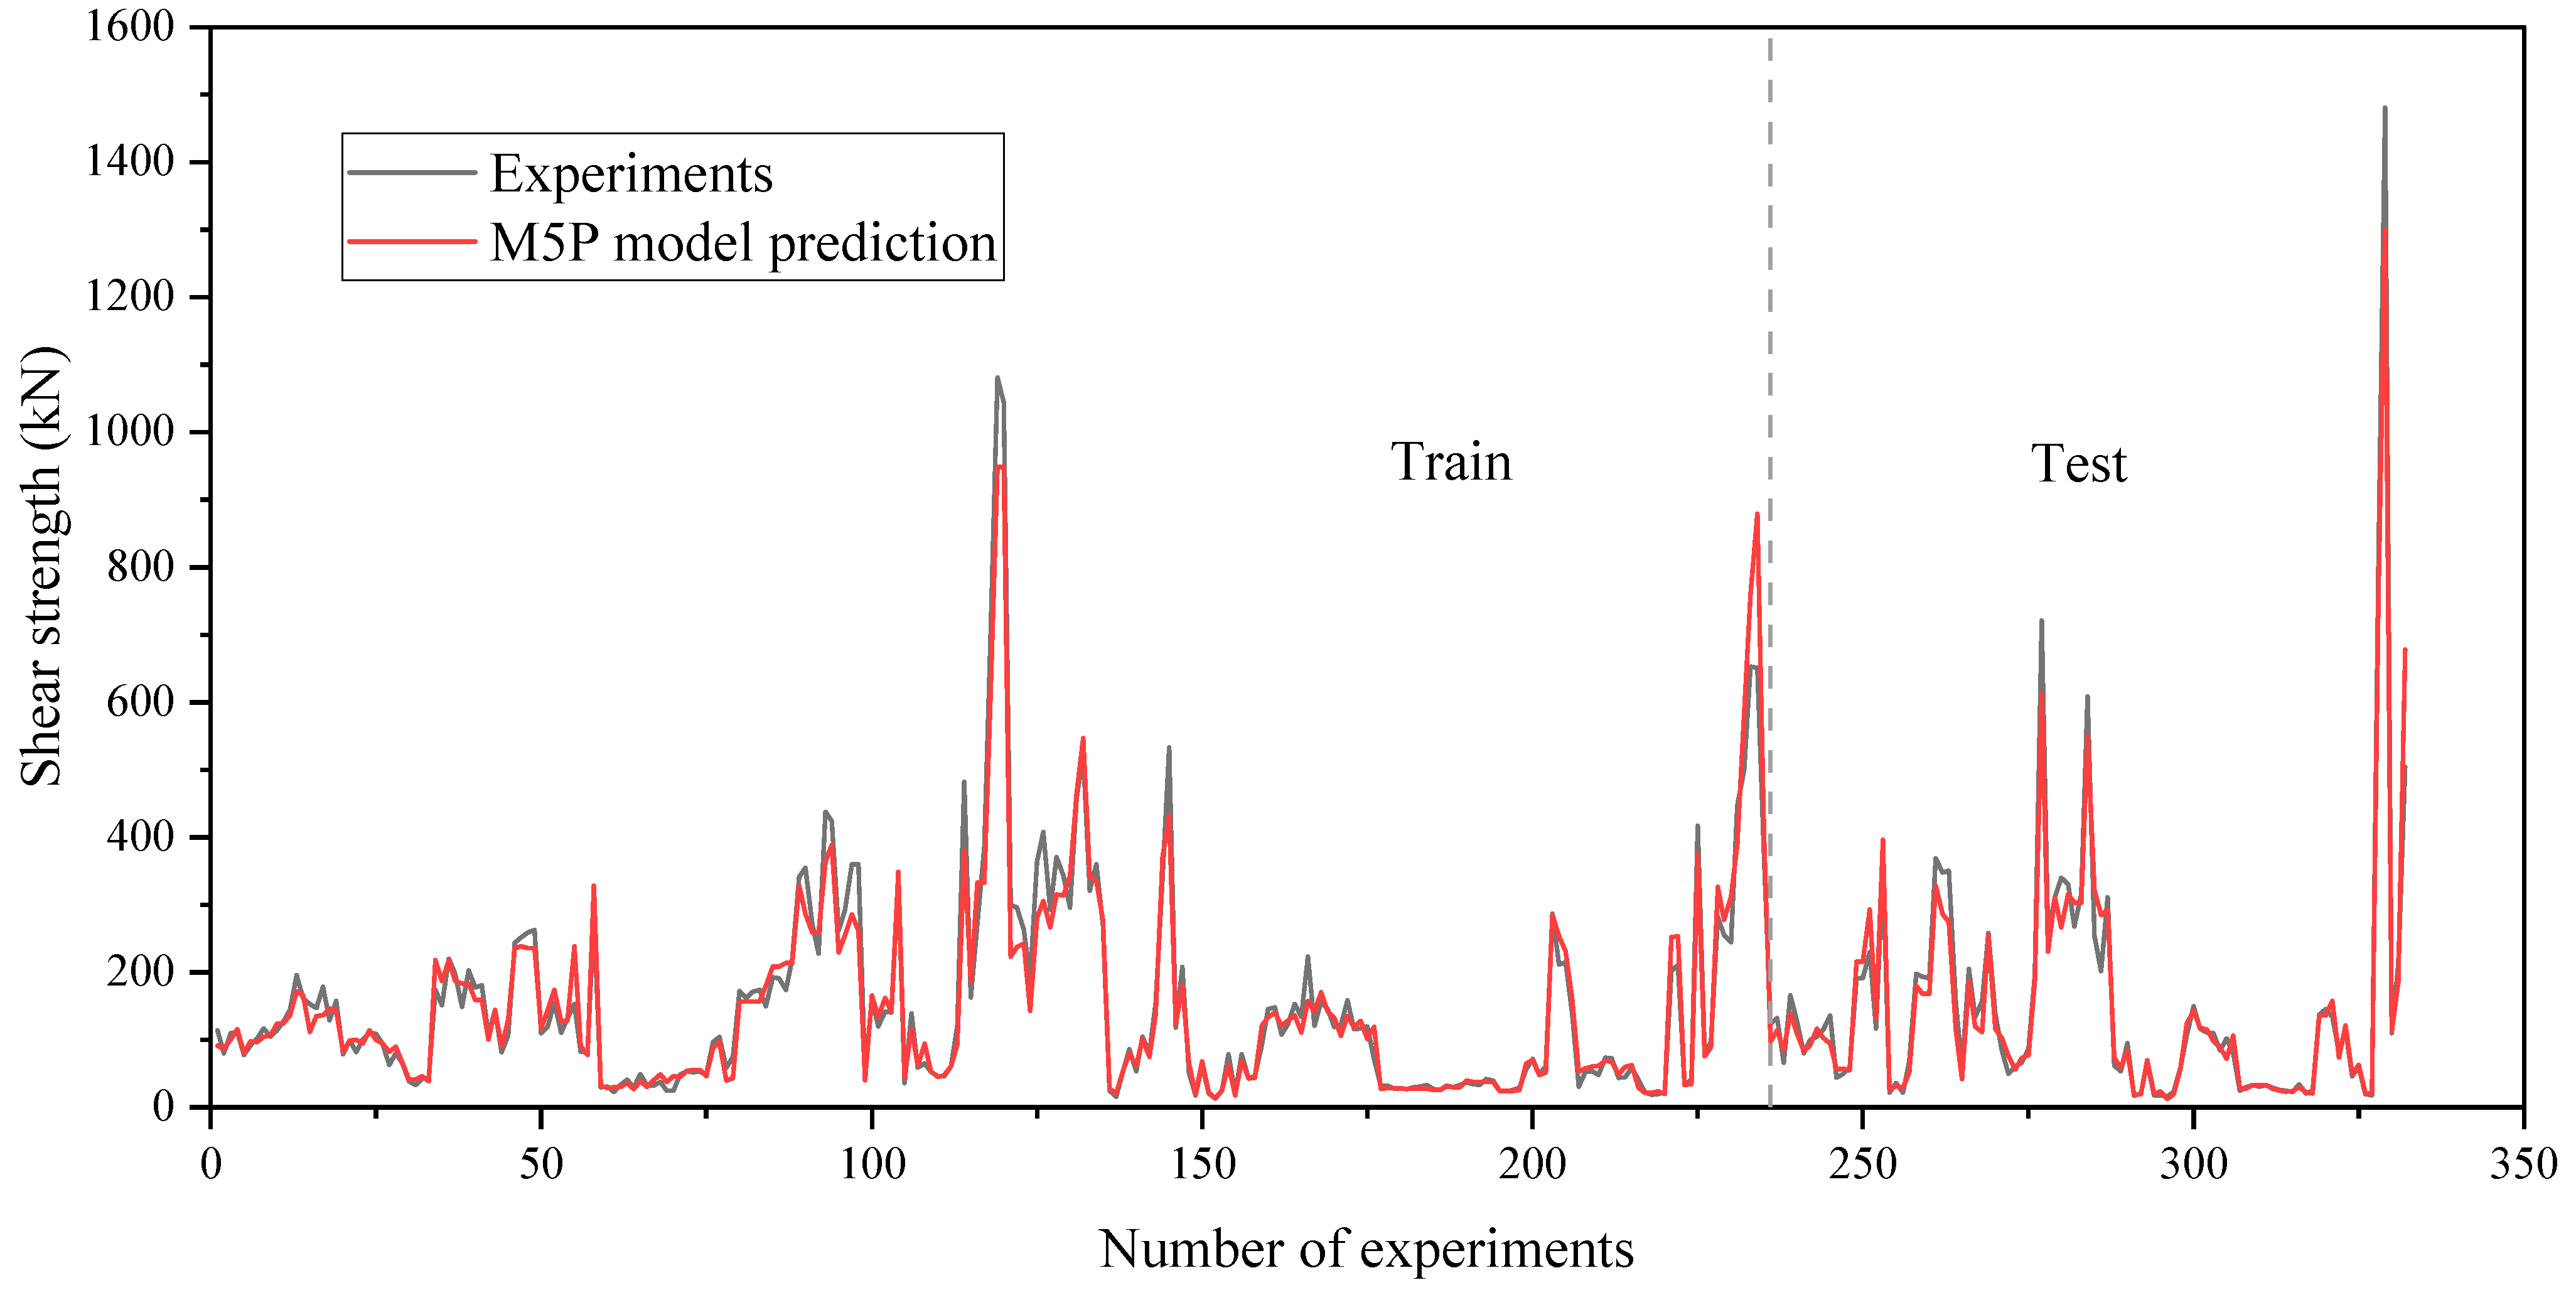
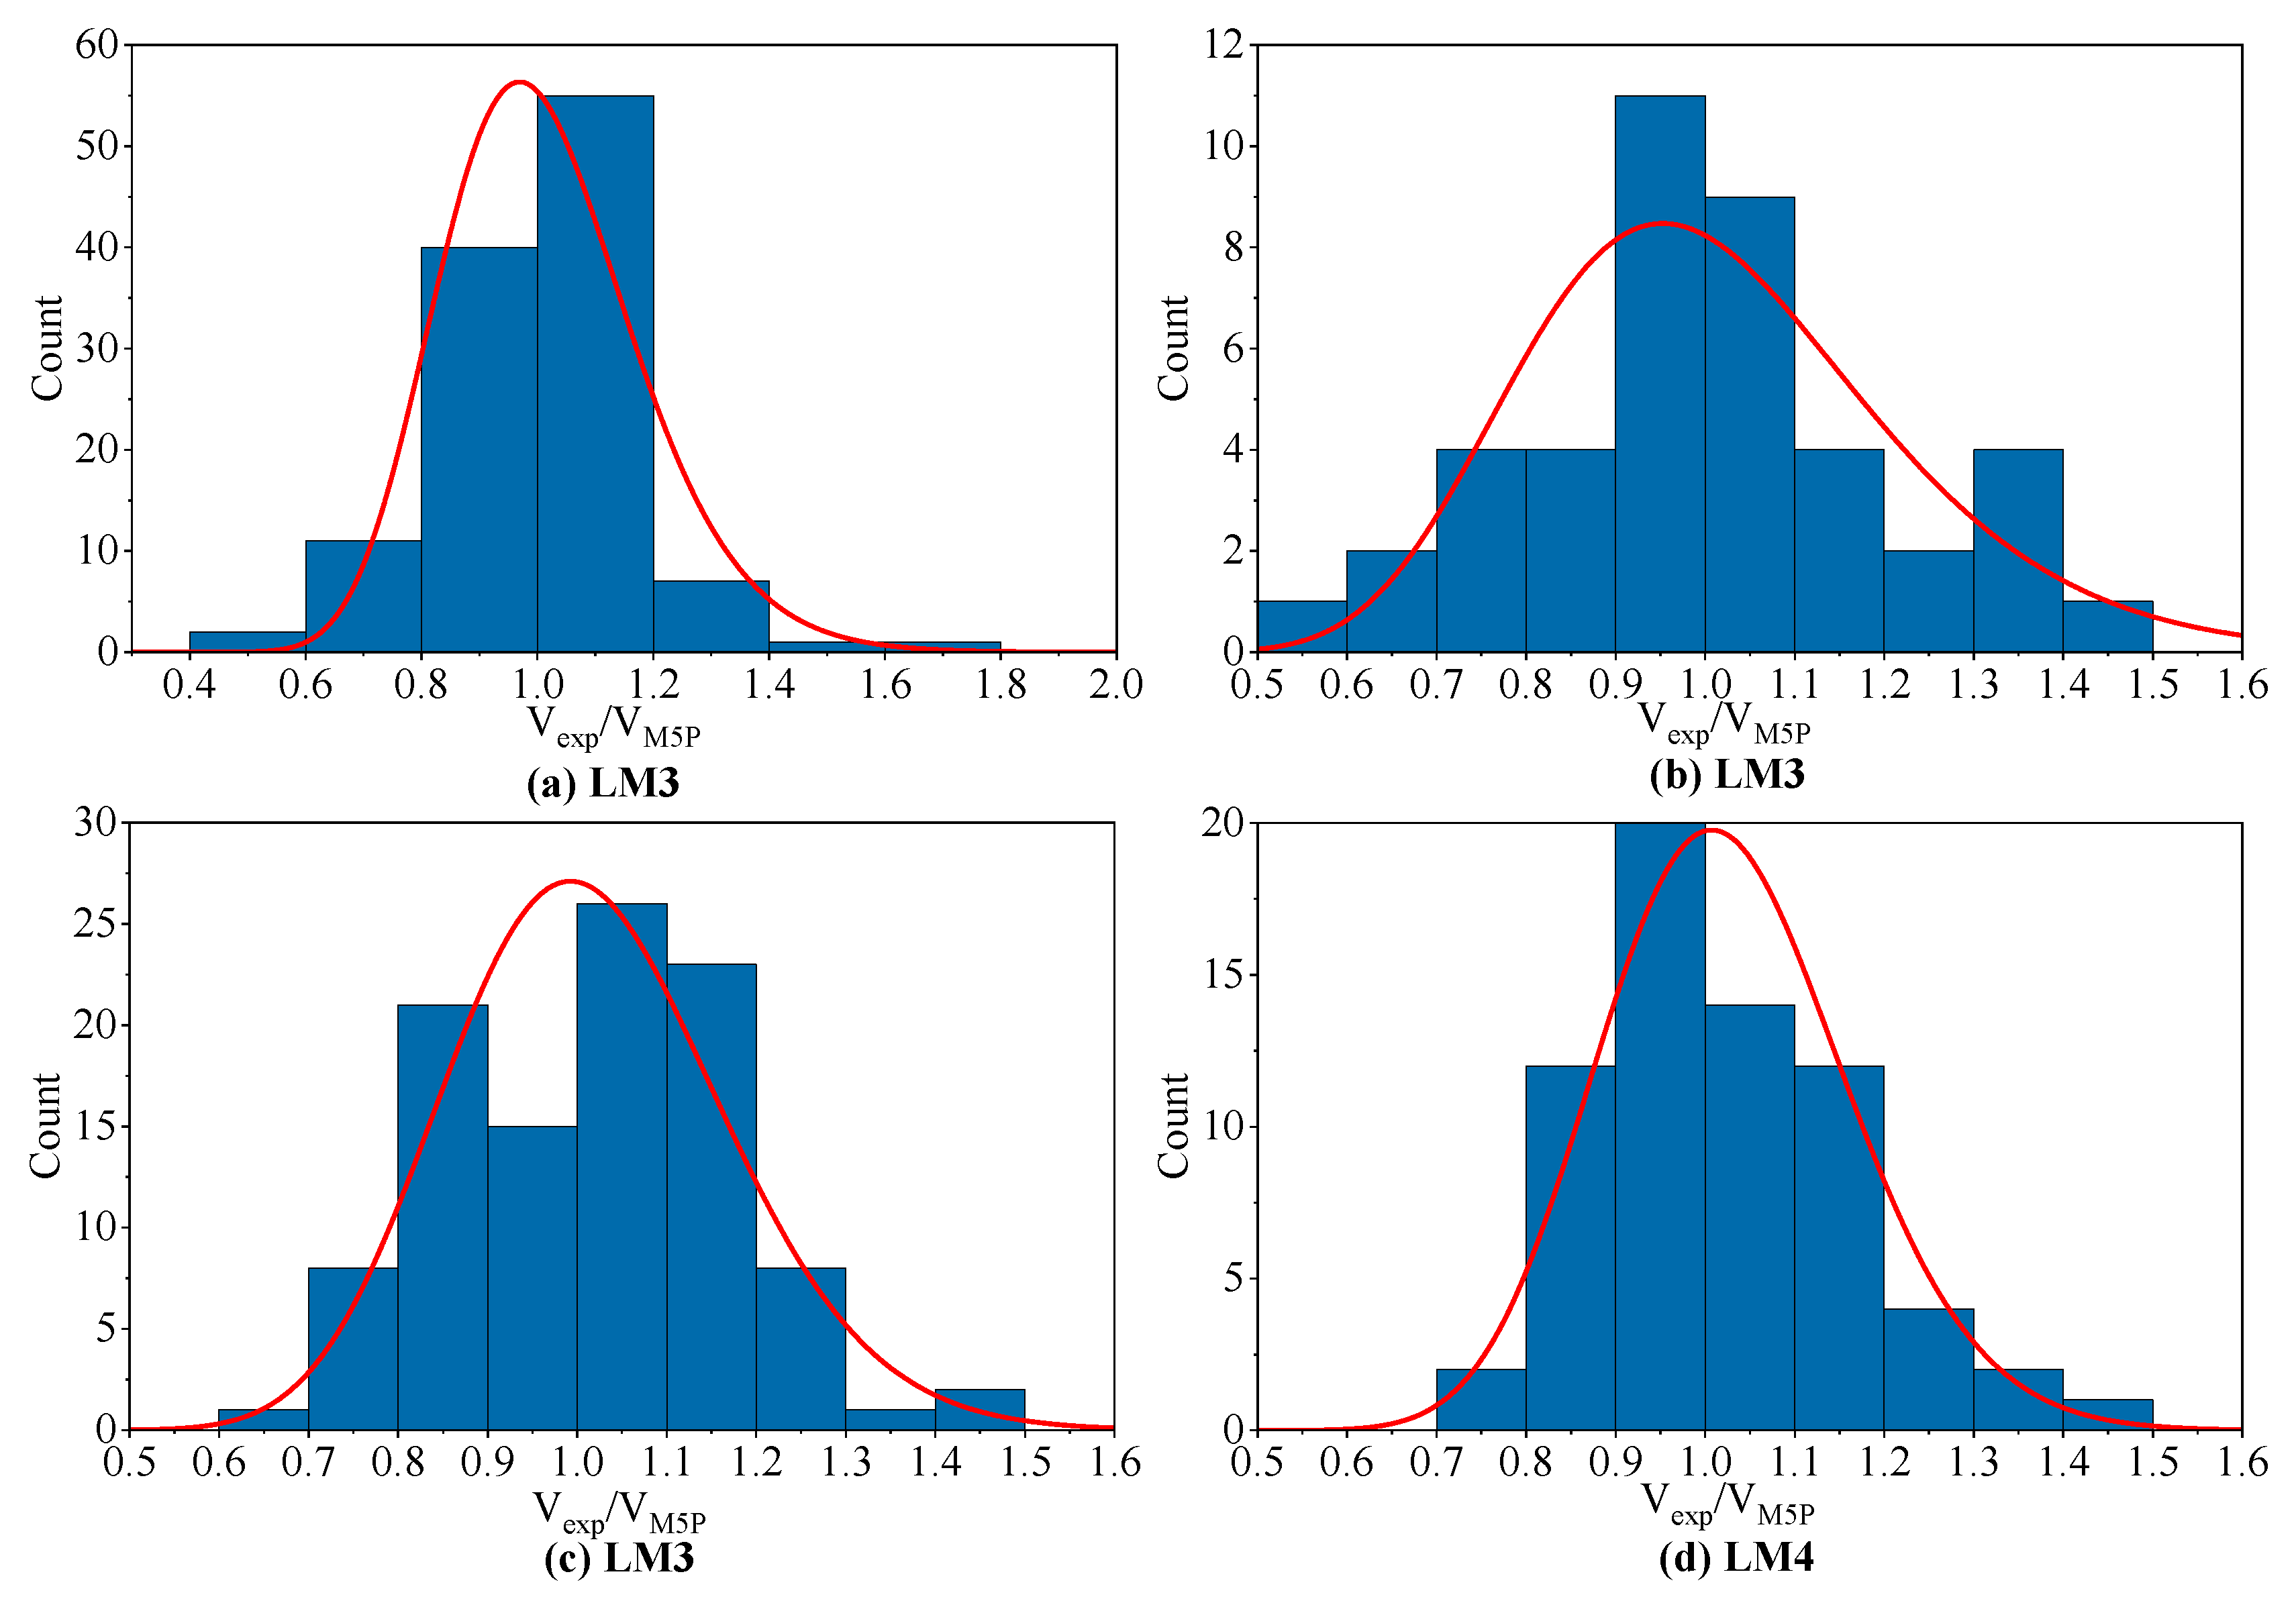
3.2. Performance Analysis

To assess the effectiveness of the established models, two key statistical indices were taken into account: the root mean square error (RMSE) and the correlation coefficient (R2). A comprehensive evaluation of these indices, which serves as an indicator of the correlations’ performance, is presented in Table 4 for further analysis and consideration. The coefficient of determination, commonly denoted as R2, is a statistical measure used to assess how well a regression model fits the data. It represents the proportion of the variation in the dependent variable (y) that can be explained by the independent variable(s) (x). R2 is a number between 0 and 1, where 0 indicates that the model cannot explain any of the variation in the dependent variable and 1 indicates that the model perfectly explains all the variation. In other words, R2 tells us how much of the variability in the dependent variable can be accounted for by the regression model. On the other hand, the RMSE is a statistical measure used to evaluate the accuracy of the predictions from a model. It is a measure of the difference between the predicted values of a model and the observed values. The RMSE represents the square root of the average of the squared differences between the predicted and observed values. The formula for RMSE is as follows:
RMSE = i = 1 n ( y i o b s y i p r e ) 2 n [ 0 , + ]
where y i p r e is the predicted value, y i o b s is the observed value, and n is the total number of observations.
The RMSE is often used to evaluate the performance of regression models, such as linear regression or time-series models, by measuring the difference between the predicted values and the actual values. The RMSE is measured in the same units as the dependent variable, which makes it easier to interpret than other measures, such as the mean absolute error (MAE).
Table 4 presents the statistical evaluation of the performance of the M5P model for predicting the shear strength of SFRC beams. The results in Table 4 show that the M5P model produced predictions that were in good agreement with the experimental data. The prediction ability of the model was evaluated using blind points that were not part of the training dataset. The M5P model was able to predict the shear strength values for the testing dataset with an R2 value of 0.969, indicating a strong association between the predicted and actual values. The closer the R2 value is to 1, the more accurate and effective the model is. Additionally, the authors used the RMSE value as another statistical metric to compare the performance of the models. The RMSE for the testing dataset for the M5P-based correlation was 37.307, indicating that the predictions from the model were very close to the actual values.
Figure 3 presents the results of the M5P model for forecasting the shear strength of SFRC beams. The results are presented as a cross plot, which shows the expected values for both the training and testing datasets. The cross plot was drawn to provide a clearer understanding of the model performance. The results indicate that the M5P model performed near perfection, as the predicted values were precise and located in a condensed area around the unit slope line (X = Y), as can be seen in the cross plot. These results are supported by the previous statistical analysis, and they demonstrate that the M5P model can accurately forecast the shear strength of SFRC beams.
In order to assess the precision and efficiency of the M5P model from an alternative viewpoint, Figure 4 displays the predicted and experimental values of the shear strength in both the training and testing datasets. The results in Figure 4 confirm the previous observations about the accuracy of the M5P model.

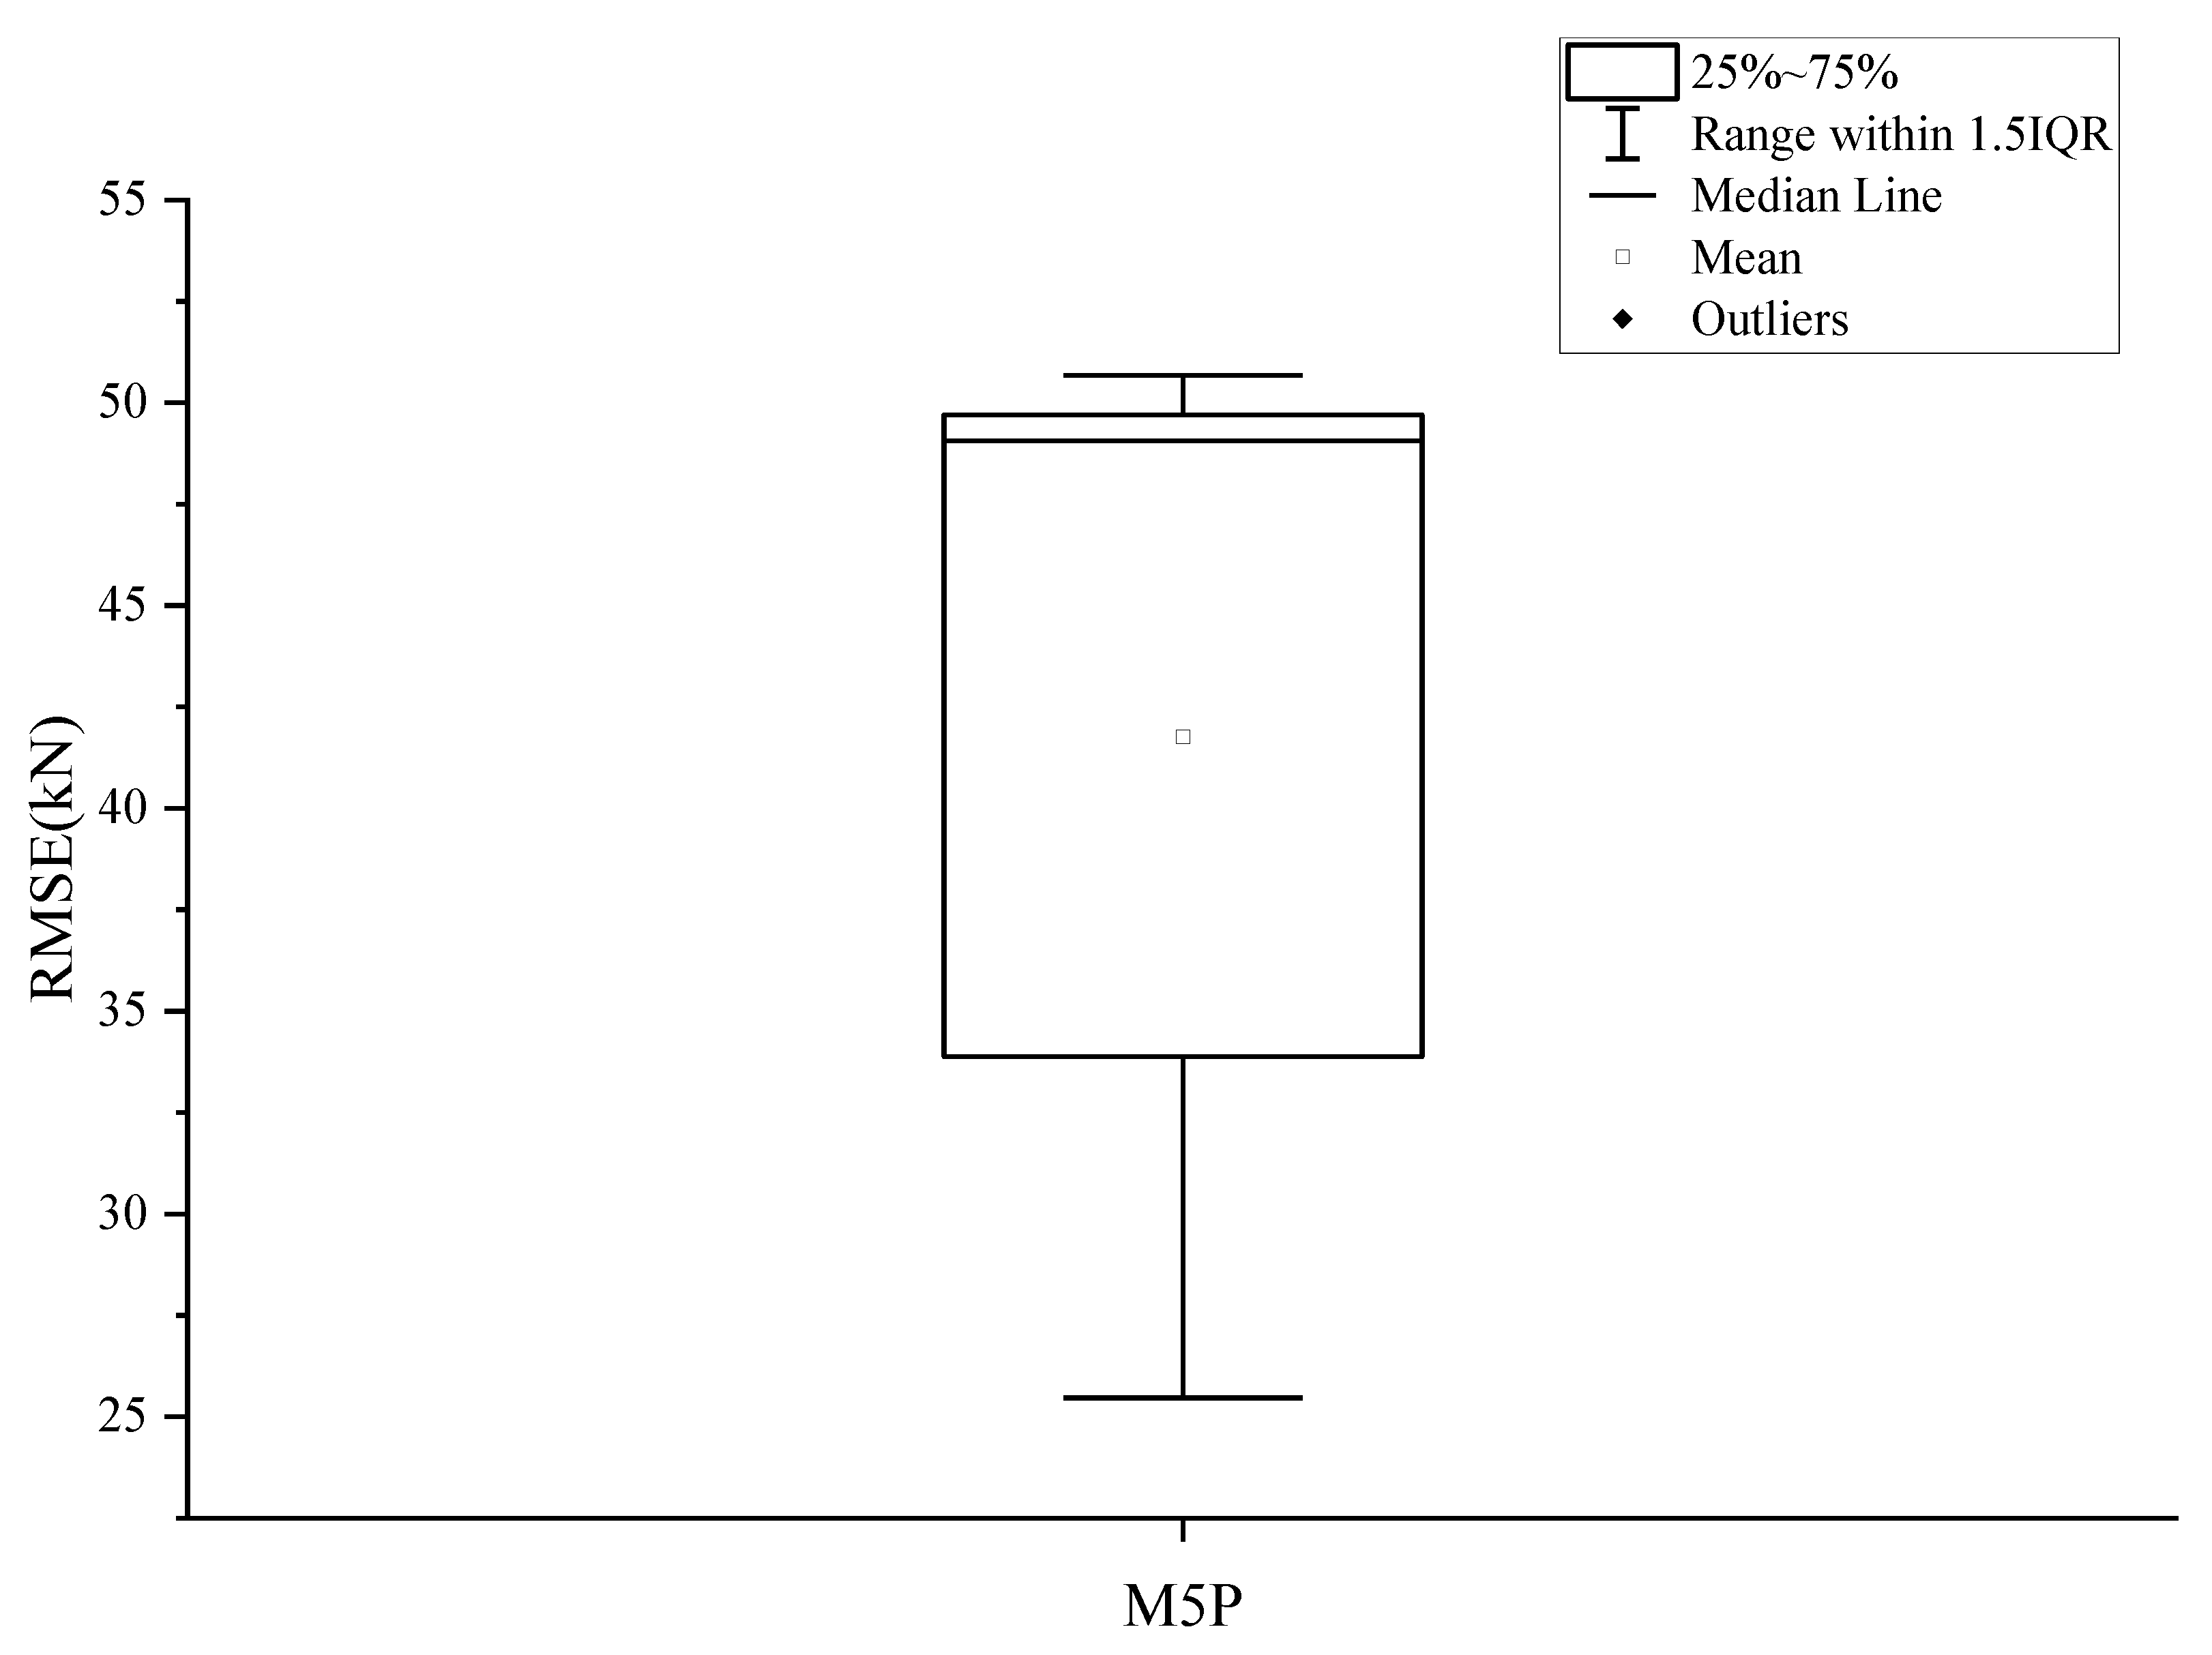
3.3. K-Fold Cross Validation Results

To ensure that overfitting does not occur in the proposed models, a widely used technique known as the five-fold cross-validation method is employed. Five-fold cross-validation is a technique for assessing the performance of ML models. The main purpose of this technique is to evaluate the ability of the model to generalize to new data, rather than simply memorizing the training data. To implement five-fold cross-validation with RMSE (root mean squared error) measurement, the steps to follow are:
  • Divide the data into five equal parts (or “folds”).
  • Choose one fold as the test set and the other four folds as the training set.
  • Train the model on the training set and use it to predict the target values on the test set.
  • Calculate the RMSE between the predicted values and the actual values in the test set.
  • Repeat steps 2–4 for each of the five folds, using a different fold as the test set each time.
  • Calculate the average RMSE across all five folds. This is the overall measure of the model’s performance.
The RMSE performance of the model on all the data points is 38 (kN), while the average performance of the 5-fold cross-validation is 41 (kN). This suggests that the model’s performance on unseen data is relatively close to its performance on the training data, indicating that the model is not prone to overfitting. The smaller difference between the two RMSE values suggests that the model is more likely to generalize well to new data. A box plot displaying the distribution of the model performance across the five folds of the data can typically be seen in Figure 5.

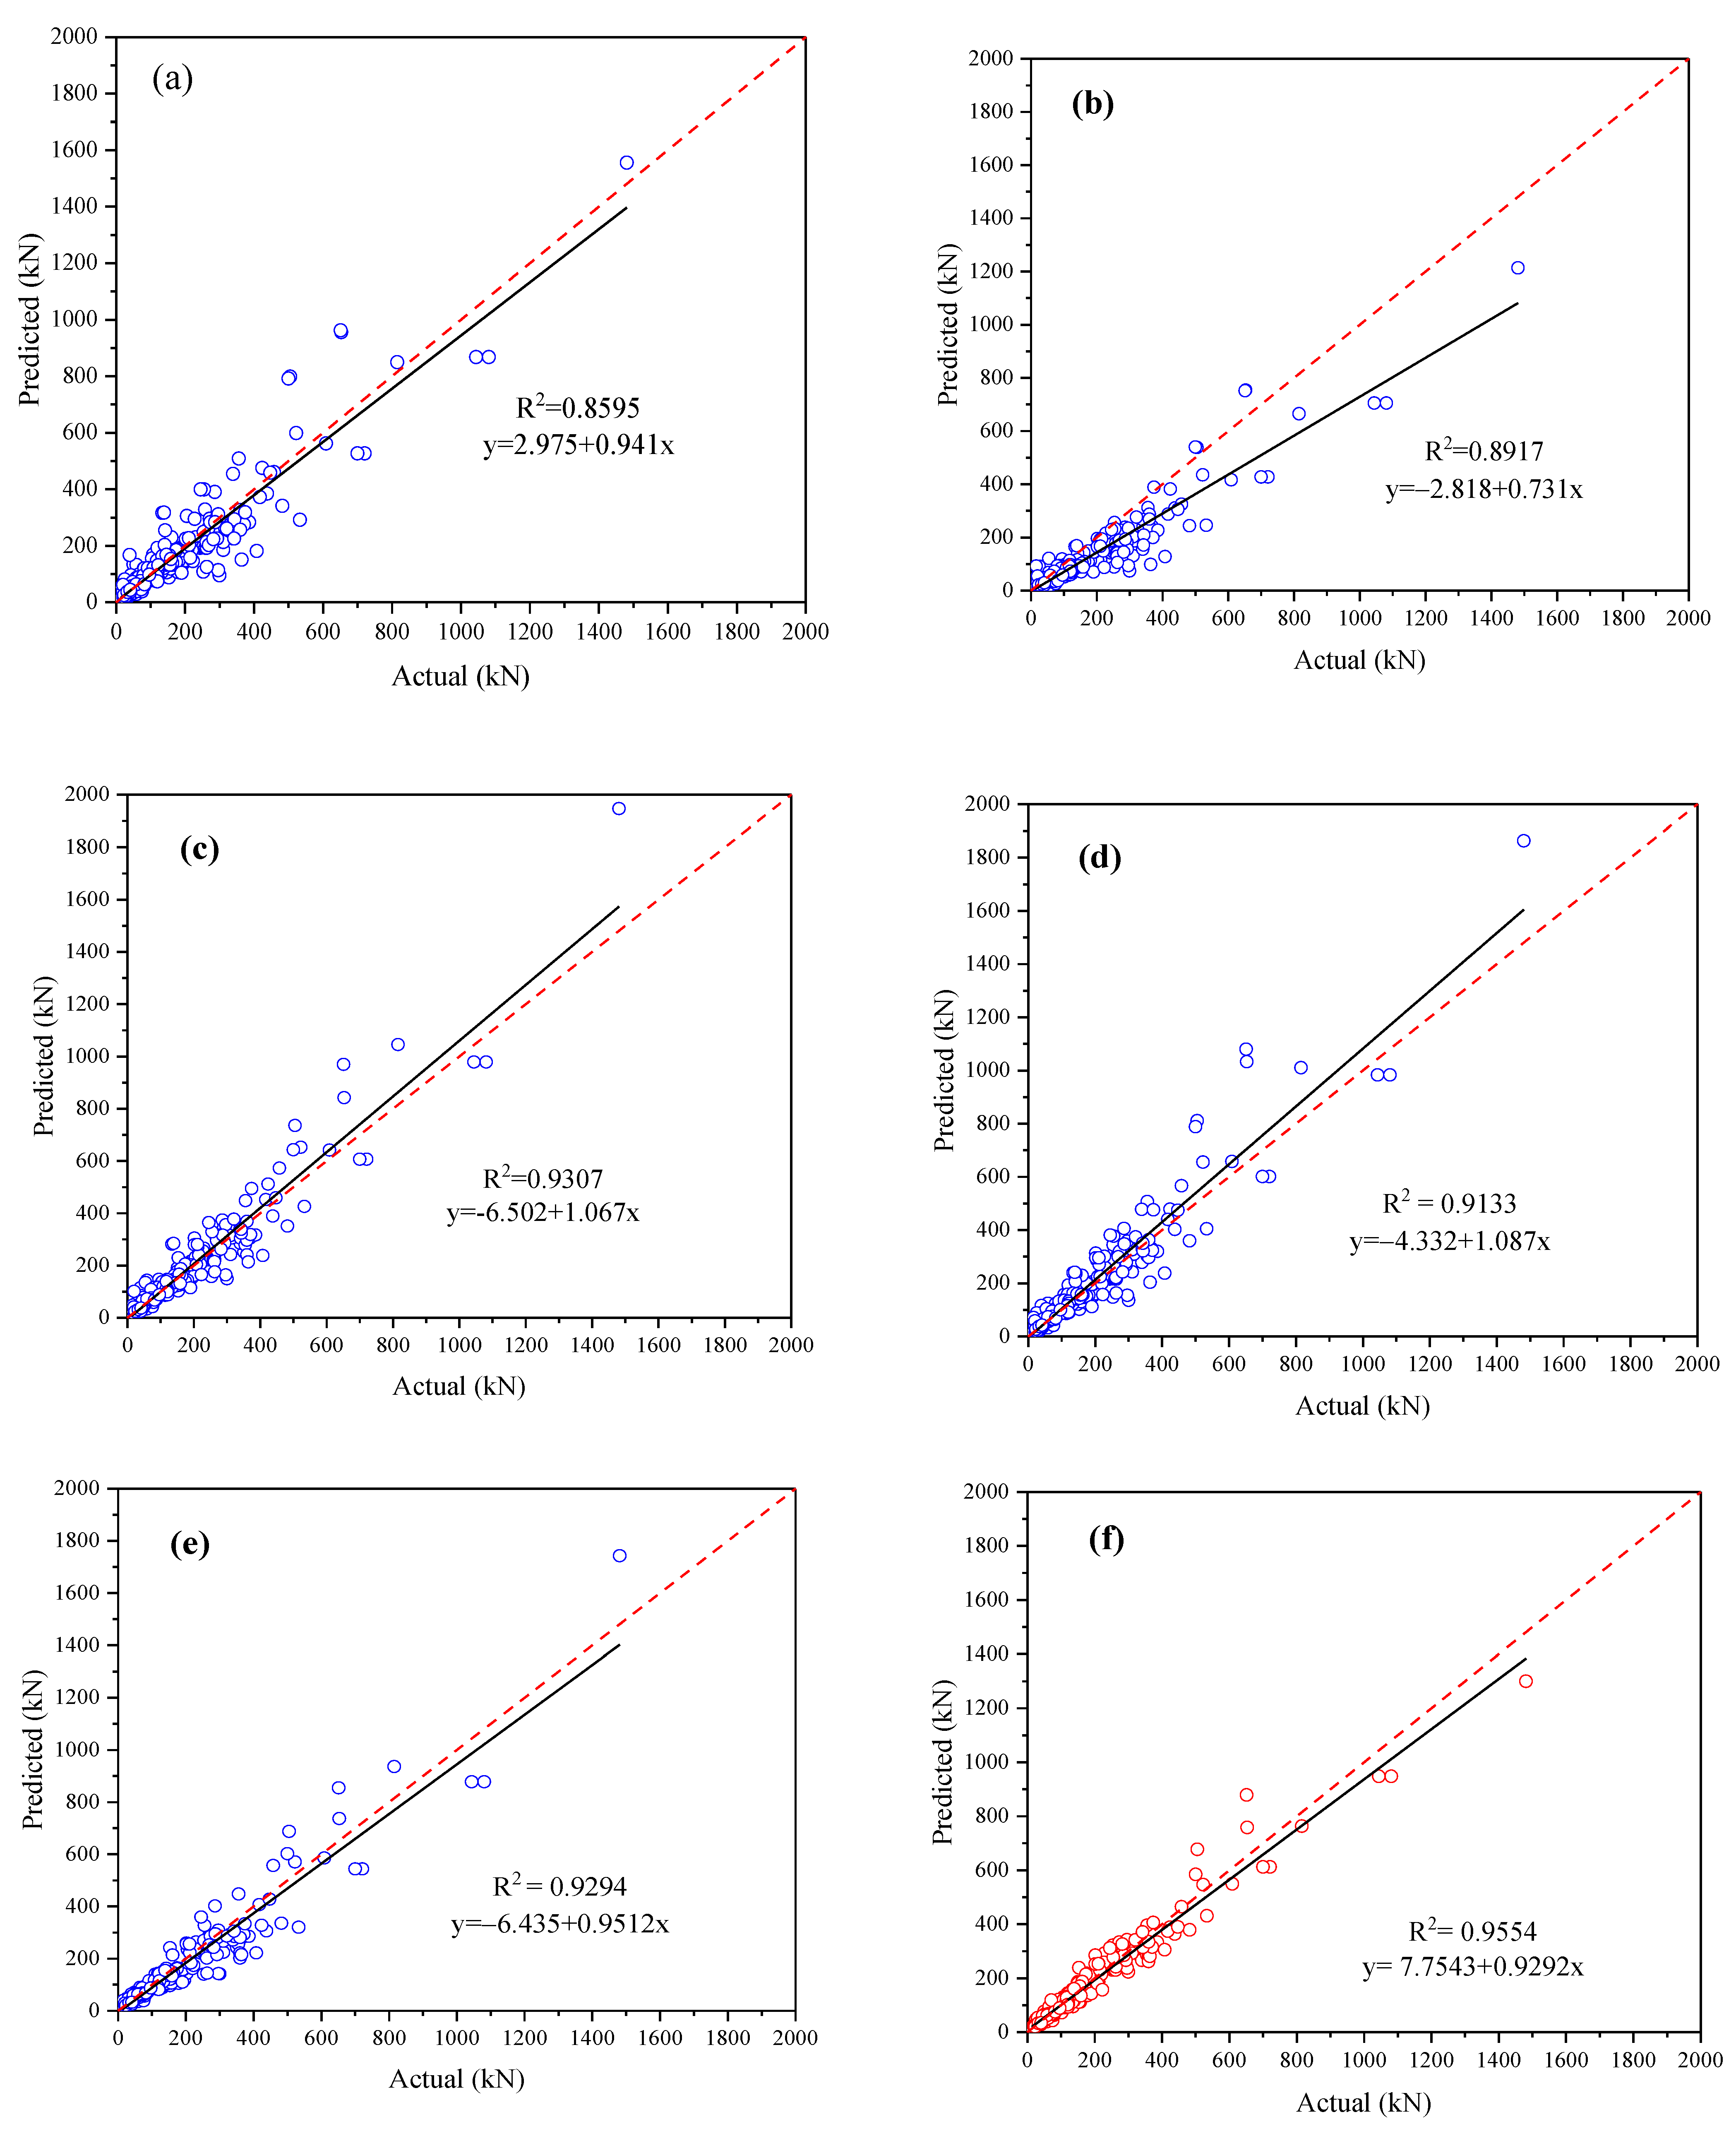
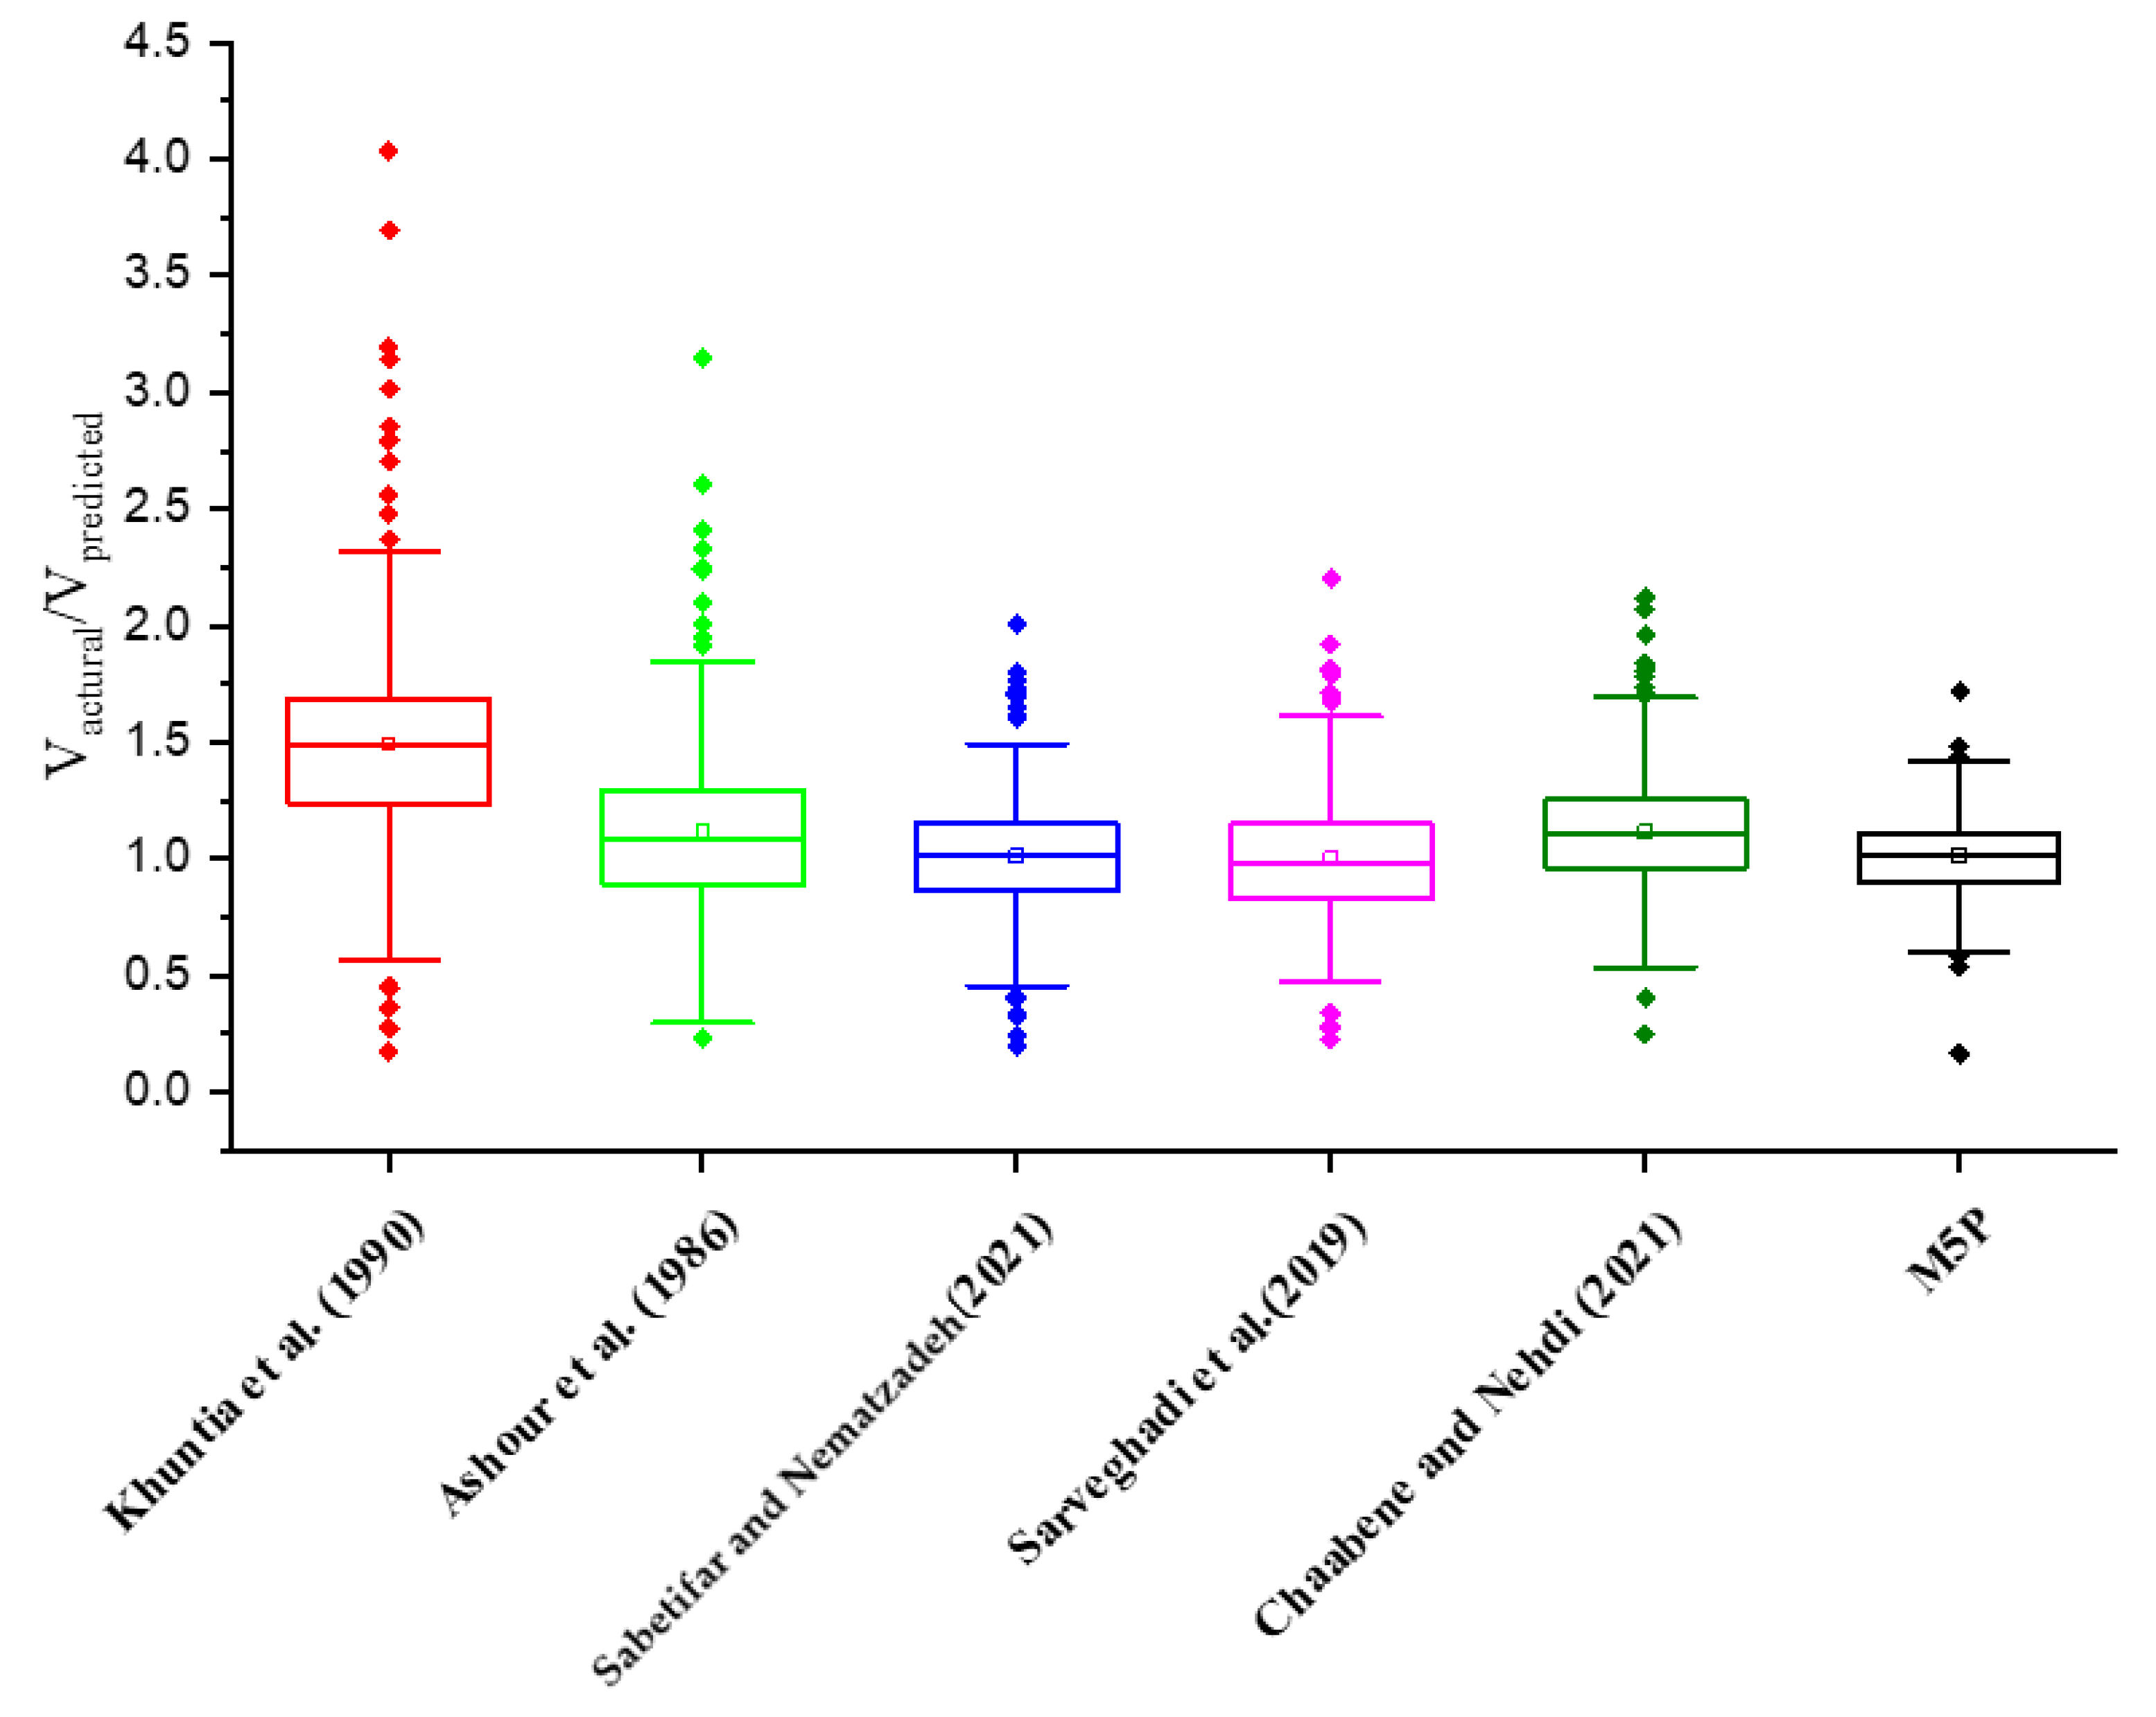
3.4. Comparision with Previouly Developed Models

Figure 6a–f visually shows the comparative analysis between the predicted shear strengths derived from existing models and those obtained from the experimental results. The dashed line, also referred to as the 1:1 line, represents the intended target values for the predictions. In contrast, the solid line embodies the linear regression calculated from the distribution of the effectively predicted data points, providing a graphical representation of the deviation between the predicted and experimental values. When the data points are in closer proximity to the 1:1 line, it signifies a higher level of accuracy for the predicted outcomes. When compared to other models, the models from Ashour et al. [60] and Khuntia et al. [54] demonstrate the lowest prediction performance, indicating a higher discrepancy between their results and the actual outcomes, suggesting room for improvement in their predictive capabilities. The results from Ashour came from a proposed equation in the study [61], which is an adaptation of Zsutty’s equation found in reference [62]. This modified version integrates the fiber factor, accounting for its influence on the overall equation. Khuntia et al. [54] took into account the post-cracking tensile characteristics of fiber-reinforced concrete (FRC) to develop an equation. Their equation was subsequently validated through the analysis of experimental outcomes obtained from 68 SFRC beam specimens featured in their study. Conversely, the average results computed using the equations proposed by Sabetifar and Nematzadeh [35], Sarveghadi et al. [63], and Chaabene and Nehdi [64] demonstrated a closer match with the experimental findings. These models were primarily developed using genetic programming (GP) as their foundation. GP, as introduced in reference [65], is a relatively recent ML technique employed to generate nonlinear regression equations, as documented in references [66,67,68]. This innovative approach has proven to be effective in producing more accurate predictive models. Notably, the equations proposed by Sabetifar and Nematzadeh [35] and Chaabene and Nehdi [64] exhibited a strong predictive performance, characterized by higher R2 values. The linear regression displayed a close alignment with the 1:1 line, indicating a high degree of accuracy in their respective models.
The predicted outcomes derived from the M5P model are juxtaposed with the experimental data, as illustrated in Figure 6f. Upon examination, it becomes evident that the dispersion of data points in the proposed M5P model is substantially smaller in comparison to the data scatters observed in the earlier models. This observation suggests that the M5P model offers a more precise and accurate prediction. Furthermore, the linear regression line plotted using the data points demonstrates a striking resemblance to the diagonal line, boasting a high R2 value of 0.9580. This high value signifies a strong correlation between the predicted results and the experimental data, indicating that the model has effectively captured the underlying relationships in the data.
In addition to the aforementioned observations, Figure 7 shows the histograms of the proposed M5P model. The visual representation of these histograms reveals a well-distributed pattern, with the mean unit value being adequately centered within the distribution. This balanced distribution is an indication of the model’s robustness and its ability to generalize well across data points with a wide distribution.
Figure 8 displays a box plot illustrating the predicted-to-tested strength ratios obtained from different predictive models. Meanwhile, Table 5 provides a detailed overview of the statistical characteristics associated with these ratios across the various models being analyzed. The analysis emphasizes that the M5P model demonstrates the highest accuracy in predicting the shear strength of SFRC beams. This is evidenced by its lowest COV and SD values, along with a mean value that closely approaches unity. The R2 value for the proposed M5P model was found to be the largest among all considered models, indicating its superior performance. In addition, its RMSE value, which signifies the error between the predicted and target values from experiments, was the second smallest one, only slightly surpassed by the value from Chaabene and Nehdi’s model [64]. Moreover, the M5P model exhibits a considerably lower SD and COV, with 0.1627 and 0.1601, respectively, compared to the values for the other models. With a mean value of 1.04, which is remarkably close to 1.0, the M5P model demonstrates a high degree of reliability in estimating the shear strength of SFRC beams. This evidence underlines the effectiveness and reliability of the M5P model in the application studied in this research.

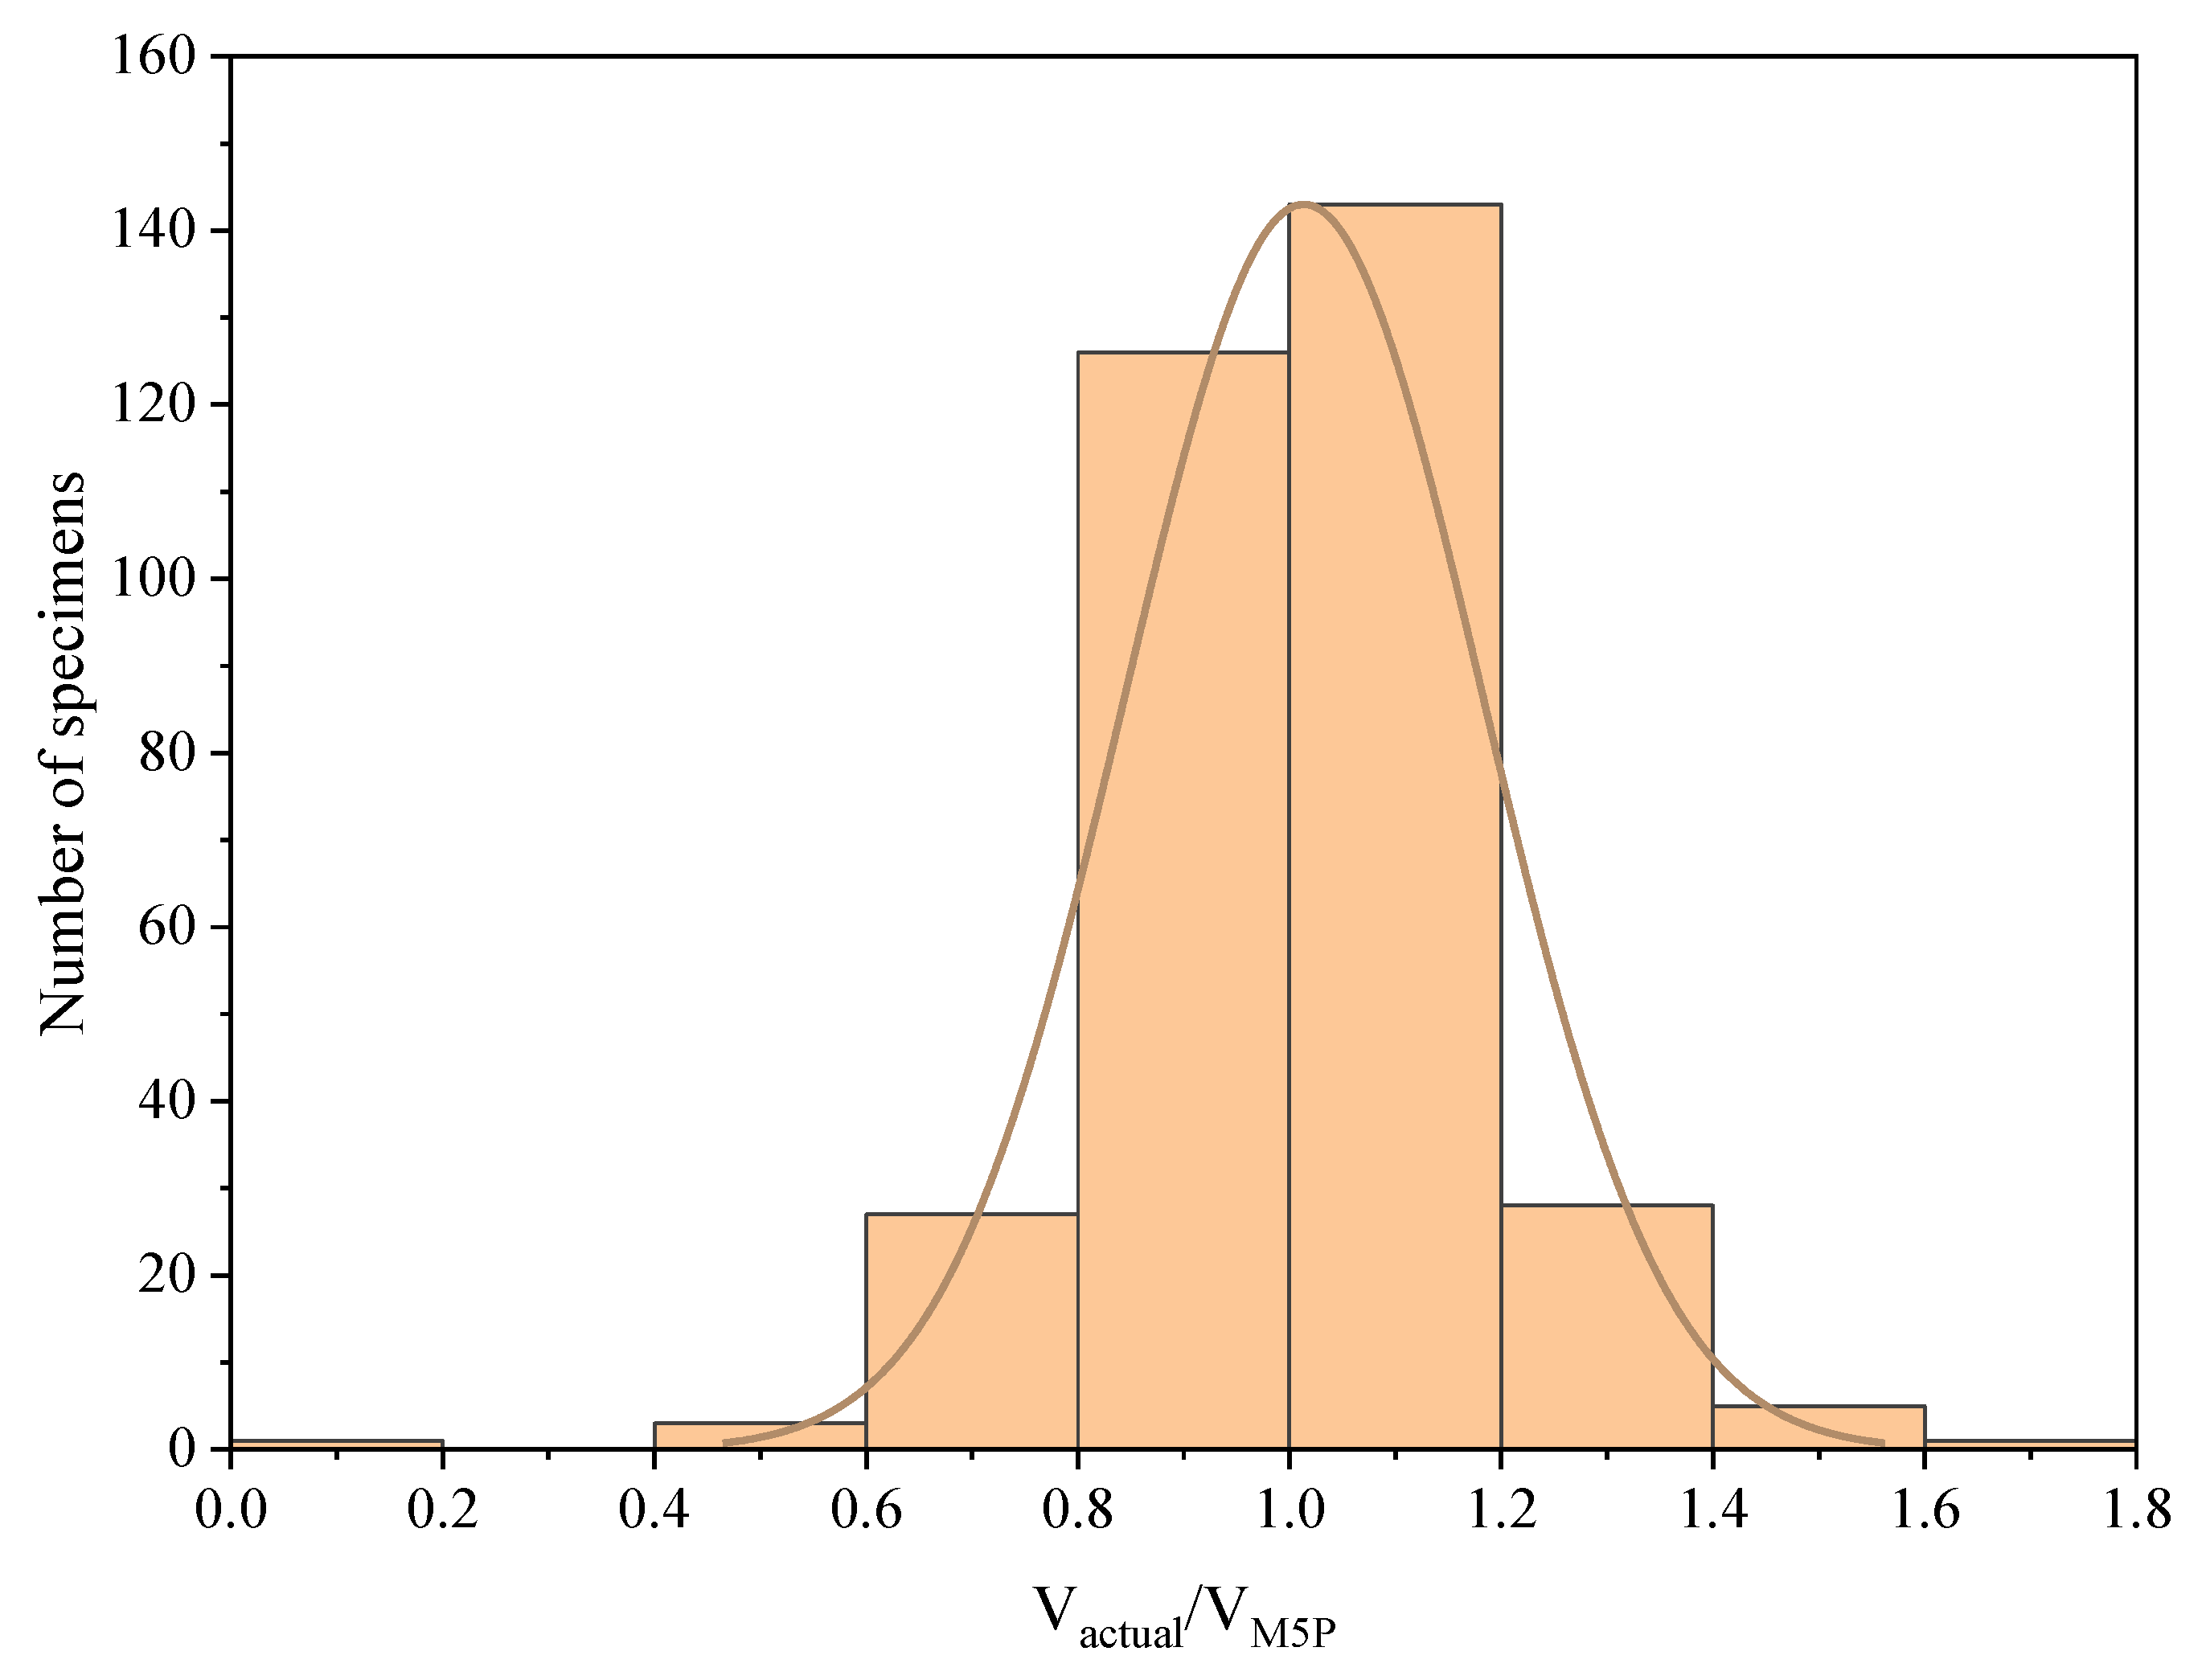
3.5. Model Safety Analysis

Most models and design codes balance safety and practicality with a marginal accuracy level. The proposed model must also maintain adequate safety, consistent with these codes. This study employs Collins scale [69] to assess the proposed model safety and compare it to existing design codes. The scale facilitates a comprehensive evaluation of the safety performance and practicality, ensuring alignment with industry standards. The demerit points classification (DPC) method evaluates a model’s safety, accuracy, and variability by examining the correlation between experimental ultimate shear strengths and estimated theoretical shear capacities. This method assigns a demerit point value (DP) according to the Vactual/Vpredicted ratio. Using the Collins scale, researchers can classify various design codes and the safety performance. Table 6 provides a detailed presentation of the safety classification based on the Collins scale, highlighting different safety levels and criteria.
In order to evaluate quantitatively the safety of the proposed model and contrast it with earlier models, demerit points are assigned to each prediction made by these models, incorporating a total of 332 data points based on the criteria outlined in Table 6. This approach enables a comprehensive comparison of the safety performance between the models. The cumulative demerit values for each model are calculated by summing the products of specimen counts and corresponding penalties within each interval as shown in Table 7. A lower total sum value indicates a higher safety level for the model under study. For instance, the model from Khuntia et al. [54] has four instances, where Vactual/Vpredicted < 0.5. Referring to Table 6, each of these 4 points carries a penalty of 10. Thus, the total penalty is calculated as 4 × 10 = 40. This method enables an effective evaluation and ranking of various models’ safety performance, guiding the selection of the safest and most reliable model for practical applications. It is crucial to highlight that the M5P algorithm demonstrates the lowest demerit penalty among the various prediction models, indicating its superior safety performance. Based on the Collins scale, approximately 70% of the predictions made by the M5P algorithm fall within the safe and acceptable range, further emphasizing its reliability and effectiveness

3.6. Safety Factor Inclusion

The M5P model equations LM1, LM2, LM3, and LM4 do not consistently overestimate all data points, but rather produce both overestimated and underestimated predictions. For this reason, introducing a reduction factor can still further improve the reliability of the predictions. This can be especially important in scenarios where reliable predictions are necessary to satisfy the design conservatism and can help ensure that the model is an effective tool for generating insights from data. As shown in Figure 9a–d, the Vexp/VM5P ratios exhibit a minor level of scatter and do not follow a normal distribution (Lognormal). Therefore, the reduction factor γ needs to be applied to account for the statistical uncertainties associated with estimating the characteristic value of the Vexp/VM5P ratio. Equation (6) provides a means of calculating the reduction factor, as recommended by EN 1992 [7,70]. By using this approach, engineers can be confident that their designs are based on sound engineering principles and are safe and reliable in a range of different scenarios.
γ = a · e x p   α β η o 0.5 η o 2
where β is a reliability index taken as 3.8, α is a sensitivity factor taken as 0.8, a is the slope of the relationship between Vexp and VM5P, and η o is the standard deviation of Vexp/a × VM5P. Those values and relationships are recommended by EN 1992 [7]. As depicted in Figure 10a–d, the slope values (a) of 1.11, 1.17, 1.23, and 1.04 are assigned for equations LM1, LM2, LM3, and LM4, respectively. By substituting these values in Equation (7), engineers can estimate the reduction factor γ for the shear strength of SFRC slender beams from equations LM1, LM2, LM3, and LM4, as 0.69, 0.69, 0.85, and 0.65, respectively.

4. Conclusions

In this study, the aim was to develop an innovative, interpretable, and easy-to-use M5P-tree-algorithm-based model to predict the shear strength of SFRC beams. The model showcases superior performance compared to existing models in the field of structural engineering. Accurate prediction of the shear strength of SFRC beams is crucial, as it ensures the safety and reliability of structures, particularly when dealing with challenging loading conditions and complex geometries. Furthermore, a safety analysis using the Collins scale was employed to assess the safety performance of the proposed model. Based on the results and analysis, the following conclusions, which emphasize the novelty of this work, can be drawn:
  • The M5P model demonstrated high accuracy in predicting the shear strength of SFRC beams, outperforming existing models in terms of performance metrics. The simplicity and ease of use of the M5P tree algorithm highlight its effectiveness in handling complex relationships and its potential applicability to other civil engineering problems.
  • The safety analysis conducted using the Collins scale revealed that the M5P model had the lowest demerit penalty and was the safest among the different prediction models. Approximately 70% of the predictions made by the M5P algorithm fell within the safe and acceptable range, emphasizing its reliability and effectiveness in practical applications.
  • By developing a more accurate, reliable, and user-friendly prediction tool, this research provides a significant contribution to the design and optimization of SFRC beams. It ensures that the desired level of shear strength is achieved while optimizing resource utilization and improving safety in SFRC structure design and construction.
The successful development and validation of the M5P model open up new opportunities for future research in the field of SFRC beams. Further refinements and enhancements to the model can be pursued, and additional case studies can be conducted to continue improving the accuracy, reliability, and safety performance of the prediction tool. Ultimately, the M5P model serves as a valuable and novel contribution to the ongoing advancement of SFRC beam design and engineering, addressing a crucial aspect of structural safety and reliability.

Author Contributions

Conceptualization, software, and editing, N.M.A.-A.; data curation and resources, M.J.H.; review, methodology, and writing—original draft, H.I.; writing—review and editing, S.N.H.; review, writing, and funding, L.F.A.B.; visualization and editing, Z.A.-K. All authors have read and agreed to the published version of the manuscript.

Funding

This research received no external funding.

Institutional Review Board Statement

Not applicable.

Informed Consent Statement

Not applicable.

Data Availability Statement

Not applicable.

Conflicts of Interest

The authors declare no conflict of interest.

References

  1. Rahman, J.; Ahmed, K.S.; Khan, N.I.; Islam, K.; Mangalathu, S. Data-driven shear strength prediction of steel fiber reinforced concrete beams using machine learning approach. Eng. Struct. 2021, 233, 111743. [Google Scholar] [CrossRef]
  2. Yang, J.; Doh, J.-H.; Yan, K.; Zhang, X. Experimental investigation and prediction of shear capacity for UHPC beams. Case Stud. Constr. Mater. 2022, 16, e01097. [Google Scholar] [CrossRef]
  3. Soltanabadi, R.; Behfarnia, K. Shear strength of reinforced concrete deep beams containing recycled concrete aggregate and recycled asphalt pavement. Constr. Build. Mater. 2022, 314, 125597. [Google Scholar] [CrossRef]
  4. Li, W.; Huang, W.; Fang, Y.; Zhang, K.; Liu, Z.; Kong, Z. Experimental and theoretical analysis on shear behavior of RC beams reinforced with GFRP stirrups. Structures 2022, 46, 1753–1763. [Google Scholar] [CrossRef]
  5. Xu, T.; Li, J. Experimental investigations of failure modes of reinforced concrete beams without web reinforcement. Eng. Struct. 2019, 185, 47–57. [Google Scholar] [CrossRef]
  6. ACI. Building Code Requirements for Structural Concrete (ACI 318-19) and Commentary (ACI 318R-19); Detroit, M., Ed.; American Concrete Institute: Farmington Hills, MI, USA, 2019. [Google Scholar]
  7. European Commission. Eurocode 2: Design of Concrete Structures-Part 1–1: General Rules and Rules for Buildings; CEN (European Committee for Standardization): Brussels, Belgium, 2010. [Google Scholar]
  8. Ma, Z.; Shen, J.; Wang, C.; Wu, H. Characterization of sustainable mortar containing high-quality recycled manufactured sand crushed from recycled coarse aggregate. Cem. Concr. Compos. 2022, 132, 104629. [Google Scholar] [CrossRef]
  9. Tran, T.T.; Pham, T.M.; Hao, H. Effect of hybrid fibers on shear behaviour of geopolymer concrete beams reinforced by basalt fiber reinforced polymer (BFRP) bars without stirrups. Compos. Struct. 2020, 243, 112236. [Google Scholar] [CrossRef]
  10. Said, A.; Elsayed, M.; Abd El-Azim, A.; Althoey, F.; Tayeh, B.A. Using ultra-high performance fiber reinforced concrete in improvement shear strength of reinforced concrete beams. Case Stud. Constr. Mater. 2022, 16, e01009. [Google Scholar] [CrossRef]
  11. Mansour, W.; Tayeh, B.A. Shear behaviour of RC beams strengthened by various ultrahigh performance fibre-reinforced concrete systems. Adv. Civ. Eng. 2020, 2020, 2139054. [Google Scholar] [CrossRef]
  12. D’Antino, T.; Focacci, F.; Sneed, L.H.; Pellegrino, C. Shear strength model for RC beams with U-wrapped FRCM composites. J. Compos. Constr. 2020, 24, 04019057. [Google Scholar] [CrossRef]
  13. Abadel, A.; Abbas, H.; Almusallam, T.; Alshaikh, I.M.; Khawaji, M.; Alghamdi, H.; Salah, A.A. Experimental study of shear behavior of CFRP strengthened ultra-high-performance fiber-reinforced concrete deep beams. Case Stud. Constr. Mater. 2022, 16, e01103. [Google Scholar] [CrossRef]
  14. Nana, W.; Tran, H.; Goubin, T.; Kubisztal, G.; Bennani, A.; Bui, T.; Cardia, G.; Limam, A. Behaviour of macro-synthetic fibers reinforced concrete: Experimental, numerical and design code investigations. Structures 2021, 32, 1271–1286. [Google Scholar] [CrossRef]
  15. Hui, L.; López-Almansa, F. New modifying truss model and numerical simulation of steel fiber reinforced concrete under pure torsion. Structures 2018, 14, 32–42. [Google Scholar] [CrossRef]
  16. Gümüş, M.; Arslan, A. Effect of fiber type and content on the flexural behavior of high strength concrete beams with low reinforcement ratios. Structures 2019, 20, 1–10. [Google Scholar] [CrossRef]
  17. Furlan, S., Jr.; de Hanai, J.B. Shear behaviour of fiber reinforced concrete beams. Cem. Concr. Compos. 1997, 19, 359–366. [Google Scholar] [CrossRef]
  18. Nematzadeh, M.; Karimi, A.; Gholampour, A. Pre-and post-heating behavior of concrete-filled steel tube stub columns containing steel fiber and tire rubber. Structures 2020, 27, 2346–2364. [Google Scholar] [CrossRef]
  19. Nematzadeh, M.; Hasan-Nattaj, F.; Gholampour, A.; Sabetifar, H.; Ngo, T.D. Strengthening of heat-damaged steel fiber-reinforced concrete using CFRP composites: Experimental study and analytical modeling. Structures 2021, 32, 1856–1870. [Google Scholar] [CrossRef]
  20. Nematzadeh, M.; Baradaran-Nasiri, A. Mechanical performance of fiber-reinforced recycled refractory brick concrete exposed to elevated temperatures. Comput. Concr. Int. J. 2019, 24, 19–35. [Google Scholar]
  21. Jafarzadeh, H.; Nematzadeh, M. Evaluation of post-heating flexural behavior of steel fiber-reinforced high-strength concrete beams reinforced with FRP bars: Experimental and analytical results. Eng. Struct. 2020, 225, 111292. [Google Scholar] [CrossRef]
  22. Gao, D.; Gu, Z.; Zhu, H.; Huang, Y. Fatigue behavior assessment for steel fiber reinforced concrete beams through experiment and fatigue prediction model. Structures 2020, 27, 1105–1117. [Google Scholar] [CrossRef]
  23. Bi, J.; Wang, Z.; Zhao, Y.; Huo, L.; Xie, Y. A mechanical model for shear design of steel fiber reinforced concrete beams without shear reinforcements. Structures 2021, 31, 216–229. [Google Scholar] [CrossRef]
  24. Nematzadeh, M.; Hasan-Nattaj, F. Compressive stress-strain model for high-strength concrete reinforced with forta-ferro and steel fibers. J. Mater. Civ. Eng. 2017, 29, 04017152. [Google Scholar] [CrossRef]
  25. Yu, Y.; Zhao, X.-Y.; Xu, J.-J.; Wang, S.-C.; Xie, T.-Y. Evaluation of shear capacity of steel fiber reinforced concrete beams without stirrups using artificial intelligence models. Materials 2022, 15, 2407. [Google Scholar] [CrossRef]
  26. Shatnawi, A.; Alkassar, H.M.; Al-Abdaly, N.M.; Al-Hamdany, E.A.; Bernardo, L.F.A.; Imran, H. Shear Strength Prediction of Slender Steel Fiber Reinforced Concrete Beams Using a Gradient Boosting Regression Tree Method. Buildings 2022, 12, 550. [Google Scholar] [CrossRef]
  27. Olalusi, O.B.; Awoyera, P.O. Shear capacity prediction of slender reinforced concrete structures with steel fibers using machine learning. Eng. Struct. 2021, 227, 111470. [Google Scholar] [CrossRef]
  28. Momani, Y.; Tarawneh, A.; Alawadi, R.; Momani, Z. Shear strength prediction of steel fiber-reinforced concrete beams without stirrups. Innov. Infrastruct. Solut. 2022, 7, 107. [Google Scholar] [CrossRef]
  29. Keshtegar, B.; Bagheri, M.; Yaseen, Z.M. Shear strength of steel fiber-unconfined reinforced concrete beam simulation: Application of novel intelligent model. Compos. Struct. 2019, 212, 230–242. [Google Scholar] [CrossRef]
  30. Chaabene, W.B.; Nehdi, M.L. Novel soft computing hybrid model for predicting shear strength and failure mode of SFRC beams with superior accuracy. Compos. Part C Open Access 2020, 3, 100070. [Google Scholar] [CrossRef]
  31. Al-Abdaly, N.M.; Al-Taai, S.R.; Imran, H.; Ibrahim, M. Development of prediction model of steel fiber-reinforced concrete compressive strength using random forest algorithm combined with hyperparameter tuning and k-fold cross-validation. East.-Eur. J. Enterp. Technol. 2021, 5, 113. [Google Scholar] [CrossRef]
  32. Tariq, M.; Khan, A.; Ullah, A.; Shayanfar, J.; Niaz, M. Improved shear strength prediction model of steel fiber reinforced concrete beams by adopting gene expression programming. Materials 2022, 15, 3758. [Google Scholar] [CrossRef]
  33. Tarawneh, A.; Almasabha, G.; Alawadi, R.; Tarawneh, M. Innovative and reliable model for shear strength of steel fibers reinforced concrete beams. Structures 2021, 32, 1015–1025. [Google Scholar] [CrossRef]
  34. Sharifi, Y.; Moghbeli, A. New predictive models via gene expression programming and multiple nonlinear regression for SFRC beams. J. Mater. Res. Technol. 2020, 9, 14294–14306. [Google Scholar] [CrossRef]
  35. Sabetifar, H.; Nematzadeh, M. An evolutionary approach for formulation of ultimate shear strength of steel fiber-reinforced concrete beams using gene expression programming. Structures 2021, 34, 4965–4976. [Google Scholar] [CrossRef]
  36. Ahmadi, M.; Kheyroddin, A.; Dalvand, A.; Kioumarsi, M. New empirical approach for determining nominal shear capacity of steel fiber reinforced concrete beams. Constr. Build. Mater. 2020, 234, 117293. [Google Scholar] [CrossRef]
  37. Shahnewaz, M.; Tannert, M. Shear strength prediction of steel fiber reinforced concrete beams from genetic programming and its sensitivity analysis. In Proceedings of the FRC: The Modern Landscape BEFIB 2016 9th Rilem International Symposium on Fiber Reinforced Concrete, Vancouver, BC, Canada, 19–21 September 2016; pp. 19–21. [Google Scholar]
  38. Ismail, M.K.; Yosri, A.; El-Dakhakhni, W. A multi-gene genetic programming model for predicting shear strength of steel fiber concrete beams. ACI Struct. J. 2022, 119, 317–328. [Google Scholar]
  39. Gandomi, A.H.; Yun, G.J.; Alavi, A.H. An evolutionary approach for modeling of shear strength of RC deep beams. Mater. Struct. 2013, 46, 2109–2119. [Google Scholar] [CrossRef]
  40. Gandomi, A.; Alavi, A.; Yun, G. Nonlinear modeling of shear strength of SFRC beams using linear genetic programming. Struct. Eng. Mech. 2011, 38, 1–25. [Google Scholar] [CrossRef]
  41. Arslan, G. Shear strength of steel fiber reinforced concrete (SFRC) slender beams. KSCE J. Civ. Eng. 2014, 18, 587–594. [Google Scholar] [CrossRef]
  42. Singh, B.; Sihag, P.; Tomar, A.; SEHGAL, A. Estimation of compressive strength of high-strength concrete by random forest and M5P model tree approaches. J. Mater. Eng. Struct. 2019, 6, 583–592. [Google Scholar]
  43. Shah, H.A.; Nehdi, M.L.; Khan, M.I.; Akmal, U.; Alabduljabbar, H.; Mohamed, A.; Sheraz, M. Predicting Compressive and Splitting Tensile Strengths of Silica Fume Concrete Using M5P Model Tree Algorithm. Materials 2022, 15, 5436. [Google Scholar] [CrossRef]
  44. Kocamaz, A.F.; Ayaz, Y.; Karakoç, M.B.; Türkmen, İ.; Demirboğa, R. Prediction of compressive strength and ultrasonic pulse velocity of admixtured concrete using tree model M5P. Struct. Concr. 2021, 22, E800–E814. [Google Scholar] [CrossRef]
  45. Henedy, S.N.; Naser, A.H.; Imran, H.; Bernardo, L.F.; Teixeira, M.M.; Al-Khafaji, Z. Development of Prediction Models for the Torsion Capacity of Reinforced Concrete Beams Using M5P and Nonlinear Regression Models. J. Compos. Sci. 2022, 6, 366. [Google Scholar] [CrossRef]
  46. Ahmed, H.U.; Mohammed, A.S.; Mohammed, A.A. Multivariable models including artificial neural network and M5P-tree to forecast the stress at the failure of alkali-activated concrete at ambient curing condition and various mixture proportions. Neural Comput. Appl. 2022, 34, 17853–17876. [Google Scholar] [CrossRef]
  47. Spinella, N.; Colajanni, P.; Recupero, A. Simple plastic model for shear critical SFRC beams. J. Struct. Eng. 2010, 136, 390–400. [Google Scholar] [CrossRef]
  48. Minelli, F. Plain and Fiber Reinforced Concrete Beams under Shear Loading: Structural Behavior and Design Aspects; Università di Brescia: Brescia, Italy, 2005. [Google Scholar]
  49. Lantsoght, E.O. Database of shear experiments on steel fiber reinforced concrete beams without stirrups. Materials 2019, 12, 917. [Google Scholar] [CrossRef]
  50. Choi, K.-K.; Hong-Gun, P.; Wight, J.K. Shear strength of steel fiber-reinforced concrete beams without web reinforcement. ACI Struct. J. 2007, 104, 12. [Google Scholar]
  51. Narayanan, R.; Darwish, I. Use of steel fibers as shear reinforcement. Struct. J. 1987, 84, 216–227. [Google Scholar]
  52. Swamy, R.; Bahia, H. Influence of fiber reinforcement on the dowel resistance to shear. J. Proc. 1979, 76, 327–356. [Google Scholar]
  53. Li, V.C.; Ward, R.J.; Hamza, A.M. Steel and Synthetic Fibers as Shear Reinforcement. Am. Concr. Instiute 1992, 89, 499–508. [Google Scholar]
  54. Khuntia, M.; Stojadinovic, B.; Goel, S.C. Shear strength of normal and high-strength fiber reinforced concrete beams without stirrups. Struct. J. 1999, 96, 282–289. [Google Scholar]
  55. Greenough, T.; Nehdi, M. Shear behavior of fiber-reinforced self-consolidating concrete slender beams. ACI Mater. J. 2008, 105, 468. [Google Scholar]
  56. Quinlan, J.R. Learning with continuous classes. In Proceedings of the 5th Australian Joint Conference on Artificial Intelligence, Hobart, Tasmania, 16–18 November 1992; pp. 343–348. [Google Scholar]
  57. Wang, Y.; Witten, I.H. Induction of Model Trees for Predicting Continuous Classes; The University of Waikato: Hamilton, New Zealand, 1996. [Google Scholar]
  58. Witten, I.H.; Frank, E. Data Mining: Practical Machine Learning Tools and Techniques, 2nd ed.; Elsevier: Amsterdam, The Netherlands, 2006. [Google Scholar]
  59. Kumar, S.A.; Vijayalakshmi, M. A naive based approach of model pruned trees on learner’s response. Int. J. Mod. Educ. Comput. Sci. 2012, 4, 52. [Google Scholar] [CrossRef]
  60. Ayaz, Y.; Kocamaz, A.F.; Karakoç, M.B. Modeling of compressive strength and UPV of high-volume mineral-admixtured concrete using rule-based M5 rule and tree model M5P classifiers. Constr. Build. Mater. 2015, 94, 235–240. [Google Scholar] [CrossRef]
  61. Ashour, S.A.; Hasanain, G.S.; Wafa, F.F. Shear behavior of high-strength fiber reinforced concrete beams. Struct. J. 1992, 89, 176–184. [Google Scholar]
  62. Zsutty, T.C. Beam shear strength prediction by analysis of existing data. J. Proc. 1968, 65, 943–951. [Google Scholar]
  63. Sarveghadi, M.; Gandomi, A.H.; Bolandi, H.; Alavi, A.H. Development of prediction models for shear strength of SFRCB using a machine learning approach. Neural Comput. Appl. 2019, 31, 2085–2094. [Google Scholar] [CrossRef]
  64. Chaabene, W.B.; Nehdi, M.L. Genetic programming based symbolic regression for shear capacity prediction of SFRC beams. Constr. Build. Mater. 2021, 280, 122523. [Google Scholar] [CrossRef]
  65. Koza, J.R. Genetic Programming: On the Programming of Computers by Means of Natural Selection (Complex Adaptive Systems). A Bradf. Book 1993, 1, 18. [Google Scholar]
  66. Sarıdemir, M. Empirical modeling of splitting tensile strength from cylinder compressive strength of concrete by genetic programming. Expert Syst. Appl. 2011, 38, 14257–14268. [Google Scholar] [CrossRef]
  67. Azamathulla, H.M.; Guven, A.; Demir, Y.K. Linear genetic programming to scour below submerged pipeline. Ocean Eng. 2011, 38, 995–1000. [Google Scholar] [CrossRef]
  68. Alavi, A.H.; Gandomi, A.H. A robust data mining approach for formulation of geotechnical engineering systems. Eng. Comput. 2011, 28, 242–274. [Google Scholar] [CrossRef]
  69. Collins, M.P. Evaluation of Shear Design Procedures for Concrete Structures; A CSA Technical Committee Reinforced Concrete Design Report; Canadian Standards Association: Toronto, ON, Canada, 2001. [Google Scholar]
  70. AbdelAleem, B.H.; Ismail, M.K.; Haggag, M.; El-Dakhakhni, W.; Hassan, A.A. Interpretable soft computing predictions of elastic shear buckling in tapered steel plate girders. Thin-Walled Struct. 2022, 176, 109313. [Google Scholar] [CrossRef]
Figure 1. Relative frequency distribution of key parameters for the datasets.
Fibers 11 00037 g001
Figure 2. M5P algorithm tree for estimating the shear strength of SFRC beams.
Fibers 11 00037 g002
Figure 3. Cross plots of the proposed M5P correlations for both training and testing datasets.
Fibers 11 00037 g003
Figure 4. Comparison of the predictions generated by the M5P-tree-based model with the experimental measurements of the shear strength for both training and testing datasets.
Fibers 11 00037 g004
Figure 5. M5P box plot for the five-folds cross validation results.
Fibers 11 00037 g005
Figure 6. Comparison of shear strength between experimental outcomes and various computational techniques: (a) Ashour et al. [61], (b) Khuntia et al. [54], (c) Sabetifar and Nematzadeh [35] (d) Sarveghadi et al. [63], (e) Chaabene and Nehdi [64], (f) proposed M5P model.
Fibers 11 00037 g006
Figure 7. Illustration of the ratio between Vactual/VM5P displayed using histograms.
Fibers 11 00037 g007
Figure 8. A box plot illustrating the distribution of actual-to-predicted strength ratios for the shear strength of SFRC beams [35,54,61,63,64].
Fibers 11 00037 g008
Figure 9. Statistical distribution of Vexp/VM5P for all M5P equations.
Fibers 11 00037 g009
Figure 10. Relationship between Vexp and VM5P for all M5P equations.
Fibers 11 00037 g010
Table 1. Summary of the statistical attributes for the input parameters gathered from the available experimental datasets.
Data CategoryStatisticsbw (mm) *d (mm) *ρ *a/d *fc (MPa) *Fst *Vu (kN) *
Training dataStandard deviation64.104176.6060.0100.63925.9930.336154.425
Mean157.429283.0450.0263.36749.3900.552152.166
Median150.000251.0000.0273.44041.0000.503110.000
Maximum610.0001118.0000.0576.000215.0002.8651081.000
Minimum55.00085.2500.0042.5009.7700.10213.000
Testing dataStandard deviation77.563181.8790.0080.63826.2160.322199.085
Mean161.291284.6930.0243.33848.0050.513157.588
Median150.000251.0000.0243.40040.2100.450108.500
Maximum600.000920.0000.0486.000215.0002.0001481.000
Minimum55.00085.2500.0102.50019.6000.10216.000
* bw = beam width; d = beam effective depth; fc = concrete strength; ρ = longitudinal reinforcement ratio; a/d = ratio of the shear span to the effective depth; Fst = steel fiber factor; Vu = shear capacity.
Table 2. Coefficients for Equation (4) predicted from the model tree.
Linear ModelCoefficient
a b c d e f g
LM10.05940.86240.94840.5095−0.74240.17990.1105
LM20.09031.15910.46550.6299−0.64990.48440.117
LM30.05661.00620.38970.2336−0.23450.47270.3405
LM40.03010.51631.15440.4401−0.3600.38810.2199
Table 3. Reference beam attributes from the testing dataset.
Vu(exp) (kN)bw (mm)d (mm)ρa/dfc (MPa)Fst
2201523810.02713.449.20.8
Table 4. Performance of the M5P model in predicting the shear strength for training and test datasets.
StatisticsRMSE (kN)R R2
Training33.9240.9760.952
Testing37.3070.9840.969
Total38.5630.9770.955
Table 5. Accuracy of earlier models for predicting the shear strength in comparison with M5P.
Predicted ModelRMSE R2Statistical Properties of Vactual/VM5P
x ¯ SDCOV%MinMax
Khuntia et al. [54]42.71040.89171.49630.453630.320.17354.0345
Ashour et al. [61]76.68930.85951.11950.372033.230.23273.1421
Sabetifar and Nematzadeh [35]61.84670.93071.01460.245424.190.19742.0038
Sarveghadi et al. [63]88.32060.91331.00070.271227.100.22672.2046
Chaabene and Nehdi [64]38.20460.92941.11930.249222.270.40622.1188
M5P in this study38.56330.95541.01600.162716.010.54071.7182
Table 6. Classification by demerit points.
Vactual/VpredictedClassificationDemerit Points
< 0.50 Extremely dangerous10
[ 0.50 0.85 ) Dangerous5
[ 0.85 1.15 ) Appropriate and safe0
[ 1.15 2.00 ) Conservative2
2.00 Extremely conservative1
Table 7. Categorization of the proposed and earlier models based on Collins criteria.
Model V a c t u a l V p r e d i c t e d < 0.50 0.5     V a c t u a l V p r e d i c t e d < 0.85 0.85     V a c t u a l V p r e d i c t e d < 1.15 1.15     V a c t u a l V p r e d i c t e d < 2 V a c t u a l V p r e d i c t e d > 2 Demerit Points
Khuntia et al. [54]4154224724410
4 × 1015 × 542 × 0247 × 124 × 2
Ashour et al. [61]10571301277526
10 × 1057 × 5130 × 0127 × 17 × 2
Sabetifar and Nematzadeh [35]967169861513
9 × 1067 × 5169 × 086 × 11 × 2
Sarveghadi et al. [63]784158821574
7 × 1084 × 5158 × 082 × 11 × 2
Chaabene and Nehdi [64]1411501382357
1 × 1041 × 5150 × 0138 × 12 × 2
This study-46232540284
0 ×1046 × 5232 × 054 × 10 × 2
Disclaimer/Publisher’s Note: The statements, opinions and data contained in all publications are solely those of the individual author(s) and contributor(s) and not of MDPI and/or the editor(s). MDPI and/or the editor(s) disclaim responsibility for any injury to people or property resulting from any ideas, methods, instructions or products referred to in the content.

