Article

Influences of Magnetization Direction on the Flux Leakage Field of Weld Defects

1
School of Intelligent Engineering, Nanjing Institute of Railway Technology, Nanjing 210031, China
2
College of Automation Engineering, Nanjing University of Aeronautics and Astronautics, Nanjing 211000, China
*
Author to whom correspondence should be addressed.
Coatings 2023, 13(6), 1005; https://doi.org/10.3390/coatings13061005
Submission received: 19 April 2023 / Revised: 22 May 2023 / Accepted: 23 May 2023 / Published: 29 May 2023

Abstract

:
The magnetic flux leakage (MFL) detection technique is applied to the detection of weld defects, such as cracks and pores. As the weld has a distinct structure, there are differences in the magnetization path and leakage field intensity under different magnetization directions. According to surveys, a suitable magnetization direction can significantly enhance detection rates of small-sized defects by stimulating a stronger field signal of the defect leakage. In this study, ANSYS finite element simulation software is used to calculate the weld defect leakage field based on the quantitative analysis. Specifically, the leakage field component strengths of circular hole defects and longitudinal rectangular groove defects are compared when the magnetization direction is perpendicular or parallel to the weld. Furthermore, the characteristic rules of the defect leakage field and its components under any magnetization direction are discussed, and a weld MFL detection platform is set up for validation. According to the experimental results, the amplitude of the magnetic leakage signal during vertical magnetization of circular hole defects is only 18.6% of that during parallel magnetization. Similarly, the amplitude of the magnetic leakage signal during parallel magnetization of longitudinal crack-type defects is only 9.2%~29.3% of that during vertical magnetization.

1. Introduction

Weld defects occur due to various factors, such as welding materials, processes, and human error. Hence, regular weld inspection is important to ensure welding quality. Ultrasound detection [1] and radiographic detection [2] are common detection methods for welds. The magnetic flux leakage (MFL) detection method can detect typical weld defects, such as cracks and pores formed during welding processes. Thus, it is suitable for detecting weld defects.
The MFL detection technique is a non-destructive method based on the changes of magnetic permeability at the location of defects in magnetized objects. A magnetic sensor is used to detect the flux leakage field at the position of the defects. This method has a few advantages, including high detection accuracy, quick detection speed, a straightforward structure, and no requirement for coupling agents. It is particularly effective for detecting surface and near-surface defects in ferromagnetic materials [3,4]. During MFL detection of pipeline circumferential welds, the detector is usually placed inside the pipeline and is oriented perpendicular to the weld for optimal detection [4]. For the automated online detection of sheet steel welds, detecting along the welding direction can improve detection efficiency and resolve issues associated with sudden changes in lift-off values when detecting perpendicularly oriented welds, which can cause distorted leakage magnetic signals.
The magnetization direction of the material is typically the same as the detection direction in classic MFL detection, such as in pipelines [4,5], steel pipe [6,7,8,9], and rail detection [10,11] regardless of the magnetization method utilized (permanent magnet, DC, AC, or pulse). Axial magnetization was employed by Shi et al. [4] to discover pipeline defects, which saturated the pipeline’s defect position. Mao et al. [6] used saddle coils to magnetize the local area of the pipe wall in steel pipe detection. Fotiadou et al. [8] leveraged a circumferential coil to perform magnetization across the entire section of the steel pipe and investigated the process of building a saturation magnetic field. Lepage and Brillon [10] used a U-shaped magnetic yoke in order to magnetize the rail head to improve the detection of transverse cracks on the rail surface. The main reasons for using this direction of magnetization are as follows:
(1)
The extension direction of cracks and other defects in pipelines and rails is usually close to 90° to the detection direction, and magnetization in this direction is conducive to generating a stronger flux leakage field at lateral defects [12,13].
(2)
To improve detection efficiency, the detection device usually operates at high speeds. The material becomes saturated with magnetism using this method [4,7,10].
(3)
Due to its mechanical structure, the detection device has a simple implementation and installation process [14].
However, the detection and recognition capability of longitudinal defects is low when directional magnetization is adopted [5], particularly for long and narrow defects. To address longitudinal defect detection, transverse magnetization is used to enhance the MFL signal. Yu Chao et al. [14] utilized a circumferential multi-pole method to uniformly magnetize the pipeline in the circumferential direction for detecting the pipeline magnetic leakage while Dutta et al. [15] used a magnetic guide plate to uniformly magnetize the steel pipe in the circumferential direction for detecting steel pipe MFL, which enhanced the detection capability for longitudinal cracks.
Common defects in welds include crack-like defects (such as cracks, incomplete fusion, and incomplete penetration) and volumetric defects (such as porosity and slag inclusions). Crack-like defects often have a planar shape and extend in the same direction as the weld, whereas volumetric flaws have a pointy appearance and are cylindrical in shape. Therefore, weld defects have different types since the weld surface is not flat and may differ significantly from other components (e.g., pipelines). However, there is little discussion of specific components such as welds in the literature on the influence of magnetization direction on the flux leakage field of defects, which is only applicable to components with a smooth surface. The primary focus of this study is to examine how magnetization direction impacts the flux leakage field strength of different types of weld defects under material saturation magnetization conditions. The research results can improve the theory of defect flux leakage field distribution and provide useful advice for designing MFL detection devices that work well.

2. Magnetic Field Distribution Characteristics in Different Magnetization Directions

The distribution of the magnetic field is unaffected by the direction of magnetization when magnetizing materials that are devoid of surface imperfections and flaws because the magnetic field lines are uniformly confined inside the ferromagnetic material regardless of the direction of magnetization. In weld detection, when magnetization in different directions is adopted, the magnetization path is no longer continuous and smooth, and the uplift occurs when the weld surface is passed. When the base metal and weld both have smooth surface features, the magnetic field distribution is examined for two distinct magnetic directions that are parallel and perpendicular to the weld.
The magnetic flux distribution of the weld center section with parallel magnetization is shown in Figure 1a. Region a has an air permeability of μ a , while region b has a magnetic permeability of μ b ( μ b   is   much   larger   than   μ a ) due to the ferromagnetic material. According to magnetic circuit theory, when a magnetic field with a total magnetic flux of Φ is applied by the magnetizer, the equation is shown as follows:
Φ = Φ a + Φ b
where,
  • Φ a = the magnetic flux within the ferromagnetic material;
  • Φ b = the magnetic flux that leaks into the air during the magnetization process.
As ferromagnetic materials exhibit no irregular variations, the magnetic field lines within and on the surface of the material are distributed uniformly. The magnetic flux density, B a and B b , remains almost constant along the magnetization path, and its distribution characteristics are like those of a flat ferromagnetic material surface.
Figure 1. The magnetic flux distribution in different magnetization directions.
Coatings 13 01005 g001
The magnetic flux distribution of the perpendicular weld section under perpendicular magnetization is shown in Figure 1b. As the material thickness and area grow at the weld position along the magnetization path, the magnetic reluctance R b at the weld position decreases according to the formula R = l / μ S . Therefore, the magnetic flux Φ b and magnetic flux density B b in the ferromagnetic material increase, while the magnetic flux Φ a and magnetic flux density B b in the air decrease. In the distribution of the magnetic field, the magnetic flux lines in the air and ferromagnetic material exhibit a deviation towards the weld.
According to the analysis above, there are two main types of leakage magnetic components that occur from the “depressed” and “bumped” portions of ferromagnetic materials. These components make up the flux leakage field that develops after material magnetization. Furthermore, this component acts as an “offset” to the background magnetic field, and it plays an opposite role to the effect of the defect leakage magnetic component. The flux leakage field B s e n s i n g measured using a magnetic sensor placed above the weld surface can be expressed as Equation (2), assuming no influence by factors such as magnetic hysteresis [8] or eddy current effects [7] resulting from dynamic magnetization.
B s e n s i n g = B b a c k g r o u n d B b u m p + B d e f e c t
where:
  • B b a c k g r o u n d = the magnetic field leaked into the air during the magnetization process;
  • B b u m p = the flux leakage field caused by material bumps;
  • B d e f e c t = the flux leakage field caused by material defects.
In the absence of defects, the magnetic field B p a r a generated by parallel magnetization and the magnetic field B p e r p generated by perpendicular magnetization can be expressed as Equations (3) and (4), respectively.
B p a r a = B b a c k g r o u n d
B p e r p = B b a c k g r o u n d B b u m p
The foregoing discussion relates to two special cases of horizontal magnetization angle, i.e., the minimum and maximum values. If the magnetization angle is between these two, then the total applied magnetic field B 0 can be expressed as the vector sum of two orthogonal magnetic field components, namely, B 0 ,   H and B 0 ,   V . The flux leakage field B s e n s i n g over the defect can be expressed as a superposition of the flux leakage fields excited by the B 0 magnetic field components.
B 0 = B 0 ,   H + B 0 ,   V B 0 ,   H = B 0 × c o s α B 0 ,   V = B 0 × s i n α
B s e n s i n g = B H + B V
where:
  • α = the angle between the magnetization direction and the welding direction;
  • B H = the flux leakage field produced by the parallel component,   B 0 ,   H , of the magnetic field;
  • B V = the flux leakage field produced by the perpendicular component, B 0 ,   V , of the magnetic field.
As a result, under different magnetization orientations, different magnetic field distributions emerge during weld detection. Different intensities of the flux leakage field B d e f e c t . are produced by weld defects with the same amounts of damage. This affects the sensor signal’s amplitude and signal-to-noise ratio, and signal amplitude is a measurement used to assess the system’s detection performance in MFL detection applications.
This paper aims to quantitatively analyze the amplitude of the flux leakage field B d e f e c t caused by weld defects based on finite element simulation.

3. Simulation Analysis of Weld Flux Leakage Field Distribution

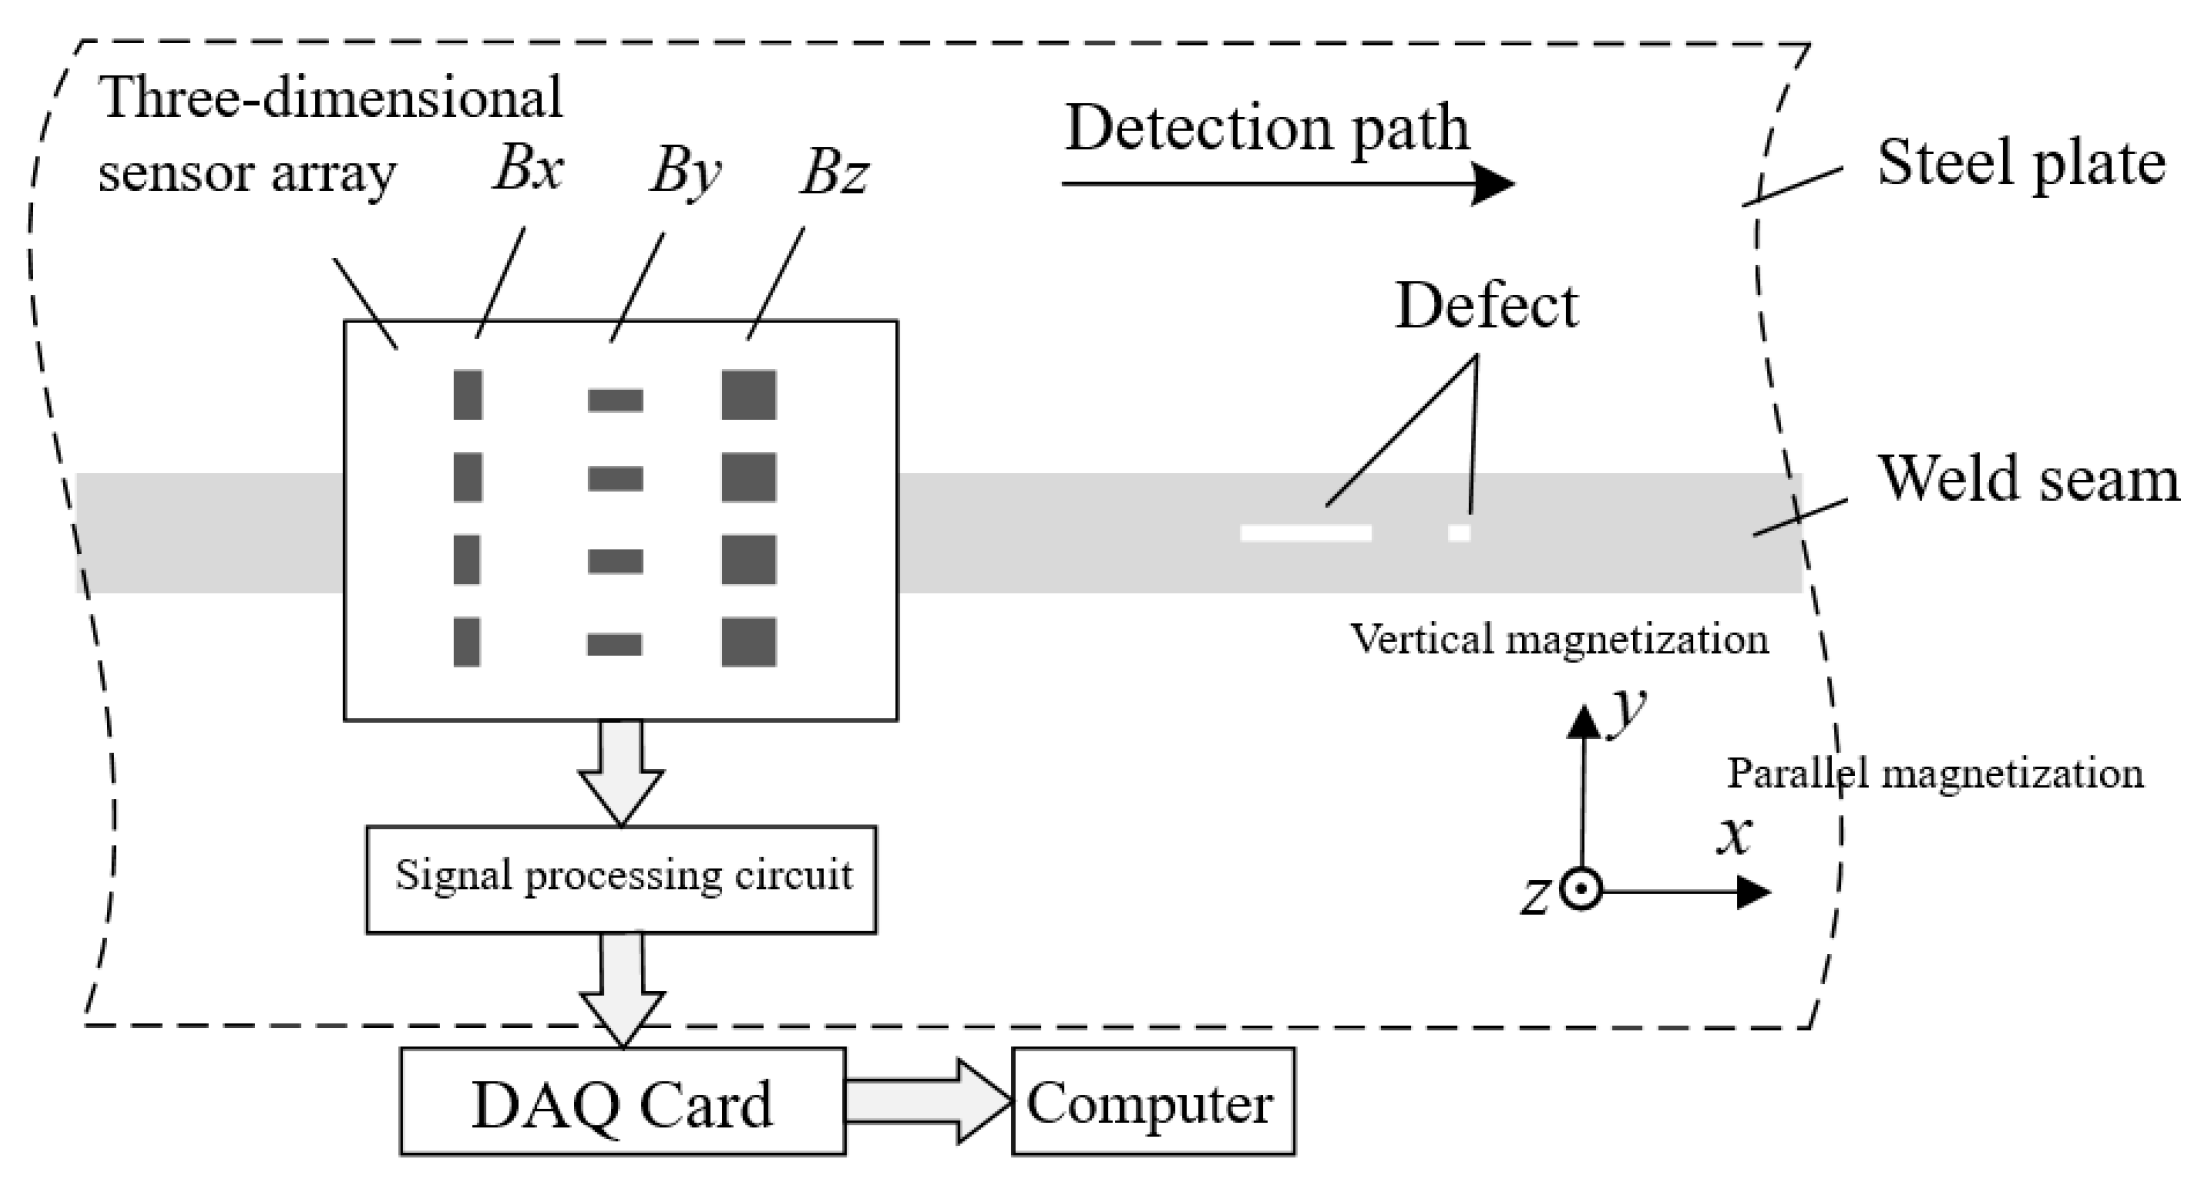
3.1. Construction of Finite Element Models

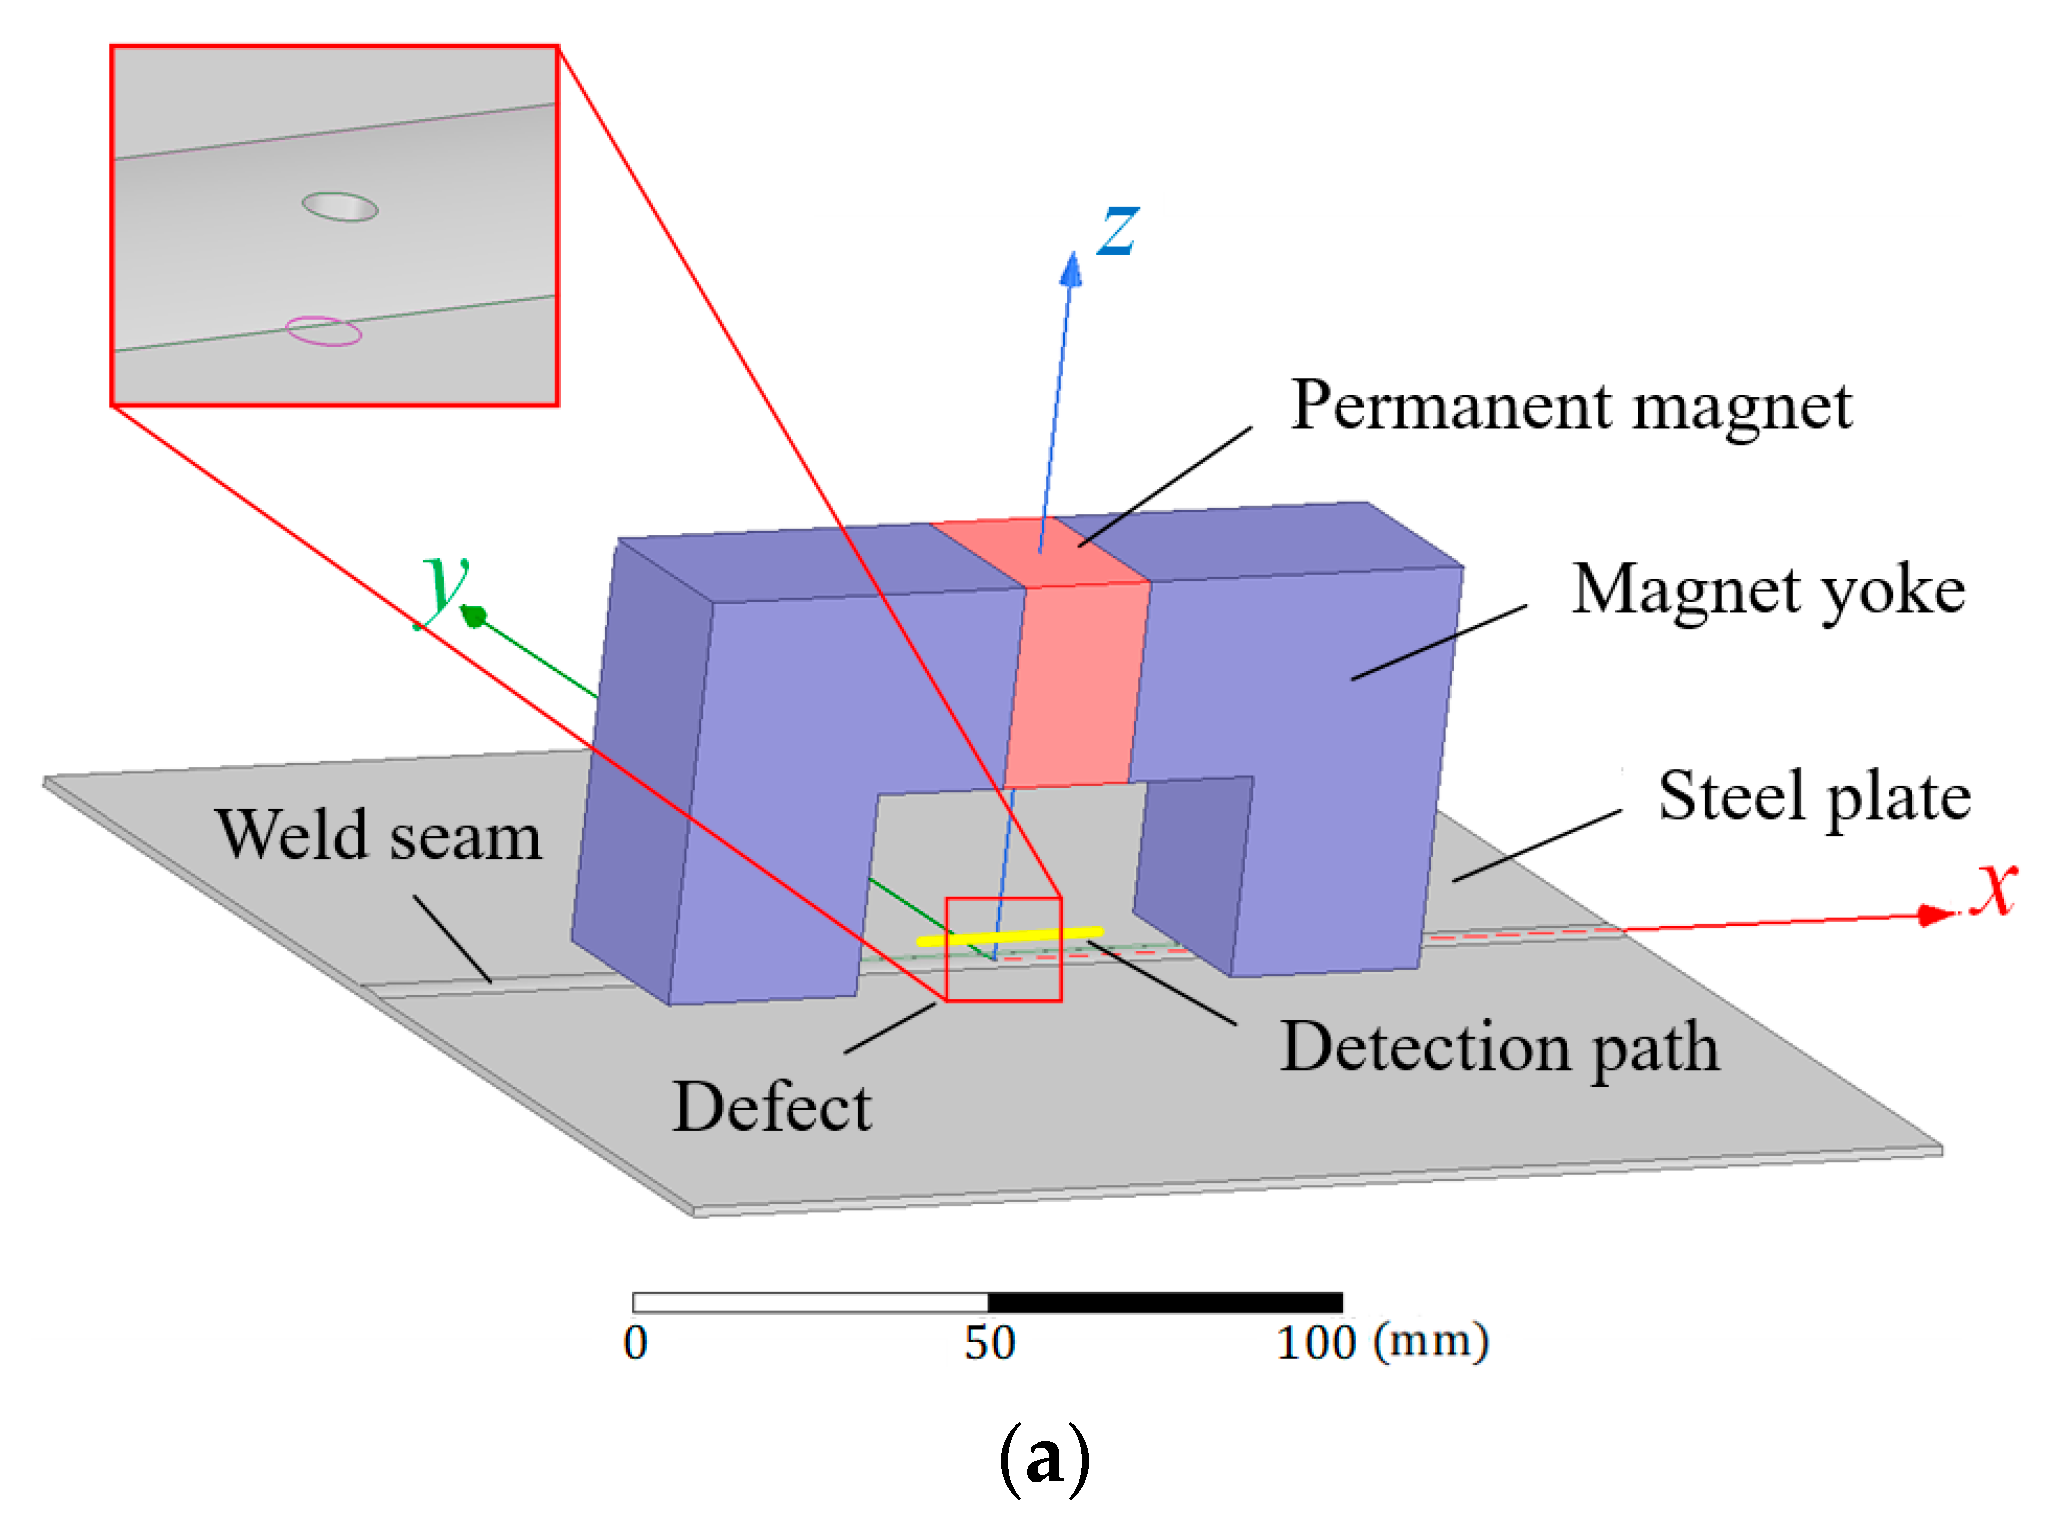
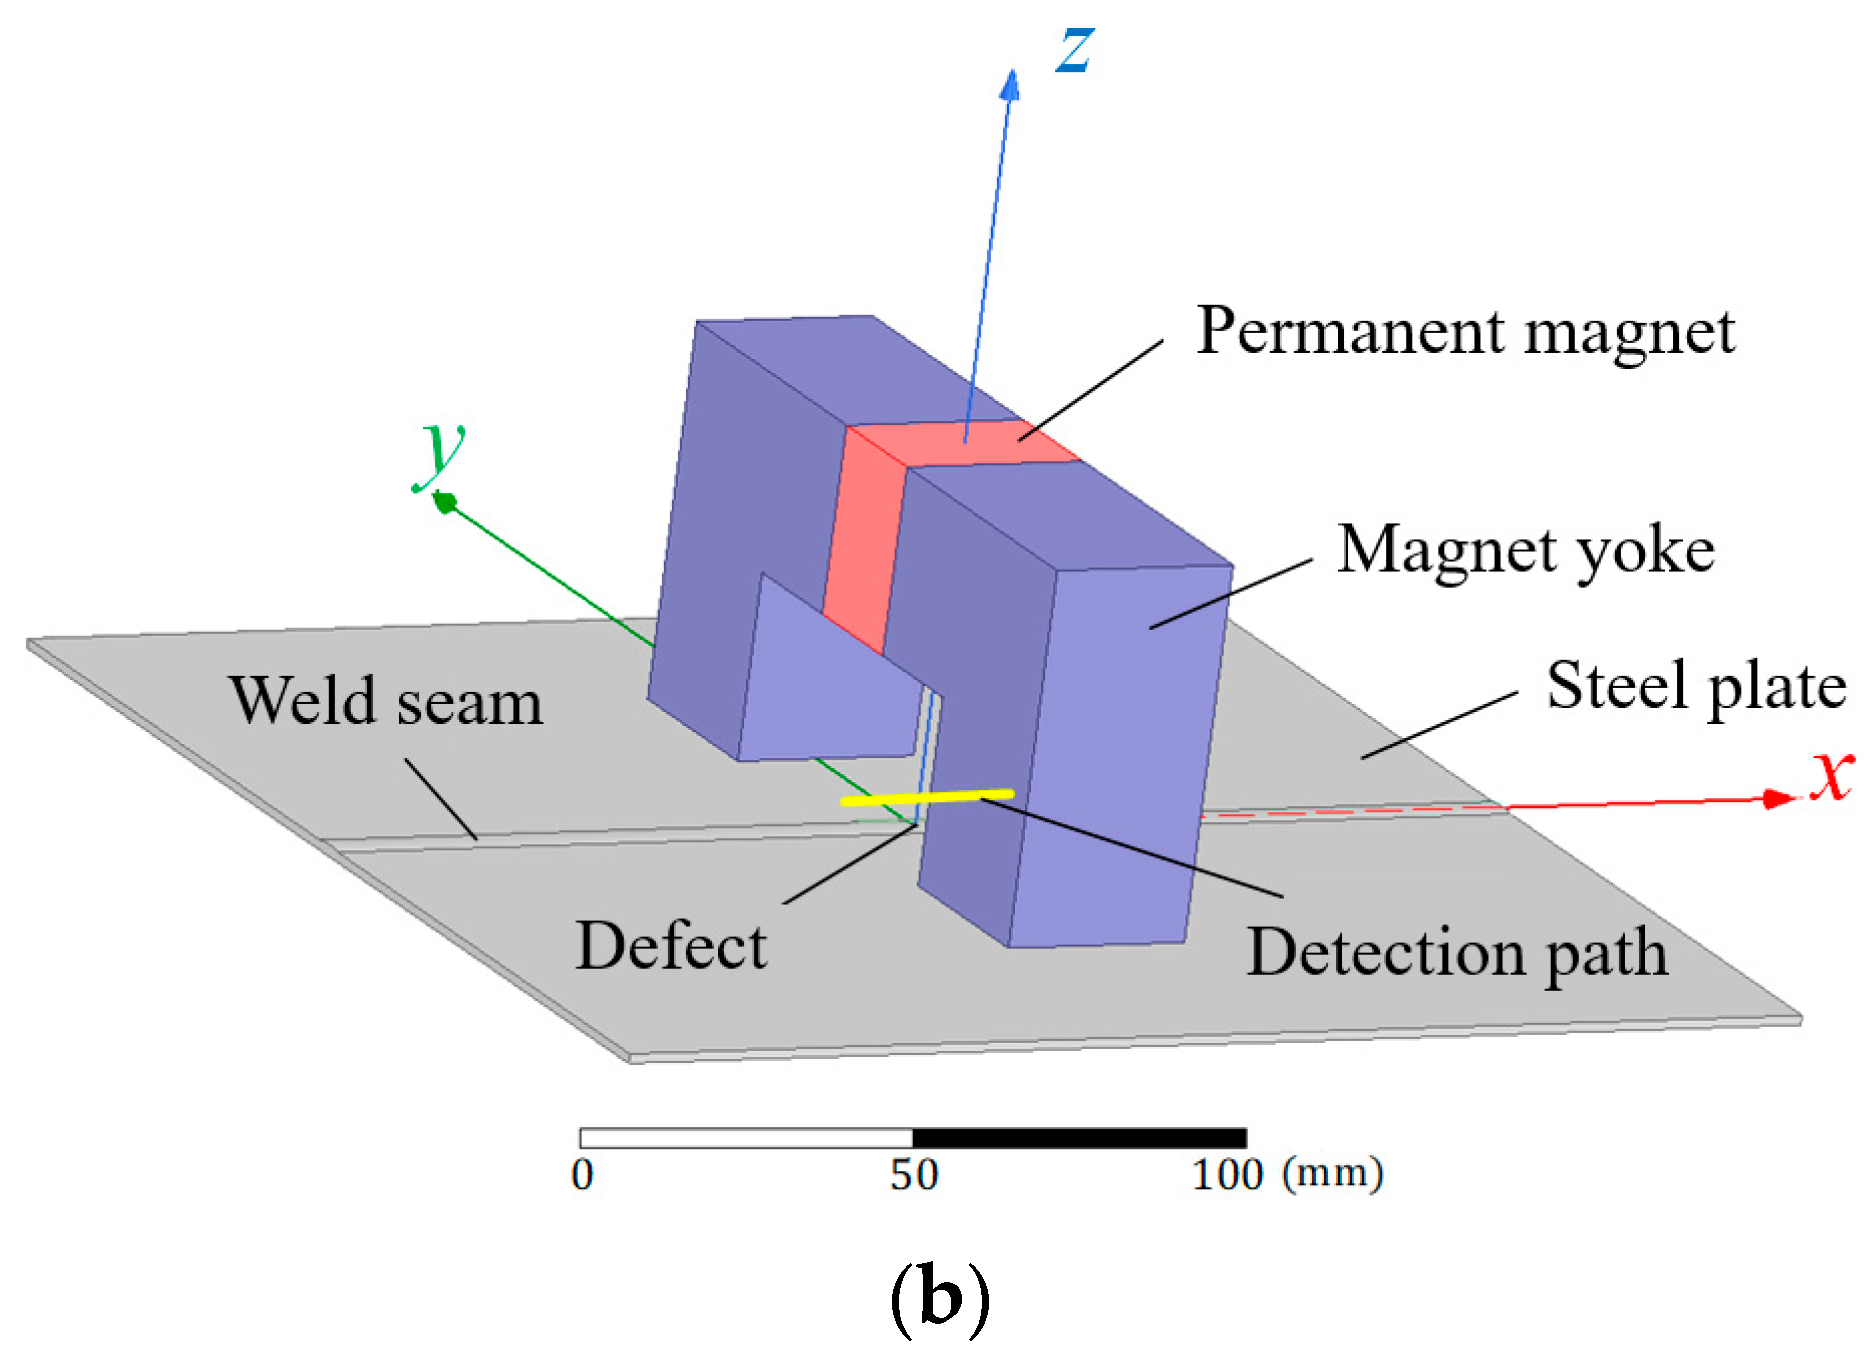
The magnetic field distribution of the weld is computed using the ANSYS Maxwell finite element simulation. Ansys is based in Pittsburgh, Pennsylvania, and the simulation used in this article is version 16.0. A three-dimensional static magnetic field model is utilized using the weld detection structure model. The structure model is shown in Figure 2.
The magnetic field model in this study assumes that the weld is aligned along the x-axis, while the weld perpendicular to the sheet steel plane is assumed to be aligned along the y-axis and the sheet steel plane’s outward normal direction is assumed to be aligned along the z-axis. Two magnetization models, respectively oriented along the x- and y-axes, are established. The magnetic flux density is represented by the x-, y -, and z- components are denoted as B x , B y , and B z . The magnetic B s e n s i n g   sensing is measured at x-coordinate points between −10 and 10 mm (where y = 0 mm, z = 1 mm, and x = −10 to 10 mm), using a detection line 20 mm long that is positioned at the middle of the weld and 1 mm from the sheet steel surface.
Table 1 presents the model parameters based on the actual dimensions of the sheet and weld. The butt weld is made with a cross-section that is shaped like an arc, with a surface width of 6 mm and a height of 0.3 mm. The butt weld’s material properties are chosen to be consistent with those of the base metal, in this instance Q235 steel. A permanent magnet positioned in the middle of the magnetic yoke arm produces the magnetic field. With a 1 mm air gap, the magnetic yoke magnetizes both the sheet steel and the weld. The permanent magnet is composed of NdFe30 with a coercivity of 838 kA/m, while the magnetic yoke is made of ferrite material to achieve the saturation magnetization of the sheet steel and weld. The simulation calculates the magnetic field   B s e n s i n g for various sizes of circular hole and rectangular groove defects at a lift-off distance of 1 mm.

3.2. Analysis of Simulation Results

(1) The distribution characteristics of a defect-free flux leakage field
Simulations are performed for the two models to obtain the flux leakage fields   B p a r a and   B p e r p above a defect-free weld with a lift-off value of 1 mm. Figure 3 displays a magnetic induction contour map in a 12 mm by 12 mm area, with the surface position of the weld indicated in a 12 mm by 6 mm area by the black dashed box.
As depicted in Figure 3a, due to the structure of the U-shaped magnet yoke, the variation of the flux leakage field in the x direction is only 16%, and the magnetic field is the weakest at the center position of the magnet yoke. Meanwhile, the change in the flux leakage field inside and outside the weld surface is negligible in the 
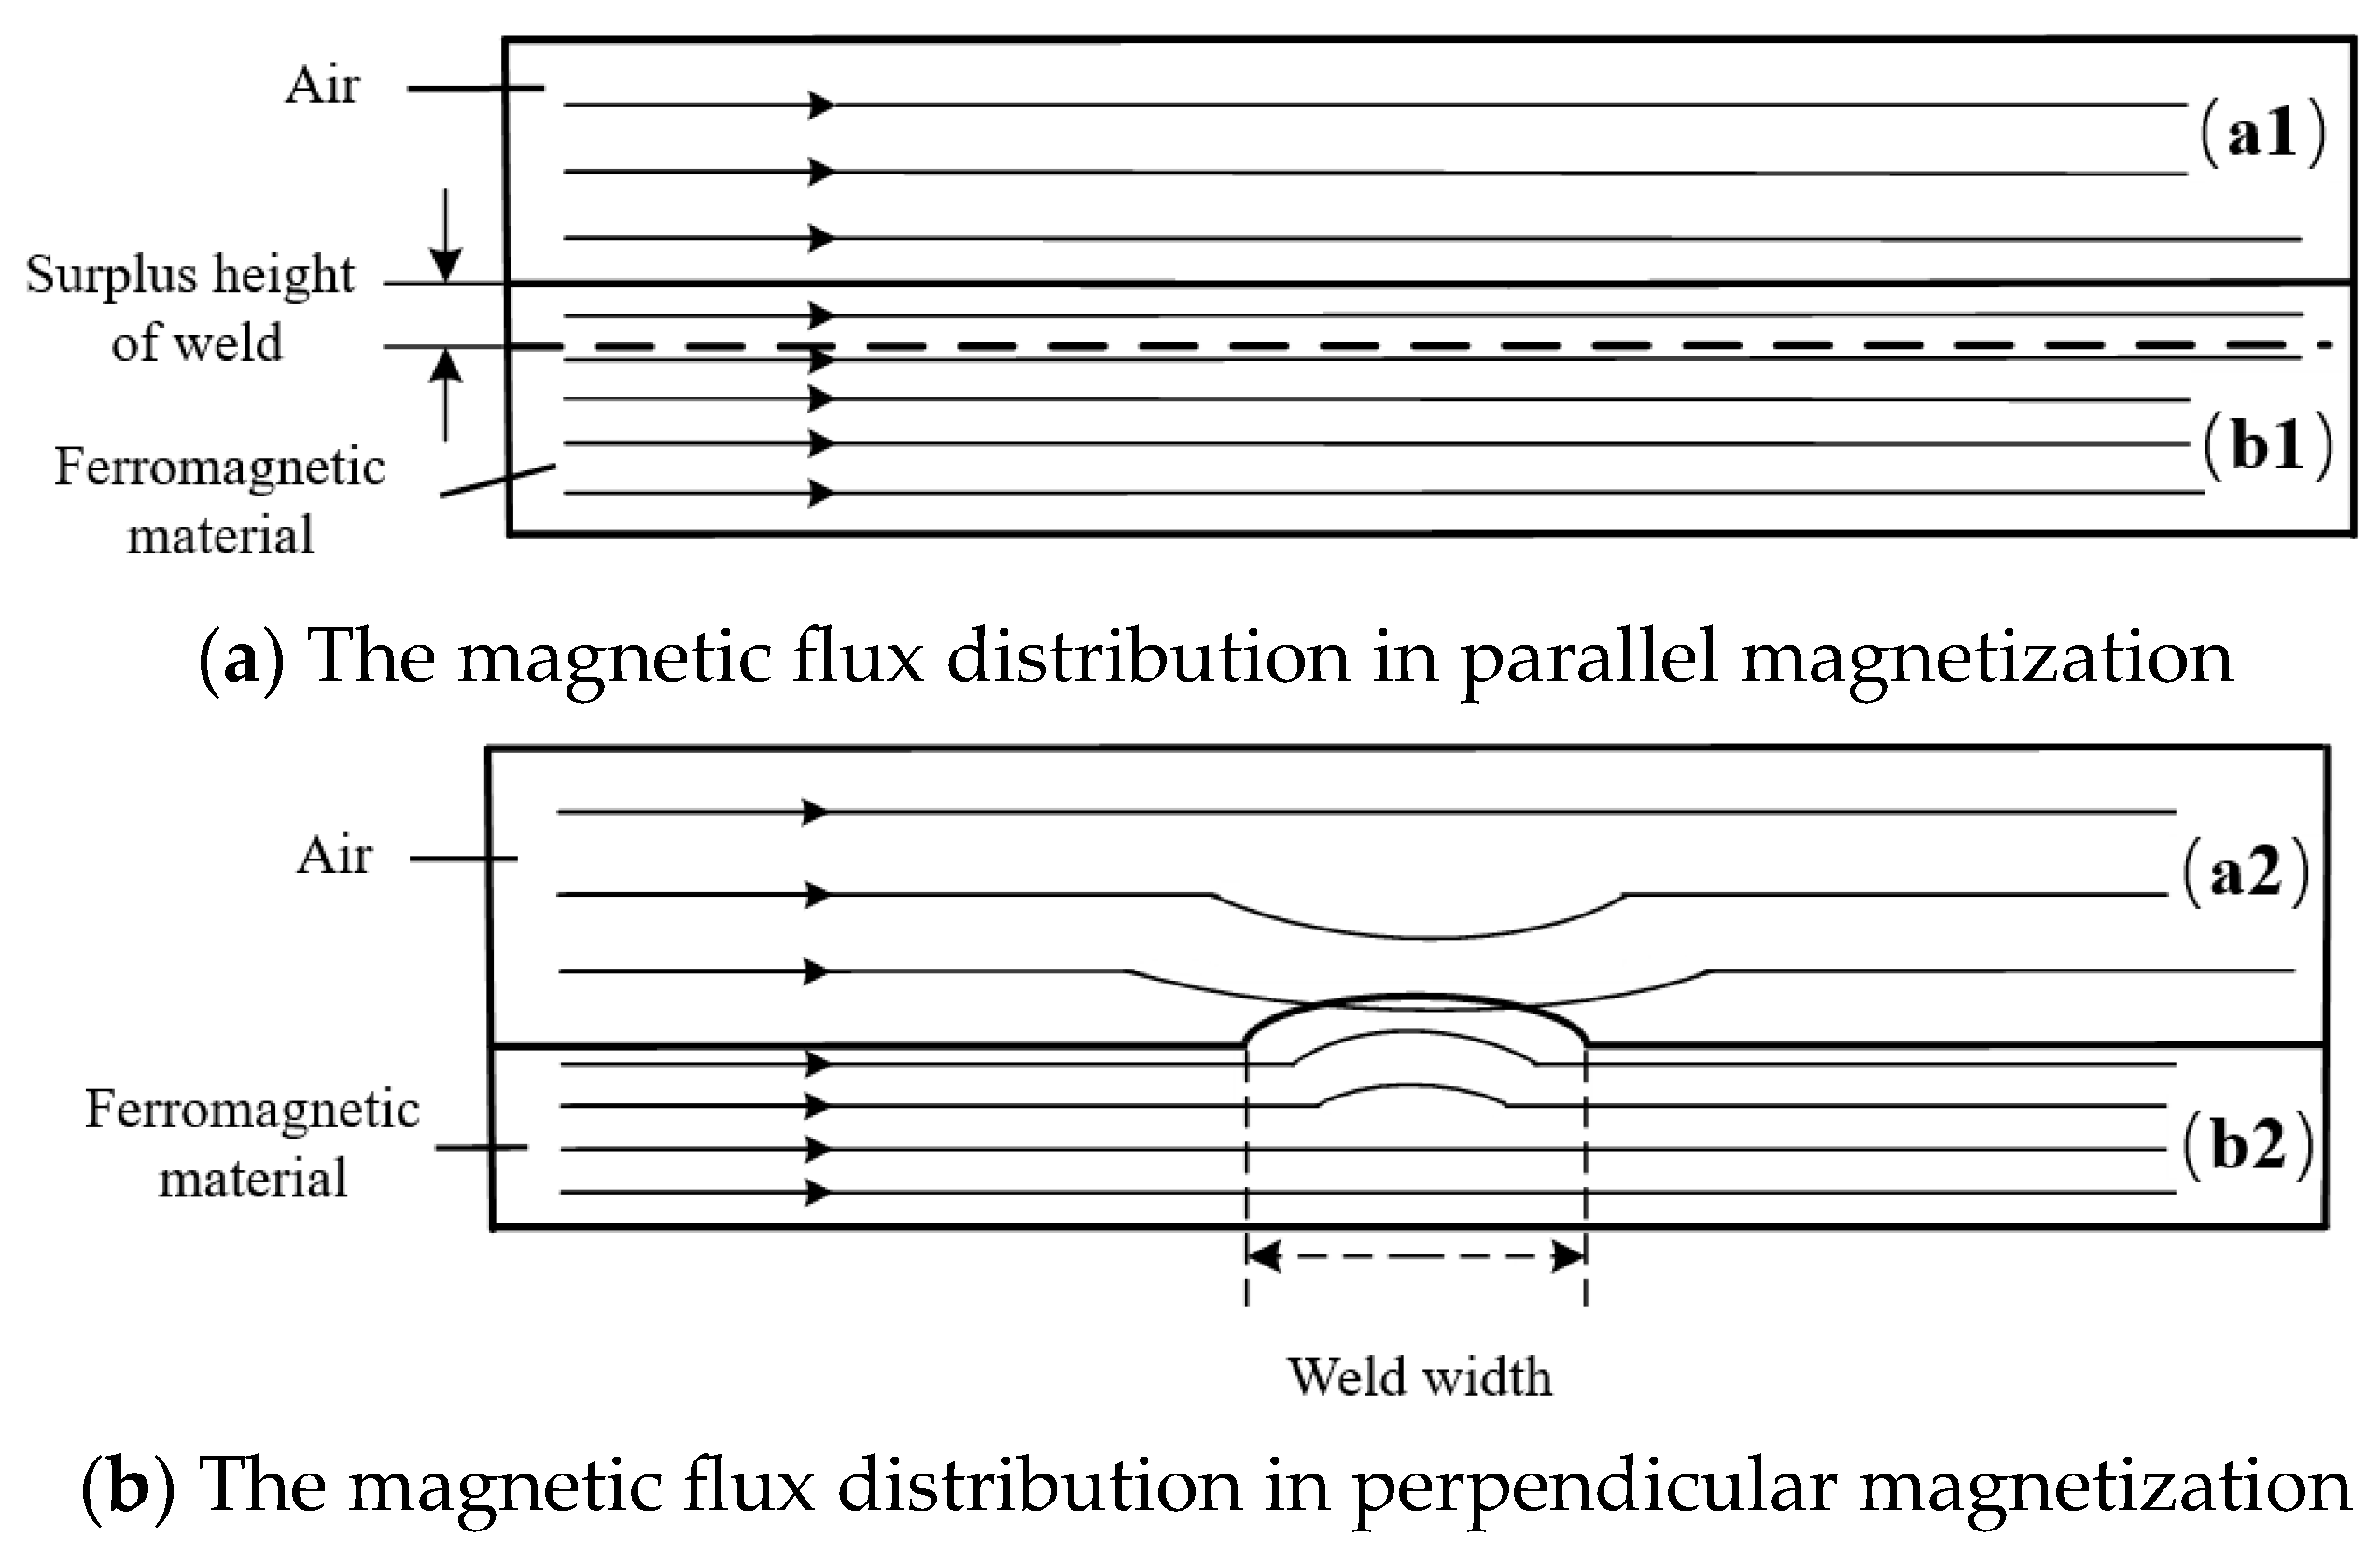
y direction. Generally speaking, the leakage magnetic field distribution of the weld seam using parallel magnetization is uniform, only including the background magnetic field, and the magnetic induction intensity is about 150 Gs. Figure 3b indicates that when magnetized in the perpendicular direction, the flux leakage field in the y direction towards the center of the weld descends rapidly, and the flux leakage field at the edge of the weld decreases from 220 to 70 Gs at the position of the centerline of the weld. At the edge of the weld, the flux leakage field begins to decrease, which is consistent with the theoretical study outlined in the previous section.
When the weld is magnetized in the parallel direction, the magnetic field distribution is akin to that of a flat surface material. In contrast, magnetization of the weld in the perpendicular direction leads to “bumps” on the magnetization path and a reduction in magnetic resistance at that location. This decrease results in a decline of the flux leakage field above the weld. To obtain the flux leakage field B d e f e c t   caused by defects, the flux leakage field B s e n s i n g   components should be subtracted from the corresponding magnetic field components, without defects ( B p a r a or B p e r p ), for quantitative analysis.
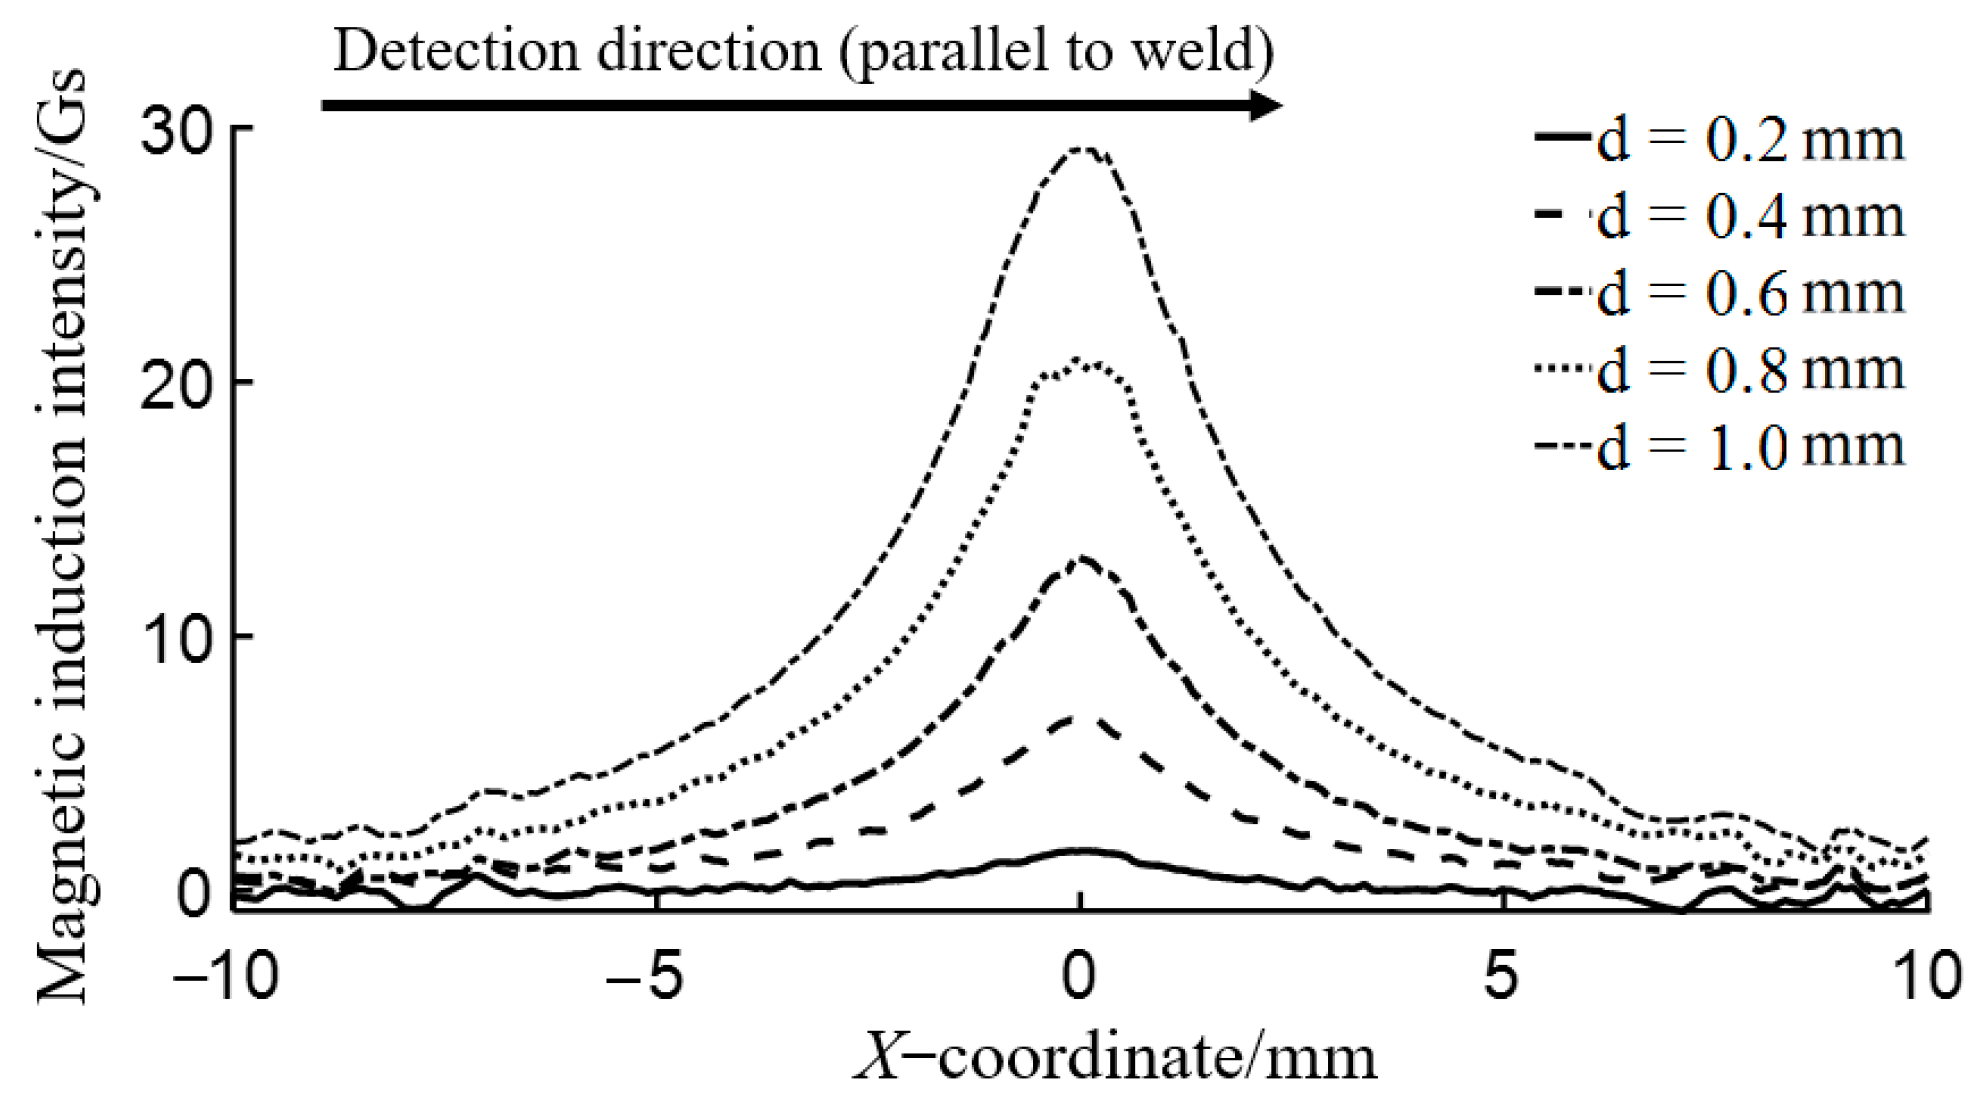
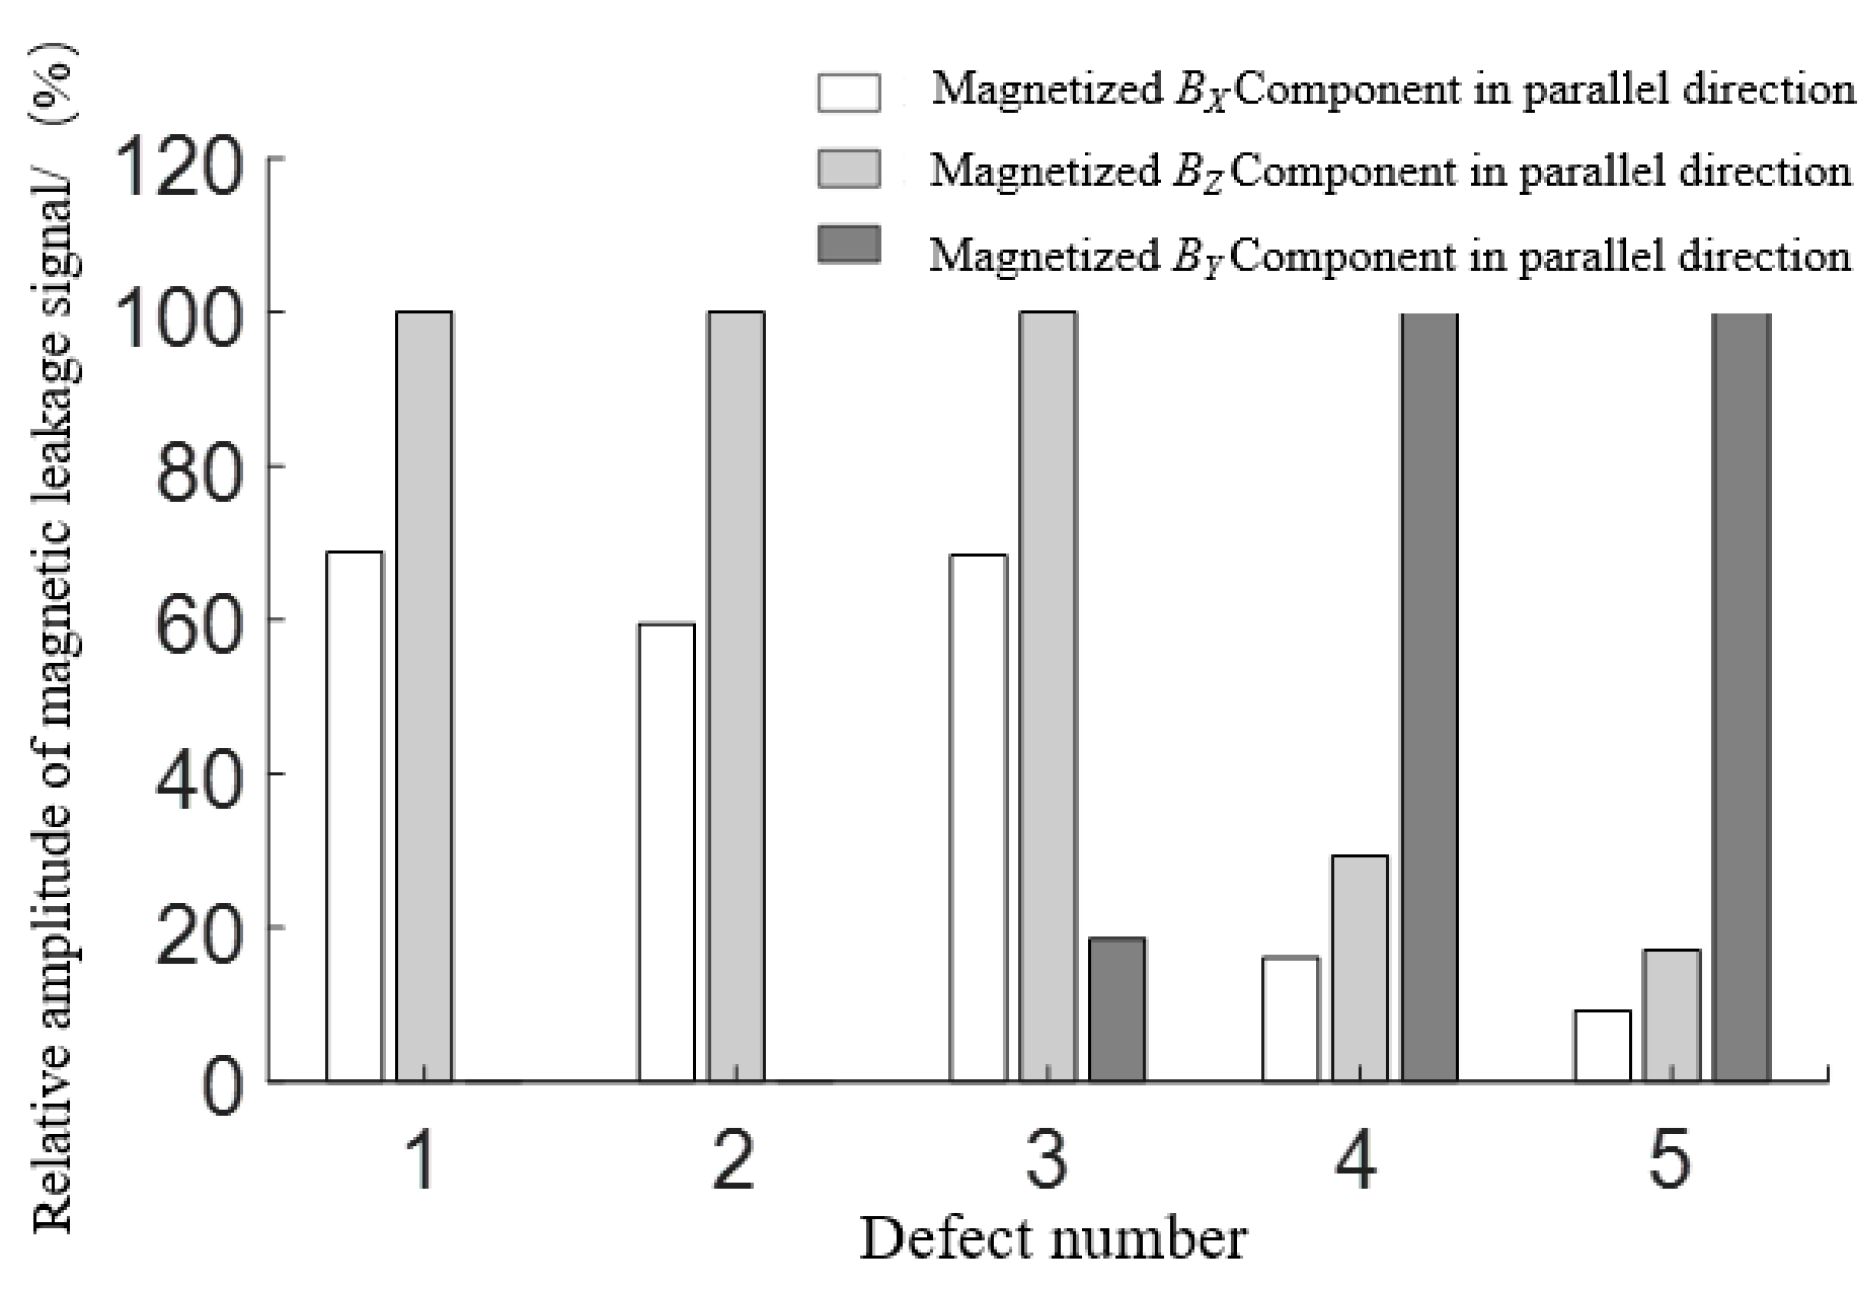
(2) Flux leakage field comparison of circular hole defects
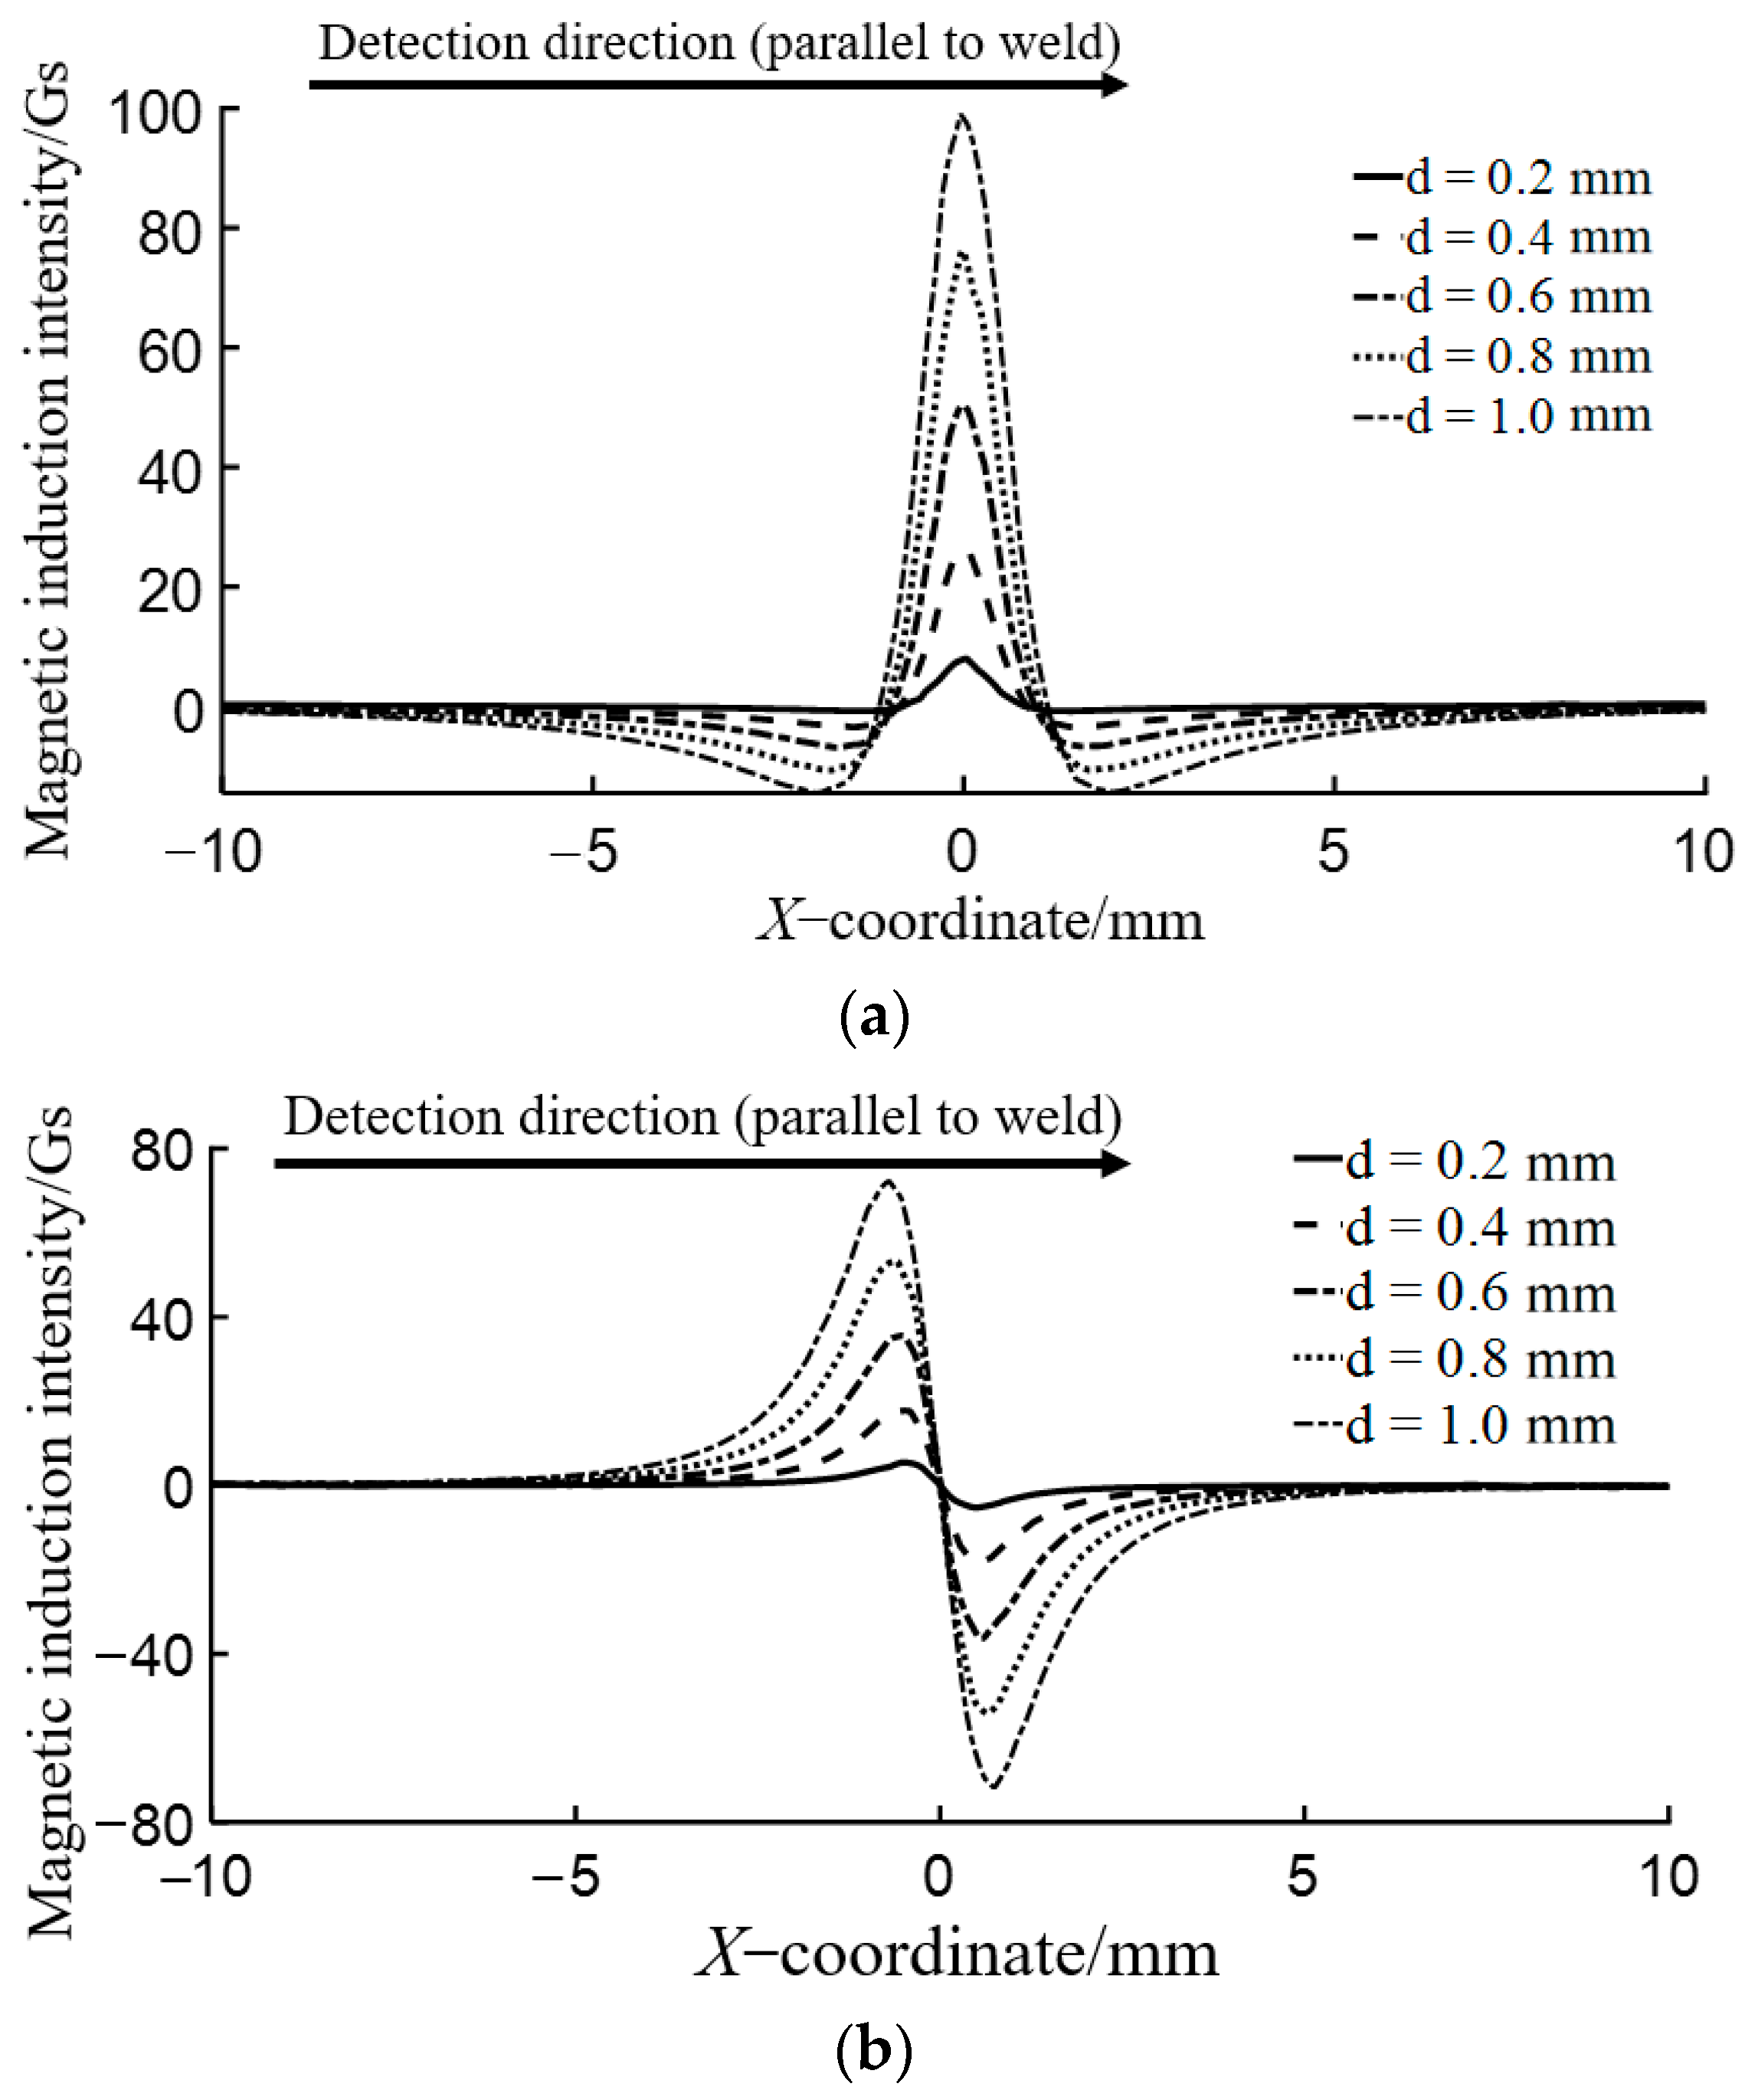
Crack-like defects and volumetric defects, which resemble rectangular grooves and round holes, respectively, make up the majority of typical weld flaws. Therefore, this study primarily focuses on the simulation and analysis of these two types of defects to compare the flux leakage fields under two different magnetization directions. For circular hole defects, when the depth is fixed at 1.8 mm (passing through the weld), simulations are carried out for different diameters (0.2, 0.4, 0.6, 0.8, and 1.0 mm), and the flux leakage field caused by the defect   B d e f e c t at the detection line is calculated using Equation (2). Among them, the amplitude of the parallel magnetic field component B y and the perpendicular magnetic field components B x and B z are negligible, so no analysis is performed.
The flux leakage fields of defects with parallel magnetization in the B x and B z components are illustrated in Figure 4. The B x component of the leakage field exhibits a single-peak signal with negative side lobes, whereas the B z component shows a double-peak signal with positive and negative lobes. Figure 5 depicts the B y component of the leakage field for defects with perpendicular magnetization, which exhibits a single-peak signal without side lobes.
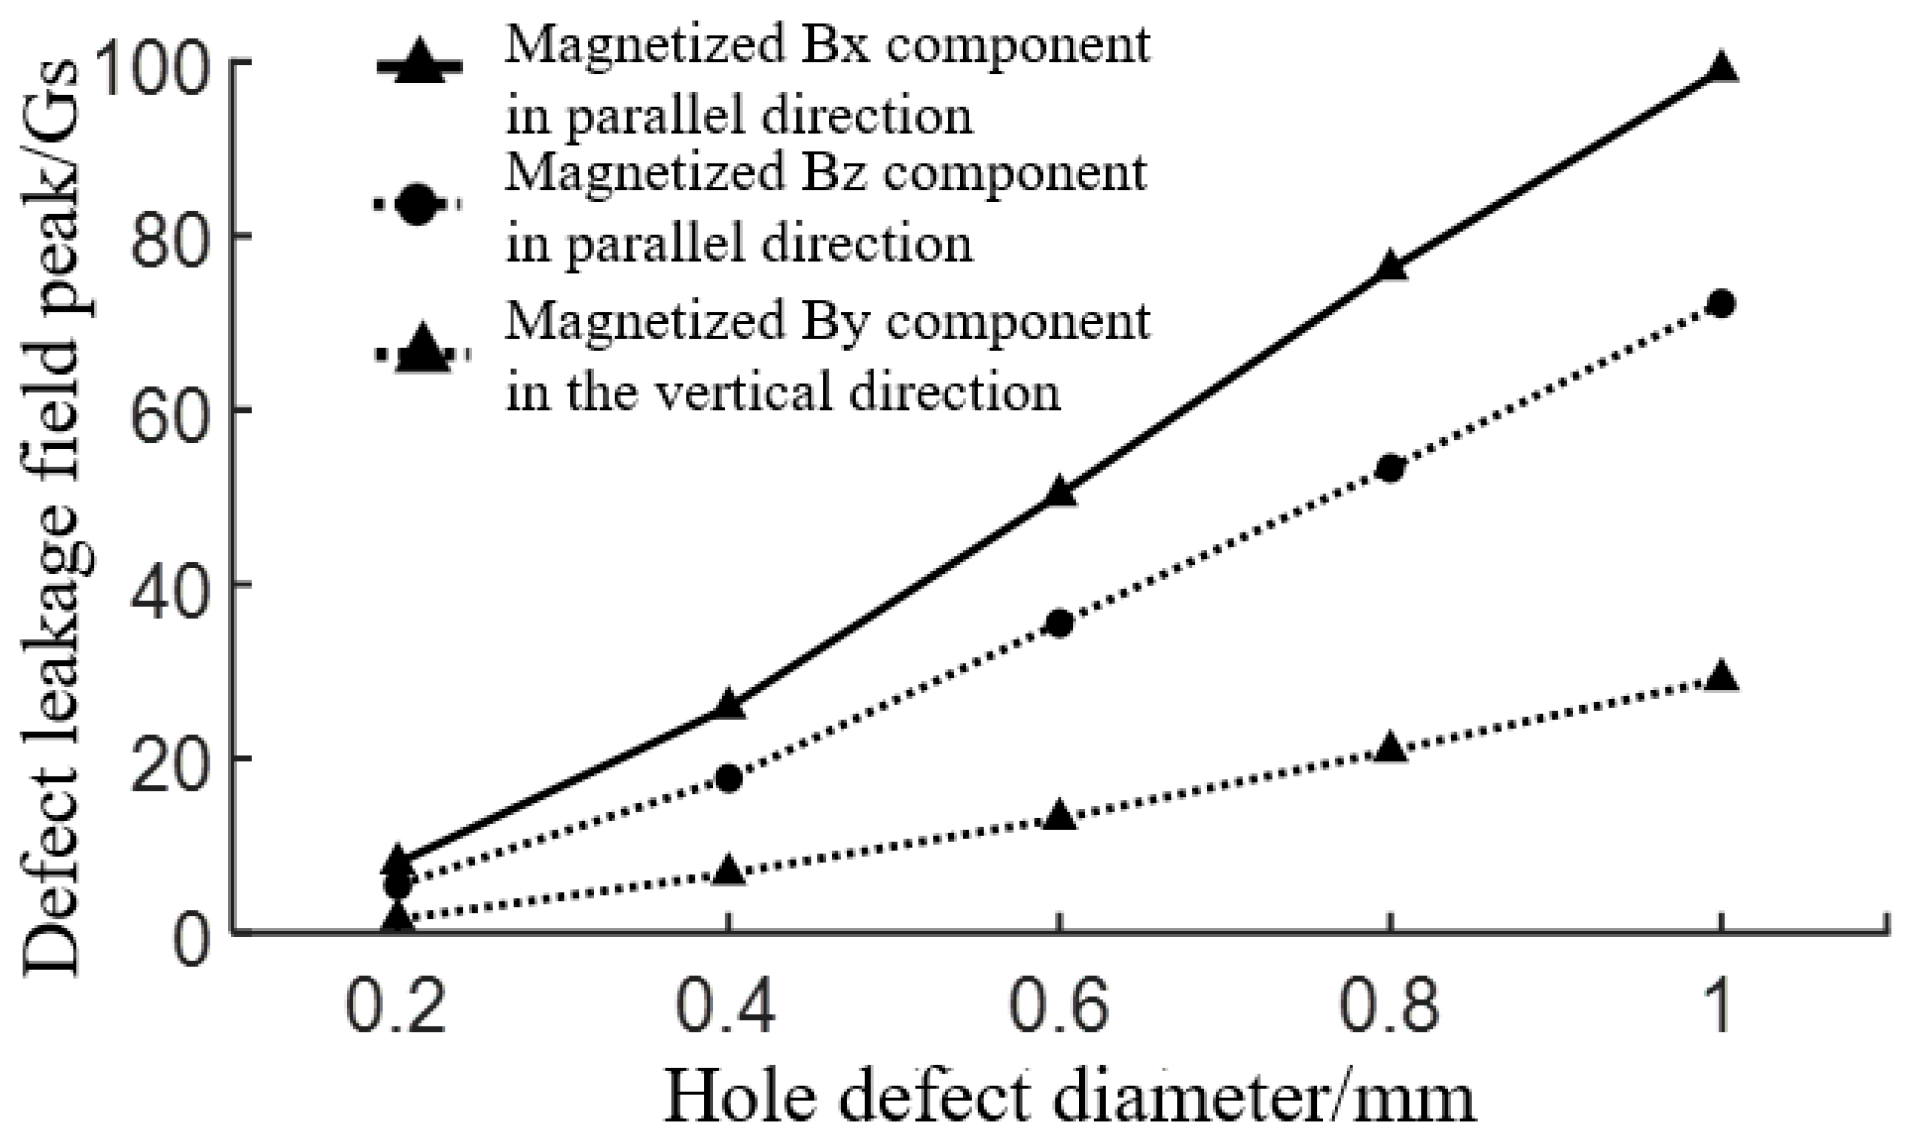
The peak values of the flux leakage field components for defects with various dimension in Figure 4 and Figure 5, are compared in Figure 6 as follows. The comparison is drawn between the two magnetization directions. As the diameter of the circular hole defect increases, the amplitude of the B d e f e c t component gradually increases. Furthermore, the B x and B z components of the parallel magnetization field are greater than the B y component of the perpendicular magnetization field. The flux leakage field induced by parallel magnetization is therefore stronger than that excited by perpendicular magnetization for circular hole defects of the same size.
(3) Comparison of flux leakage fields for rectangular groove defects
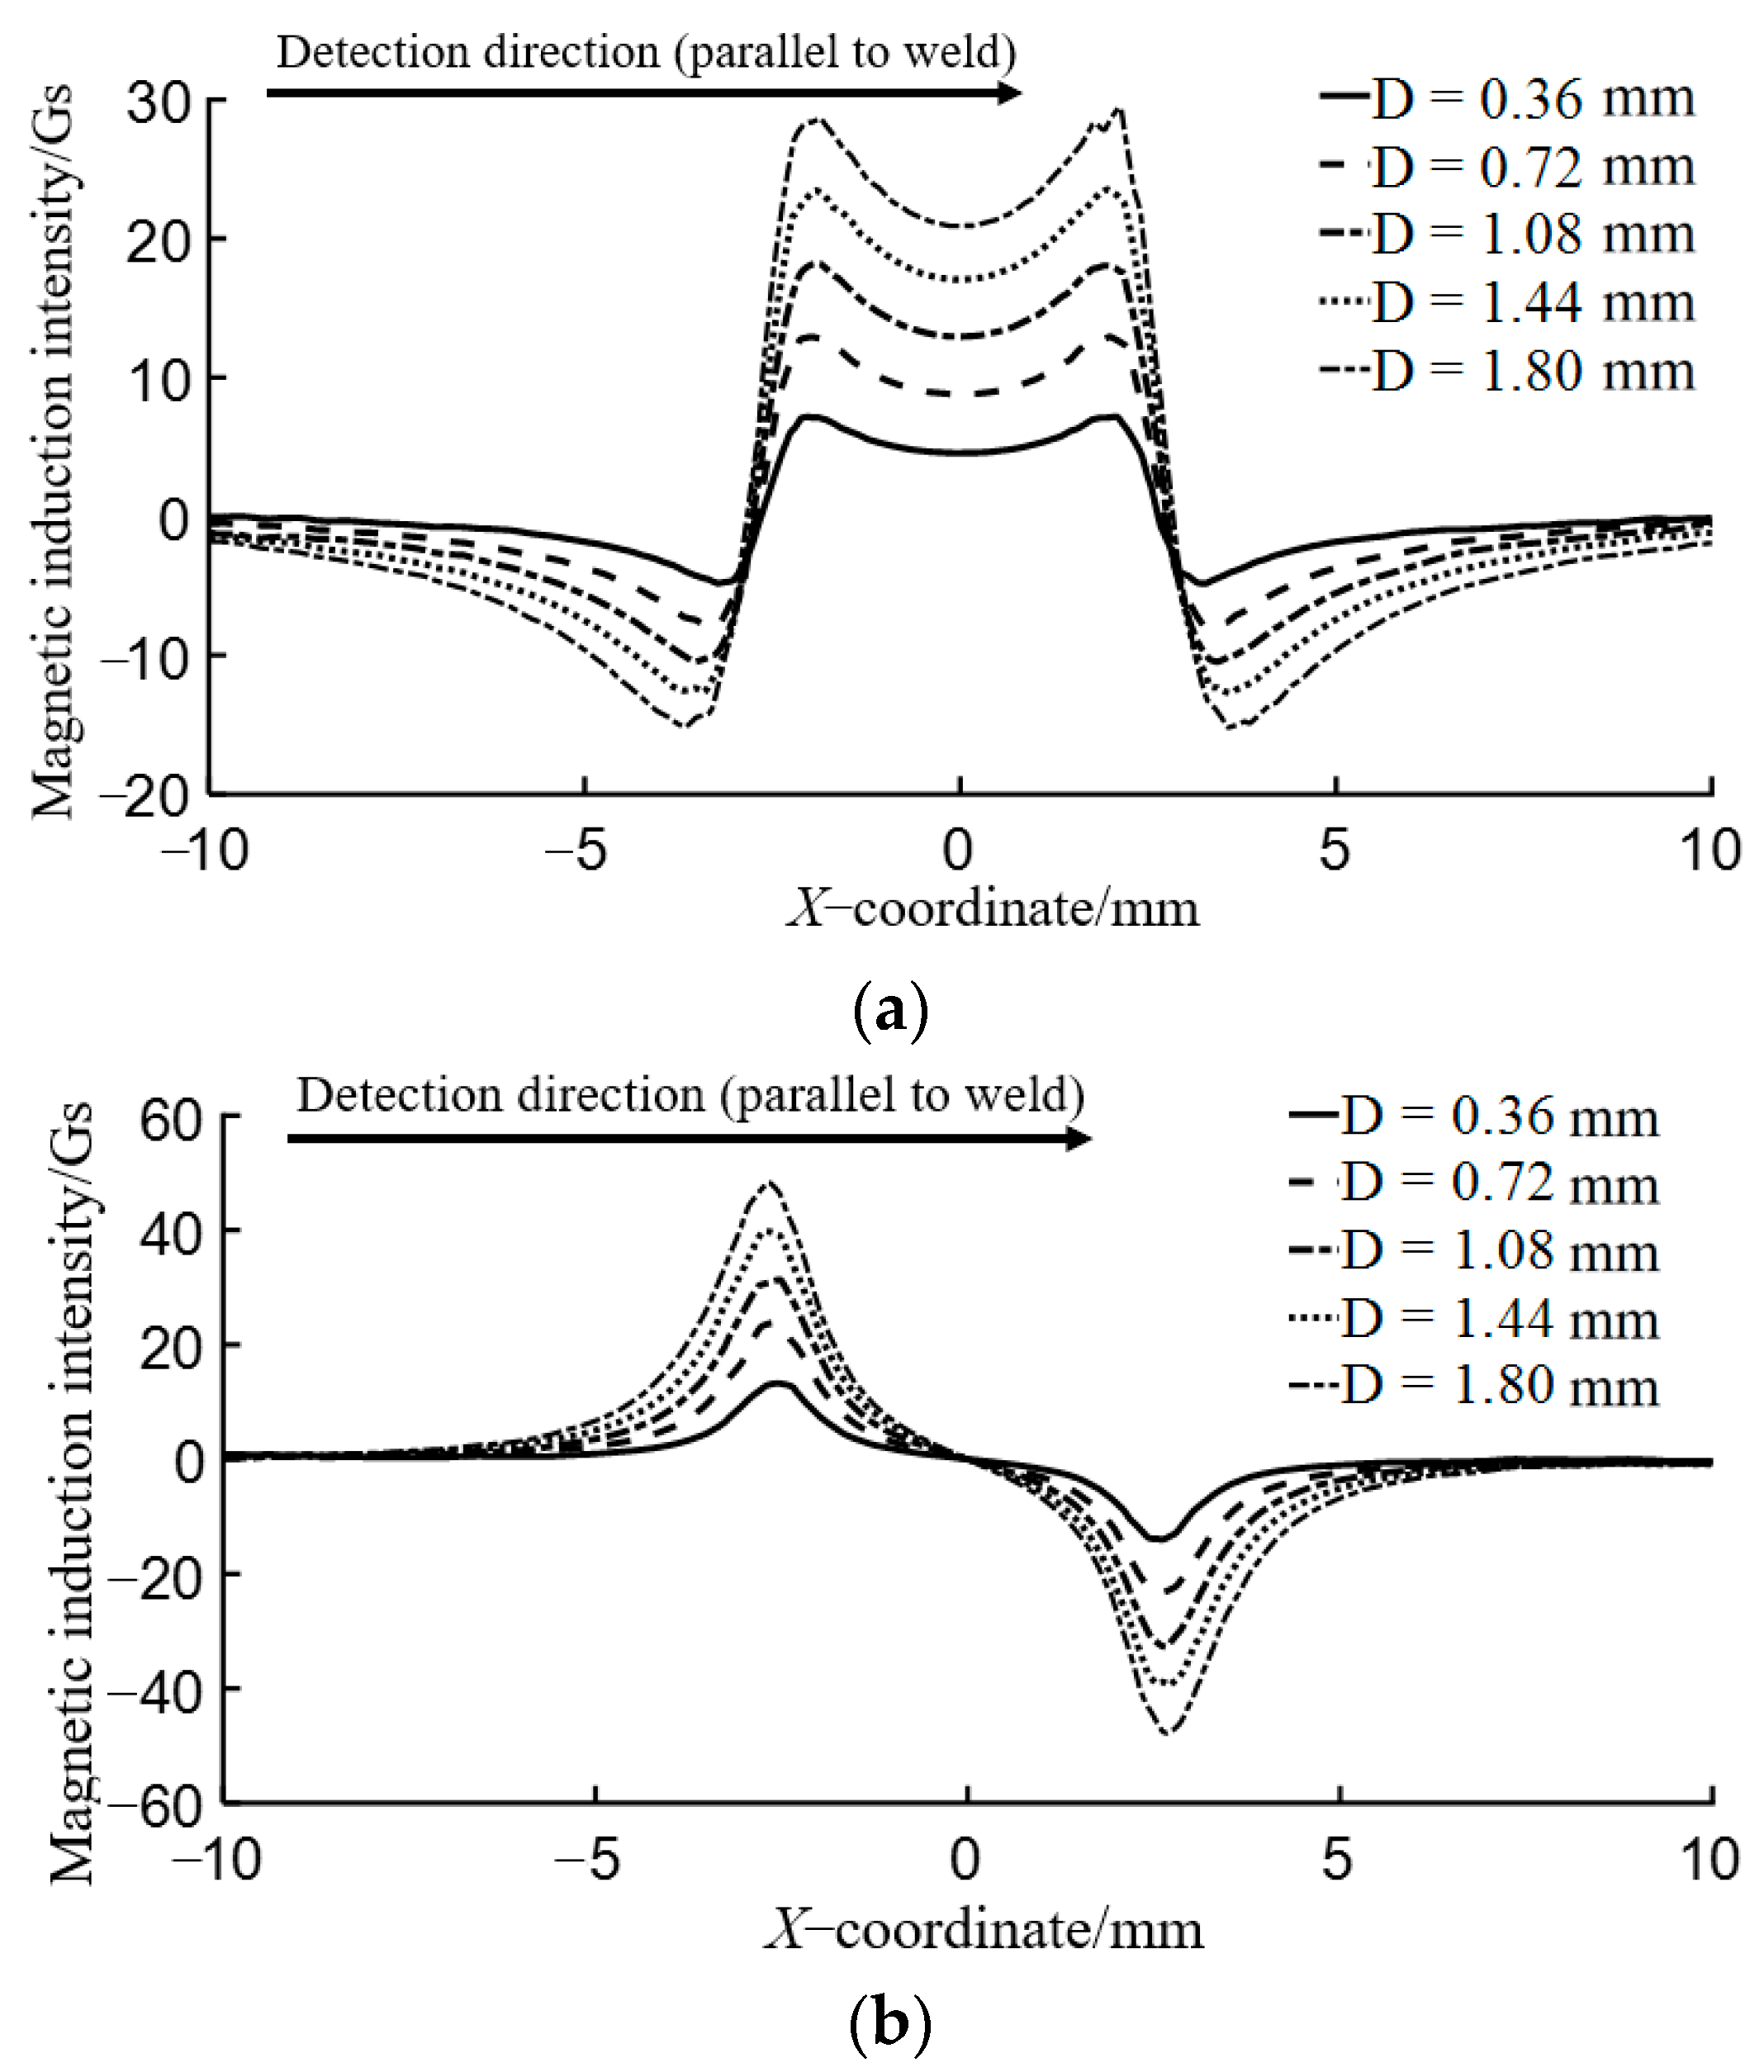
For rectangular groove defects with a fixed length of 5 mm and a width of 0.5 mm, researchers in this study conducted simulations for defects of varying depths to calculate the magnetic induction intensity B at the detection line position. The depth D is set to 0.36, 0.72, 1.08, 1.44, and 1.80 mm (20%t, 40%t, 60%t, 80%t, and 100%t), respectively, based on the weld thickness (sheet thickness + weld reinforcement height) t = 1.8 mm. The flux leakage field of the defect at the detection line position B d e f e c t is calculated using Equation (2).
The flux leakage field components in the parallel direction of magnetization, B x and B z , are illustrated in Figure 7. Specifically, the B x component is characterized by a dual-peak signal with negative side lobes, and the spacing between the peaks is almost the same as the length of the crack (5 mm). Conversely, the B z component is represented by a dual-peak signal with both positive and negative values, and the spacing between the peaks is almost the same as the length of the crack. On the other hand, Figure 8 displays the B y component of the flux leakage field in the perpendicular direction of magnetization. It is a single-peak signal with no side lobes, and the width of the peak approximates the length of the crack.
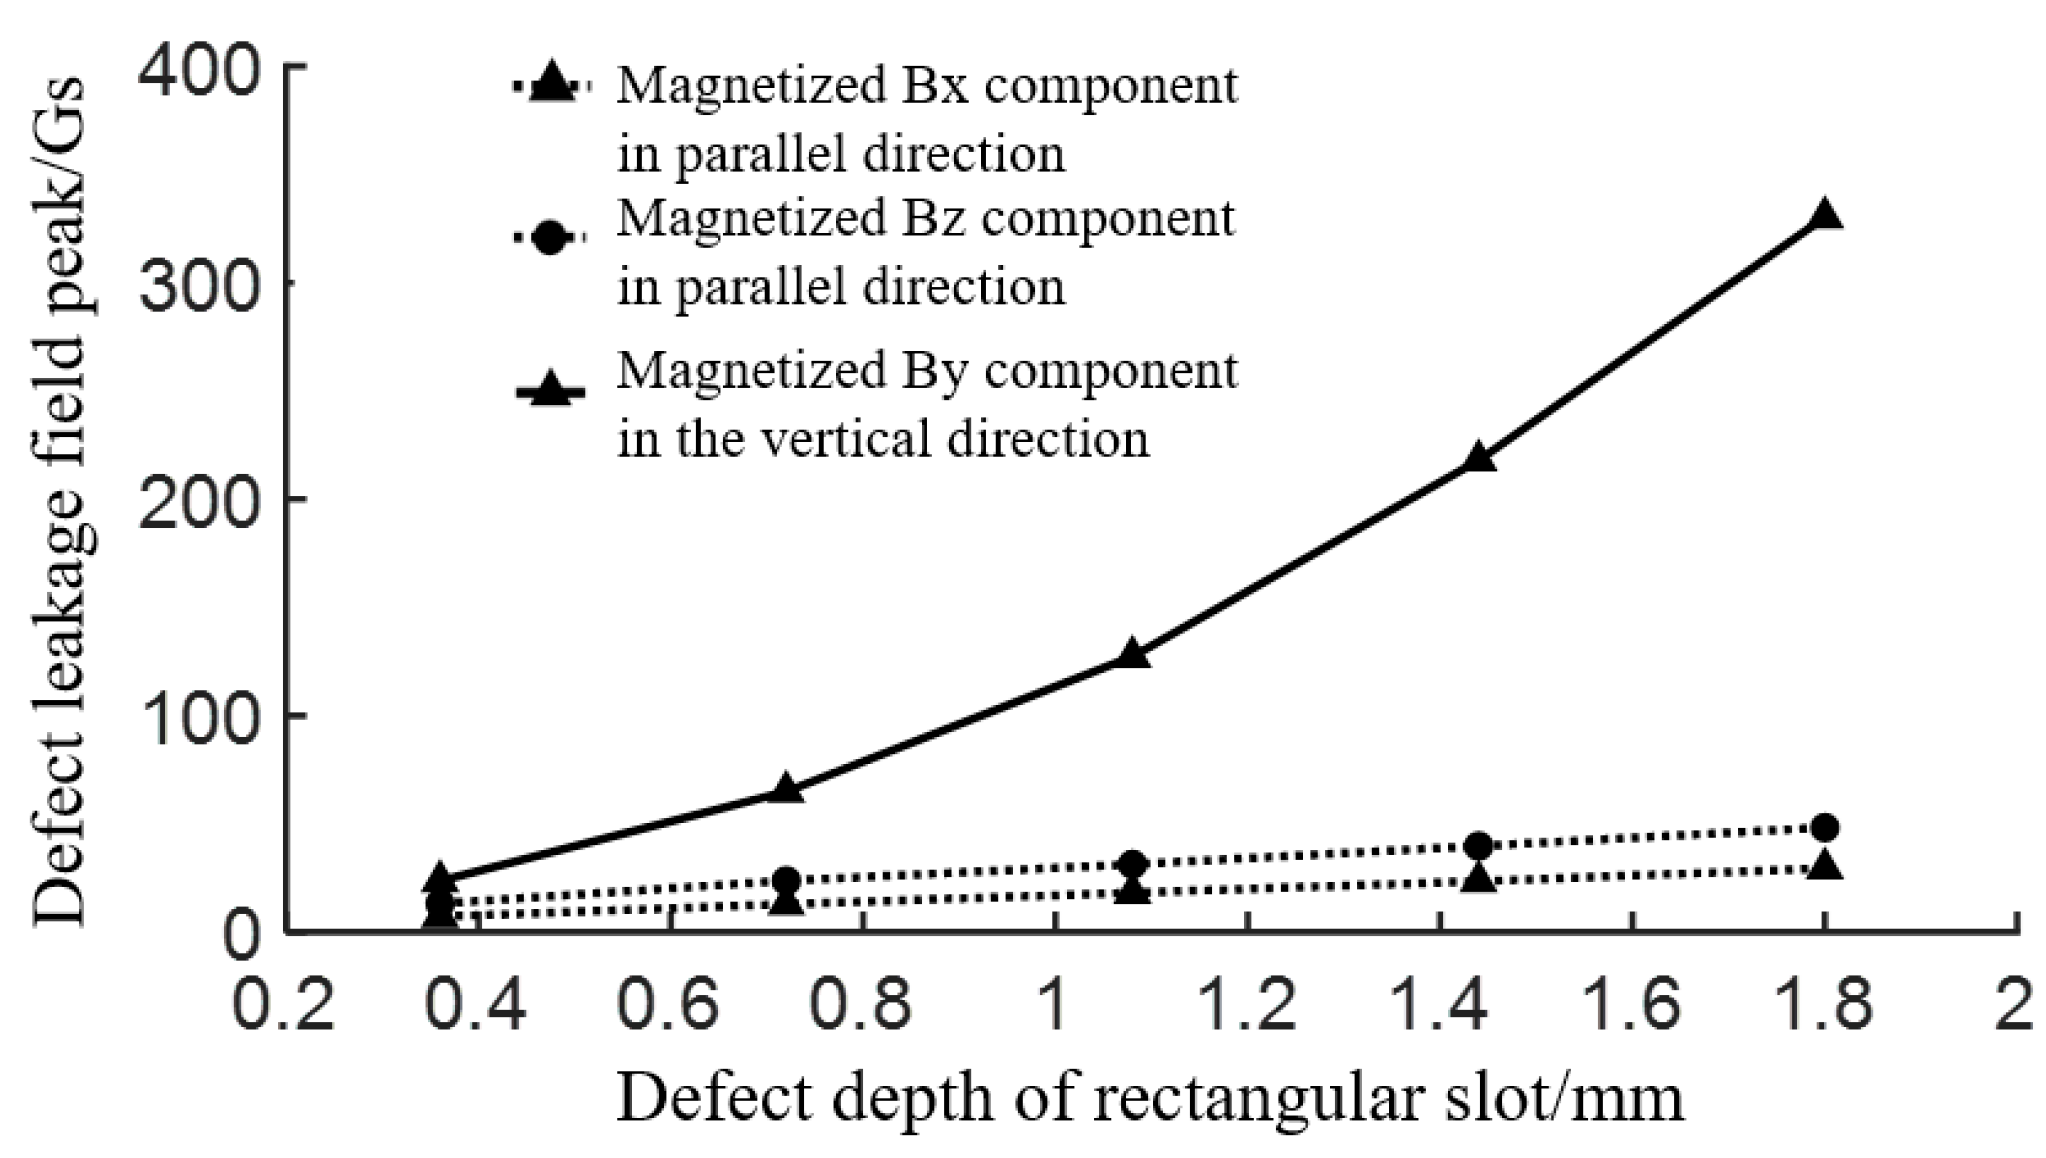
Figure 9 illustrates a comparison between the peak values of the flux leakage field components for different depths of rectangular groove defects (as shown in Figure 7 and Figure 8) and two different magnetization directions. As the depth of the rectangular groove defect, D, increases, the amplitude of the B d e f e c t   component gradually increases. Moreover, the B y component detected under the perpendicular magnetization direction is much larger than the B x and B z components detected under the parallel magnetization direction. Thus, when the aspect ratio of the rectangular groove defect reaches a certain level (the aspect ratio of 10 in this simulation), the excitation of the defect flux leakage field under the perpendicular magnetization direction is stronger than that under the parallel magnetization direction.

3.3. Analysis of Influence of Magnetization Direction on Flux Leakage Field

Based on the theoretical analysis and simulation results presented above, the magnetization direction has the following influences on the flux leakage field in weld defect detection:
(1) Due to the central symmetry of circular hole defects, the cross-sectional features of the defects along the magnetization path are the same regardless of the magnetization direction. Based on the simulated results of flux leakage fields for different sizes of circular hole defects, it is found that the weld affects the flux leakage field’s distribution and that the defect flux leakage field excited by perpendicular magnetization is always weaker than the defect flux leakage field excited by parallel magnetization. According to Equations (5) and (6), the flux leakage field in any direction is the vector sum of the parallel and perpendicular components of the flux leakage field generated by magnetization. Based on the above analysis, it can be concluded that the defect flux leakage field B d e f e c t gradually decreases when the magnetization angle α increases.
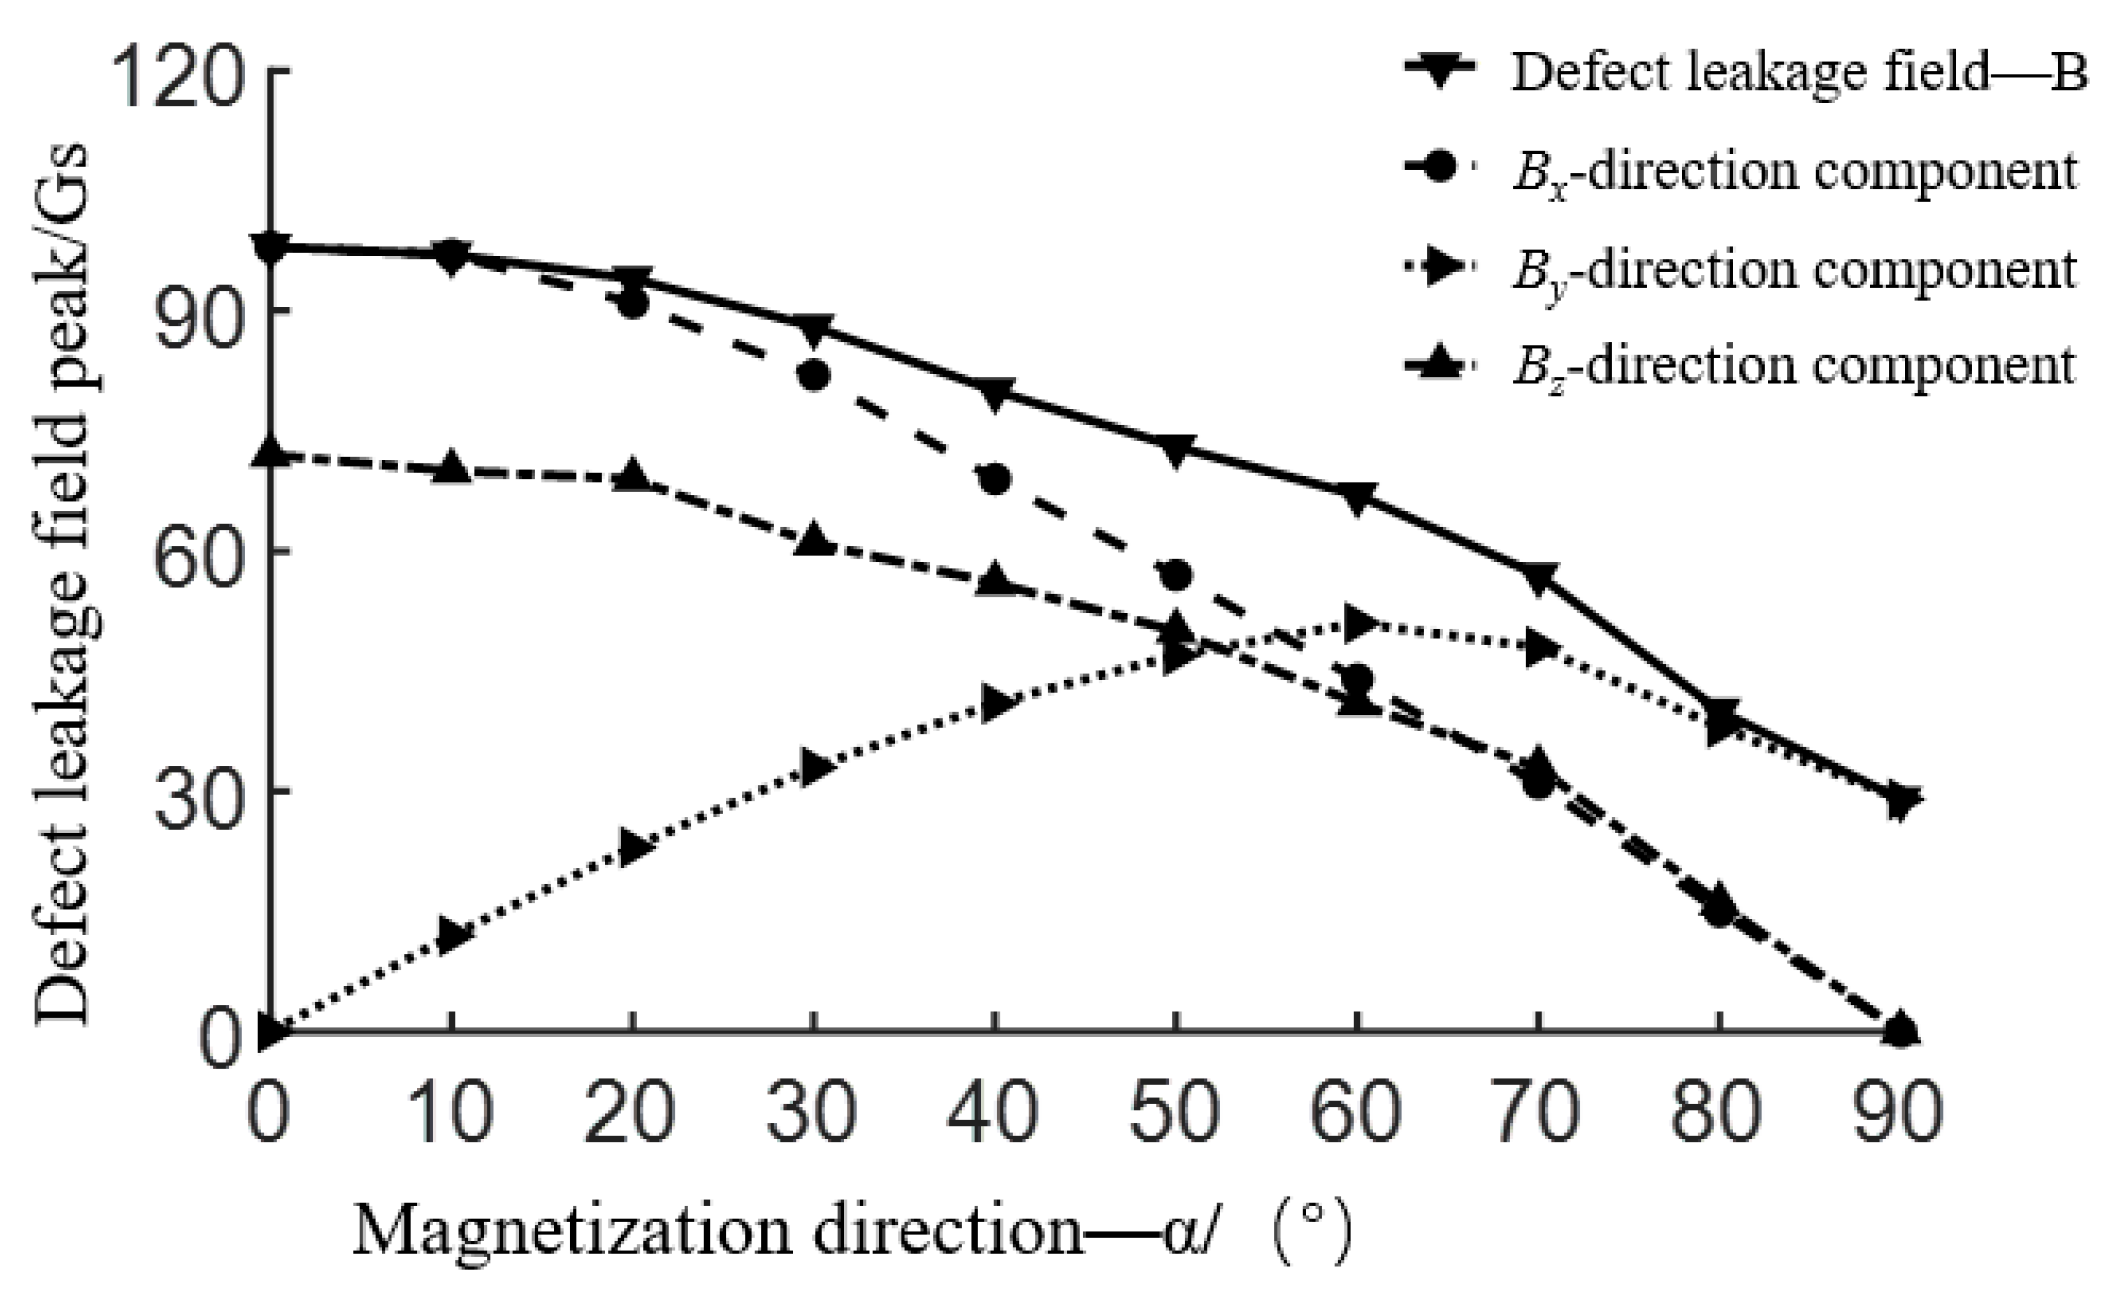
To confirm the above conclusion, a simulation calculation of the peak variation of the flux leakage B d e f e c t and its components is performed for magnetic direction angles ranging from 0° to 90° (with a 10° interval) and for a circular hole defect with a diameter of 1 mm and a depth of 1.8 mm, as shown in Figure 10.
As the magnetic direction angle α increases, the peak values of the flux leakage field, B d e f e c t , and the B x and B z   components both gradually decrease. Meanwhile, the peak value of the B y component initially increases followed by a decline after reaching its maximum at α = 60°. At α = 90°, B y B d e f e c t . Consequently, the optimal angle for detecting circular hole defects is α = 0°, where the peak values of B d e f e c t , B x   and B z are at their zenith.
(2) Based on the 3D magnetic dipole model [13] of rectangular groove defect extending along the x-axis; when the surface is flat without welds, as the angle α between the magnetization direction and the defect extension direction increases (0°−90°); the flux leakage field component B x of the defect gradually decreases and the B y component increases. Moreover, when the aspect ratio of the rectangular groove reaches a certain level, the peak value of the B y component of the flux leakage field in the perpendicular direction of magnetization (α = 90°) is greater than that of any component of the flux leakage field B x and B z for any magnetization direction. Therefore, the main concern for the rectangular groove defect is the flux leakage field component B y perpendicular to the length direction of the rectangular groove. According to the simulation results of the flux leakage field for rectangular groove defects of different sizes with welds, the peak value of the flux leakage field B y excited by perpendicularly oriented magnetization is greater than that of any component of the parallel-oriented flux leakage field, which is consistent with the results of the flat surface without welds. Based on the above analysis, it can be inferred that when the angle α of the magnetization direction reaches a certain level, the peak value of the flux leakage field component B y of the rectangular groove defect is greater than that of any component of the flux leakage field B x and B z for any magnetization direction.
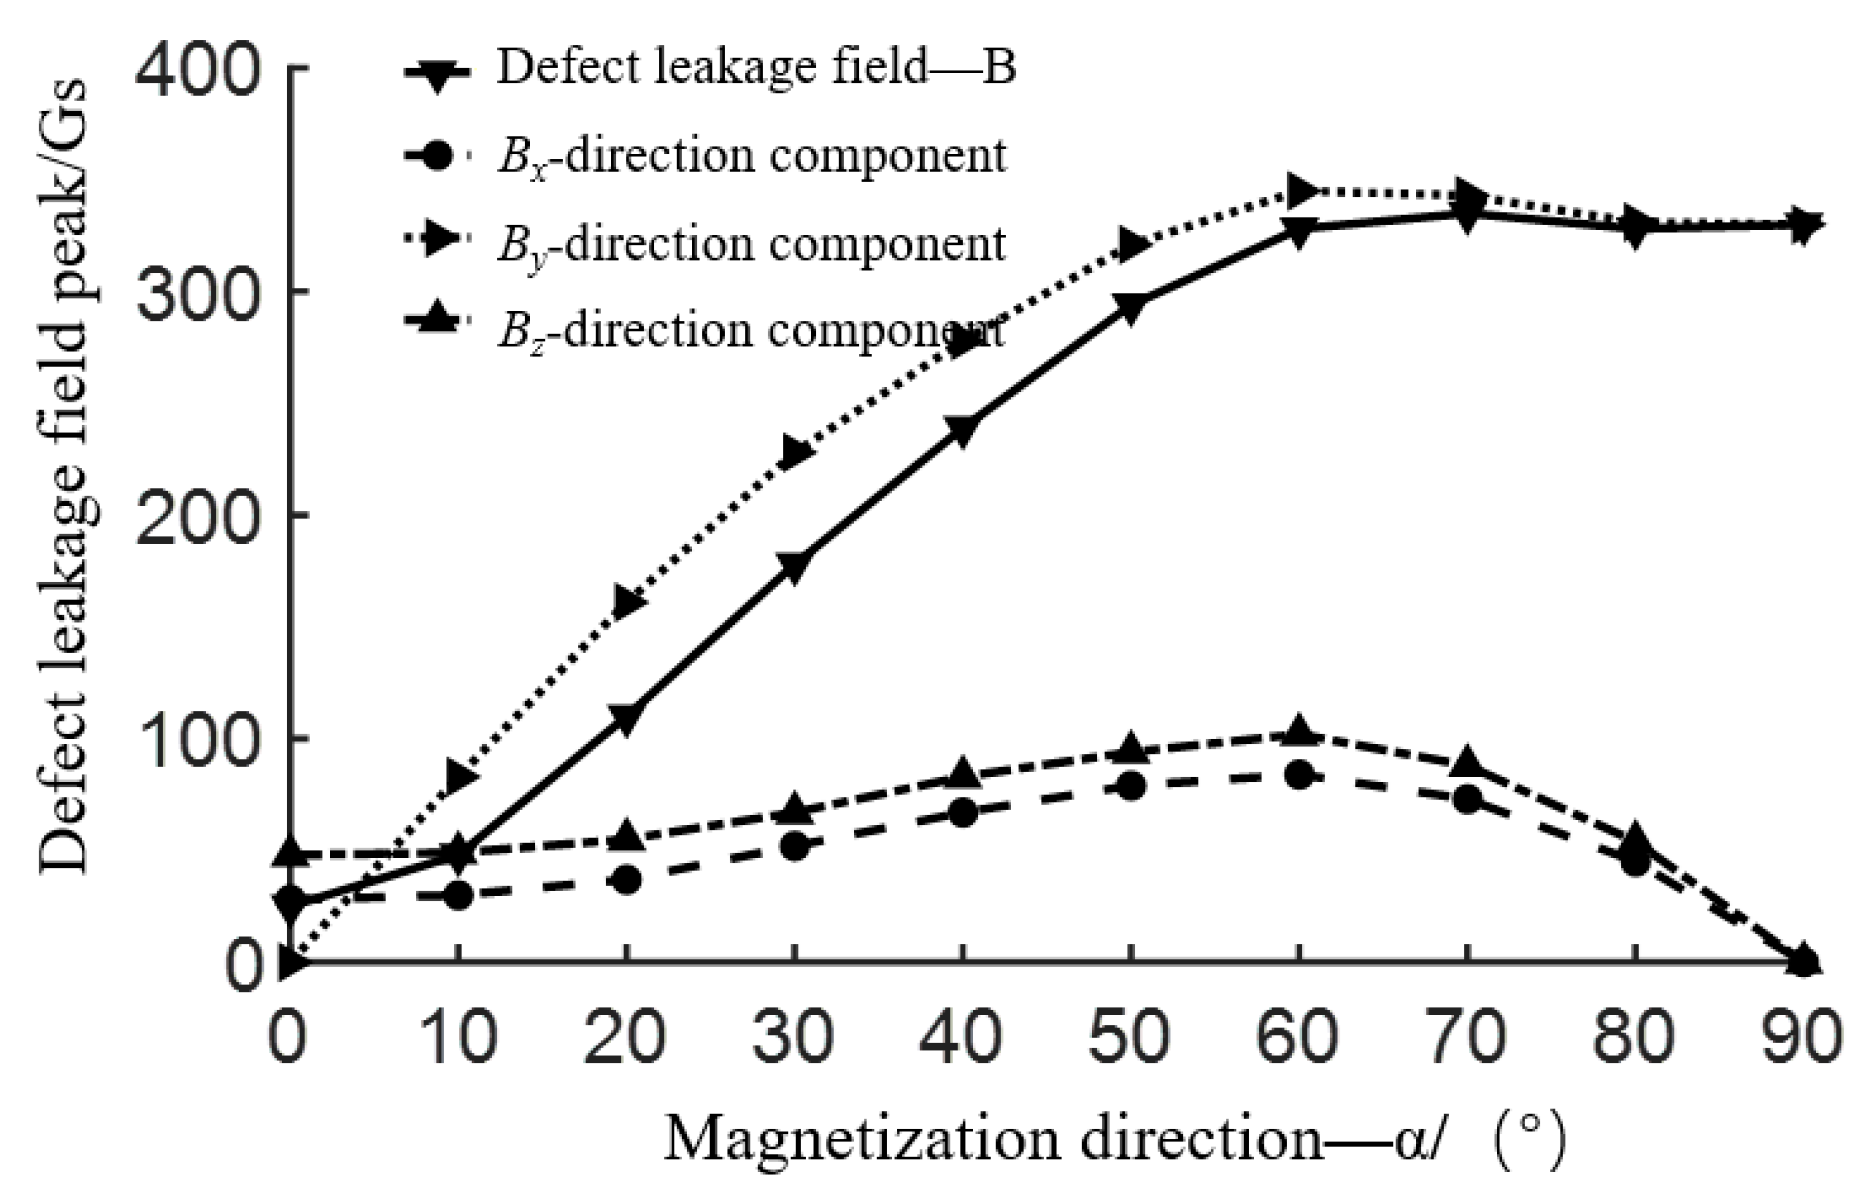
To verify the aforementioned conclusion, this study performs simulation calculations for the flux leakage field of a rectangular groove defect with a depth of 1.8 mm and a width of 0.5 mm, at magnetization angles ranging from 0° to 90° (in intervals of 10°). Figure 11 shows the peak variations of B d e f e c t and its components.
As the angle α between the magnetization direction and the defect elongation direction increases, the peak values of both B d e f e c t and B y exhibit an increasing trend. Moreover, when α ≥ 20°, the B y component exceeds any component of B x and B z in any magnetization direction; when α = 60°, both B d e f e c t   and B y reach the maximum values; and when α > 60°, B y B d e f e c t , while both B x and B z components gradually decrease to zero. Therefore, at a magnetization angle of 60°, the defect detection capability reaches the highest level.

4. Experimental Verification

4.1. MFL Detection System for Welds

A detecting probe, signal conditioning hardware, data collecting hardware, and a computer make up the MFL weld detection system. The detecting probe consists of a magnetizer (Nanjing University of Aeronautics and Astronautics, Nanjing, China) and a three-dimensional Hall sensor array (Nanjing University of Aeronautics and Astronautics, Nanjing, Jiangsu), with a neodymium iron boron permanent magnet (Nanjing University of Aeronautics and Astronautics, Nanjing, China) being used in the magnetizer and a UGN3503 Hall sensor (Nanjing University of Aeronautics and Astronautics, Nanjing, China) with a typical sensitivity of 1.3 mV/Gs being used in the sensor array, which helps to separate the defect-induced MFL signal from the low-frequency background magnetic field. The computer is in charge of storing and processing the MFL detection data, while the data collection card enables A/D conversion of the MFL signal at a sample rate of 10 kHz. A schematic diagram of the detection system is presented in Figure 12.
A 43 array of Hall sensors, with 4 sensors in each direction, makes up the sensor (x, y, and z). Since there are 4 mm between sensors in the same direction, a 12 mm scanning width is possible, guaranteeing comprehensive coverage of the weld. The sensor array is positioned near the weld’s center during the detection procedure, with a lift-off distance of 1 mm. The scan is carried out along the direction of the weld at a speed of around 0.3 m/s. The identical detection settings are used for all tests, and both x-direction (parallel to the weld) and y-direction (perpendicular to the weld) studies are carried out. The chosen sheet is built from Q235 material. It has dimensions of 600 mm × 500 mm × 1 mm, a weld width of 6 mm, and 5 simulated faults are positioned at the weld centerline. Figure 13 displays the sheet weld defect samples, and Table 2 displays the defect size parameters. The labeled numbers in the figure match the defect numbers.

4.2. Analysis of Test Results

To present the detection results more intuitively and clearly, the MFL signals are linearly converted to grayscale values. The grayscale images of the four channels of each directional sensor are drawn, and linear interpolation is applied between adjacent channels to obtain the smoothed grayscale images of the MFL components on the surface of the weld. The B y component of the MFL signal in the parallel magnetization direction is relatively small, so it is not analyzed. The detection results of the B x and B z components of the MFL signals are shown in Figure 14. By observing the grayscale images of the MFL signals, it can be found that the 5 defects are easily distinguished by the B x component, and the defect signals are single-peaked with negative side lobes, with a maximum peak value of 0.89 V. The B z component also clearly identifies the five defects. These defect signals are double-peaked with a maximum peak value of 1.51 V, which is consistent with the simulated results. For circular hole defects, as the diameter of the defect increases, both the peak value of the defect signal and the range of the MFL field increase. For crack defects, as the length of the crack increases, the range of the flux leakage field in the weld direction also gradually increases.
The MFL signals B x and B z , which pertain to the direction of perpendicular magnetization, are deemed insignificant and, thus, are excluded from analysis. The results obtained from the detection of the MFL signal B y   are presented in Figure 15. According to the MFL signal, the B y component at the position of the circular hole defect is nearly invisible due to the presence of background noise, making it difficult to determine its amplitude. Nevertheless, two crack defects labeled 4 and 5 were detected, and they exhibited single-peak signals at their respective locations, which were discovered to be consistent with the simulation’s results. As the length of the crack increases, the range of the flux leakage field in the direction of the weld also expands gradually, with the peak value of the field reaching 3.26 V.
The channel with the highest peak value is chosen among the MFL signals B x , B z   and B y acquired from the parallel and perpendicular magnetizations in order to compare the peak values of the defect signals. The relative amplitude of this signal is then calculated and is presented in Figure 16.
Concerning the circular hole defect, the parallel magnetization produces B x and B z component signals with larger amplitudes than the B y component signal obtained from the perpendicular magnetization. Furthermore, only the round hole defect denoted 3 is detected by perpendicular magnetization, and its signal amplitude is only 18.6% of the former. Both magnetization directions are capable of identifying the crack faults. However, parallel magnetization results in a leakage magnetic signal with a B x amplitude that is merely 16.1% and 9.2% of the B y   signal amplitude, while the B z amplitude is only 29.3% and 17.1% of the B y signal amplitude. The relative peak values of the signals obtained from the two magnetization directions are found to be consistent with the analytical conclusions derived from the simulation results.
According to the above-mentioned experimental findings, longitudinal crack defects can be more easily detected when magnetization is applied perpendicularly to the direction of the crack, whereas circular holes can be more easily detected when magnetization is applied parallel to the direction of the crack. Due to the normally small size of natural weld defects, it may be considered optimal to apply a combined strategy of parallel and perpendicular weld direction magnetization in order to improve the detection capabilities of various types of defects. Furthermore, by contrasting the amplitude of leakage magnetic signals, the basic properties of flaws can be discovered.

5. Conclusions

This study delves into the influence of magnetization direction on the flux leakage field of defects in the magnetic particle testing of sheet steel welds. Two orthogonal magnetization directions, parallel and perpendicular to the weld, are used to examine the flux leakage field B d e f e c t of circular hole and rectangular groove defects. In addition, the amplitude characteristics of B d e f e c t   and its components are analyzed when the magnetization direction is intermediate between these two directions. The following results are obtained after a thorough theoretical examination, model simulation, and experimental verification:
(1) In the absence of defects, the flux leakage field of welds under parallel magnetization exhibits a magnetic field distribution like that of a flat material’s surface. However, the flux leakage field gradually diminishes toward the weld’s center under perpendicular magnetization.
(2) In the case of circular hole defects, the flux leakage field B d e f e c t that results steadily diminishes as the magnetization angle rises. When magnetized perpendicular to the weld direction (α = 0°), B d e f e c t attains its maximum value and is primarily concentrated in the B x and B z components. In contrast, when magnetized perpendicular to the weld direction (α = 90°), B d e f e c t reaches its minimum value and is primarily concentrated in the B y component.
(3) In the case of longitudinal crack defects, as the magnetization angle α increases, the resulting flux leakage field B d e f e c t tends to increase. When α reaches a certain magnitude, B d e f e c t and B y components reach their maximum values and tend to stabilize.
(4) Both magnetization directions are capable of identifying the crack faults. However, parallel magnetization results in a leakage magnetic signal with a B x amplitude that is merely 16.1% and 9.2% of the B y   signal amplitude, while the B z amplitude is only 29.3% and 17.1% of the B y signal amplitude.

Author Contributions

Conceptualization, Y.Y. and P.W.; Methodology, K.J.; Writing—original draft, Y.Y. and K.J.; Writing—review & editing, P.W. All authors have read and agreed to the published version of the manuscript.

Funding

This research was funded by China Jiangsu Province’s Industry-University-Research Cooperation Project, Grant Number: BY2022566; China Jiangsu Province’s Vice General Manager of Science and Technology Project, Grant Number: FZ20220065; QingLan Project of the Jiangsu Higher Education Institutions; the Jiangsu Graduate student Scientific Research and Innovation Project, Grant Number: KYCX21_0200.

Institutional Review Board Statement

Not applicable.

Informed Consent Statement

Not applicable.

Data Availability Statement

Not applicable.

Conflicts of Interest

The authors declare no conflict of interest.

References

  1. Wang, Z.S. Research on image detection and recognition for defects on the surface of the steel plate based on magnetic flux leakage signals. In Proceedings of the 29th Chinese Control and Decision Conference, Chongqing, China, 28–30 May 2017; pp. 6139–6144. [Google Scholar]
  2. Yang, Z.; Anthonie, B.; Chen, R. Numerical and experimental study of wheel-rails impact vibration and noise generated at an insulated rails joint. Int. J. Impact Eng. 2018, 113, 29–39. [Google Scholar] [CrossRef]
  3. Zhang, Q.; Zou, D.Q.; Yang, Q.Q. Research and analysis of damaged morphology and structure on the head of switch rail. Metall. Anal. 2019, 39, 23–28. [Google Scholar]
  4. Dudkin, E.P.; Andreeva, L.A.; Sultanov, N.N. Methods of noise and vibration protection on urban rails transport. Procedia Eng. 2017, 189, 829–835. [Google Scholar] [CrossRef]
  5. Wang, S.F.; Liu, L.Y.; Liu, H.T.; Chen, S. Crack initiation and spalling analysis of inner rail on heavy haul railway curve based on damage accumulation and weight parameter. China Railw. Sci. 2017, 27, 31–35. [Google Scholar]
  6. Mao, B.Y.; Lu, Y.; Wu, P.L. Signal processing and defect analysis of pipeline inspection applying MFL methods. Intell. Serv. Robot. 2014, 7, 203–209. [Google Scholar] [CrossRef]
  7. Kalil, K.E.; Sen, D.; Nagarajaiah, S. Vibration-based structural health monitoring under changing environmental conditions using Kalman filtering. Mech. Syst. Signal Process. 2019, 117, 1–15. [Google Scholar]
  8. Fotiadou, E.; Laar, J.V.; Oei, S.G.; Vullings, R. Enhancement of low-quality fetal electrocardiogram based on time-sequenced adaptive filtering. Med. Biol. Eng. Comput. 2018, 56, 2313–2323. [Google Scholar] [CrossRef] [PubMed]
  9. Liu, B.; He, L.Y.; Zhang, H.; Cao, Y.; Fernandes, H. The axial crack testing model for long distance oil-gas pipeline based on MFL internal inspection method. Measurement 2017, 103, 275–282. [Google Scholar] [CrossRef]
  10. Lepage, B.; Brillon, C. Dynamic ECA lift-off compensation. AIP Conf. Proc. 2015, 1650, 424–433. [Google Scholar]
  11. Ye, Y.; Ping, W.; Wu, N.; Ge, F.; Zhou, F. Optimisation for accuracy improving of MSB signal detection. Electron. Lett. 2017, 53, 1578–1580. [Google Scholar] [CrossRef]
  12. Shi, P.; Ke, J.; Zhang, P.; Xie, S.; Chen, Z.; Zheng, X. Quantitative inversion of stress and crack in ferromagnetic materials based on metal magnetic memory method. IEEE Trans. Magn. 2018, 54, 6202011. [Google Scholar] [CrossRef]
  13. Kim, D.; Udpa, L.; Udpa, S.S. Lift-off invariance transformations for eddy current nondestructive evaluation signals. AIP Conf. Proc. 2002, 615, 615–622. [Google Scholar]
  14. Gui, Y.T.; Sophian, A.; Taylor, D.; Rudlin, J. Multiple sensors on pulsed eddy-current detection for 3-D subsurface crack assessment. IEEE Sens. J. 2005, 5, 90–96. [Google Scholar]
  15. Dutta, S.M.; Ghorbel, F.H.; Stanley, R.K. Simulation and analysis of 3-D magnetic flux leakage. IEEE Trans. Magn. 2009, 45, 1966–1972. [Google Scholar] [CrossRef]
Figure 2. A three-dimensional finite element simulation model. (a) Parallel magnetization model; (b) Perpendicular magnetization model.
Coatings 13 01005 g002aCoatings 13 01005 g002b
Figure 3. A magnetic induction contour map at the weld location. (a) Magnetization in parallel direction (b) Magnetization in perpendicular direction.
Coatings 13 01005 g003
Figure 4. The flux leakage field of circular hole defects with parallel magnetization. (a) B x component of the flux leakage field; (b) B z component of the flux leakage field.
Coatings 13 01005 g004
Figure 5. B y component of the flux leakage field of circular hole defects with perpendicular magnetization.
Coatings 13 01005 g005
Figure 6. Comparison of peak values of defect flux leakage fields.
Coatings 13 01005 g006
Figure 7. The flux leakage field of rectangular groove defects with parallel magnetization. (a) Bx component of the flux leakage field; (b) Bz component of the flux leakage field.
Coatings 13 01005 g007
Figure 8. B y component of the flux leakage field of rectangular groove defects with perpendicular magnetization.
Coatings 13 01005 g008
Figure 9. Comparison of peak values of defect flux leakage fields.
Coatings 13 01005 g009
Figure 10. The peak values of the flux leakage field for circular hole defects with varying magnetic direction angles.
Coatings 13 01005 g010
Figure 11. Peak value of flux leakage field of rectangular groove defect with different magnetization directions.
Coatings 13 01005 g011
Figure 12. Schematic diagram of detection system.
Coatings 13 01005 g012
Figure 13. The defect samples of the sheet weld.
Coatings 13 01005 g013
Figure 14. Grayscale image of the MFL signal in the direction of parallel magnetization. (a) MFL signal of B x component; (b) MFL signal of B z component.
Coatings 13 01005 g014
Figure 15. Grayscale image of the B y component of the MFL signal in the direction of perpendicular magnetization.
Coatings 13 01005 g015
Figure 16. Relative amplitude of MFL signals.
Coatings 13 01005 g016
Table 1. Material and dimension parameters of model components.
Simulation ComponentsMaterialsDimension Parameters/mm
Magnetic yokeferrite160 × 80 × 80 (with a pole spacing of 60)
Permanent magnetNdFe3030 × 40 × 40
Sheet steelQ235200 × 200 × 1.5
WeldQ235200 × 6 × 0.3 (circular arc)
Circular hole defectvacuumThe depth is 1.8 mm, and the different diameters are 0.2, 0.4, 0.6, 0.8, and 1.0 mm
Rectangular grooves defectvacuumThe length is 5 mm, the width is 0.5 mm, and the depth is 0.36, 0.72, 1.08, 1.44, and 1.80 mm
Table 2. Size parameters of artificial defects (sheet thickness t = 1.0 mm).
TypesNo.Defect Size Parameters
Circular hole DiameterDepth
10.3 mm100%t (1.0 mm)
20.5 mm100%t (1.0 mm)
31.0 mm100%t (1.0 mm)
Crack Length WidthDepth
44.0 mm1.0 mm100%t (1.0 mm)
55.0 mm1.0 mm100%t (1.0 mm)
Disclaimer/Publisher’s Note: The statements, opinions and data contained in all publications are solely those of the individual author(s) and contributor(s) and not of MDPI and/or the editor(s). MDPI and/or the editor(s) disclaim responsibility for any injury to people or property resulting from any ideas, methods, instructions or products referred to in the content.

