Article

Preparation of SrAl2O4: Eu2+, Dy3+ Powder by Combustion Method and Application in Anticounterfeiting

1
Beijing Key Laboratory of Printing and Packaging Materials and Technology, Beijing Institute of Graphic Communication, Beijing 102600, China
2
National Center for Nanoscience and Technology, CAS Key Laboratory of Nanophotonic Materials and Devices (Preparatory), Beijing 100190, China
3
The GBA Research Innovation Institute for Nanotechnology, Guangzhou 510700, China
*
Authors to whom correspondence should be addressed.
These authors contributed equally to this work.
Coatings 2023, 13(4), 808; https://doi.org/10.3390/coatings13040808
Submission received: 21 March 2023 / Revised: 14 April 2023 / Accepted: 14 April 2023 / Published: 21 April 2023
(This article belongs to the Special Issue Optoelectronic Thin Films)

Abstract

:
Green emitting long afterglow phosphor SrAl2O4: Eu2+, Dy3+ was synthesized via the combustion method. The physical phase analysis was carried out by X-ray diffraction, the results show that the introduction of Eu2+ into the lattice of the matrix resulted in a broad green emission centered at 508 nm, which is ascribed to the characteristic 4f65d1 to 4f7 electronic dipole allowed transition of Eu2+ ions. The doping of Eu2+ and Dy3+ did not change the physical phase of the crystals. Dy3+, as a coactivator, does not emit light itself, but can generate holes to form a trap energy level, which acts as an electron trap center to capture some of the electrons generated by the excitation of Eu2+. After excitation has ceased, let them gradually to transfer to the ground state for long afterglow luminescence. Then, we investigate the optical characterizations of different samples excited by X-ray. We found that SrAl2O4: Eu2+, 0.5% Dy3+ has this higher luminous intensity and afterglow. Its fluorescence lifetime is about 720 ns, and its quantum yield can reach 15.18%. Through search engine marketing (SEM) and energy dispersive X-ray spectroscopy (EDX), it has been proved that the sample has been successfully synthesized and its component content has been confirmed. The Eg value calculated from the diffuse reflectance spectrum is 4.61eV. The prepared SrAl2O4: Eu2+, Dy3+ luminescent powder is combined with Polydimethylsiloxane substrate for anticounterfeiting application, which provides a novel idea and method for the development of the anticounterfeiting field.

1. Introduction

There have long been inorganic phosphors or luminous materials. The light of these phosphors, which have an inorganic host with a large band gap, is caused by localized transitions between the electronic states of the impurity core, also known as the activator. The chosen dopant ion is the primary factor in determining the spectrum properties of phosphors. There are many afterglow phosphors that have been created, and their emission ranges from ultraviolet to infrared. The aluminates, silicates, or sulfides that have been doped with europium and a suitable trivalent lanthanide are the most effective afterglow phosphors that emit in the visible spectrum. The most encountered afterglow phosphor is SrAl2O4: Eu2+, Dy3+ [1,2,3,4,5]. In 1968, Palilla [6] et al. discovered the long afterglow characteristics of aluminate system for the first time in the process of studying SrAl2O3: Eu2+ luminescence. The long afterglow luminescent materials with excellent luminescence performance of aluminate system are mainly MAl2O4: Eu2+, RE3+(M = Ca,Sr,Ba; RE = Dy,Nd,Ho,Er,Pr,Tb, etc.) [7,8], its emission peaks are mainly concentrated in the blue-green light band, the known blue-green long afterglow materials with the best performance are SrAl2O4: Eu2+, Dy3+ [9]. The long afterglow material SrAl2O4: Eu2+, Dy3+ can emit bright and lasting green long afterglow after excitation with ultraviolet light or X-ray. The afterglow emission peak is located at 520 nm [10], the brightness is 20 times that of the sulfide system, and the afterglow time is more than 24 h [11].
Among strontium aluminates with various stoichiometries, SrAl2O4 stands out especially as an excellent host lattice for making high emission, long afterglow phosphors by doping with rare earth ions [1]. Therefore, there is a lot of interest in developing such materials by different methods, the most used being the combustion method [12]; other methods include the hydrothermal approach [13] and high-temperature solid-state method [14]. The luminescent materials prepared by hydrothermal method have the advantages of good dispersion, homogeneous phase, high crystallinity and purity of luminescent powder particles and minimum environmental pollution. However, this method requires high equipment and strict technical control of temperature and pressure. High temperature solid state method is the most extensive and earliest method to prepare inorganic luminescent materials. The manufacturing process is relatively mature and the crystal structure formed is good, but its synthesis requires high temperature, long reduction time and long cooling time. However, the combustion method used in this paper, although the optical properties of the sample will be reduced after grinding, the combustion method has a relatively low reaction temperature, short preparation time, simple process, and high purity of the product [12]. It is widely used in experiments.
Currently, phosphors have important applications in many fields. When excited by UV light or an electron beam, Mn2+ ions, particularly in ZnGa2O4 spinel, emit a bright green color that can be used in vacuum fluorescent displays (VFDs), field emission displays (FEDs), and thin-film electroluminescent devices [15]. Using MgAl2O4 spinel ceramics as an example, the presented positron annihilation lifetime spectra can be used on a broad spectrum of functional nanomaterials with significant porosity [16]. There are several uses for transition metal ions as doping materials in chemistry, physics, biology, material science, and other fields. These uses are related to numerous technologies, including laser technology, nonlinear optics, optical information, phosphor materials, catalysis, and others [17]. Fluorescent powder is also widely used in anticounterfeiting materials, it mainly refers to the basic materials needed to make anticounterfeiting labels, anticounterfeiting trademarks, anticounterfeiting bills, anticounterfeiting cards, etc. At present, the fluorescent anticounterfeiting technology mainly uses photoluminescence. For example, if the paint is mixed with phosphor powder and printed on the product, the pattern is invisible or low-recognition state without ultraviolet light. In external light, it glows. Therefore, it is necessary in order to develop multilevel anticounterfeiting technology [4]. We are also working on some new rare-earth-doped luminescent materials. We obtained a rare-earth-doped luminescent patent this year and carried out technological transformation.
Herein, green emitting phosphors SrAl2O4, SrAl2O4: Eu2+, and SrAl2O4: Eu2+, Dy3+ were prepared successfully via combustion method. The crystal structure, luminescent properties, afterglow behavior, fluorescence lifetime, as well as the quantum efficiency were examined. In addition, the optimal reaction temperature and the optimal amount of Dy ion doping were determined by photoluminescence experiments. Surface morphology of samples with different solvent additions was observed by using scanning electron microscopy. In the end, we combined the prepared SrAl2O4: Eu2+, Dy3+ luminescent powder with PDMS elastic substrate for anticounterfeiting application study [12,13,14,18].

2. Materials and Equipment

2.1. Materials and Synthesis

SrAl2O4: Eu2+, Dy3+ is prepared by a simple combustion method. SrCO3(A.R.), Al2O3(A.R.), Eu2O3(A.R.), Dy2O3(A.R.), and urea are used as raw materials, they were purchased from Tianjin Chemical Reagent Factory. First, SrCO3, Al2O3, Eu2O3, and Dy2O3 are respectively dissolved in nitric acid to obtain transparent and clear solutions of Sr(NO3)2 (0.5 mmol/mL), Al(NO3)3 • 9H2O (1 mmol/mL), Eu(NO3)3 (0.1 mmol/mL), and Dy(NO3)3 (0.1 mmol/mL). Next, take 3.9 mL of Sr(NO3)2, 4 mL of Al(NO3)3 • 9H2O, 0.4 mL of Eu(NO3)3, 0.1 mL of Dy2O3, 2.2 g of urea and a proper amount of deionized water into the crucible, and mix them to obtain a clear solution. Fully stir the mixed solution, burn it in muffle furnace at 800 °C; for 2–3 min, hear a “bang” and observe the flame, and take out the product after a moment of cooling. The puffy mushroom cloud like milky white product is obtained after combustion reaction. Green SrAl2O4: Eu2+, Dy3+ fluorescent powder can be obtained after cooling and grinding.
The Dy3+ doping samples were prepared by the same experimental operation. The doping amount of Dy(NO3)3(0.1 mmol/mL) was 0.1%, 0.5%, 1%, 2%, 4%, 6%, 8% and 10%, respectively, and 8 samples were obtained. Then three groups of morphology control experiments including EA (Ethyl Acetate), PVA (Polyvinyl alcohol), PEG (Polyethylene glycol), were added respectively to change the micro morphology of the luminescent materials.

2.2. Instruments

The crystal structures of the synthesized samples were investigated with an X-ray diffractometer [19] (D/max 2200PC X-ray diffractometer manufactured by Rigaku Corporation). Using the F4700 fluorescence spectrometer [20] for PL test, the emission spectrum and excitation spectrum of the luminescent powder can be drawn to study its spectral properties. The microstructures were observed and compared with a scanning electron microscope (Quanta 250 FEG scanning electron microscope from Hitachi, Japan) [21]. The elemental composition and content were measured by scanning electron microscope-energy meter (Phenom Pro X, Holland). The wavelengths of UV lamps (Manufactured by Hangzhou, China.) is 365 nm. With this excitation source, a continuous fluorescence excitation spectrum in the range of 280–460 nm was measured with a fluorescence spectrometer. The ultraviolet diffuse reflectance spectrum was measured with UV-3600 Ultraviolet Visible Near Infrared Spectrophotometer (Shimadzu Corporation, Kyoto, Japan). The fluorescence lifetime and quantum yield of phosphors were measured by transient steady state fluorescence spectrometer (FLS1000, Edinburgh, UK). Visible light optical fiber spectrometer (FX2000, Shanghai, China) to measure the X-ray fluorescence spectra of different samples and the afterglow luminous intensity by X-ray excited.

3. Results and Discussion

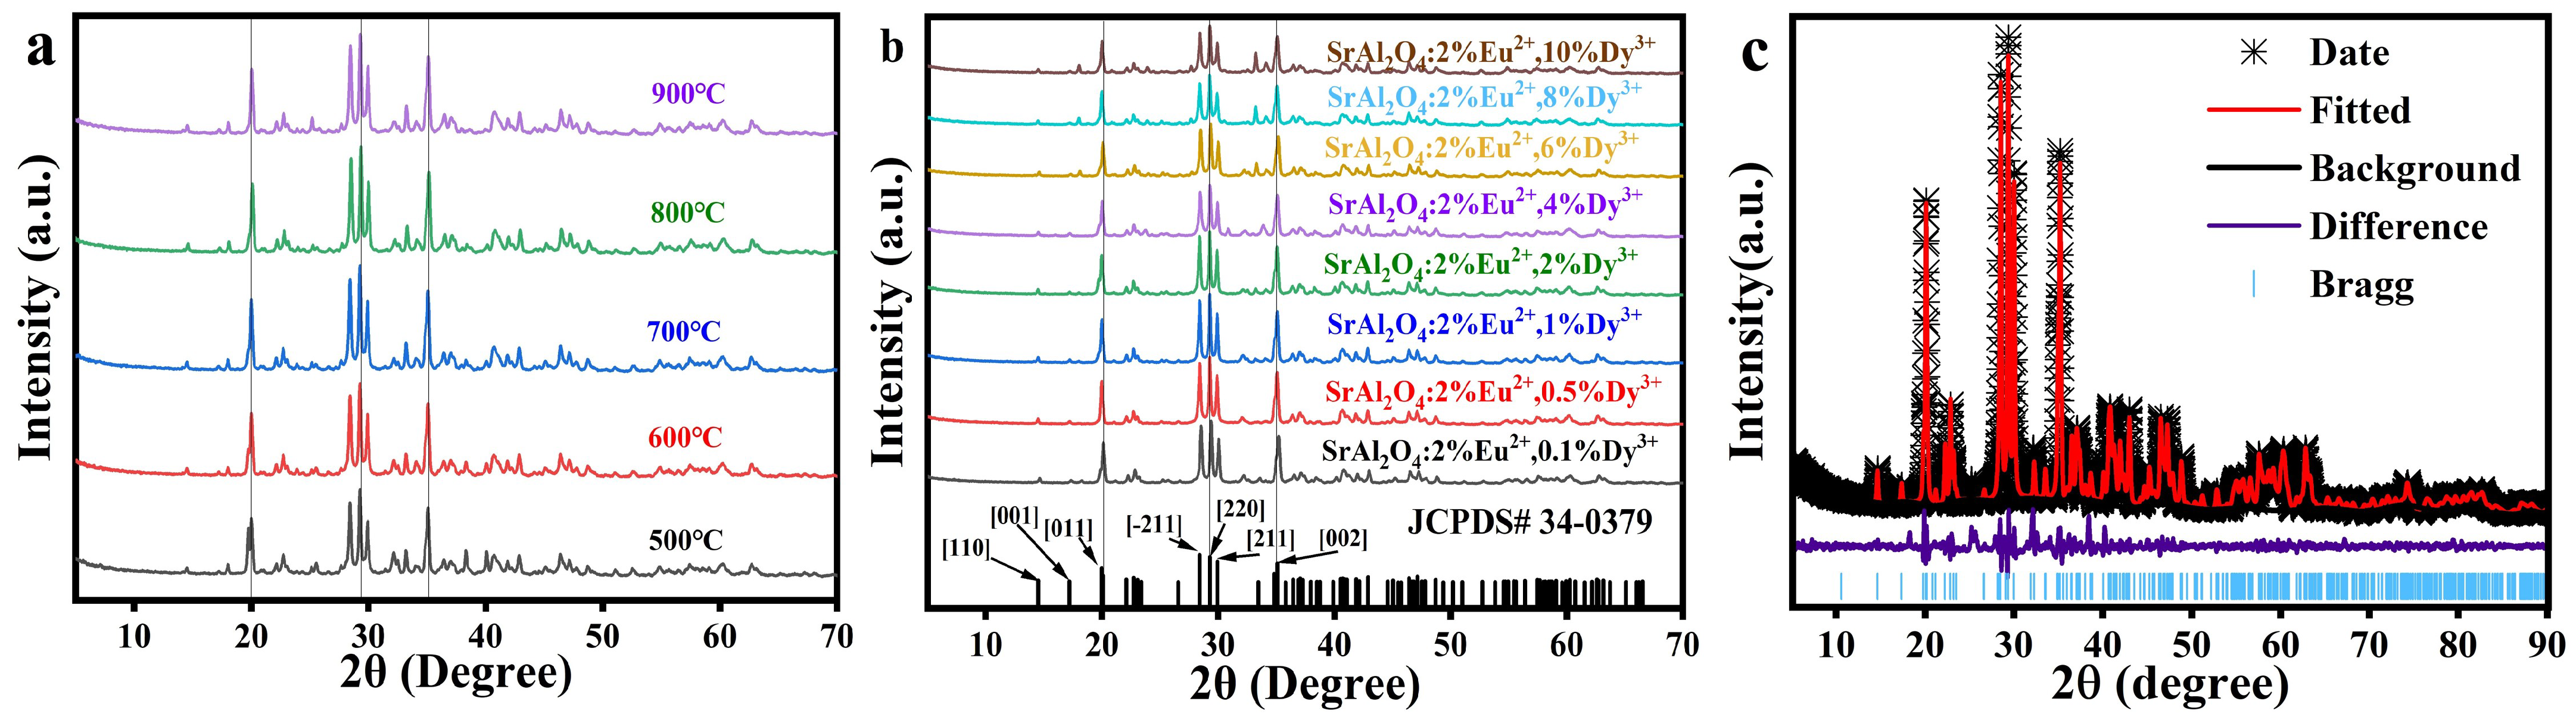
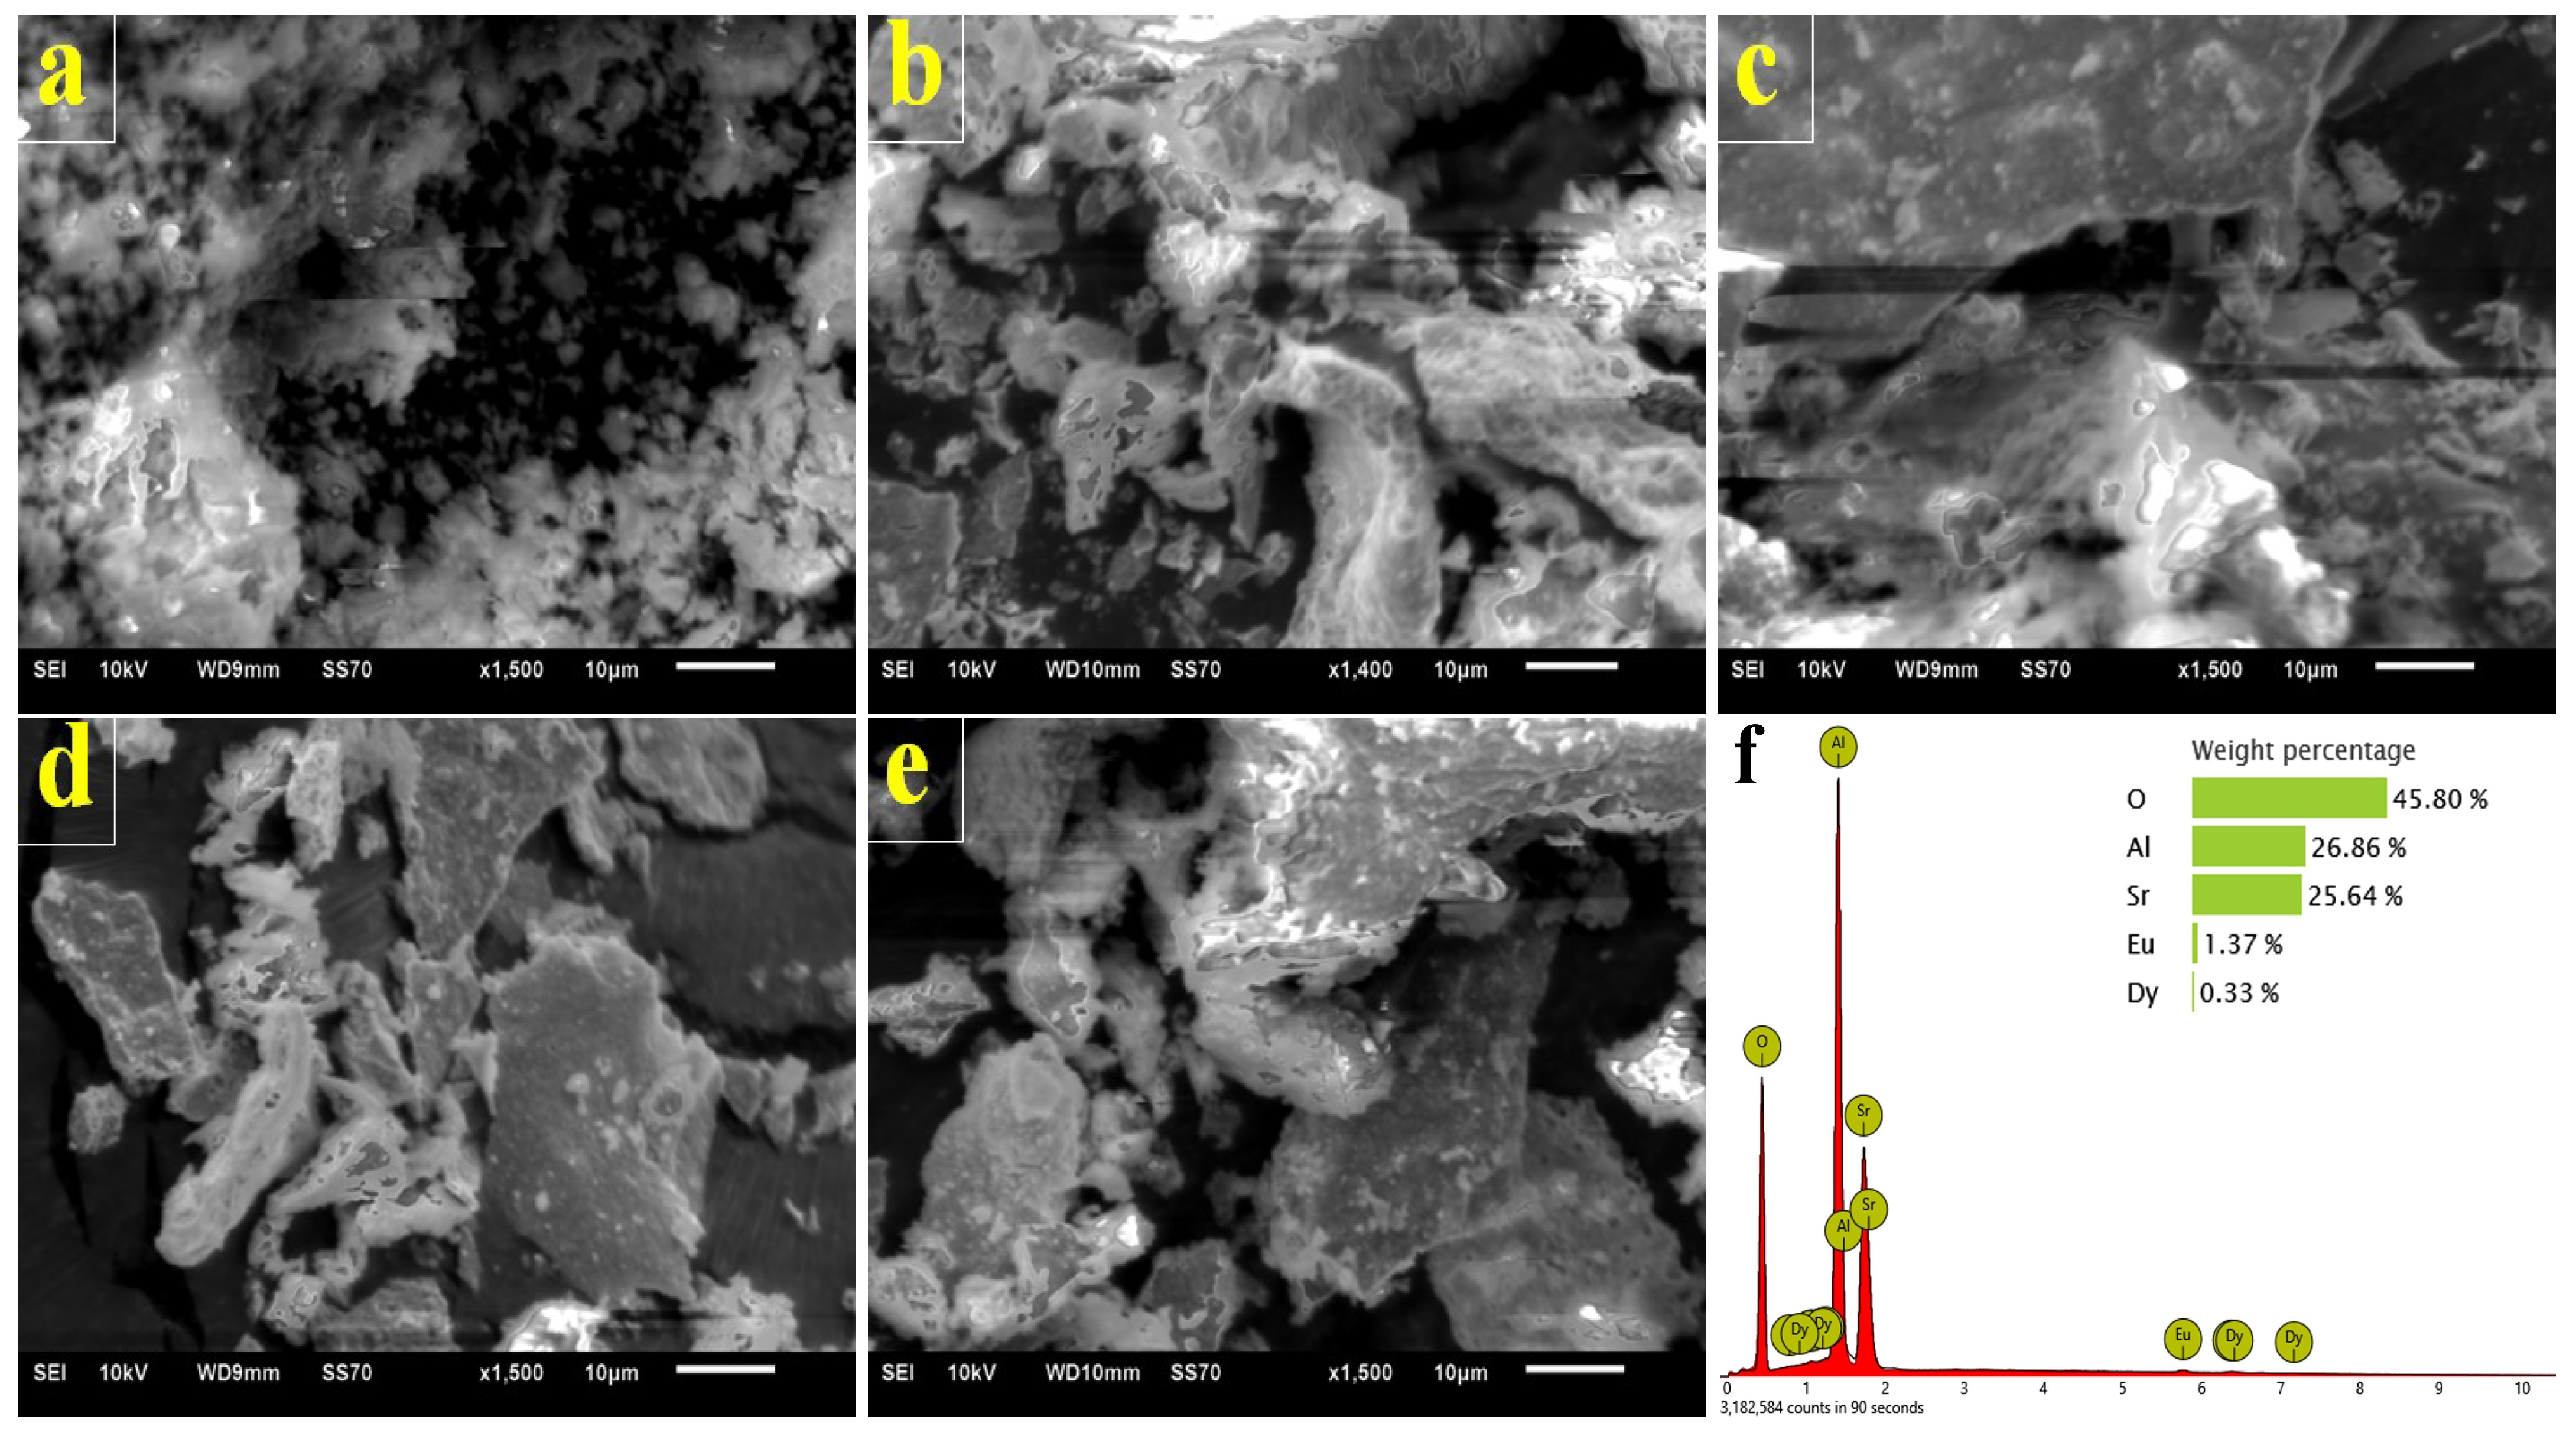
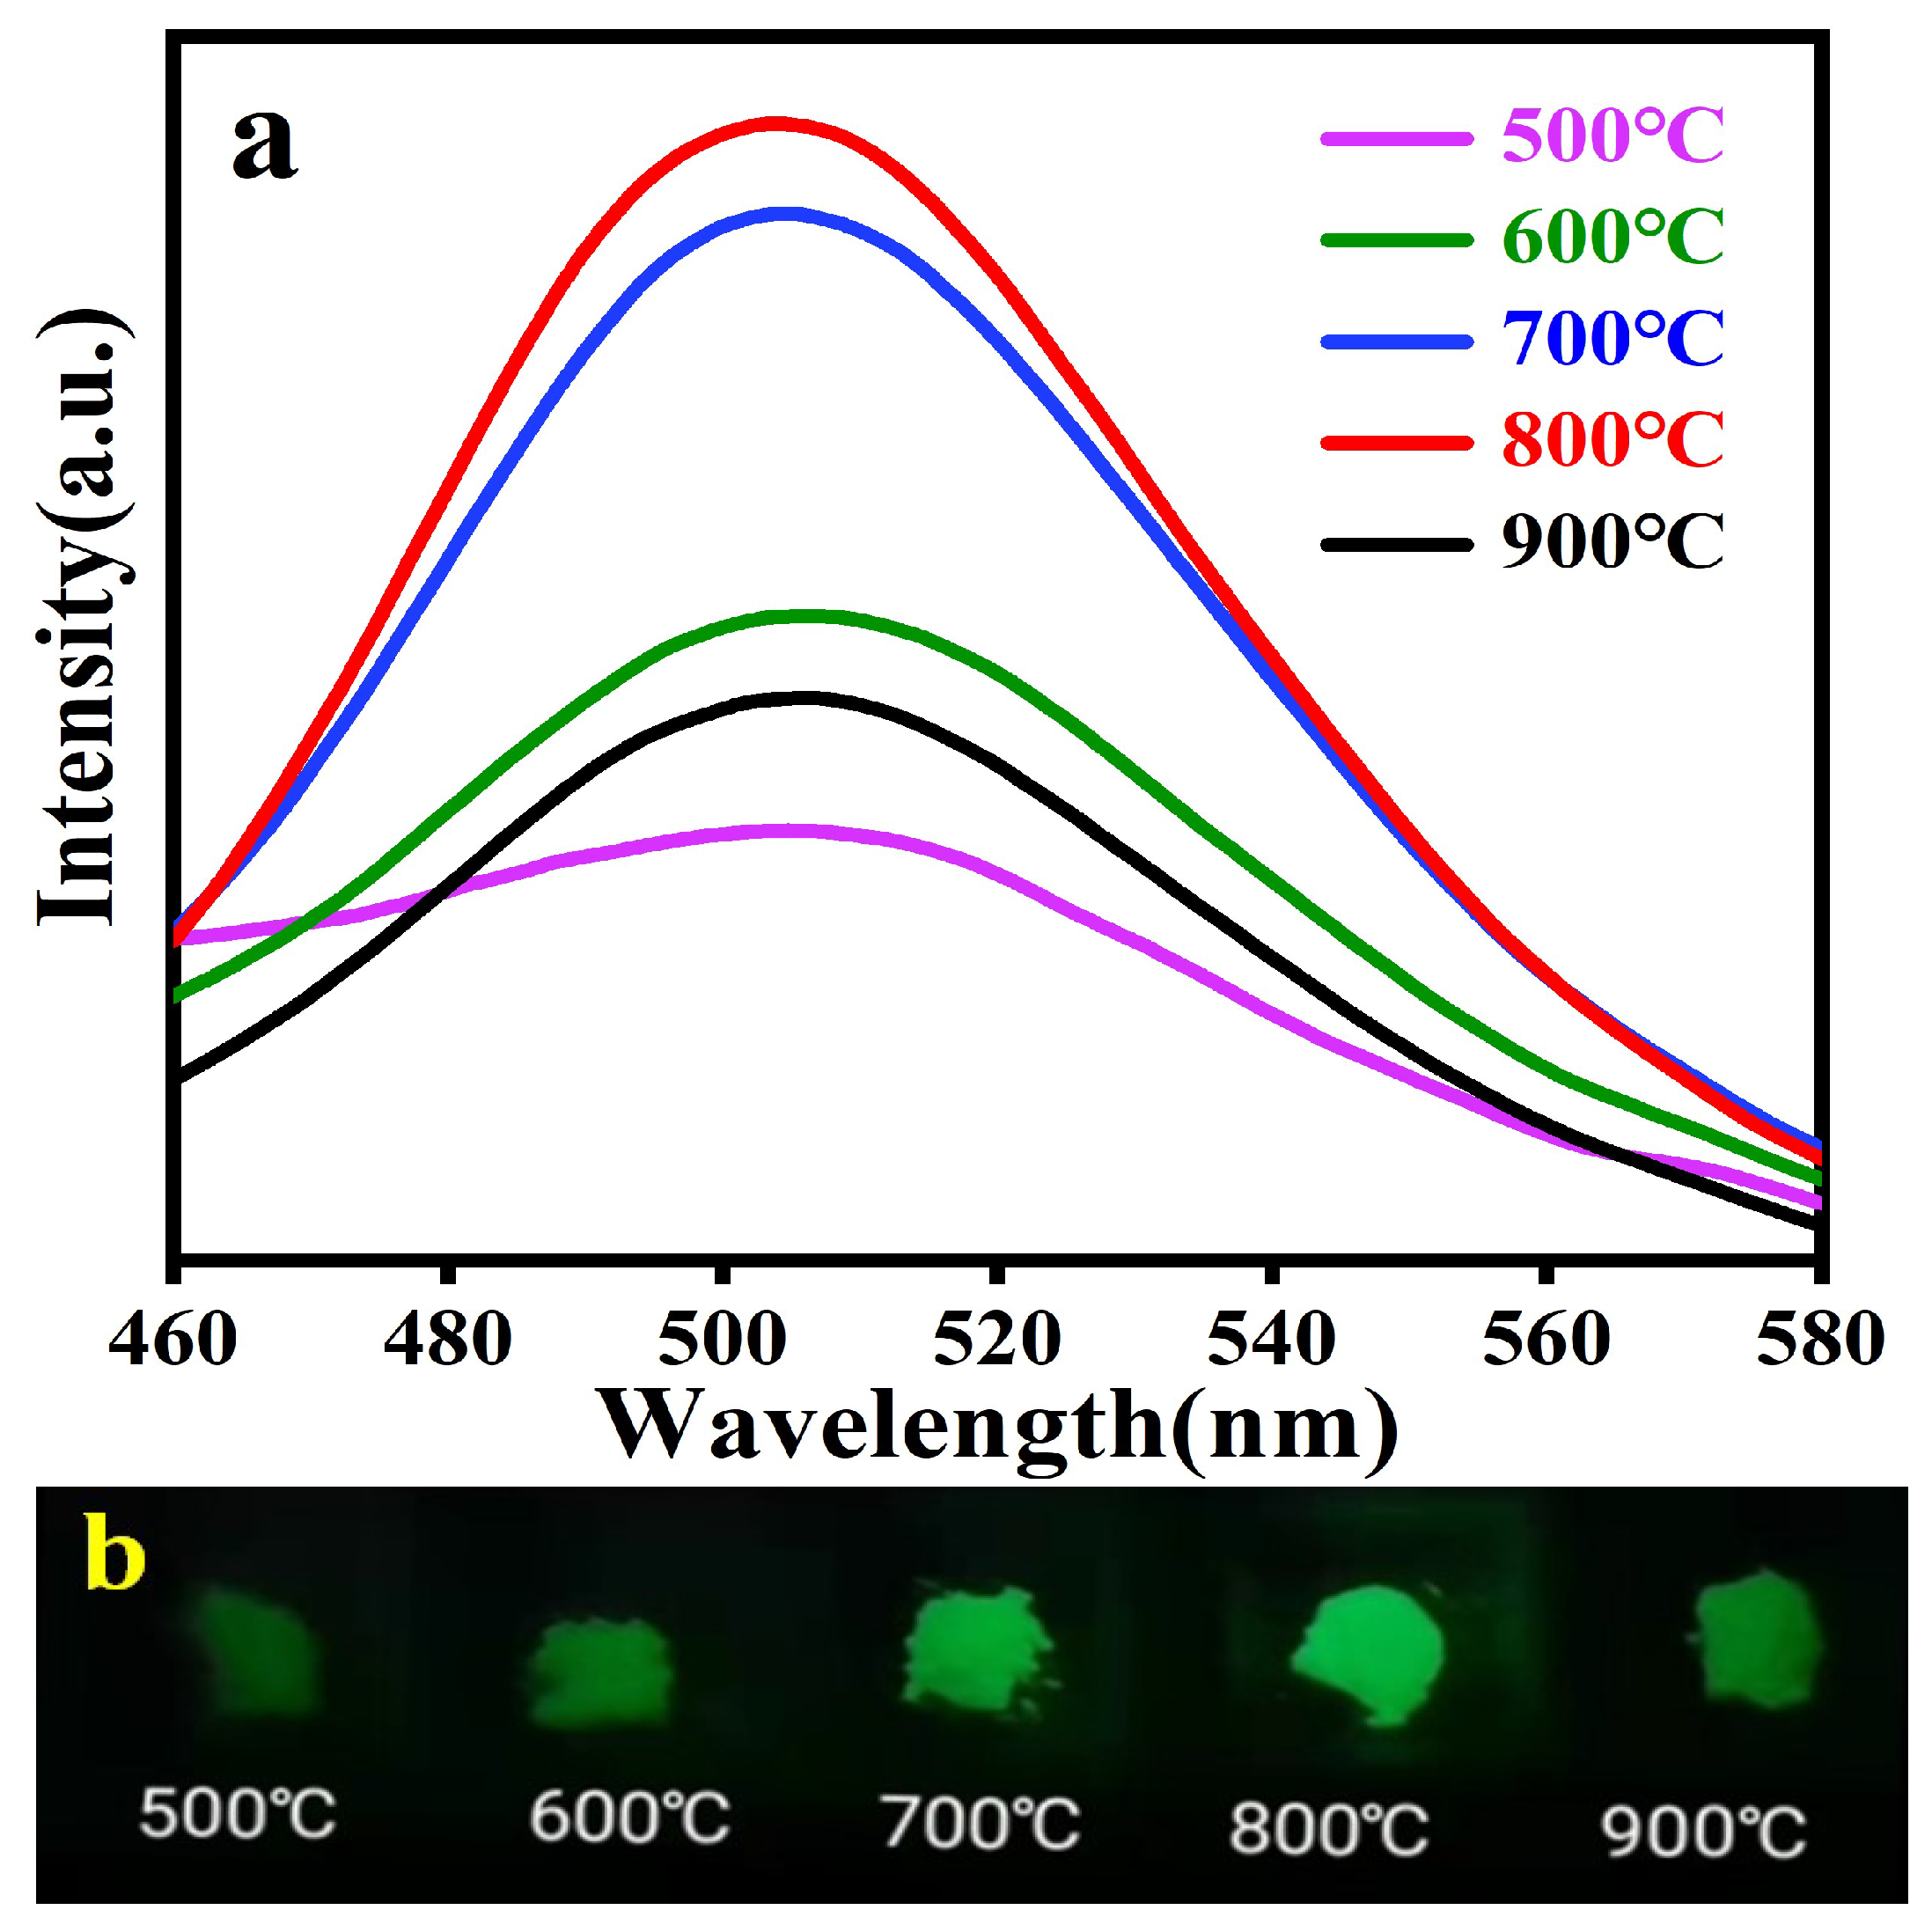
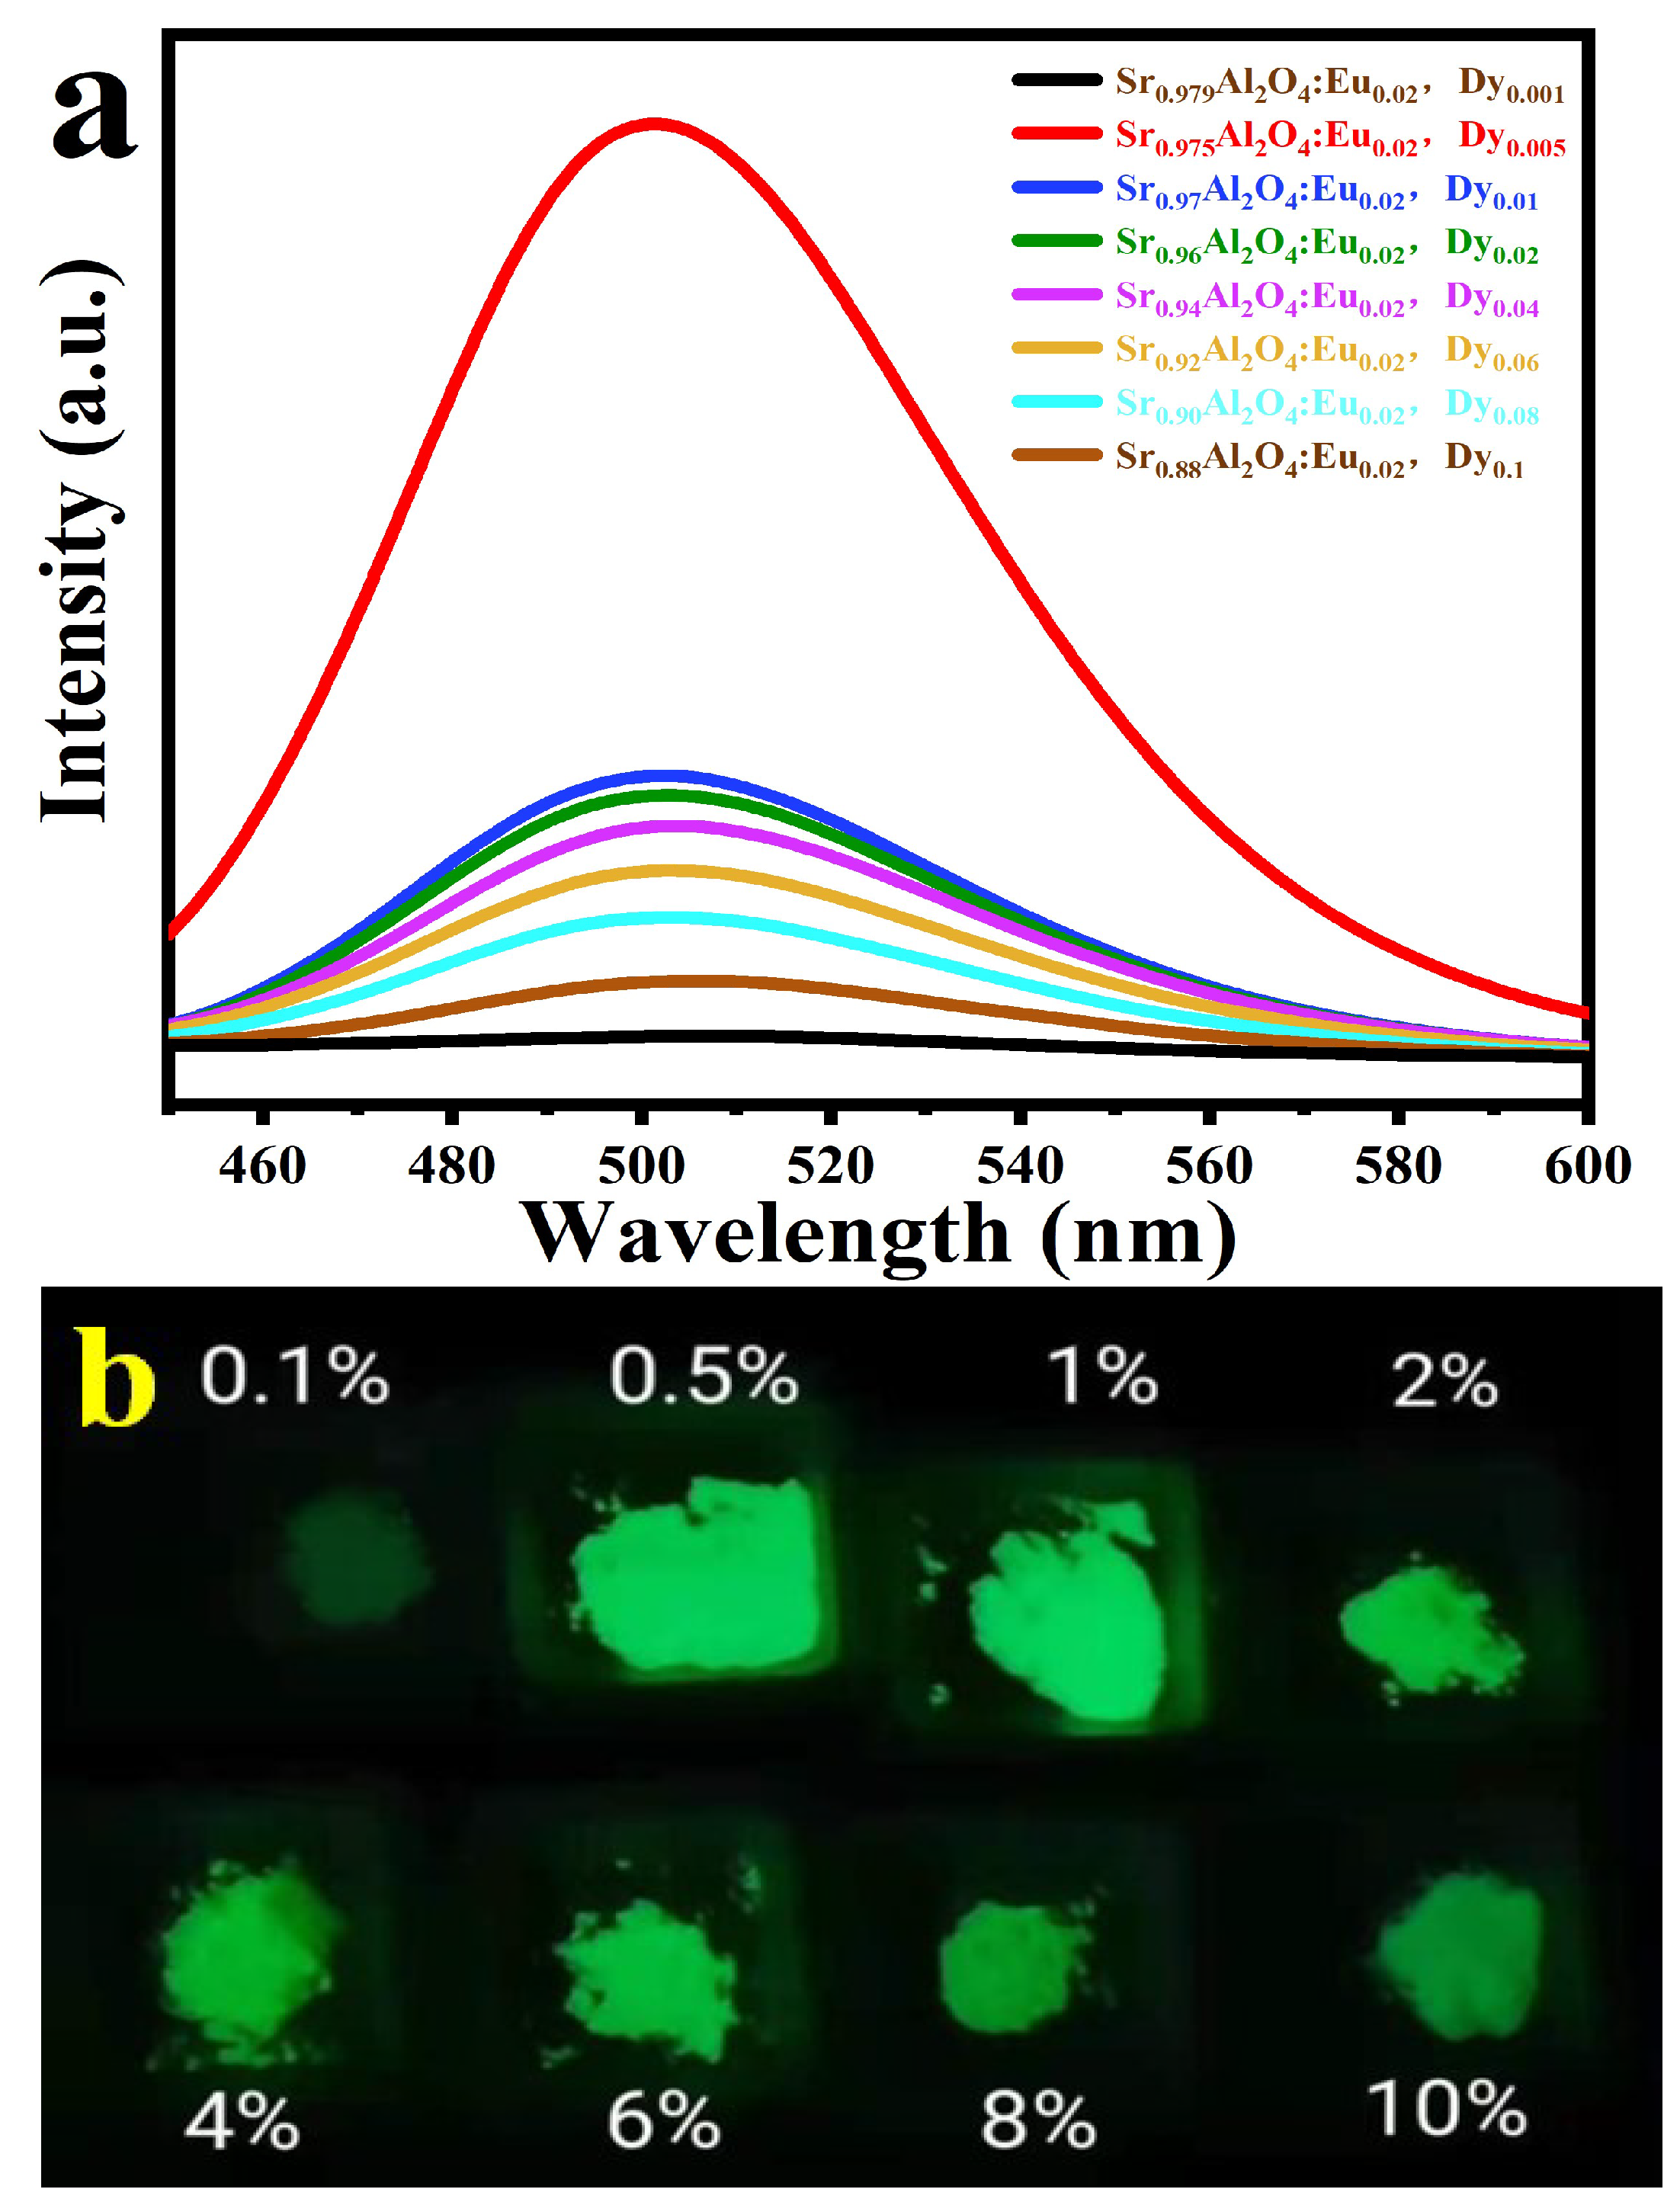
3.1. Phase Identification and Surface Morphology Analysis

The phase composition and purity of SrAl2O4: Eu2+, Dy3+ phosphor at different temperatures and SrAl2O4: Eu2+, Dy3+ phosphor doped with Dy ions of different concentrations were investigated by X-ray powder diffraction. Figure 1 shows the X-ray diffraction (XRD) pattern based on samples prepared at different temperatures and different Dy ion doping concentrations. The main reflections were observed at 2 θ values 19.951°, 22.740°, 28.386°, 29.275°, 29.922°, and 35.113°. It was found that the diffraction peaks of these samples could match well with the standard SrAl2O4(JCPDS#34–0379) card. Thus, these peaks can be attributed to the X-ray reflections from monoclinic SrAl2O4 crystallographic planes (001), (120), (−211), (220), (211), and (013), per the information recorded in JCPDS card number 34-0379 [22]. Strontium aluminate showed prominent peaks at these diffraction angles. The long afterglow phosphorescent substance SrAl2O4: Eu2+, Dy3+ was identified as the source of the strong peaks by comparing the phosphor’s X-ray pattern with a reference card (JCPDS 34-0379). There were no additional impurity peaks between the observed patterns (black cross) and calculated data (red line), and the refinement parameter value was R w p = 7.448% and χ 2 = 4.61, which confirmed that the SrAl2O4 host was a single phase. The Rietveld refinement XRD patterns of the sample were carried out by the general structure analysis system (GSAS) software [23].
High-temperature and low-temperature phases of SrAl2O4 are composed of hexagonal and monoclinic polymorphs, respectively. It is typically asserted that when SrAl2O4 is doped with rare-earth ions, only the monoclinic phase exhibits luminescence features [10]. Additionally, the lack of lines from other impurity structures, such as Sr4Al14O25 or Sr3Al2O6 low-temperature phases, suggests that the products produced are all SrAl2O4 monoclinic phase [22]. The ionic radii of the dopants and codopants in SrAl2O4 determine where they should be positioned. The Sr2+ (1.21 Å) ion sites are easily occupied by the Eu2+ (1.20 Å) and Dy3+ (0.97 Å) ions. Eu3+ ions inserted in the Sr2+ sites of SrAl2O4 are easily reduced to Eu2+ because Sr2+ and Eu2+ ions have extremely similar ionic radii [24], Eu2+ is expected to replace the Sr2+ site in SrAl2O4. The position and form of the luminescence emission band for Dy ions are not altered by the coactivation of the trivalent rare earth. For SrAl2O4: Eu2+, Dy3+, they solely affect the afterglow’s duration and intensity, making it much longer and much more intense [25]. Even without Dy3+ codoping, the afterglow is there [26]. Because of this, we are confident in stating that Eu2+ serves as the luminescence center in these compounds. Thereby demonstrating that Eu2+ and Dy3+ ions had been successfully doped in SrAl2O4 matrix.
SEM micrographs of different temperature-controlled synthesis SrAl2O4: Eu2+, Dy3+ phosphors (Figure 2) demonstrate this material’s granular microstructure. It has a magnification of 1500 times, with an average scale size of about 10 μ m. The samples’ respective sintering temperatures were 500 °C, 600 °C, 700 °C, 800 °C, and 900 °C. It is evident that as the temperature rises, the phosphor’s molecular gap will widen. It can be found that the molecular gap is increased due to the significant amount of gas that the reaction produced after increasing the sintering temperature. Figure 2f shows the elemental composition and content of SrAl2O4: 2%Eu2+, 0.5%Dy3+ phosphor. The necessary elements of Sr, Al, O, Eu, Dy can be directly recorded in the EDX spectrum. It is clear that the atomic percentages of the Eu2+ ion was measured to be about 1.37% and the atomic percentages of the Dy3+ ion was measured to be about 0.33%, which is a little lower than the standard value 2%Eu and 0.5%Dy based on the chemical formula due to the influence of oxygen in the air during the tested operations. In the light of the foregoing, it can be suggested that Eu2+ and Dy3+ activated SrAl2O4 phosphors have been successfully synthesized in the current study.

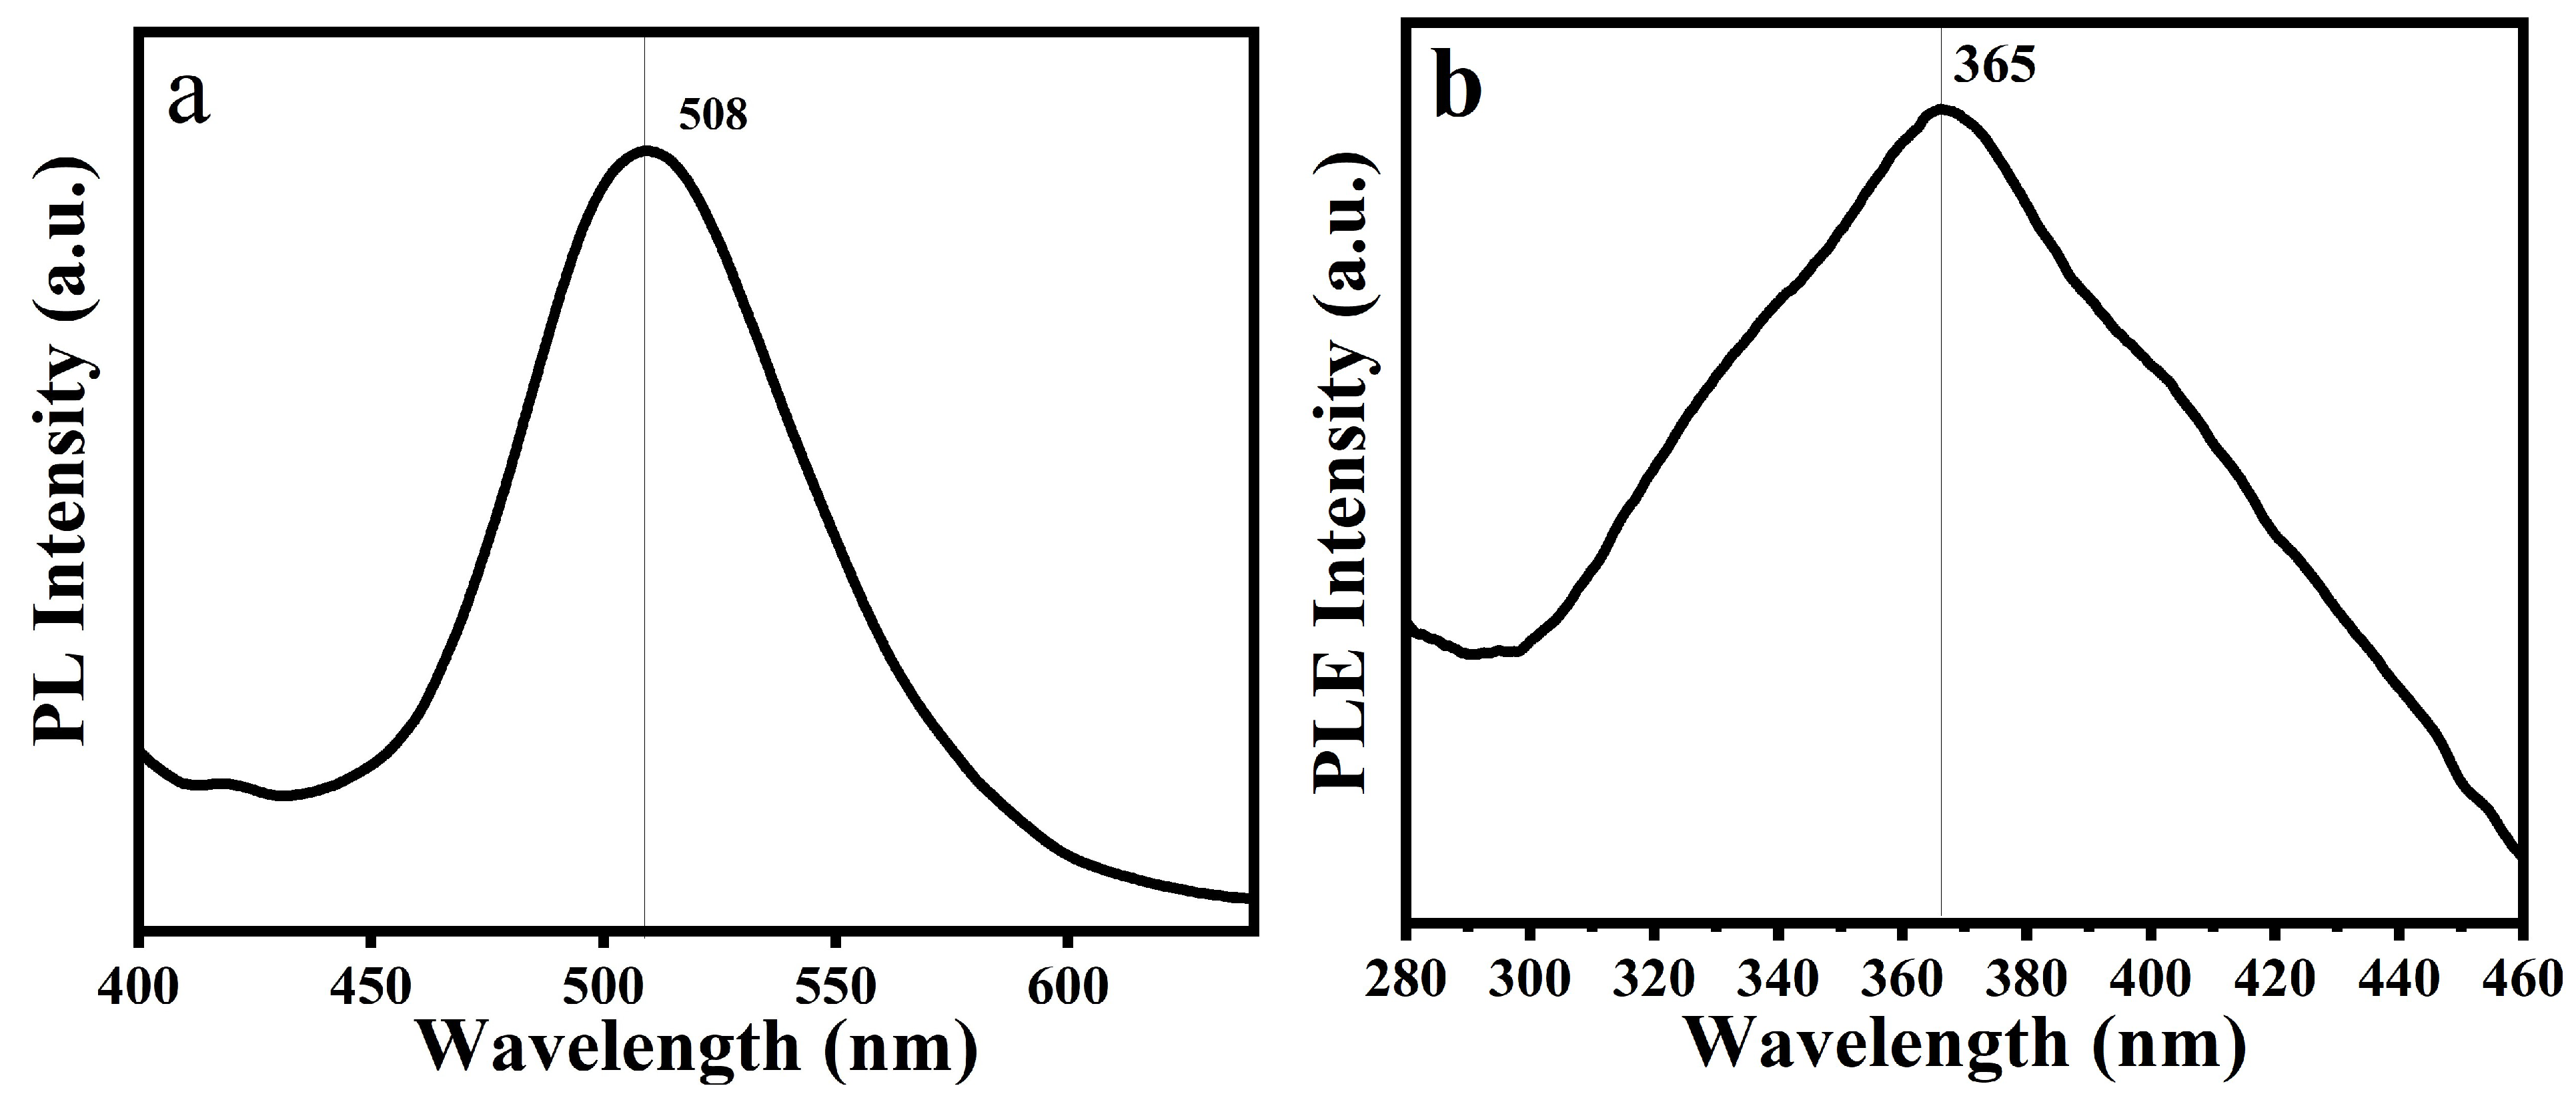
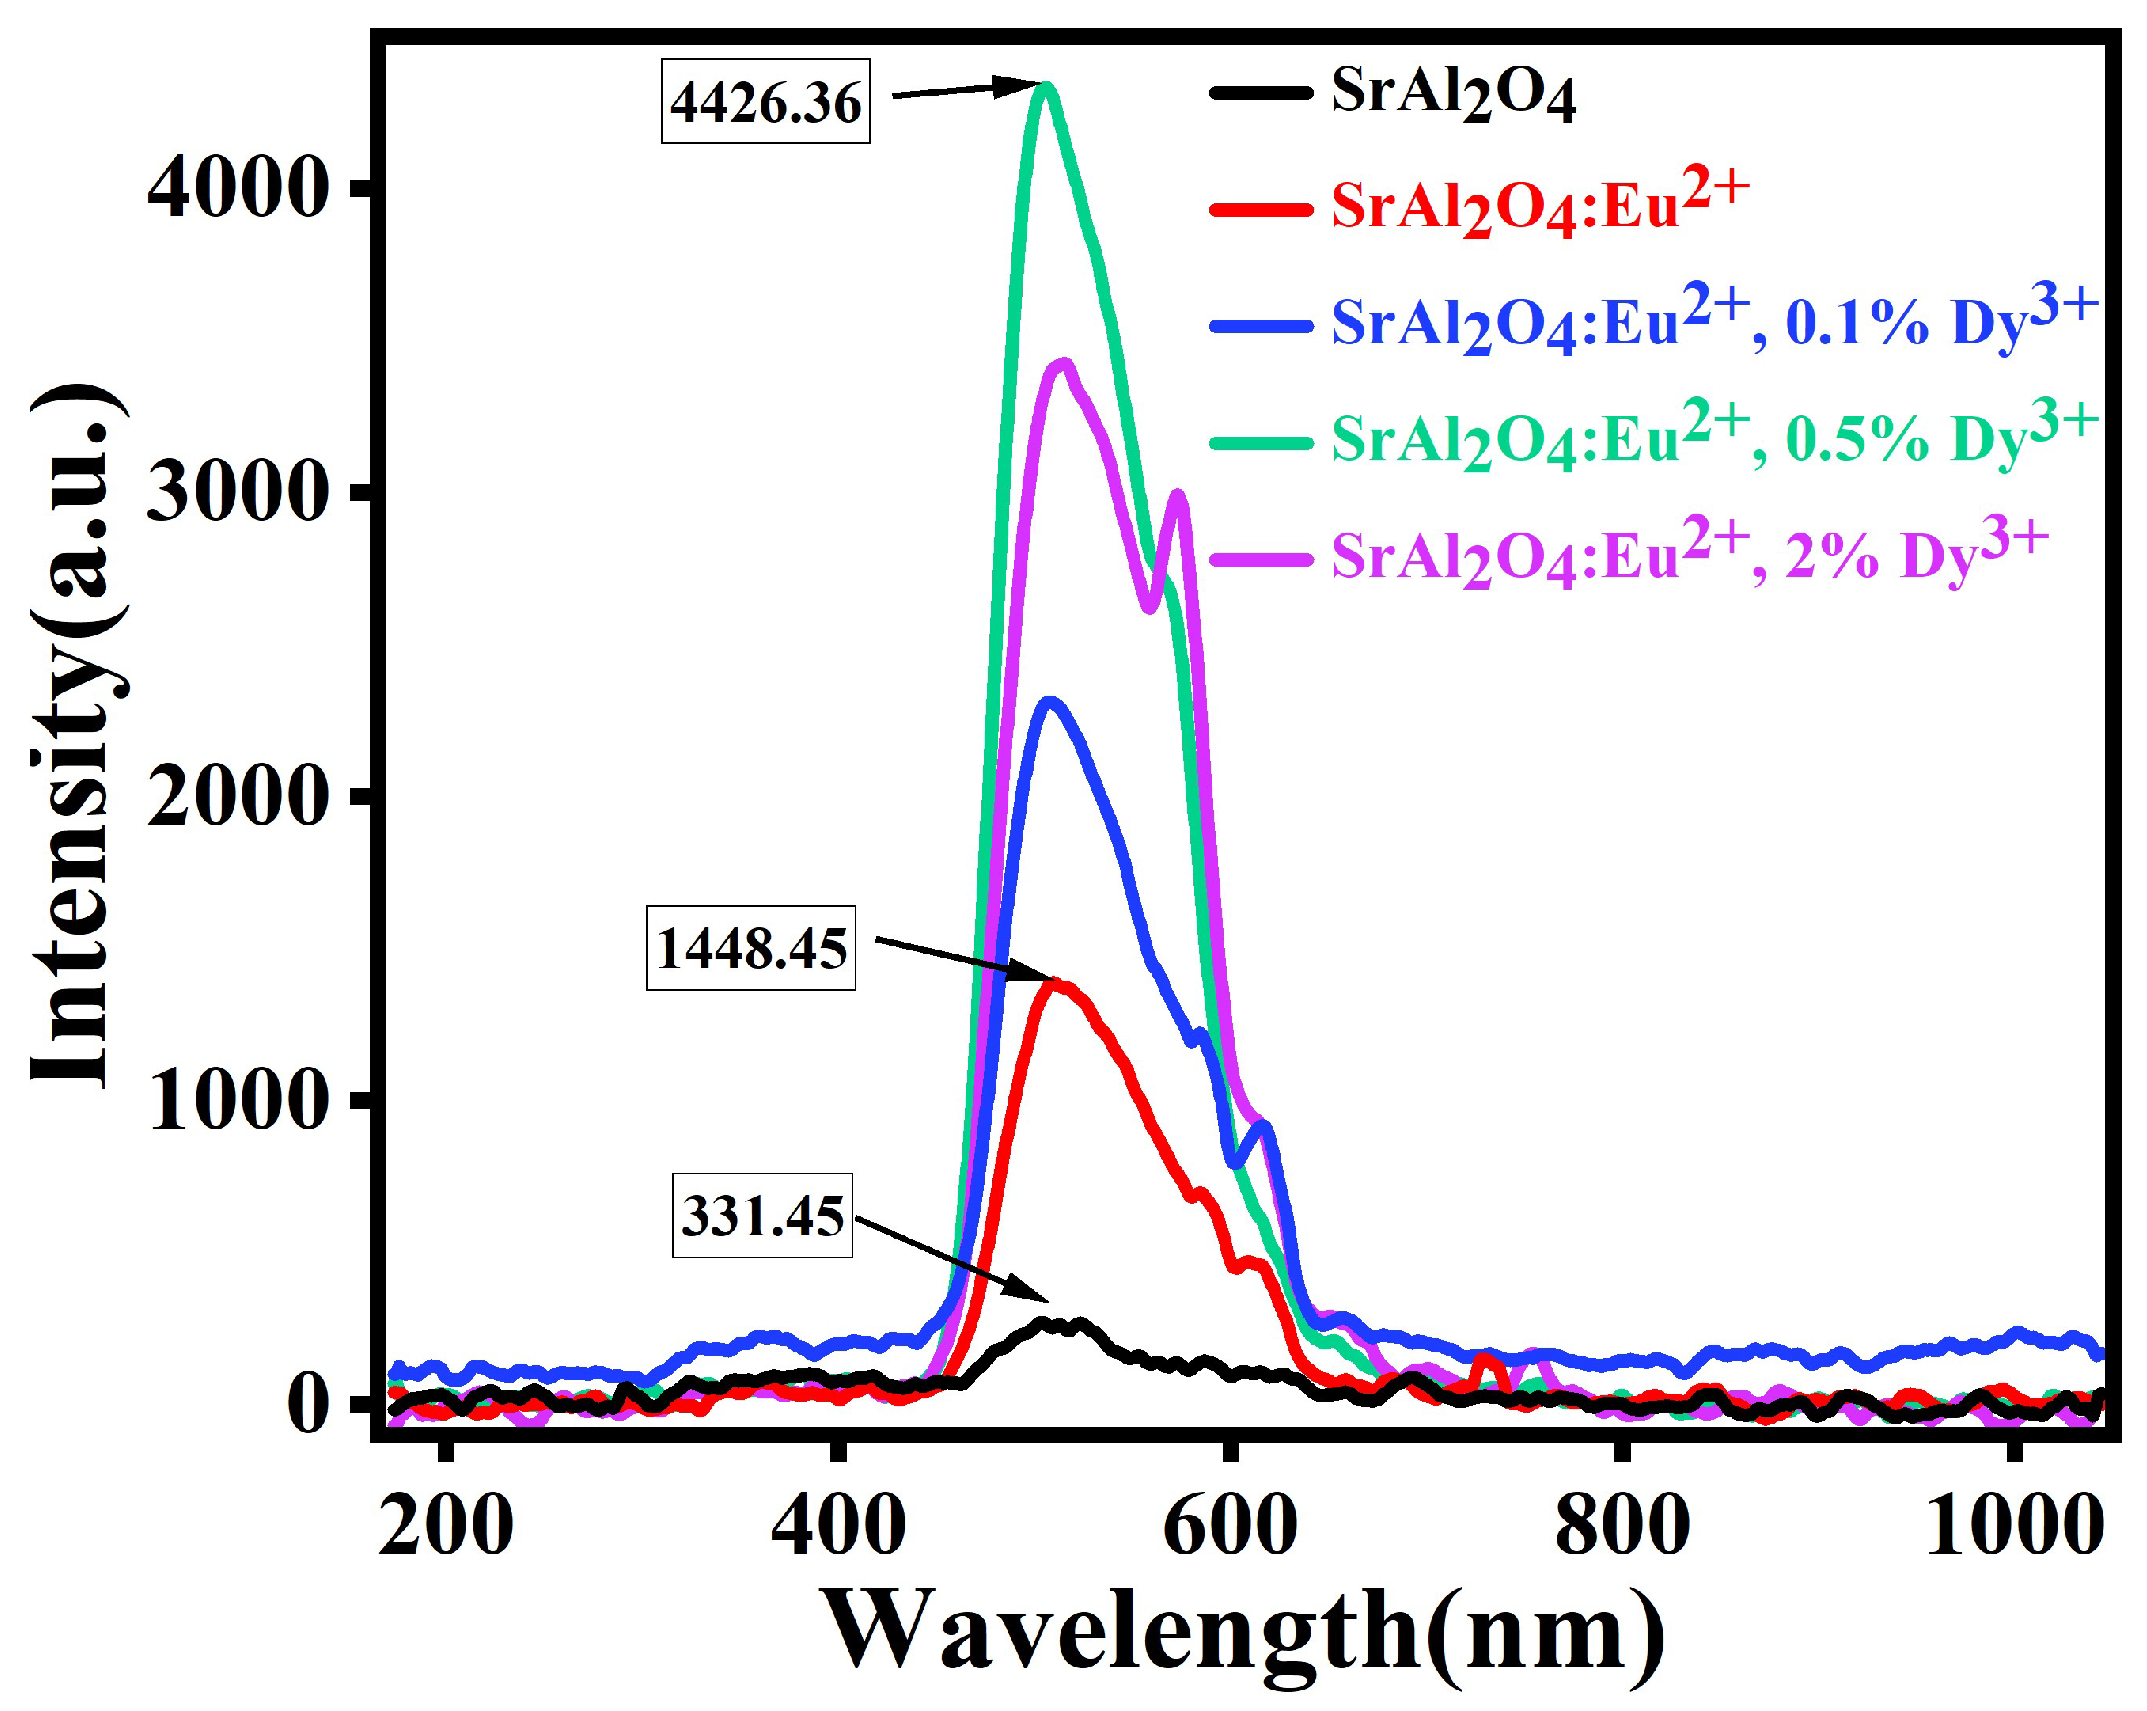
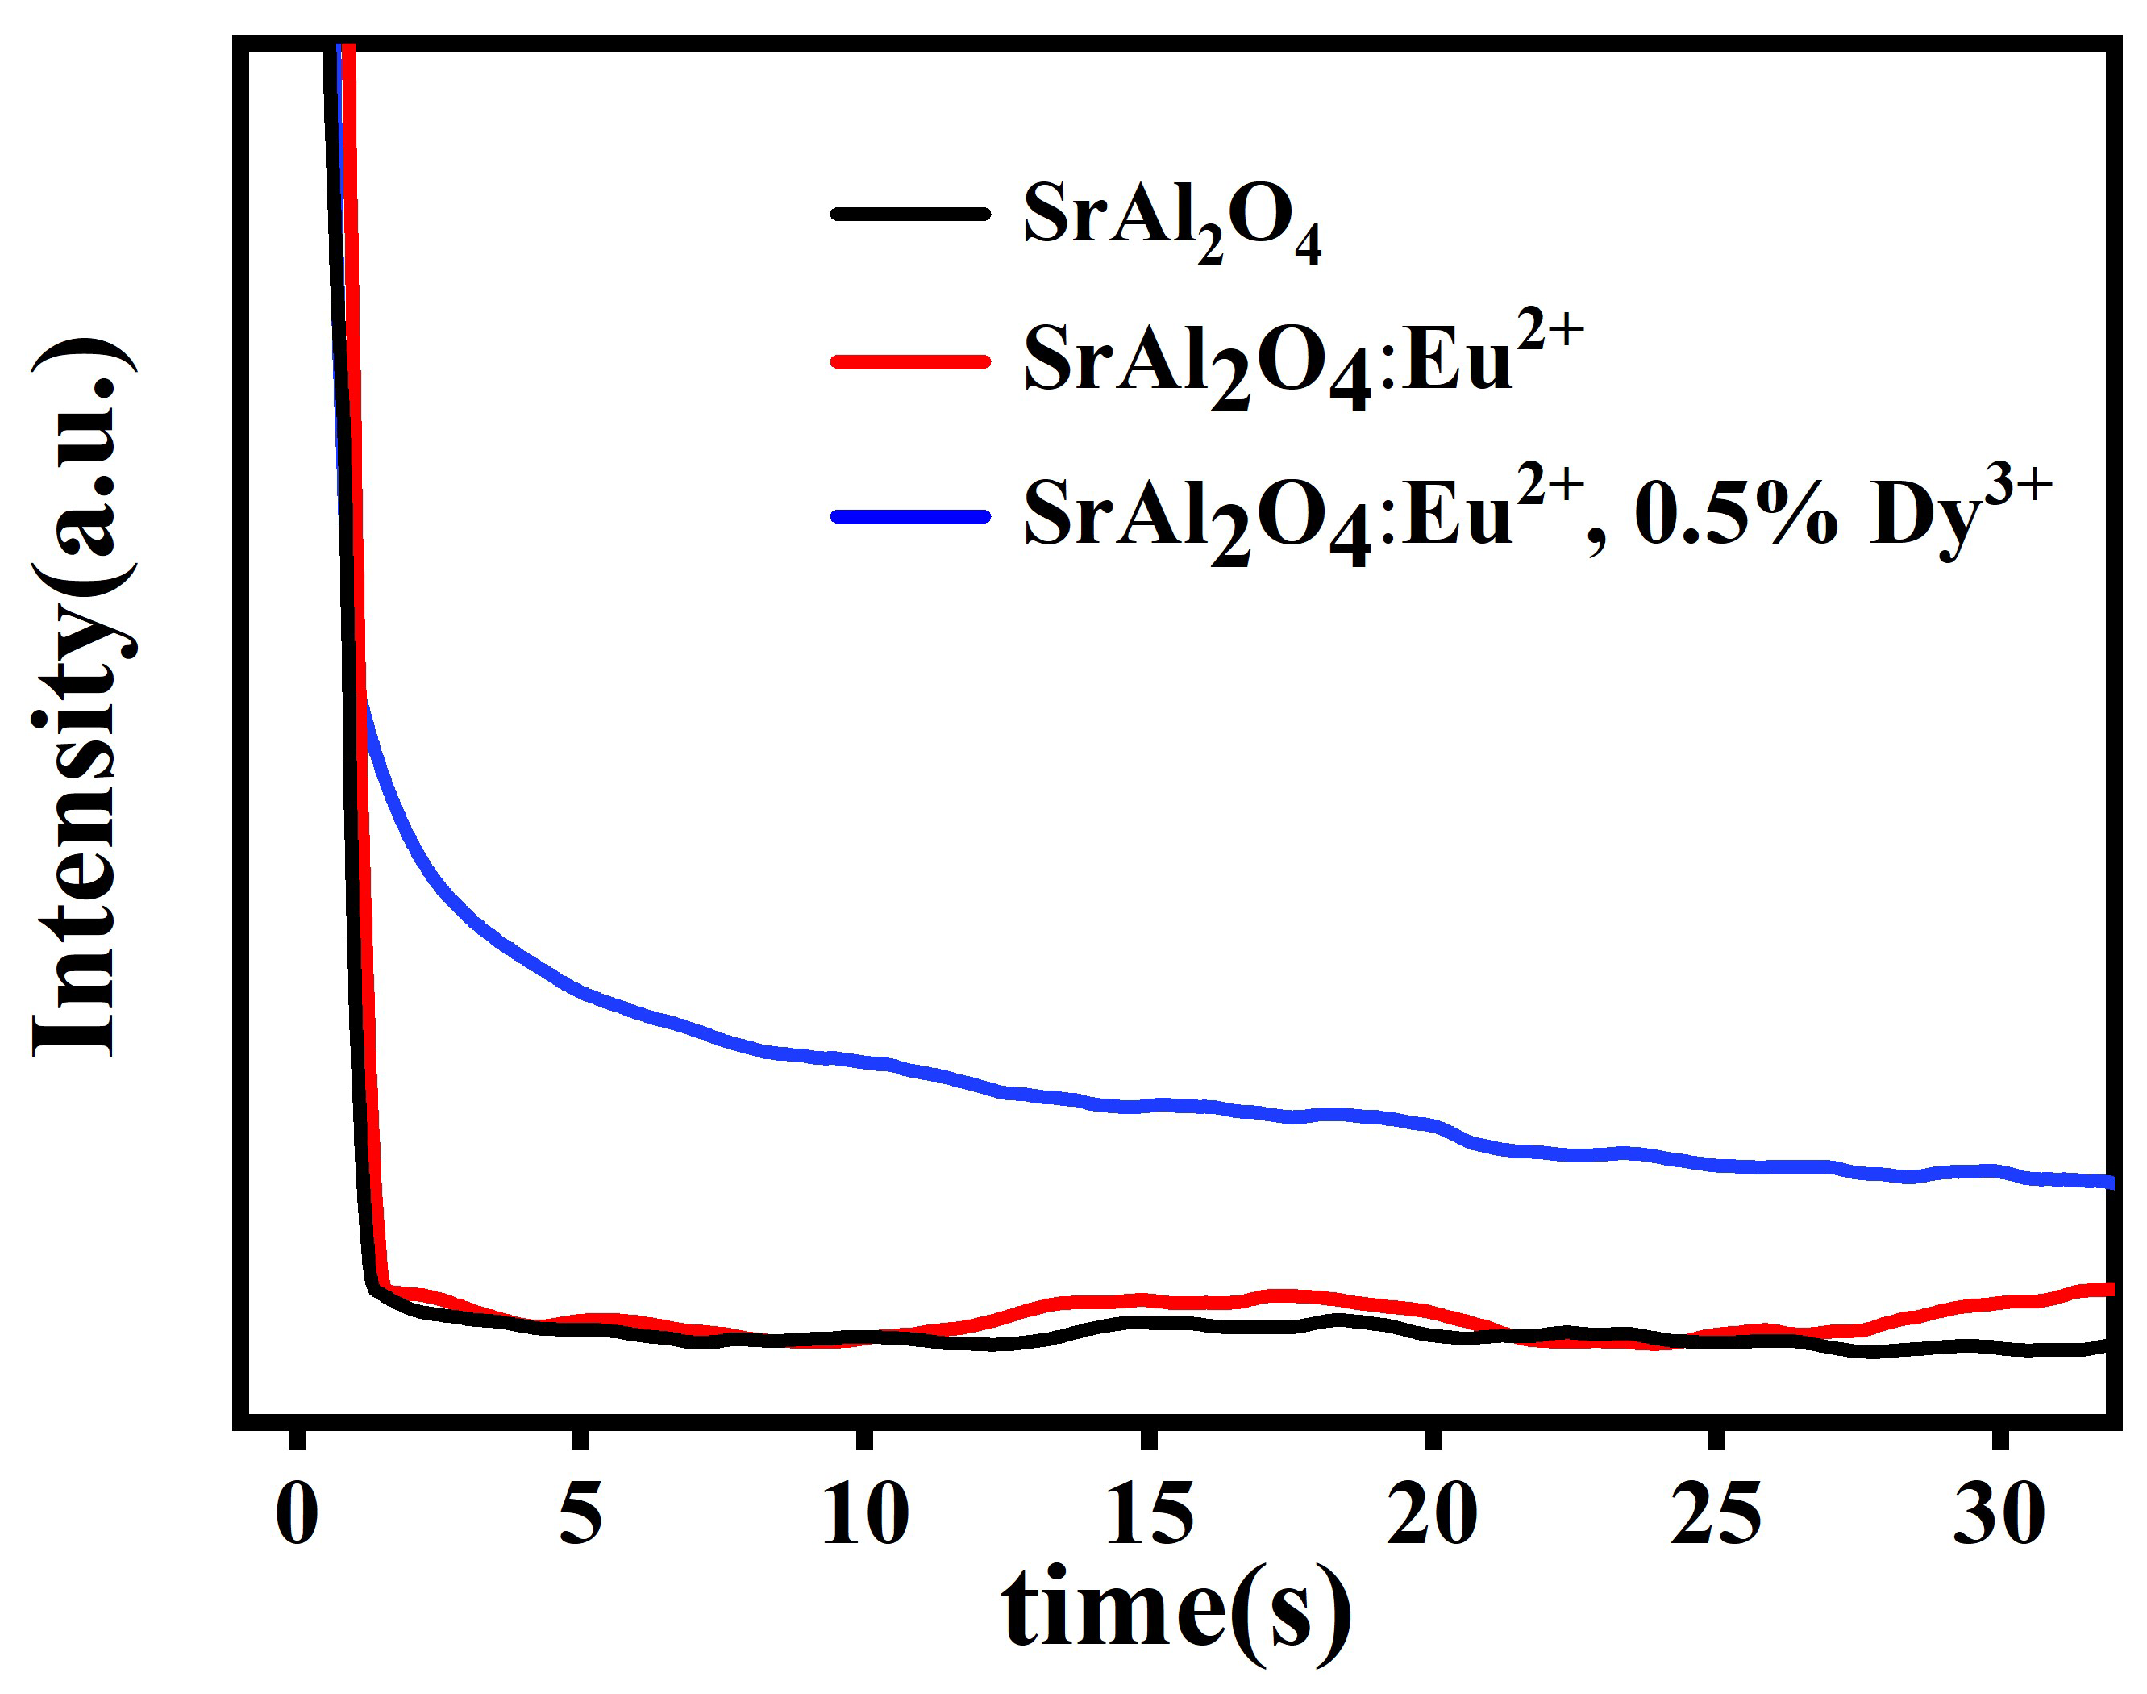
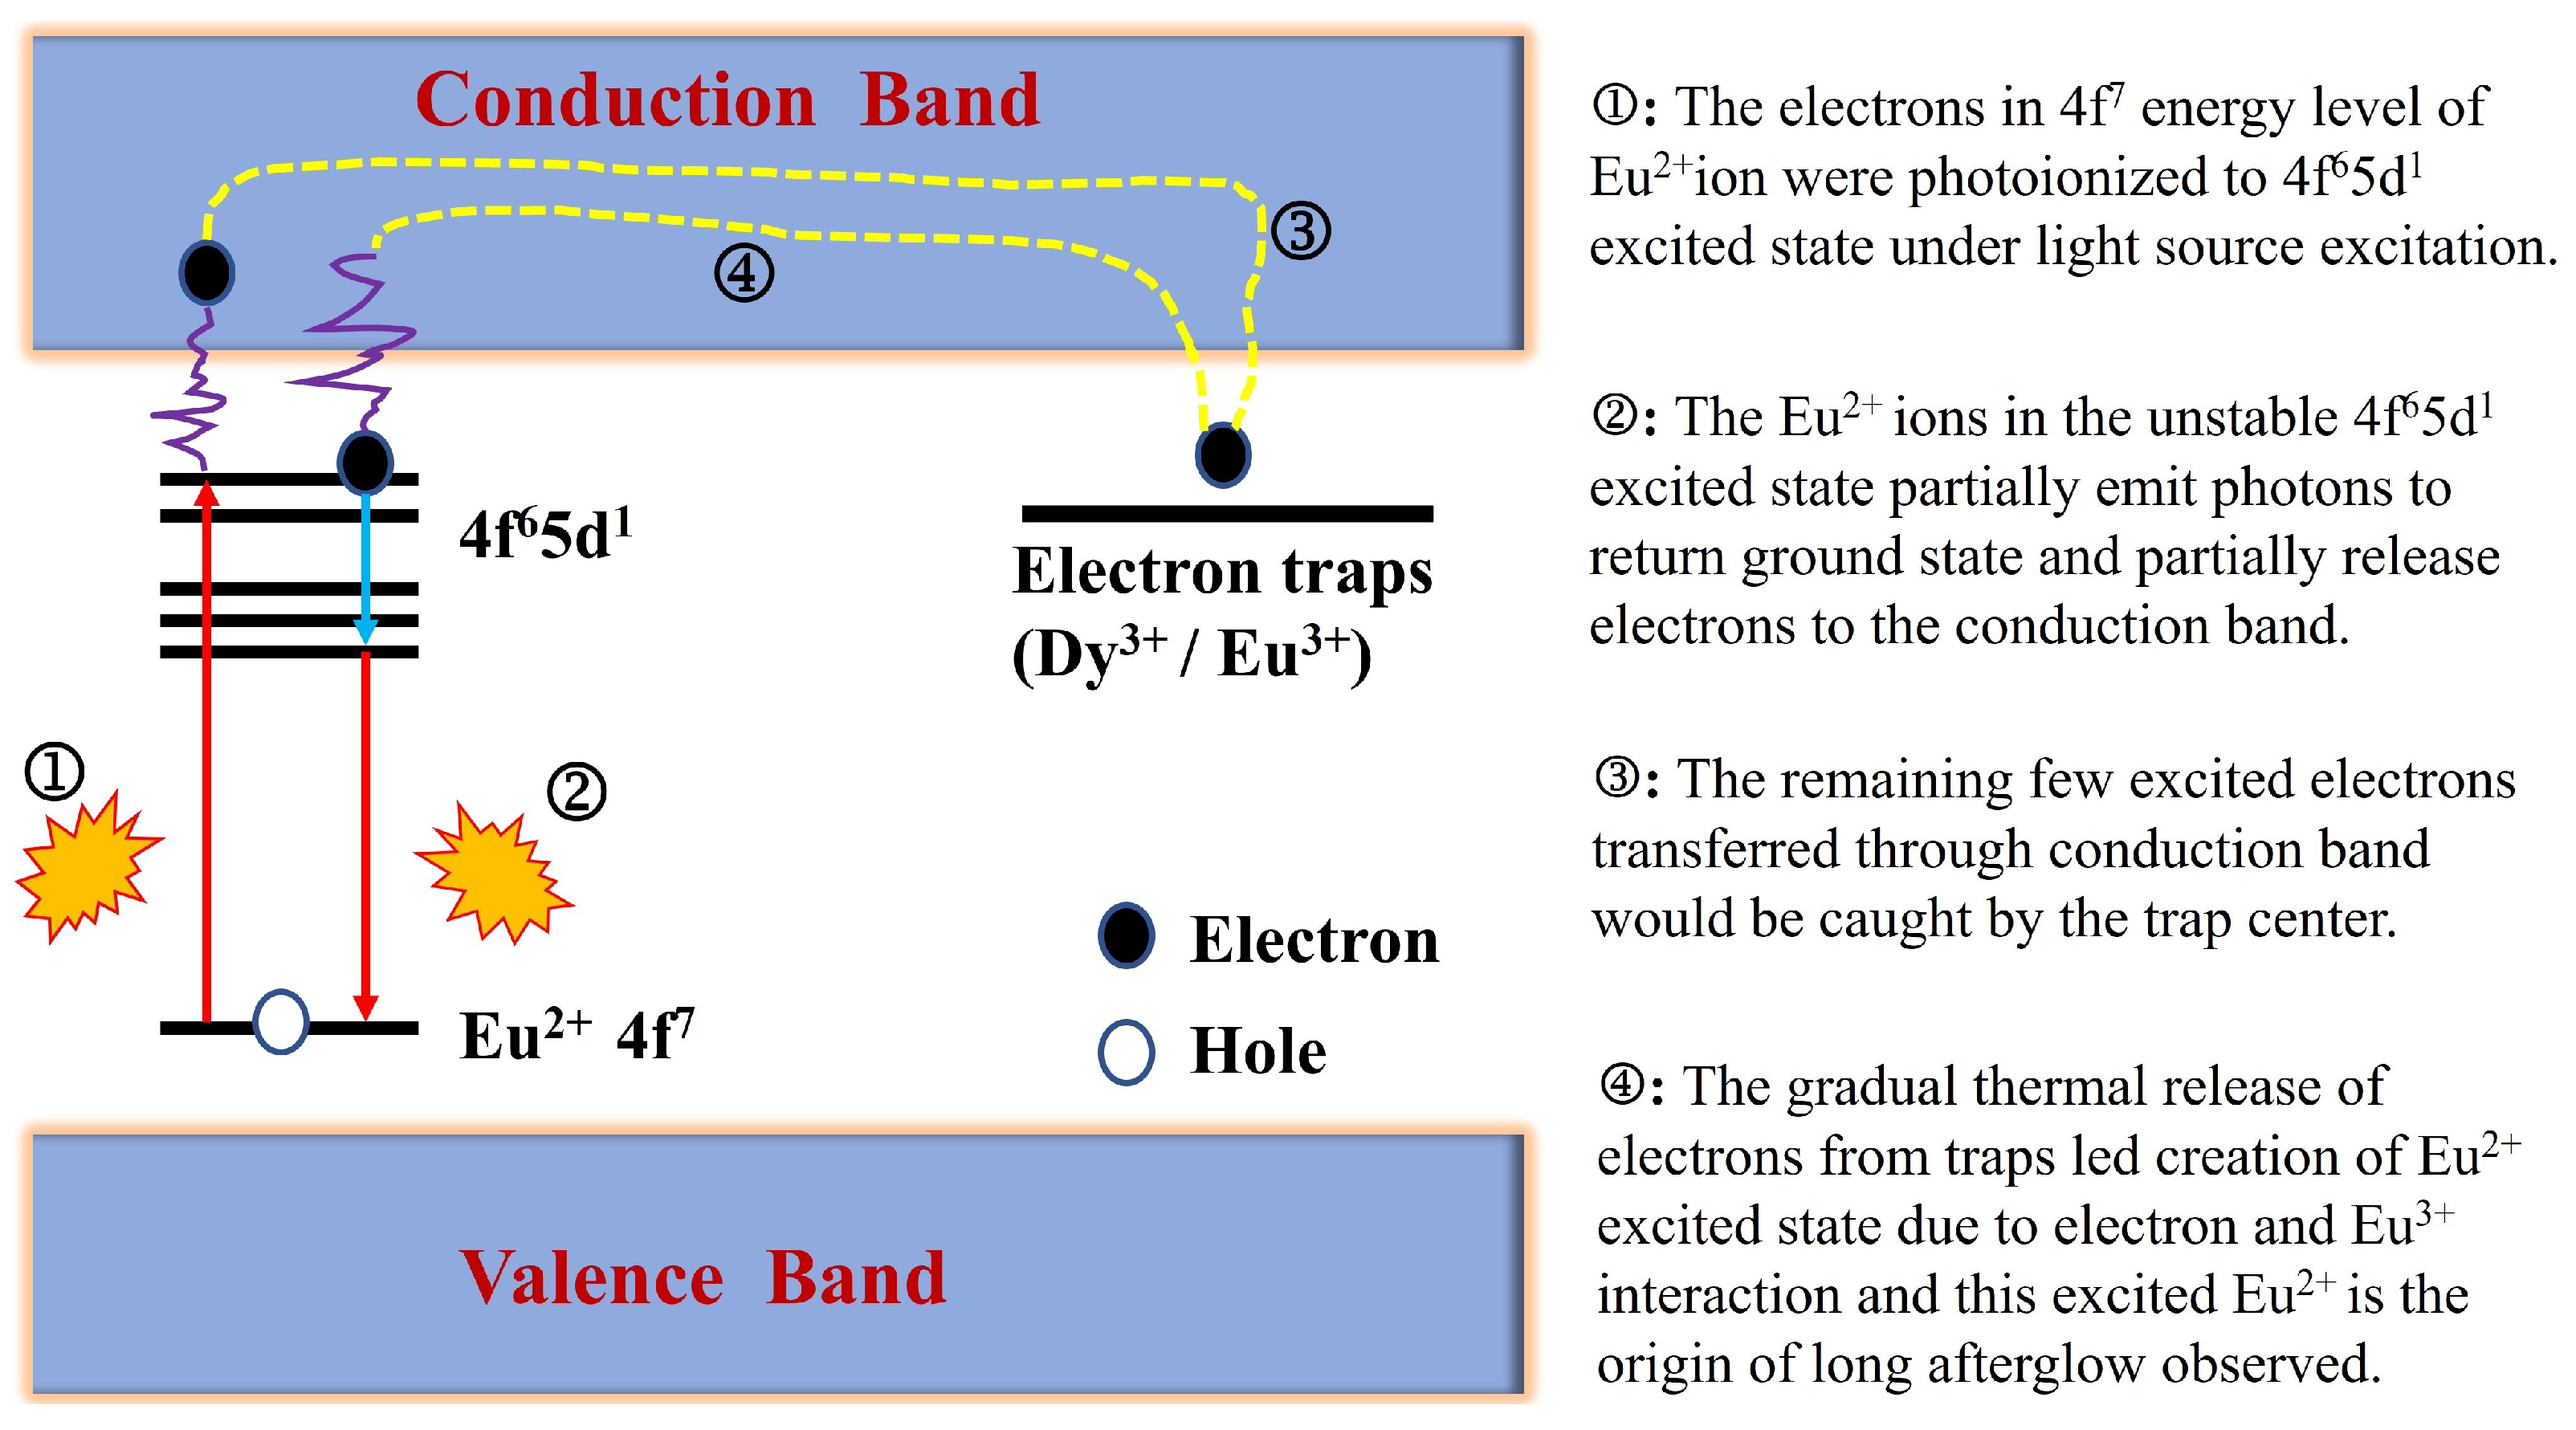
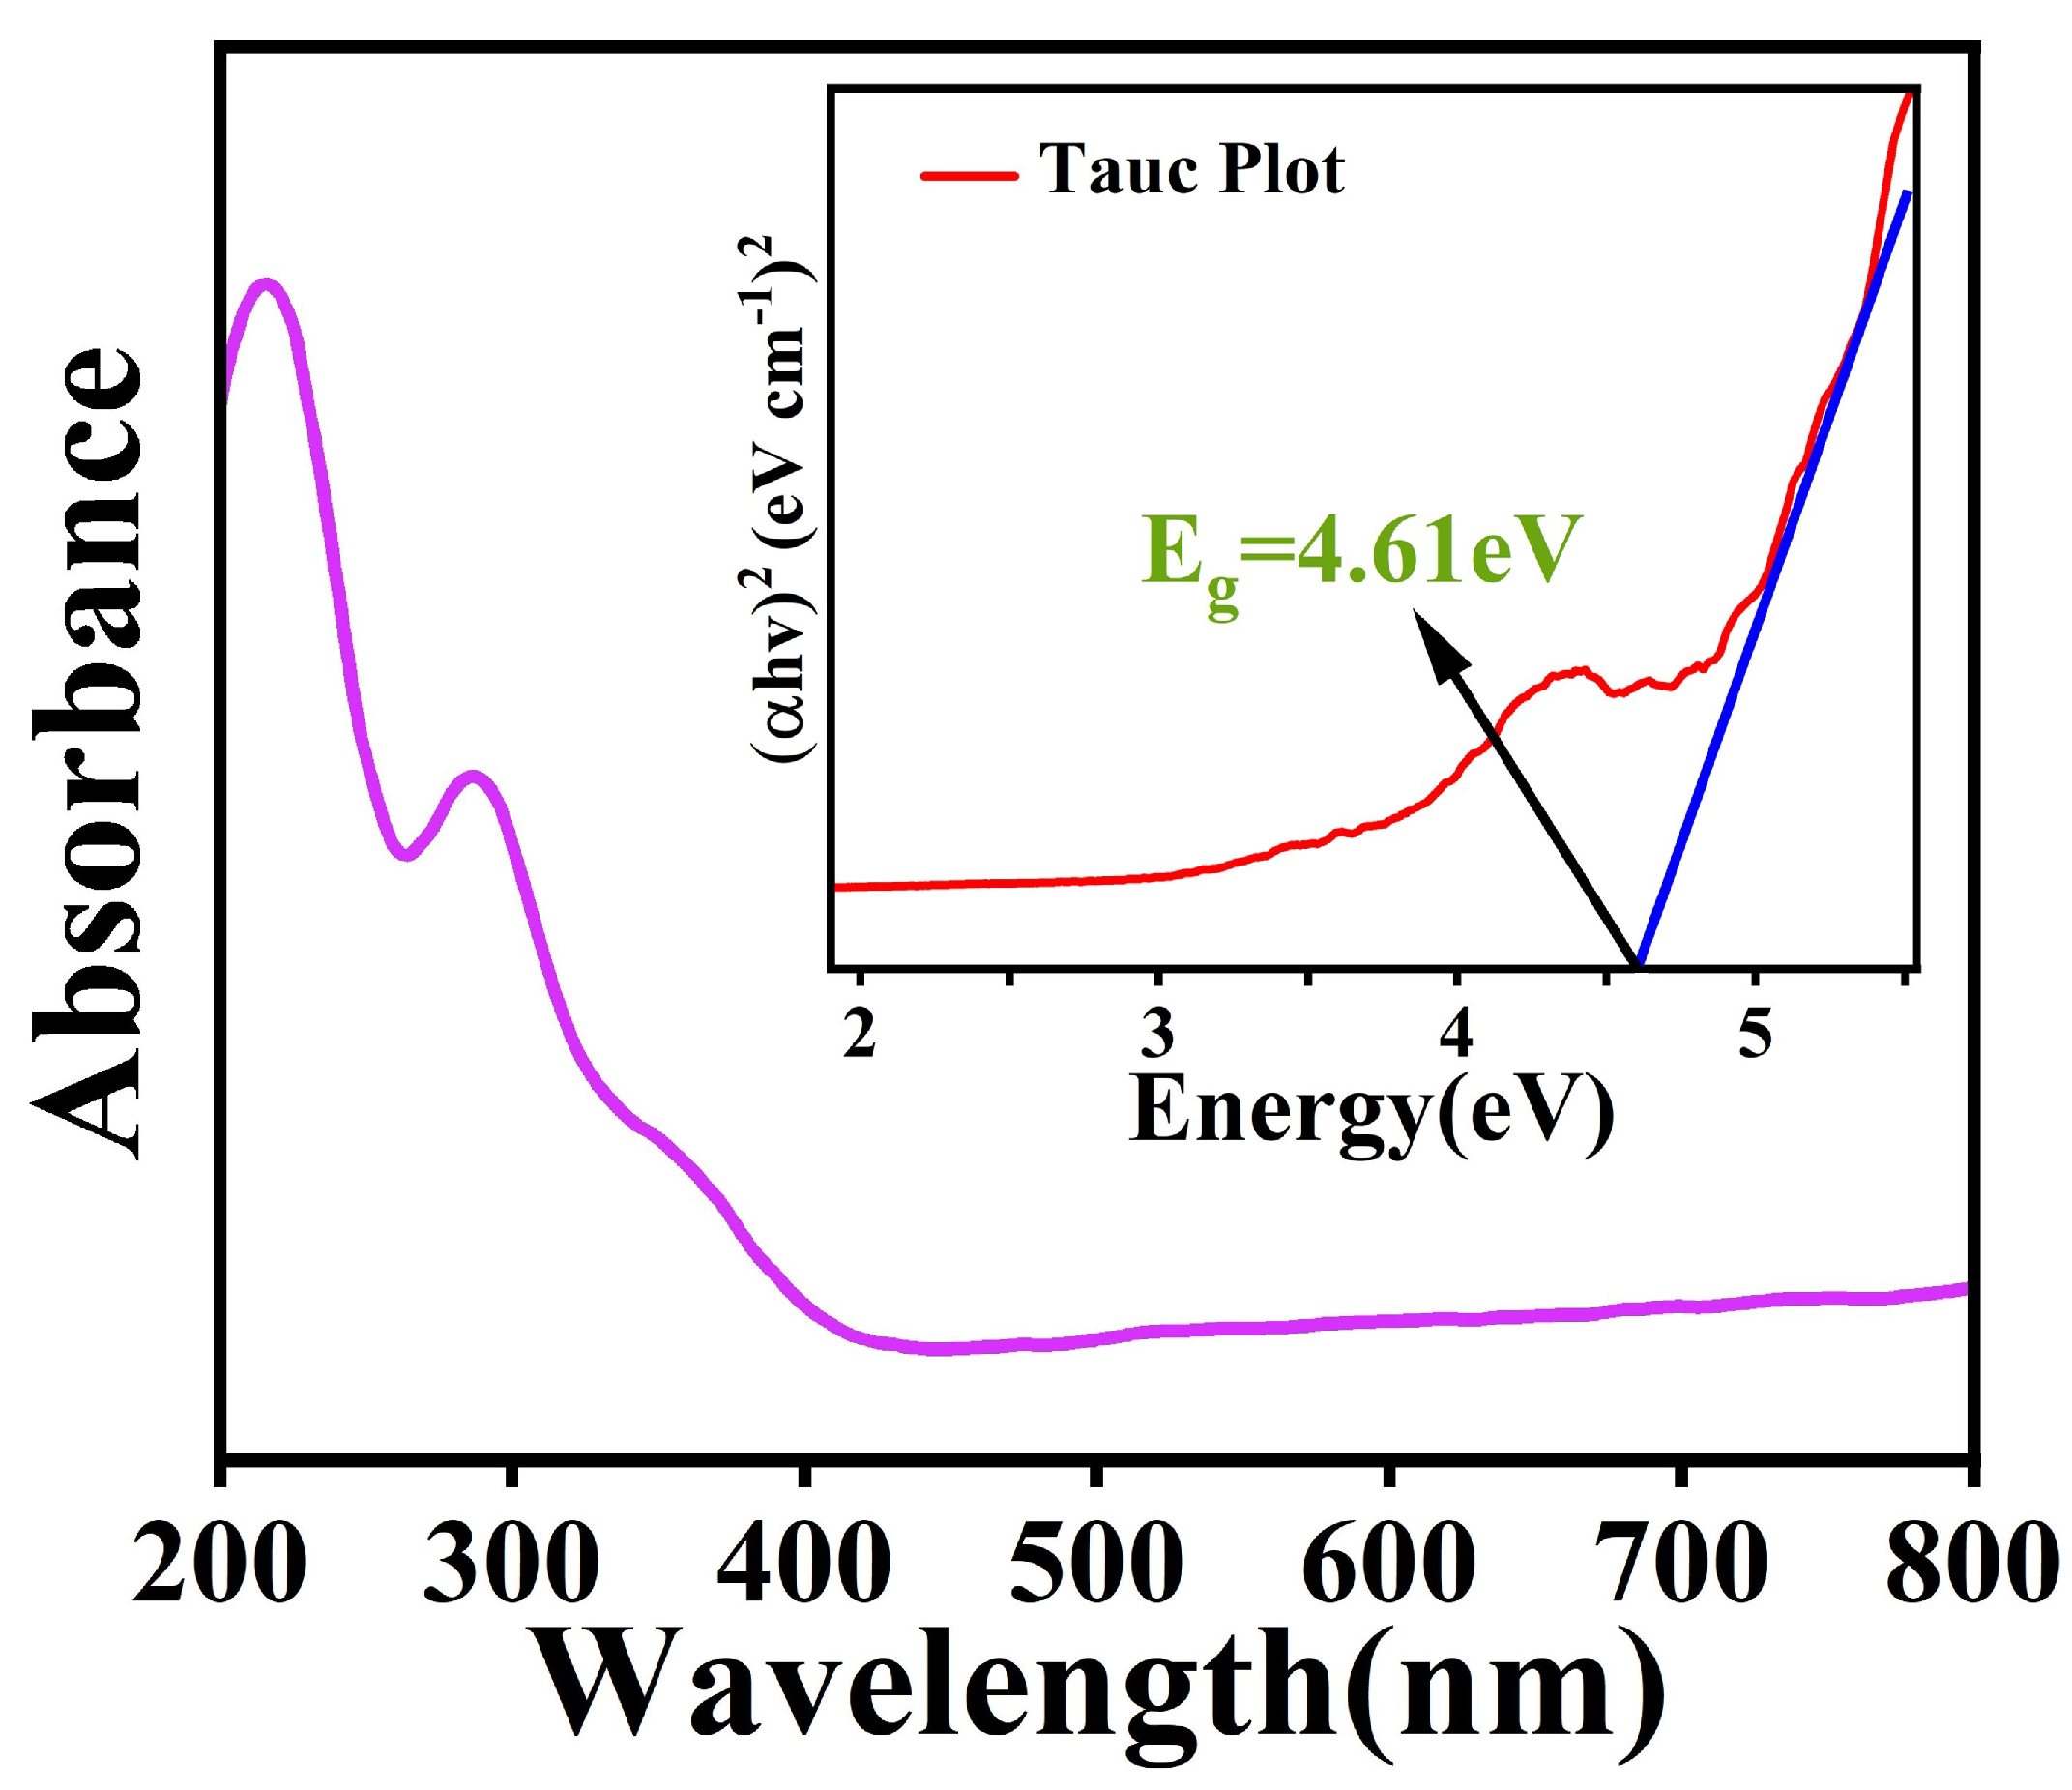
3.2. Optical Characterization

Figure 3a shows the fluorescence emission spectrum of the sample excited by 365 nm UV light when the doping amount of dysprosium ion is 0.5% at the combustion temperature of 800 °C. It can be seen that the emission duration is between 400 nm and 650 nm, and maximum emission peak is at 508 nm. It is basically consistent with the spectroscopic study of SrAl2O4: Eu2+, Dy3+ single crystal [18]. Figure 3b shows the excitation spectrum after excitation with the emission peak value of 508 nm from the emission spectrum. It can be seen that the peak wavelength is basically at 365 nm, which is consistent with the emission spectrum, indicating that 365 nm is the main excitation wavelength of SrAl2O4:Eu2+,Dy3+. The stuffed tridymite type structure, in which two distinct Sr2+ sites with comparable local distortion are present, is what monoclinic SrAl2O4 belongs to. Because Sr2+ and Eu2+ have similar ionic radii, Eu2+ is expected to occupy Sr2+ sites. Eu2+ present inside the host lattice is hence responsible for the emission’s greenish coloring. The observed excitation of samples is approximately 365 nm which can be due to 4f65d1→4f7 transition of the Eu2+ ion. Furthermore, no emission peaks in the red region between the energy levels in the 4f sublayer of Eu3+ have been detected, proving that the divalent europium ions of the remaining rare earth ions still exist in the grain boundaries [22]. Dysprosium trivalent ions can form shallow and deep traps in SrAl2O4, while Eu2+ ions can only form shallow traps. Dy3+ related traps in the range of 0.6 to 1.2 eV from the conduction band are in SrAl2O4:Eu2+,Dy3+ plays a role in the sensitization of the luminescent center during the luminescence process, which proves that Dy3+ has a sensitizing effect on the luminescence of Eu2+ [25,27,28,29,30].
Figure 4a shows the emission spectra of SrAl2O4: Eu2+, Dy3+ samples sintered at different temperatures when excited at 365 nm. The spectral pattern excited at 365 nm is the smoothest and the effect is better. Figure 4b shows the luminescence of the temperature control group under the irradiation of an ultraviolet light at 365 nm. It is evident that the sample have an obvious green light. When the temperature rises from 500 °C to 800 °C, the brightness gradually increases, and the brightness starts to weaken when the temperature increases to 900 °C. It can be found that 800 °C is the optimal reaction temperature for strontium aluminate doped europium and dysprosium, and the brightness decreases when the temperature decreases or increases. It is clear that the combustion temperature during calcination affects the strontium aluminate with europium and dysprosium doping’s luminous characteristics.
Figure 5a is the emission spectrum of SrAl2O4: Eu2+,Dy3+ obtained by changing the doping amount of dysprosium ion at the optimal calcination temperature of 800 °C, and then using the wavelength of 365 nm for excitation. Figure 5b shows the luminescence of 8 groups of luminescent samples doped with different amounts of dysprosium ions under the irradiation of an ultraviolet light at 365 nm. The doping amount of dysprosium ion between the upper left and lower right corners are 0.1%, 0.5%, 1%, 2%, 4%, 6%, 8%, 10%, respectively. It can be seen from Figure 5a,b the luminous intensity is better when the doping content of dysprosium ions sample is 0.5%.
The production of afterglow characteristics and their strength are intimately related to the traps that the material creates, based on the long afterglow luminescence mechanism. As a coactivator, Dy3+ does not emit light on its own, but it can produce holes to create an energy level that serves as an electron trap center, catching part of the electrons emitted by the excitation of Eu2+. After the excitation is finished, the trapped electrons are then released by thermal perturbation at the proper rate, enabling them to move into the excited state and then return to the ground state for long afterglow luminescence.When the Dy3+ concentration rises, there are more electron traps available, which allows for a large amount of electrons to be released gradually after the excitation has ended, increasing the brightness of the afterglow. The electron trap density, on the other hand, becomes excessively high and the corresponding distance between the traps shortens when the concentration of Dy3+ exceeds a particular amount. The phenomena of afterglow concentration quenching will then take place as the carriers move between the traps. The brightness of the afterglow finally starts to fade. The findings from experiments indicate that a Dy3+ concentration of 0.5% results in the optimum afterglow performance.
Figure 6 shows the X-ray fluorescence spectra of different samples. It can be seen that the luminous intensity of strontium aluminate is weak, and its luminescence can hardly be found, as shown in Figure 7a. When Eu ion is added, it can be found with a slight green light, as shown in Figure 7b. When Eu and Dy ions are added simultaneously, compared to Figure 7a, green light can be clearly seen. When 0.5% Dy ion is added, its luminous intensity is the highest, as shown in Figure 7d. Its luminous intensity is about 13.3 times of SrAl2O4 and 3.05 times of SrAl2O4: Eu2+. Therefore, when Eu ions and 0.5%Dy ions are doped, the X Ray luminescence performance is better. The photoluminescence under X-ray excitation is basically consistent with that under ultraviolet irradiation.
Figure 8 shows the afterglow attenuation curves of different samples under X-ray irradiation. It can be seen that afterglow luminous intensity of SrAl2O4 and SrAl2O4: Eu2+ is low, the most interesting phenomenon is that after doping Dy ions, the afterglow luminous intensity has been significantly improved. The samples’ luminescence decay process is nonexponential. Generally, in aluminate phosphors, the luminescent centers are Eu2+ ions and the traps are Dy3+ ions [31]. The trap energy level produced by doping Eu2+ and Dy3+ ions in crystals usually causes the long afterglow property [13]. The quick decay is caused by the electron’s short survival time in Eu2+ and Eu2+ions immediately transition from 4f65d1→4f7 level. The presence of Dy3+ ions in the host lattice and the deep trap energy center of Dy3+ are attributed to the slower decay process, which is only significant in SrAl2O4: Eu2+, Dy3+ samples [32].
The long afterglow mechanism could be a hole trapped-transported-detrapped process [30]. The Dy3+ acts as a trap of holes (trap levels), with the trap levels located between the excited and ground states of Eu2+. Following UV or X-ray excitation, electron and hole pairs are produced, and some free holes transported in the conduction band are captured by the Dy3+ traps. When the excitation source was removed, some holes trapped by the Dy3+ traps were thermally released slowly and relaxed to the excited state of Eu2+, before returning to the ground state of Eu2+ and emitting light. This is why phosphor sustained a long afterglow duration at a poor luminescent level of intensity [33]. Herein, an explanation for the afterglow of these SrAl2O4: Eu2+, Dy3+ phosphors was put out (Figure 9).
Fluorescence lifetime refers to the time elapsed when the fluorescence intensity decreases to 1/e of the fluorescence intensity at the time of stopping excitation when the excitation source is turned off. The fluorescence lifetime curve of SrAl2O4 and SrAl2O4: 0.02Eu2+, xDy3+(x = 0, 0.001, 0.01, 0.04, 0.06, 0.08, and 0.1) samples was measured under the xenon lamp and the curve was well fitted, as shown in Figure 10. The fluorescence lifetime curves are divided into two regimes: the initial rapid decay and the subsequent slow decay. In general, the following exponential relationships can best fit the fluorescence lifetime decay curve [33]:
I = I 0 + A 1 e t τ 1 + A 2 e t τ 2
where I is the phosphorescence intensity, A 1 and A 2 are the constants, t is the time, τ 1 , and τ 2 are the decay times for the exponential components. Using the software of Origin 2022, the values of τ 1 and τ 2 of the phosphors can be obtained, as listed in Table 1. The average lifetimes can also be obtained by the Formula (2) [34]. The detail parameters are listed in Table 1.
τ a v g = A 1 τ 1 2 + A 2 τ 2 2 A 1 τ 1 + A 2 τ 2
Through the Table 1, we obtain the fluorescence lifetimes of the series of SrAl2O4 and SrAl2O4: 0.02Eu2+, xDy3+(x = 0, 0.001, 0.01, 0.04, 0.06, 0.08, and 0.1) samples as 1.174, 717.311, 720.518, 713.355, 726.596, 702.182, 718.112, 713.445 ns, respectively. When Eu and Dy are not added to the SrAl2O4, it can be seen that its fluorescence lifetime is almost zero. When Eu2+ ions is doped into SrAl2O4, the intuitive result is that the fluorescence lifetime is increased. When Dy3+ ions is doped into SrAl2O4: Eu2+, has little impact on its fluorescence lifetime. This may be due to that dysprosium addition will cause lattice distortion, which may affect the luminescence of europium and reduce the lifetime of europium. However, this process may be accompanied by energy transfer from Dy to Eu, which in turn can improve the fluorescence lifetime of Eu. There is already a large amount of literature [2,35,36] to prove that if the energy transfer occurs in a system, the fluorescent decay lifetimes of sensitizer should decline with the increase of activator content. But in this experiment, sensitizer is Dy and activator is Eu. We studied the relationship between the fluorescence decay lifetime of sensitizer and activator. However, we found that the addition of Dy ions does not affect their fluorescence lifetime.
To investigate the absorption properties and band gap value of the obtained SrAl2O4: Eu2+,Dy3+, UV–vis diffuse reflection spectra is conducted and the spectrum. The UV–vis diffuse reflectance spectra of synthetic SrAl2O4: Eu2+,Dy3+ recorded in the 200–800 nm region is shown in Figure 11. The band gap could be calculated based on UV–vis diffuse reflectance result using Tauc’s equation that given by [37]:
( α h v ) 2 = A ( h v E g )
where hv is the photon energy, A is a material-dependent constant and E g is the energy band gap. α is the optical absorption coefficient, it can be obtained by the Kubelka–Munk function [37]:
α = 1 R 2 2 R
R is the observed reflectance in the diffuse reflectance spectrum. Inset of Figure 11 displays the plot of ( α hv)2 against (Energy), which enables extrapolation of the straight-line graph at ( α hv)2 = 0 to compute the energy gap. The synthesized SrAl2O4: Eu2+,Dy3+’s band gap was calculated to be 4.61 eV, which is reasonable and in reasonable accord with the previously published literature results [11,37,38].

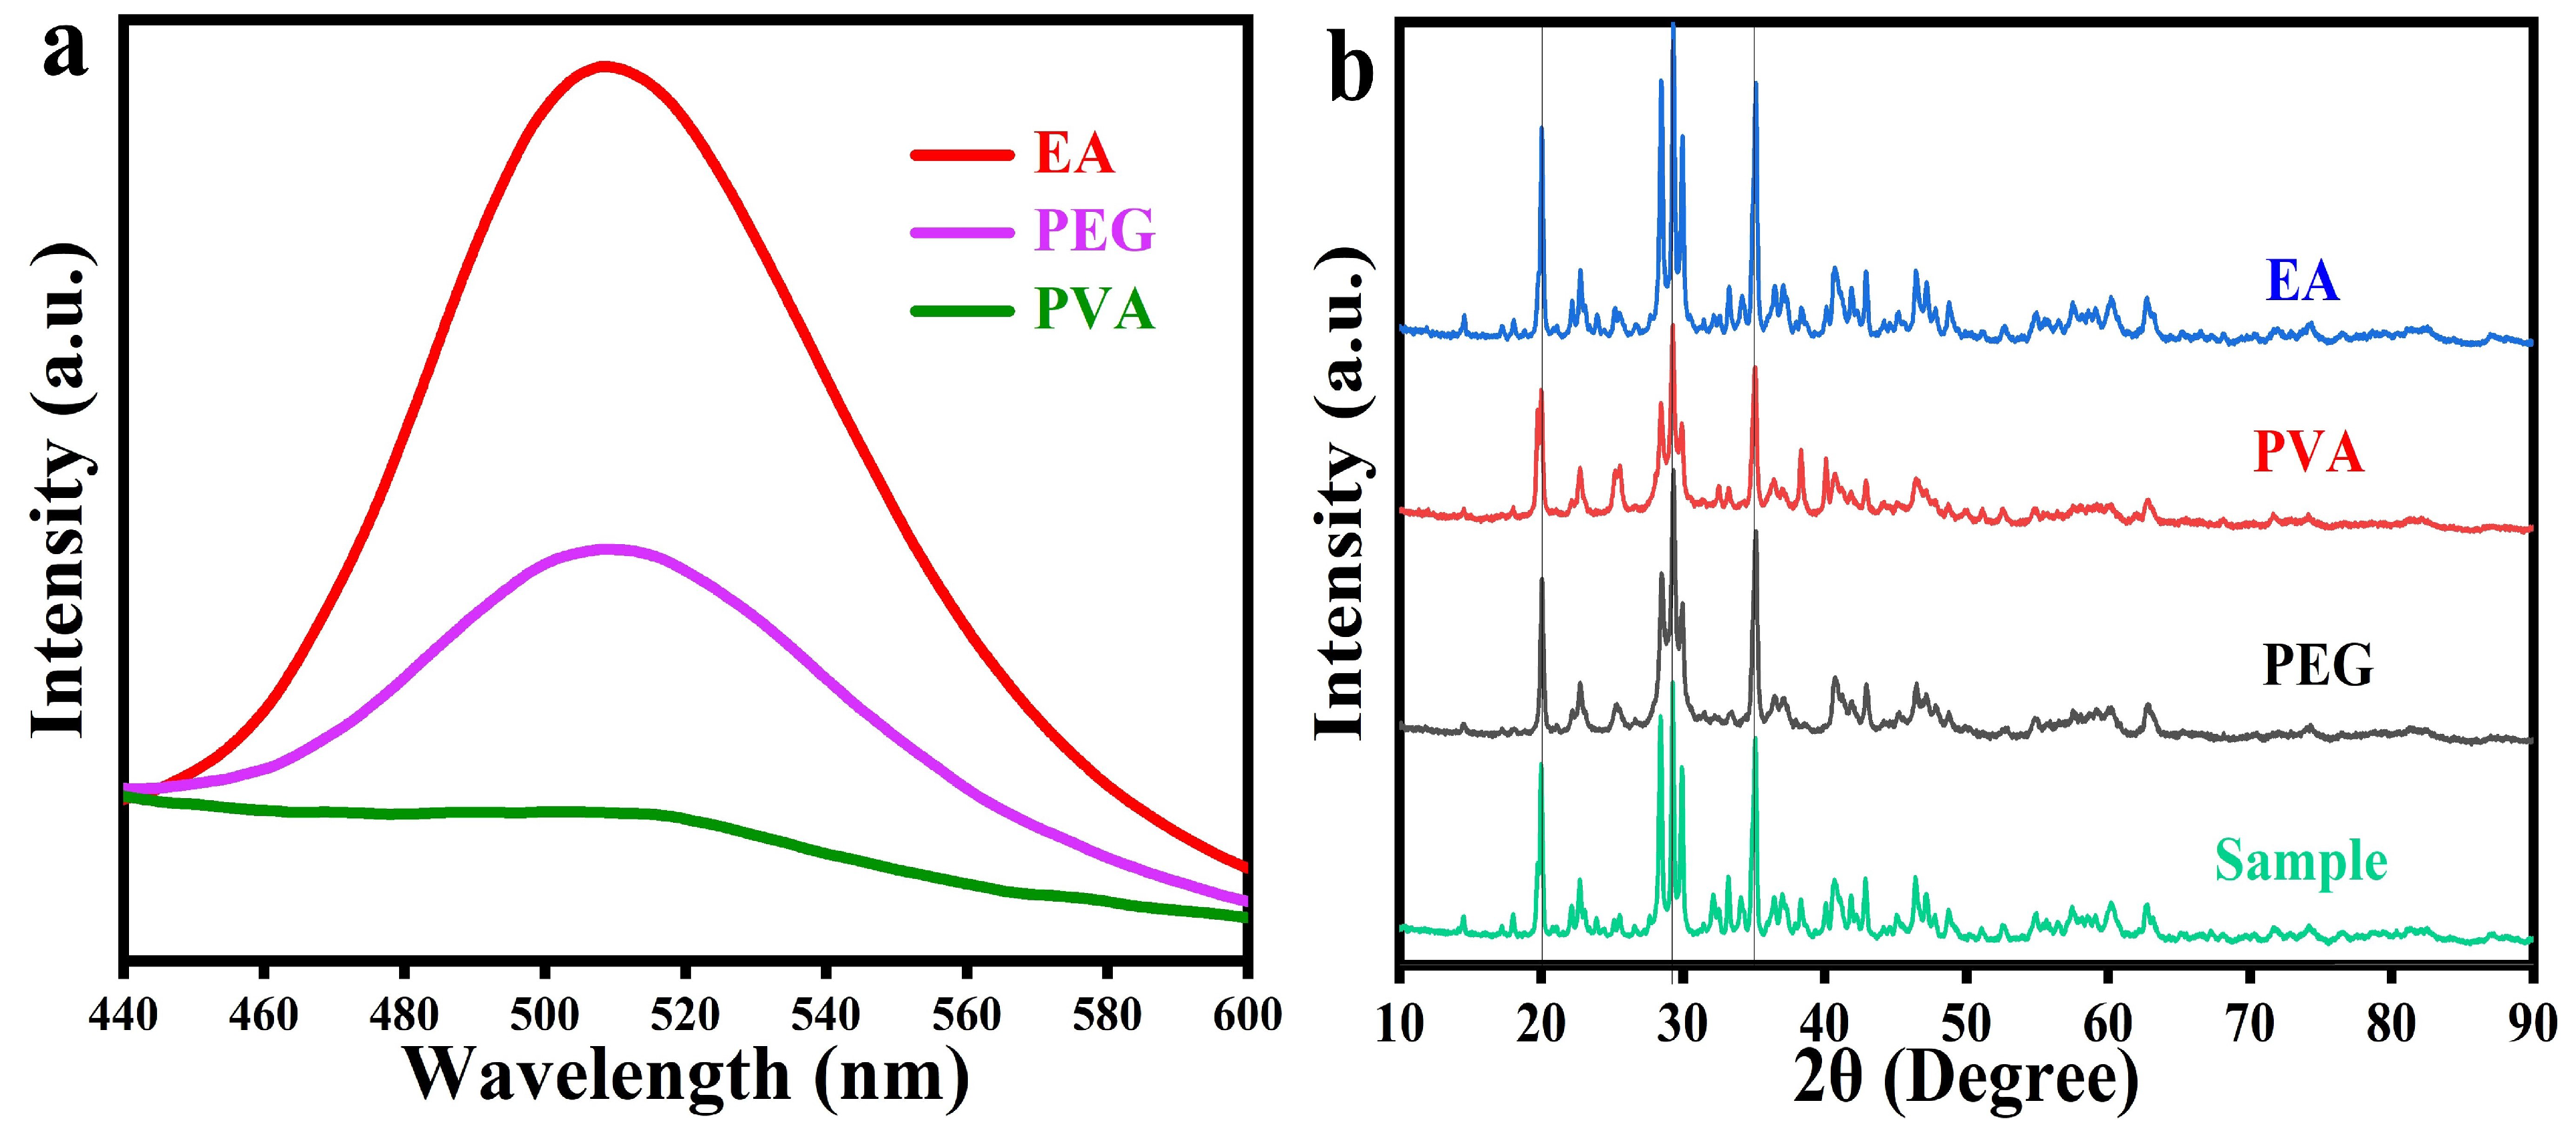
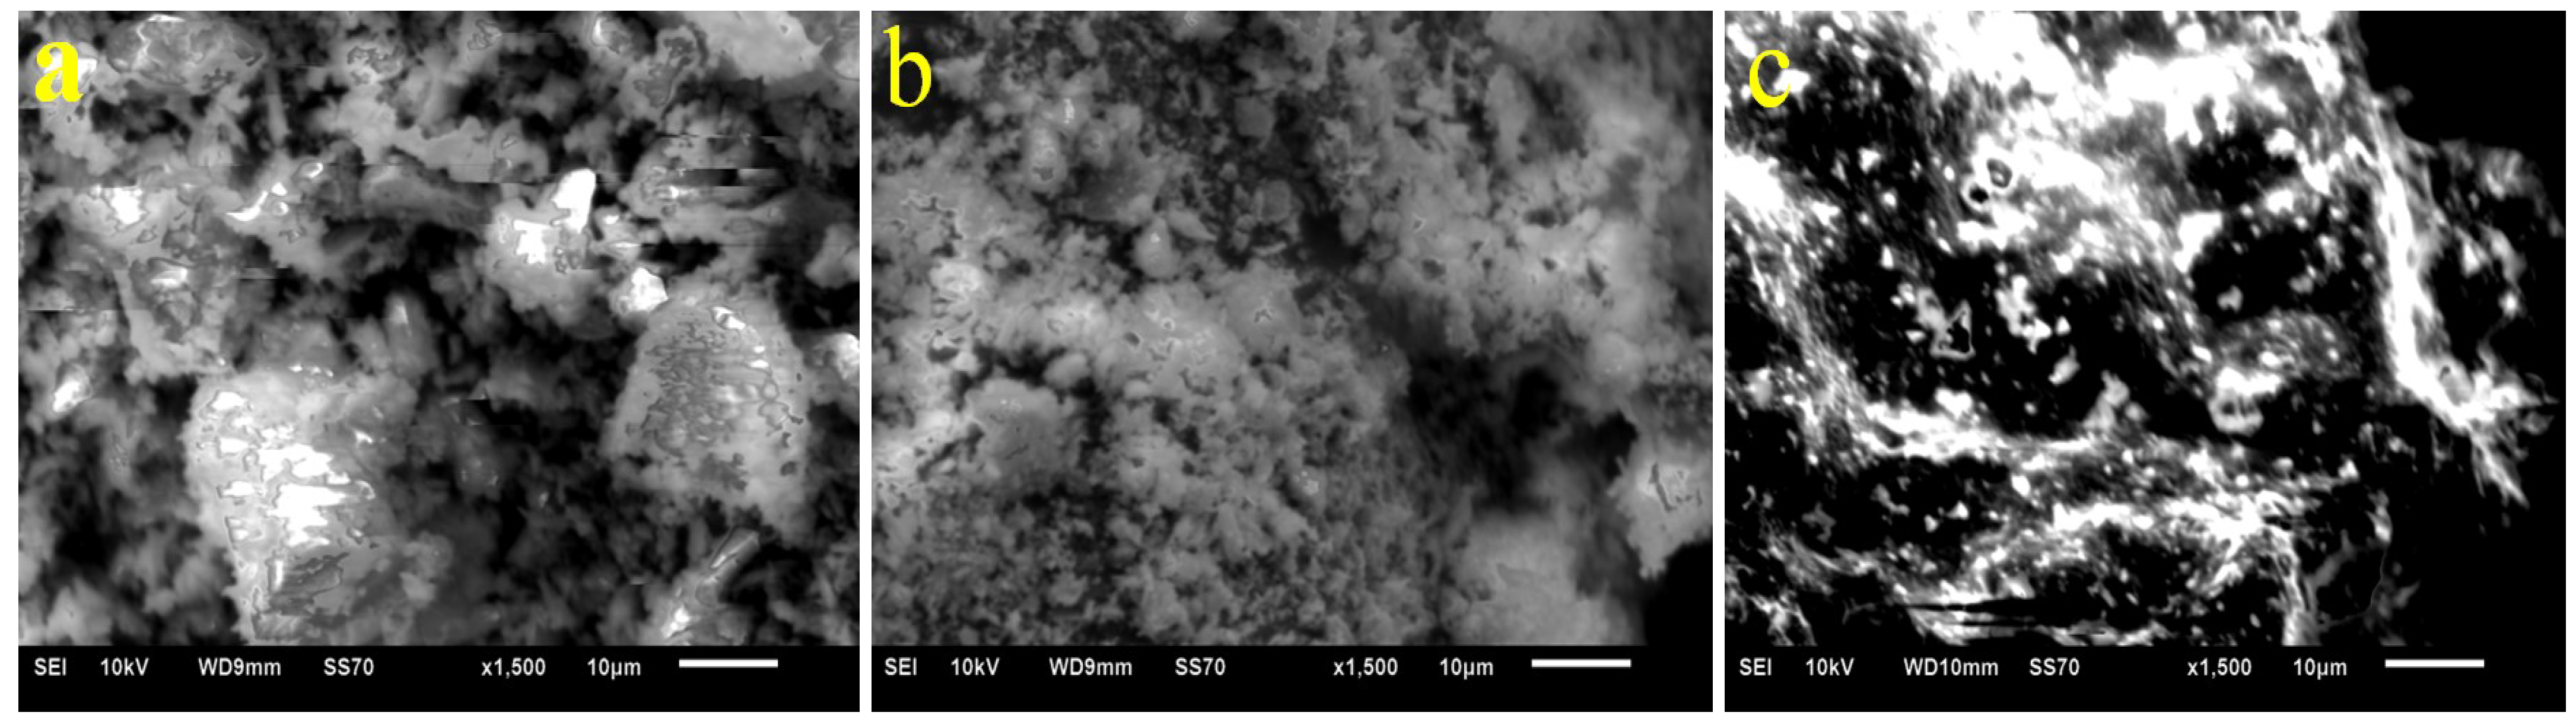
3.3. Luminescence and Morphology of SrAl2O4: Eu2+,Dy3+ in Different Solvents
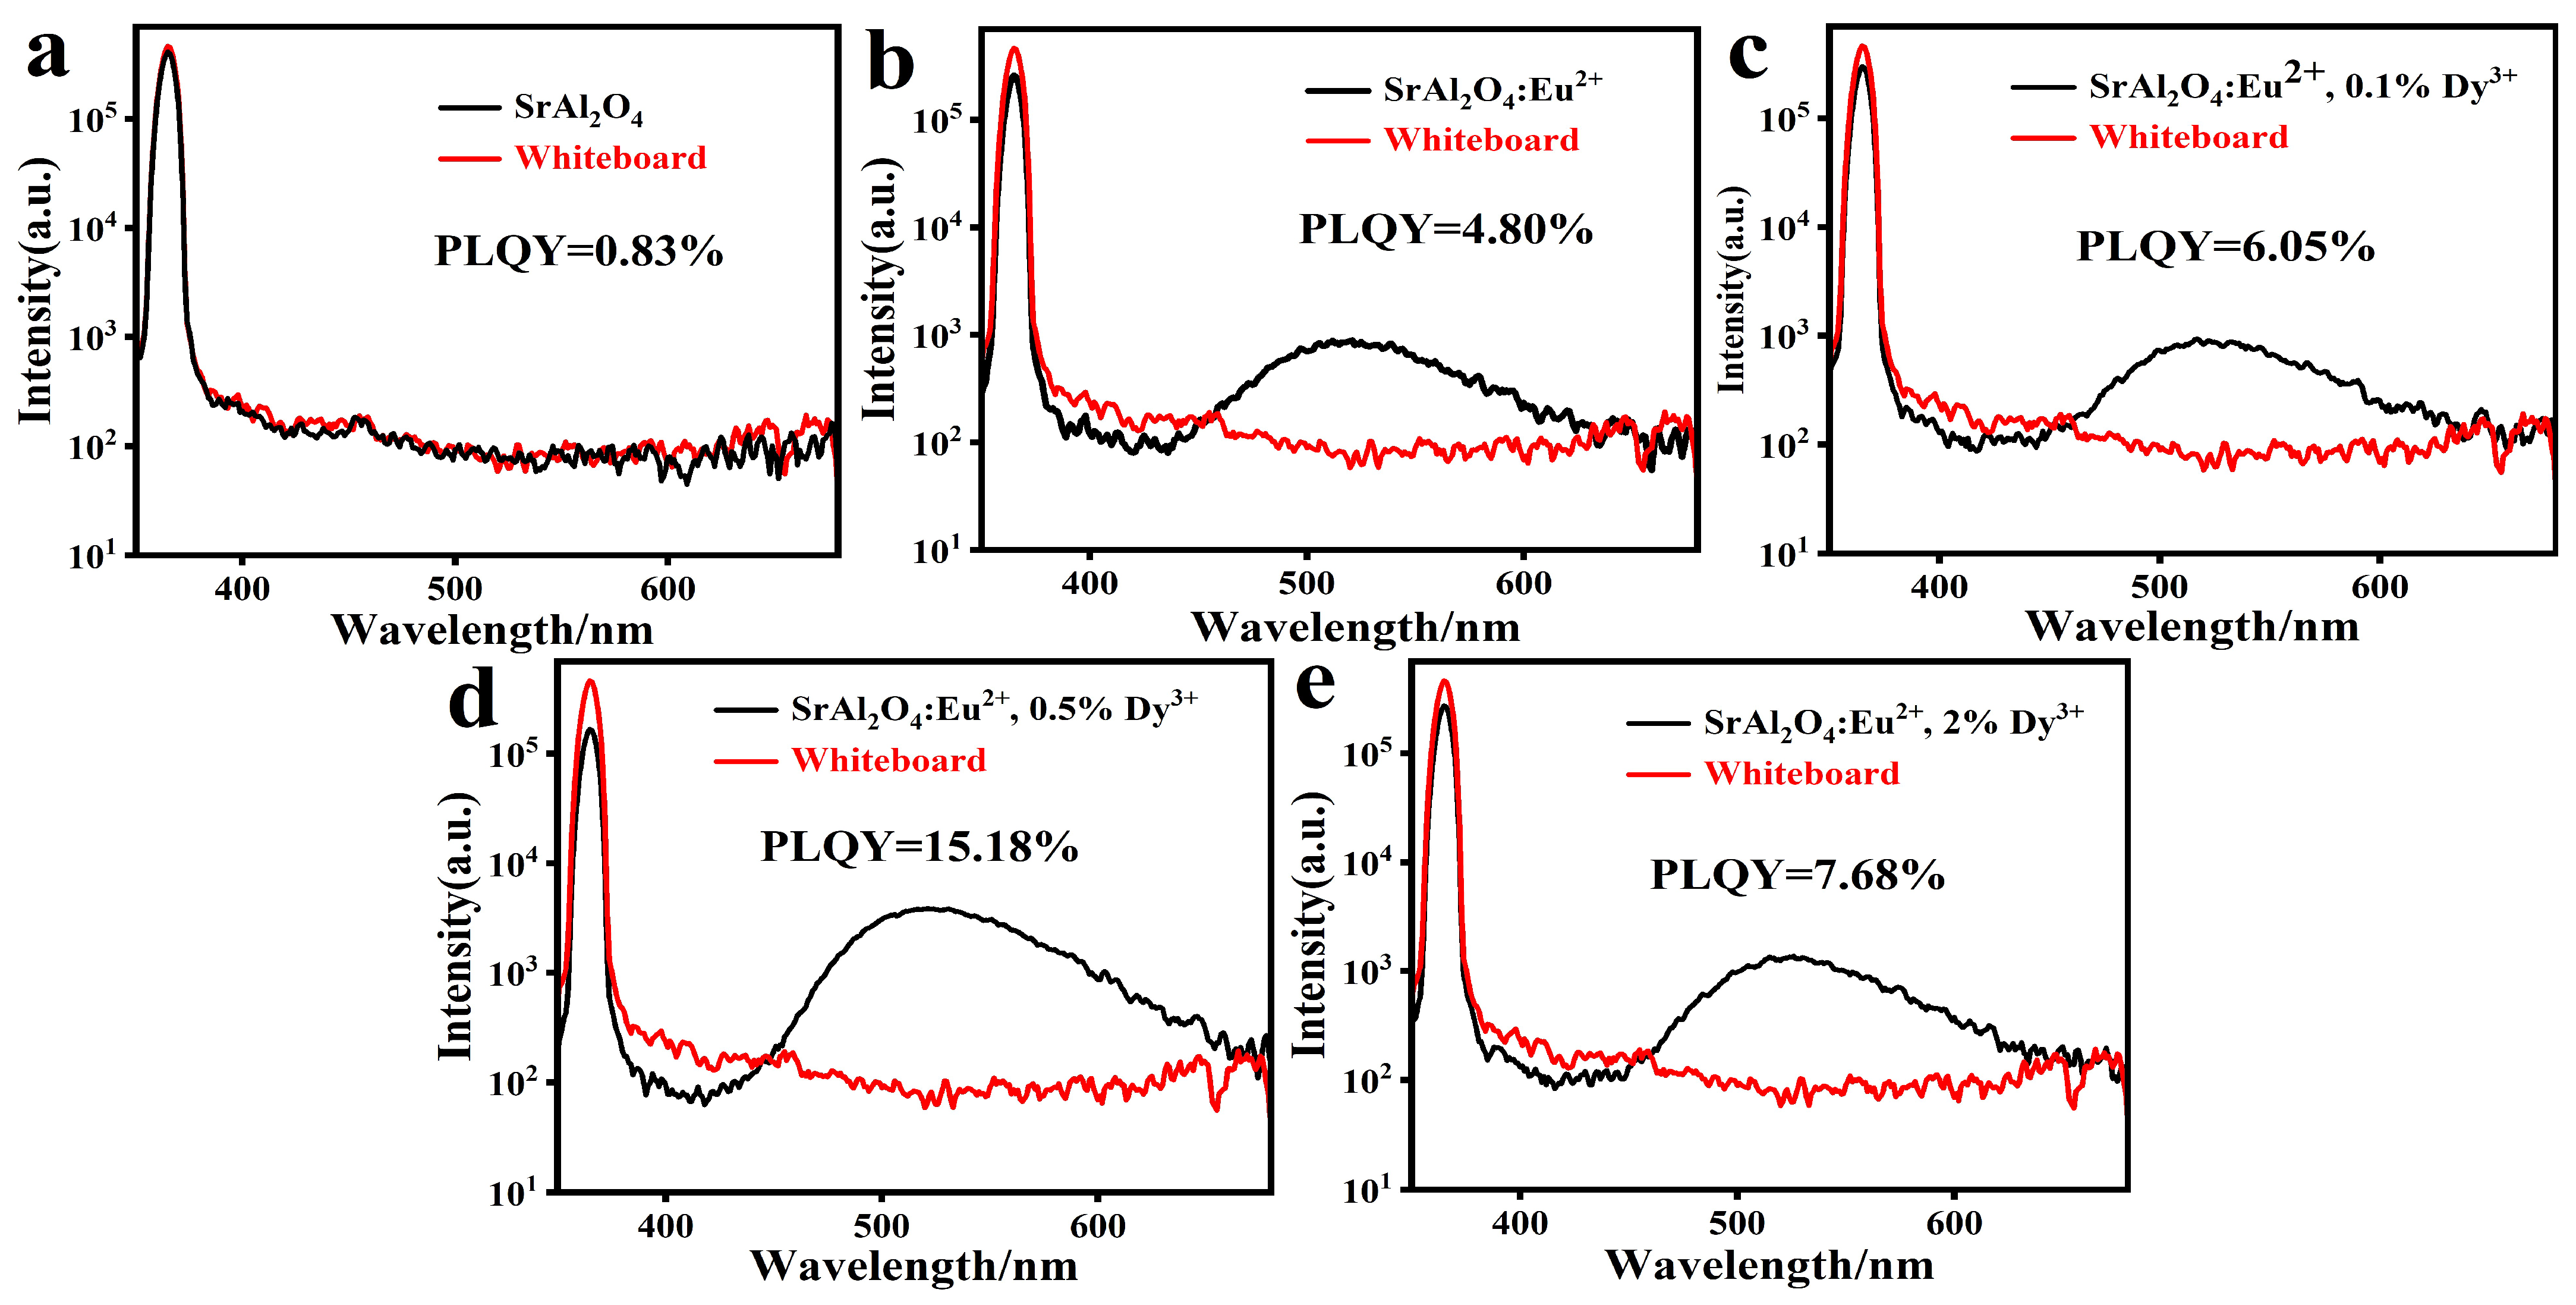
Figure 12a shows the emission spectra of SrAl2O4: Eu2+,Dy3+ luminescent materials with three solvents when excited by ultraviolet light with a wavelength of 365nm. The positions of three broadband peaks are basically the same, and the peak with Ethyl Acetate(EA) solvent is the highest, followed by the sample with Polyethylene glycol(PEG) solvent, and the lowest is the sample with Polyvinyl alcohol(PVA) solvent. Figure 12b shows the XRD diffraction patterns of SrAl2O4: Eu2+,Dy3+ samples with three solvents added and SrAl2O4: Eu2+,Dy3+ samples without solvents added. From top to bottom, the XRD diffraction patterns of the samples with EA, PVA, PEG solvent and without solvent are shown respectively. Through waveform comparison, it can be found that the three samples have three main crystal diffraction peaks, and the intensity and position are almost the same as those without solvents, and the crystal structure is consistent, indicating that the addition of solvent does not change its crystal structure.
SEM micrographs of different solvents synthesis SrAl2O4: Eu2+, Dy3+ phosphors (Figure 13) demonstrate this material’s granular microstructure. It has a magnification of 1500 times, with an average scale size of about 10 μ m. Solvent has the function of micellization, which can change its surface tension. From the comparison of the three images, it can be observed that their morphology has changed. It can be observed that the gap from EA to PVA and PEG samples has become smaller gradually, and the solvent has changed the dispersion degree between particles. Compared with the SEM image of the sample prepared without adding solvent in Figure 2, different solvent will also change the gap of the sample, which is accompanied by the shape.

3.4. Quantum Yield

The above samples were measured at the exceptional range from 350.00 nm to 380.00 nm and luminescence range from 380.00 nm to 800.00 nm. It can be seen that the quantum yield of strontium aluminate is particularly low without doping any rare earth ions, as shown in Figure 14. When Eu ions are doped, the quantum yield of strontium aluminate can be improved. When Eu ions and Dy ions are both doped, the quantum yield of strontium aluminate will need to be further improved. After doping rare earth elements, strontium aluminate has a higher quantum yield, indicating that it is a appropriate matrix for rare earth ion doping. Generally, we use the following formula to calculate the quantum yield [39]:
P L Q Y = N e m i s s i o n N a b s o r p t i o n = λ h c { I e m p r o ( λ ) I e m r e f ( λ ) } d λ λ h c { I e x r e f ( λ ) I e x p r o ( λ ) } d λ
The N a b s o r p t i o n is the number of photons absorbed by the sample, N e m i s s i o n is the number of photons emitted from the sample, λ is the wavelength, h is Planck’s constant, c is the velocity of light, I e x p r o and I e x r e f are the integrated intensities of the excitation light with the sample and reference sample, respectively, I e m p r o and I e m r e f are the mission intensities with the sample and reference sample, respectively.
In this paper, red is a white board, which is used to compare with the sample wire to obtain the quantum yield. Black represents the sample line. The quantum efficiency is the area difference between the emission section (450 nm–650 nm) and the excitation section (350 nm–380 nm). These figures are logarithmic to the ordinate, so the excitation section is small. If the logarithm is not taken, the intensity of the white board at the excitation end will be several orders of magnitude higher than that of the sample. Herein, Figure 14d has the highest quantum yield. However, compared with other substances [40], its quantum yield is relatively low, this is also where efforts should be made in the future. How to further improve the quantum yield of strontium aluminate significantly needs more research.

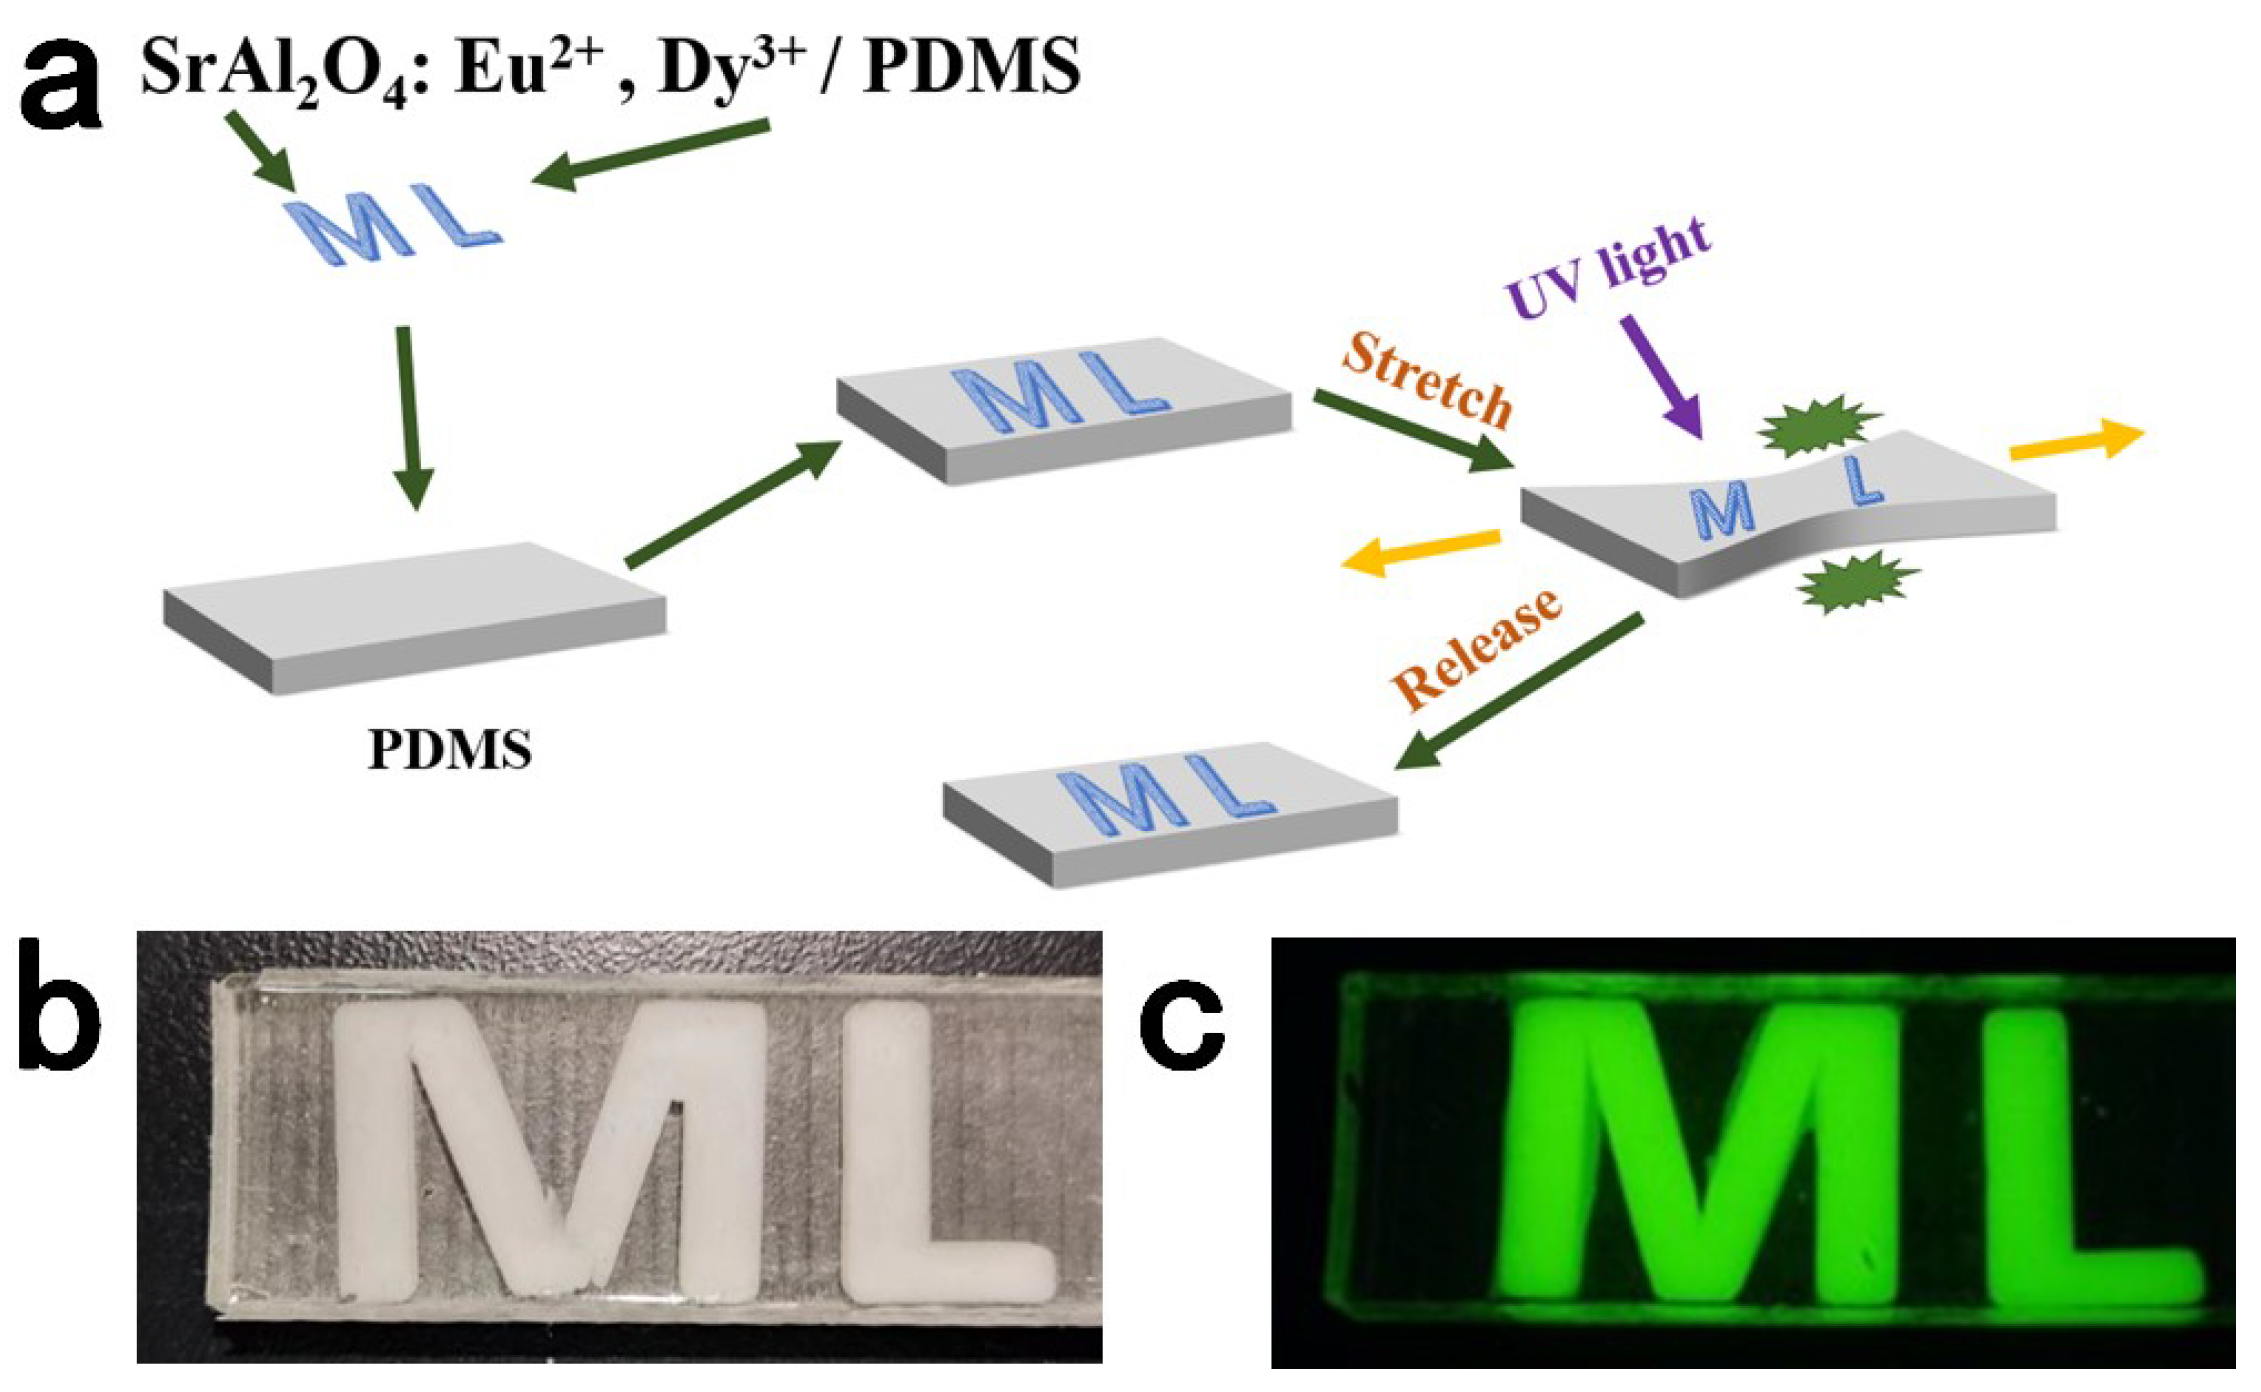
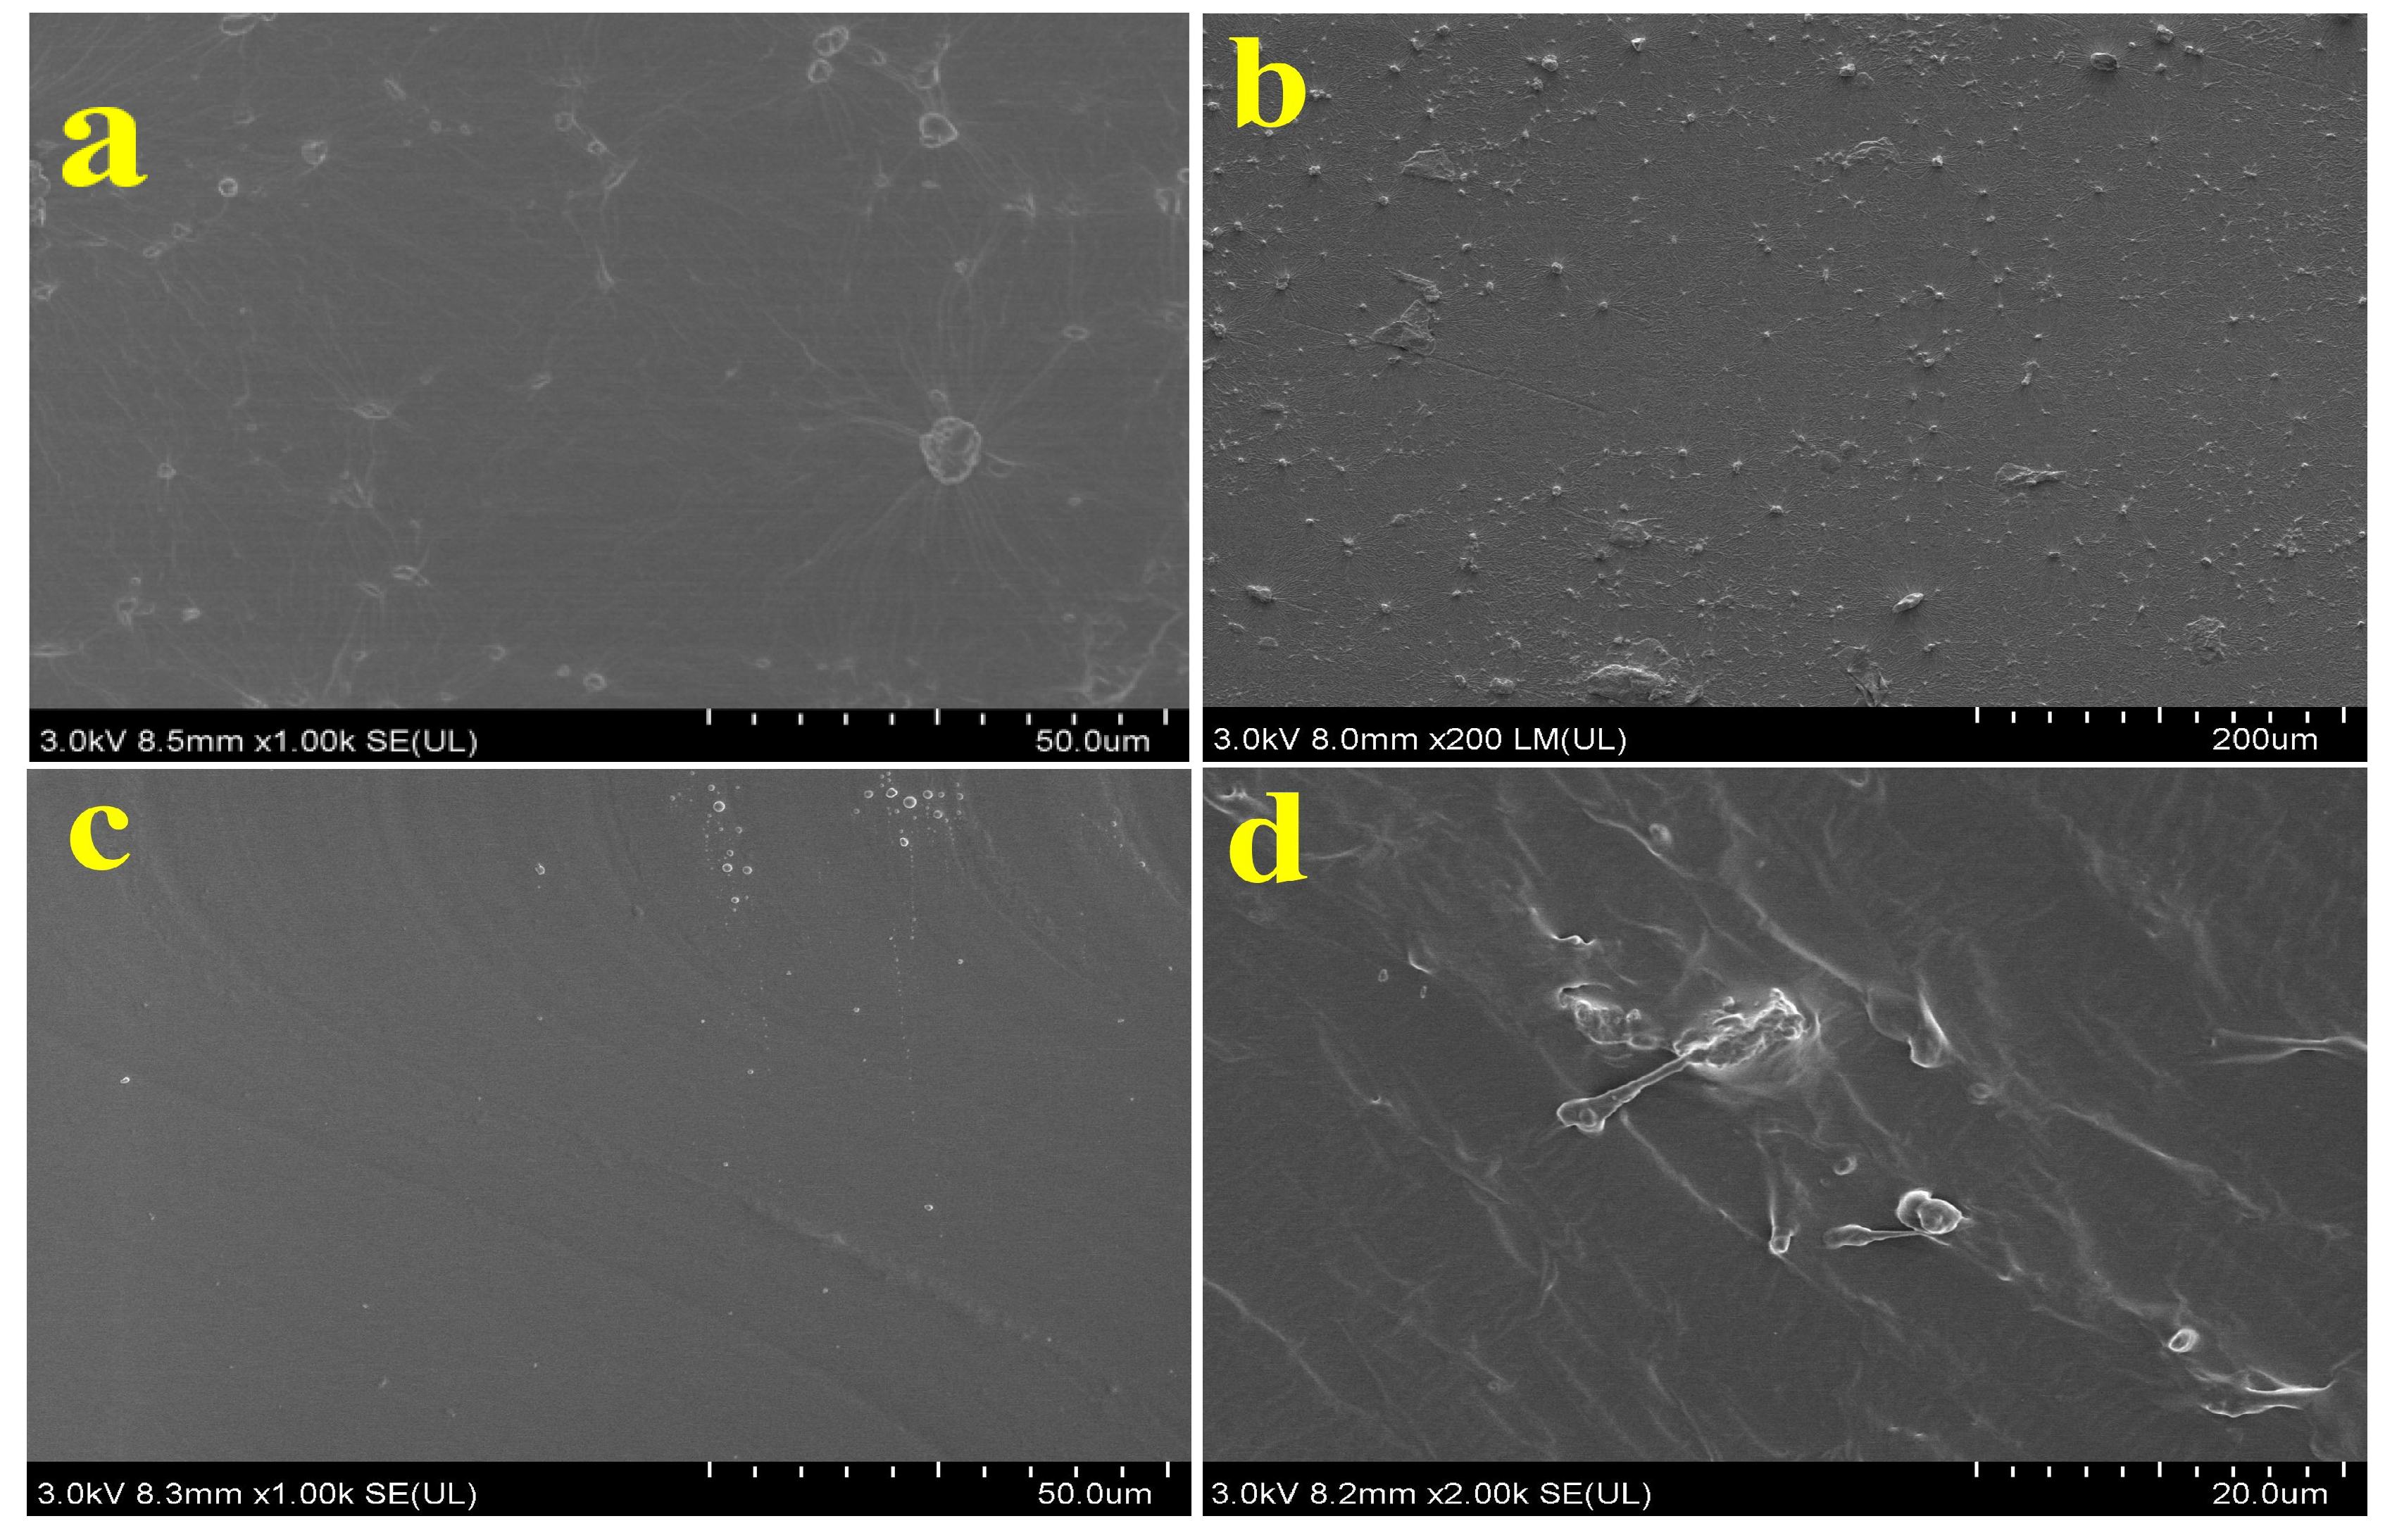
3.5. Preparation and Morphology of Pdms Composites

Polydimethylsiloxane (PDMS) is well known as organosilicon which is a kind of polymer organosilicon compound material. It is optically transparent, nontoxic, excellent water resistance, oxidation resistance, chemical inertia, and thermal stability. The curing agent, also known as a hardener, is a substance that can control and enhance the curing reaction.
To further study the anticounterfeiting properties of phosphors, we combined rare-earth doped SrAl2O4: Eu2+,Dy3+ luminescent powders with PDMS elastic substrates. SrAl2O4: Eu2+,Dy3+ luminescent powder materials were prepared by the combustion method. The silicone rubber selected for use is Dow Corning 184, which contains PDMS based resin and curing agent. They are mixed in the ratio of 10:1, one part is reserved for use, and the other part is added with SrAl2O4: Eu2+,Dy3+ powder. Stir evenly to make them fully fuse into milky white viscous emulsion. Then pour it into the mold with "mL" letter. Because the mixing will mix air in the liquid, which will affect the anticounterfeiting effect, it needs to be placed in the vacuum drying oven for vacuum drying. The vacuum degree of the vacuum drying oven is set to 0.1. It can be observed that when vacuuming, a large number of bubbles in the emulsion will be slowly pumped to the surface and then dissolve and disappear. This process generally requires 20min to get a transparent mixture without bubbles. Then put it into a muffle furnace at 120 °C; for heating, solidify it into shape, take it out after 40min and cool it in cold water. This process is shown in Figure 15a. Next, PDMS elastic substrate shall be made. After cooling, the formed solid mixture material is buckled from the letter mold and placed in a rectangular mold. The PDMS prepared for use is poured into the rectangular mold. Repeating the previous operation. First, remove the bubbles in the milk with a vacuum drying oven, and then heat it in a muffle furnace. Finally, the PDMS composite material sample is obtained.
The luminescent powder is wrapped by PDMS. It has the characteristics of flexible materials which can be stretched and can also be returned to its original shape. The composite material is almost transparent in the sunlight (Figure 15b), while when illuminated by the ultraviolet lamp, the "ML" letter added with SrAl2O4: Eu2+,Dy3+ luminous powder will appear green (Figure 15c). Moreover, PDMS is low cost and simple used, so we can easily use it in anticounterfeiting packaging.
Figure 16a,c are SEM images without fluorescent powder, and Figure 16b,d are SEM images with fluorescent powder. The sintering temperature of the samples was 120 °C. When the magnification reaches 200 µm, by observing the surface of PDMS composite that small particles can be barely seen on the surface doped with fluorescent powder. Thereupon, cross section is cut by brittle fracture of the liquid nitrogen method. It can be clearly observed in the Figure 16c that the cross section without fluorescent powder is smooth. It can be observed from Figure 16d that small particles and bubbles appear on the cross section of fluorescent powder. This result shows that the fluorescent powder can be applied in the anticounterfeiting of PDMS.

4. Conclusions

In summary, SrAl2O4: Eu2+,Dy3+, a phosphor with long afterglow property, was successfully prepared by the combustion method. XRD analysis showed that Eu2+ and Dy3+ were successfully doped into the SrAl2O4 lattice. Under the excitation of X-rays and ultraviolet rays, SrAl2O4: Eu2+,Dy3+ phosphors exhibit green luminescence, which was ascribed to the 4f65d1 to 4f7 transition of Eu2+. Eu2+ ion is the luminescent centers and Dy3+ has a sensitizing effect on the luminescence of Eu2+. Changes in the content of Dy ions have little impact on the fluorescence lifetime of the sample, which is approximately 720 ns. The optimum doping concentrations of Dy3+ is 0.5%, and its quantum yield is 15.18%. SEM test shows that adding different surfactants EA, PVA, and PEG can change the morphology of luminescent materials, but does not change its crystal structure. EDX experiments have confirmed that the sample has been successfully synthesized and its component content has been confirmed. The Eg of the sample was calculated to be 4.61eV by UV diffuse reflectance spectroscopy. The prepared SrAl2O4: Eu2+,Dy3+ luminescent powder is successfully combined with PDMS means it can be well applied for anticounterfeiting application.

Author Contributions

P.G., J.W. (Jigang Wang), J.W. (Jiao Wu) and Q.X.; designed and carried out the experiment. P.G., J.W. (Jigang Wang), L.Y. and Q.L.; processed the test data. With the help of Y.Q. and Z.L.; wrote and completed the paper. All authors have read and agreed to the published version of the manuscript.

Funding

This research is supported by Beijing Natural Science Foundation (No. 2202018), General Project of Beijing Municipal Education Commission Science and Technology Program (No. KM202010015004), Research and development of intelligent packaging for cultural relics (Ed202001), Construction and application transformation of cross media cloud platform for printing and packaging anticounterfeiting and traceability (27170121005), National Natural Science Foundation of China (No. 21604005, Grant No. 52072084), the general project of fundamental research of BIGC (No. Ed202208, Eb202001, 20190122041, 22150122042, 22150122034, 27170122012), Initial funding for the Doctoral Program of BIGC (No. 27170121001/002), and the general project of science and technology of Beijing Municipal Education Commission (No. KM202110015008), the Key Area Research and Development Program of Guangdong Province (Grant no. 2020B0101020002), the GBA National Institute for Nanotechnology Innovation (Grant No. 2020GN0106), the National Key R&D Program of China (Grant No. 2021YFC2802000), National key research and development program (2019YFB1707202).

Institutional Review Board Statement

Not applicable.

Informed Consent Statement

Not applicable.

Data Availability Statement

Research data are not shared.

Conflicts of Interest

The authors declare no conflict of interest.

References

  1. Lazău, R.; Ianoș, R.; Păcurariu, C.; Căpraru, A. Comparative study on SrAl2O4 formation using different approaches. Ceram. Int. 2022, 48, 13271–13276. [Google Scholar] [CrossRef]
  2. Zeng, P.; Wei, X.; Yin, M.; Chen, Y. Investigation of the long afterglow mechanism in SrAl2O4: Eu2+, Dy3+ by optically stimulated luminescence and thermoluminescence. J. Lumin. 2018, 199, 400–406. [Google Scholar] [CrossRef]
  3. der Heggen, V.; Joos, D.; Feng, J.J.; Fritz, A.; Delgado, V.; Gartmann, T.; Walfort, N.; Rytz, B.; Hagemann, D.; Poelman, D.; et al. Persistent Luminescence in Strontium Aluminate: A Roadmap to a brighter Future. Adv. Funct. Mater. 2022, 32, 2208809. [Google Scholar] [CrossRef]
  4. Hua, Y.; Yu, J.S. Dual-functional platforms toward field emission displays and novel anti-counterfeiting strategy based on rare-earth activated materials. Ceram. Int. 2021, 47, 18003–18011. [Google Scholar] [CrossRef]
  5. Son, N.M.; Trac, N.N. Synthesis of SrAl2O4: Eu2+, Dy3+ phosphorescence nanosized powder by combustion method and its optical properties. J. Phys. Conf. Ser. 2009, 187, 012017. [Google Scholar] [CrossRef]
  6. Alharbi, Y.R.; Abadel, A.A.; Mayhoub, O.A.; Kohail, M. Effect of using available metakaoline and nano materials on the behavior of reactive powder concrete. Constr. Build. Mater. 2021, 269, 121344. [Google Scholar] [CrossRef]
  7. Palilla, F.C.; Levine, A.K.; Tamkus, M.R. Fluorescent properties of alkaline earth aluminates of the type MAl2O4 activated by divalent europium. J. Electrochem. Soc. 1968, 115, 642–644. [Google Scholar] [CrossRef]
  8. Hölsä, J.; Jungner, H.; Lastusaari, M.; Niittykoski, J. Persistent luminescence of Eu2+ doped alkaline earth aluminates, MAl2O4:Eu2+. J. Alloy. Compd. 2001, 323–324, 326–330. [Google Scholar] [CrossRef]
  9. Jia, W.; Yuan, H.; Lu, L.; Liu, H.; Yen, W.M. Crystal growth and characterization of Eu2+, Dy3+: SrAl2O and Eu2+, Nd3+: CaAl2O4 by the LHPG method. J. Cryst. Growth 1999, 200, 179–184. [Google Scholar] [CrossRef]
  10. Johari, M.; Rajabi, M.; Mohammadi, V. Production of SrAl2O4: Eu2+, Dy3+ green-emitting phosphor nano-pigment powders via microwave processing route. Pigment. Resin Technol. 2017, 46, 85–91. [Google Scholar] [CrossRef]
  11. Zhai, B.G.; Huang, Y.M. Green Afterglow of Undoped SrAl2O4. Nanomaterials 2021, 11, 2331. [Google Scholar] [CrossRef] [PubMed]
  12. Parauha, Y.R.; Sahu, V.; Dhoble, S.J. Prospective of combustion method for preparation of nanomaterials: A challenge. Mater. Sci. Eng. B 2021, 267, 115054. [Google Scholar] [CrossRef]
  13. Xiao, Q.; Xiao, L.; Liu, Y.; Chen, X.; Li, Y. Synthesis and luminescence properties of needle-like SrAl2O4:Eu, Dy phosphor via a hydrothermal co-precipitation method. J. Phys. Chem. Solids 2010, 71, 1026–1030. [Google Scholar] [CrossRef]
  14. Yang, L.; Liu, Q.; Zheng, H.; Zhou, S.; Zhang, W. The decay model of Eu2+ and Eu2+, Dy3+ substituted SrAl2O4 prepared by high temperature solid phase method. J. Phys. Chem. Solids 2019, 124, 151–156. [Google Scholar] [CrossRef]
  15. Luchechko, A.; Zhydachevskyy, Y.; Ubizskii, S.; Kravets, O.; Popov, A.I.; Rogulis, U.; Elsts, E.; Bulur, E.; Suchocki, A. Afterglow, TL and OSL properties of Mn(2+)-doped ZnGa2O4 phosphor. Sci. Rep. 2019, 9, 9544. [Google Scholar] [CrossRef]
  16. Klym, H.; Karbovnyk, I.; Piskunov, S.; Popov, A.I. Positron Annihilation Lifetime Spectroscopy Insight on Free Volume Conversion of Nanostructured MgAl2O4 Ceramics. Nanomaterials 2021, 11, 3373. [Google Scholar] [CrossRef] [PubMed]
  17. Andreici Etimie, E.L.; Avram, N.M.; Brik, M.G. The d-d transitions and ligand field parameters for Cr3+/ Co2+ doped (Mg, Zn)Al2O4: Multi-reference Ab initio investigations. Opt. Mater. X 2022, 16, 100188. [Google Scholar] [CrossRef]
  18. Delgado, T.; Afshani, J.; Hagemann, H. Spectroscopic Study of a Single Crystal of SrAl2O4: Eu2+, Dy3+. J. Phys. Chem. C 2019, 123, 8607–8613. [Google Scholar] [CrossRef]
  19. Dołęga, A.; Juszyńska-Gałązka, E.; Deptuch, A.; Jaworska-Gołąb, T.; Zieliński, P.M. Vibrational Dynamics of Carbamazepine: Studies Based on Two-Dimensional Correlation Spectroscopy and X-ray Diffraction. Appl. Spectrosc 2020, 74, 473–484. [Google Scholar] [CrossRef]
  20. Hansford, G.M. Phase-targeted X-ray diffraction. J. Appl. Crystallogr. 2016, 49 Pt 5, 1561–1571. [Google Scholar] [CrossRef]
  21. Joy, D.C. The Resolution of the SEM. Microsc. Microanal. 2020, 3, 1173–1174. [Google Scholar] [CrossRef]
  22. Aroz, R.; Lennikov, V.; Cases, R.; Sanjuán, M.L.; de la Fuente, G.F.; Munoz, E. Laser synthesis and luminescence properties of SrAl2O4: Eu2+, Dy3+ phosphors. J. Eur. Ceram. Soc. 2012, 32, 4363–4369. [Google Scholar] [CrossRef]
  23. Yan, Y.; Ge, M.; Li, Y.; Kumar, D.N.T. Morphology and spectral characteristics of a luminous fiber containing a rare earth strontium aluminate. Text. Res. J. 2012, 82, 1819–1826. [Google Scholar] [CrossRef]
  24. Clabau, F.; Rocquefelte, X.; Jobic, S.; Deniard, P.; Whangbo, M.-H.; Garcia, A.; Le Mercier, T. Mechanism of Phosphorescence Appropriate for the Long-Lasting Phosphors Eu2+-Doped SrAl2O4 with Codopants Dy3+ and B3+. Chem. Mater. 2005, 17, 3904–3912. [Google Scholar] [CrossRef]
  25. Vitola, V.; Millers, D.; Bite, I.; Smits, K.; Spustaka, A. Recent progress in understanding the persistent luminescence in SrAl2O4: Eu, Dy. Mater. Sci. Technol. 2019, 35, 1661–1677. [Google Scholar] [CrossRef]
  26. Lü, X.; Shu, W.; Yu, Q.; Fang, Q.; Xiong, X. Roles of doping ions in persistent luminescence of SrAl2O4: Eu2+, RE3+ phosphors. Glass Phys. Chem. 2007, 33, 62–67. [Google Scholar] [CrossRef]
  27. Brik, M.G.; Ma, C.G.; Yamamoto, T.; Piasecki, M.; Popov, A.I. First-Principles Methods as a Powerful Tool for Fundamental and Applied Research in the Field of Optical Materials. In Phosphor Handbook: Experimental Methods for Phosphor Evaluation and Characterization; CRC Press: Boca Raton, FL, USA, 2022; pp. 1–26. [Google Scholar]
  28. Seeman, V.; Feldbach, E.; Kärner, T.; Maaroos, A.; Mironova-Ulmane, N.; Popov, A.I.; Shablonin, E.; Vasil’chenko, E.; Lushchik, A. Fast-neutron-induced and as-grown structural defects in magnesium aluminate spinel crystals with different stoichiometry. Opt. Mater. 2019, 91, 42–49. [Google Scholar] [CrossRef]
  29. Endla, P. Synthesis and evaluation of ZnAl2O4 and Mn, Dy doped ZnAl2O4 powders by sol–gel and ball milling method. Chem. Pap. 2022, 76, 7327–7331. [Google Scholar] [CrossRef]
  30. Jia, W.; Yuan, H.; Lu, L.; Liu, H.; Yen, W.M. Phosphorescent dynamics in SrAl2O4:Eu2+,Dy3+ single crystal fibers. J. Lumin. 1998, 76–77, 424–428. [Google Scholar] [CrossRef]
  31. Katsumata, T.; Nabae, T.; Sasajima, K.; Matsuzawa, T. Growth and characteristics of long persistent SrAl2O4- and CaAl2O4- based phosphor crystals by a floating zone technique. J. Cryst. Growth 1998, 183, 361–365. [Google Scholar] [CrossRef]
  32. Das, S.; Manam, J.; Sharma, S.K. Composites of BaAl2O4: Eu2+,Dy3+/organic dye encapsulated in mesoporous silica as multicolor long persistent phosphors based on radiative energy transfer. New J. Chem. 2017, 41, 5934–5941. [Google Scholar] [CrossRef]
  33. Han, S.D.; Singh, K.C.; Cho, T.Y.; Lee, H.S.; Jakhar, D.; Hulme, J.P.; Han, C.H.; Kim, J.D.; Chun, I.S.; Gwak, J. Preparation and characterization of long persistence strontium aluminate phosphor. J. Lumin. 2008, 128, 301–305. [Google Scholar] [CrossRef]
  34. Pei, P.; Wei, R.; Wang, B.; Su, J.; Zhang, Z.; Liu, W. An Advanced Tunable Multimodal Luminescent La4GeO8: Eu2+, Er3+ Phosphor for Multicolor Anticounterfeiting. Adv. Funct. Mater. 2021, 31, 2102479. [Google Scholar] [CrossRef]
  35. Wang, S.; Wu, H.; Wen, X.; Luo, Y.; Tan, T.; Jiao, S.; Pang, R.; Jiang, L.; Zhang, S.; Li, D.; et al. Single-phase white-emitting and tunable color phosphor Na3Sc2(PO4)3: Eu2+, Dy3+: Synthesis, luminescence and energy transfer. J. Rare Earths 2022, 40, 551–558. [Google Scholar] [CrossRef]
  36. Li, K.; Shang, M.; Lian, H.; Lin, J. Recent development in phosphors with different emitting colors via energy transfer. J. Mater. Chem. C 2016, 4, 5507–5530. [Google Scholar] [CrossRef]
  37. Liu, B.; Gu, M.; Liu, X.; Huang, S.; Ni, C. Theoretical study of structural, electronic, lattice dynamical and dielectric properties of SrAl2O4. J. Alloy. Compd. 2011, 509, 4300–4303. [Google Scholar] [CrossRef]
  38. Nazarov, M.; Brik, M.G.; Spassky, D.; Tsukerblat, B.; Nazida, A.N.; Ahmad-Fauzi, M.N. Structural and electronic properties of SrAl2O4: Eu2+ from density functional theory calculations. J. Alloy. Compd. 2013, 573, 6–10. [Google Scholar] [CrossRef]
  39. Yang, Y.; Wu, A.; Bai, H.; Bao, J.; Li, W.; Liu, Y. Synthesis of LaPO4:Eu nanofibers with enhanced photoluminescence quantum yield. J. Alloy. Compd. 2021, 879, 160477. [Google Scholar] [CrossRef]
  40. Yang, S.; Dai, Y.; Shen, Y.; Duan, C.; Rao, Q.; Peng, H.; Yang, F.; Shan, Y.; Zhao, Q. Blue emission from Sr0.98Ga2B2O7: 0.01Bi3+, 0.01Dy3+ phosphor with high quantum yield. J. Alloy. Compd. 2019, 810, 151849. [Google Scholar] [CrossRef]
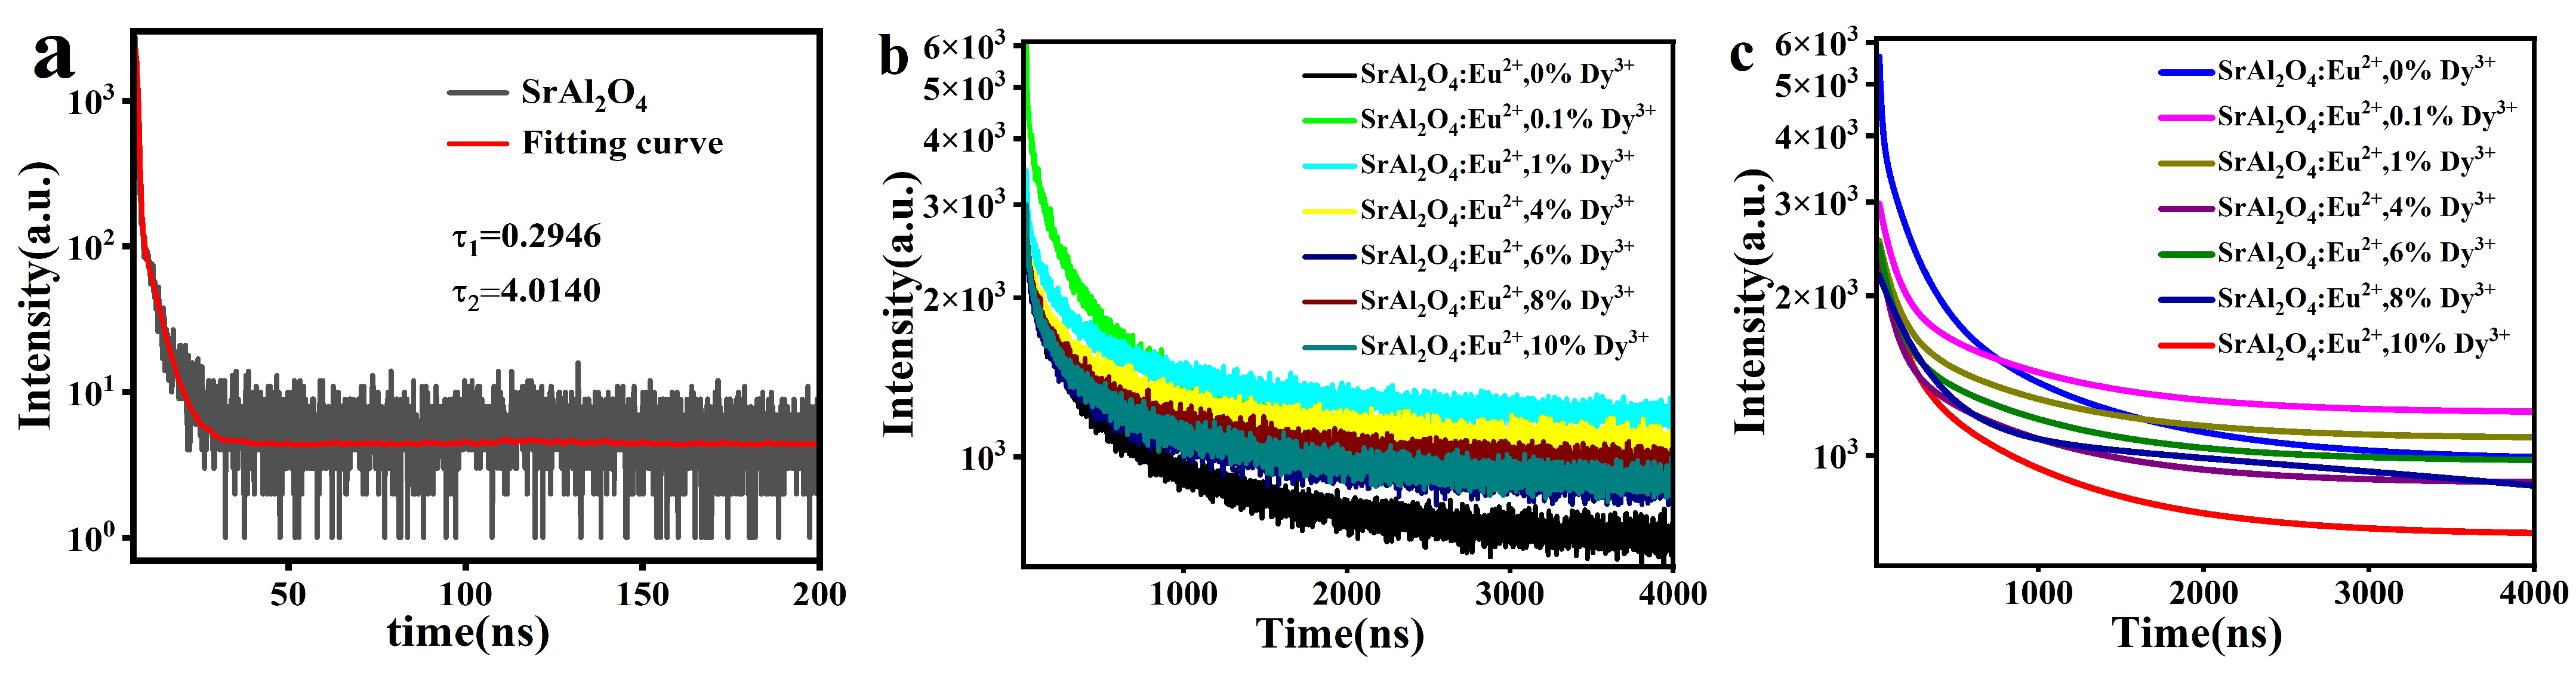
Figure 1. (a) X-ray diffraction (XRD) investigation based on the samples prepared at different temperatures, (b) XRD investigation based on the samples prepared at different Dy ion doping concentration, (c) The XRD refinement of SrAl2O4 host.
Coatings 13 00808 g001
Figure 2. Scanning electron microscope (SEM) of the luminescent samples synthesized at (a) 500 °C, (b) 600 °C, (c) 700 °C, (d) 800 °C, (e) 900 °C, and (f) The energy dispersive X-ray spectroscopy (EDX) of the SrAl2O4: Eu2+, Dy3+.
Coatings 13 00808 g002
Figure 3. (a) photoluminescence spectroscopy (PL) emission spectrogram of SrAl2O4: 2%Eu2+, 0.5%Dy3+ sample was excited at 365 nm, (b) Photo Luminescence Excitation (PLE) excitation spectrum of SrAl2O4: 2%Eu2+, 0.5%Dy3+ sample was detected at 508 nm.
Coatings 13 00808 g003
Figure 4. (a) PL emission spectrum of samples were excited at 365nm; (b) Luminescence of temperature control group under 365 nm UV lamp irradiation.
Coatings 13 00808 g004
Figure 5. (a) emission spectra of different Dy3+ doping amounts ( λ e m = 365 nm); (b) Luminescence of different Dy3+ doping amounts under 365 nm UV lamp irradiation.
Coatings 13 00808 g005
Figure 6. X-ray fluorescence spectra of different samples.
Coatings 13 00808 g006
Figure 7. Optical imaging pictures of 5 samples under X-ray excitation (a) SrAl2O4, (b) SrAl2O4: Eu2+, (c) SrAl2O4: Eu2+, 0.1 %Dy3+, (d) SrAl2O4: Eu2+, 0.5 %Dy3+, and (e) SrAl2O4: Eu2+, 2%Dy3+.
Coatings 13 00808 g007
Figure 8. Afterglow of each sample under X-ray.
Coatings 13 00808 g008
Figure 9. Schematic diagram of afterglow mechanism for SrAl2O4: Eu2+, Dy3+.
Coatings 13 00808 g009
Figure 10. (a) Fluorescence lifetime decay curve and fitting curve of SrAl2O4, (b) Fluorescence lifetime decay curves of different samples of SrAl2O4: 0.02Eu2+, xDy3+(x = 0, 0.001, 0.01, 0.04, 0.06, 0.08, and 0.1), (c) Fluorescence lifetime decay fitting curves for different samples of SrAl2O4: 0.02Eu2+, xDy3+(x = 0, 0.001, 0.01, 0.04, 0.06, 0.08, and 0.1).
Coatings 13 00808 g010
Figure 11. UV absorption diffuse reflection spectrum of the prepared SrAl2O4: Eu2+,Dy3+ (inset:the band gap values).
Coatings 13 00808 g011
Figure 12. (a) Emission spectra of phosphors with different solvents ( λ e m = 365 nm), (b) XRD patterns of samples with different solvents.
Coatings 13 00808 g012
Figure 13. SEM images of the luminescent samples synthesized after adding (a) EA; (b) PVA; (c) PEG.
Coatings 13 00808 g013
Figure 14. Fluorescence spectra of different samples and quantum yield (a) SrAl2O4, (b) SrAl2O4: Eu2+, (c) SrAl2O4: Eu2+, 0.1 %Dy3+, (d) SrAl2O4: Eu2+, 0.5 %Dy3+, and (e) SrAl2O4: Eu2+, 2%Dy3+.
Coatings 13 00808 g014
Figure 15. (a) Preparation process of PDMS composites and its elastic properties, (b) PDMS composites in natural light, (c) PDMS composite under UV lamp irradiation.
Coatings 13 00808 g015
Figure 16. (a) SEM surface morphology of PDMS composite without fluorescent powder and the average size of about 50 μ m, (b) SEM surface morphology of PDMS composite with fluorescent powder and the average size of about 200 μ m (c) SEM sectional morphology of PDMS composite without fluorescent powder and the average size of about 50 μ m, (d) SEM sectional morphology of PDMS composite with fluorescent powder and the average size of about 20 μ m.
Coatings 13 00808 g016
Table 1. Parameters of fluorescence lifetime decay curves for different samples.
SampleDecay Lifetimes (ns)
A 1 A 2 τ 1 τ 2 τ avg
SrAl2O40.0880.0020.29464.01401.174
SrAl2O4: Eu2+, 0%Dy3+822.640747.737117.708812.838717.311
SrAl2O4: Eu2+, 0.1%Dy3+1924.7191110.173180.771907.019720.518
SrAl2O4: Eu2+, 1%Dy3+1021.863753.37897.536813.502713.355
SrAl2O4: Eu2+, 4%Dy3+820.139640.820106.750828.777726.596
SrAl2O4: Eu2+, 6%Dy3+890.813628.54588.892798.896702.182
SrAl2O4: Eu2+, 8%Dy3+877.156633.43694.751818.088718.112
SrAl2O4: Eu2+, 10%Dy3+1147.305648.023110.980852.331713.445
Disclaimer/Publisher’s Note: The statements, opinions and data contained in all publications are solely those of the individual author(s) and contributor(s) and not of MDPI and/or the editor(s). MDPI and/or the editor(s) disclaim responsibility for any injury to people or property resulting from any ideas, methods, instructions or products referred to in the content.

