1. Introduction
Typically, cans intended to come into contact with food require the application of polymeric coating formulations to the internal surfaces to prevent product-packaging interaction, which could reduce product shelf life or quality to an unacceptable level. There are several essential requirements that an internal coating has to fulfill to be applied: it has to act as an inert barrier, separating the packaging from its contents but without imparting any flavour to the food; it must resist physical deformation during the manufacturing process of the packaging and still provide the required chemical resistance; and the enamel must be flexible, spread evenly, and completely cover the substrate by adhering to the metal surface [
1]. In general, polymeric coatings are complex formulations that may contain different components like resins, cross-linking agents, lubricants, and solvents, among others.
Epoxy resins are one of the most used polymeric coating due to their desirable mechanical properties, chemical resistance and flavor retention. Epoxy resins are thermosetting resins that have several epoxide groups per molecule and are obtained by condensation of epichlorohydrin with bisphenol A (BPA), giving rise to bisphenol A diglycidyl ethers (BADGEs) [
2].
The resulting material, namely coating, may contain starting substances like additives or monomers, and substances that are non-intentionally added (NIAS) such as reaction or degradation products formed during the manufacturing process. All of them can potentially migrate from the food contact material into the food. Therefore, to guarantee food safety, control of the migration of materials in contact with food has become a priority matter. For example, cyclo-di-BADGE (CdB), which is not integrated into the polymer network and therefore can easily migrate, was the predominant compound detected in samples analyzed in the authors’ laboratory by high-performance liquid chromatography (HPLC) [
3]. Moreover, several BADGE derivatives with chain stoppers, solvents or catalysts used for coating production were identified by many authors in extracts of epoxy coating as well as in analysis carried out with food simulants [
4,
5,
6,
7,
8]. However, it should be noted that very little work has been done on the analysis of these compounds using real food samples.
Currently, there is no specific harmonized EU legislation covering this sector related to polymeric coatings for food cans. There is a resolution of the Council of Europe on coatings intended to come into contact with foodstuffs that includes general guidelines and a list of substances used in the manufacture of coatings intended to come into contact with foodstuffs [
9]. There are certain substance-specific legislations such as Regulation 2018/213 [
10] that establishes a specific migration limit (SML) for BPA of 0.05 mg/kg, from plastics and also from varnishes or coatings applied to materials, while BPA migration from plastic materials or varnishes or coatings applied to materials and articles intended specifically for babies is not allowed and young children up to 3 years old; or Regulation 1895/2005 [
11] that establishes a maximum SML of 9 mg/kg for the sum of BADGE and their hydrolyzed derivatives (BADGE.H
2O, BADGE.2H
2O), and also an SML of 1 mg/kg for the sum of their hydrochloric derivatives (BADGE.H
2O.HCl, BADGE.HCl, BADGE.2HCl). However, BADGE derivatives with chain stoppers, solvents or catalysts used for coating production are not taken into account, for which due to this similarity is also expected to result in potentially harmful toxicological profiles.
In this study, the polymeric coating in forty-eight cans was assessed by an infrared spectrometer with attenuated total reflectance (FTIR-ATR). The food matrices were extracted, and a target analysis was carried out to quantify CdB using reversed phase HPLC with fluorescence detection (HPLC-FLD). Liquid chromatography was selected since it is the most appropriate technique in the analysis of bisphenolic compounds. The results were also confirmed by liquid chromatography with tandem mass spectrometry detection (LC-MS/MS), in particular when interferences were present in the food samples. There are very few works regarding the analysis of CdB in real food matrices due to the recent availability of the analytical standard. The first estimation of potential exposure of the adult population was estimated by combining the concentration of CdB in the positive samples with the Spanish consumption data, when available.
In addition, and for the first time to the best of our knowledge, a non-targeted screening by LC-MS/MS in positive and negative electrospray ionization (ESI) mode was performed in the real food sample extracts for the tentative identification of other BADGE derivatives from epoxy resins comparing their masses with a homemade database based on the possible starting substances. It has to be noted that the absence of available analytical standards, as well as toxicity data to date, and also the non-existing regulated European threshold, poses a challenge in this kind of screening study.
2. Materials and Methods
2.1. Chemicals and Analytical Standards
Cyclo-di-BADGE (CdB) 99.5% was purchased from Chiron AS (Trondheim, Norway). Acetonitrile (ACN), glacial acetic acid and tert-butyl methyl ether (MTBE) were from Scharlab (Barcelona, Spain). Tetrahydrofuran was obtained from Merck (Darmstadt, Germany). Ultrapure water was obtained from a Direct-Q equipment (Millipore Ibérica, S.A., Madrid, Spain). To carry out the solid phase extraction (SPE), Sep-Pak C18 cartridges were obtained from Waters (Ireland). The chemical structure and some physico-chemical characteristics of CdB are shown in
Table 1 (ChemDraw Professional v. 16.0.1.4).
A stock solution of CdB containing 200 µg/mL was prepared in a mix of acetonitrile and tetrahydrofuran (60:40, v/v). From this, two intermediate solutions of 20 and 2 µg/mL in ACN were prepared. Working solutions ranging from 5 to 200 µg/L were prepared daily in sunflower oil for the quantification in samples with a fat content higher than 2% and in ACN for the quantification in samples with lower fat content. The stock solution and the intermediate solutions were stored at 4 °C in the fridge for up to 6 and 1 month, respectively.
2.2. Food Samples
Forty-eight food samples packaged in cans of different brands were collected in the retail market at different location sites in Spain (2019–2020) and were kept at room temperature until the analysis. The samples covered the food category of fish (twenty-two samples) including tuna, bonito, mackerel, sardine, melva, octopus and anchovies; and the category of vegetables (twenty-six samples) including tomato, olives, lentils, mushrooms, artichoke, peppers, beans, corn, fresh palm hearts, green peas and bean stew. The can sizes ranged between 80 and 2700 g and the fat content was between 0% in the samples of artichoke or fresh palm hearts and 33% in the tuna in oil samples, according to the detailed information on the label.
2.3. Sample Extraction
A validated and ISO 17025 accredited method by the Spanish National Accreditation body (ENAC) for the determination of bisphenols and some epoxy derivatives in foods, based on HPLC-FLD and confirmation by LC-MS/MS, was applied for the extraction of the samples and quantification of CdB. The total content of the can, both the covering liquid and the solid, were homogenized. An amount of 10 g of each food sample was taken for analysis. Assays were performed in duplicate. A volume of 10 mL of MTBE was added, the mixture was shaken for 15 min in an orbital agitator and centrifuged at 3000 rpm for 10 min. Then, the organic layer was collected and, for those samples with a fat content higher than 2%, the previous process was repeated with another 10 mL of MTBE. Both extracts were pooled and evaporated by a stream of nitrogen at 35 °C until a fatty residue was obtained. Then, a volume of 5 mL of ACN was added and stirred. Following, the supernatant was recovered, and this process was repeated with another 5 mL of ACN. The extracts were pooled and evaporated until dryness under a stream of nitrogen at 40 °C. A volume of 10 mL of ACN was used to dissolve the residue and an aliquot (c.a. 5 mL) was further cleaned by flowing it through a Sep-Pak C18 cartridge. Finally, 1 mL of the purified extract was mixed with 1 mL of water and filtered with a Polytetrafluoroethylene (PTFE) 0.2 filter, before the injection into the LC.
The method described was validated, in terms of accuracy and precision.
For the method validation, as well as for control quality tests, the sample of bonito in vegetable oil was selected as a representative matrix. The recovery was assessed by adding the homogenized sample at different concentrations levels of 10, 50 and 100 µg/kg. For this, appropriate aliquots of the 2 µg/mL in ACN intermediate standard solution were added and allowed to infuse into the sample for 15 min before proceeding with the extraction.
Working standard solutions prepared in sunflower oil were also extracted with a volume of 10 mL of ACN, shaken for 15 min, centrifuged, and an aliquot was passed through an SPE cartridge before HPLC analysis. Finally, the extract was mixed with water (1:1, v/v) and filtered with a PTFE 0.2 filter, before the injection into the LC.
2.4. Fourier Transform Infrared Spectroscopy (FTIR)
FTIR-ATR assays to verify the type of internal coating were performed using the same equipment and conditions as those described in the study of Santillana et al. [
12]. The equipment was controlled by the software Spectrum (Perkin-Elmer Spectrum, Boston, MA, USA) (Spectrum 10). The analysis was done on the internal side (lid, base, lateral) of the cans by covering the entire crystal surface using the clamp pressure set to its optimum value to obtain a good signal.
The identification was made by matching the spectra obtained with the spectra of the IR libraries (KnowItAll Informatics System, IR edition 2020, Bio-Rad Laboratories, Bio-Rad Laboratories, Inc., Philadelphia, PA, USA). The best hit quality index (HQI) was considered in each comparison.
2.5. High Performance Liquid Chromatography Coupled to Fluorescence Detection (HPLC-FLD)
CdB quantification was performed on an Agilent Technologies 1100 series (Waldbronn, Germany) HPLC system equipped with an Agilent G1321A fluorescence detector, controlled by the ChemStation. An X-Terra C18 column (150 mm × 3.0 mm, 3.5 µm) from Waters (Milford, MA, USA) was used. The mobile phase consisted of (A) water and (B) ACN. The gradient employed was: 0–0.35 min, 25% B; 0.35–5.8 min, 25–45% B; 5.8–15.5 min, 45–70% B; 15.5–18.4 min, 70–100% B; 18.4–20.5 min, 100% B; 20.5–22 min, 25% B. A constant flow rate of 0.55 mL/min was used and the injection volume was 20 µL. Fluorescence detection was carried out using the wavelength of 227 nm as excitation and 313 nm as emission.
The method described was validated, in terms of linearity, and sensitivity.
2.6. Liquid Chromatography Coupled to Mass Spectrometry (LC-MS/MS)
To confirm the presence of CdB, a LC-MS/MS system from Agilent Technologies (Waldbronn, Germany) was used. It consisted of an HPLC 1200 series coupled to a triple quadrupole mass spectrometer Triple Quad 6410, controlled by MassHunter software (MassHunter B.04.01, Agilent, Santa Clara, CA, USA). The same X-Terra column thermostat at 30 °C was used. The mobile phase consisted of water containing 0.1% (v/v) acetic acid (A) and ACN (B). The gradient employed was: 0–0.45 min, 30% B; 0.45–13.05 min, 30–80% B; 13.05–16.55 min, 80–100% B; 16.55–20.05 min, 100% B; 20.05–20.75 min, 30% B; 20.75–32 min, 30% B. A constant flow rate of 0.4 mL/min and a volume of 50 µL for the injection was used. Positive electrospray ionization (ESI) mode was used. The optimized settings of the MS/MS detector were as follows: vaporizer temperature 325 °C; spray voltage 4000 V; gas flow 6 L/min; fragment energy 135 V. Nitrogen was used as the sheath gas at a pressure of 45 psi. Selected reaction monitoring (SRM) mode was used for data acquisition. The selected precursor ion for CdB was m/z 586.4, the most sensitive ion in the Q1 mass spectra, which has been assigned as the ammonium adduct. Three SRM transitions of m/z 586.4 > 135.1 (40 V collision gas energy), m/z 586.4 > 285.1 (20 V) and m/z 586.4 > 569.3 (20 V) were monitored. CdB eluted at 15.6 min.
In addition, to tentatively elucidate the structure of the epoxy oligomers displayed in the FLD chromatograms, an LC-MS analysis in full scan mode (MS2 scan) was also carried out, under the same chromatographic conditions. MS data were acquired in full scan mode in the range 400 to 1000 m/z, both in positive and negative mode. Fragment energy was set at 135 V and for each peak detected in the chromatogram the mass spectra were checked against a homemade library for potential oligomers.
2.7. Dietary Exposure Estimation
Dietary exposure was estimated using the same methodology as that presented in previous work by the group [
13]. Briefly, Spanish consumption data from a national dietary survey [
14] were combined with the CdB concentration obtained in each actual sample. For those samples where CdB was found below the limit of quantitation (LOQ), half the value of the limit was assigned for exposure estimation purposes. In this study, we focused on the adult population group because they represent the largest consumer group of this type of food.
2.8. Statistical Analysis
Data are presented as the mean ± standard deviation.
3. Results and Discussion
3.1. Determination of the Type of Coating by FTIR
The nature of the can coating formulation and composition were not available before testing and therefore, the first step was the elucidation of the coating by FTIR technique. Only the best HQI were considered. Most of the coatings in the can bodies resulted to be polyesters (56%), followed by epoxy resins (31%) and others (13%). Regarding the internal coating of the lids, most turned out to be polyester type (81%).
Figure 1 shows the IR spectrum of sample S34 (
Figure 1A), which was identified as an epoxy resin with an HQI of 88; and the IR spectrum of sample S26, identified as a polyester coating with an HQI of 80 (
Figure 1B).
The great use of epoxy resins as coatings for food cans is due to their favorable mechanical characteristics, chemical resistance and flavour retention [
15]. Epoxy resins based on BADGE are one of the most widely used. However, several studies have related BPA as an endocrine disruptor and currently BPA is banned in epoxy coatings for infant formula packaging [
10]. The concern of the consumers about BPA in food, as well as legal restrictions, have led manufacturers to seek alternatives such as polyester coatings.
3.2. Method Validation
Calibration curves prepared daily in oil and ACN (HPLC-FLD) showed good linearity with correlation coefficients ≥ 0.999, in the concentration range from 5 to 200 µg/L CdB. The quantification limit (LOQ), taken as the lowest validated concentration level, was 0.010 mg/kg food (0.005 mg/kg for beverages), though lower concentration levels could be detected.
The accuracy and precision were determined by spiking a sample of bonito in oil with a known amount of CdB at different levels of concentration in triplicate on three separate days (n = 9). The mean recoveries obtained were 87% at level 10 µg/kg, 101% at level 50 µg/kg and 107% at level 100 µg/kg; while the intralaboratory precision values obtained, expressed as the % RSD, were not higher than 6% in all cases. These results show that the method proved to be appropriate for the extraction of CdB in canned food samples. Quality control samples were run in parallel with the sample analysis at different concentration levels to check method performance.
3.3. Concentration of CdB in Canned Food Samples
Twenty samples resulted to be positive (>LOQ = 10 µg/kg) for the presence of CdB (42%). Most of these positive samples, shown in
Table 2, belonged to the food category of fish and had a fat content higher than 2% which could be attributed to the fact that this type of compound generally presents more affinity for the lipid-soluble environment. Indeed, lower concentration values were found in low fat or not fatty matrices, corresponding to vegetable food type samples. Overall, 55% of the fish canned samples analysed (22) had CdB values above the LOQ; while in the case of vegetable samples (26) this percentage was lower, 31%. The results obtained were expressed as µg of CdB per kg of food (fourth column in
Table 2) and these were used for exposure estimation; for the remaining 28 samples, CdB was below the LOQ and for exposure assessment the middle bound was considered, that is, half the value of the LOQ was assigned. Additionally, only for informative purposes, the results were also recalculated applying a surface/volume (S/V) ratio of 6 dm
2 per kg of food for samples with a food content lower than 500 g (fifth column in
Table 2), as indicated in Regulation 10/2011 [
16].
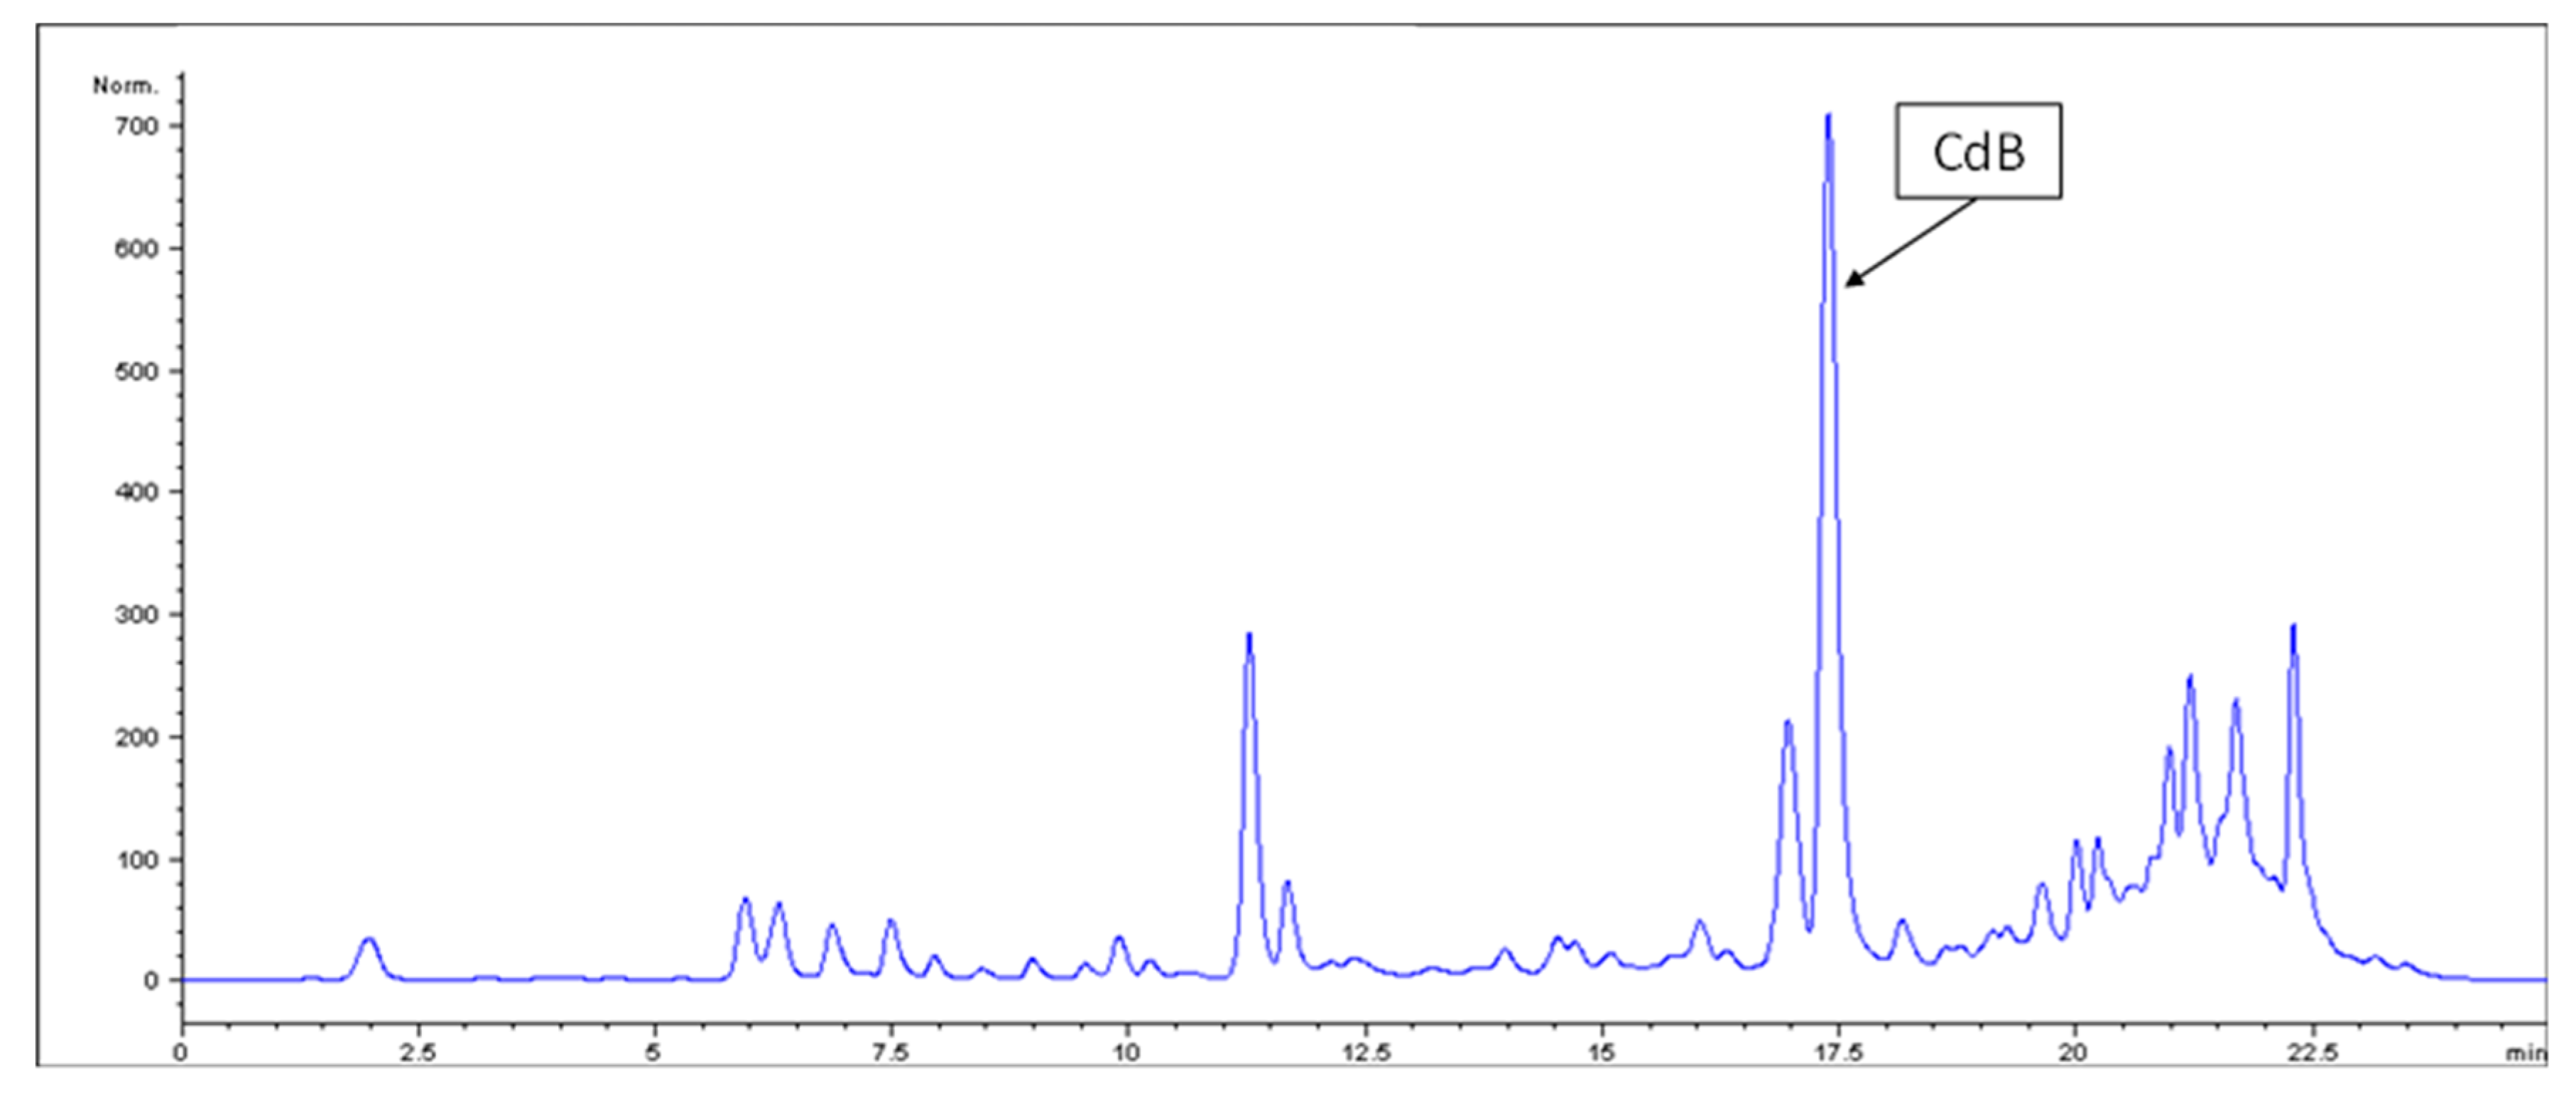
The concentrations of CdB ranged from <LOQ to 2623 µg/kg in a sample of sardines in oil (S25).
Figure 2 shows the HPLC-FLD chromatogram of the sardines in oil sample (S25) containing 2623 µg/kg CdB. These results agree with those presented in the work of Biederman et al. [
17], who found an average concentration of 1025 µg/kg of CdB in samples of canned fish in oil (April 2010) and a maximum of 2640 µg/kg of CdB in a sample of sardines in oil (September 2012). Data on studies concerning the presence of CdB in foods are scarce.
In 2016, the German Federal Institute for Risk Assessment (BfR) published a statement about the presence of CdB into oily foods and assumed that CdB breaks down into linear molecules similar to BADGE. Based on the Cramer classification for CdB and the new proposal of the EFSA [
5] for the assessment of non-genotoxic substances in food contact, an exposure level of 90 µg per person and day was considered tolerable [
2]. Assuming an ingestion of 200 g of fatty food per day by an adult, this would account for a maximum migration level of 450 µg/kg. Taking into account the concentration of migrated CdB, (not corrected for an S/V of 6 when applicable), in the samples analysed in this study (
n = 48), 23% exceeded this recommendation.
From the data shown in
Table 2, it can be seen that all the positive can samples for CdB contained an internal coating based on an epoxy resin, except for the sample where the lowest concentration of CdB (S26) was obtained, with an internal coating based on polyester. In this sample it was found that the external coating of the can was an epoxy resin, therefore, a possible set-off phenomena during the staking of the sheets in the manufacturing could explain the results obtained [
3]. Indeed, as expected, in samples where CdB was below the LOQ, the internal coating was not identified as epoxy-based. No correlation was found in the oily samples between the concentration values of CdB and the type of canned oil, sunflower or olive oil.
3.4. Estimation of the Exposure to CdB
Fifty-eight percent of the CdB results were below the LOQ. To derive mean concentrations for exposure calculation, these values were considered to be equal to 1/2 LOQ, according to WHO/GEMS Food recommendations [
18]. Median concentration values (P50) are reported for those foods where at least 6 analytical results were available; the 95th percentile (P95) has not been estimated due to the limited number of observations for each type of food.
Table 3 shows the estimated mean concentration levels and the derived dietary exposure values (mean and 50th percentile) of the Spanish adult population to CdB, based on the combination of the mean concentration levels of CdB found in the canned food samples included in this study and the consumption data [
14]. For some specific canned food samples, including mackerel, palm hearts, artichokes, red pepper, and green peas the exposure could not be estimated because no consumption data by the Spanish adult population were available.
As the toxicology data available for CdB are limited and there is no established tolerable daily intake (TDI) for this compound, the threshold of toxicological concern (TTC) concept is used to estimate the level of human exposure. The Cramer classification, using the Toxtree v3.1.0 (Ideaconsult Ltd., Sofia, Bulgaria) software [
19], is considered the best-known approach to making a TTC estimation. Cramer’s decision tree makes it possible to classify the toxicological hazard of an analyte based on its molecular structure into class I, II or III for low, intermediate or high toxicity, respectively.
CdB is classified as class III as a heterocyclic compound, so a value of 1.5 µg/kg bw/day or 90 µg/person/day assuming a person weigh of 60 kg, which is also assumed when migration limits are set regarding materials in contact with food, is assumed for the evaluation of the exposure [
20]. Therefore, taking into account the estimated dietary exposure values obtained for CdB in the Spanish adult population and the mean concentration values found in the studied vegetables and oily fish canned samples, though data are limited and considering that consumption data were not available for all food types, it seems that at an average this value is not exceeded. However, an exceedance probability for higher consumers or brand loyalty consumers of canned oily fish cannot be excluded, in particular with the consumption of sardines in oil packaged in cans with an internal epoxy-based coating.
These results coincide with those reported by the BfR where it is concluded that this TTC is not exceeded when considering an average consumption of canned oily fish, but for higher consumptions, this TTC could be exceeded and cause long-term adverse effects on human health [
20].
3.5. Tentative Identification of Epoxy Oligomers
As can be observed in
Figure 2, there are numerous peaks (in addition to CdB) and some of them presented the same fluorescence spectrum. With the intention of tentatively identify these compounds, a non-target screening analysis was applied. The positive food extracts for CdB were also analyzed by LC-MS in positive and negative ESI mode (MS2 scan) using the same chromatographic method, but with the acquisition mode in full scan from
m/
z 400 to 1000. The upper
m/
z limit of 1000
m/
z was selected since it is generally recognized that compounds (excluding perfluoroalkyl substances) above this mass range are typically not absorbed through the gastrointestinal tract. Significantly more peaks were observed in the chromatograms acquired in the positive mode, and only these results are displayed in
Table 4.
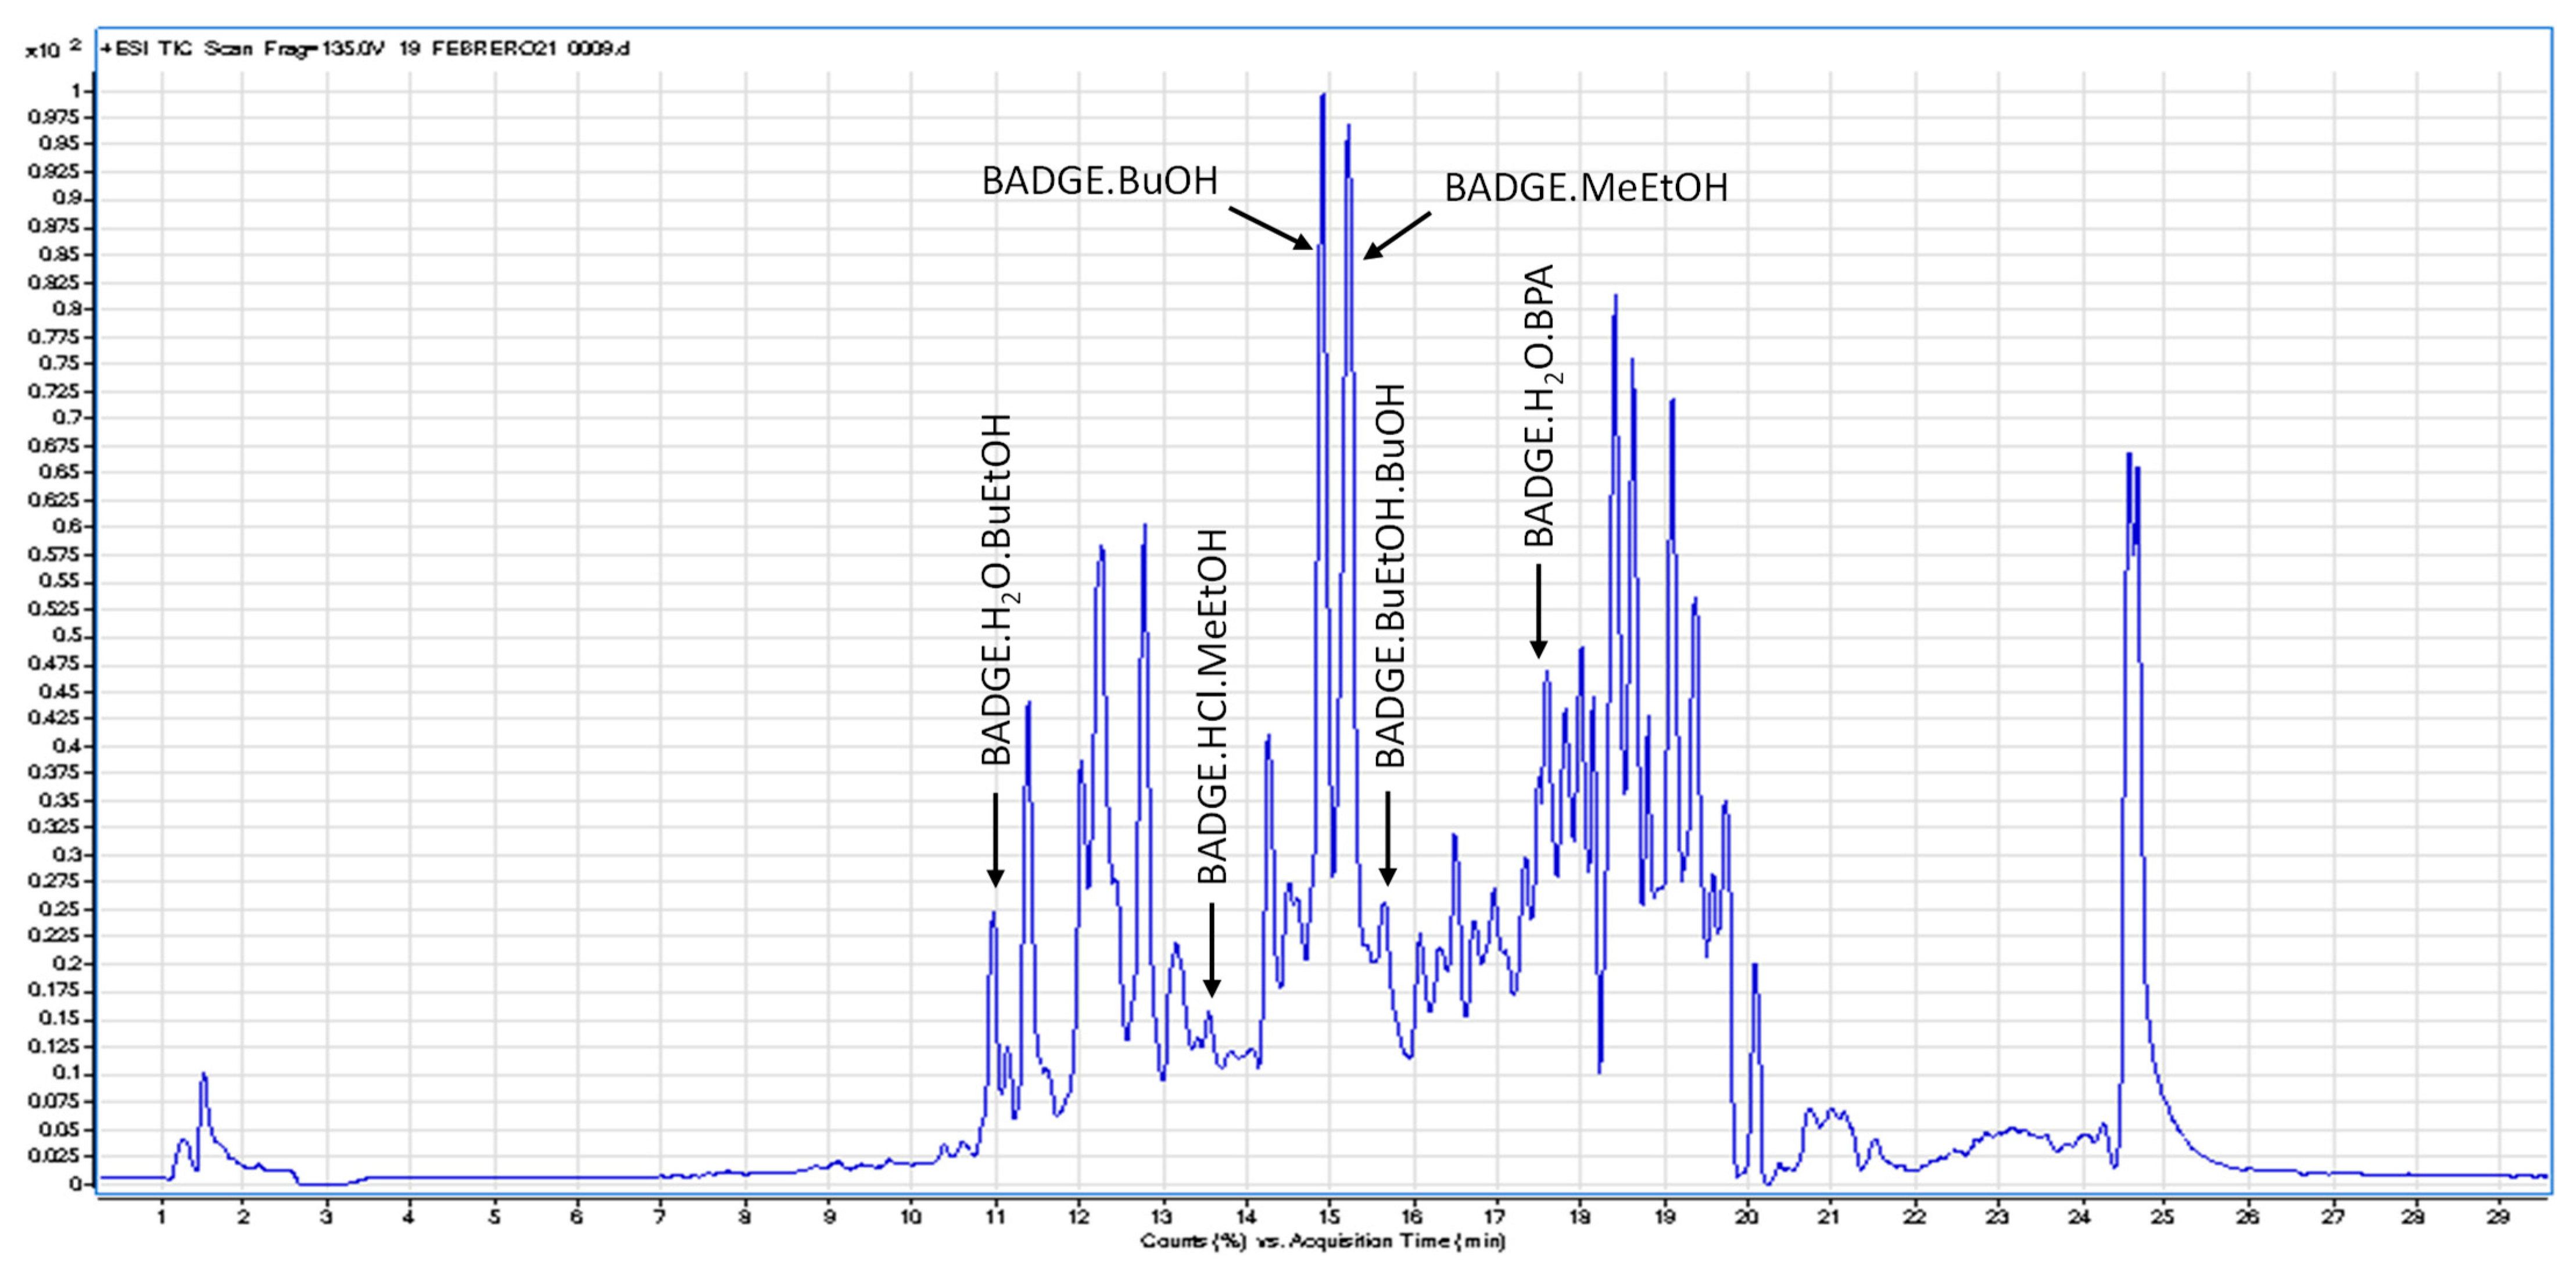
Figure 3 shows the scan LC-MS chromatogram of the octopus sample (S40).
For the tentative identification of compounds, a homemade database was developed at the laboratory, taking into account possible starting substances present in epoxy resins and the possible adducts formed including H+ (M + 1), ACN+ (M + 42), NH4+ (M + 18), Na+ (M + 23), K+ (M + 39) and H− (M − 1), as well as n repetitions of BADGE units up to 1000 m/z. Comparing the mass spectra of the detected peaks with those in the homemade database, a total of 18 epoxy oligomers could be tentatively identified in the food extracts. For most of the compounds, the adduct with sodium could be detected, probably because foods could contain it among their ingredients as a natural source. As shown in the table, two possible structures could be attributed to m/z 643.5, BADGE.BPA.BuOH or BADGE(n = 1)H2O; since this technique does not allow to obtaining the value of the accurate mass, the specific assignation was not possible.
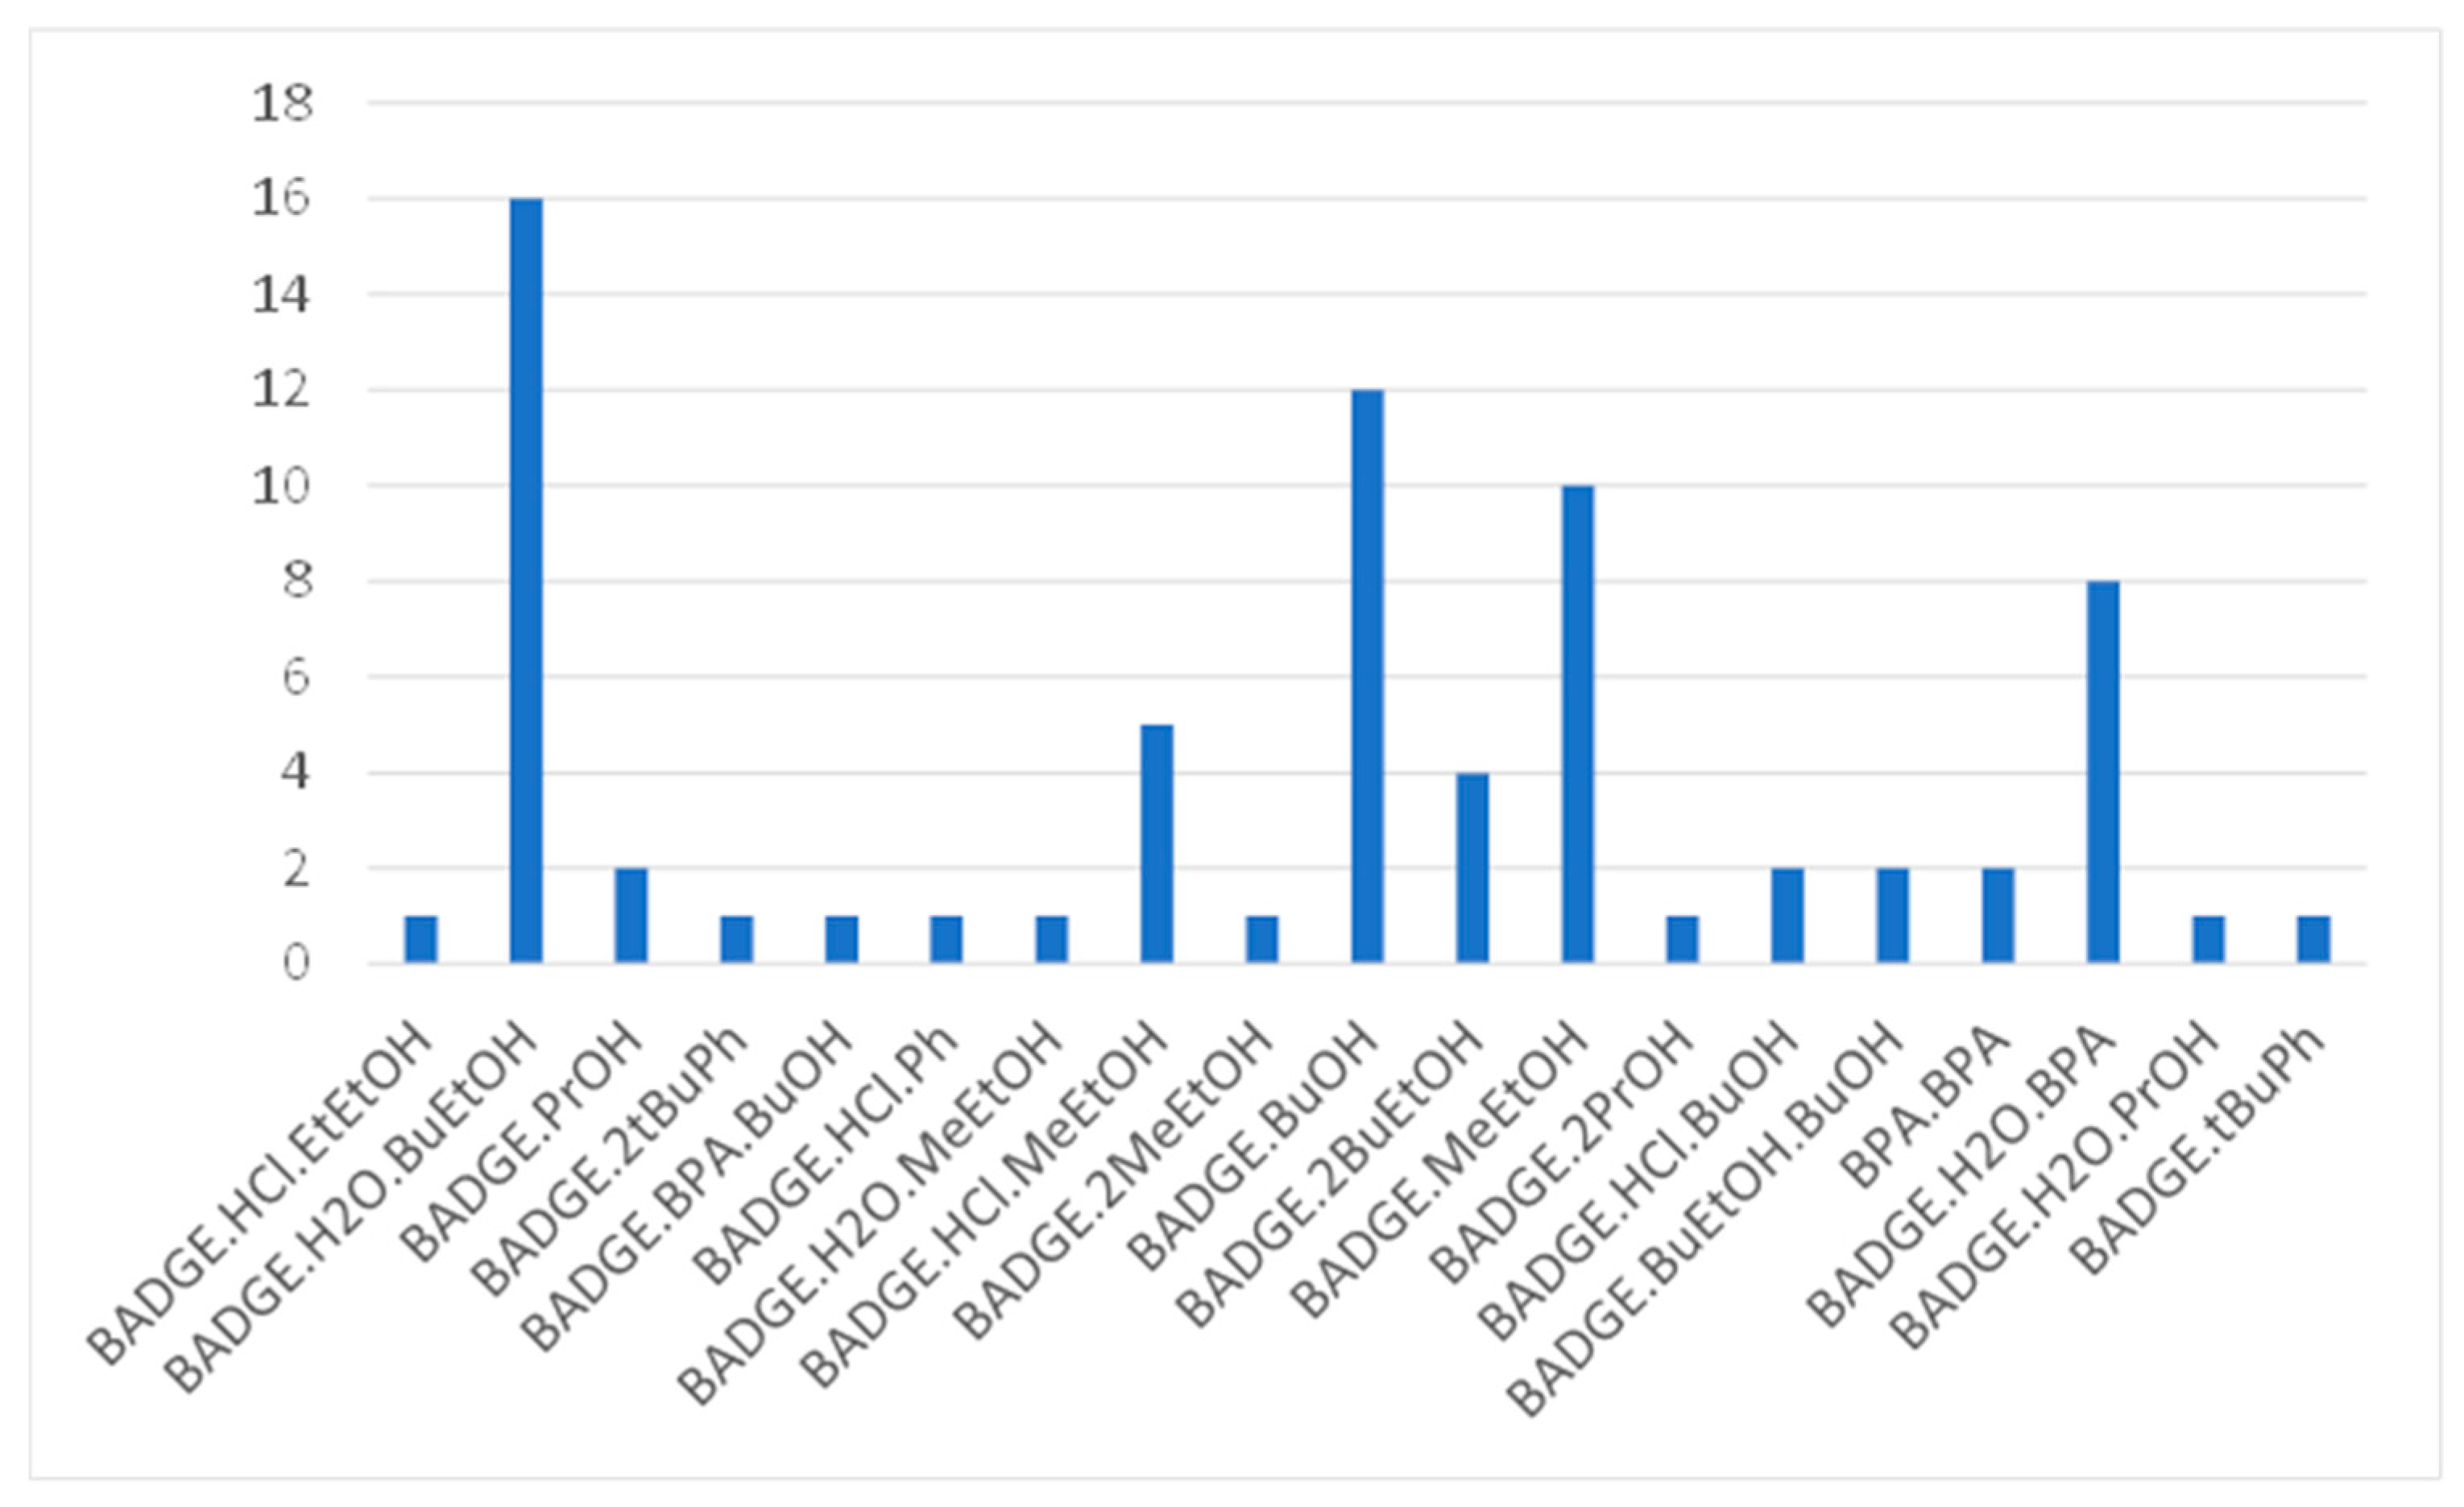
The BADGE derivative with the highest incidence was BADGE.H
2O.BuEtOH, which was presented in sixteen of the twenty samples analysed; followed by BADGE.BuOH, BADGE.MeEtOH and BADGE.H
2O.BPA (
Figure 4). These results are in line with others published in the literature [
4,
5,
6,
7,
8]. However, the bibliography reviewed by the authors revealed that these compounds were only identified in migration tests carried out on cans with solvents. The closest study to the present one would be that reported by Theobald et al. [
5], where sunflower oil was used as a simulant for the identification of these compounds. Therefore, to date, this would be the first work where these BADGE derivatives are tentatively identified in real food samples.
These epoxy derivatives have not been toxicologically evaluated yet, therefore the toxicological hazard was estimated using the Cramer decision tree based on its molecular structure. All of them turned out to be classified as class II (high toxicity) because they contain more than one aromatic ring in their structures. Toxicological studies are required to assess the risk of consumer exposure to these compounds, which should not be underestimated.
4. Conclusions
In this study, the polymeric coating of forty-eight vegetable and fish cans was characterized using FTIR-ATR, proving to be most of them a polyester type. An analytical method based on HPLC-FLD was developed and validated in order to quantify and confirm CdB in food samples. CdB was quantitated in 20 food canned samples out of 48 analysed, at concentration levels ranging from <LOQ to 2623 µg/kg in a sample of sardines in olive oil. The results were confirmed by LC-MS/MS and a first estimation of the dietary exposure of the Spanish adult population was calculated. The recommended value of 1.5 µg/kg bw/day for substances classified as class III was found not to be exceeded at an average consumption for the food type of samples analysed, when consumption data were available for the Spanish population. Nevertheless, an exceedance could not be dismissed for higher consumers without additional data as well as it is important to take into account the combined exposure to multiple endocrine disruptors. Overall, sardines in oil, packaged in cans with an internal epoxy-based coating was found to be the food type giving the higher exposure.
In addition, and for the first time to the best of our knowledge, a non-targeted screening using LC-MS was performed in food sample extracts and several BADGE derivatives from epoxy-based coatings such as BADGE.H2O.BuEtOH, BADGE.BuOH, BADGE.MeEtOH, among others, were tentatively identified. These compounds, due to this similarity with BADGE molecule, are also expected to result in potentially harmful toxicological profiles. Therefore, a risk assessment seems necessary for these epoxy derivatives to guarantee consumer product safety. These results would be very profitable for regulatory agencies, to be able to implement future legislation for this type of polymeric coating.

 ,
, 


