
Effect of Fluorocarbon Polymers on Hydrophobicity, Wear Resistance and Corrosion Resistance of Epoxy Resins

1
School of Materials Science and Engineering, Xiangtan University, Xiangtan 411105, China
2
Hunan Bangzer Technology Co., Ltd., Xiangtan 411100, China
3
Key Laboratory of Low Dimensional Materials and Application Technology of Ministry of Education, Xiangtan University, Xiangtan 411105, China
*
Authors to whom correspondence should be addressed.
Coatings 2023, 13(4), 685; https://doi.org/10.3390/coatings13040685
Submission received: 27 February 2023
/
Revised: 22 March 2023
/
Accepted: 22 March 2023
/
Published: 27 March 2023
(This article belongs to the Special Issue Advanced Polymeric Materials and Coatings: Synthesis, Properties and Applications)
Abstract
:In order to meet the anticorrosion and wear resistance requirements of petroleum pipelines, we selected a polymer (FC) containing difunctional hydroxyl propyl acrylate (HPA) and perfluoroalkyl ethyl acrylate (TEAc-N) free radical polymerization to prepare hydrophobic fluorocarbon chain oil and a hydroxyl special functional group. Combined with tetrafluororesin (F4), the hydrophobic, wear-resistant and corrosion-resistant properties of epoxy coating were improved. The optimum synthesis ratio of TEAc-N:HPA was 9:1, and the FC polymer with the best hydrophobicity was prepared. The hydrophobic angle of the coating was 100.3% higher than that of pure Q235 section steel. By adding 5 wt.% of FC to epoxy resin (EP), the hydrophobicity increased by 65.4% and oleophobicity increased by 32.1% compared with pure EP. The coefficient of friction was reduced by 73.8%. EIS test results showed that the impedance modulus in the low frequency region (|Z|0.01 Hz) was two orders of magnitude higher than that of the pure epoxy coating. The composite coating has sufficient utility to meet the wear, heat and corrosion resistance requirements for oil pipeline transportation.
1. Introduction
In petroleum media, the core factor of corrosion is sulfur: compounds of sulfur precipitated in the pipeline react with the iron in the pipeline to produce ferrous sulfate compounds. Due to the presence of free acid, hydrolysis is intensified and corrosion is more serious [1,2]. To solve this problem, scholars have proposed a series of methods, including pipeline stray current interference control technology, pipeline cathodic protection technology, and pipeline anticorrosion layer technology. At this stage, pipeline anticorrosion coatings are more widely used in practice because of their high economic effect and easy operation. Among them, barrier coatings (Ni-P/SiC composite coatings [3,4], diamond-like carbon coatings [5]) have become a popular direction to solve this problem. Oil pipeline coatings need to have excellent solvent resistance; be able to resist chemical corrosion by H2S, CO2, O2, acids, alkalis and organics in the transmission medium; be tough and wear resistant; have good impact resistance, bending resistance, and strong adhesion; and be able to effectively prevent mechanical damage during construction and damage from plant roots and soil environmental stresses during use. They also need to have a flat and smooth surface that is easy to handle [6].
Because of its high modulusand good chemical stability, epoxy resin can be used as an effective anticorrosive material, and is widely used in various aspects. However, due to the existence of micropores and hydrophilicity in the curing process, the anticorrosion feature is not long-lasting. Scholars have made many efforts to address this in recent years.
Fluorinated monomer is widely used because of its low surface energy, excellent high temperature resistance, aging resistance, chemical resistance and other properties, but fluorinated monomer is expensive, its polymer is not easily melted by solvent, and it has poor adhesion. By introducing fluorocarbon long chains into polymers, some polymers with good film forming properties, strong hydrophobicity, low cost and easy operation can be obtained [7]. At present, a large amount of fluoride preparation work has been carried out. Chuang Ma tooled ethyl methacrylate and butyl acrylate to obtain a fluorinated copolymer with good hydrophobicity, good aging resistance and very high compressive strength [8]. Miao synthesized photopatternable fluorinated polyacrylate prepolymers with other conventional low dielectric constant fluorinated materialsand the synthesized prepolymers had better compatibility with hydrocarbon solvents and monomers [9]. Zhang synthesized a new fluorinated acrylate polymer with excellent liquid repellency and thermal stability [10].
In recent years, fluorinated components have also been used in anticorrosive coatings [11]. Li prepared a series of NFTO composite coatings. Electrochemical impedance spectroscopy proved that the corrosion resistance of composite coatings immersed in 3.5 wt.% NaCl solution for 30 days was significantly improved [12]. M. Cichomski modified the resulting coatings with perfluorinated and alkyl phosphonic acid self-assembly layers with hydrocarbon or perfluorocarbon chains (DP and PFDP), which, applied to the top of Ti-DLC coatings, significantly improved their tribological and corrosion properties [13]. Zhong prepared hydrophobic modified alkyd resin composite coating with fluorinated acrylate-siloxane and submicron sheet zinc phosphate pigment, which has high anticorrosion properties for carbon steel [14]. Cheng developed a dual-function low-surface-energy coating with a polysilazane pre-ceramic precursor, which showed relatively low surface free energy and high corrosion resistance [15].
However, specific literature on the application of fluorinated polymers in the anticorrosion enhancement of epoxy coatings (EP) is rare, and the dispersion of fluorinated polymers seriously affects other mechanical properties [16]. It is suitable for the inner wall of oil pipelines, because it has excellent adhesion, excellent heat and wear resistance, and sufficient corrosion resistance, but there is no detailed study at present.
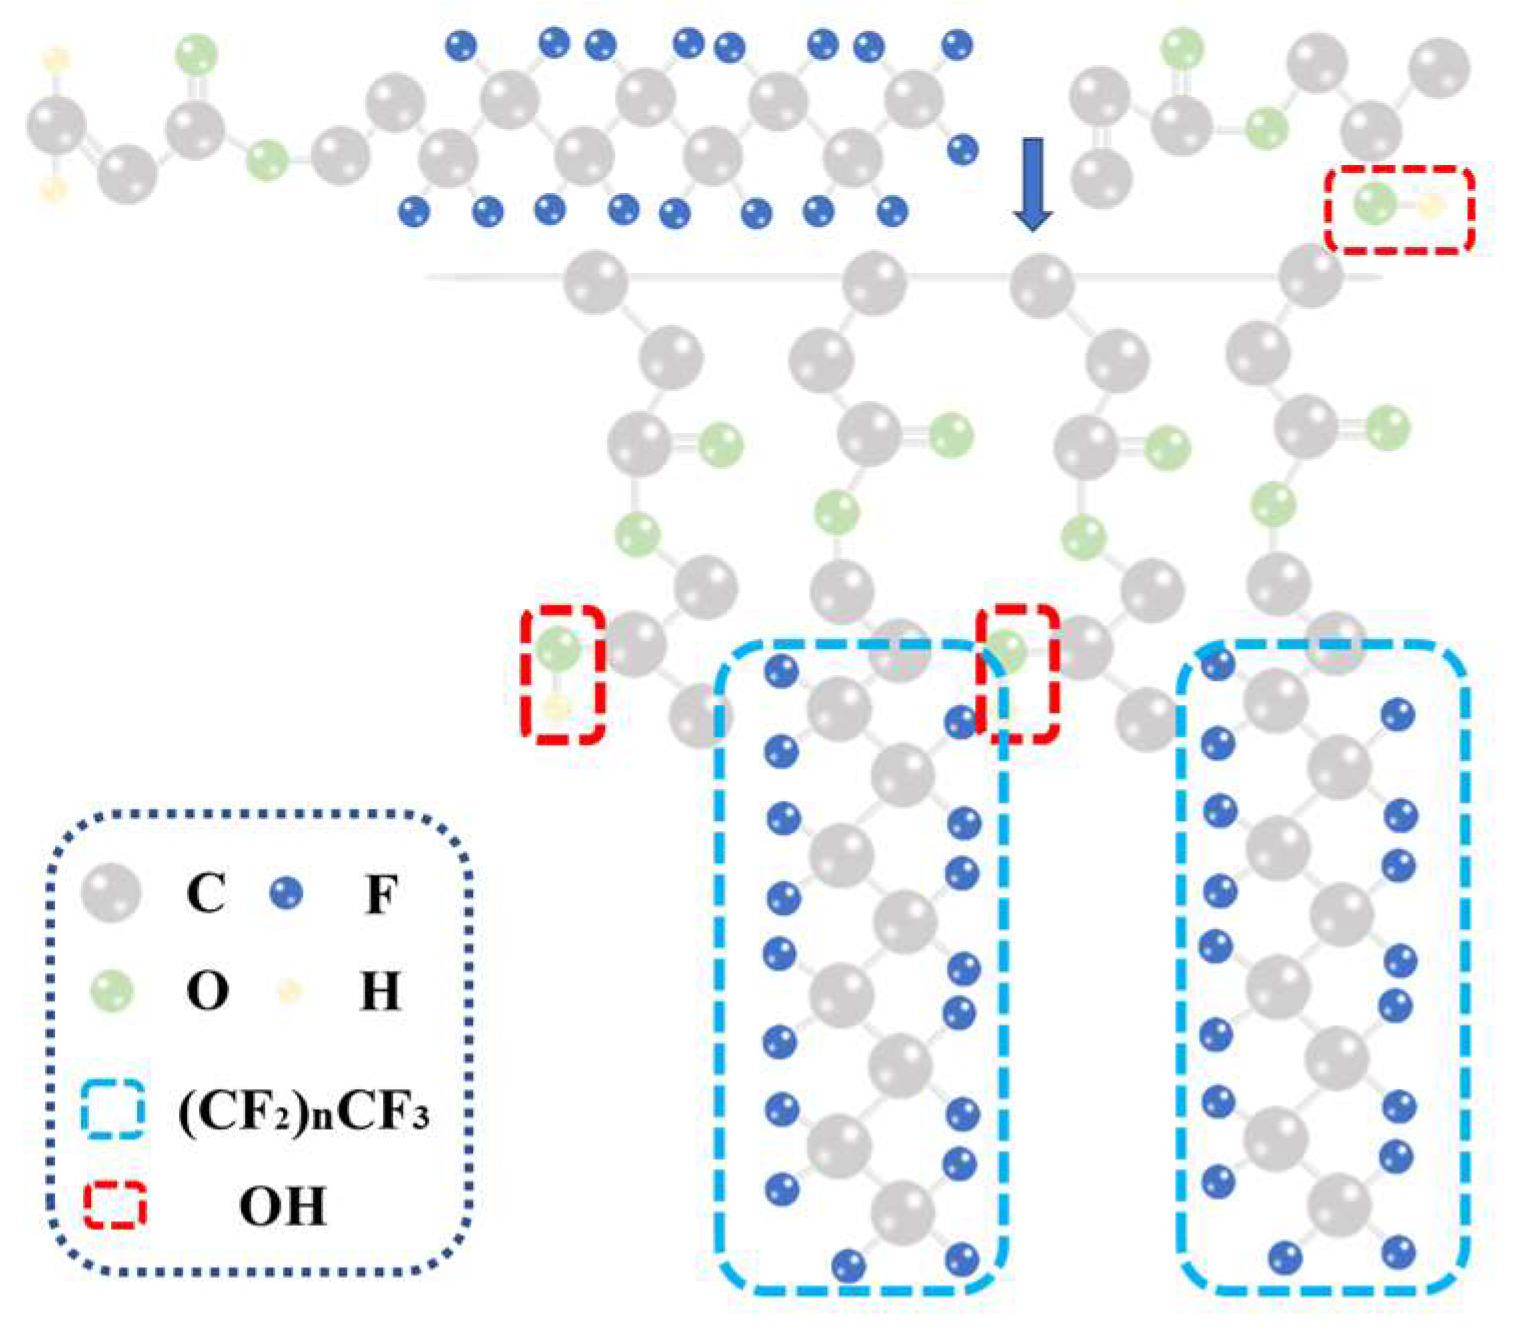
In this paper, a new method for preparing fluorocarbon acrylate polymers is provided. Free radical polymerization of hydroxypropyl acrylate with bifunctional group monomers with fluorinated acrylic monomers is a simple and economical preparation process. The hydroxypropyl acrylate contains OH bonds providing excellent high adhesion, and the long fluorocarbon chain provides excellent corrosion and abrasion resistance, good chemical resistance, good stability and hydrophobic oil transfer. The tetrafluororesin (F4) is used as a binder to bind the epoxy resin to the FC. It meets the performance requirements of new oil pipeline coatings.
2. Experimental Section
2.1. Materials
EP (CYD 014, epoxy equivalent is 0.12) and F4 were purchased from Sanmu Chemical (Nanjing, China) Co., Ltd. TEAc-N was purchased from New Material Co., Ltd. (Hangzhou, China). HPA, dibenzoyl peroxide (BPO), butyl acetate and hexafluoroisopropanol (HFIP) were obtained from Maclin Biochemical Technology Co., Ltd. (Shanghai, China). Curing agent 22A-75PX (NCO:16.5 wt.%) was supplied by Asahi Kasei Corporation (Tokyo, Japan). Test substrates (Q235 steel sheets) were purchased from Biuged Laboratory Instruments Co., Ltd. (Guangzhou, China).
2.2. Preparation of FC Copolymer
The FC polymer was prepared by a modified solution polymerization method. First, 10 g of butyl acetate was added to a three-necked round-bottom flask with a reflow condensing device, protected by nitrogen, stirred in an oil bath and heated to 100 °C. Then, 0.1 g of BPO and 1 g of HPA were added dropwise into a three-necked flask with a constant pressure liquid funnel and heated to 120 °C for the 2 h reaction. Next, 9 g of perfluoroalkyl ethyl acrylate and 1 g of HPA were added dropwise into a three-neck flask for 4 h reaction. Finally, 0.1 g of BPO was added and the temperature was raised to 125 °C for the 2 h reaction. The resulting mixture was left to stand for 24 h. The resting solution was washed with butyl acetateand centrifuged, and the solution was removed. This was repeated three times, and the solution was dried in a drying oven at 80 °C for 24 h. It was ground into a powder to produce FC polymer for backup. Figure 1 shows the synthesis reaction equation.
2.3. Preparation of Composite Coatings
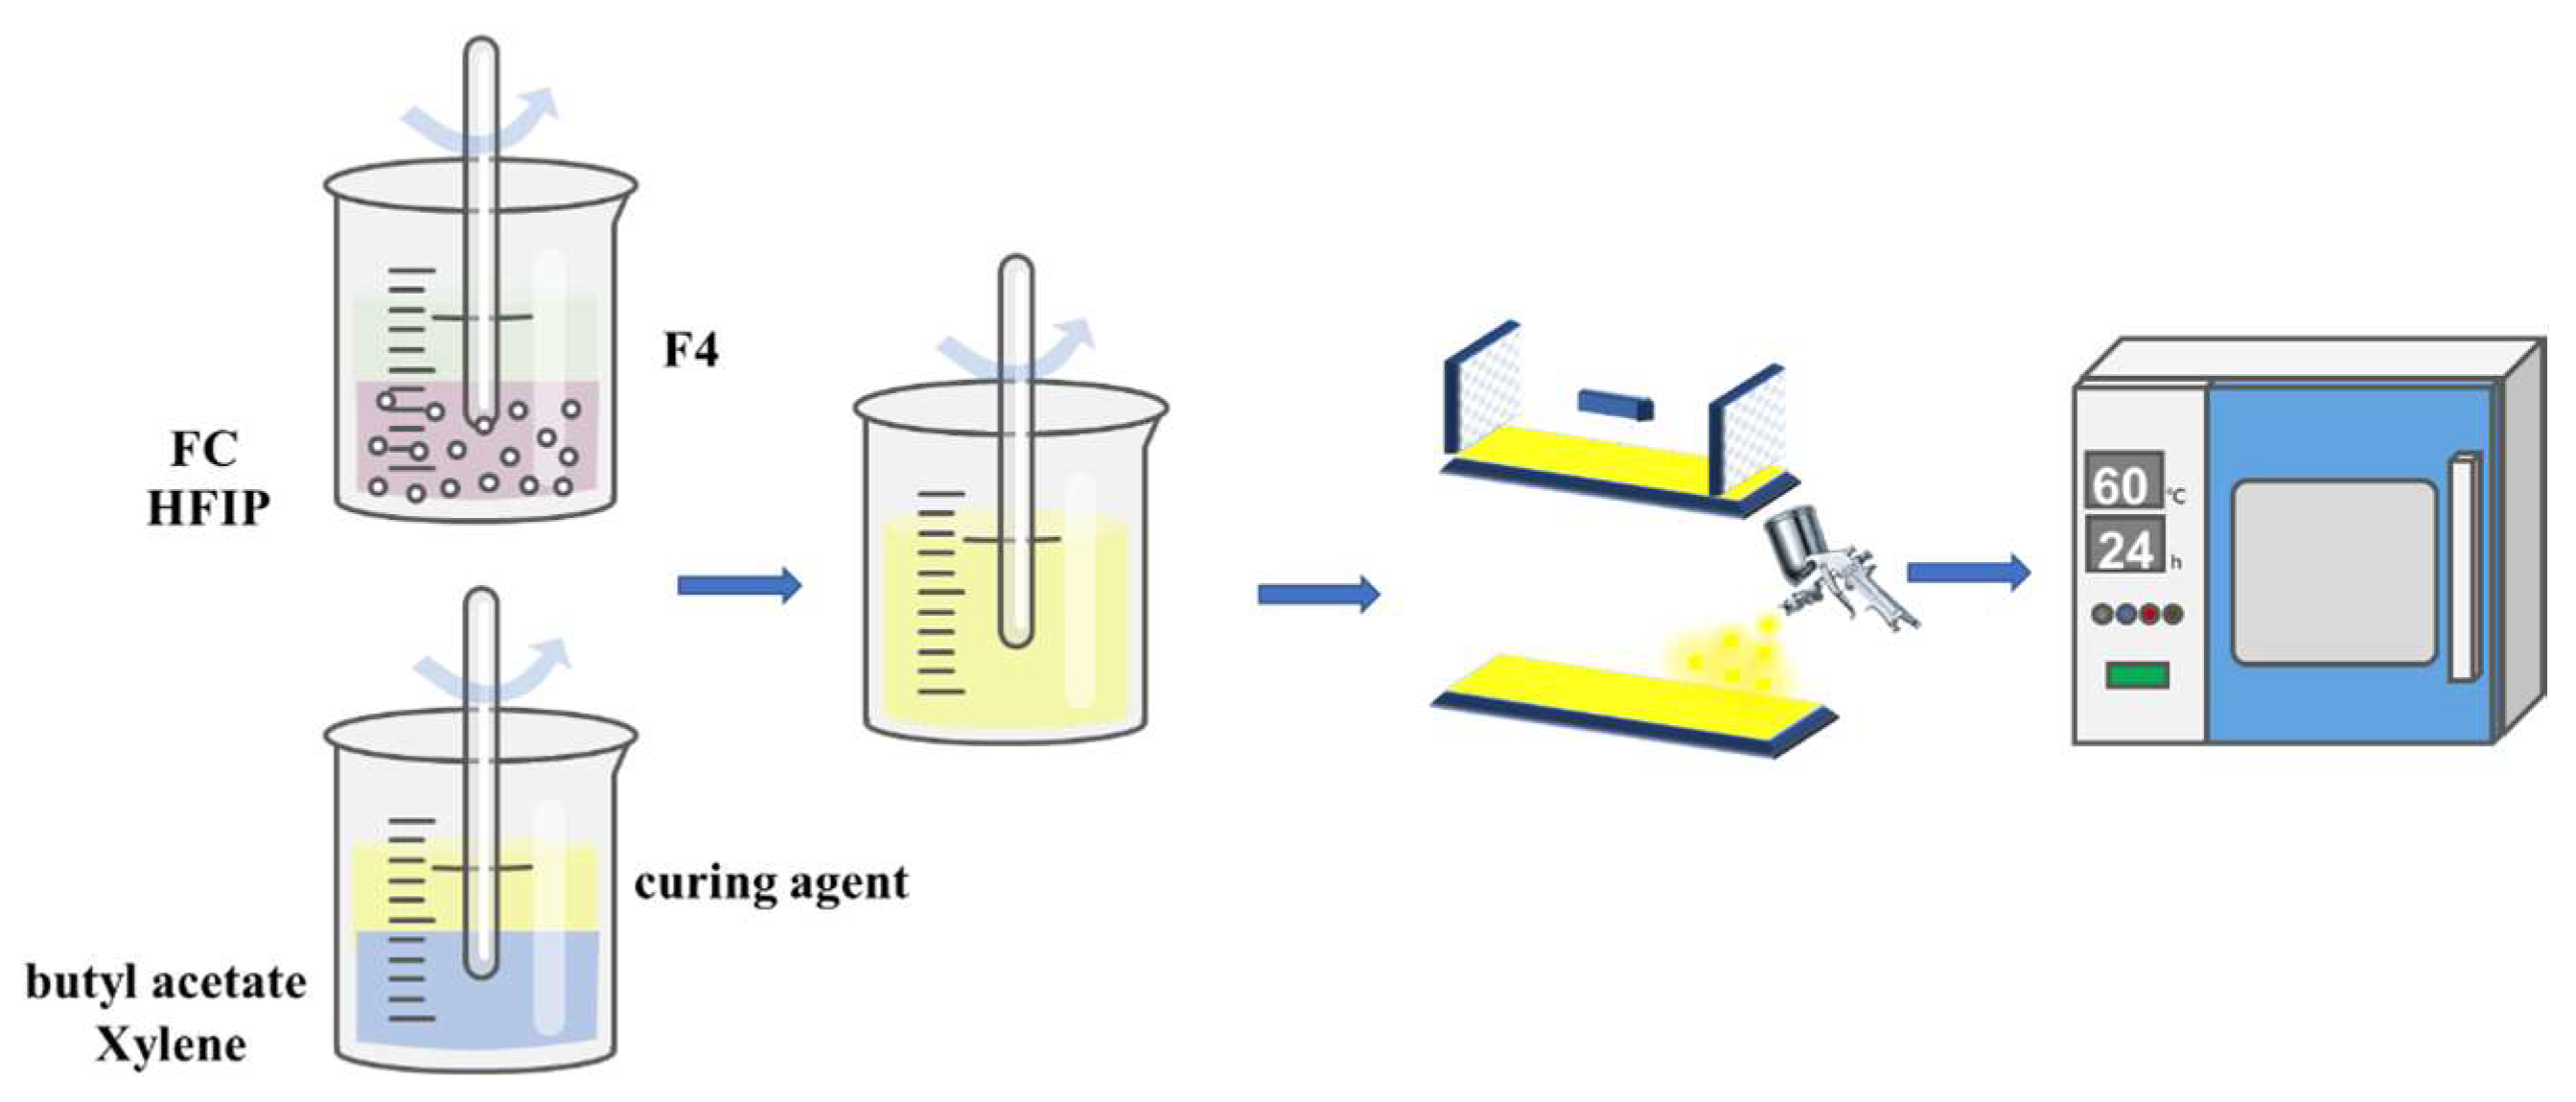
The preparation method of the composite coating is shown in Figure 2. First, EP and curing agent were dissolved in a mixed solvent consisting of butyl acetate and xylene in a 1:1 volume ratio. Subsequently, a certain amount of FC (5 wt.% of the mass fraction of the composite coating) was first dissolved in HFIP at a volume ratio of 1:1, and then a certain amount of F4 (1.67 wt.% of the mass fraction of the composite coating) was sequentially ultrasonically dispersed in the mixed solution. To ensure that the mixed slurry was well dispersed, it was stirred at room temperature for 24 h with a magnetic stirrer. Then, the obtained coatings were sprayed/scraped onto the surface of Q235 mild steel, which had been cleaned by sandblasting and ultrasonic cleaning with anhydrous ethanol. Finally, all samples were cured in an oven at 85 °C for 24 h. The thickness of the cured composite coatings was 45 ± 5 μm. They are named EP, 3-FEP, 5-FEP, 7-FEP and 10-FEP.
2.4. Characterization Testing
An FT-IR spectrometer (Nicolet IS 10) with a resolution of 2 cm−1 was used for 16 scans to obtain the spectra. One part of the sample and 100 parts of KBr were ground in a mortar and pressed to ensure a uniform force under pressure and a translucent shape. An X-ray photoelectron spectrometer (Thermo Scientifi K-Alpha, MA, USA) was used to analyze the chemical information of the FC for the surface of the object. A monochromatic AlKa source with an energy of 1486.6 eV was used and the spectrum was calibrated with carbon to avoid the effect of charge potential shift on the results. The final data were fitted using Avantage 5.976. The molecular weights of the composites were analyzed by X-gel chromatography (Agilent PL-GPC50, Santa Clara, CA, USA) using HFIP as an eluent. The thermal stability of the synthetics was analyzed using a thermogravimetric analyzer (TGA-50 Shimadzu, Tokyo, Japan) with a temperature range from 0 to 600 °C. The crystallinity of the synthesis was analyzed using a thermal analyzer (DSC Q10, TA, Delaware, MD, USA). An X-ray polycrystalline powder diffractometer (D/MAX-2500/PC, Rigaku, Tokyo, Japan) was used for the qualitative analysis of polycrystalline substances. The surface morphology of the composite films was observed using a scanning electron microscope (SU 8010, Tokyo, Japan) in the mode of low vacuum (70 Pa) and accelerating voltage (15 kV). Due to the non-conductive nature of the organic coating, SEM imaging is not clear. Before the test, the sample should be placed in a vacuum and sprayed with gold for 60 s to increase the conductivity of the coating. The dry film thickness of coatings was tested with a film thickness meter. During the test, the test probe is calibrated and zeroed, and five different positions are tested on each sample plate and the average value is obtained to ensure that the thickness of each test point of the coating meets the requirements; then the coating-related test performance can be tested.
2.5. Surface Wettability Testing
A LAUDA Scientific GmbH contact angle tester was used to test the static oil and water contact angle of epoxy resin films with different concentrations of FC by dropping 10 μL of the test liquid on the part with thicker and more uniform coating. Three different, randomly selected surface areas were selected. The average of the obtained results was determined.
2.6. Friction Reduction Performance Test
The tribological properties of the coatings were tested by the spherical method using a CFT-I friction and wear tester. Tribological tests were performed on all coatings according to the following conditions: load of 20 N, amplitude of 5 mm, sliding distance of 12.5 m and sliding speed of 2.5 m/min. AISI 52100 steel balls with a diameter of 6 mm were used as bi-material. In order to obtain relatively accurate data, the friction coefficient and wear amount of each coating were measured three times.
2.7. Corrosion Resistance Test
In a BGD-882 programmable salt spray corrosion tester, the fog corrosion solution was sodium chloride solution containing 5 wt.% NaCl, the temperature was adjusted to 35 °C, the working mode was set to work 10 s and pause 20 s, and the test standard was GB/T 1771-2007. The sample plate was scratched before the test, so that the scratch penetrated the coating, and the corrosion condition near the scratch was used to judge the salt spray corrosion resistance of the coating.
A Reference 600 + electrochemical workstation was used for polarization testing and AC impedance testing (EIS), and the EIS technique was used to study the corrosion process of a coating to analyze the corrosion mechanism. The coating sample was made into a 1 cm2 working electrode with all parts of the working electrode except the side containing the coating sealed with crystal glue and leaded from the back; a saturated Calomel Electrode (SCE) and a platinum disc were used as reference and counter electrode, respectively, and the test solution was 3.5 wt.% NaCl (Sigma Aldrich, Shanghai, China). The electrochemical impedance spectroscopy (EIS) study was conducted with an open circuit condition (OCP) potential time setting of 60 min and a frequency range of 100 kHz to 10 mHz for the EIS study. The test period was one month. In order to obtain stable corrosion data, the samples had to be immersed in a 3.5 wt.% NaCl solution at 25 °C for 24 h.
3. Results and Discussion
3.1. Characterization of FC
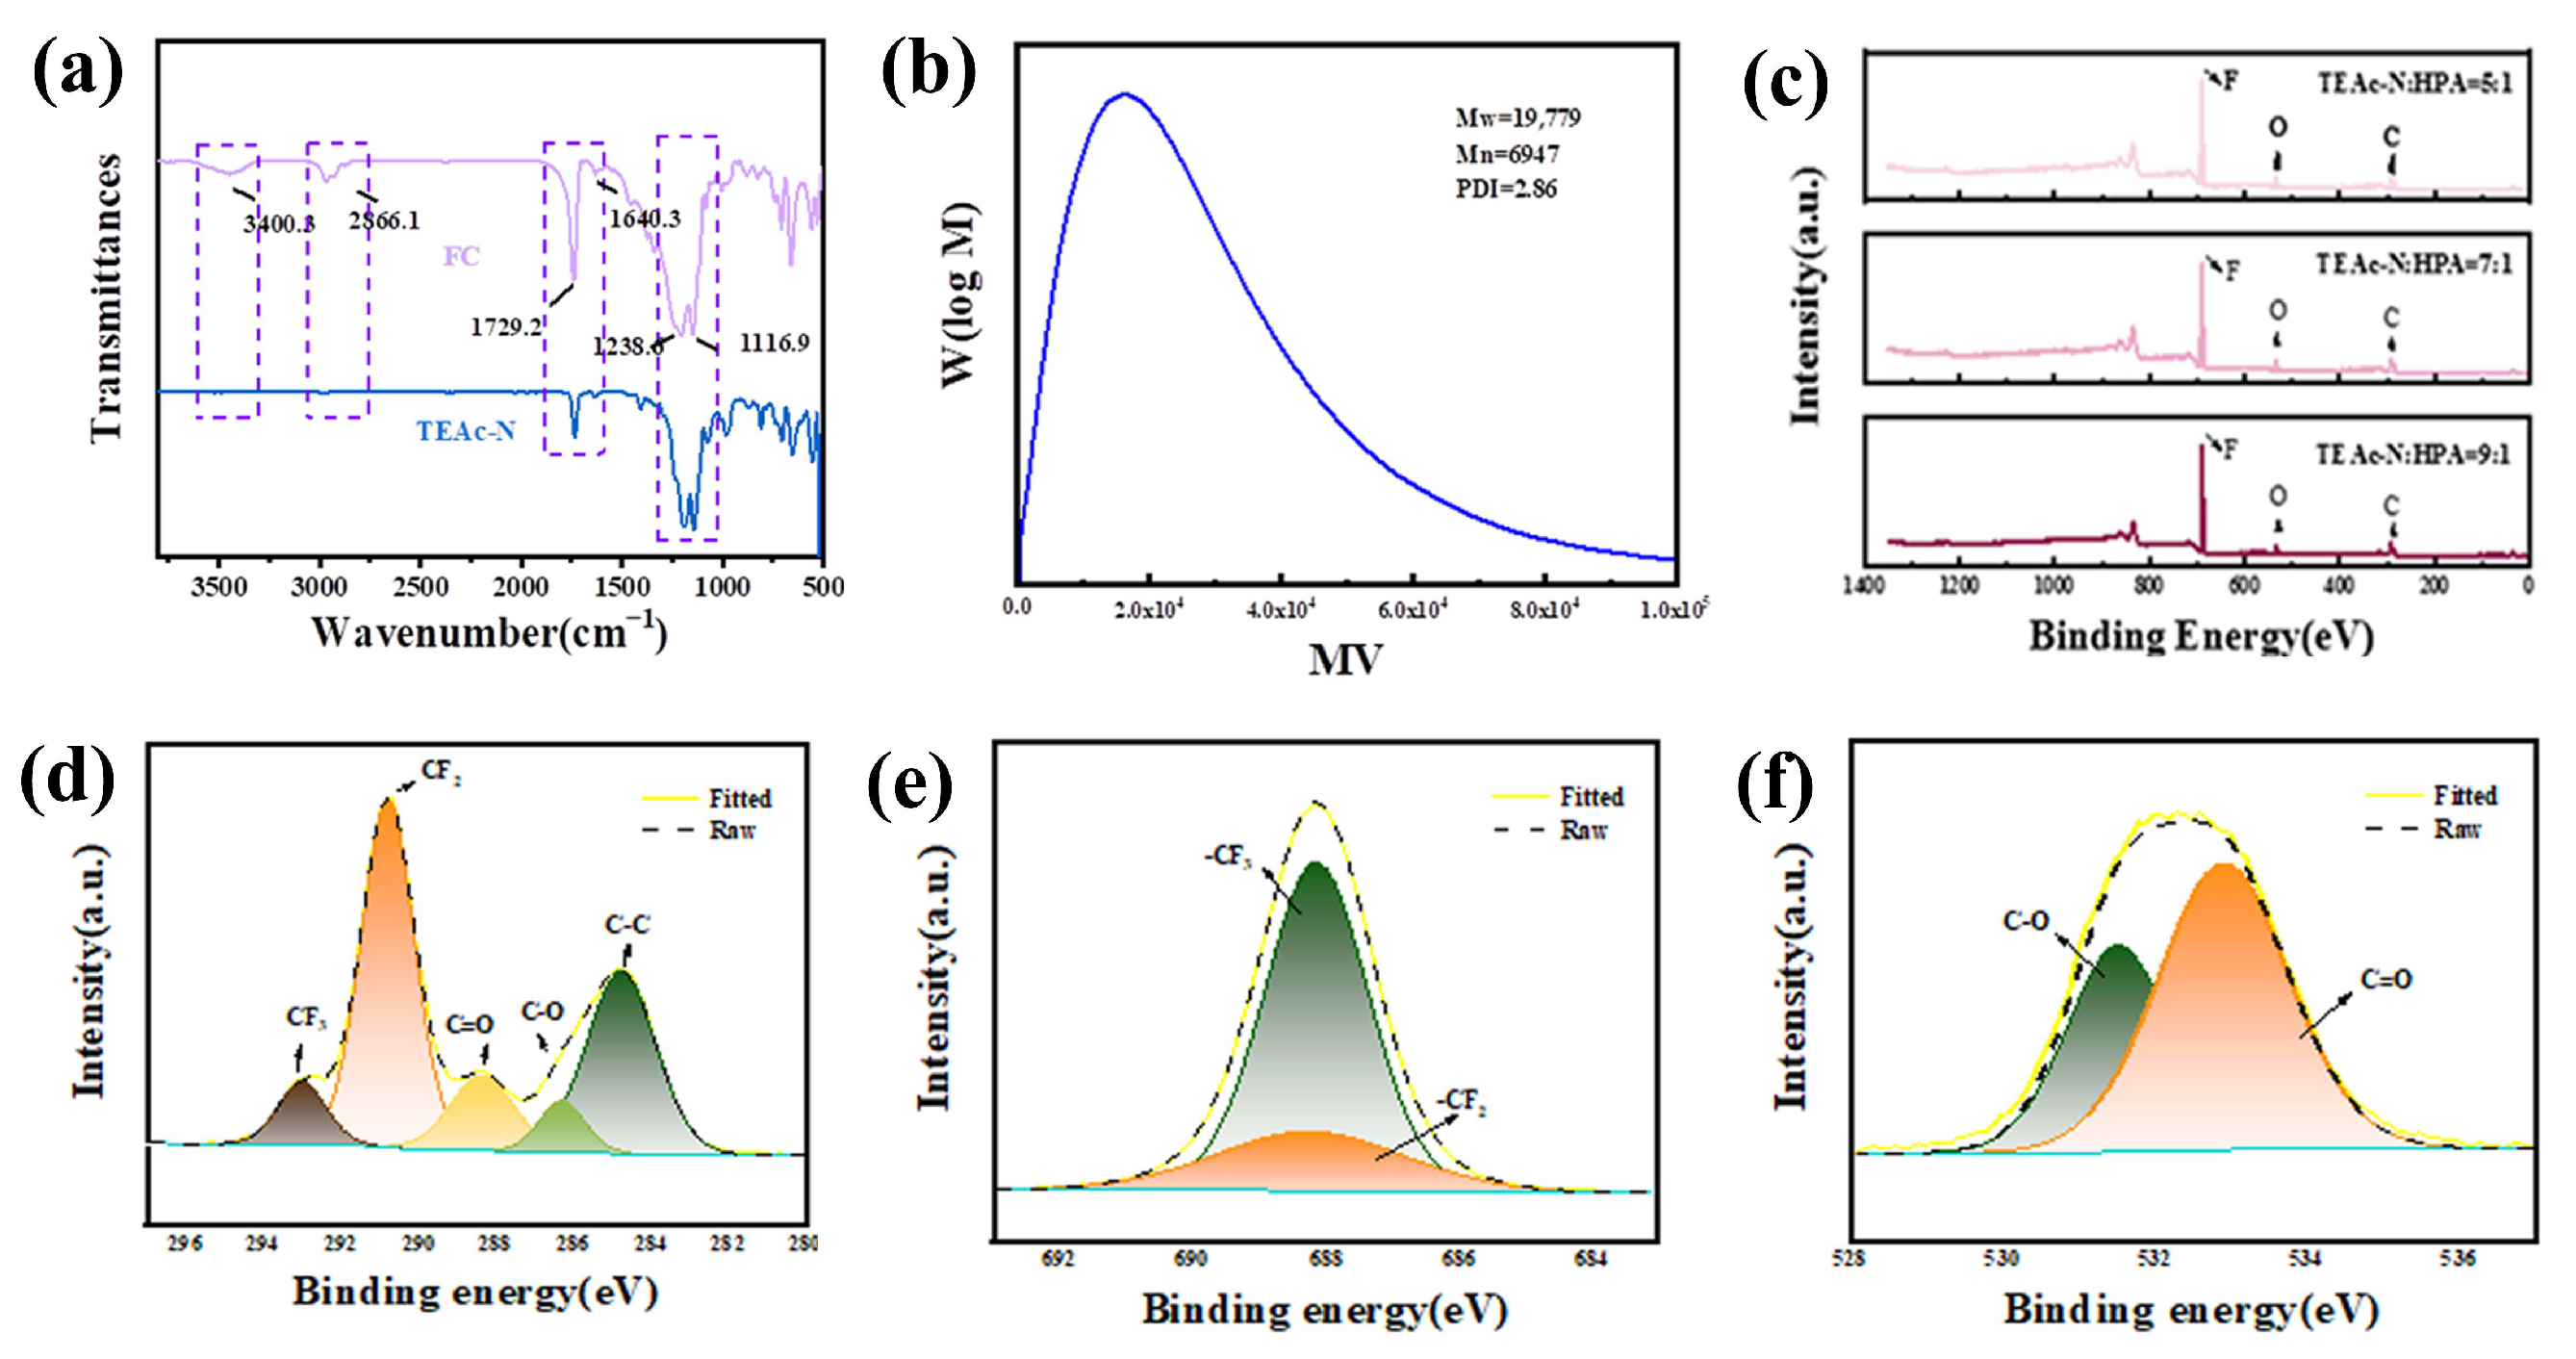
FTIR spectra can be used to elucidate the changes in the chemical groups of FC. As shown in Figure 3a, both TEAc-N and FC exhibit relatively broad absorption peaks at 1116.9 and 1238.3 cm−1, corresponding to the stretching vibration absorption of -CF3 and -CF2 [17]., There is a shared strong ester group characteristic peak at 1729.2 cm−1. Compared with the original TEAc-N, FC at 1640.3 cm−1, the absorption intensity of the C=C double bond relative to the ester group is significantly weaker, and a series of polymerization reactions are carried out, but a small number of incompletely reacted double bonds are still present. The wide absorption band at 3400 cm−1 for FC compared with the original TEAc-N is due to the molecular water caused by the OH stretching vibration of the adsorbed molecule [18]. It is believed that the peak at 3400 cm−1 corresponds to the adsorbed water, indicating that part of the membrane is slightly dissolved in sea water [19].
The molecular weight and molecular weight distribution can be obtained from the GPC system, and the molar mass calibration of FC is shown in Figure 3b. Using HFIP as the eluent, the heavy average molecular weight Mw of 19,779 and the number average molecular weight (Mn) of 6947 were obtained, and the dispersion index (PMI = Mw/Mn) was 2.86, indicating the appropriate range of molecular weight distribution. Only one peak appears on the GPC curve. It can be concluded that a copolymer was obtained, which can provide utility in the low-molecular-weight part of the copolymer and support some degree of processability in the high-molecular-weight part [20]. The resulting molecular weight distribution of the polymer with the appropriate width balances the utility and processability properties.
Figure 3c shows the total spectrum of FC. The percentages of fluorine in the TEAc-N and HPA mass ratios of 5:1, 7:1 and 9:1 are 51.71%, 53.81% and 55.13%, respectively. Figure 3b shows the fine spectra of FC polymer C1s appearing at 290 and 292.94 eV corresponding to the -CF2 and -CF3 peaks. This indicates that the hydroxyl and carbon chains were successfully grafted onto the TEAc-N.
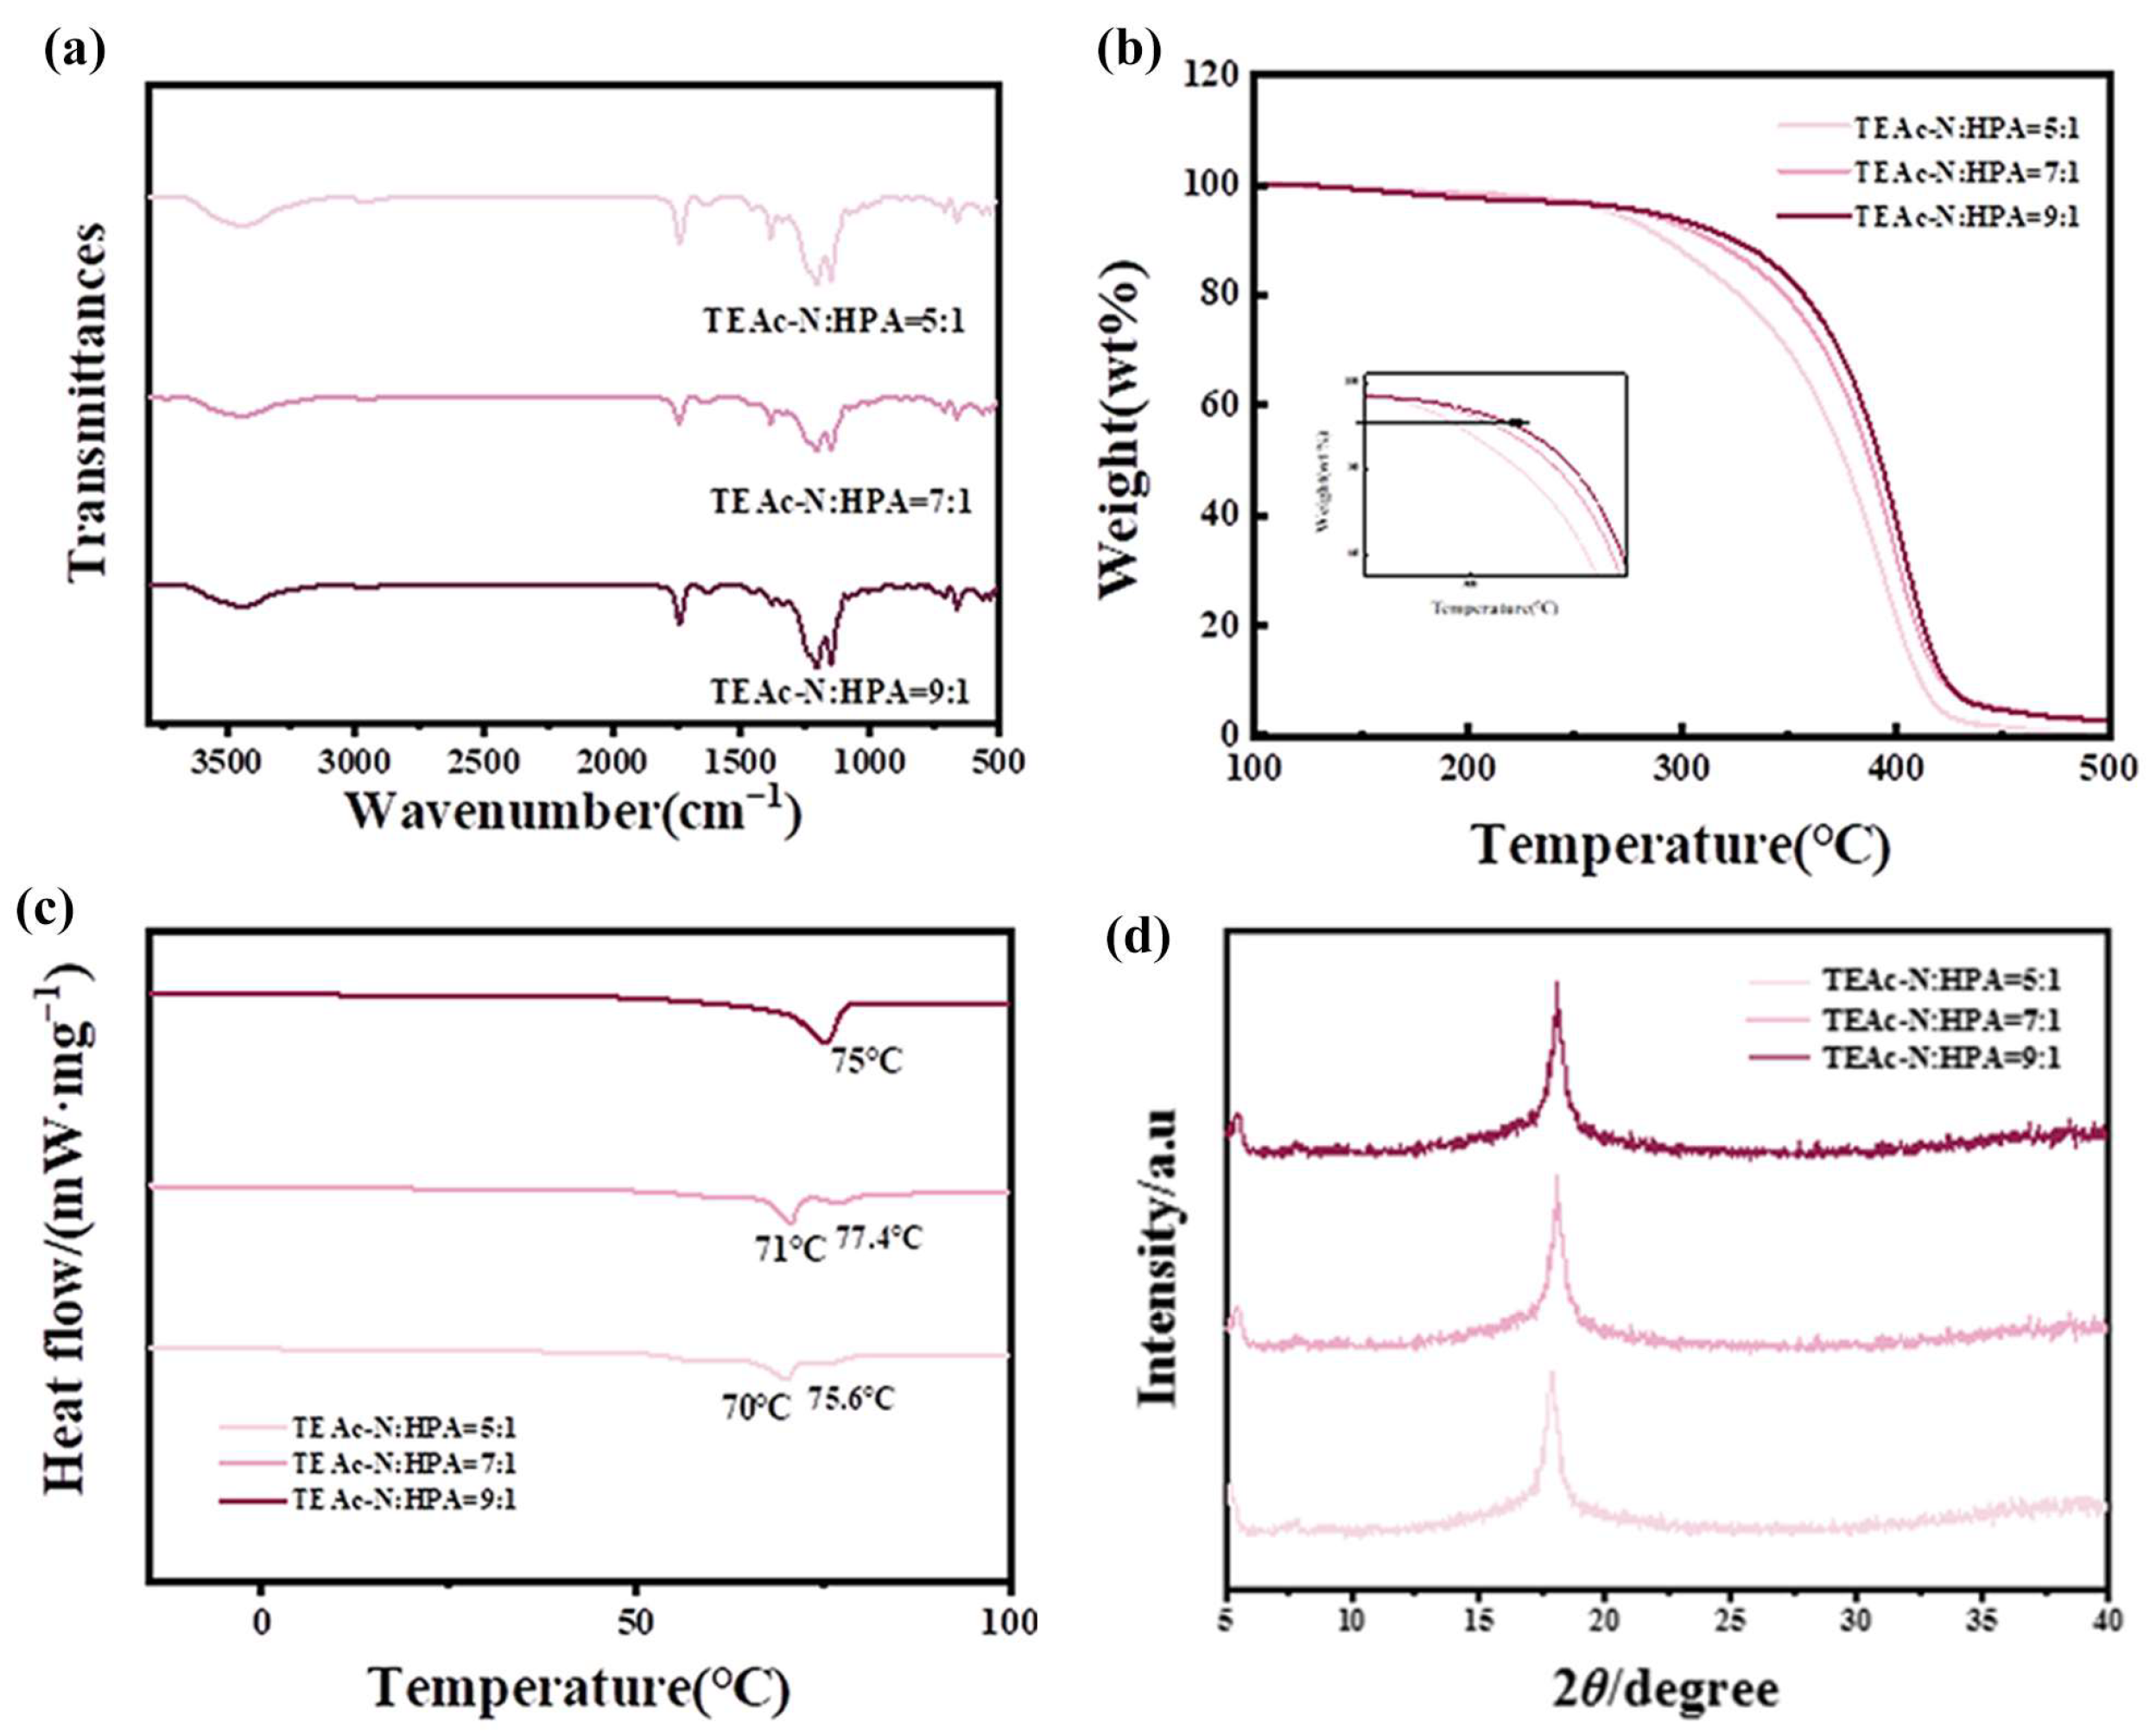
Figure 4a shows the IR spectra of FC polymers synthesized with TEAc-N and HPA mass ratios of 5:1, 7:1 and 9:1. The absorption peak corresponding to the CF bond at 9:1 is more robust and broader. The chemical bonding changes of the FC polymers were further analyzed by XPS spectroscopy.
Figure 4b shows the thermogram of the three FCs, where the weight loss of FC at 100–200 °C is due to the unremoved water [21,22]. The main weight loss that occurs between 300 and 450 °C is due to the breakdown of the polymer carbon chains [23,24]. The thermal decomposition temperature and thermal stability of FC also increase with increasing amounts of TEAc-N. The initial decomposition temperature reaches a maximum of approximately 322.52 °C when the ratio of TEAc-N to HPA content is increased to 9:1. This is probably due to the fact that the large number of C-F bonds on TEAc-N shield the carbon chains and therefore increase the stability of the polymer [25,26]. The crystallization temperatures on the DSC curves of thermodynamically incompatible polymers are separate for each majority compound.
Two crystallization peaks (70 °C, 75.6 °C), (71 °C, 77.4 °C) can be seen on the curves for FC (5:1) and FC (7:1), respectively, from Figure 4c, while only one crystallization peak (75 °C) is seen on the curve for FC (9:1), where the agreement between the acrylic and fluorinated phases increases and Tg decreases to 75 °C.
As can be seen from Figure 4d, a strong peak appears at 21.5° (2θ), which is the hexagonal accumulation peak of the hydrocarbon lateral face, and an obvious crystal peak of ordered sheet structure of the Rf group of perfluoroalkyl side chain appears at 5.39° (2θ). The results indicated that the side chain structure of copolymer changed little with the increase in TEAc-N content.
3.2. Wettability of Composite Coating
A quantity of 1 g each of FC (5:1), FC (7:1) and FC (9:1) were dissolved in 1 g of HFIP, sonicated for 30 min, then mechanically stirred with 10 g of mixed solvent of xylene and butyl acetate (5:5) and 10 g of F4 for 30 min. Finally, 10 g of curing agent was added for 30 min and dried under vacuum at 60 °C for 6 h to form a film while a blank control group was prepared. These four groups were subjected to oil (dodecane) and water (homemade) contact angle tests to optimize the best FC, and the test results are as follows.
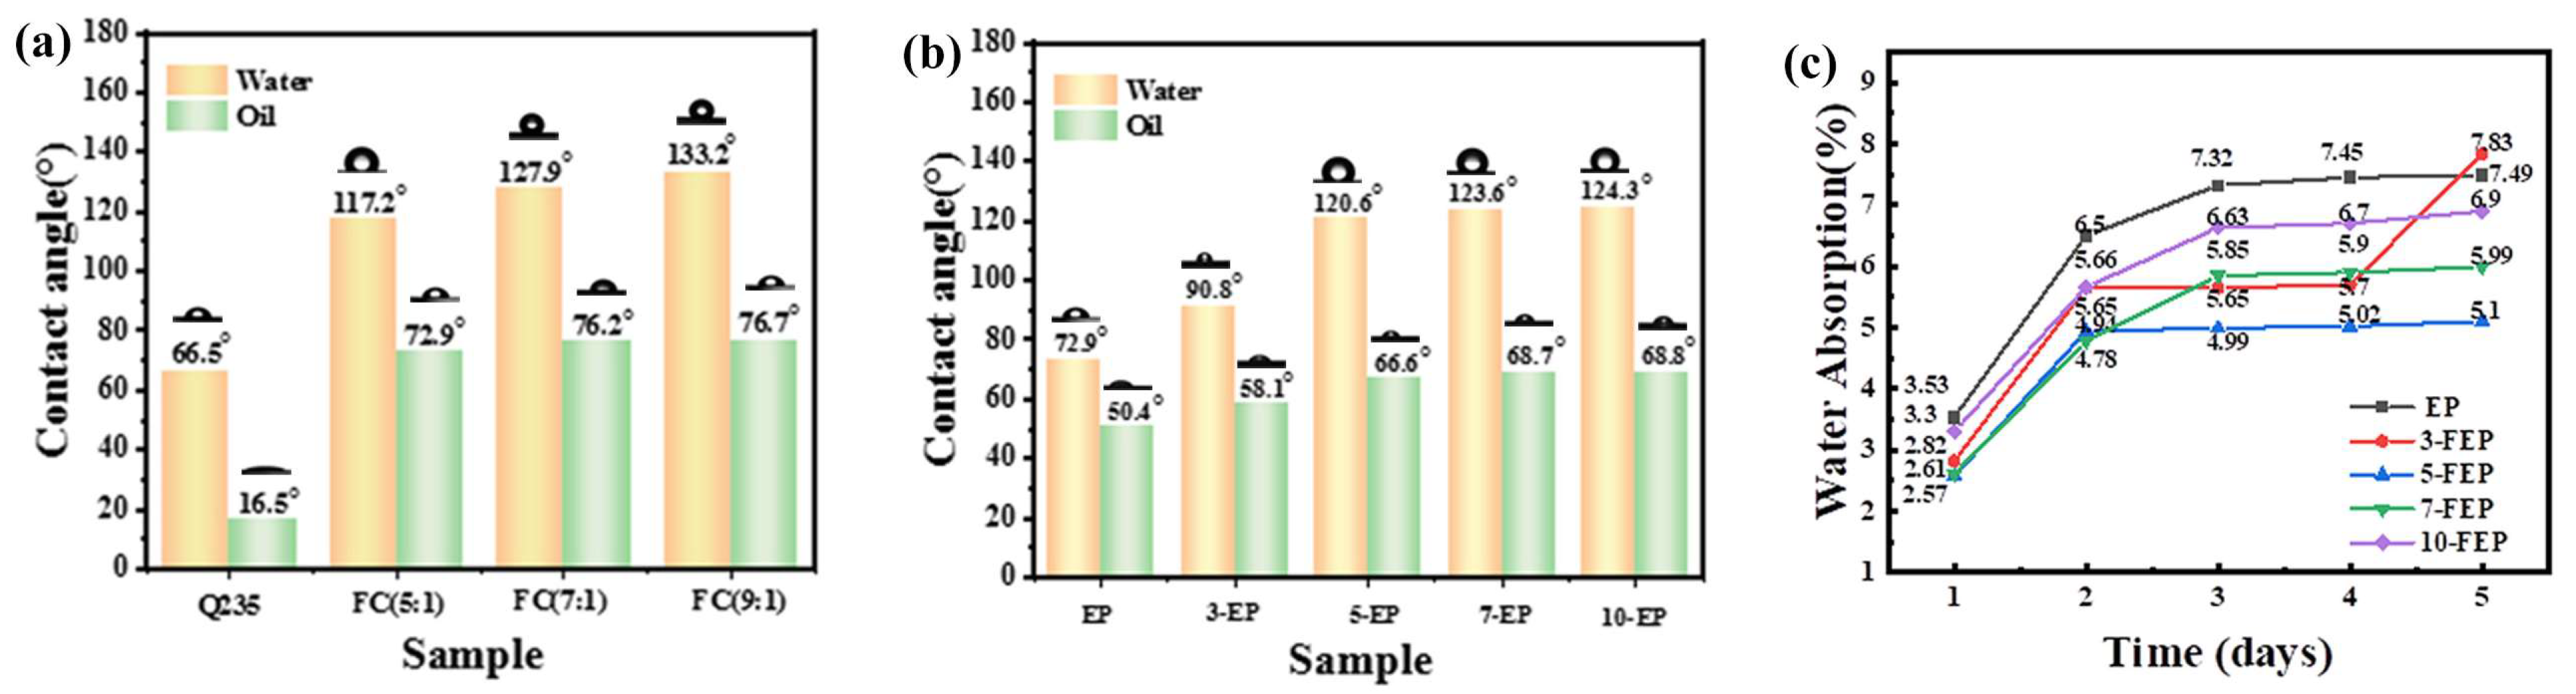
Lower surface energy means larger contact angles and lower ability of hydrophobic materials to interact spontaneously [27]. From Figure 5a, water contact angle (WCA) contacts show that coatings without FC additives are hydrophilic, with WCA values below 90°. Clearly, this contrasts with the hydrophobicity exhibited by coatings containing FC additives, with the highest WCA measured in FC (9:1) coatings being 133.2°. Again, it can be seen that the regularity of the oil contact angle (OCA) is consistent with the WCA. In the absence of the FC additive, Q235 shows an extremely low OCA of 16.5°, while the highest OCA of 76.7° was measured for the FC (9:1) coating. This may be due to the surface enrichment of the fluorocarbon chains produced by the excess FC during the reaction. The WCA of the coatings continued to increase with increasing TEAc-N content compared with the WCA of 117.2° and 127.9° and OCA of 72.9° and 76.2° for the FC (5:1) and FC (7:1) coatings, respectively, with the further increase in content. Collectively, we chose FC (9:1) as the polymer to explore the optimal content.
These five groups were tested for oil (dodecane) and water (homemade) contact angles and the results are shown in Figure 5b. It shows that the pure EP coatings were hydrophilic, with a WCA value of 72.9°. The coating with FC addition was hydrophobic and the WCA of the coating increased with increasing FC content. 3-FEP WCA increased to 90.8° and 5-FEP WCA increased to 120.6° with a rapid increase. 7-FEP FC increased more slowly to 123.6°, and the rate of increase became slower. Similarly, the regularity of the OCA is consistent with the WCA. The OCA of pure EP is 50.4° and the OCA of the coating similarly increases with the FC content. 5-FEP increases to 66.6°, while 7-FEP increases more slowly to 68.7°. The barrier properties of the coatings can be evaluated by water absorption tests. Figure 5c shows the variation of water absorption with immersion time in deionized water for the pure epoxy coating and the composite coating. The water absorption curves of these coatings have similar trends. At the beginning of the immersion period (0–48 h), the water absorption of the coatings increased significantly. Then, the water absorption of the coatings increased at a lower rate and eventually stabilized, indicating that the coatings reached saturation of water absorption. Compared with the pure epoxy coating, the water absorption rate of the coatings all decreased after the addition of fillers. Especially for 5-FEP, the water absorption of the coating decreased significantly. On the one hand, this may be due to the fact that FC has better dispersion in the epoxy resin and thus can prevent the penetration of water molecules more effectively. On the other hand, it may be because the long fluorocarbon chain polymer can form crystals due to the relatively long fluorocarbon chain, and the fluorine-containing groups can be stably arranged on the polymer surface, which is not easily disturbed, and even if disturbed, it can play a shielding role, thus having a better effect of water and oil repellency.
3.3. Dispersibility of Composite Coatings
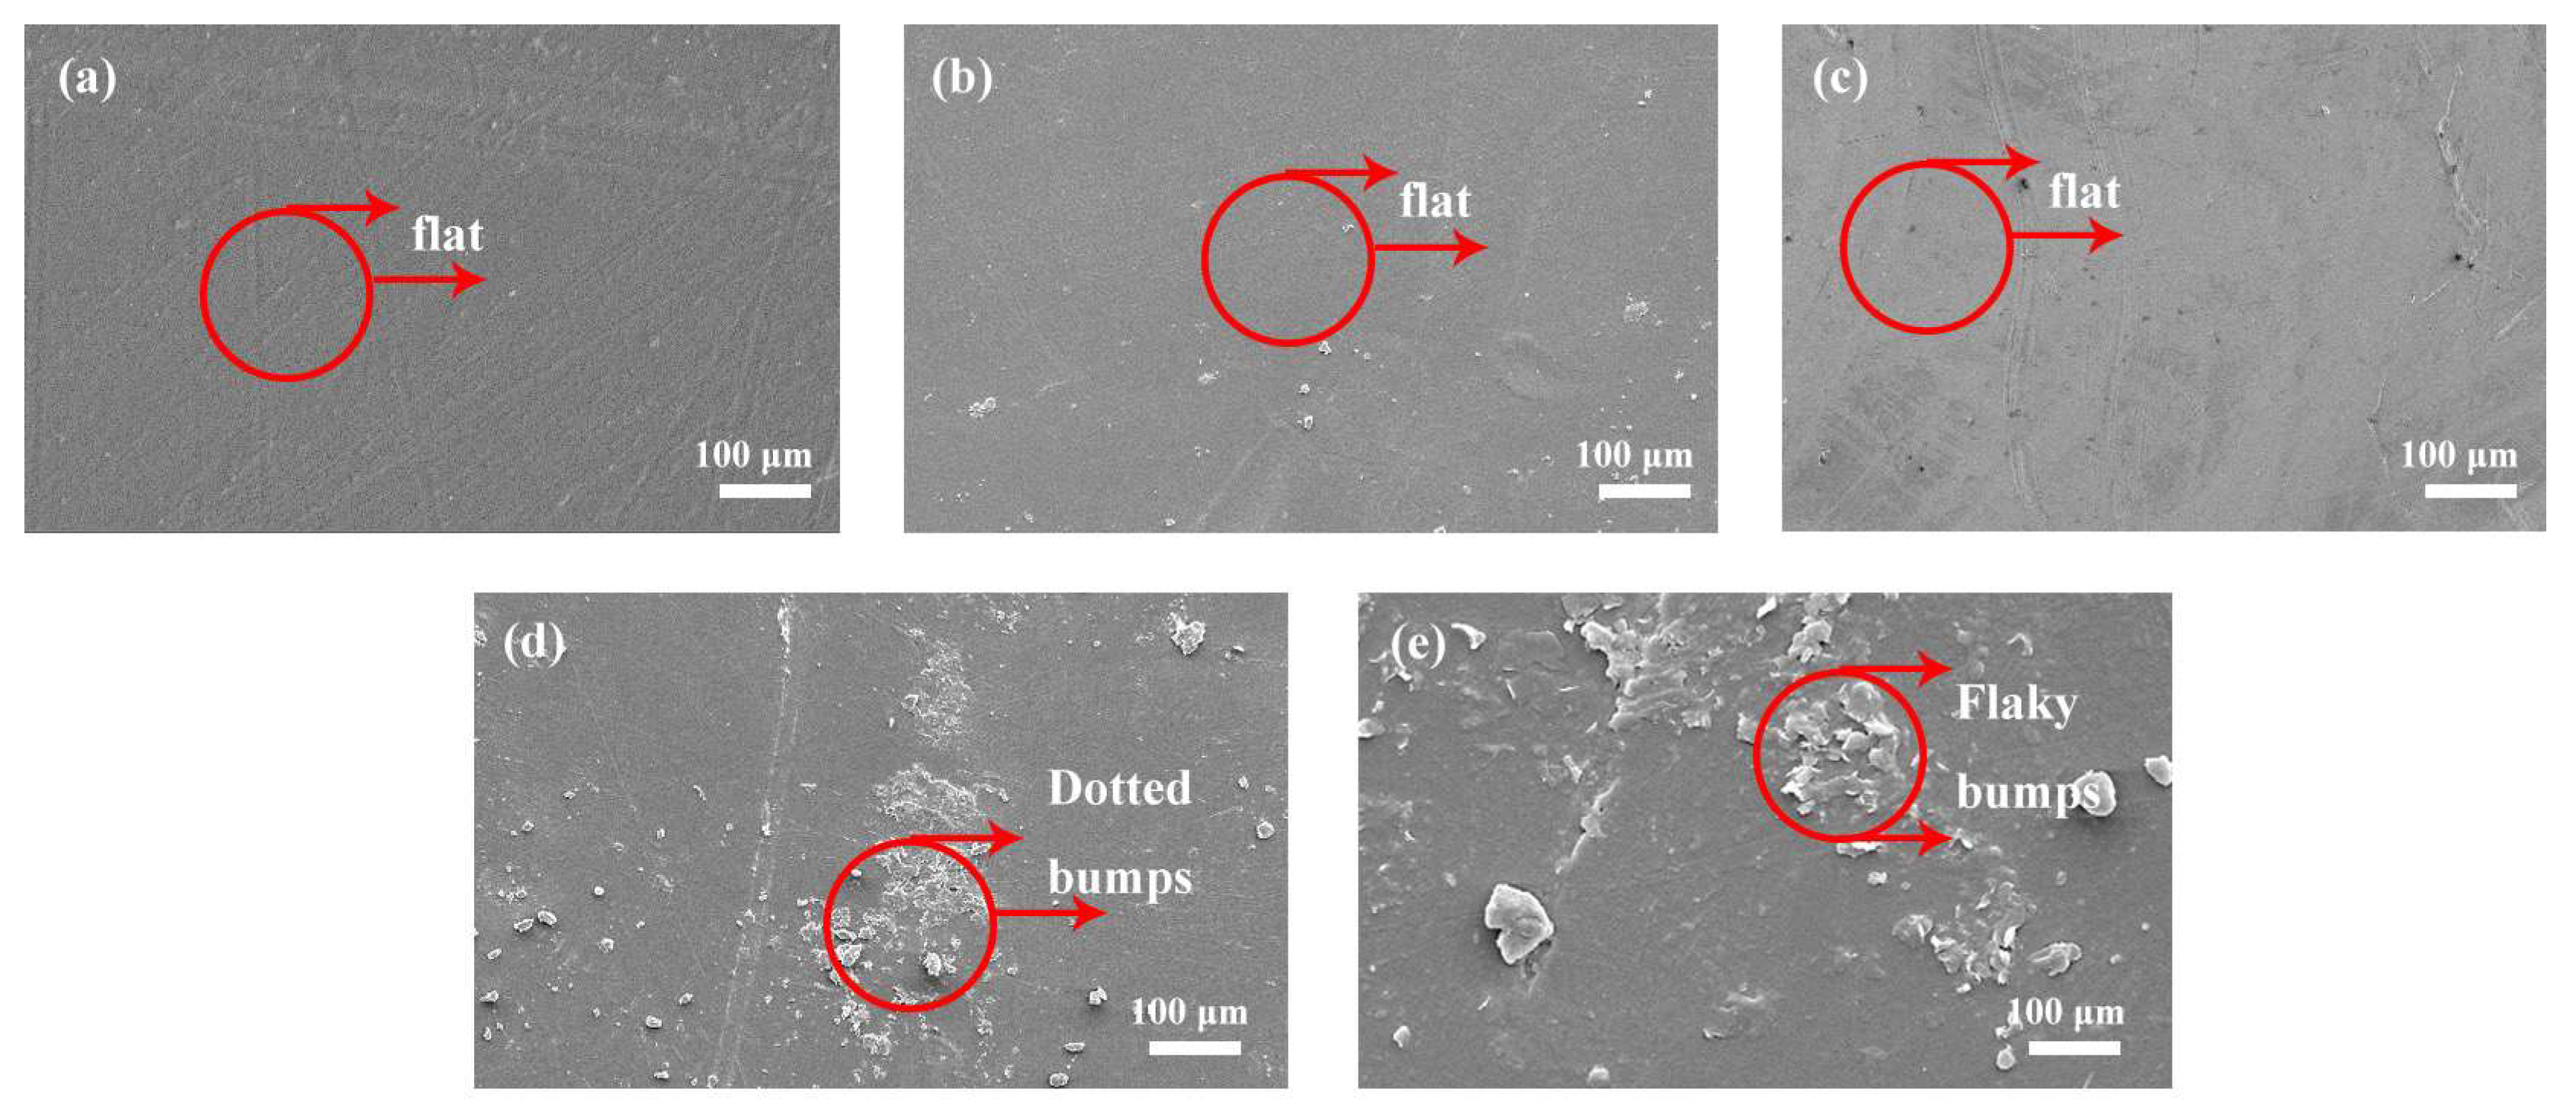
In Figure 6a, the pure EP image is flat and smooth. With the increase in FC content, a dotted bump and blocky bump phenomenon (Figure 6d,e), which may be due to the convergent appearance of the fluoropolymer, becomes increasingly obvious as the content increases to a certain level. Among them, 5-FEP showed a good smoothing effect.
3.4. Tribological Properties of Composite Coatings
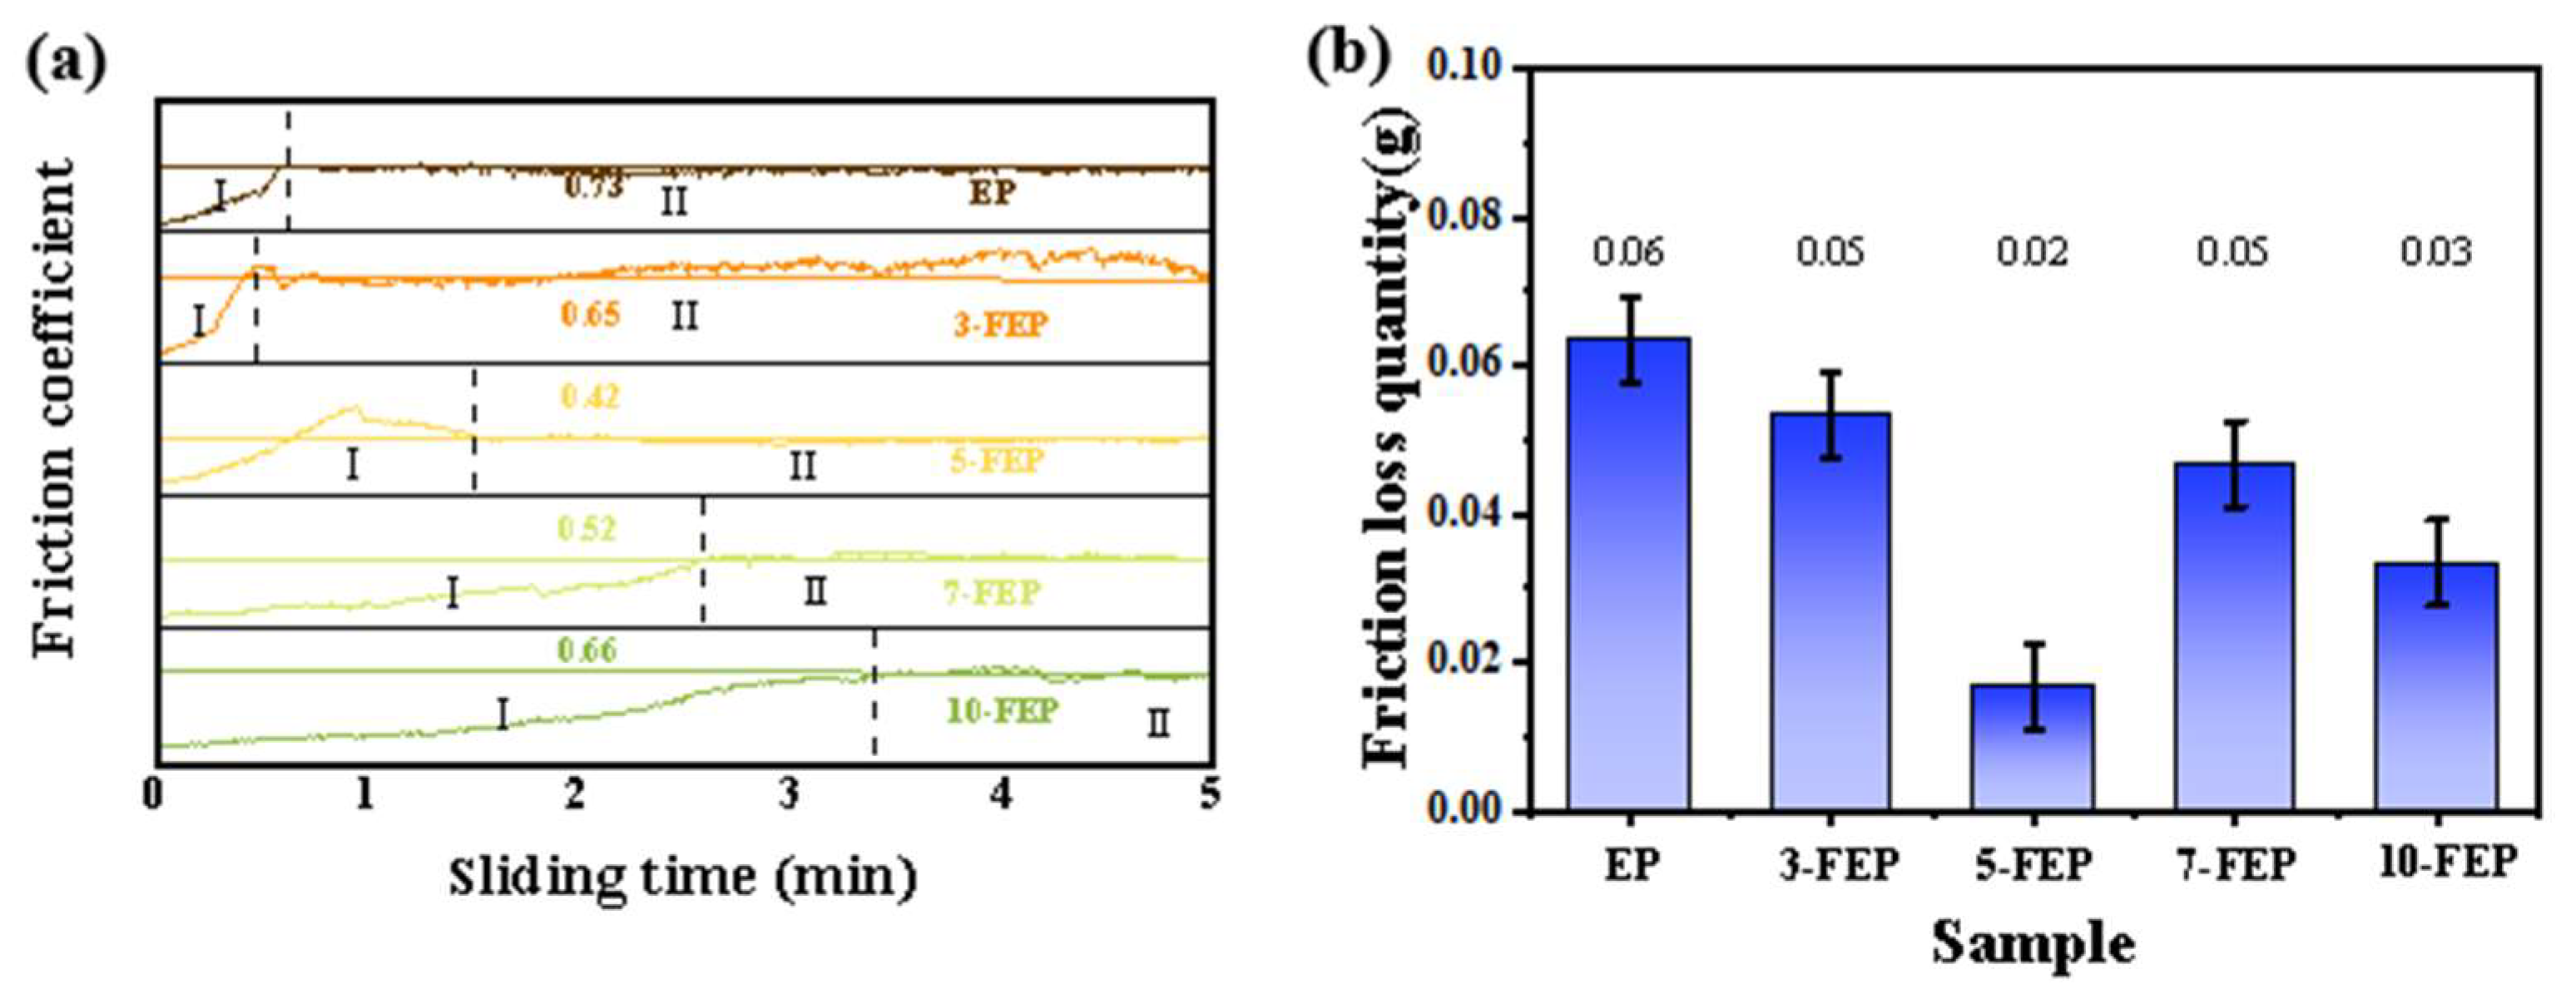
The friction coefficients and wear rates of the coatings are shown in Figure 7a. The graphs show the dynamic curves of the friction coefficients of the five coatings, with a brief saturation of the coating in “I” and a sharp increase in the friction coefficient [28]. This is followed by a slow increase and large fluctuations during “Ⅱ”, and finally tends to a relatively stable phase. The reason for this may be that when a load is applied, the rougher surface of the coating is subjected to a large contact stress when it is not being rubbed, and as the friction proceeds, the surface roughness is gradually smoothed and stabilizes. The friction coefficient of the pure EP coating was the largest (average friction coefficient of 0.73), and the addition of FC polymer further reduced the friction coefficient to 0.65 and 0.42 for 3-FEP and 5-FEP, respectively.
As can be seen from Figure 7b, with the filling of FC, the average friction decreases first and then increases. At 5-FEP, the average friction is the lowest, only 0.02 g. The reason may be that the fluorine atom contains a C-C backbone and forms a complete cylinder, which makes the intermolecular force smaller and the intermolecular sliding resistance smaller, and the addition of long fluorocarbon chains reduces the surface energy. Too much FC polymer forms agglomerates on the surface, which is not conducive to reducing the frictional properties.
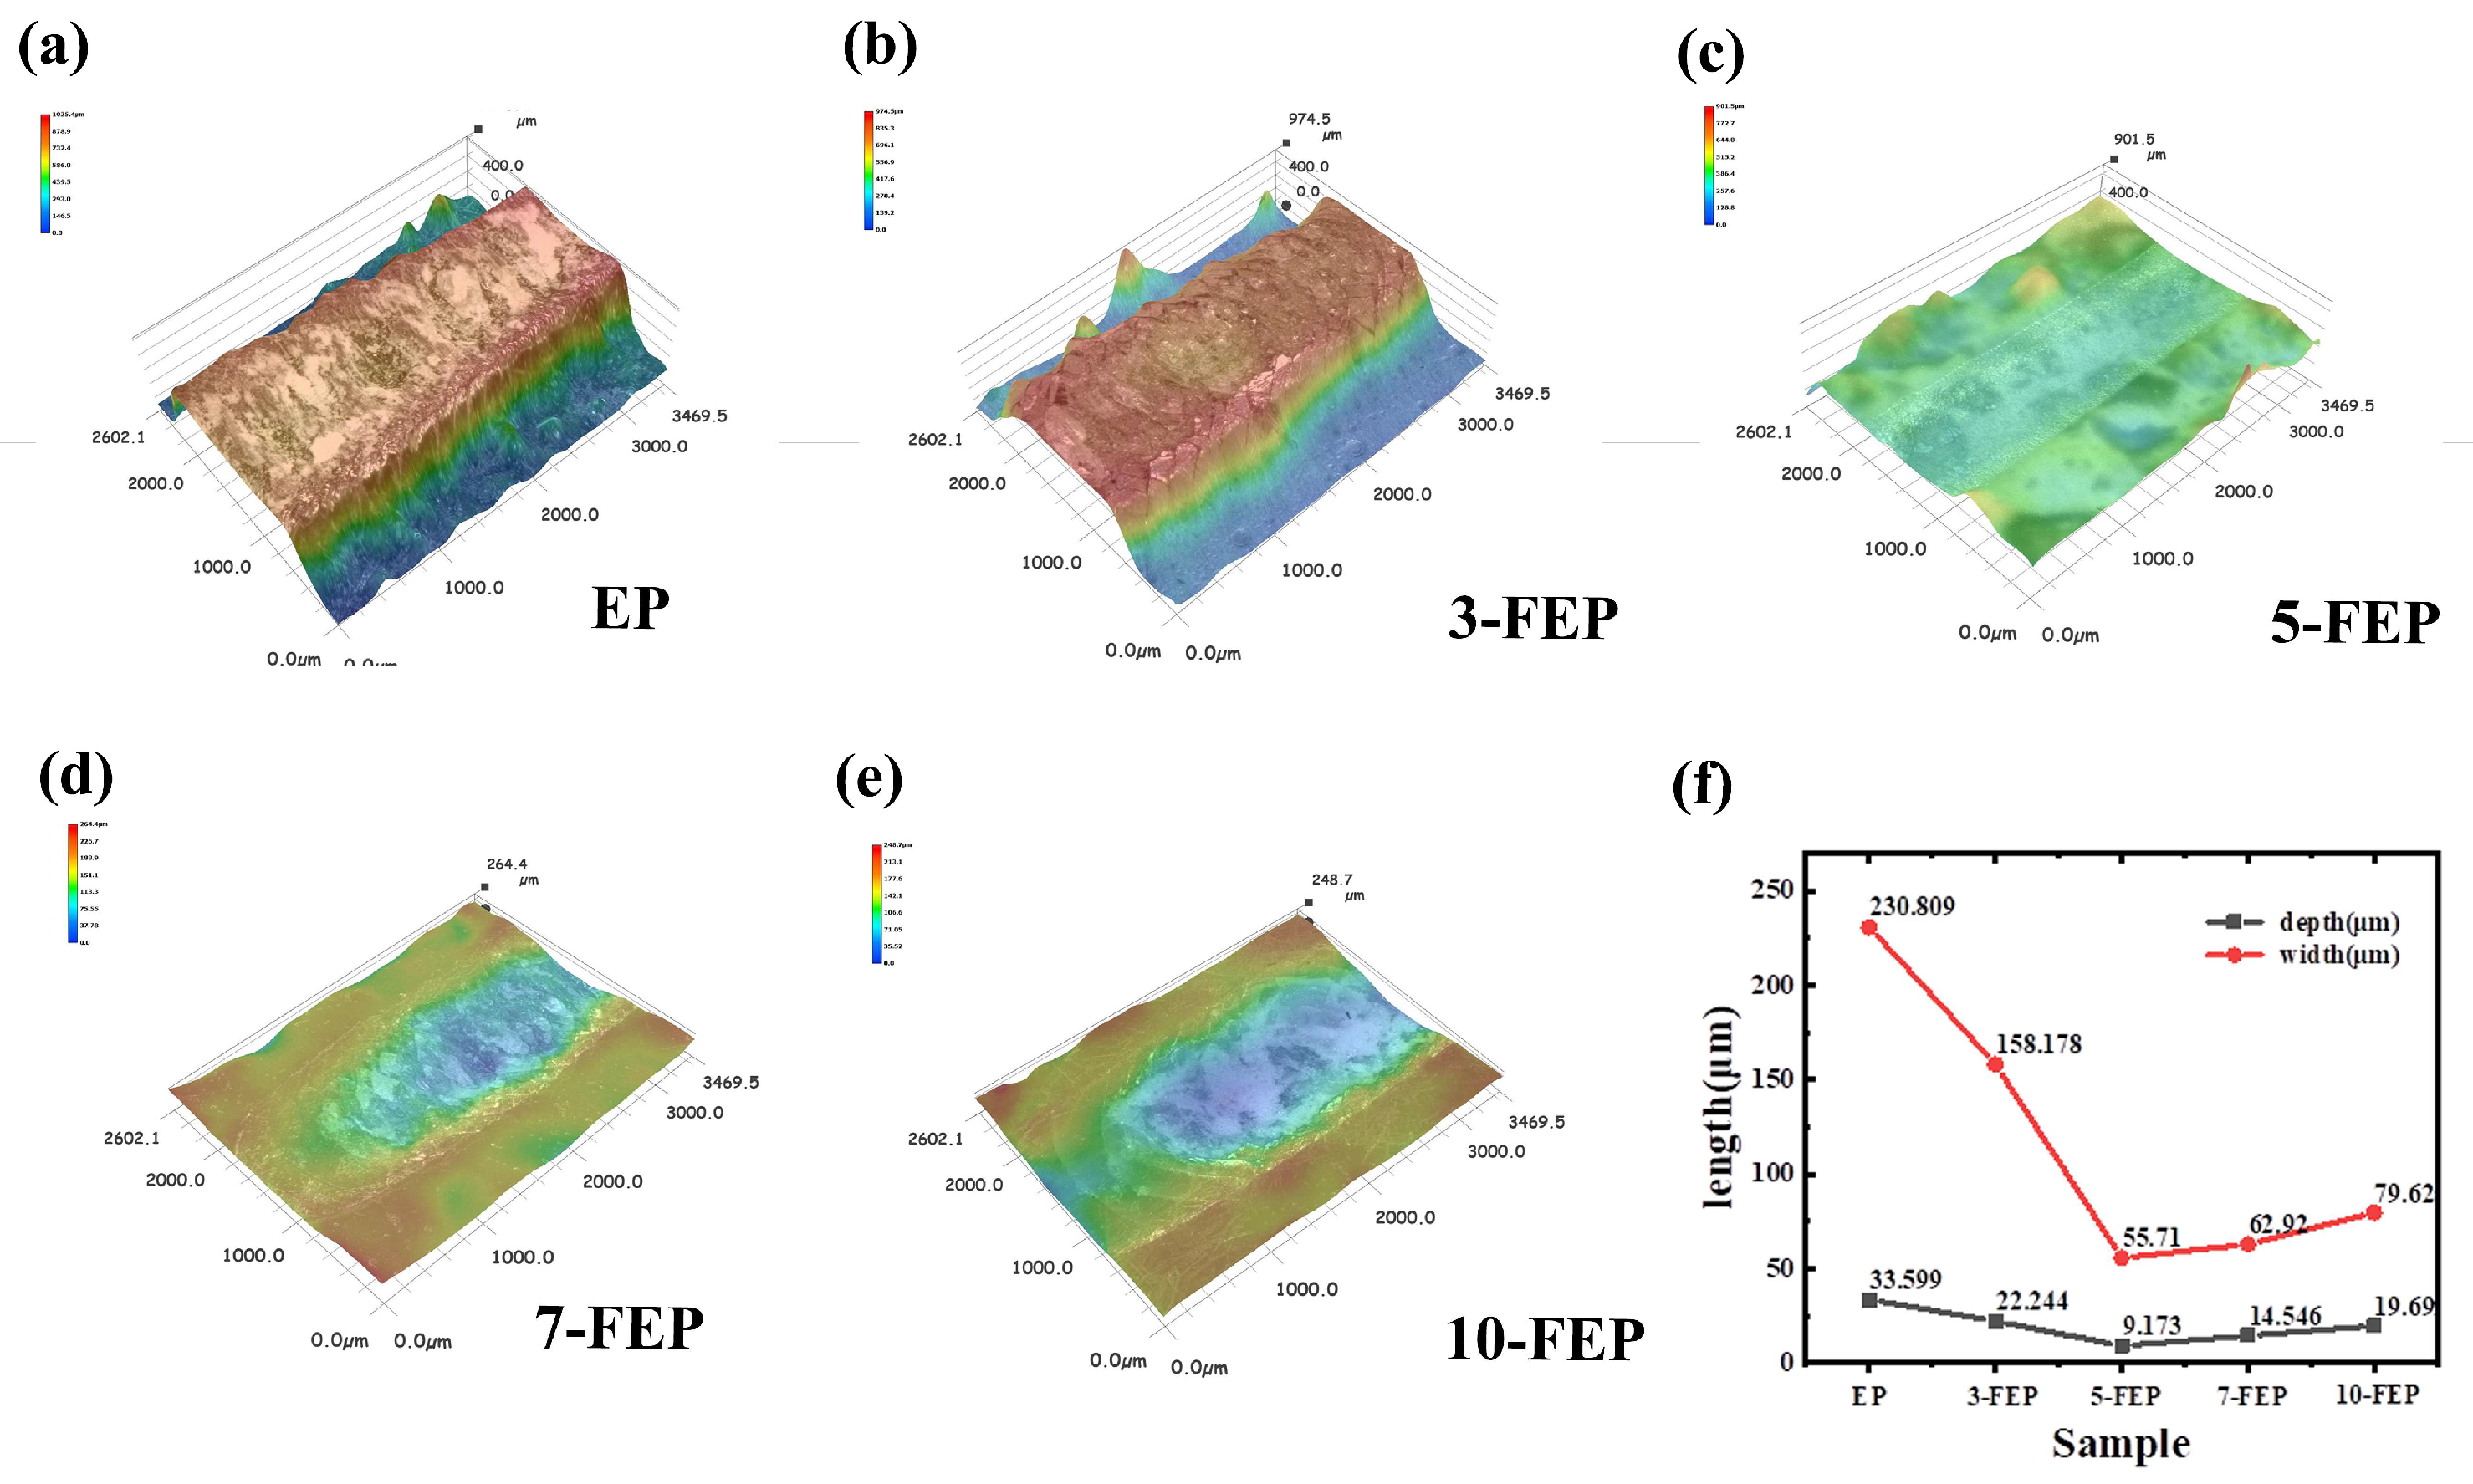
Figure 8a–e shows the three-dimensional morphology of the different coatings after friction and the corresponding cross sections of the wear marks. Figure 8f represents the average width and depth of friction. The frictional cross-sectional depths of 230.809, 158.178, 55.710, 62.920 and 79.652 μm were obtained for the five coatings EP, 3-FEP, 5-FEP, 7-FEP and 10-FEP, respectively. It can be clearly seen that the blank EP coating shows the largest wear width and depth (Figure 8a). With the addition of FC, the composite coating shows less wear damage and narrower and shallower wear marks, which is consistent with its enhanced anti-wear properties. These results again demonstrate the superiority of the modified FC in improving the wear resistance of the epoxy-based composite coatings.
As can be seen from Figure 7a, the surface of EP is severely worn and has a large area of spalling. This is due to the lack of mechanical strength, toughness and load-bearing capacity of epoxy resin itself, resulting in poor wear resistance. As shown in Figure 9b–e, the presence of FC reduces the peeling of the coating, transforming from a rough, wrinkled shape to a smoother friction surface. The reason is that evenly dispersed FC is easy to enter the friction interface and PTFE resin with high bearing performance and lubrication performance is more conducive to the formation of uniform tough friction film on the surface of the steel ball under repeated friction. However, excessive FC polymer is easy to clump, destroy the consistency of the coating, and cannot be evenly dispersed in EP, resulting in insufficient improvement of the strength and toughness of epoxy resin.
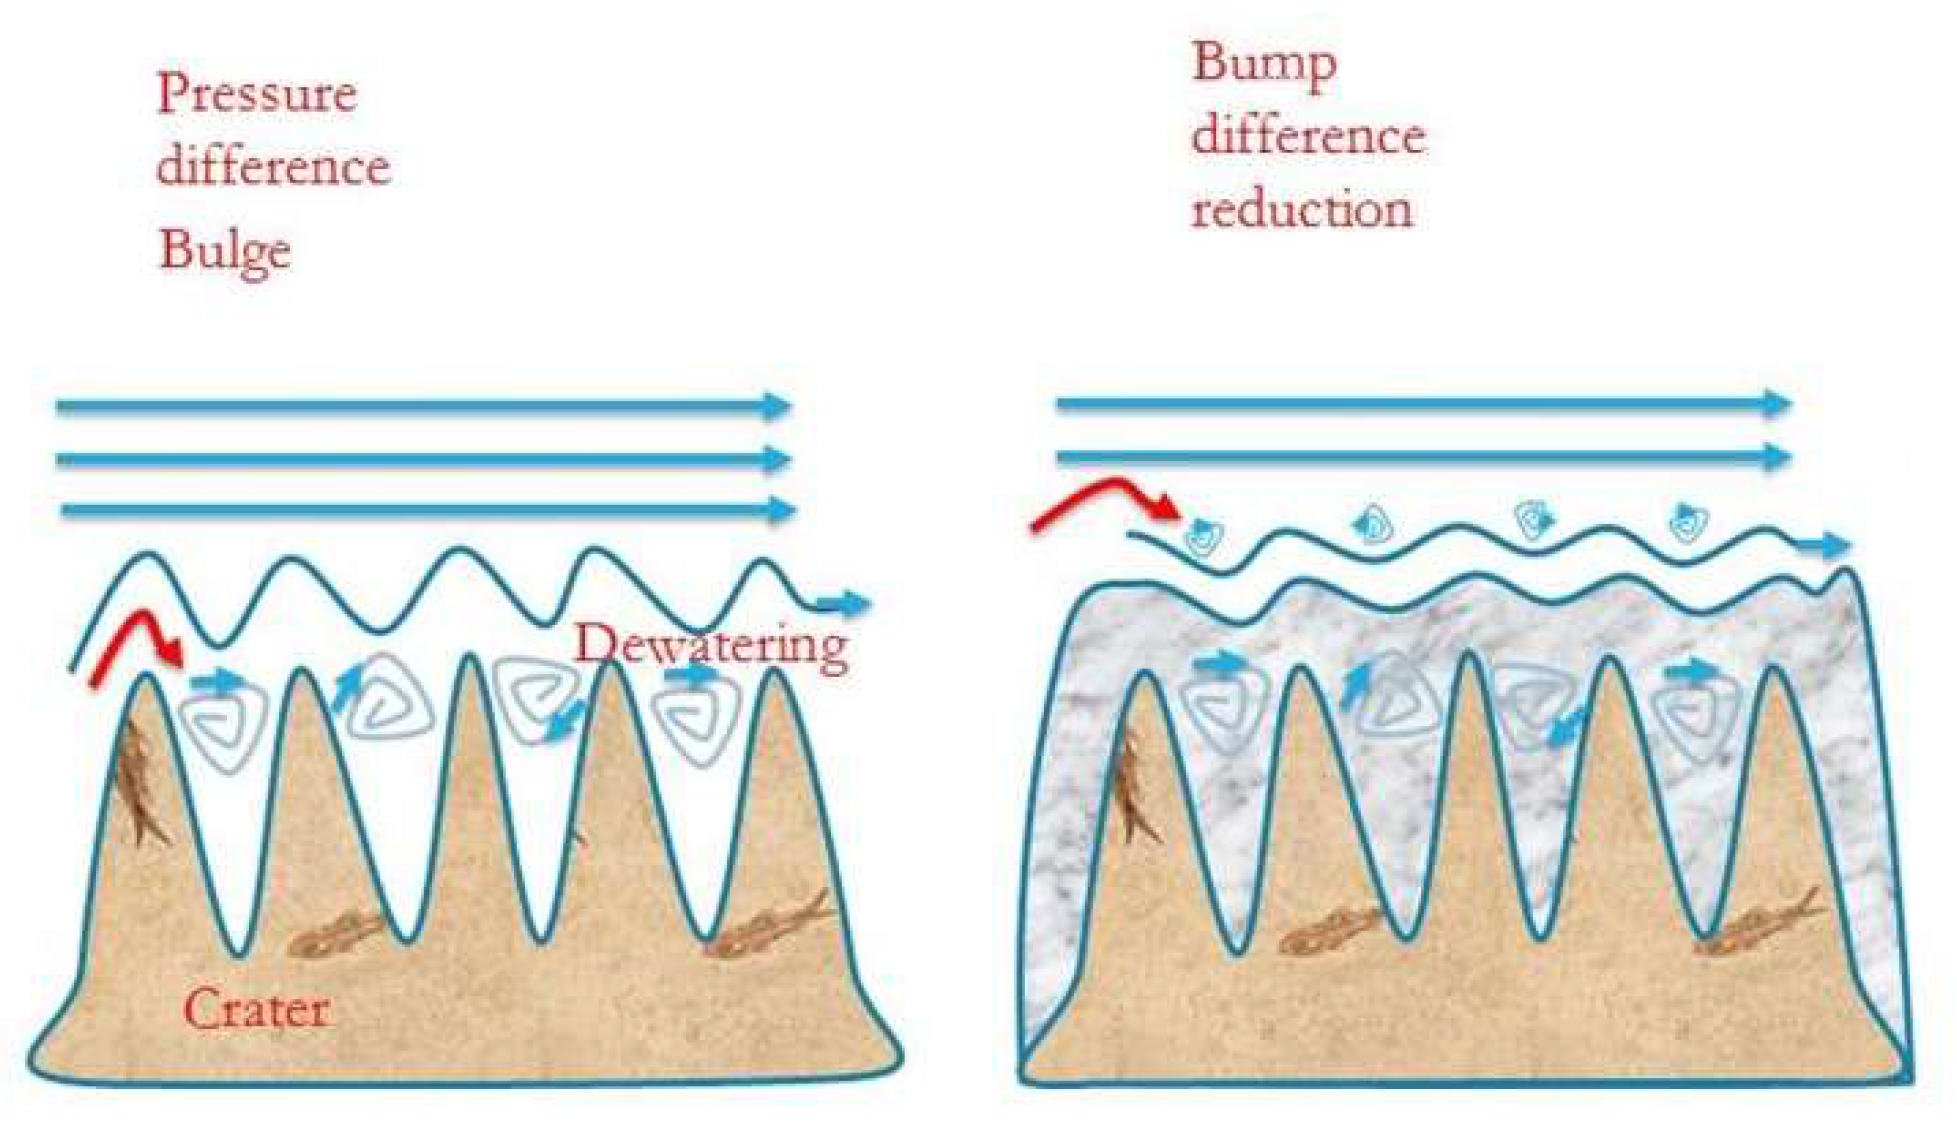
The mechanism of wear resistance is shown in Figure 10. The epoxy resin combined with the fluorocarbon polymer is firmly bonded to the inner wall of the oil pipe under the action of isocyanate, which greatly reduces the bump and pit on the inner wall surface and reduces the air pressure difference, and the special property of water and oil resistance given by the long chain of fluorocarbon reduces the retention nature of the liquid, thus improving the wear resistance.
3.5. Anticorrosion Performance of Composite Coatings
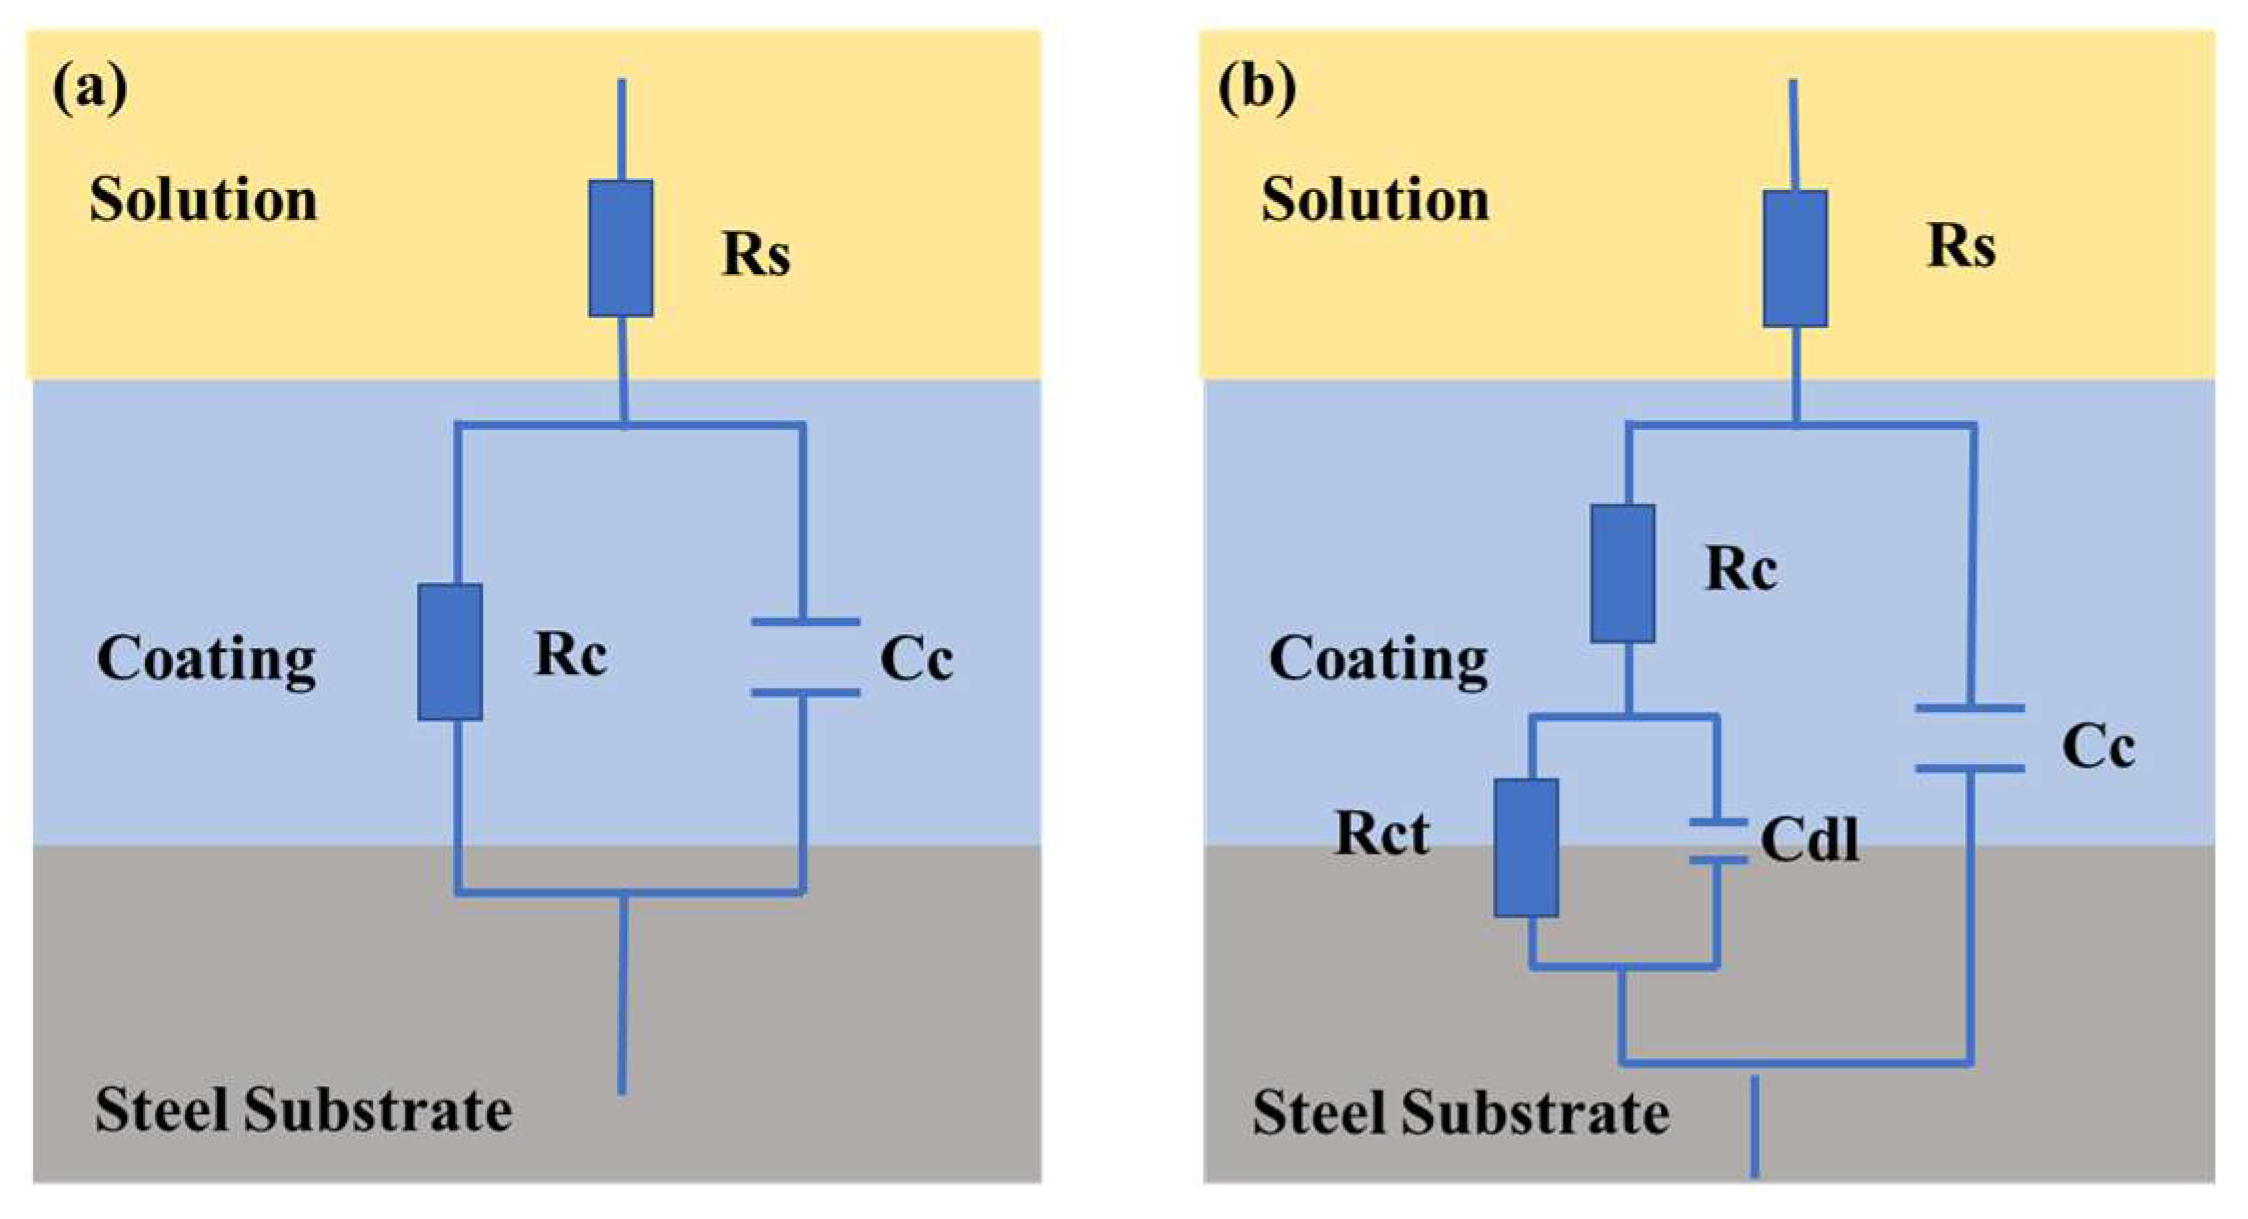
ZsimDemo 3.30 software was used to fit the equivalent circuit, and the results were shown in Figure 11. Rs represents the impedance of the solution to the current, which is related to the properties of the solution itself. Rc is a coating dependent constant, representing the effect of the coating on the current impedance; Cc is the coating capacitor, the same as the ‘pure capacitor’ in electricity; Cdl is called electric double layer capacitor; RCTS are related to charge transfer in electrode reactions [29]. At the early stage of corrosion, the corrosive medium does not enter the coating surface, so there is only solution resistance Rs, coating capacitance Cc and coating constant Rc. The initial equivalent circuit can be expressed as Figure 11a. With the increase of soaking time, the corrosive medium gradually enters the coating and a series of corrosion reactions occur. In this case, the coating resistance is pure Rct and the electric double layer capacitor Cdl appear. The equivalent circuit can be expressed as Figure 11b.
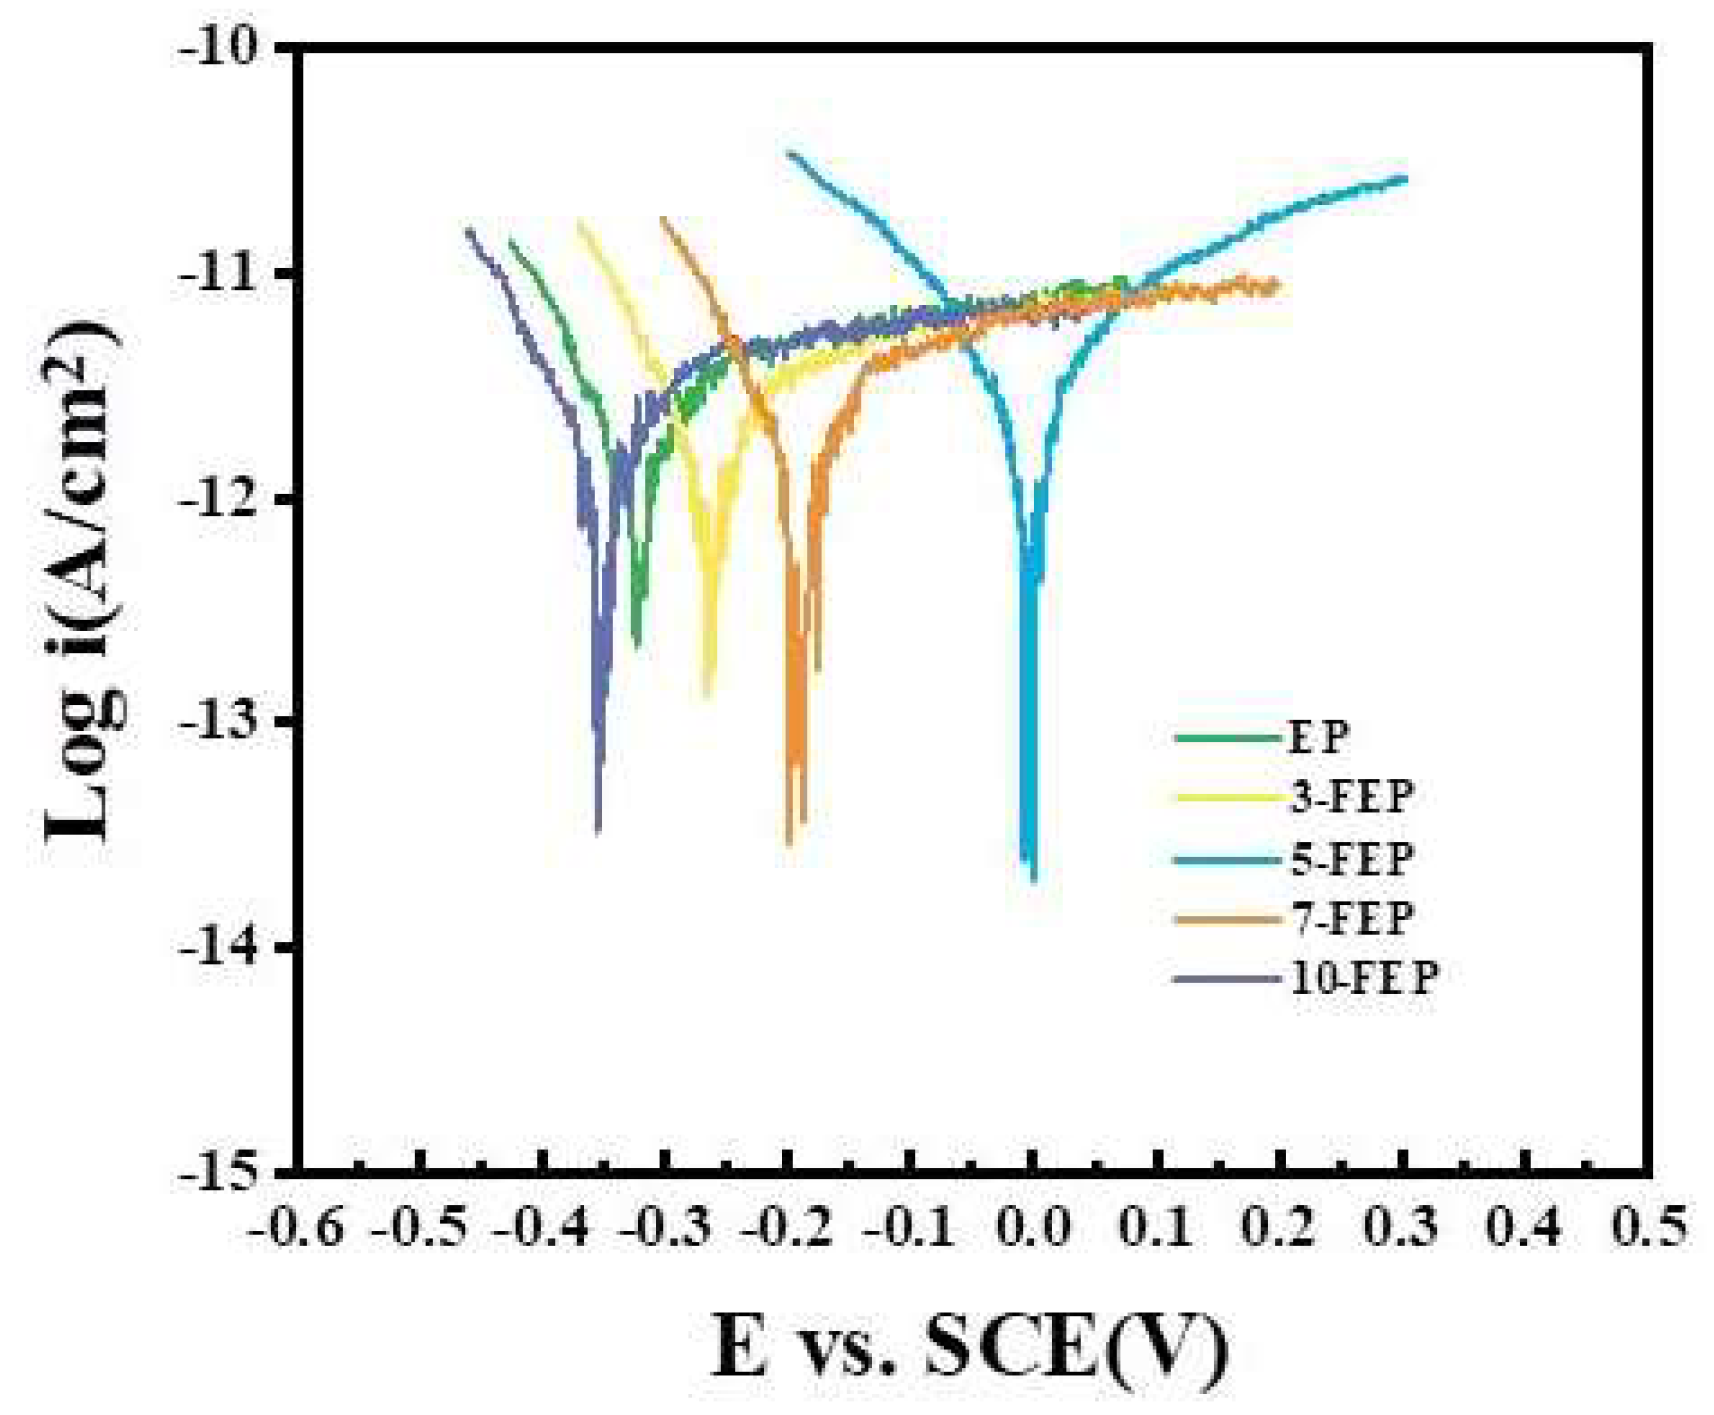
From previous experience, the lower the corrosion current density (Icorr) and the more positive the corrosion potential (Ecorr), the better the corrosion resistance. From the Figure 12 and Table 1 can be seen, FC decreases the corrosion current density and the corrosion potential is close to the positive potential. With the increase of FC, the corrosion resistance of the coating decreases slightly. When the FC content is 5 wt.%, 5-FEP has the larger corrosion potential (−0.03 V) and the smaller corrosion current density (3.42−14 A/cm2), which fully indicates that its corrosion resistance is the most excellent. The difference in corrosion potential was two orders of magnitude and the difference in corrosion current was two orders of magnitude compared to pure EP.
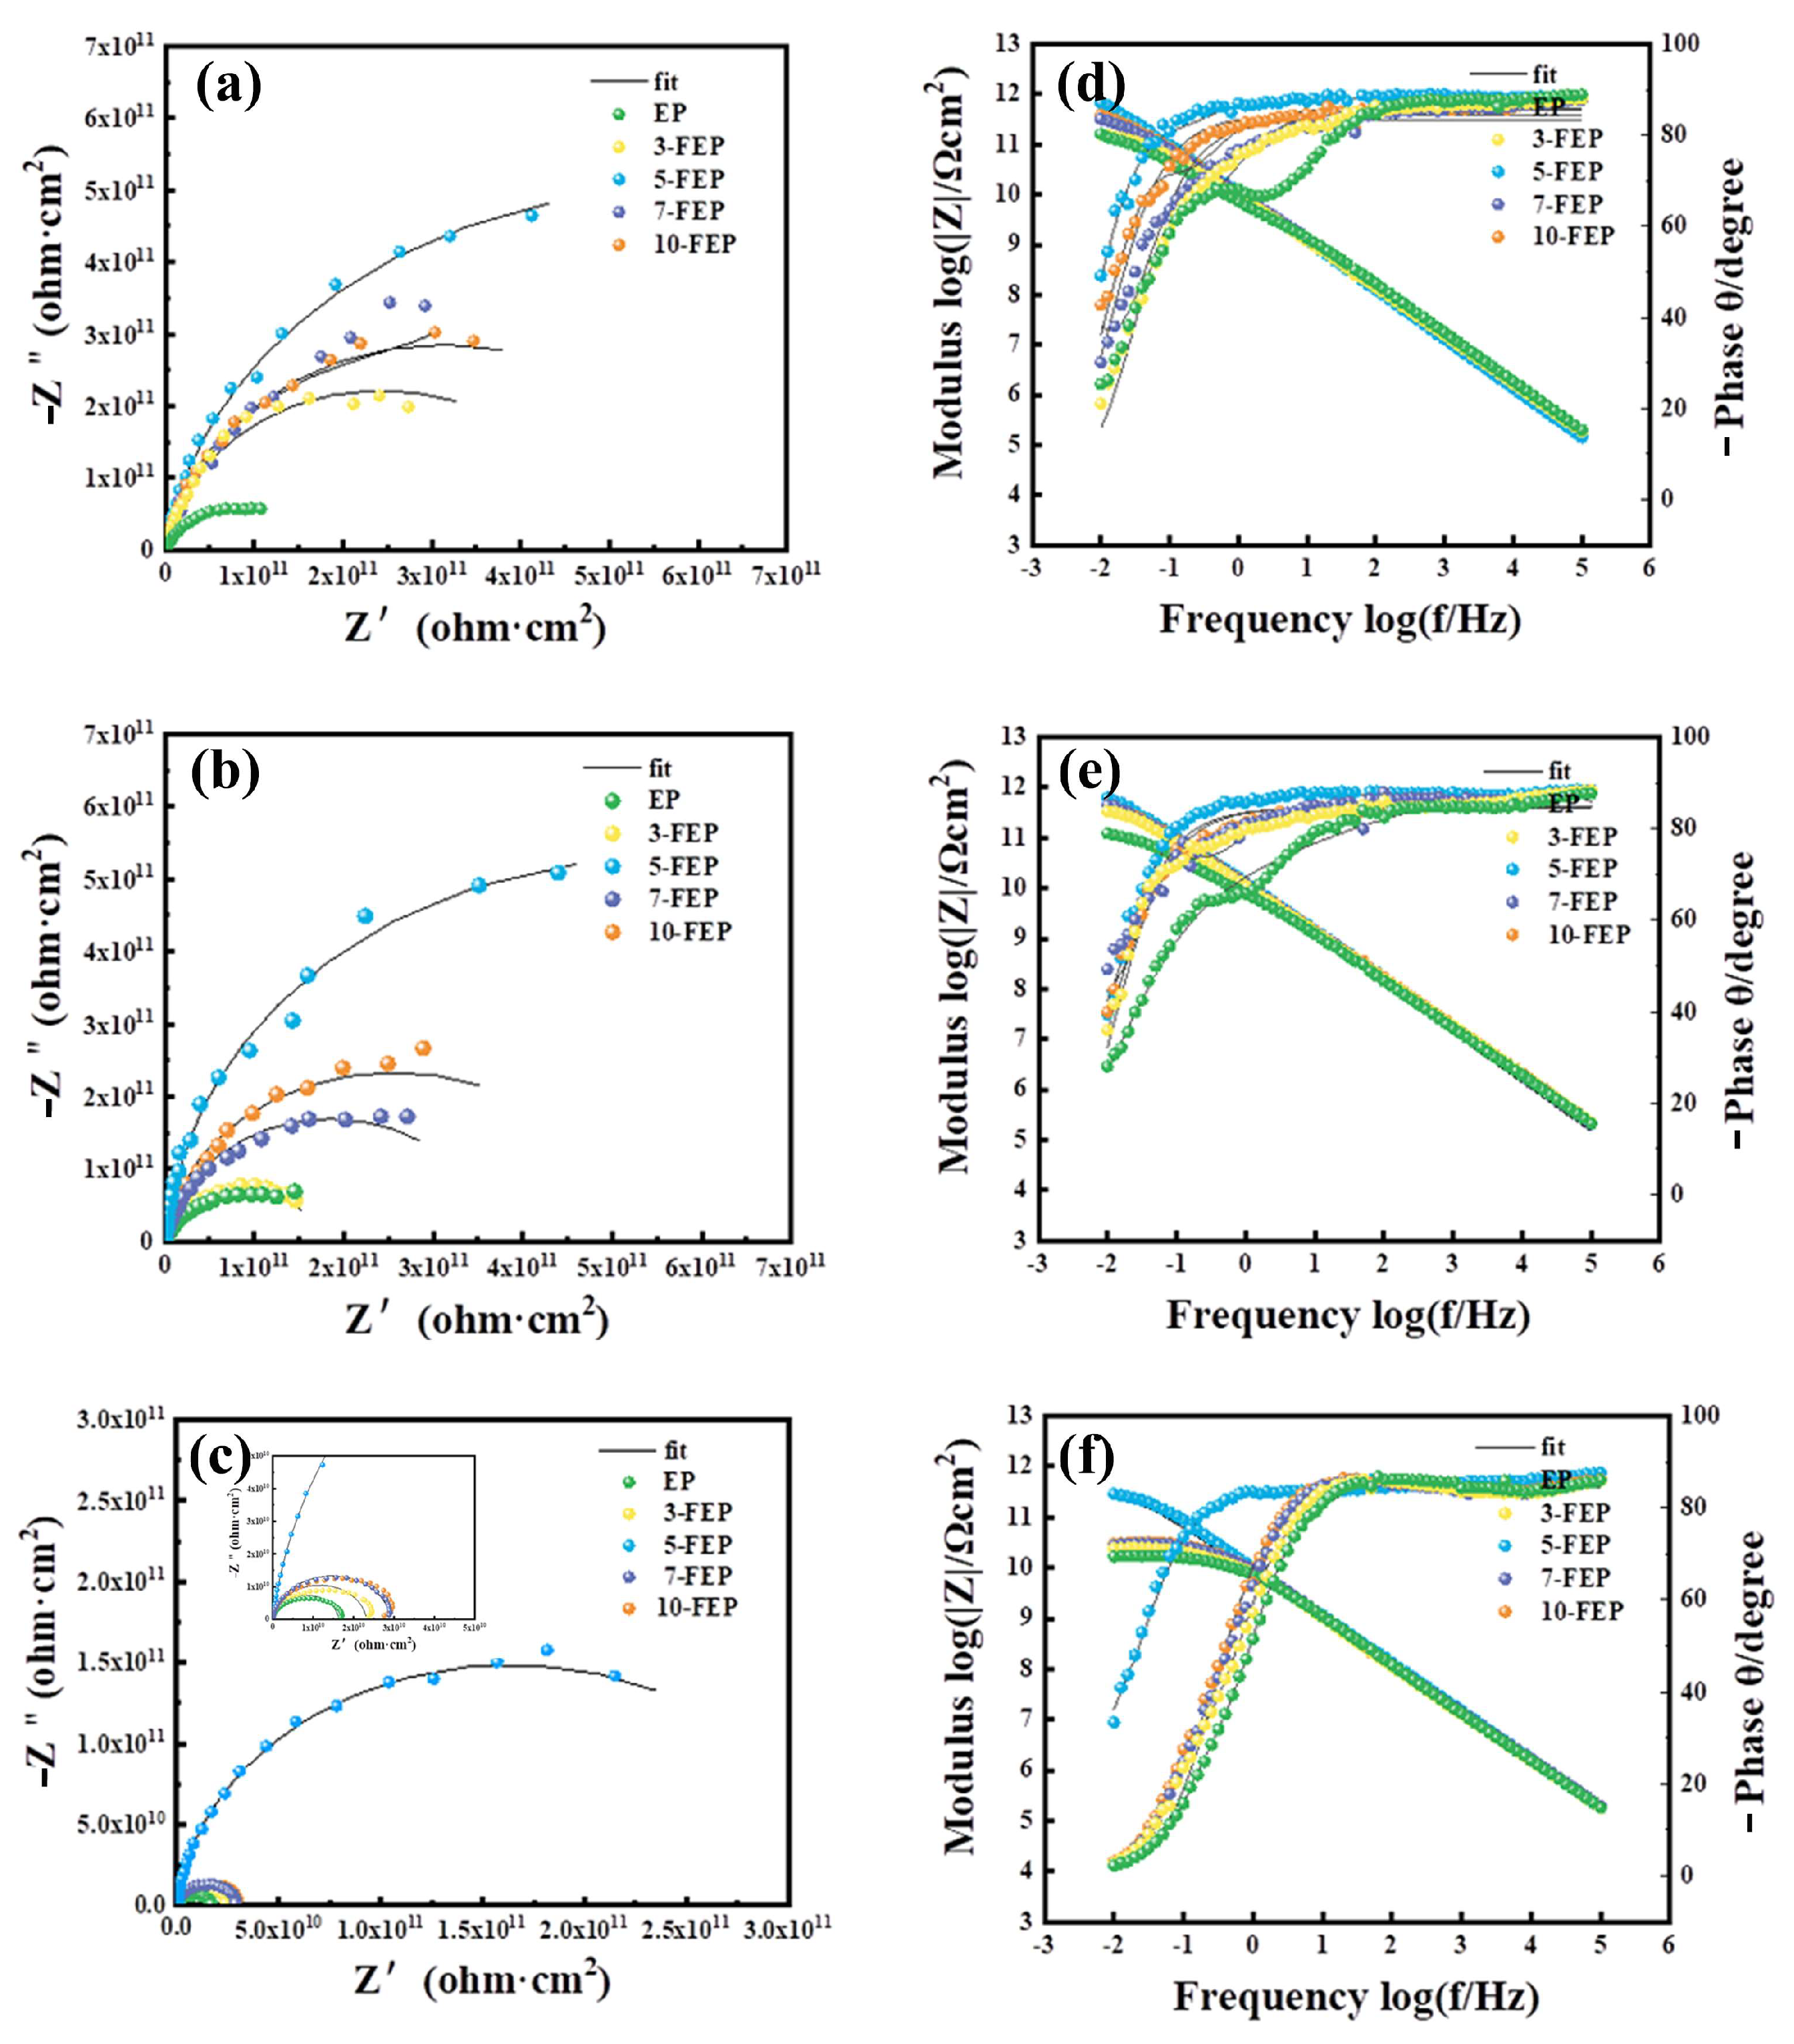
Figure 13a–f show the Nyquist and Bode plots of the five coatings after 1, 7, and 21 days of immersion in 3.5 wt.% NaCl solution. In terms of Nyquist plots, Z’ indicates the real part of the impedance; Z” indicates the imaginary part of the impedance; seawater undergoes infiltration and the pore resistance of the coating decreases. The larger the self-arc diameter, the better the protection performance [30]. As the immersion proceeded, the overall capacitive arcs all showed a decreasing trend, indicating a decrease in corrosion protection to the substrate. The radius of the pure EP coating was the smallest and the radius of the 5-FEP coating was the largest. Also, |Z|0.01 Hz values were widely used to evaluate the shielding performance of the samples [31]. When the immersion time was increased to 7 days, all five coatings at |Z|0.01 Hz showed varying degrees of degradation compared to the initial immersion period, due to the absorption of corrosive media and the generation of transport paths through defects or pores to the steel substrate. However, at 0.01 Hz, the |Z|0.01 Hz of EP gradually decreases from 1.62 × 10¹¹ (1 day) to 1.67 × 10¹⁰ Ω cm2 (21 days), which implies that the pure EP coating is less corrosion-resistant in corrosive media due to the heterogeneous structure of the coating. In contrast, 5-FEP gradually decreases from 6.21 × 10¹¹ (1 day) to 2.91 × 10¹¹ Ω·cm2 (21 days) at |Z|0.01 Hz higher than the pure EP coating by one order of magnitude during the post-medium period of NaCl solution immersion, which indicates that the 5-FEP coating has the best corrosion-resistance durability. In the middle and late stages of NaCl immersion, the corrosive medium reaches the substrate surface and forms a passivation layer at the substrate/coating interface, which prevents further deepening of the electrochemical reaction and improves the corrosion resistance of the coatings. Table 2 shows the corresponding fitting EIS parameter values. 5-FEP has maintained a high RC value. The change of phase with time in the EIS test can also be a good indication of the corrosion resistance of the coating. We commonly use the breakpoint frequency (FB), which is expressed as the corresponding response frequency at 45°; the higher the FB, the larger the delamination area. It can be seen that the FB of the five coatings at the beginning of the immersion are very low, indicating that the corrosion medium has not yet penetrated the coating. As the corrosion medium continues to erode, the FB value begins to increase rapidly, indicating that the corrosion medium penetrates the coating and a considerable amount of loose corrosion products form between the substrate and the coating. For 5-FEP coatings, it can be seen that the FB has been maintained at a low value during the initial and mid-immersion process, and that the coating has excellent protective performance.
3.6. Analysis of Neutral Salt Spray Test
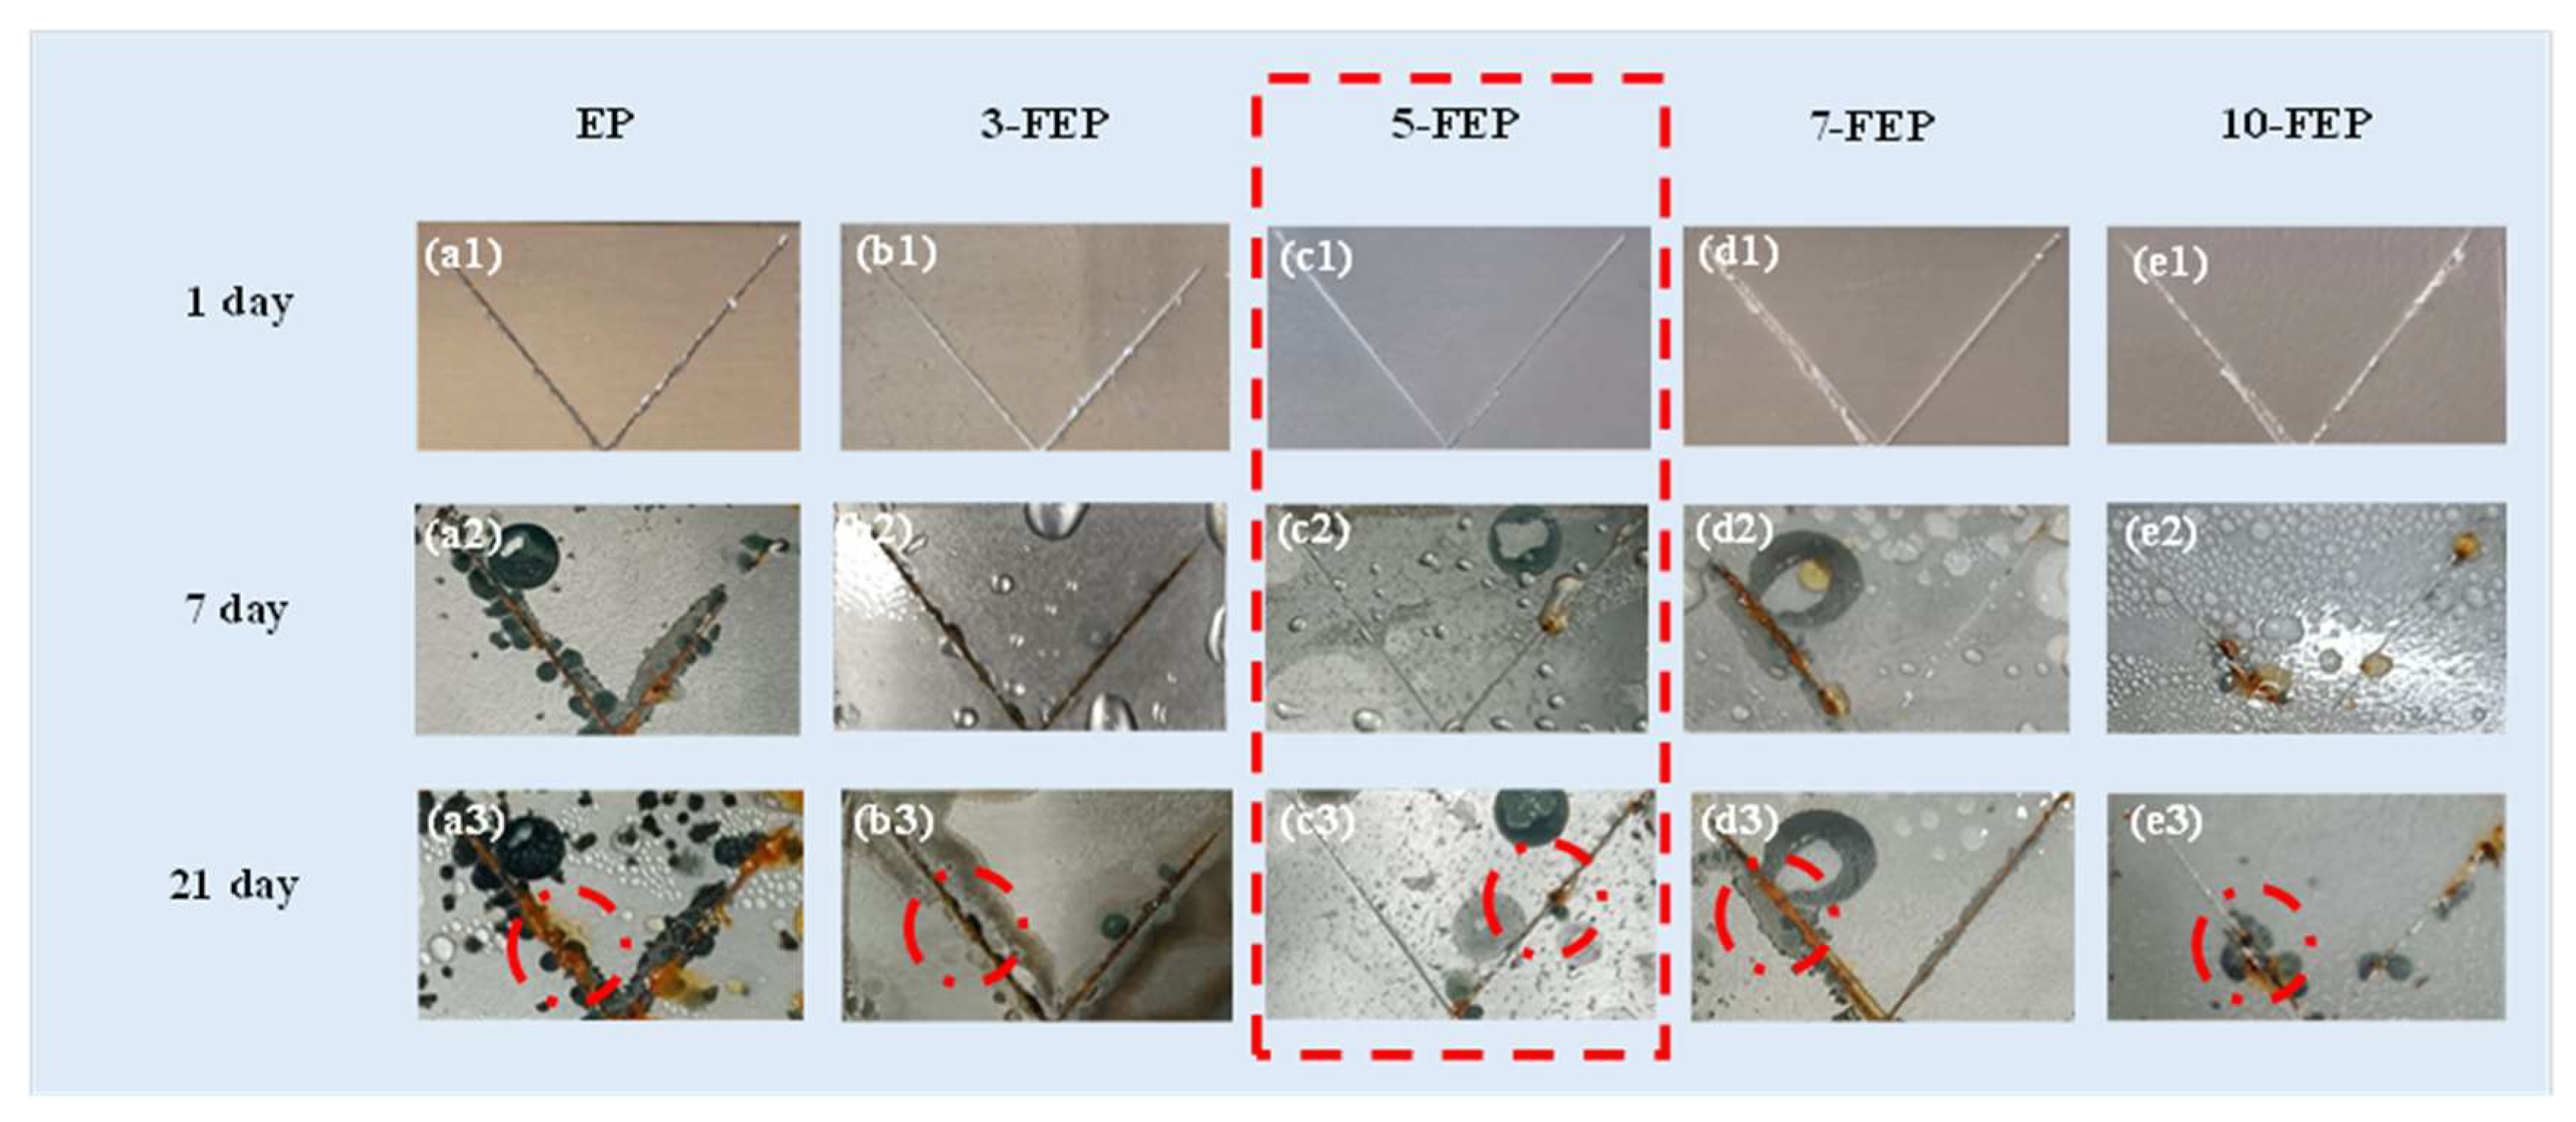
The salt spray resistance test can be used to evaluate the corrosion resistance of a coating by scratching the surface of the coating prior to the experiment to facilitate observation of corrosion. The visual surface images of the five coatings after 1, 7 and 21 days are given in Figure 14. It can be clearly observed that after 7 days, rusting appeared near the scratches on the surface of the pure EP coating, as well as peeling of the coating, and dense blistering and pitting appeared outside the scratches. After 21 days, the pitting of the coating gradually became larger and tended to darken in color. The large amount of rusting and the generation of coating dots indicated that the shielding ability of the coating was poor, resulting in the corrosive medium having penetrated the coating to reach the substrate.
After adding the right amount of FC, the corrosion protection and shielding of the composite coating were obviously strengthened. The pitting and blistering of the composite coating with the addition of 5 wt.% FC and F4 were effectively improved, which may be due to the enhanced hydrophobicity and water resistance of the coating with the addition of FC to the epoxy resin matrix. However, when the FC content was further increased, the corrosion area near the scratches became larger and the rusting phenomenon became more severe. This may be due to the fact that, at high contents, the compatibility difference between FC and EP is too great and a certain degree of agglomeration occurs. The overall structure of the resin was destroyed, leading to a decrease in coating performance. The results of the salt spray experiments showed that the addition of the appropriate amount of FC composites could improve the shielding performance of the coating.
4. Conclusions
- Fluorinated acrylic resins were synthesized by free radical copolymerization, and their structures were confirmed by FTIR, XPS and GPC measurements. The oil contact angle and water contact angle of FC synthesized with different TEAc-N monomers were tested, and 9:1 was selected as the best FC.
- FC was added to epoxy resin and cured with isocyanate compound to obtain the composite coating. The performance of the composite coating was comprehensively evaluated by contact angle, scanning electron microscope, super depth of field microscope, tribometer, electrochemical impedance spectroscopy and salt spray test. It was found that the addition of FC changed the epoxy resin from hydrophilic to hydrophobic, reduced the friction coefficient and loss, and enhanced the anticorrosion performance.
- 5-FEP had the best effect. The friction coefficient was 0.42, which was lower than that of pure EP (0.73). The friction loss was only 0.02 g. 5-FEP had the largest corrosion potential (−0.03 V) and the smallest corrosion current density (3.42−14 A/cm2). Compared with pure EP, the corrosion potential was one order of magnitude different, and the corrosion current was two orders of magnitude different. After 21 days of immersion, the impedance of the EP coating was nearly six orders of magnitude higher than that of the EP coating.
- FEP can be of great value as a long-term anticorrosion and hydrophobic wear-resistant method for the inner coating of transport pipelines.
Author Contributions
Conceptualization: X.O.; Methodology: Y.T.; Formal analysis and investigation: J.T.; Writing—original draft preparation: Y.T.; Writing—review and editing: F.Q. and N.Z.; All authors have read and agreed to the published version of the manuscript.
Funding
This research was funded by Educational Commission of Hunan Province of China (20B579); National Natural Science Foundation of China (52271117); Hunan Provincial Natural Science Foundation of China (2021JJ30646); High Technology Research and Development Program of Hunan Province of China (2022GK4038).
Institutional Review Board Statement
Not applicable.
Informed Consent Statement
Not applicable.
Data Availability Statement
Not applicable.
Conflicts of Interest
The authors declare no conflict of interest.
References
- Ijaola, A.O.; Farayibi, P.K.; Asmatulu, E. Superhydrophobic coatings for steel pipeline protection in oil and gas industries: A comprehensive review. J. Nat. Gas Sci. Eng. 2020, 83, 103544. [Google Scholar] [CrossRef]
- Cheng, S.; Yuan, W. Corrosion mechanism and anticorrosion technology of oil and gas gathering and transportation pipeline. IOP Conf. Ser. Earth Environ. Sci. 2021, 859, 012115. [Google Scholar] [CrossRef]
- Yang, G.R.; Song, W.M.; Sun, X.M.; Ma, Y.; Lu, J.J.; Hao, Y. The Wear Behavior of Electroless Ni-P/SiC Composite Coating. Adv. Mater. Res. 2011, 239–242, 954–957. [Google Scholar] [CrossRef]
- Zhu, Y.; Xiong, J.; Tang, Y.; Yu, Z. EIS study on failure process of two polyurethane composite coatings. Prog. Org. Coat. 2010, 69, 7–11. [Google Scholar] [CrossRef]
- Lusk, D.; Gore, M.; Boardman, B.; Upadhyaya, D.; Casserly, T.; Oppus, M. A High Corrosion and Wear Resistant Interior Surface Coating for Use in Oilfield Applications. Adv. Mater. Res. 2010, 83–86, 592–600. [Google Scholar] [CrossRef]
- Ling, Z.; Qing, Y.; Huang, X. Research and application progress of natural gas pipeline resistance reduction and wear-resistant coatings. Corros. Protect. 2003, 24, 4. [Google Scholar]
- Shibuichi, S.; Yamamoto, T.; Onda, T.; Tsujii, K. Super Water- and Oil-Repellent Surfaces Resulting from Fractal Structure. J. Colloid Interface Sci. 1998, 208, 287–294. [Google Scholar] [CrossRef]
- Ma, C.; Wang, H.; Zhang, H.; Liu, X.; Chen, H. Preparation and Properties of Fluorinated Poly(ethyl methacrylate-co-butyl acrylate). Polym. Sci. Ser. B 2019, 61, 163–169. [Google Scholar]
- Yao, M.; Gao, P.; Zhao, H.; Nie, J.; He, Y. Photo-patternable F-containing acrylic copolymers as passivation materials. Mater. Chem. Phys. 2020, 253, 123404. [Google Scholar] [CrossRef]
- Ding, Z.; Ping, X.; Pan, R.; Lin, X.; Jiang, B. Preparation and Surface Properties Study of Novel Fluorine-Containing Methacrylate Polymers for Coating. Materials 2018, 11, 2258. [Google Scholar]
- Maeztu, J.; Berlanga, C.; Bastidas, D.; Palacio, J.; Rodriguezet, R. Effect of graphene oxide and fluorinated polymeric chains incorporated in a multilayered sol-gel nanocoating for the design of corrosion resistant and hydrophobic surfaces. Appl. Interf. Sci. 2017, 419, 138–149. [Google Scholar] [CrossRef]
- Li, C.; Hu, Y.; Zhang, J.; Shen, L.; Bao, N. Tribological and Corrosion Behaviors of Fluorocarbon Coating Reinforced with Sodium Iron Titanate Platelets and Whiskers. J. Appl. Polym. Sci. 2020, 13, 48936. [Google Scholar] [CrossRef]
- Cichomski, M.; Burnat, B.; Prowizor, M.; Jedrzejczak, A.; Batory, D.; Piwoński, I.; Kozłowski, W.; Szymanski, W.; Dudek, M. Tribological and corrosive investigations of perfluoro and alkylphosphonic self-assembled monolayers on Ti incorporated carbon coatings, Tribology International. Tribol. Int. 2019, 130, 359–365. [Google Scholar] [CrossRef]
- Zhong, S.; Qin, K.; Hou, Y.; Xu, T.; Cai, Y.; Yi, L. Waterborne corrosion-resistant hydrophobic alkyd resin composite coatings modified with fluorinated acrylate–siloxane and submicron-sheet zinc phosphate pigment. J. Coat. Technol. Res. 2021, 18, 1309–1320. [Google Scholar] [CrossRef]
- Cheng, Y.; Wu, C.; Hu, L. Dual functional low surface energy coating of anti-corrosion / fouling via crosslinking polysilazane preceramic precursor incorporated with fluorine. Prog. Org. Coat. 2023, 177, 107409. [Google Scholar] [CrossRef]
- Xie, Y.; Liu, W.; Liang, L.; Liu, C.; He, S.; Zhang, F.; Shi, H.; Yang, M. Enhancement of anticorrosion property and hydrophobicity of modified epoxy coatings with fluorinated polyacrylate, Coll, Surf, A: Physicochemi, Engineer. Aspects 2019, 579, 123659. [Google Scholar] [CrossRef]
- Su, Y.C.; Chang, F.C. Synthesis and characterization of fluorinated polybenzoxazine material with low dielectric constant. Polymer 2003, 44, 7989–7996. [Google Scholar] [CrossRef]
- Suda, Y.; Morimoto, T. Molecularly adsorbed water on the bare surface of titania (rutile). Langmuir 1987, 3, 786–788. [Google Scholar] [CrossRef]
- Nakayama, T. Structure of TiO2/ SiO2 Multilayer Films. J. Electrochem. Soc. 1993, 141, 237–241. [Google Scholar] [CrossRef]
- Tang, W.; Matyjaszewski, K.; Dong, H. Well-Defined High-Molecular-Weight Polyacrylonitrile via Activators Regenerated by Electron Transfer ATRP. Macromolecules 2007, 40, 2974–2977. [Google Scholar]
- Jiao, C.; Shao, Q.; Wu, M.; Zheng, B.; Guo, Z. 2-(3,4-Epoxy) ethyltriethoxysilane-modified waterborne acrylic resin: Preparation and property analysis. Polymer 2020, 190, 122196. [Google Scholar] [CrossRef]
- Chen, H.; Tian, X.; Liu, J. Unsaturated Polyester Resin Nanocomposites Containing ZnO Modified with Oleic Acid Activated by N,N′-Carbonyldiimidazole. Polymers 2018, 10, 362. [Google Scholar] [CrossRef] [PubMed] [Green Version]
- Wang, W.; Kan, Y.; Pan, Y.; Yuan, Y.; Liew, K.M.; Hu, Y. Urchin-Like Shells of TiO2 Hollow Spheres for Improving the Fire Safety of Epoxy Resin. Ind. Eng. Chem. Res. 2016, 56, 1341–1348. [Google Scholar] [CrossRef]
- Williams, B.L.; Ding, H.; Hou, Z.; Paul, P.O.; Lewis, F.A.; Smith, A.T.; Sun, L. Highly efficient polyvinyl alcohol/montmorillonite flame retardant nanocoating for corrugated cardboard. Adv. Compos. Hybrid Mater. 2021, 4, 662–669. [Google Scholar] [CrossRef]
- Fang, C.; Jing, Y.; Zong, Y.; Lin, Z. Preparation and characterization of fluorine-containing acrylic latex PSAs using a reactive surfactant. J. Fluor. Chem. 2016, 192, 113–119. [Google Scholar] [CrossRef]
- Fang, C.; Zhu, K.; Zhu, X.; Lin, Z. Preparation and characterization of self-crosslinking fluorinated polyacrylate latexes and their pressure sensitive adhesive applications. Int. J. Adhes. Adhes. 2019, 95, 102417. [Google Scholar] [CrossRef]
- Azémard, C.; Vieillescazes, C.; Ménager, M. Effect of photodegradation on the identification of natural varnishes by FT-IR spectroscopy. Microchem. J. 2014, 112, 137–149. [Google Scholar] [CrossRef]
- Tian, H.; Wang, C.; Guo, M.; Cui, Y.; Tang, Z. Microstructures and high-temperature self-lubricating wear-resistance mechanisms of graphene-modified WC-12Co coatings. Friction 2021, 9, 331–335. [Google Scholar] [CrossRef]
- Xia, W.; Xue, H.; Wang, J.; Wang, T.; Song, L.; Guo, H.; Fan, X.; Gong, H.; He, J. Functionlized graphene serving as free radical scavenger and corrosion protection in gamma-irradiated epoxy composites. Carbon 2016, 101, 315–323. [Google Scholar] [CrossRef]
- Marcus, P. Corrosion Mechanisms in Theory and Practice, 2nd ed.; CRC Press: Boca Raton, FL, USA, 2002; p. 742. [Google Scholar]
- Meng, F.; Liu, L.; Li, Y.; Wang, F. The failure behaviour of a commercial highly pigmented epoxy coating under marine alternating hydrostatic pressure. Prog. Org. Coat. 2015, 82, 101–112. [Google Scholar]
Figure 1.
C synthesis reaction equation.

Figure 2.
Composite coating preparation process.

Figure 3.
(a) FTIR of TEAc-N and FC; (b) GPC diagram of FC; (c) XPS full spectra of different ratios of FC; (d) XPS analysis: survey spectrum high-resolution spectra of C1s in FC (TEAc-N:HPA = 9:1); (d) FTIR spectra of different ratios of FC; (e) XPS analysis: survey spectrum high-resolution spectra of F1s in FC (TEAc-N:HPA = 9:1); (f) XPS analysis: survey spectrum high-resolution spectra of O1s in FC (TEAc-N:HPA = 9:1).

Figure 4.
(a) FTIR spectra of different ratios of FC; (b) DCS of FC; (c) TG of FC; (d) XRD of FC.

Figure 5.
(a) the WCA and OCA for different scales of FC; (b) Composite coating of WCA and OCA; (c) Variation of water absorption of different coatings with soaking time.
Figure 5.
(a) the WCA and OCA for different scales of FC; (b) Composite coating of WCA and OCA; (c) Variation of water absorption of different coatings with soaking time.

Figure 6.
SEM surface images: (a) EP, (b) 3-FEP, (c) 5-FEP, (d) 7-FEP, (e) 10-FEP.

Figure 7.
(a) Friction coefficient of the composite coating; (b) Friction loss of composite coatings.
Figure 7.
(a) Friction coefficient of the composite coating; (b) Friction loss of composite coatings.

Figure 8.
Cross-sectional profile heights and corresponding depth 3D friction patterns for the five coatings: (a) EP, (b) 3-EP, (c) 5-EP, (d) 7-EP, (e) 10-EP; (f) Resistance reduction mechanism.
Figure 8.
Cross-sectional profile heights and corresponding depth 3D friction patterns for the five coatings: (a) EP, (b) 3-EP, (c) 5-EP, (d) 7-EP, (e) 10-EP; (f) Resistance reduction mechanism.

Figure 9.
Surface SEM of the fractured coatings:(a) EP, (b) 3-FEP, (c) 5-FEP, (d) 7-FEP, (e) 10-FEP.
Figure 9.
Surface SEM of the fractured coatings:(a) EP, (b) 3-FEP, (c) 5-FEP, (d) 7-FEP, (e) 10-FEP.

Figure 10.
Resistance reduction mechanism.

Figure 11.
(a) Early equivalent circuit; (b) mid-late equivalent circuit.

Figure 12.
Polarization curve of composite coating.

Figure 13.
Nyquist of the composite coatings: (a) 1 day, (b) 7 day, (c) 21 day; Bode plots of the composite coatings: (d) 1 day, (e) 7 day, (f) 21 day.
Figure 13.
Nyquist of the composite coatings: (a) 1 day, (b) 7 day, (c) 21 day; Bode plots of the composite coatings: (d) 1 day, (e) 7 day, (f) 21 day.

Figure 14.
Visual surface images of the composite coating after exposure to salt spray test for 1, 7 and 21 days.
Figure 14.
Visual surface images of the composite coating after exposure to salt spray test for 1, 7 and 21 days.


Table 1.
Electrochemical polarization corrosion parameters.
| Sample | Ecorr (V vs. SCE) | Icorr (A/cm2) | βa (V/dec) | −βc (V/dec) |
|---|---|---|---|---|
| EP | −0.39 | 1.14 × 10⁻¹² | 0.07 | 0.05 |
| 3-FEP | −0.27 | 1.56 × 10⁻¹³ | 0.16 | 0.14 |
| 5-FEP | −0.03 | 3.42 × 10⁻¹⁴ | 0.03 | 0.04 |
| 7-FEP | −0.20 | 1.52 × 10⁻¹³ | 0.07 | 0.05 |
| 10-FEP | −0.32 | 1.61 × 10⁻¹³ | 0.09 | 0.06 |
Table 2.
The electrochemical parameters extracted from EIS data of the coating.
| Coatings | Time | Rc (Ω∙cm2) | Qcd | Rct (Ω∙cm2) |
|---|---|---|---|---|
| Y0 (Ω−1cm−2sn) | ||||
| EP | 1d | 1.28 × 10¹⁰ | 1.56 × 10⁻¹⁰ | 4.44 × 10⁹ |
| 7d | 2.00 × 10⁷ | 7.78 × 10⁻¹² | 2.45 × 10¹¹ | |
| 21d | 8.54 × 10⁵ | 7.70 × 10⁻¹² | 1.88 × 10¹¹ | |
| 3-FEP | 1d | 7.04 × 10¹¹ | 1.31 × 10⁻¹⁰ | 1.99 × 10⁹ |
| 7d | 1.44 × 10¹¹ | 8.73 × 10⁻¹² | 4.69 × 10¹¹ | |
| 21d | 7.04 × 10¹¹ | 1.30 × 10⁻¹⁰ | 1.38 × 10¹¹ | |
| 5-FEP | 1d | 8.63 × 10¹¹ | 6.52 × 10⁻¹² | 1.16 × 10¹² |
| 7d | 5.93 × 10¹¹ | 1.68 × 10⁻¹² | 1.17 × 10¹² | |
| 21d | 3.56 × 10¹¹ | 7.75 × 10⁻¹² | 2.48 × 10¹⁰ | |
| 7-FEP | 1d | 6.58 × 10¹¹ | 2.53 × 10⁻⁷ | 1.81 × 10⁷ |
| 7d | 7.78 × 10¹⁰ | 8.56 × 10⁻¹² | 2.86 × 10¹¹ | |
| 21d | 5.68 × 10⁷ | 1.04 × 10⁻¹² | 2.89 × 10¹⁰ | |
| 10-FEP | 1d | 5.81 × 10¹¹ | 7.99 × 10⁻¹¹ | 9.99 × 10⁷ |
| 7d | 5.13 × 10¹¹ | 2.80 × 10⁻¹² | 3.97 × 10⁷ | |
| 21d | 2.44 × 10¹⁰ | 1.62 × 10⁻¹⁰ | 6.09 × 10⁹ |
Disclaimer/Publisher’s Note: The statements, opinions and data contained in all publications are solely those of the individual author(s) and contributor(s) and not of MDPI and/or the editor(s). MDPI and/or the editor(s) disclaim responsibility for any injury to people or property resulting from any ideas, methods, instructions or products referred to in the content. |
© 2023 by the authors. Licensee MDPI, Basel, Switzerland. This article is an open access article distributed under the terms and conditions of the Creative Commons Attribution (CC BY) license (https://creativecommons.org/licenses/by/4.0/).
Share and Cite
MDPI and ACS Style
Tan, Y.; Tang, J.; Zhao, N.; Qi, F.; Ouyang, X. Effect of Fluorocarbon Polymers on Hydrophobicity, Wear Resistance and Corrosion Resistance of Epoxy Resins. Coatings 2023, 13, 685. https://doi.org/10.3390/coatings13040685
AMA Style
Tan Y, Tang J, Zhao N, Qi F, Ouyang X. Effect of Fluorocarbon Polymers on Hydrophobicity, Wear Resistance and Corrosion Resistance of Epoxy Resins. Coatings. 2023; 13(4):685. https://doi.org/10.3390/coatings13040685
Chicago/Turabian StyleTan, Yali, Jun Tang, Nie Zhao, Fugang Qi, and Xiaoping Ouyang. 2023. "Effect of Fluorocarbon Polymers on Hydrophobicity, Wear Resistance and Corrosion Resistance of Epoxy Resins" Coatings 13, no. 4: 685. https://doi.org/10.3390/coatings13040685
Note that from the first issue of 2016, this journal uses article numbers instead of page numbers. See further details here.