
Study on the Matching of Surface Texture Parameters and Processing Parameters of Coated Cemented Carbide Tools
Abstract
:1. Introduction
2. Material and Methods
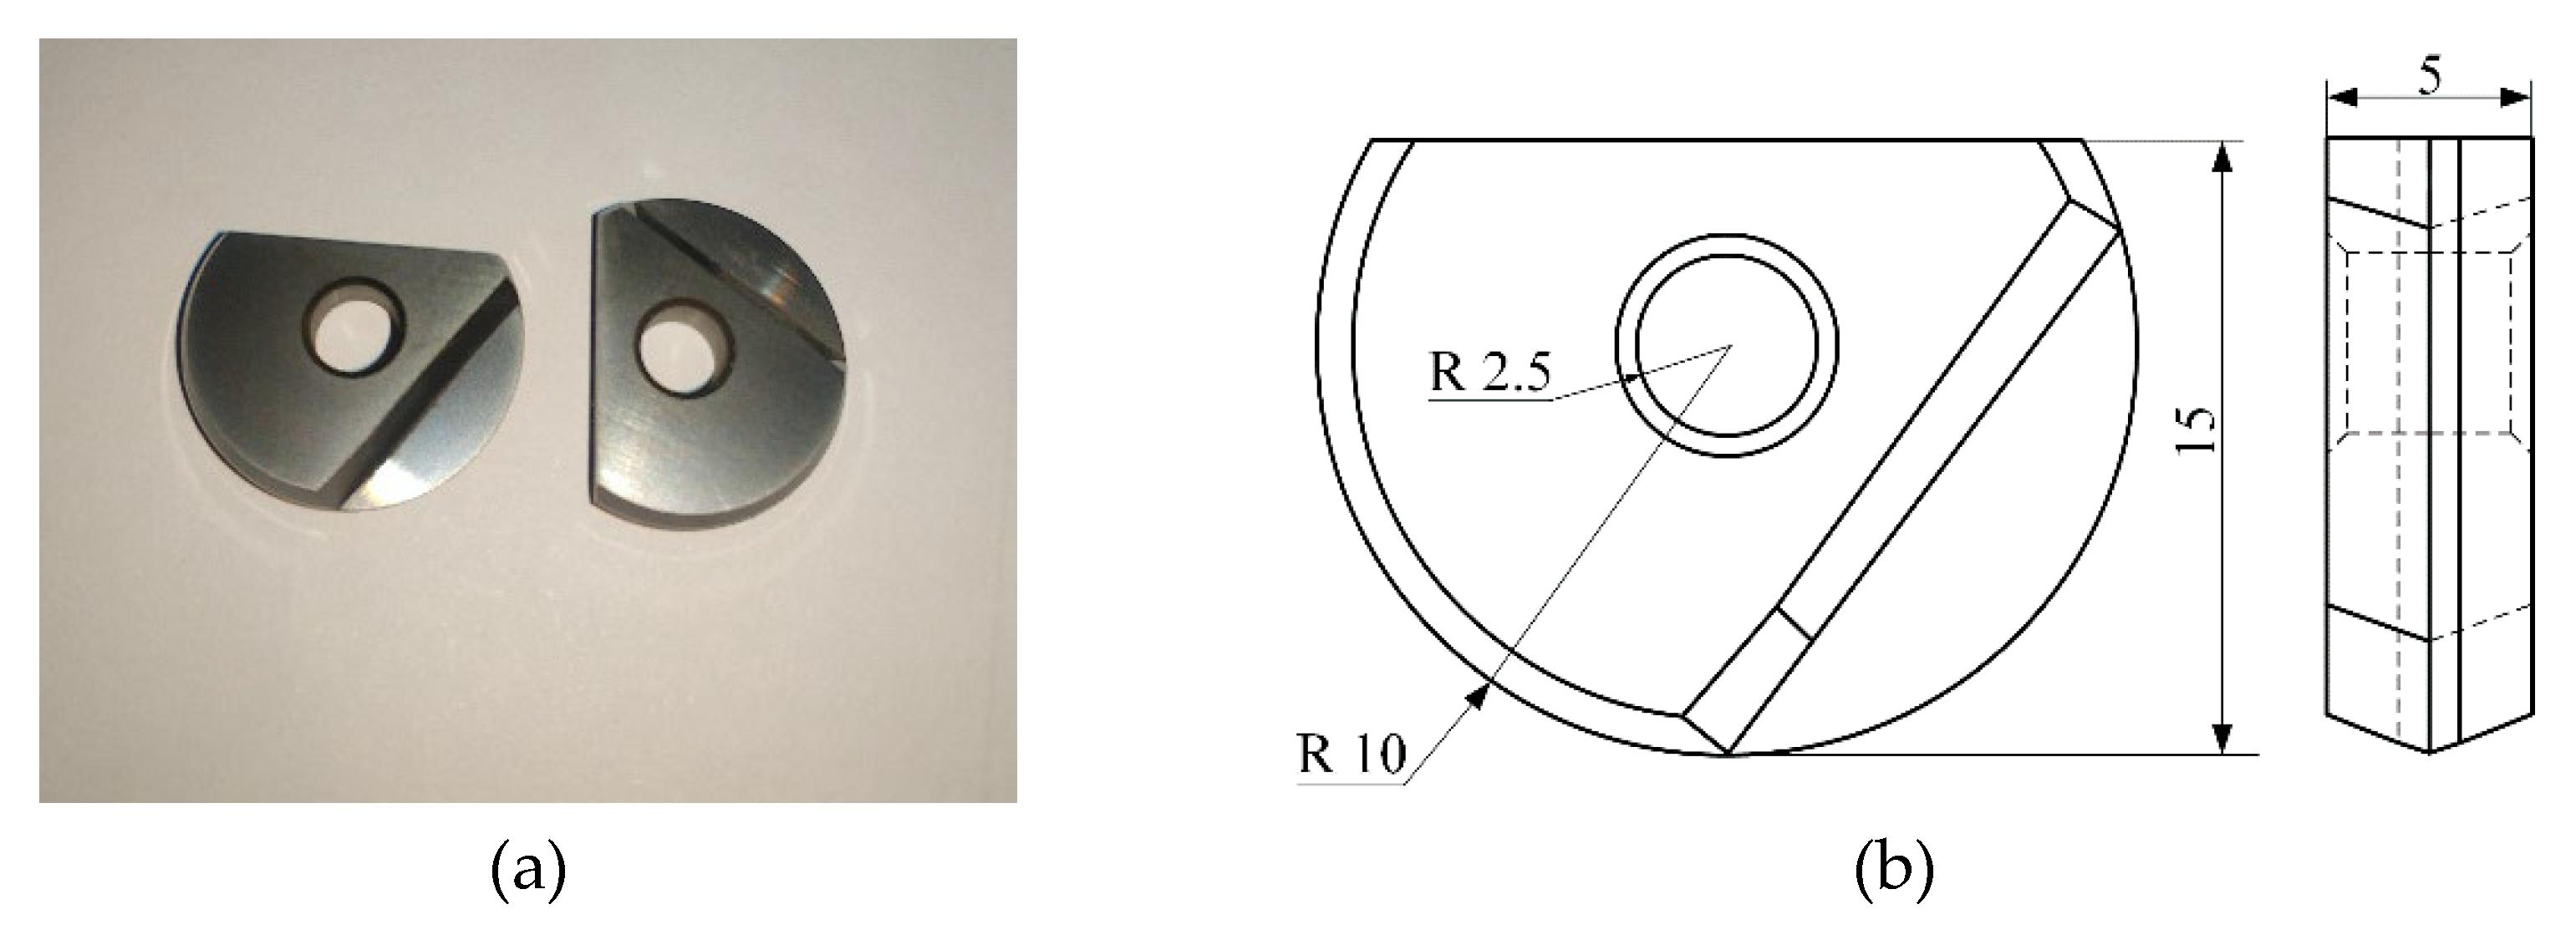
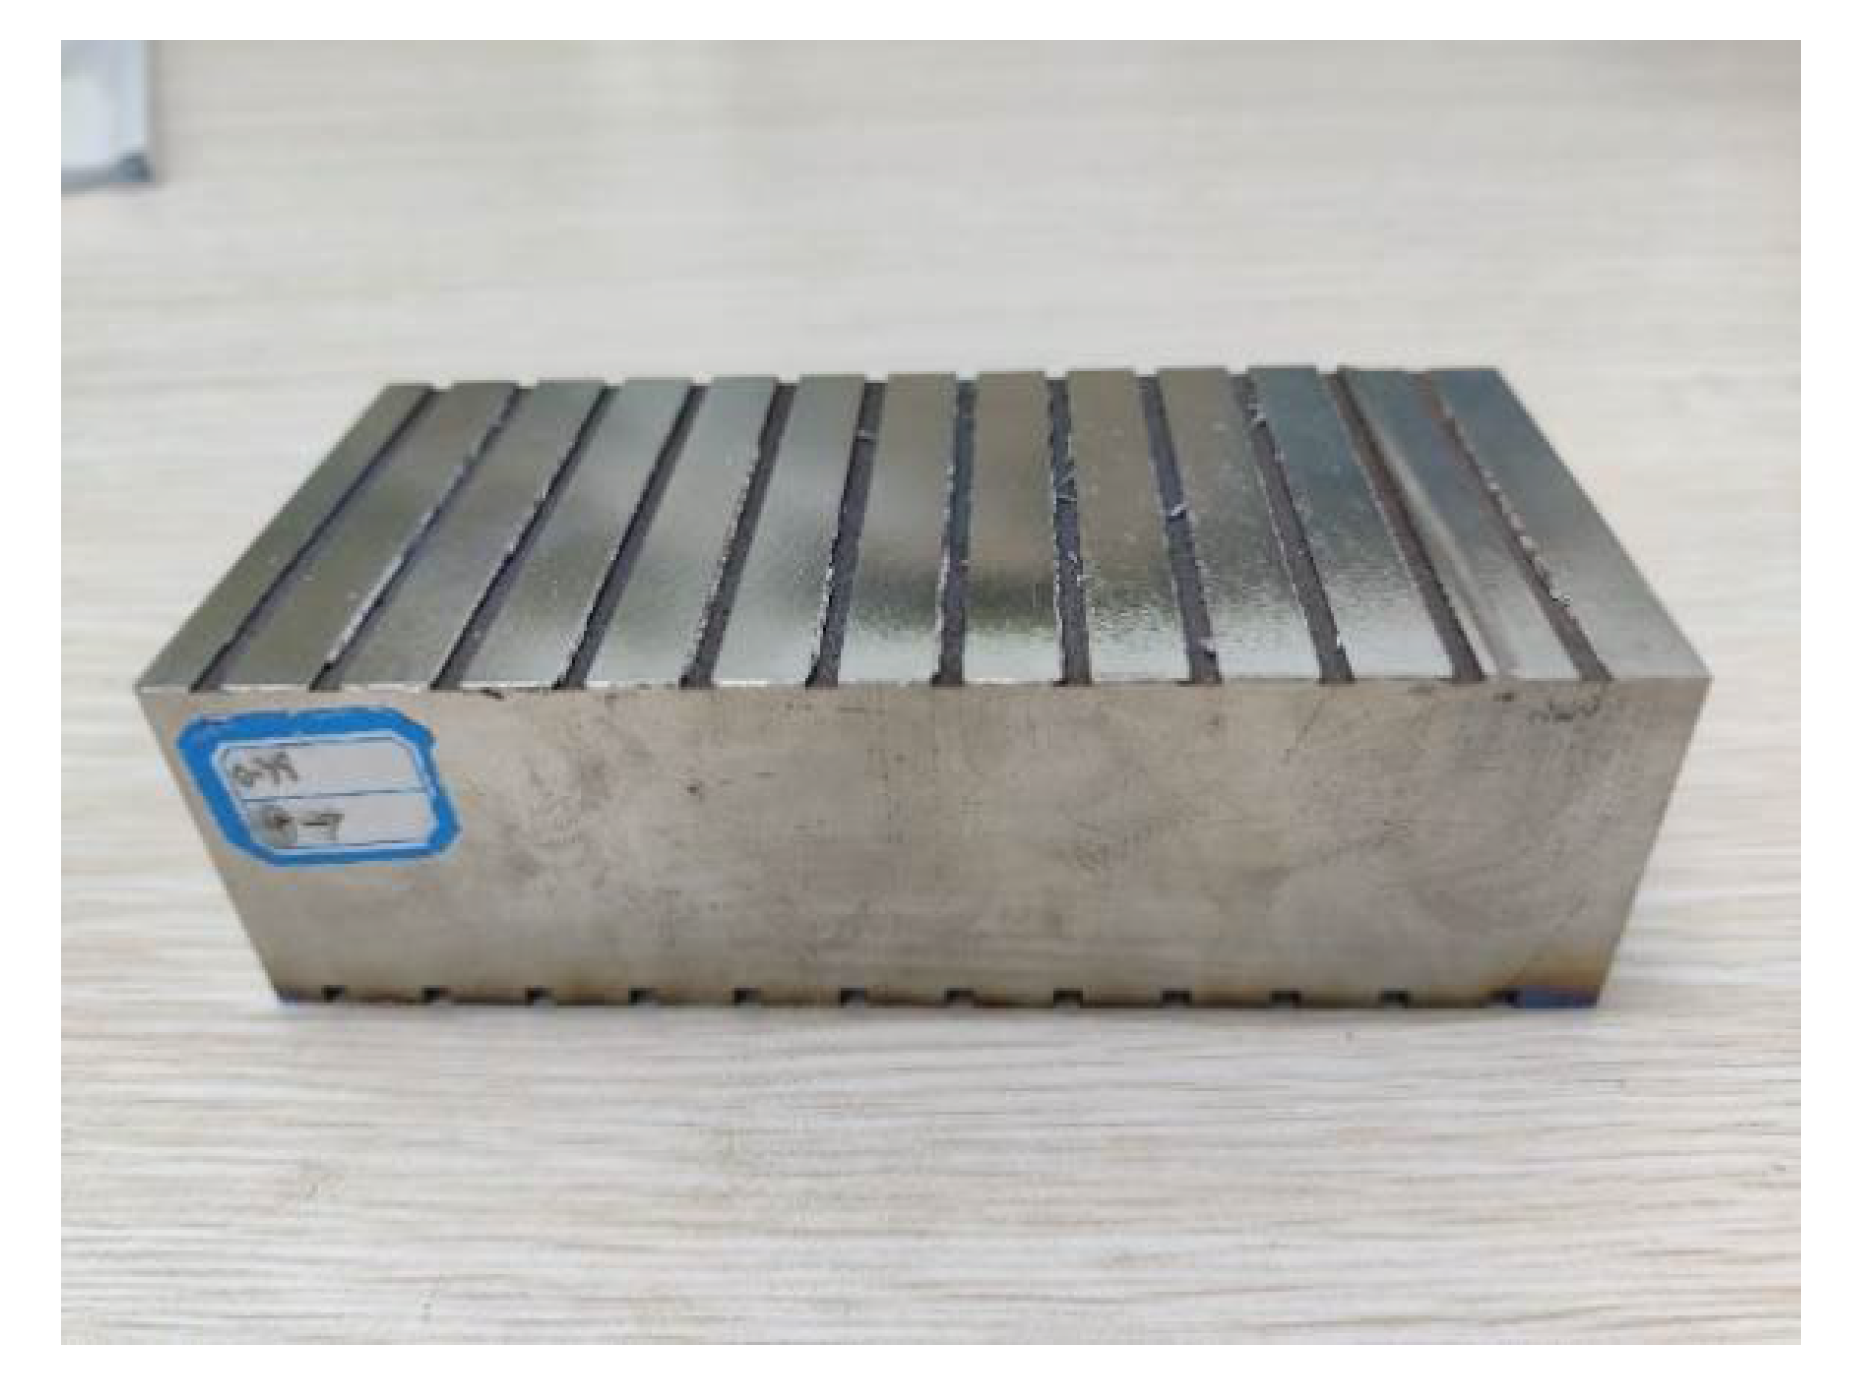
2.1. Tools and Workpieces
2.2. Orthogonal Experimental Design
2.3. Construction of the Experiment Platform
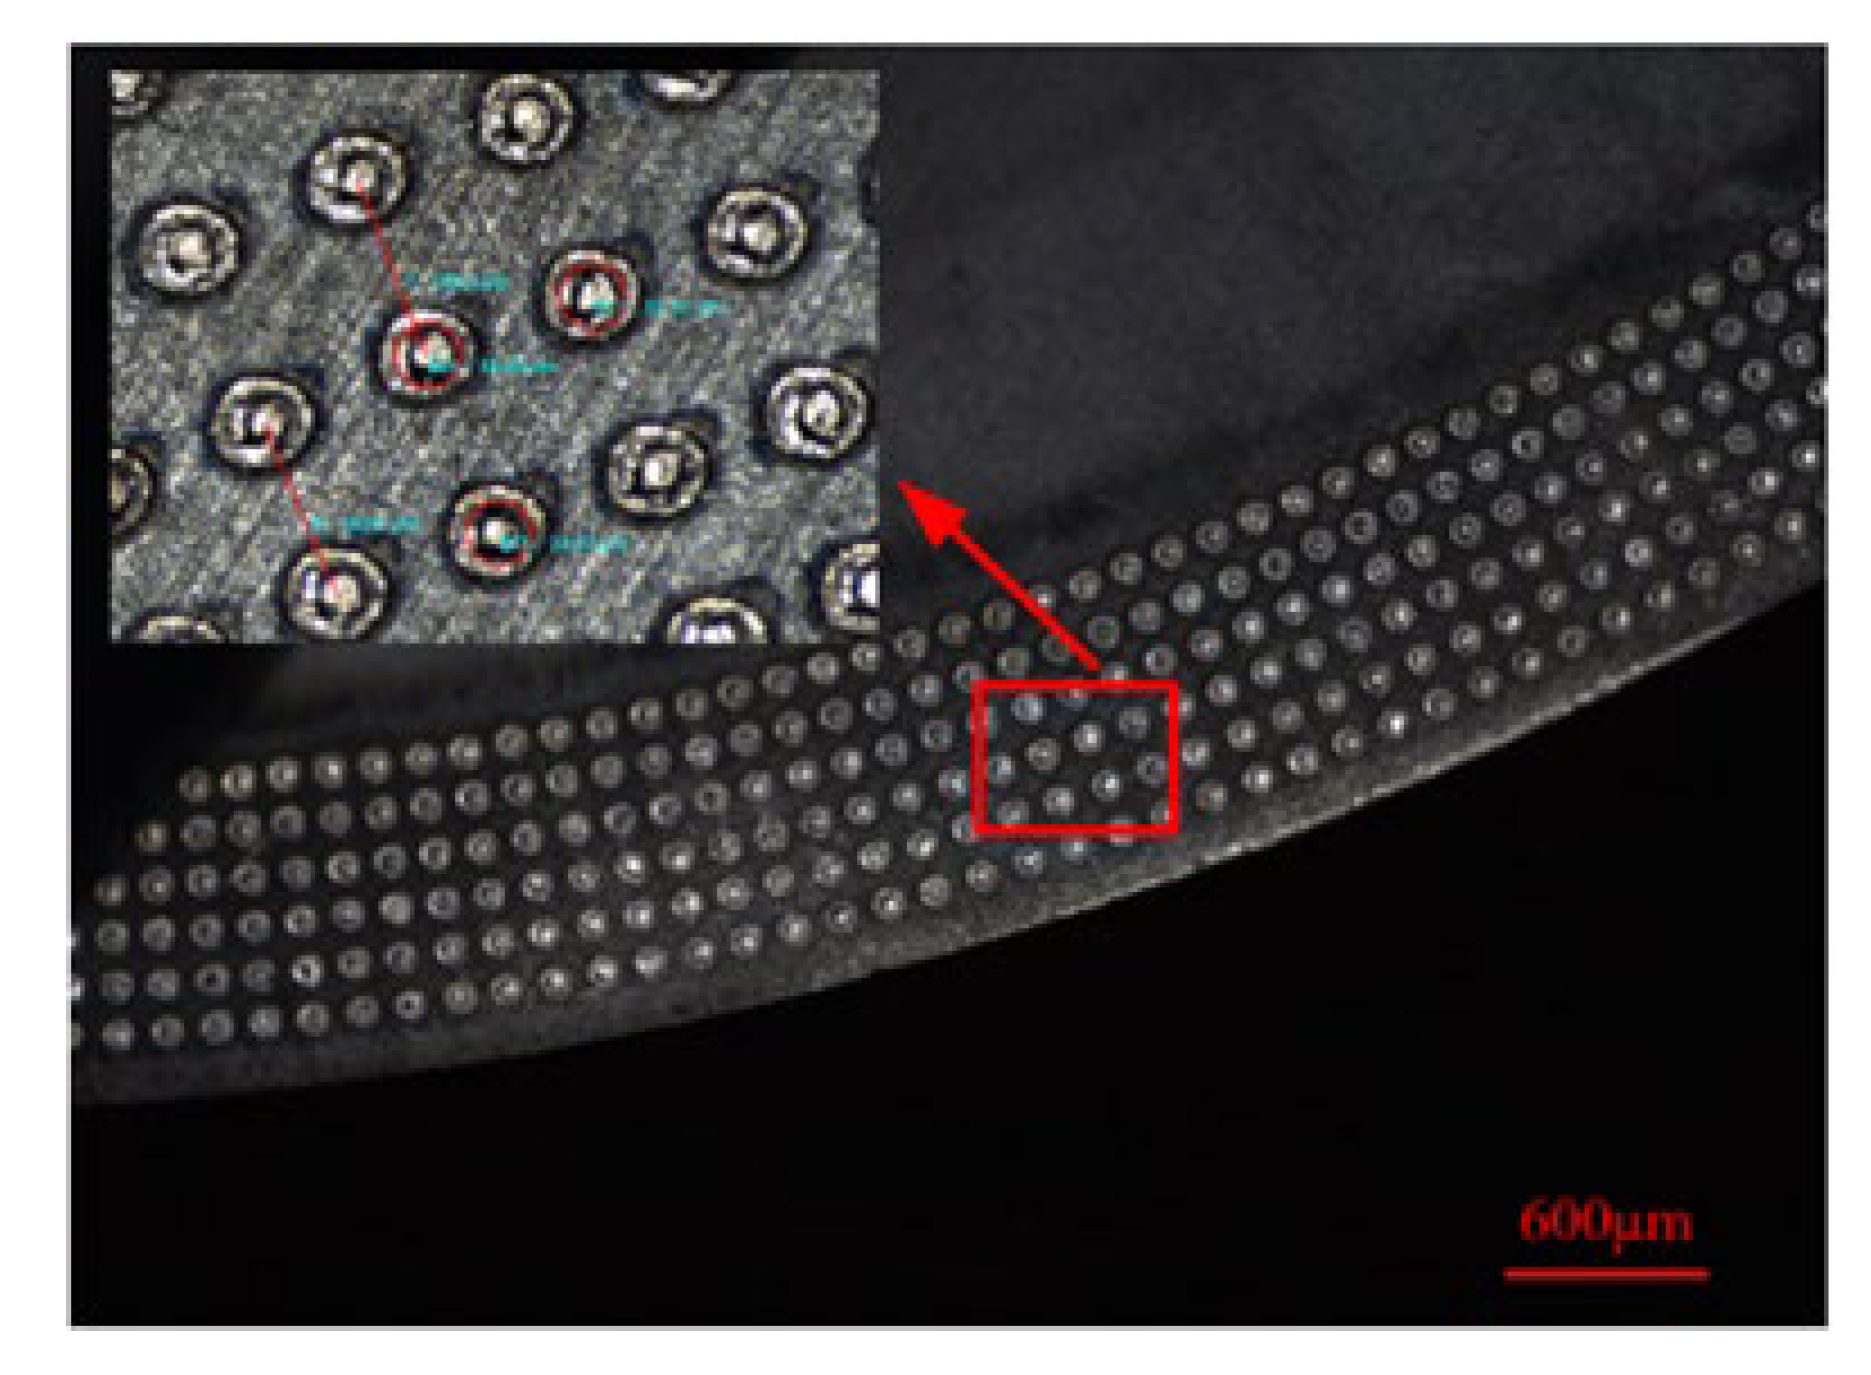
- (1)
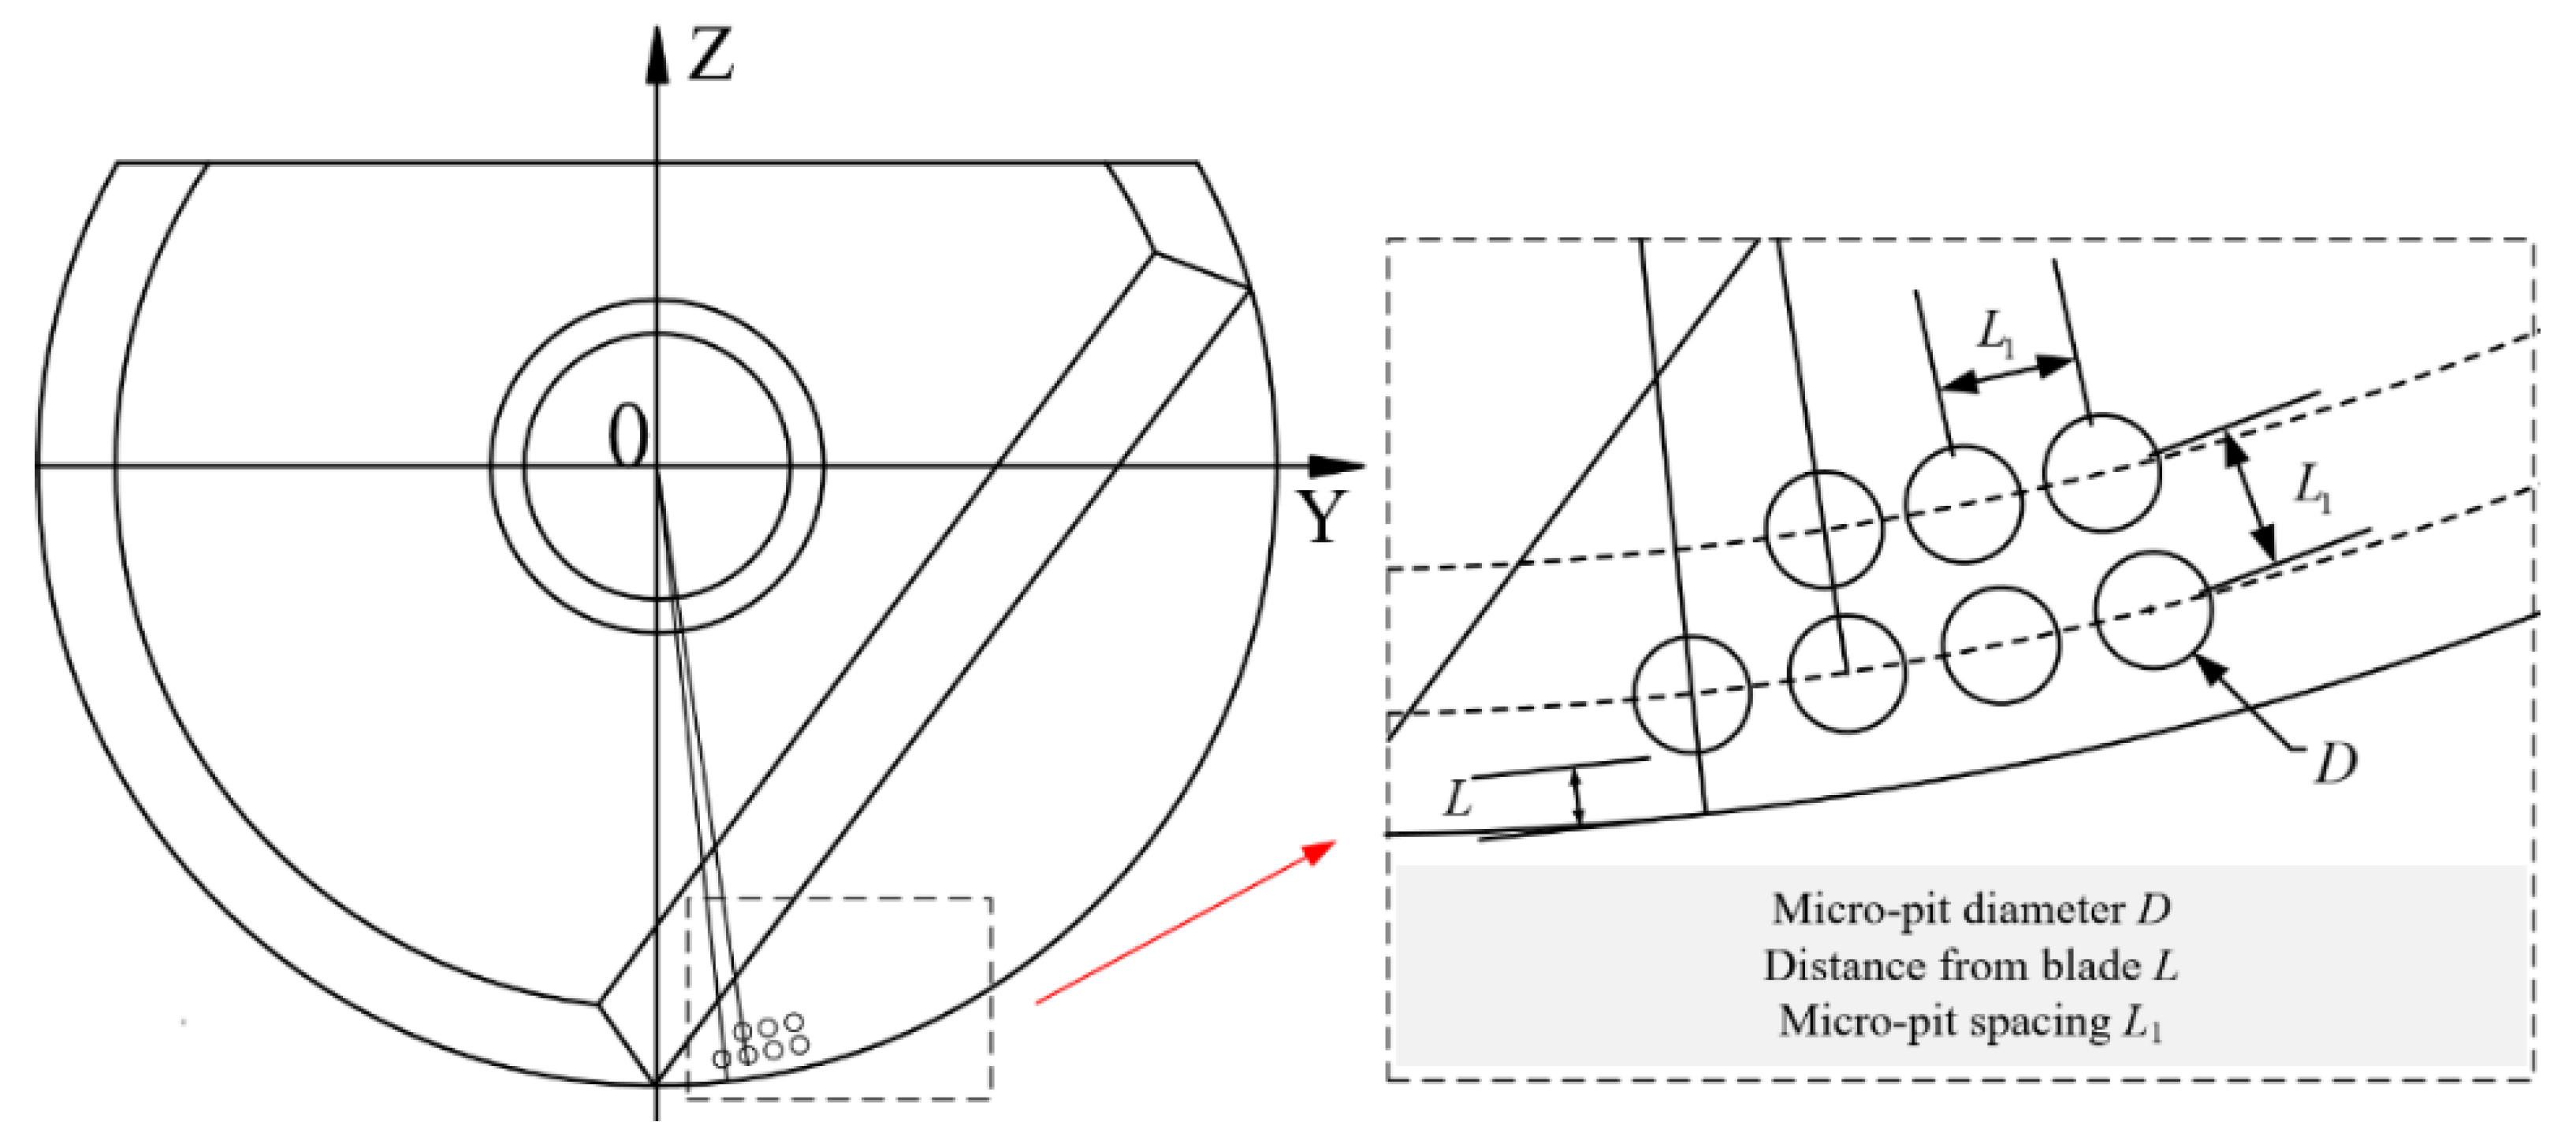
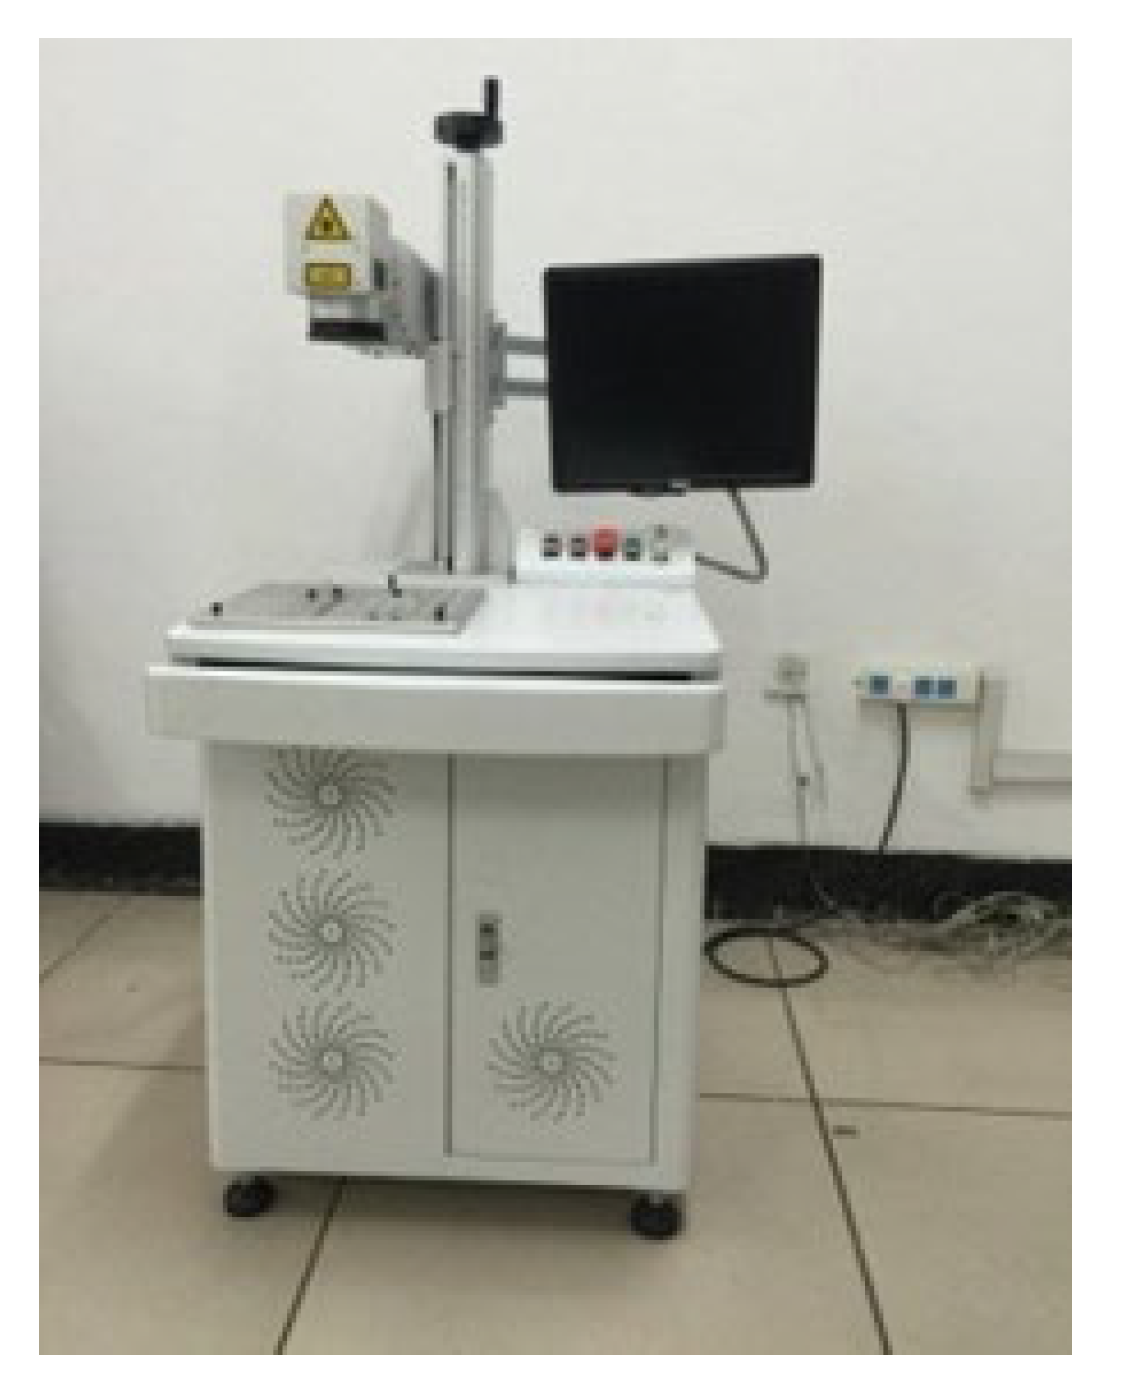
- Tool micro-texture preparation
- (2)
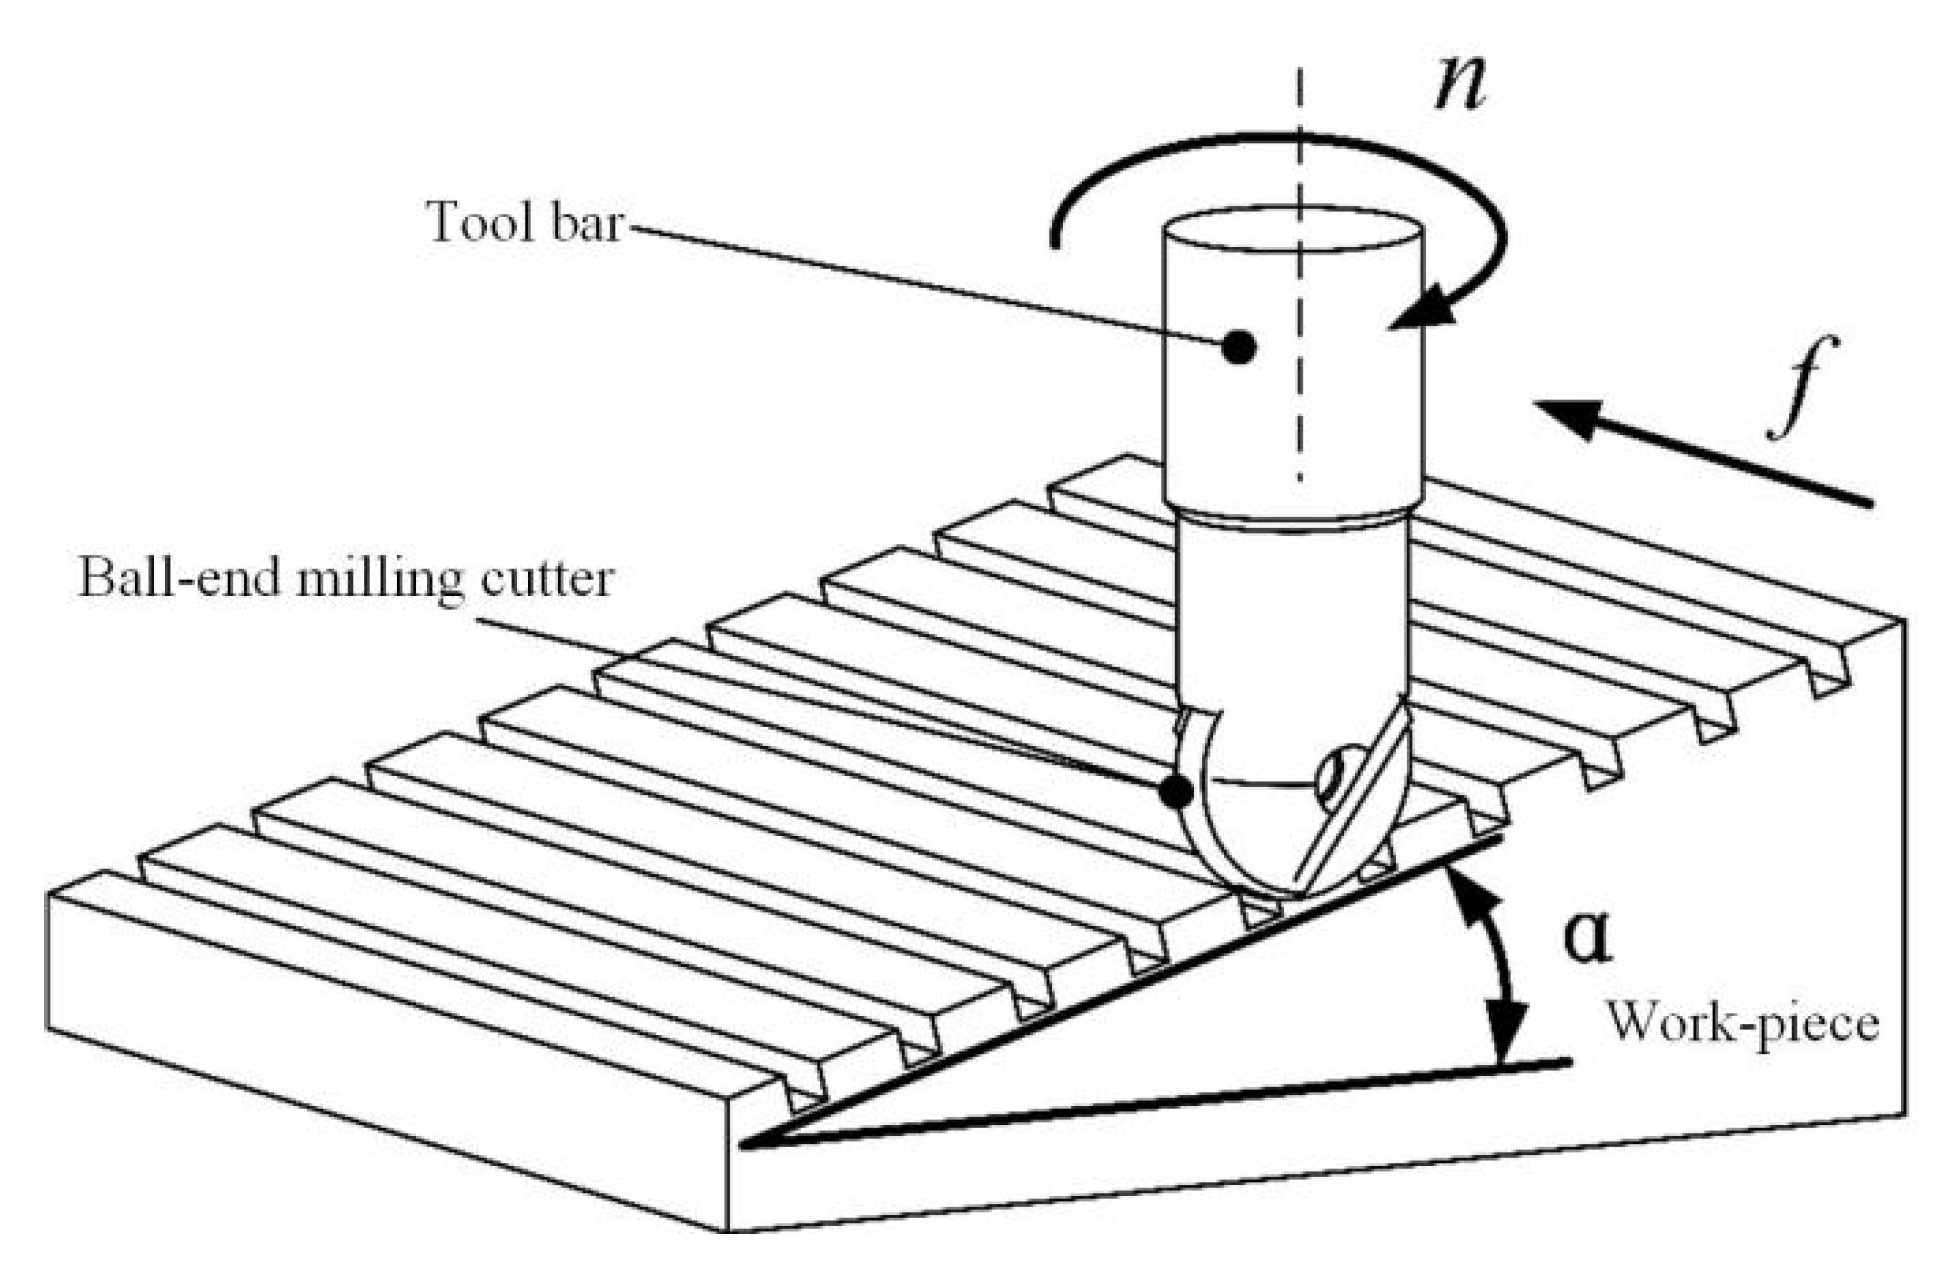
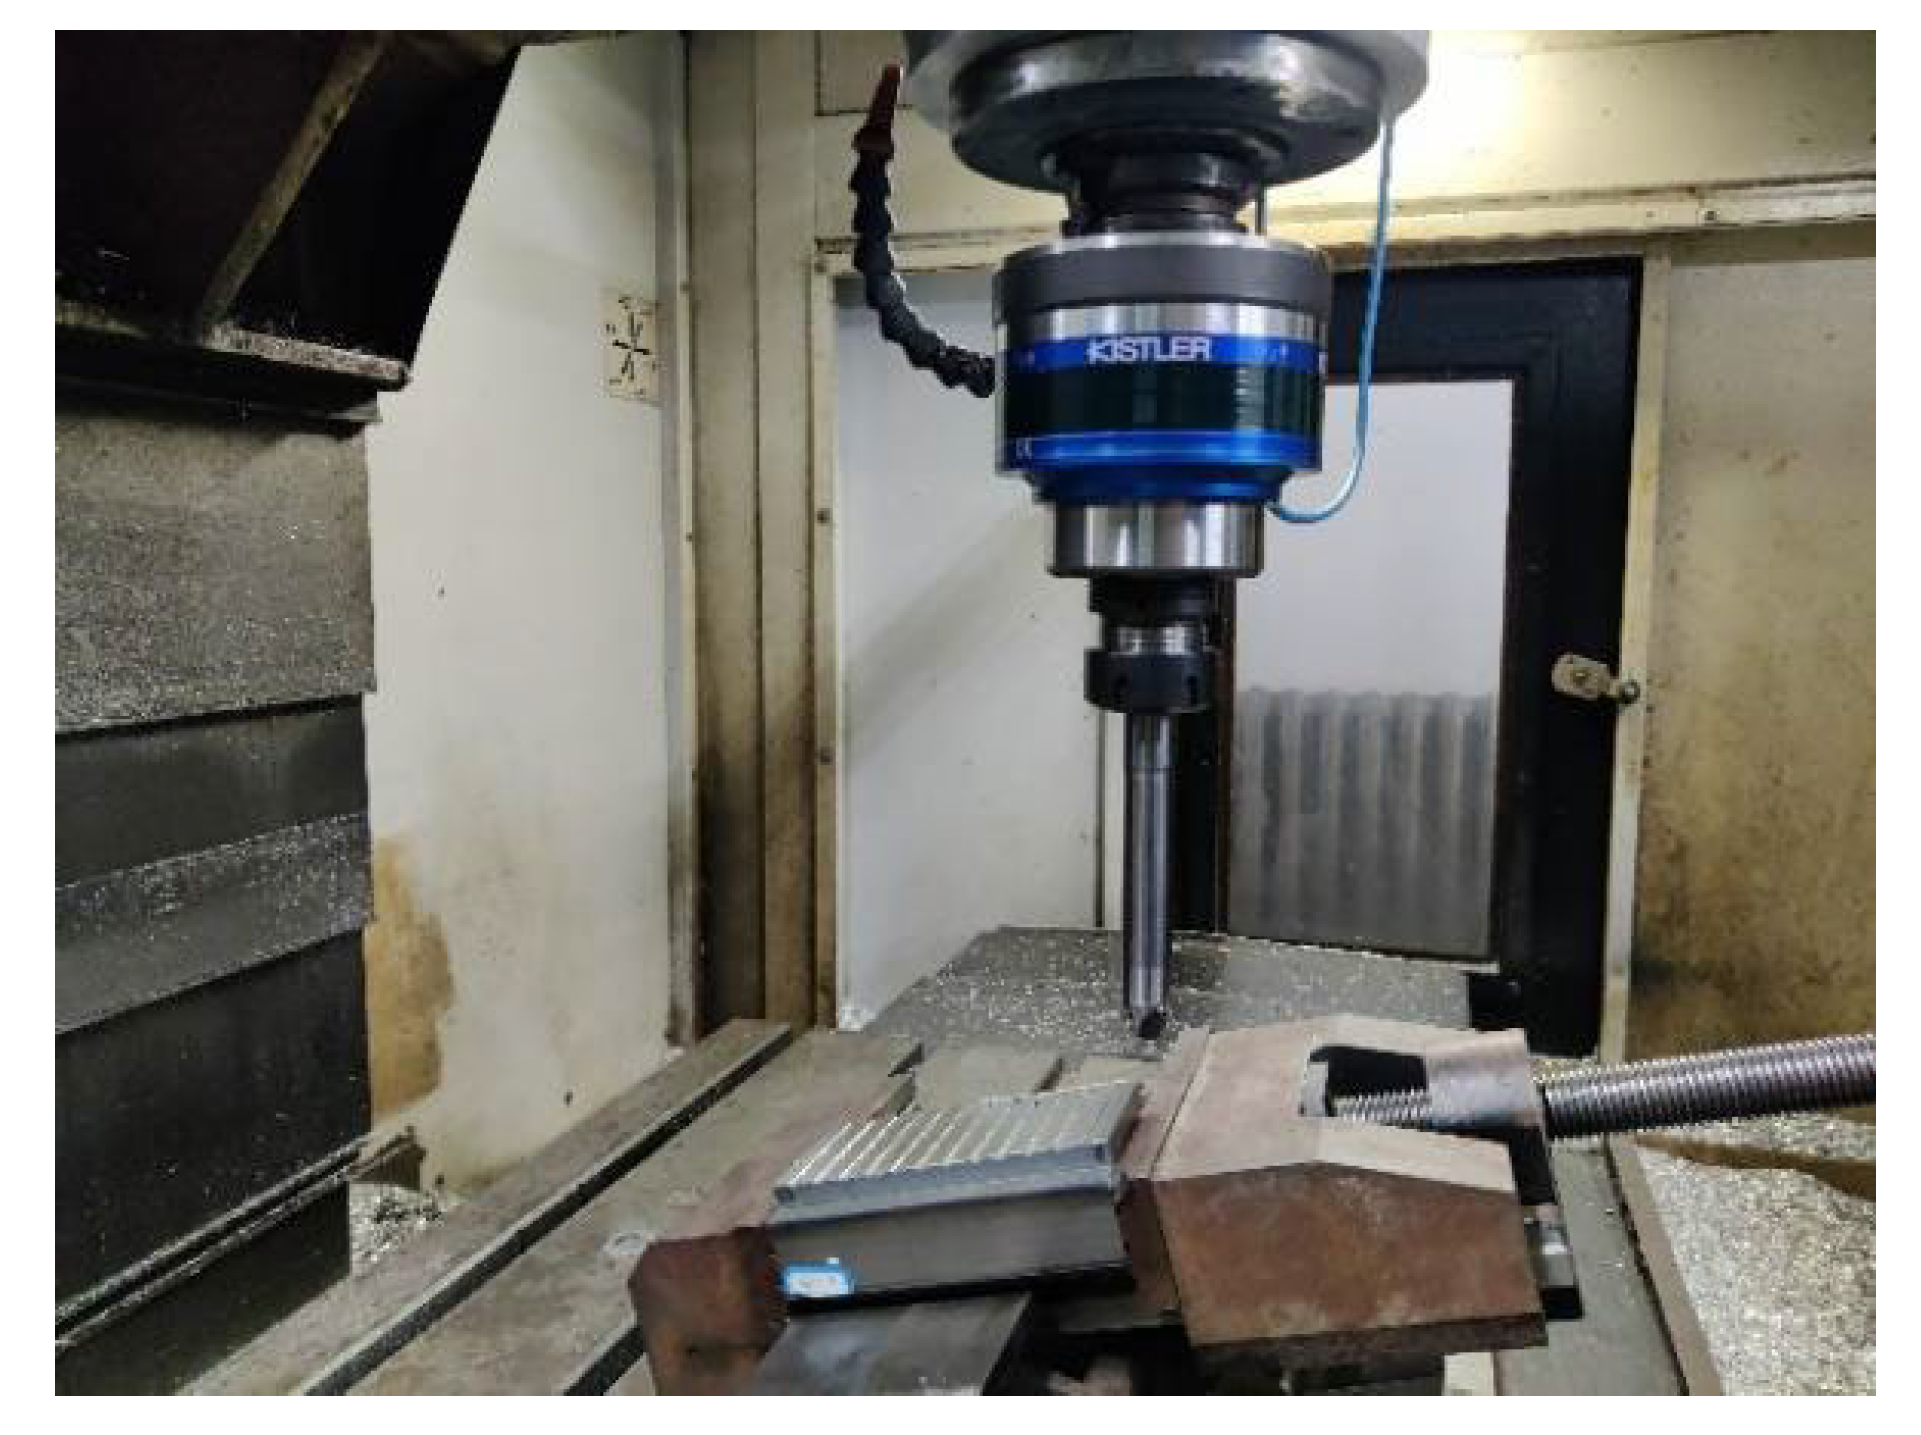
- Milling experimental platform
- (3)
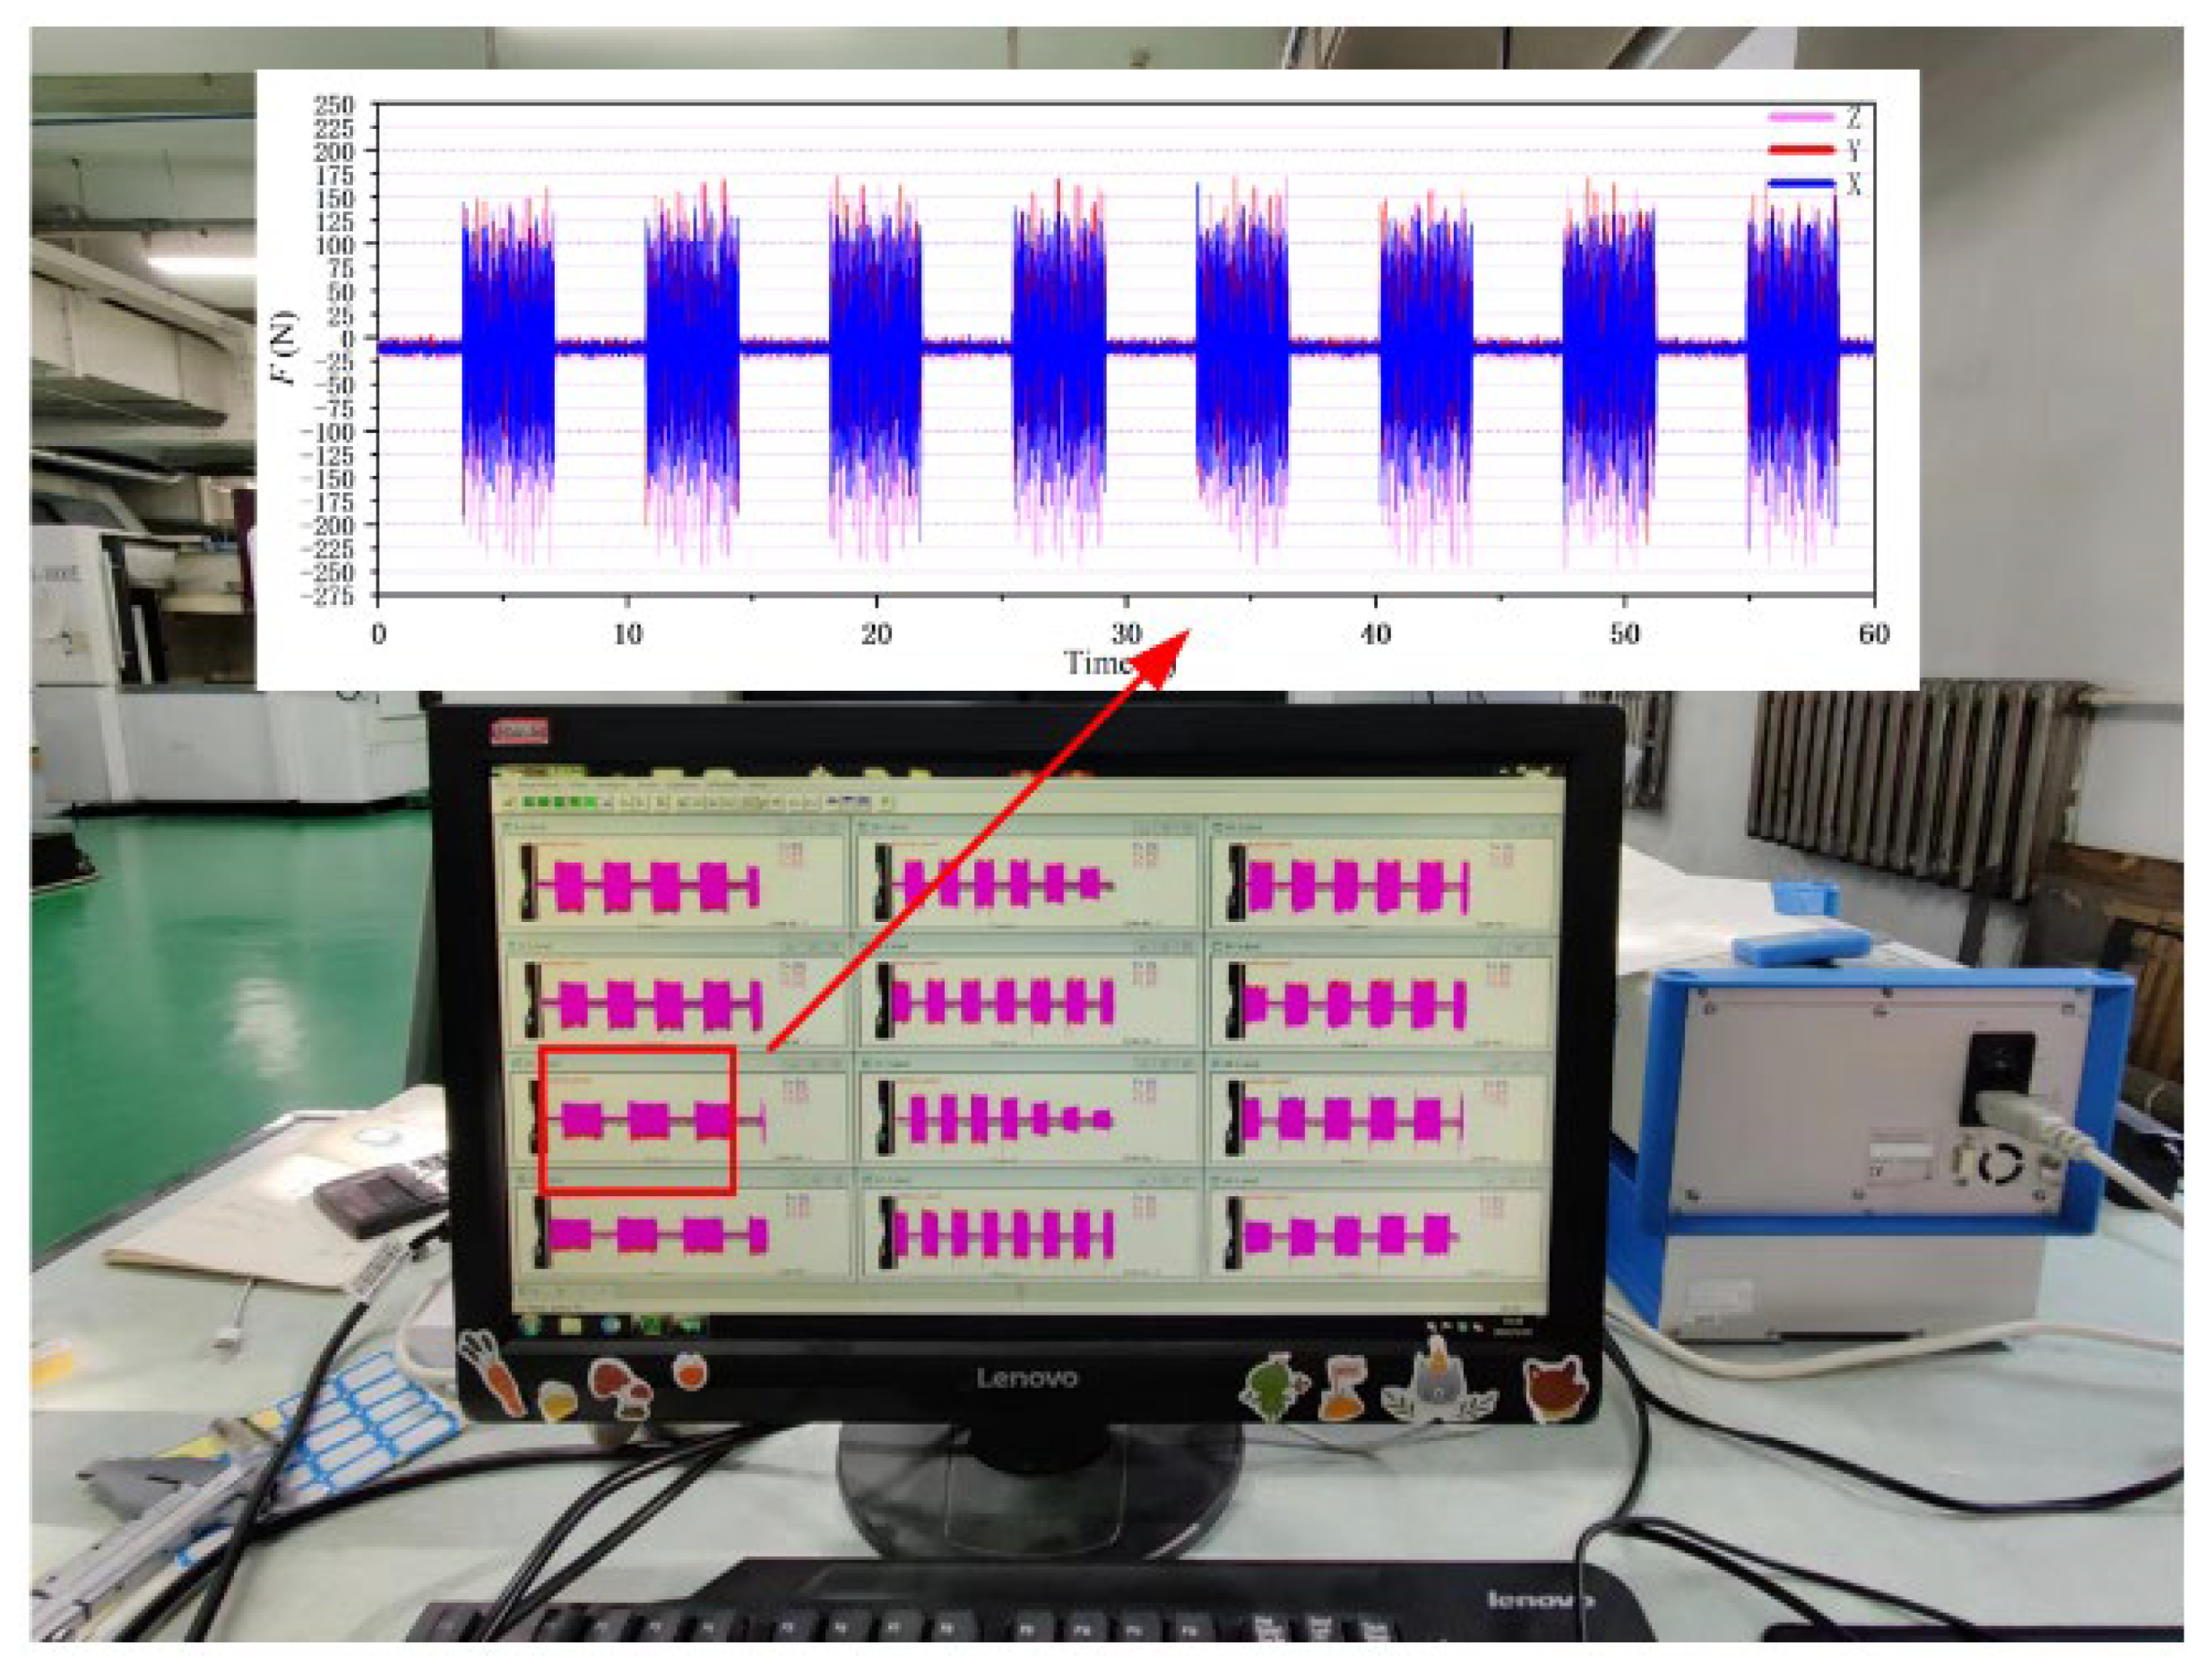
- Detection equipment
3. Results and Discussion
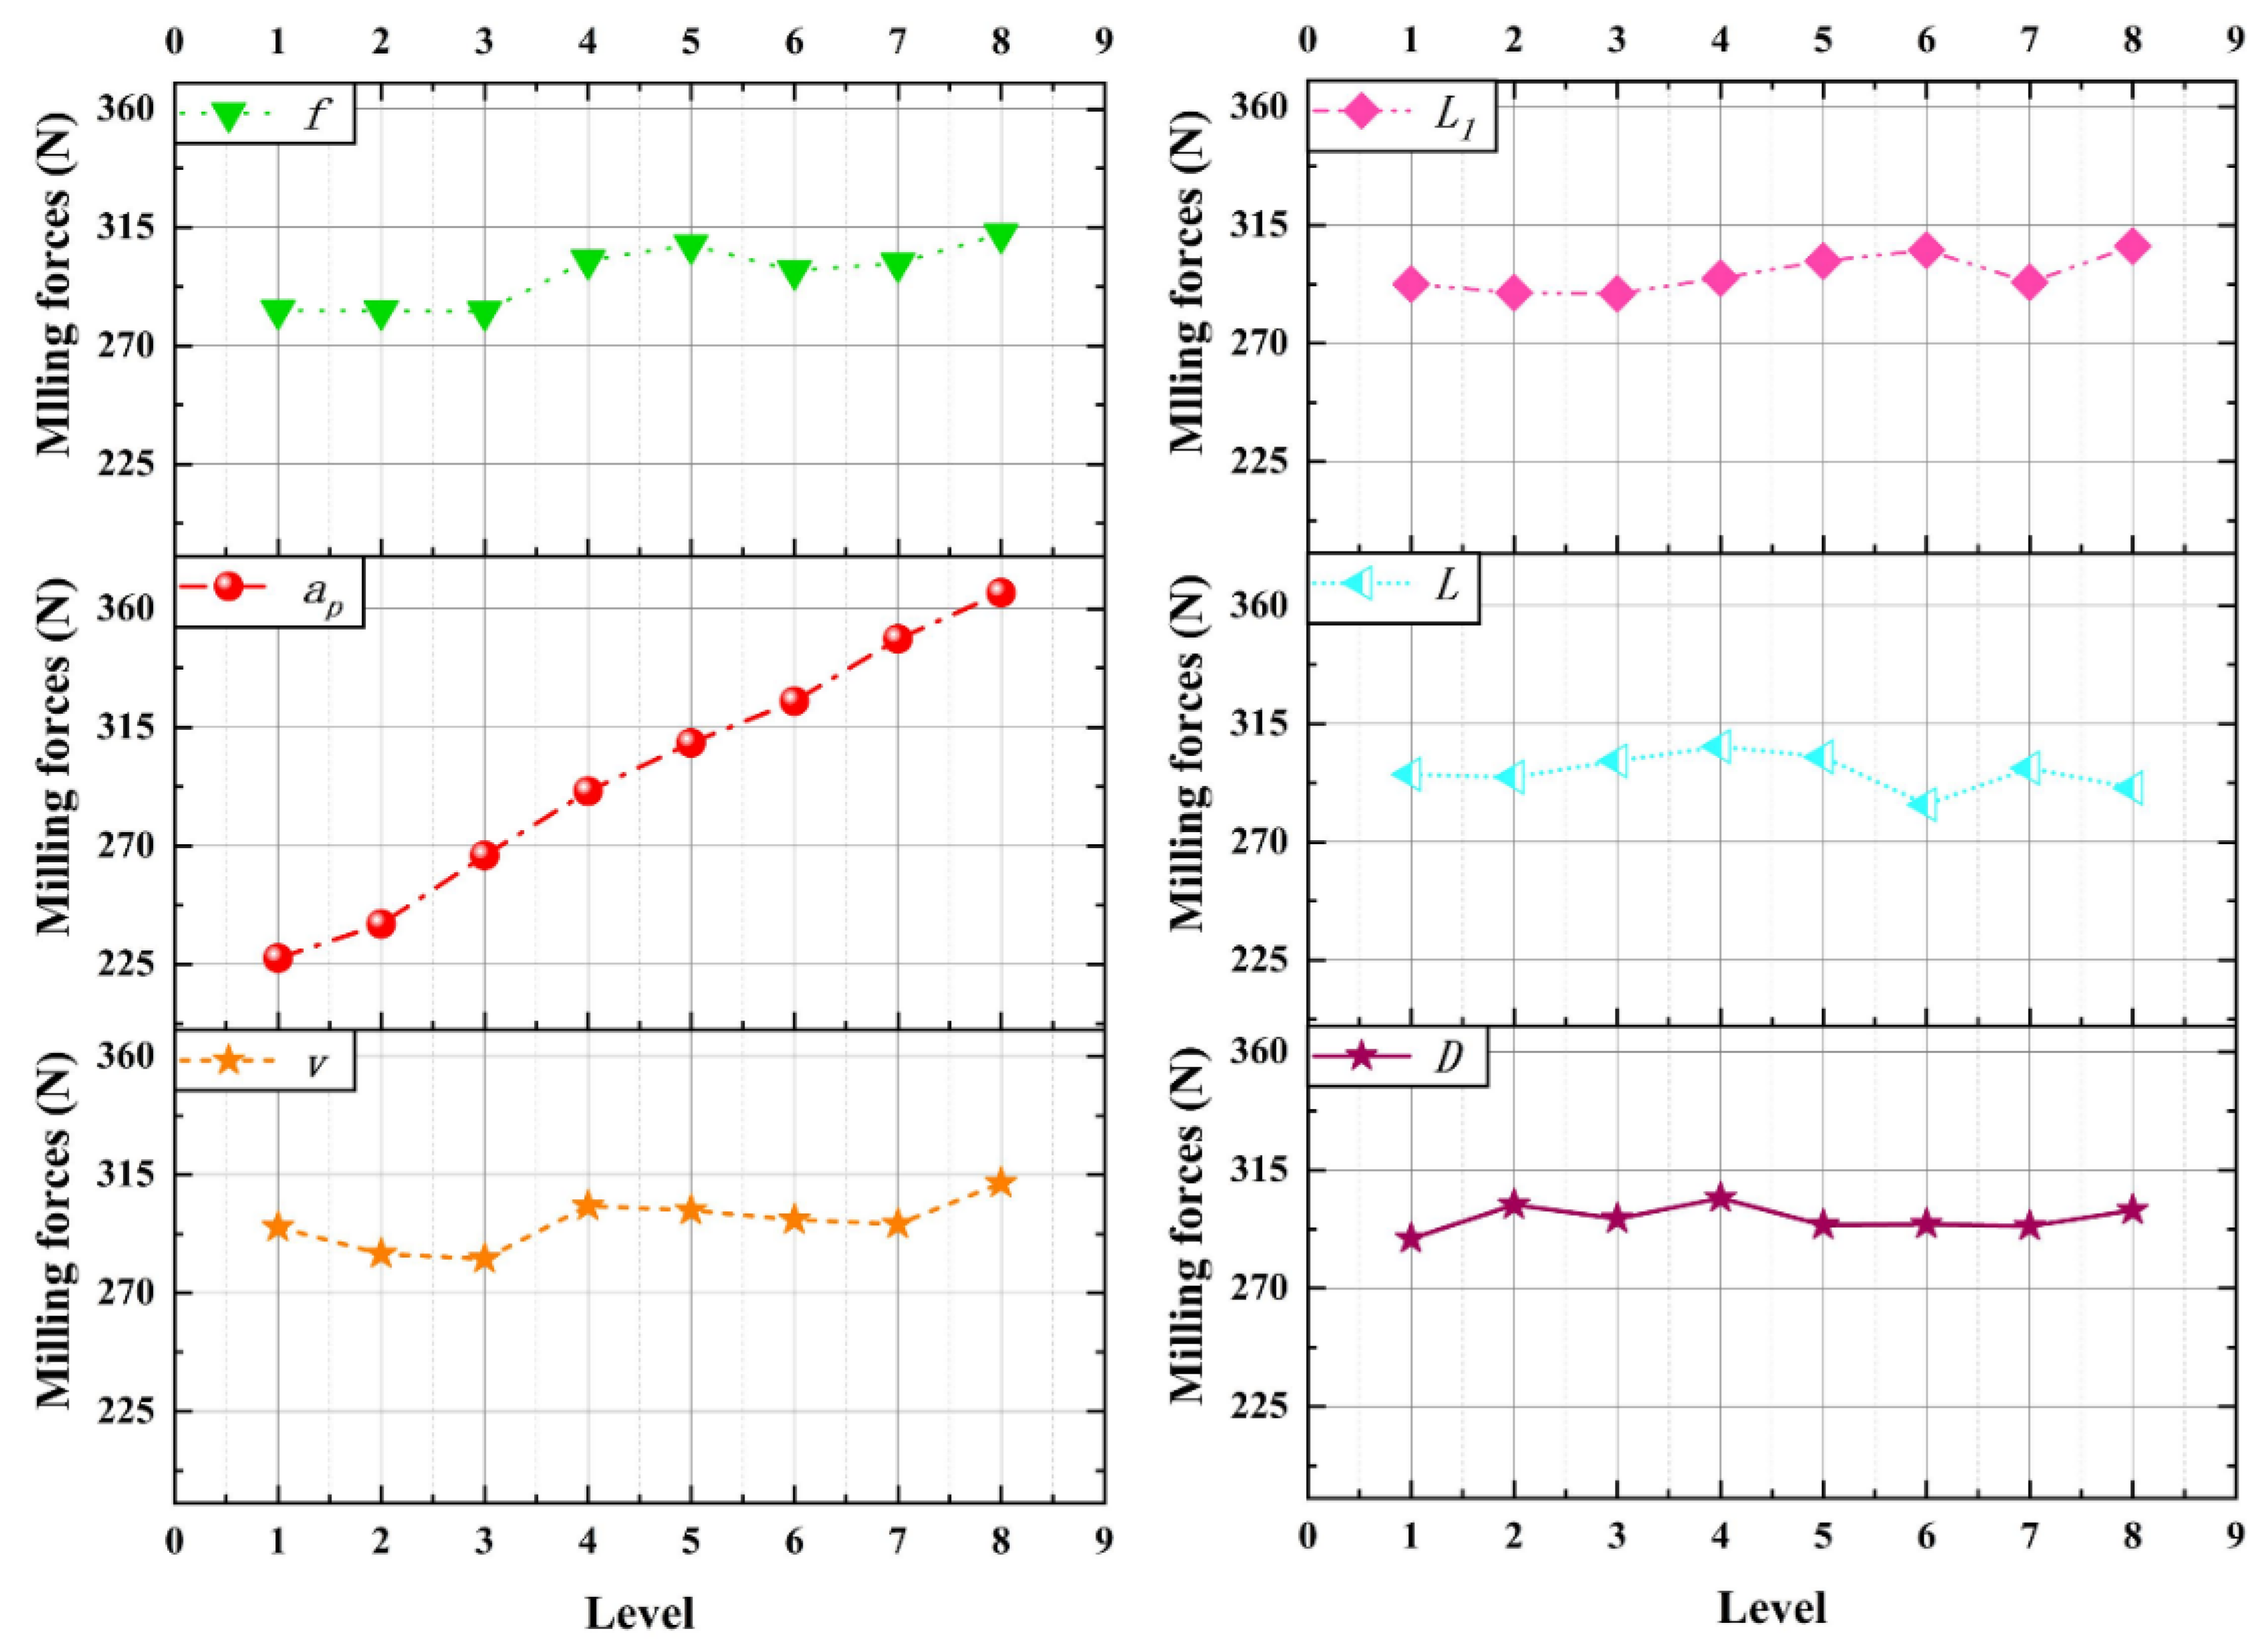
3.1. Result Analysis of Milling Force
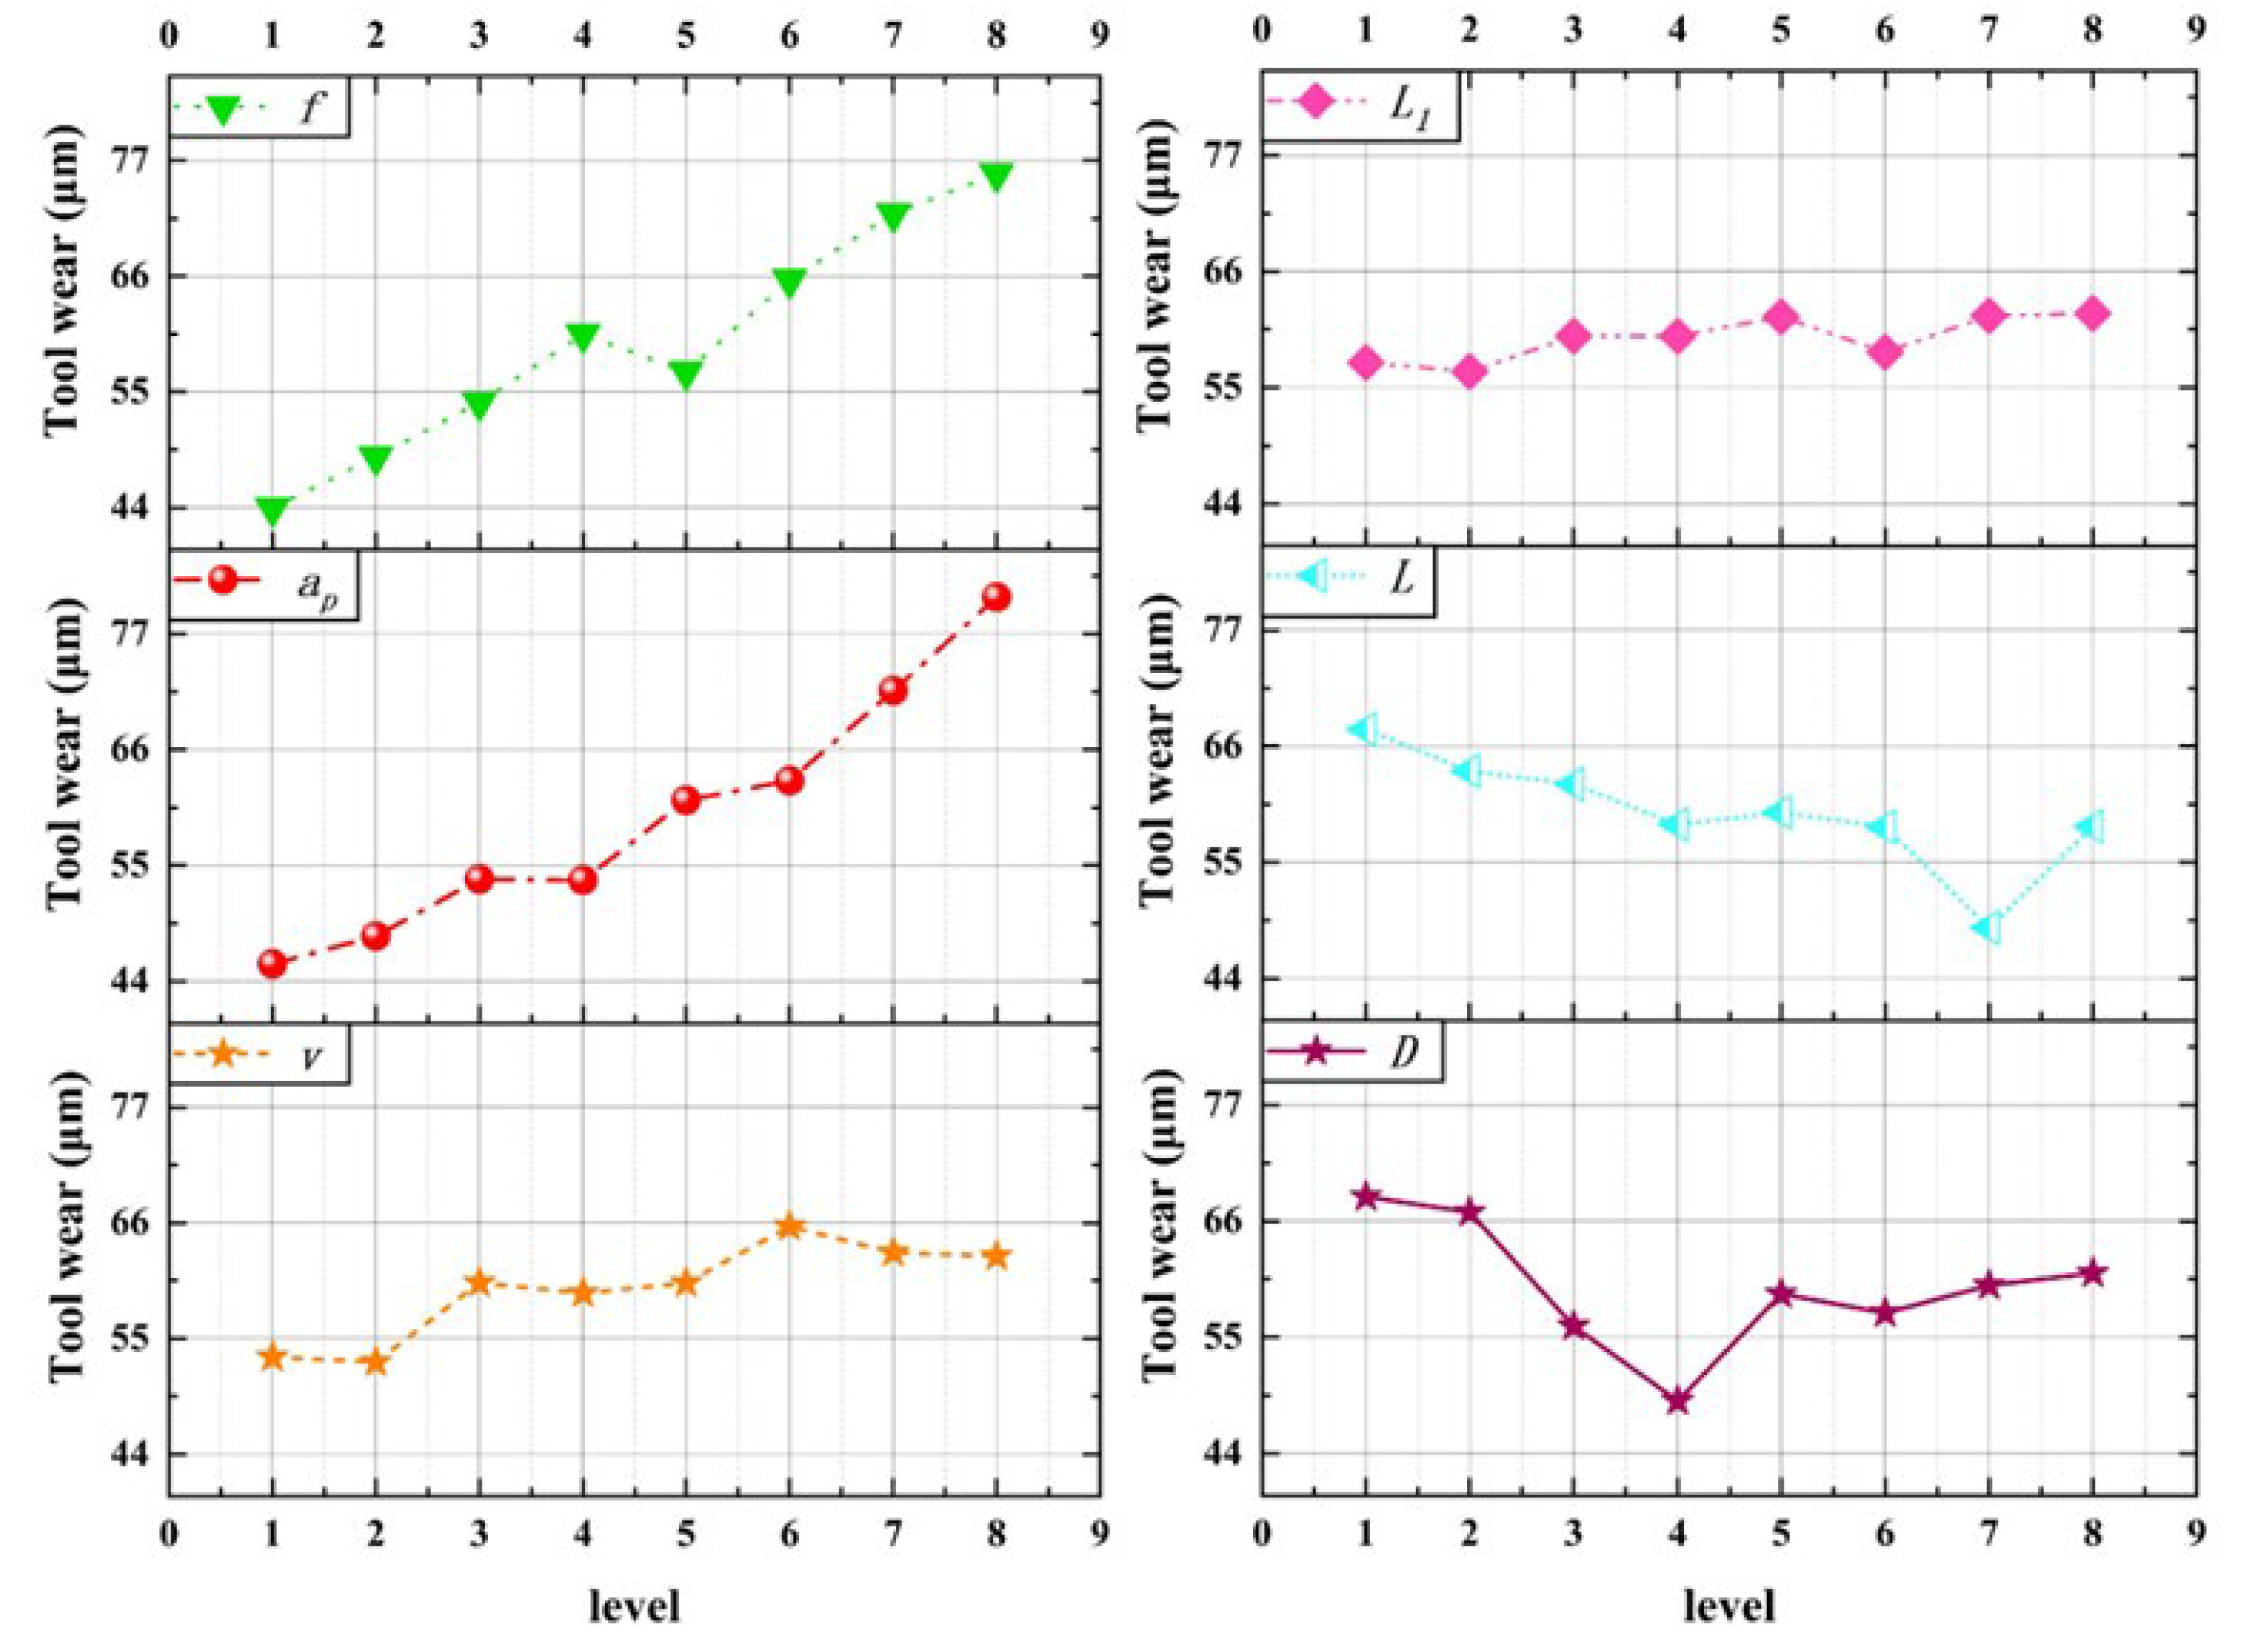
3.2. Analysis of Tool Wear Results
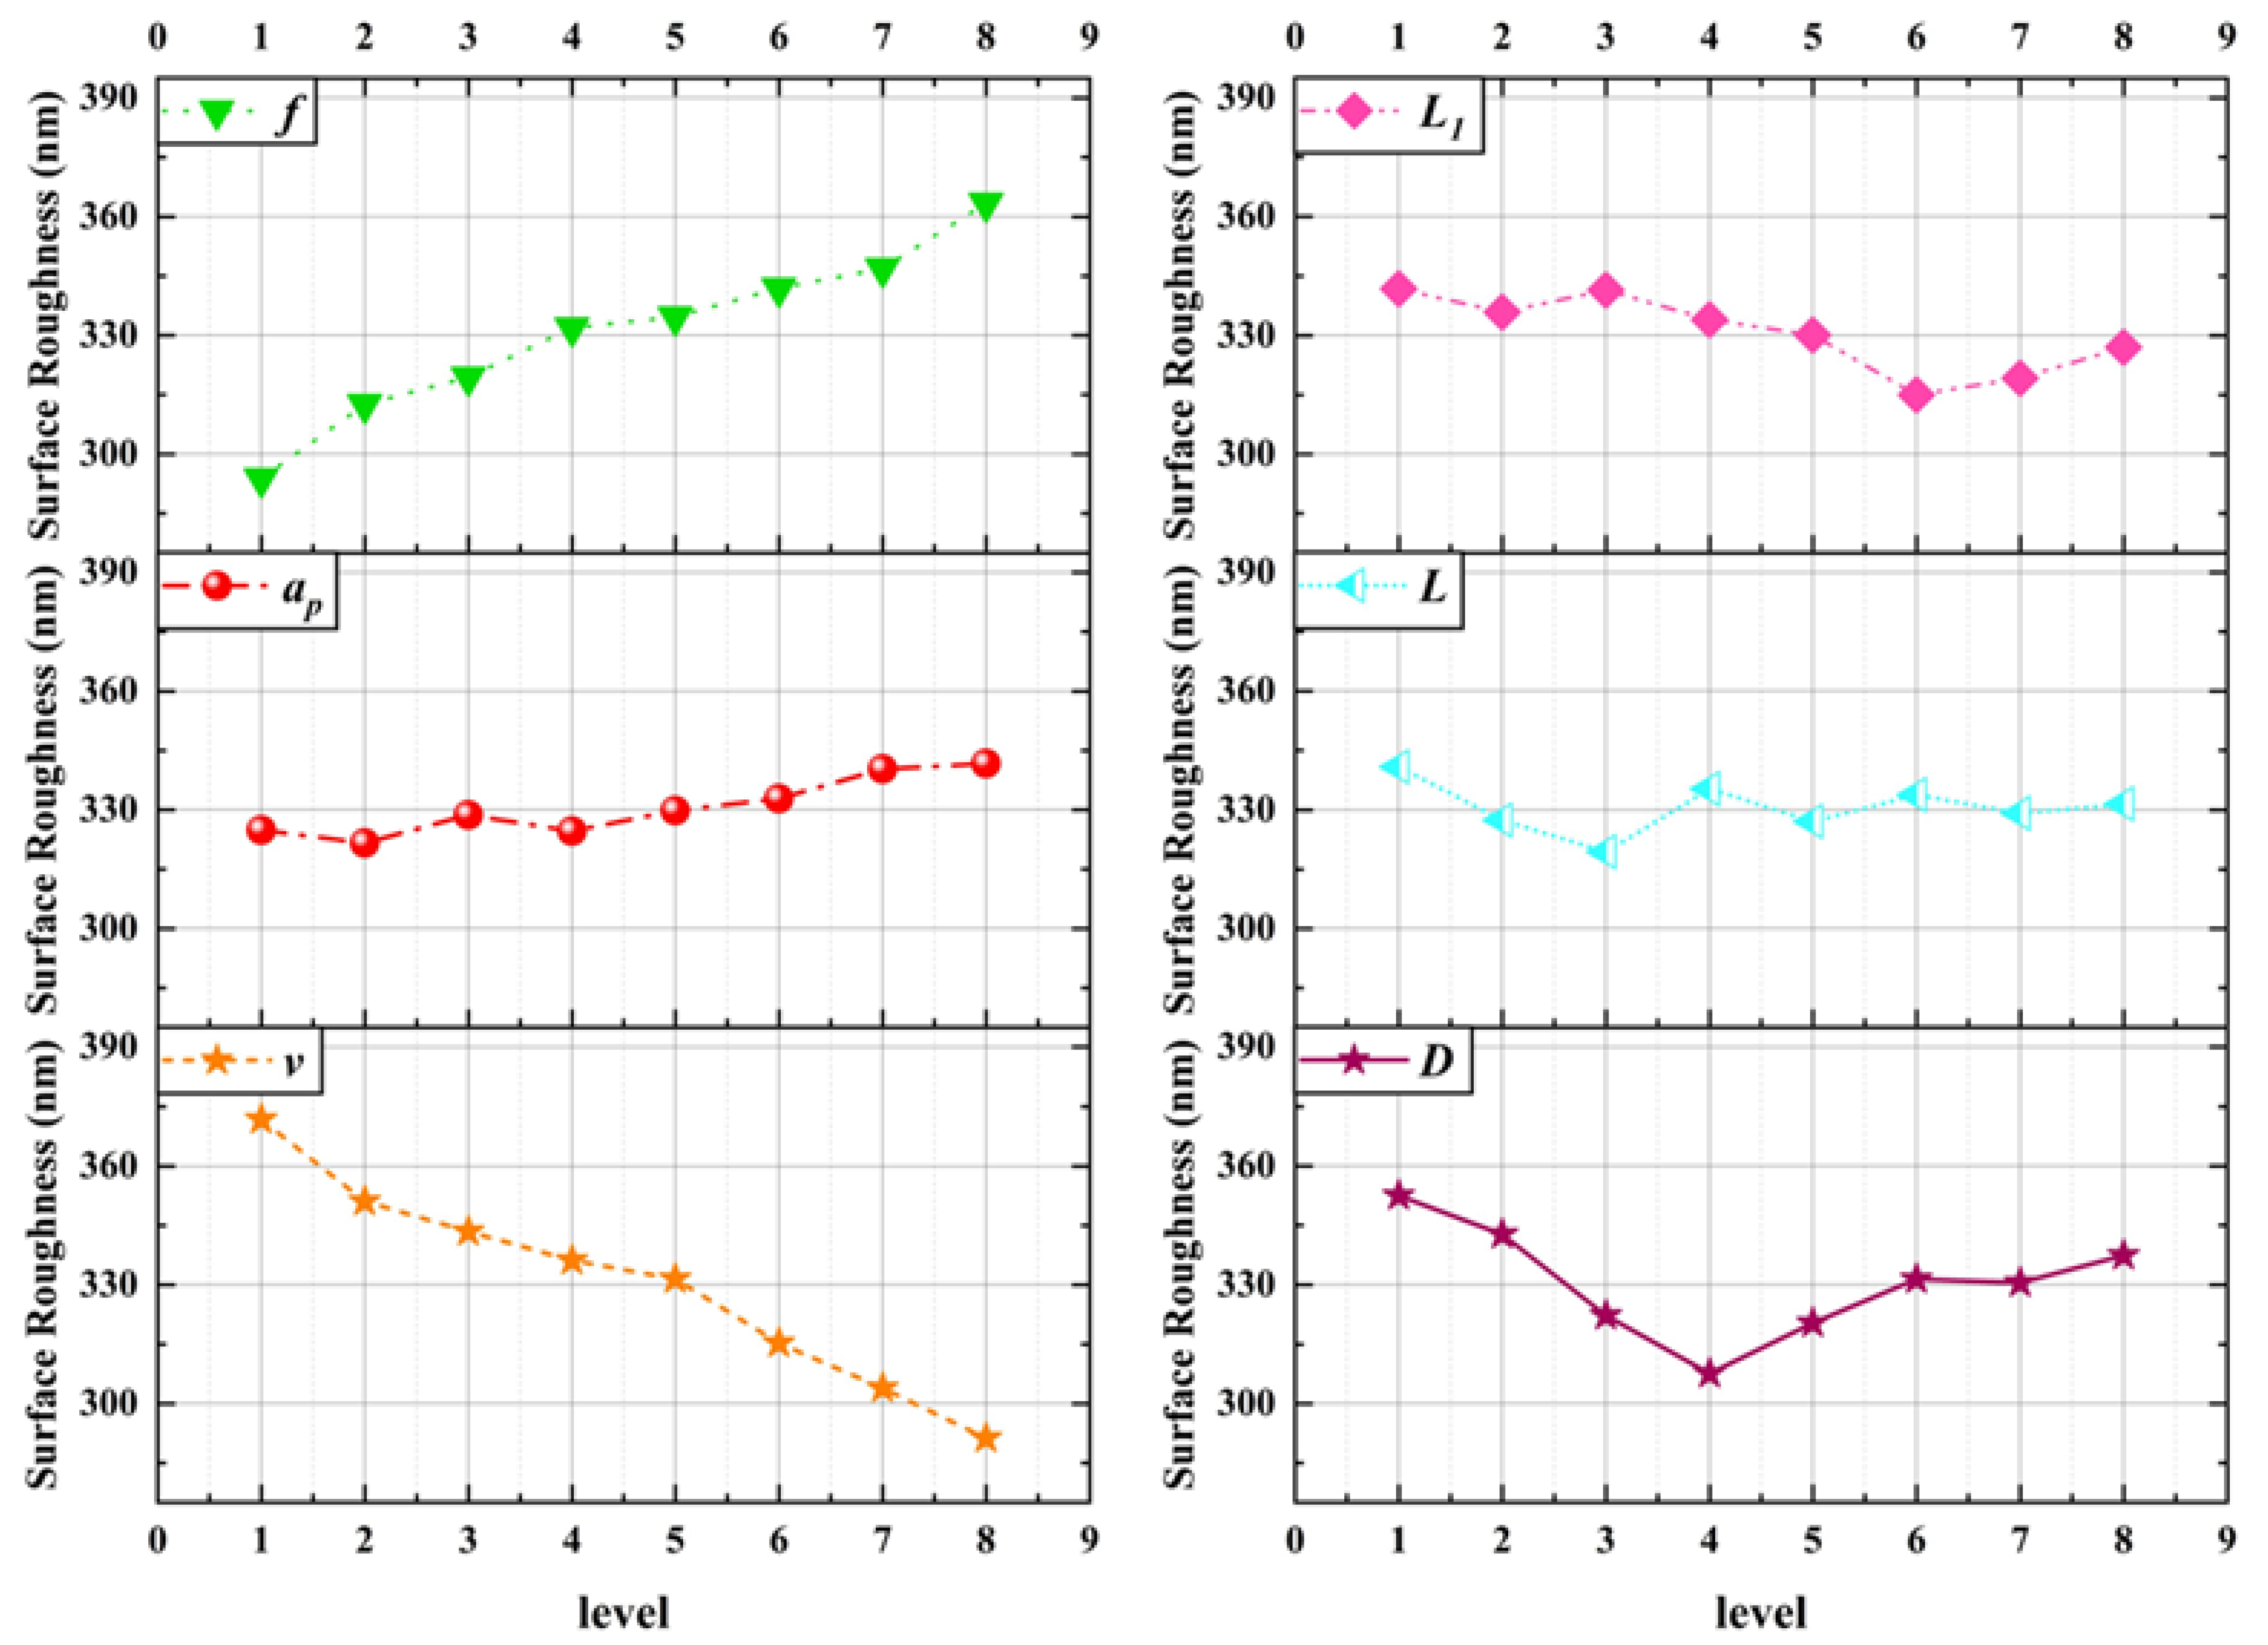
3.3. Result Analysis of Workpiece Surface Roughness
4. Regression Model and Parameter Optimization
4.1. Establishment of the Prediction Model
- (1)
- Empirical regression model
- (2)
- Multiple linear regression model
- (3)
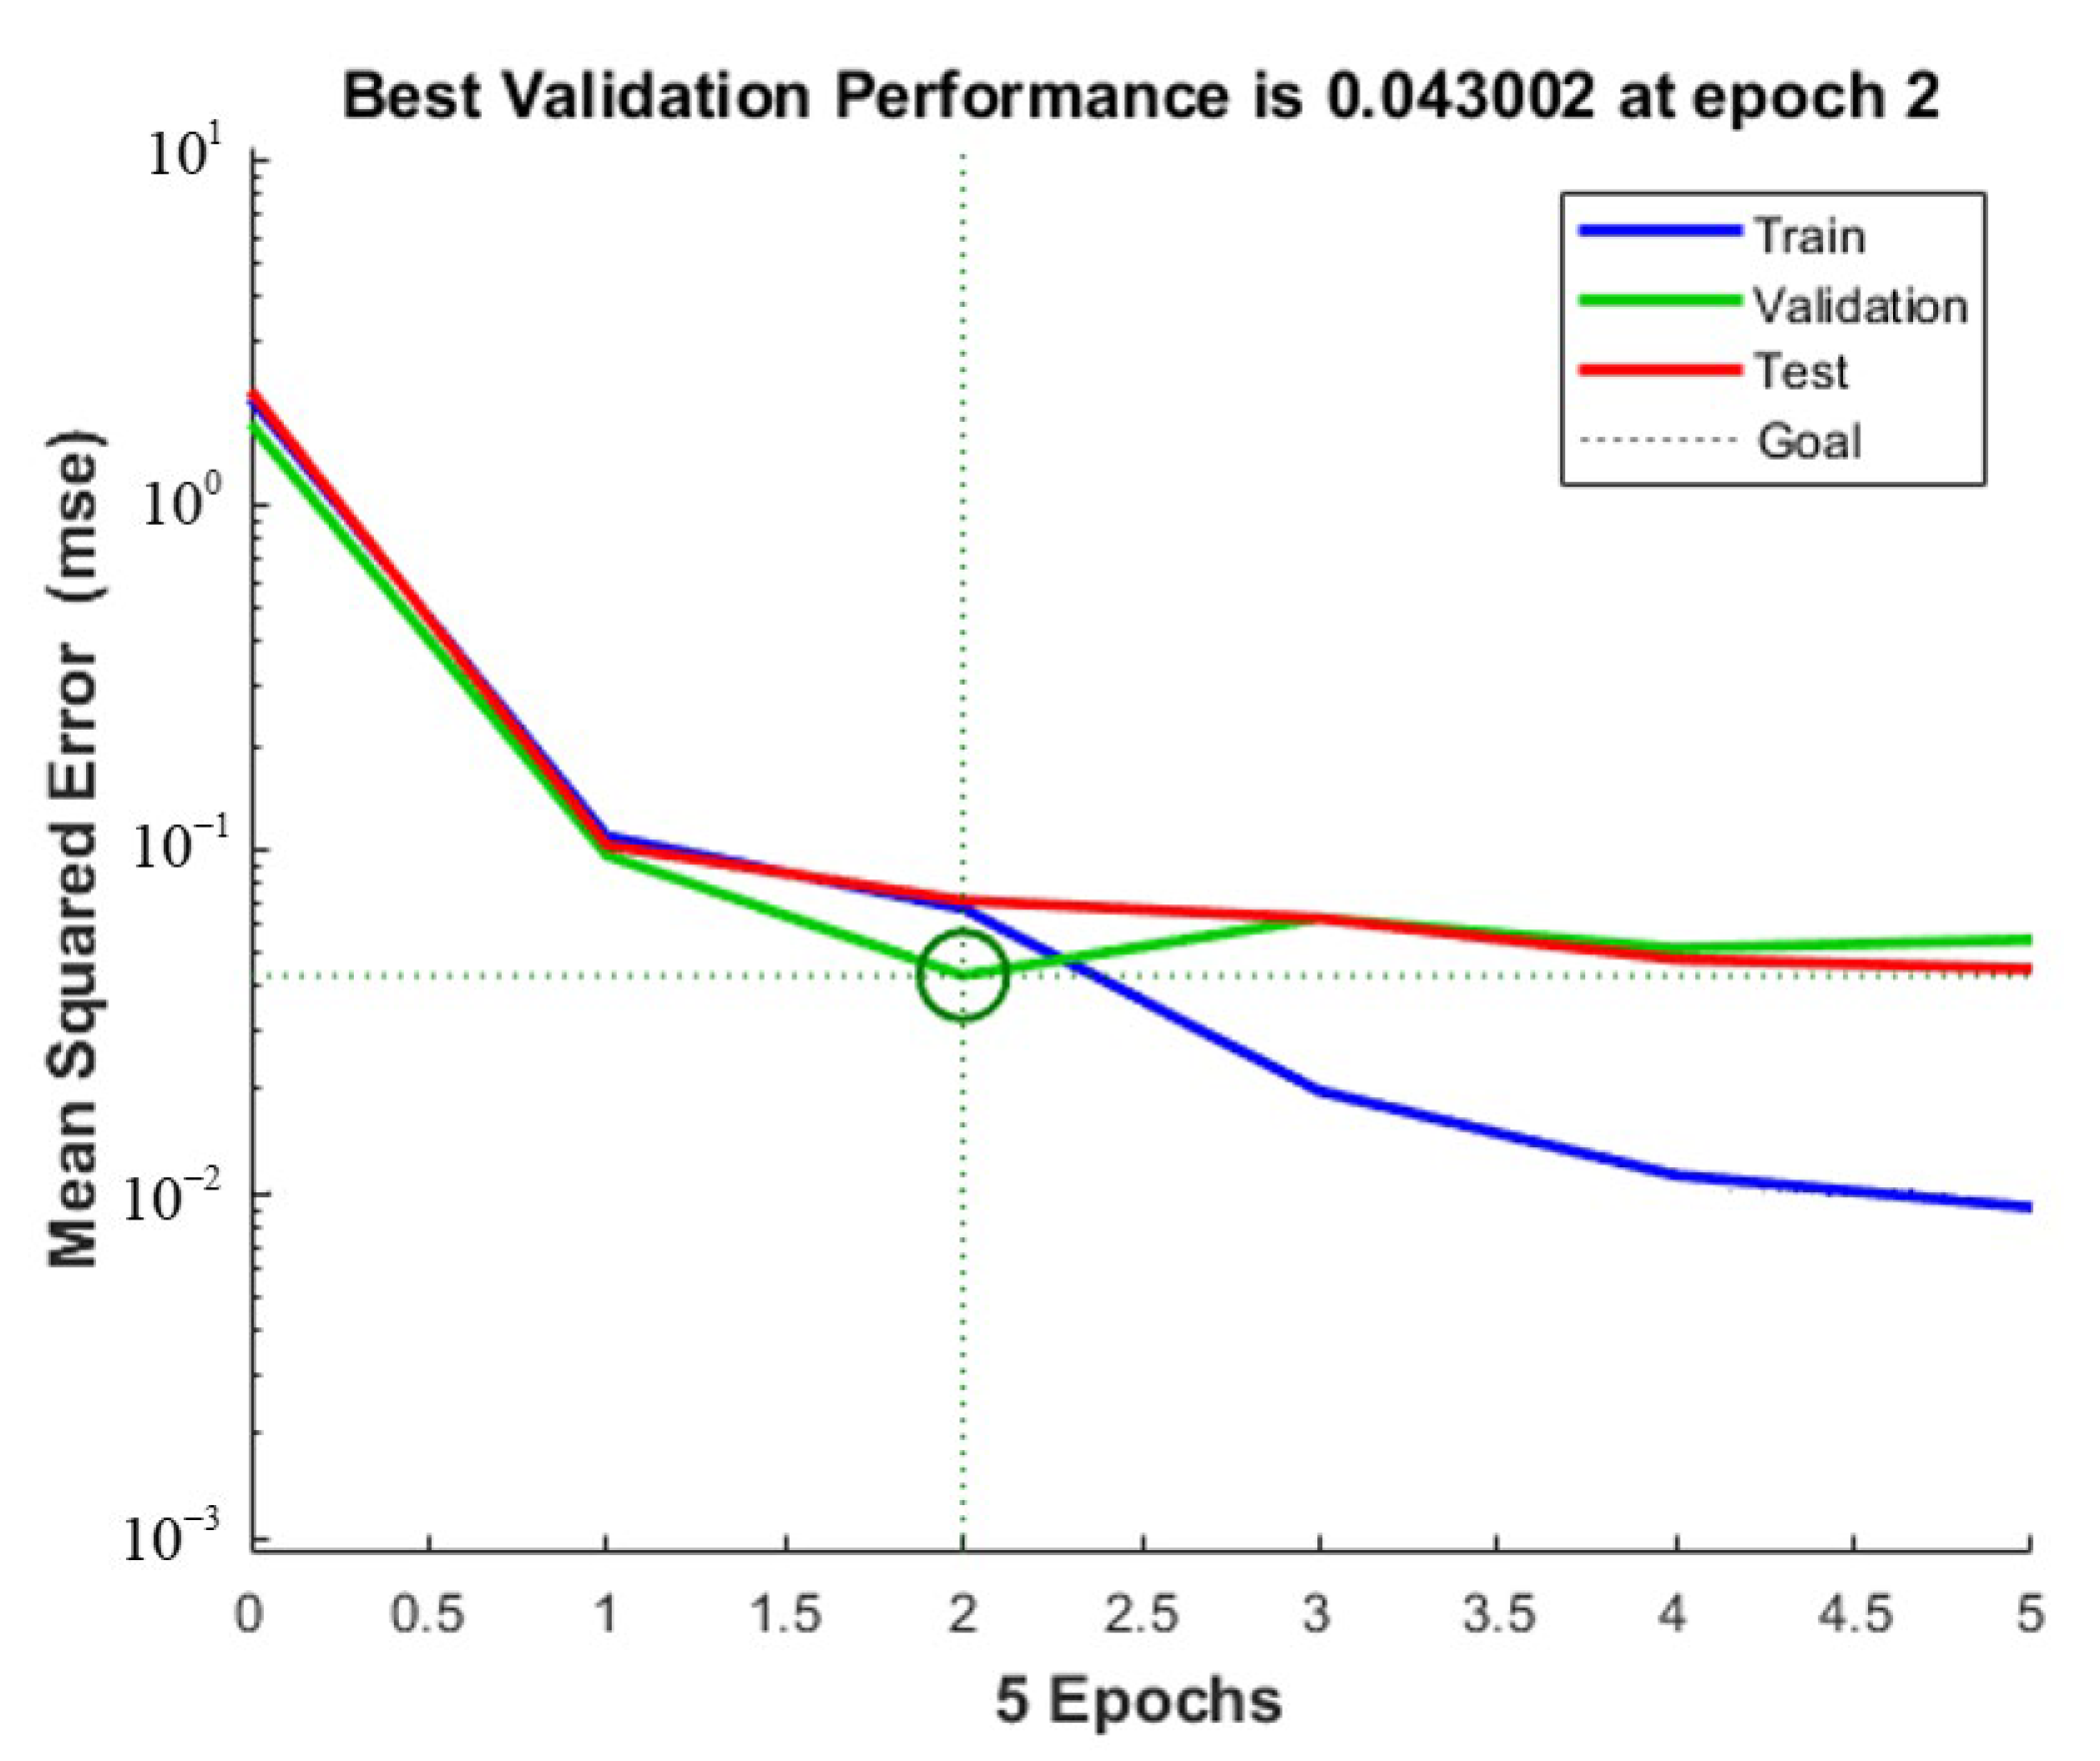
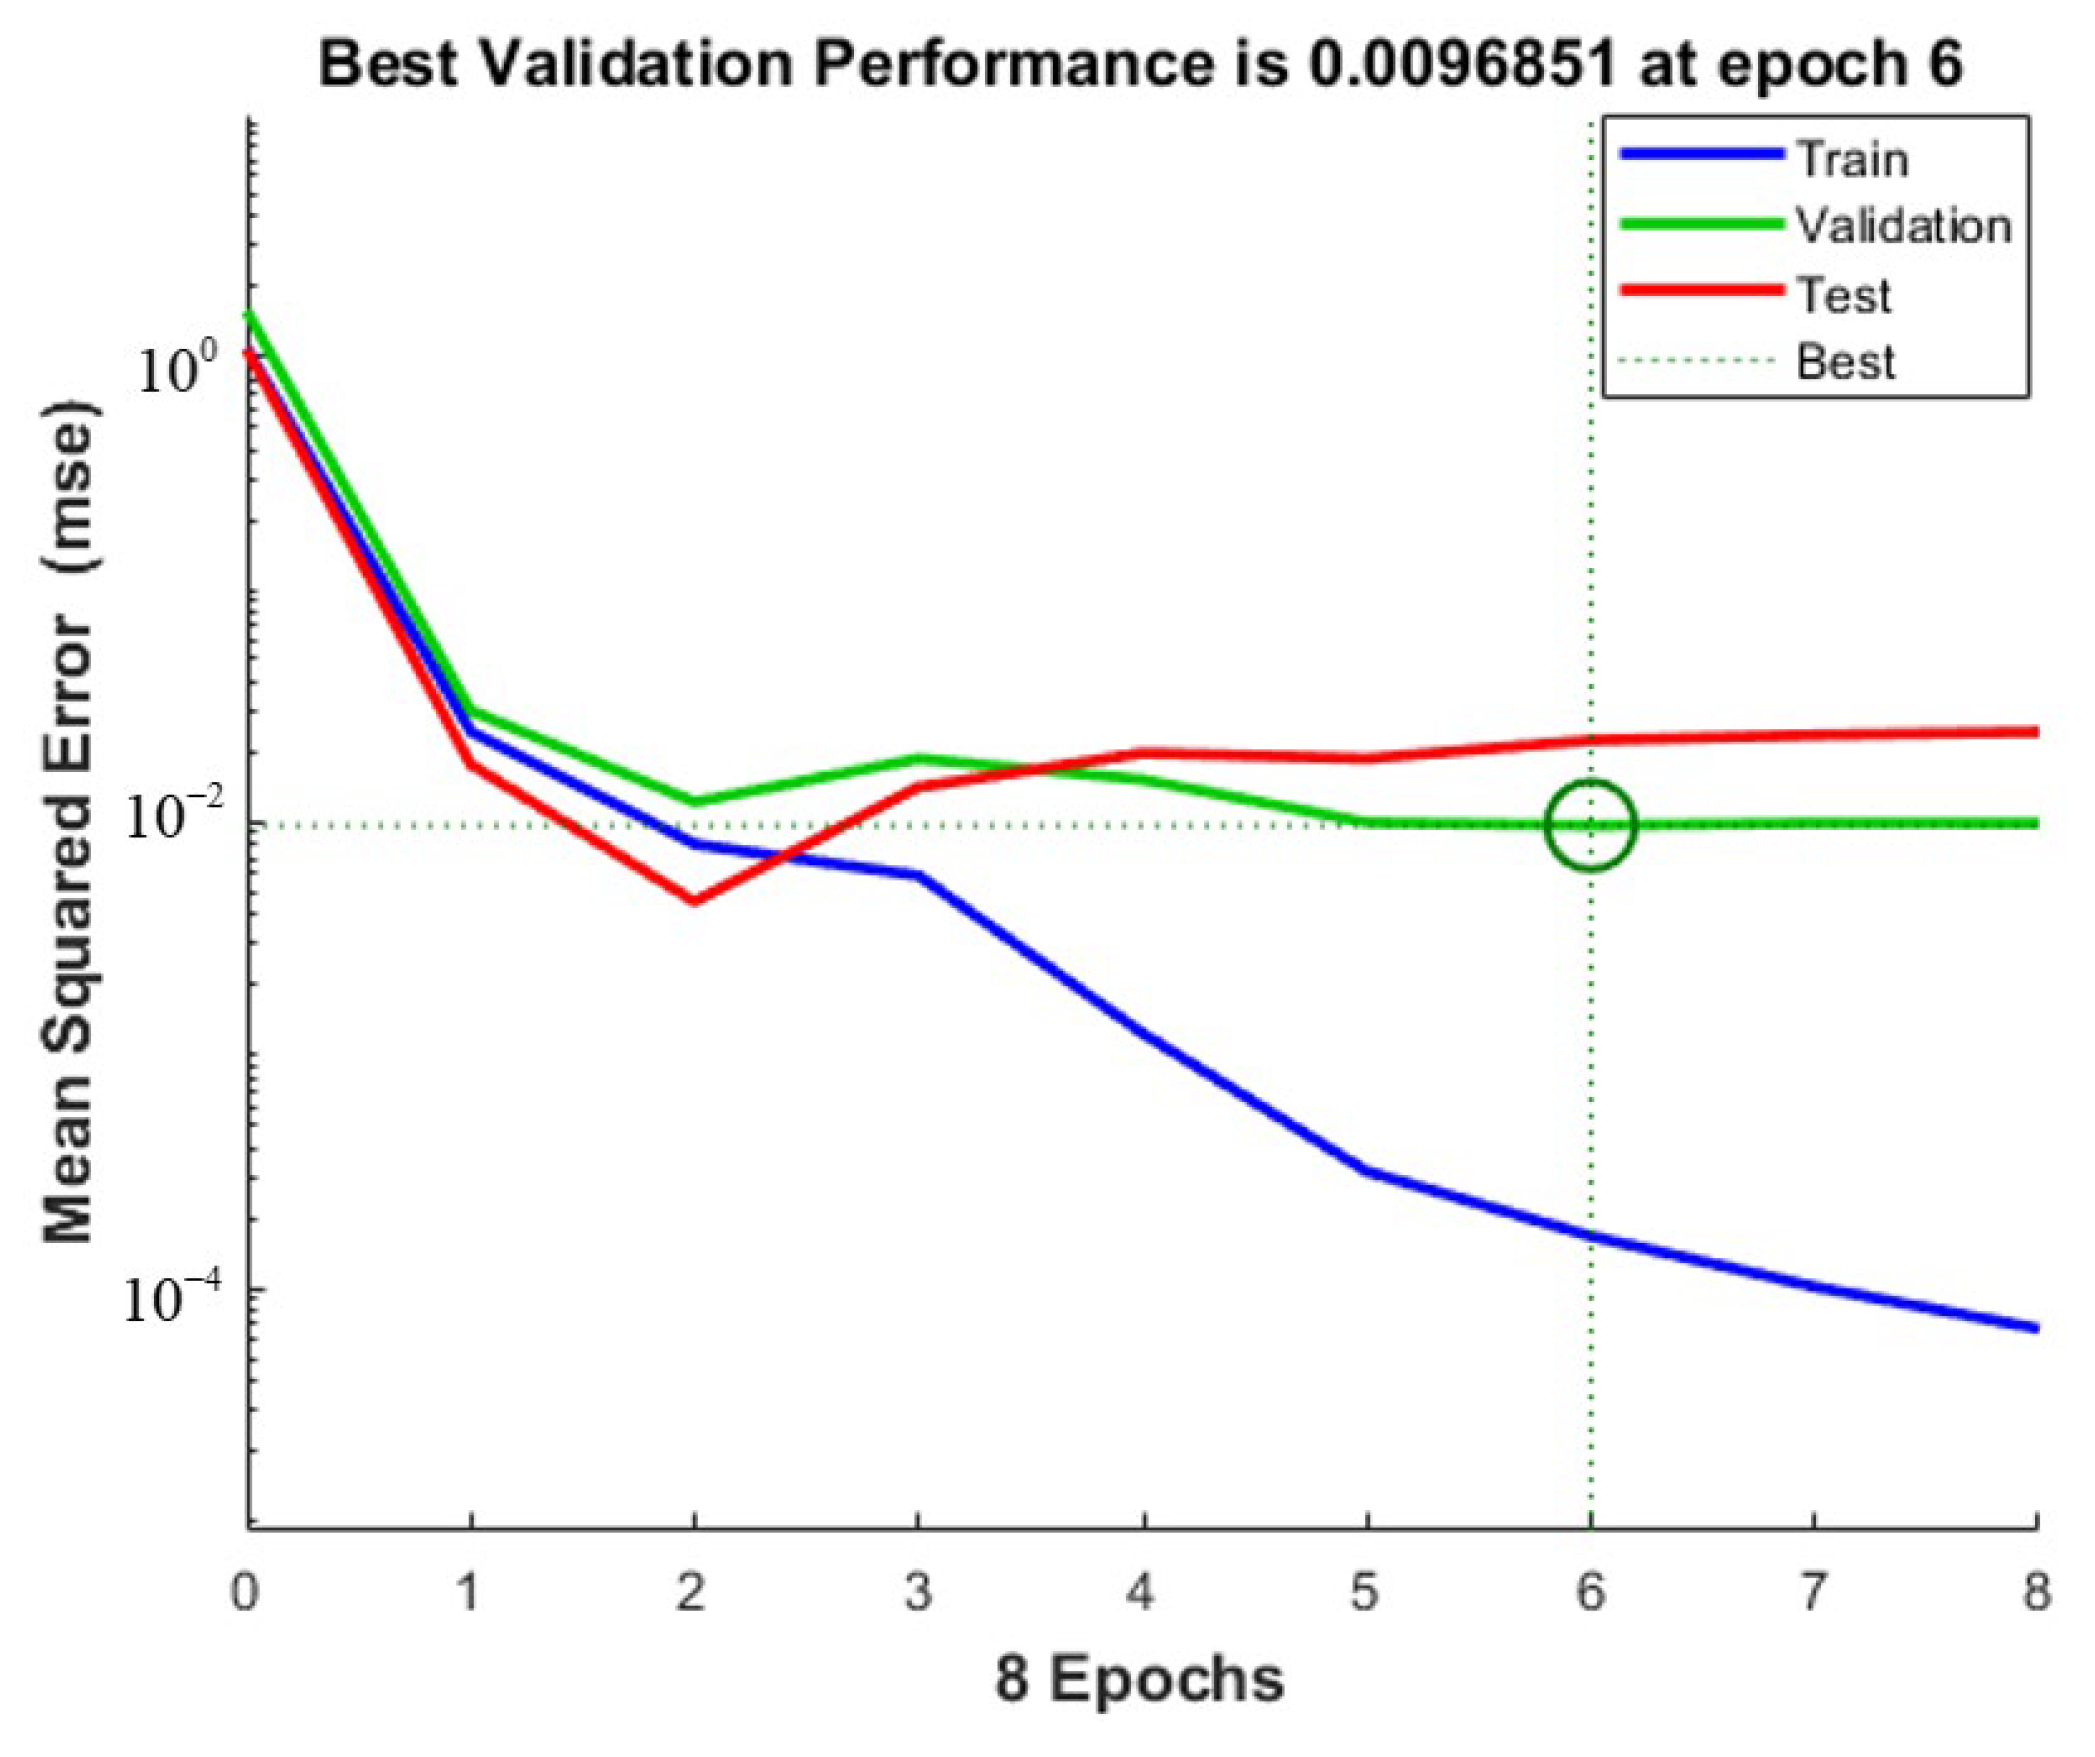
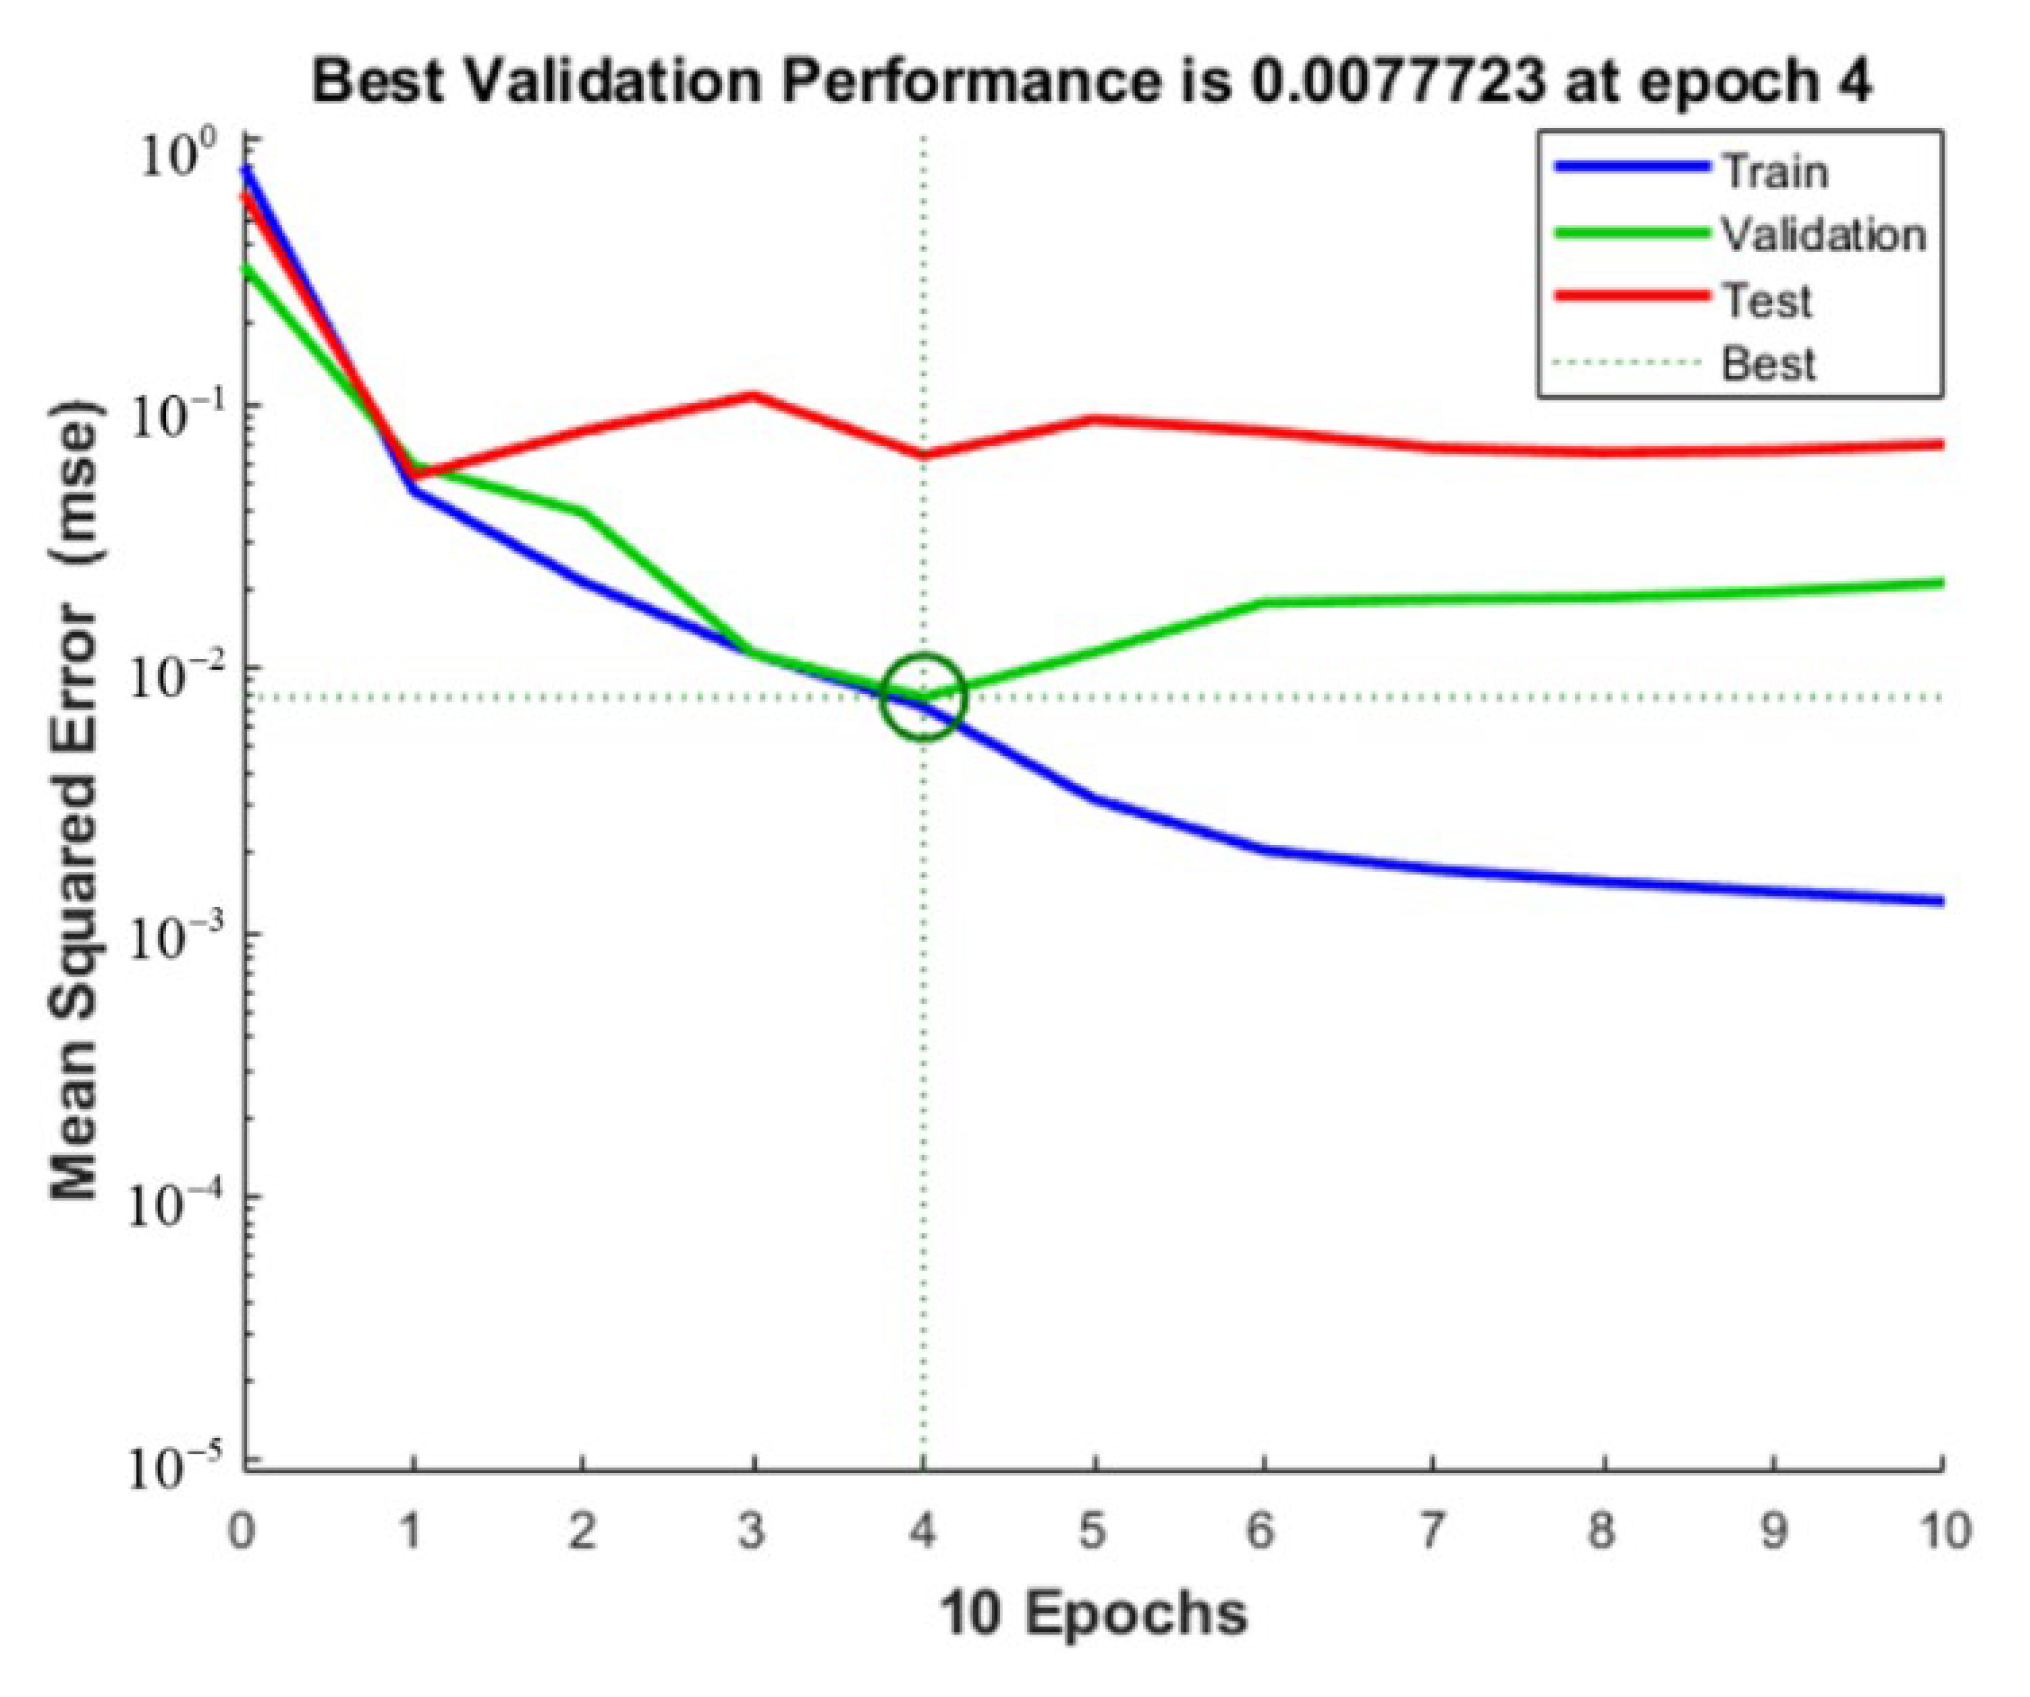
- BP neural network milling performance prediction model
4.2. Significance Test and Optimization of the Prediction Model
- (1)
- Empirical model significance test
- (2)
- Significance test of tbe multiple regression model
- (3)
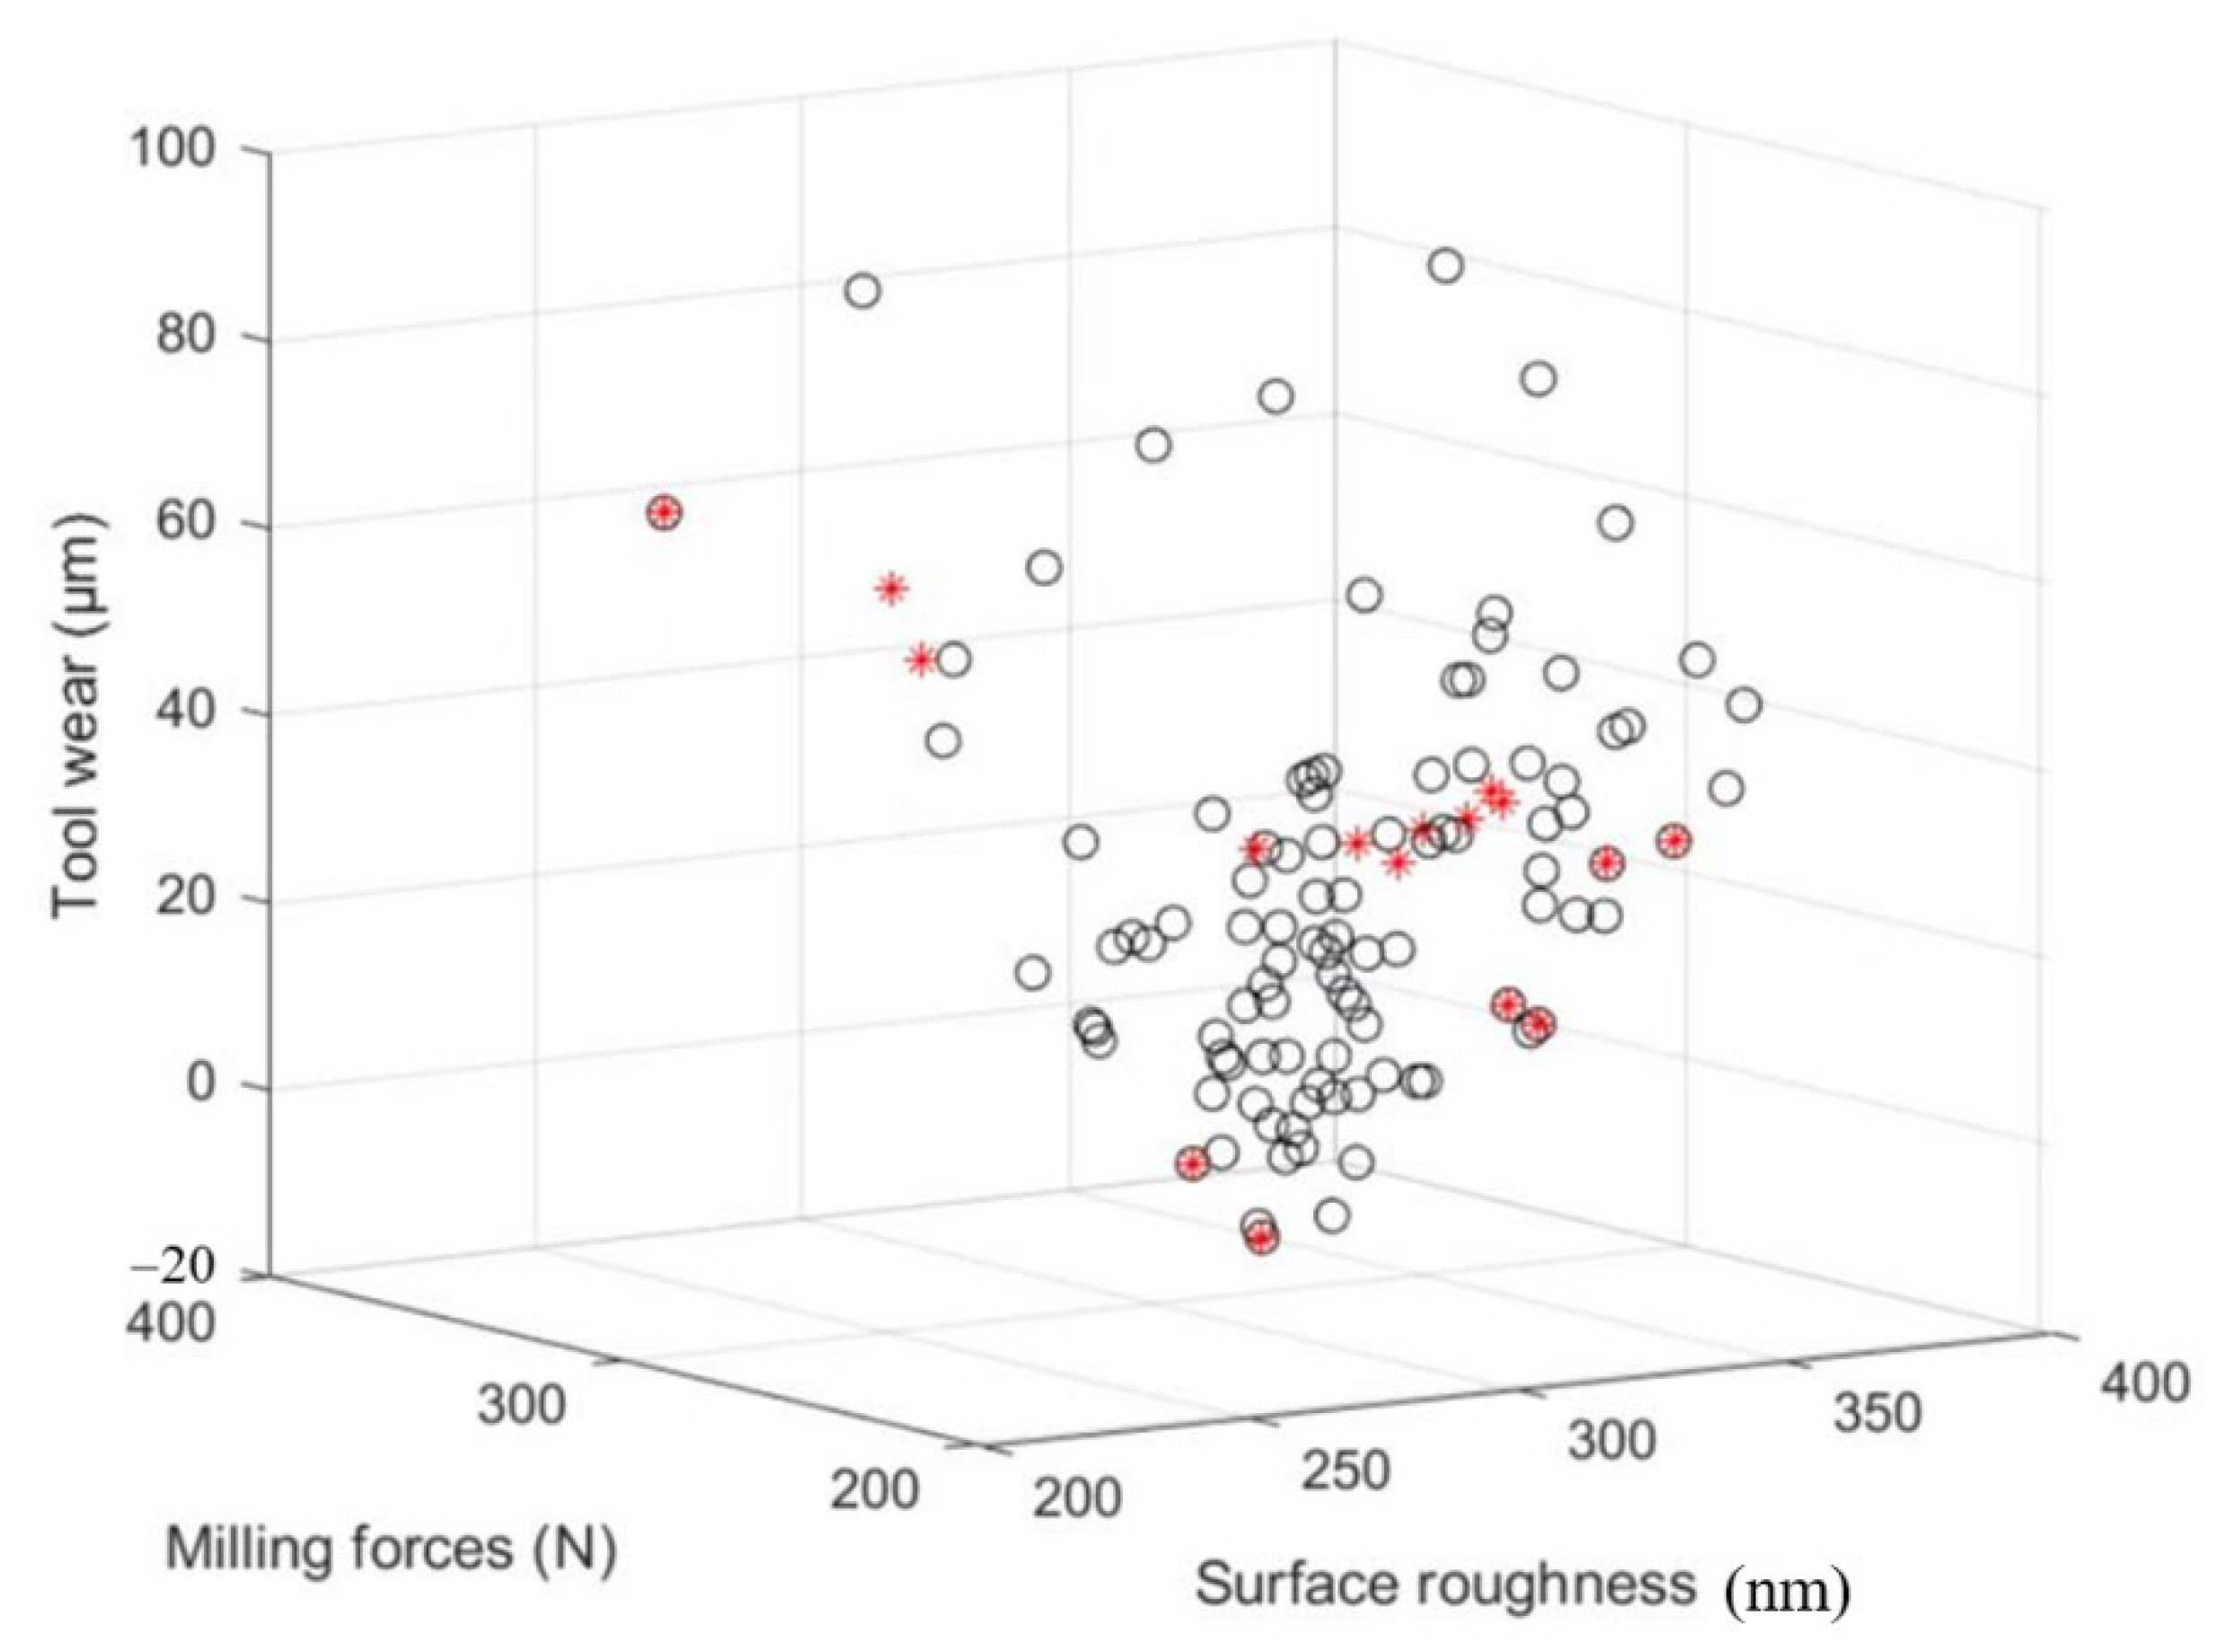
- Evaluation of the milling performance prediction model
4.3. Establishment of the Optimization Model of Micro-Texture Parameters and Cutting Parameters
- (1)
- Objective function and constraint conditions
- (2)
- Implementation and verification of artificial bee colony algorithm parameter optimization model
5. Conclusions
- The orthogonal experiments of cutting parameters and micro-texture parameters are designed, and an experimental platform for milling titanium alloy with micro-texture coated ball end milling cutters is established. The results show that the cutting parameters affect the milling force, tool wear and workpiece surface roughness more significantly, and the micro-texture parameters are in the second response level. It is found that micro-texture parameters limit the effect of micro-texture by changing its distribution in the insertion region, thereby affecting milling performance and workpiece surface quality. The effect of micro-texture on anti-wear, friction reduction, heat dissipation and chip storage has been demonstrated.
- Based on the empirical regression method, multiple linear regression method and BP neural network method, the prediction models of milling force, tool wear and workpiece surface roughness are established. The root mean square error is used to describe the fitting degree, and it is found that the multiple linear regression method has the highest fitting degree.
- Taking milling force, tool wear and workpiece surface roughness as evaluation indexes, the cutting parameters and micro-texture parameters are optimized based on the artificial bee colony algorithm. The optimization results are: v = 159.4232 (m/min), ap = 0.211 (mm), f = 0.06 (mm/r), D = 62.3429 (μm), L = 121.5184 (μm), and L1 = 235.6443 (μm).
Author Contributions
Funding
Institutional Review Board Statement
Informed Consent Statement
Data Availability Statement
Conflicts of Interest
References
- Yuan, C.G.; Pramanik, A.; Basak, A.K.; Prakash, C.; Shankar, S. Drilling of titanium alloy (Ti6Al4V)—A review. Mach. Sci. Technol. 2021, 25, 637–702. [Google Scholar] [CrossRef]
- Li, Y.; Li, S.; Yu, Q. Research review on cutting temperature and cutting vibration of titanium alloy. In MATEC Web of Conferences; EDP Sciences: Les Ulis, France, 2021; Volume 353, p. 01017. [Google Scholar]
- Tong, X.; Han, P.; Yang, S. Coating and micro-texture techniques for cutting tools. J. Mater. Sci. 2022, 57, 17052–17104. [Google Scholar]
- Xiaorong, Z.; Lin, H.; Sen, Y.; Tao, Z.; Pengfei, T.; Zichuan, Z. Research progress of surface micro-texture in the cutting process. Surf. Technol. 2022, 51, 100–127. [Google Scholar]
- Peng, Z.; Zhongsheng, W.; Kaojun, S. Research on the application of finite element simulation in the cutting process of titanium alloy aviation structural parts. In Proceedings of the 3rd Expert Forum on CNC Machine Tools and Automation Technology, Xi’an, China, 16 March 2012; pp. 79–83. [Google Scholar]
- Guo, B.; Zhiji, S.; Jianfeng, Z.; Zhenzhong, W. An Chenhui. Experiments on influencing factors of surface roughness in ultra-precision machining. Opt. Precis. Eng. Forum Pap. 2015, 277–282. [Google Scholar]
- Torrano, I.; Barbero, O.; Kortabarria, A.; Arrazola, P.J. Prediction of Residual Stresses in Turning of Inconel 718. Adv. Mater. Res. 2011, 1243, 421–430. [Google Scholar]
- Li, A.; Zhao, J.; Dong, Y.; Wang, D.; Chen, X. Surface integrity of high-speed face milled Ti-6Al-4V alloy with PCD tools. Mach. Sci. Technol. 2013, 17, 464–482. [Google Scholar] [CrossRef]
- Garrido, A.H.; González, R.; Cadenas, M.; Battez, A.H. Tribological behavior of laser-textured NiCrBSi coatings. Wear 2011, 271, 925–933. [Google Scholar] [CrossRef]
- Koshy, P.; Tovey, J. Performance of electrical discharge textured cutting tools. CIRP Ann. 2011, 60, 153–156. [Google Scholar] [CrossRef]
- Sarma, D.K.; Rajbongshi, S.K. A study in turning of AISI D2 steel with textured and non-textured coated carbide tool at the flank face. Mater. Today Proc. 2020, 28, 574–581. [Google Scholar] [CrossRef]
- Tong, X.; Qu, Q. Optimizing the micro-texture and cutting parameters of ball-end milling cutters to achieve milling stability. Proc. Inst. Mech. Eng. Part E J. Process Mech. Eng. 2022. [Google Scholar] [CrossRef]
- Wang, L. Experimental Study on Cutting Titanium Alloy with Surface Micro-Textured Tools; Nanjing University of Aeronautics and Astronautics: Nanjing, China, 2012. [Google Scholar]
- Stoeterau, R.L.; Janssen, A.; Mallmann, G. Analysis of dimple textured surfaces on cutting tools. J. Braz. Soc. Mech. Sci. Eng. 2017, 39, 3989–3996. [Google Scholar] [CrossRef]
- Teng, C. Study on Surface Micro-Texture and Friction Properties of Ultrasonic Elliptical Vibration Assisted Cutting; Nanchang Aviation University: Nanchang, China, 2018. [Google Scholar]
- Li, C.; Xuhong, G.; Chichi, Z.; Jiju, G. Comparative study on milling performance of non-textured and textured tools. Manuf. Technol. Mach. Tools 2019, 11, 89–93. [Google Scholar]
- Li, X.; Qin, X.; Yang, J.; Xu, W. Comparison of the Applicability of Two Reanalysis Products in Estimating Tall Tower Wind Based on Multiple Linear Regression and Artificial Neural Network in South China. Adv. Meteorol. 2022, 2022, 6573202. [Google Scholar] [CrossRef]
- Ying, Q.; Xiunan, F. Multiple linear regression model and application. China Sci. Technol. Inf. 2022, 669, 73–74. [Google Scholar]
- Binbin, P.; Xianguo, Y.; Juan, D. Surface quality prediction based on BP and RBF neural networks. Surf. Technol. 2020, 49, 324–328. [Google Scholar]
- Shettigar, A.K.; Patel, G.M.; Chate, G.R.; Vundavilli, P.R.; Parappagoudar, M.B. Artificial bee colony, genetic, back propagation and recurrent neural networks for developing intelligent system of turning process. SN Appl. Sci. 2020, 2, 5826–5832. [Google Scholar] [CrossRef] [Green Version]


| Factor | Cutting Speed v (m/min) | Cutting Depth ap (mm) | Feed Rate f (mm/r) | Micro-Pit Diameter D (μm) | Distance from Blade L (μm) | Micro-Pit Spacing L1 (μm) | |
|---|---|---|---|---|---|---|---|
| Level | |||||||
| 1 | 110 | 0.2 | 0.05 | 30 | 90 | 120 | |
| 2 | 120 | 0.25 | 0.06 | 40 | 100 | 140 | |
| 3 | 130 | 0.3 | 0.07 | 50 | 110 | 160 | |
| 4 | 140 | 0.35 | 0.08 | 60 | 120 | 180 | |
| 5 | 150 | 0.4 | 0.09 | 70 | 130 | 200 | |
| 6 | 160 | 0.45 | 0.1 | 80 | 140 | 220 | |
| 7 | 170 | 0.5 | 0.11 | 90 | 150 | 240 | |
| 8 | 180 | 0.55 | 0.12 | 100 | 160 | 260 | |
| Number | Milling Force | Number | Milling Force | Number | Milling Force | Number | Milling Force |
|---|---|---|---|---|---|---|---|
| 1 | 209.28 | 17 | 220.81 | 33 | 208.92 | 49 | 250.33 |
| 2 | 236.3 | 18 | 224.18 | 34 | 273.11 | 50 | 228.78 |
| 3 | 286.72 | 19 | 215.69 | 35 | 273.17 | 51 | 263.1 |
| 4 | 269.36 | 20 | 272.83 | 36 | 292.2 | 52 | 269.22 |
| 5 | 322.27 | 21 | 293.44 | 37 | 318.69 | 53 | 290.22 |
| 6 | 341.57 | 22 | 322.42 | 38 | 332.68 | 54 | 326.84 |
| 7 | 331.21 | 23 | 365.27 | 39 | 342.79 | 55 | 342.48 |
| 8 | 363.51 | 24 | 349.07 | 40 | 369.44 | 56 | 398.74 |
| 9 | 237.58 | 25 | 215.2 | 41 | 215.92 | 57 | 260.12 |
| 10 | 219.94 | 26 | 258.37 | 42 | 226.7 | 58 | 255.24 |
| 11 | 274.51 | 27 | 259.07 | 43 | 298.02 | 59 | 259.99 |
| 12 | 292.63 | 28 | 319.36 | 44 | 310.61 | 60 | 299.1 |
| 13 | 296.87 | 29 | 336.37 | 45 | 316.33 | 61 | 298.87 |
| 14 | 321.46 | 30 | 294.65 | 46 | 323.95 | 62 | 335.45 |
| 15 | 342.73 | 31 | 345.83 | 47 | 334.53 | 63 | 383.75 |
| 16 | 293.33 | 32 | 396.02 | 48 | 356.82 | 64 | 401.74 |
| Number | Tool Wear | Number | Tool Wear | Number | Tool Wear | Number | Tool Wear |
|---|---|---|---|---|---|---|---|
| 1 | 46.21 | 17 | 61.69 | 33 | 28.29 | 49 | 71.97 |
| 2 | 34.36 | 18 | 49.72 | 34 | 55.82 | 50 | 50.01 |
| 3 | 45.4 | 19 | 39.22 | 35 | 62.88 | 51 | 53.95 |
| 4 | 54.33 | 20 | 37.38 | 36 | 82.49 | 52 | 55.9 |
| 5 | 66.6 | 21 | 47.61 | 37 | 57.27 | 53 | 76.57 |
| 6 | 58.5 | 22 | 66.63 | 38 | 74.52 | 54 | 28.53 |
| 7 | 47.38 | 23 | 78.48 | 39 | 53.4 | 55 | 89.25 |
| 8 | 72.97 | 24 | 101.66 | 40 | 67.46 | 56 | 79.19 |
| 9 | 41.47 | 25 | 50.37 | 41 | 48.8 | 57 | 16.41 |
| 10 | 38.85 | 26 | 69.93 | 42 | 29.76 | 58 | 57.79 |
| 11 | 54.34 | 27 | 36.55 | 43 | 88.22 | 59 | 48.99 |
| 12 | 45.34 | 28 | 41.87 | 44 | 68.25 | 60 | 43.52 |
| 13 | 59.45 | 29 | 56.87 | 45 | 77.96 | 61 | 47.2 |
| 14 | 66.04 | 30 | 55.44 | 46 | 63.54 | 62 | 91.15 |
| 15 | 66.6 | 31 | 73.08 | 47 | 79.18 | 63 | 85.35 |
| 16 | 50.43 | 32 | 90.31 | 48 | 69.69 | 64 | 112.19 |
| Number | Surface Roughness | Number | Surface Roughness | Number | Surface Roughness | Number | Surface Roughness |
|---|---|---|---|---|---|---|---|
| 1 | 343 | 17 | 349 | 33 | 322 | 49 | 371 |
| 2 | 305 | 18 | 338 | 34 | 302 | 50 | 301 |
| 3 | 373 | 19 | 336 | 35 | 326 | 51 | 312 |
| 4 | 394 | 20 | 300 | 36 | 363 | 52 | 260 |
| 5 | 376 | 21 | 354 | 37 | 334 | 53 | 323 |
| 6 | 399 | 22 | 328 | 38 | 361 | 54 | 227 |
| 7 | 399 | 23 | 371 | 39 | 339 | 55 | 300 |
| 8 | 374 | 24 | 402 | 40 | 312 | 56 | 316 |
| 9 | 319 | 25 | 328 | 41 | 300 | 57 | 296 |
| 10 | 318 | 26 | 377 | 42 | 272 | 58 | 319 |
| 11 | 376 | 27 | 328 | 43 | 322 | 59 | 244 |
| 12 | 370 | 28 | 332 | 44 | 297 | 60 | 297 |
| 13 | 359 | 29 | 288 | 45 | 354 | 61 | 252 |
| 14 | 370 | 30 | 317 | 46 | 320 | 62 | 329 |
| 15 | 341 | 31 | 379 | 47 | 329 | 63 | 256 |
| 16 | 366 | 32 | 343 | 48 | 294 | 64 | 345 |
| Evaluating Indicator | Root Mean Square Error | Coefficient of Determination r2 |
|---|---|---|
| Milling force | 21.025 | 83.062 |
| Tool wear | 8.3378 | 76.211 |
| Surface roughness | 19.374 | 80.752 |
| Degree of Freedom | Regression Sum of Squares | Mean Square | F | Significance F | ||
|---|---|---|---|---|---|---|
| Milling force | Regression analysis | 6 | 0.3308 | 0.0551 | 77.0077 | 1.6395 × 10⁻²⁵ |
| Residual error | 57 | 0.0408 | 0.0007 | —— | —— | |
| Grand total | 63 | 0.3716 | —— | —— | —— | |
| Tool wear | Regression analysis | 6 | 0.9397 | 0.1566 | 19.2547 | 4.0847 × 10⁻¹² |
| Residual error | 57 | 0.4636 | 0.0081 | —— | —— | |
| Grand total | 63 | 1.40343 | —— | —— | —— | |
| Surface roughness | Regression analysis | 6 | 0.12848 | 0.02141 | 24.6066 | 3.6314 × 10⁻¹⁴ |
| Residual error | 57 | 0.04960 | 0.00087 | —— | —— | |
| Grand total | 63 | 0.17809 | —— | —— | —— |
| Evaluating Indicator | R2 | Adjusted R2 | F | Significance F |
|---|---|---|---|---|
| Milling force F | 0.918 | 0.894 | 49.39 | <0.0001 |
| Abrasion loss VB | 0.841 | 0.803 | 22.44 | <0.0001 |
| Surface roughness Ra | 0.858 | 0.828 | 28.49 | <0.0001 |
| Evaluating Indicator | Empirical Formula | Multiple Linear Regression | BP Neural Network |
|---|---|---|---|
| Milling force F | 16.4745 | 15.9 | 21.025 |
| Abrasion loss VB | 10.1494 | 7.69 | 8.3378 |
| Surface roughness Ra | 21.4313 | 14.3 | 19.374 |
| Evaluating Indicator | Optimization | Actual Measurement | Relative Error |
|---|---|---|---|
| Milling force (N) | 203.58 | 219.52 | 7.26% |
| Tool wear (μm) | 14.89 | 16.47 | 9.59% |
| Surface roughness (nm) | 245.87 | 263.71 | 6.77% |
Disclaimer/Publisher’s Note: The statements, opinions and data contained in all publications are solely those of the individual author(s) and contributor(s) and not of MDPI and/or the editor(s). MDPI and/or the editor(s) disclaim responsibility for any injury to people or property resulting from any ideas, methods, instructions or products referred to in the content. |
© 2023 by the authors. Licensee MDPI, Basel, Switzerland. This article is an open access article distributed under the terms and conditions of the Creative Commons Attribution (CC BY) license (https://creativecommons.org/licenses/by/4.0/).
Share and Cite
Yang, H.; Yang, S.; Tong, X. Study on the Matching of Surface Texture Parameters and Processing Parameters of Coated Cemented Carbide Tools. Coatings 2023, 13, 681. https://doi.org/10.3390/coatings13040681
Yang H, Yang S, Tong X. Study on the Matching of Surface Texture Parameters and Processing Parameters of Coated Cemented Carbide Tools. Coatings. 2023; 13(4):681. https://doi.org/10.3390/coatings13040681
Chicago/Turabian StyleYang, Haochuan, Shucai Yang, and Xin Tong. 2023. "Study on the Matching of Surface Texture Parameters and Processing Parameters of Coated Cemented Carbide Tools" Coatings 13, no. 4: 681. https://doi.org/10.3390/coatings13040681