
First-Principle Study of the Interface of Al2O3/CoCr Metal-Based Composites


College of Materials Science and Engineering, North University of China, Taiyuan 030051, China
*
Author to whom correspondence should be addressed.
Coatings 2023, 13(4), 680; https://doi.org/10.3390/coatings13040680
Submission received: 28 February 2023
/
Revised: 23 March 2023
/
Accepted: 24 March 2023
/
Published: 27 March 2023
Abstract
:In this work, the interface bonding properties of Al2O3/CoCr metal matrix composites were calculated using first principles after Al2O3 was added to traditional CoCr alloys. The phase and microstructure of the CoCr alloy and the Al2O3/CoCr metal matrix composites were characterized. The results indicate that the interface binding ability of the Al2O3 (111)/CoCr (111) interface model was the strongest, and the electronic overlap of its interface was the highest. The charge density was the strongest, the overlap area was the highest, and there was a charge accumulation area at the interface. Meanwhile, the influence of the amount of added Al2O3 on the bonding strength of the Al2O3/CoCr interface was studied. It was concluded that the interface bonding ability of the Al2O3 (111)/CoCr (111) interface was the best when 5% Al2O3 was added. By studying the phase composition and microstructure of Al2O3/CoCr metal matrix composites, it was shown that the microstructure of the composites was uniform and dense after added Al2O3, Al2O3, M6C, and CoAl2O4 phases appeared, and the grain size was finer.
1. Introduction
Cobalt–chromium (CoCr) alloys have wide applications in the field of dentistry [1,2], due to the CoCr’s superior mechanical properties, resistance to corrosion, and biocompatibility. However, the CoCr alloy encounters some problems in clinical use, such as low gold–porcelain bonding strength, easy shedding of the porcelain layer, and easy precipitation of metal ions [3,4,5], which limit its application in the field of dentistry. Therefore, it is necessary to find an effective way to improve the properties of the cobalt–chromium alloy. Ceramic-particle-reinforced composite materials have become a commonly used method to improve material properties. Ceramic-metal matrix composite materials integrate many excellent characteristics of metal and ceramic materials and possess high hardness, high strength, excellent wear resistance, and corrosion resistance of ceramic materials without damaging the plastic toughness of metal materials [6,7,8,9].
In recent years, research has been conducted exploring and improving the properties of the CoCr alloy reinforced by ceramic particles [10,11,12]. For example, Gong et al. [10] prepared CoCrNi-based high-temperature, wear-resistant composites containing Al2O3 ceramic particles using powder metallurgy technology. The results show that the Al2O3-reinforced CoCrNi matrix composites have higher hardness, density, and wear resistance than those without Al2O3. Above 800 °C, Al2O3 particles react with CoO to form a high-temperature solid lubricant CoAl2O4, which reduces the wear rate and friction coefficient of the composite and improves the wear resistance. Bandyopadhyay et al. [12] prepared ceramic/metal matrix composites by adding calcium phosphate (CaP) as reinforcement ceramics into CoCr alloys. The results showed that the concentration of Co ions decreased from 367 ± 7.071 ppb to 13.69 ± 0.12 ppb, and the concentration of Cr ions decreased from 25.5 ± 3.536 ppb to 4.34 ± 0.06 ppb. Human osteoblasts were selected to test the biocompatibility of ceramic/metal matrix composites with an in vitro cytotoxicity test. The results showed that CoCrMo–CaP composites had no obvious cytotoxicity. Therefore, finding suitable ceramic particles can effectively improve the performance of CoCr alloys. Existing studies have shown that Al2O3 and Co have good wettability [13]. Therefore, this paper intends to add Al2O3 to CoCr alloys to improve traditional CoCr alloys and to prepare ceramic/metal matrix composite materials that are more suitable for dental field.
The properties of Al2O3/CoCr metal matrix composites mainly depend on their atomic structure and interface bonding properties, but these properties are difficult to study using experimental methods. At present, first-principles calculations based on density functional theory (DFT) can be used to study the microscopic interaction mechanism of the interface [14,15,16,17,18,19]. The Al2O3/metal composite interface has certainly received extensive attention in research. For example, Sergey et al. [20,21] used first-principles calculations to explore the electronic structure and stability of the Cu (111)/α-Al2O3 (0001) interface and made an in-depth analysis of the interface structure at the nano level. Qiu et al. [22] used a first-principles discrete variational method to study the electronic structure and magnetism of Co/Al2O3/Co under O-terminal and Al-terminal interface models of different thicknesses under local spin-density approximations. However, there are few first-principles calculations and research reports on the Al2O3/CoCr interface. Therefore, it is necessary to deeply explore the interface bonding condition and stability between Al2O3 and CoCr alloys from a theoretical perspective and explore and study the aspects of combining theory with practice and explaining experimental phenomena and mechanisms. In this paper, three kinds of interface models, including Al2O3 (111)/CoCr (100), Al2O3 (111)/CoCr (110), and Al2O3 (111)/CoCr (111), were established by using the first-principles calculation method. The adhesion work, interface energy, and electronic structure properties of the three interfaces were calculated and analyzed in detail. Meanwhile, Al2O3/CoCr metal matrix composites were prepared by SLM technology, and their phase composition and microstructure properties were analyzed.
2. Materials and Methods
2.1. CoCr Alloy Powder
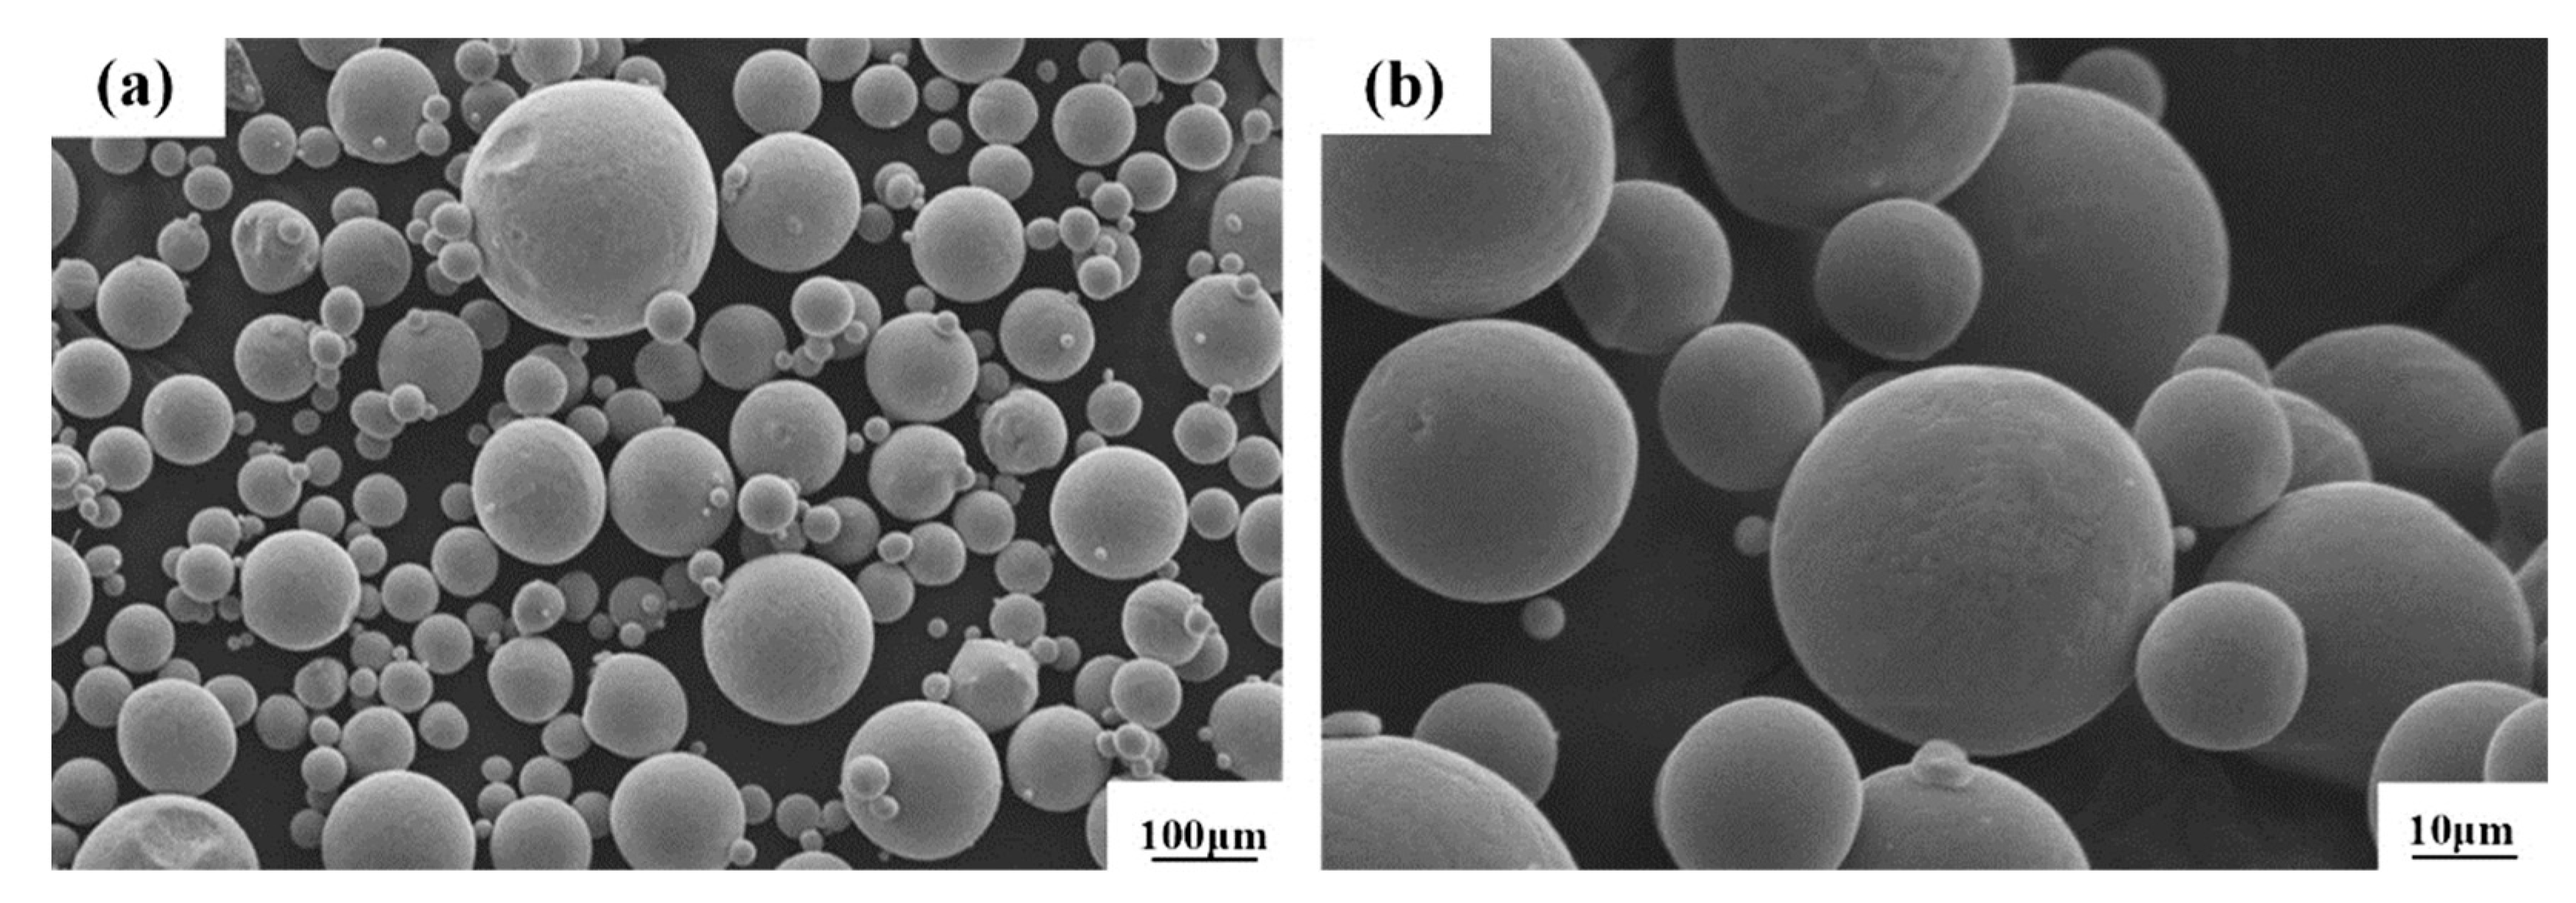
The micromorphology of Renishaw special CoCr alloy powder produced from the Huarong Purui (Beijing, China) Science and Technology Co., Ltd., Beijing, China, is shown in Figure 1. The powder purity is 99%, and the powder has a good spherical size, uniform particle size distribution, and a relatively smooth particle surface.
The CoCr alloy used is 8.3 g/cm3, and the melting point is 1380 °C, complying with ASTMF-7598 (ISO5832-4:1996); it is suitable for the constituency laser melting process. The specific chemical composition of the alloy powders is shown in Table 1.
2.2. Al2O3 Powder
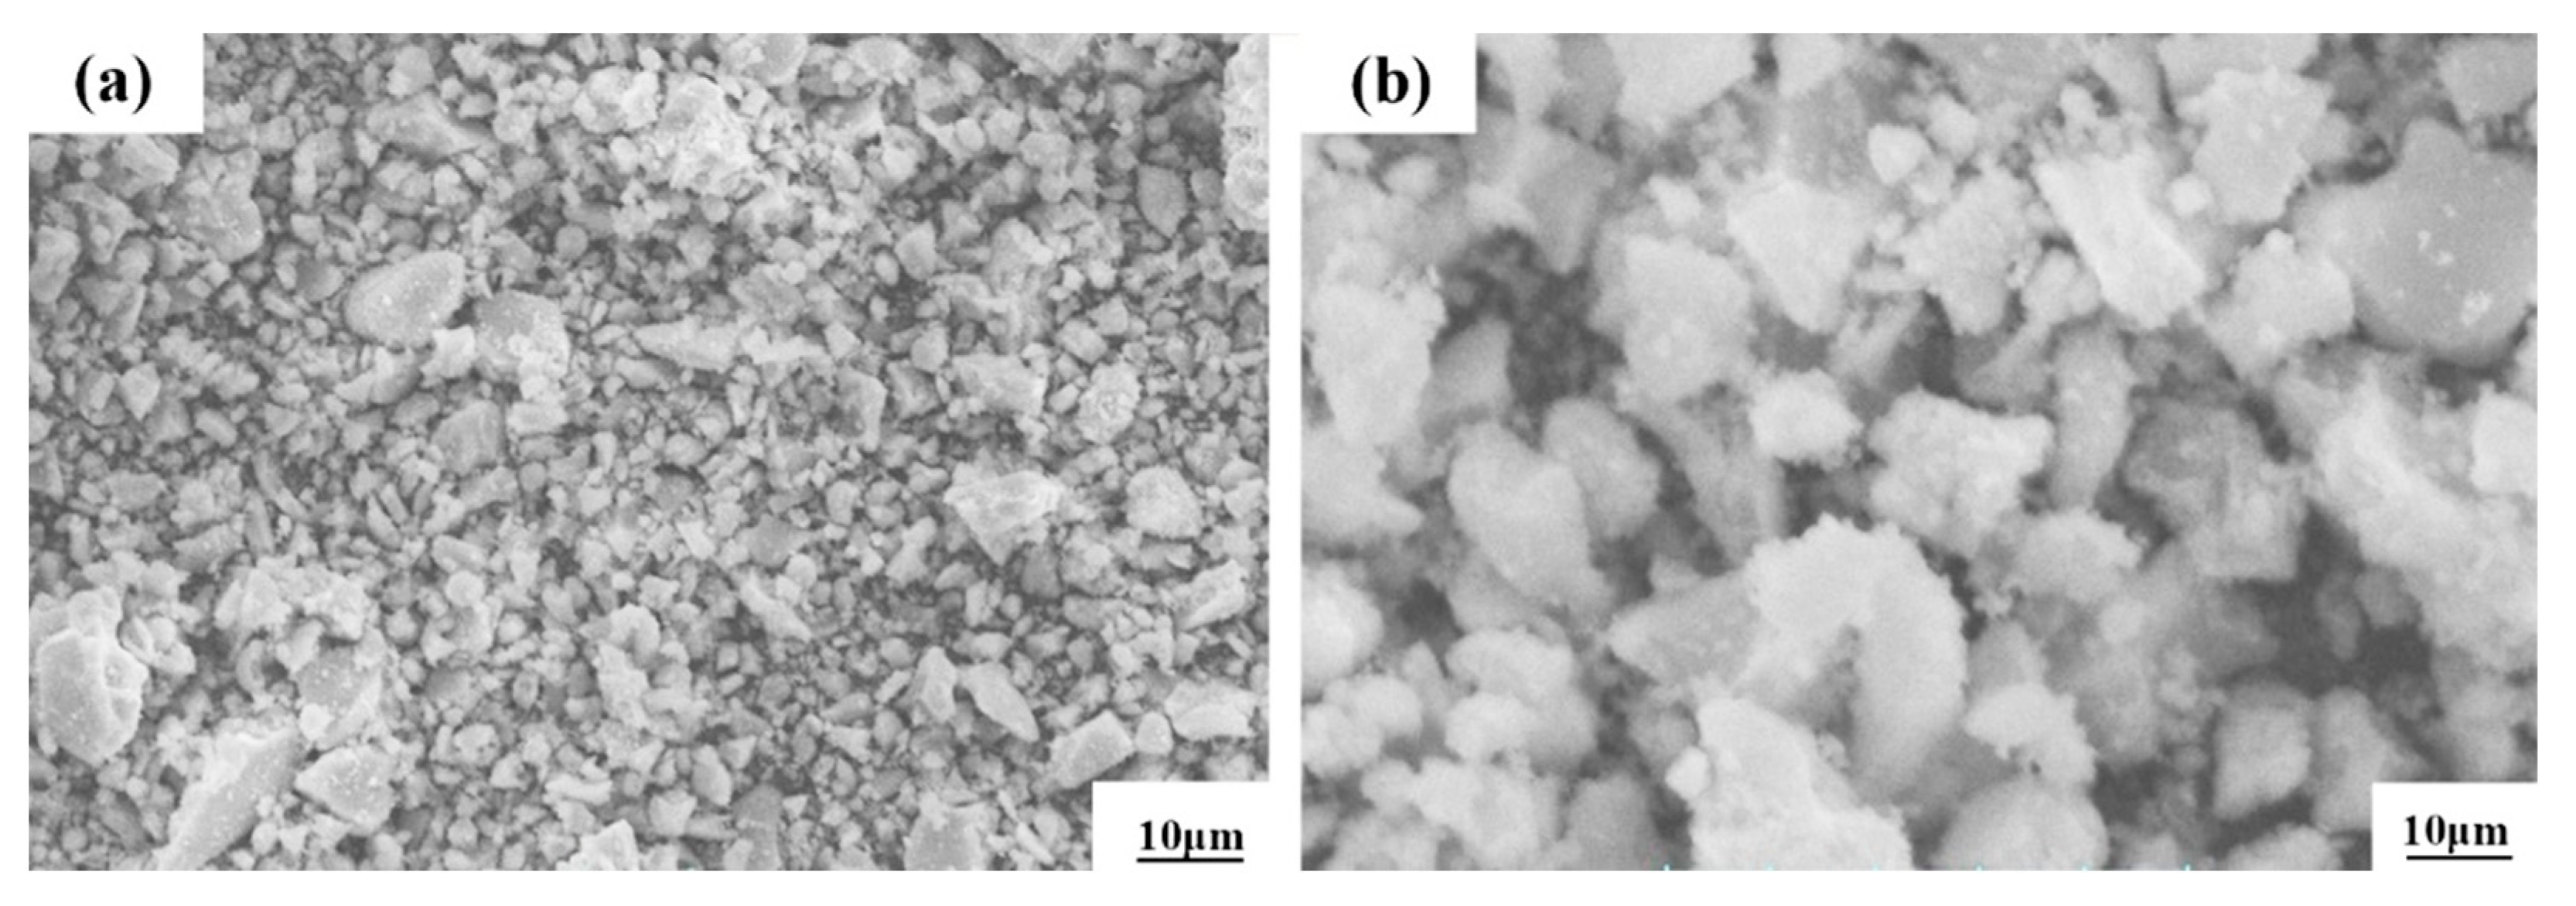
For this study, we used Al2O3 ceramic powder, which is produced from Jiangsu Soviet Union Ruixin Material Co., Ltd., Changchun, China. The powder purity is 99%, with a melting point of 2050 °C and a fire resistance of 2000 °C, and the maximum temperature can reach 1950 °C. The micromorphology of this powder is shown in Figure 2. The powder has an irregular sheet structure, the agglomeration phenomenon is serious, obvious gaps appear between the agglomerations, and it has a low density.
2.3. Test Method
2.3.1. The Preparation Method of Al2O3/CoCr Composite Powder
The composite powder was prepared by vacuum ball milling. The planetary ball mill (model QM-3SP4) was used to complete the test. The parameters of the ball mill were set as follows: the rotational speed was 60 rpm, the ball milling time was 6 h, the ball material ratio was 3:1. The specific process was as follows: Al2O3 as the reinforcement particle of the metal matrix composite material, CoCr as the matrix material, ZrO2 balled together into the stainless steel ball milling tank, and the ball milling tank after vacuum according to the parameters to complete the test.
2.3.2. SLM-Forming Test
The SLM manufacturing equipment used in this study was the UK RenishawAM400. The laser model was SPIredPOWER 400 W, the laser wavelength was 1071 nm, the beam focus diameter was up to 70 μm, and the laser output mode was the pulse type.
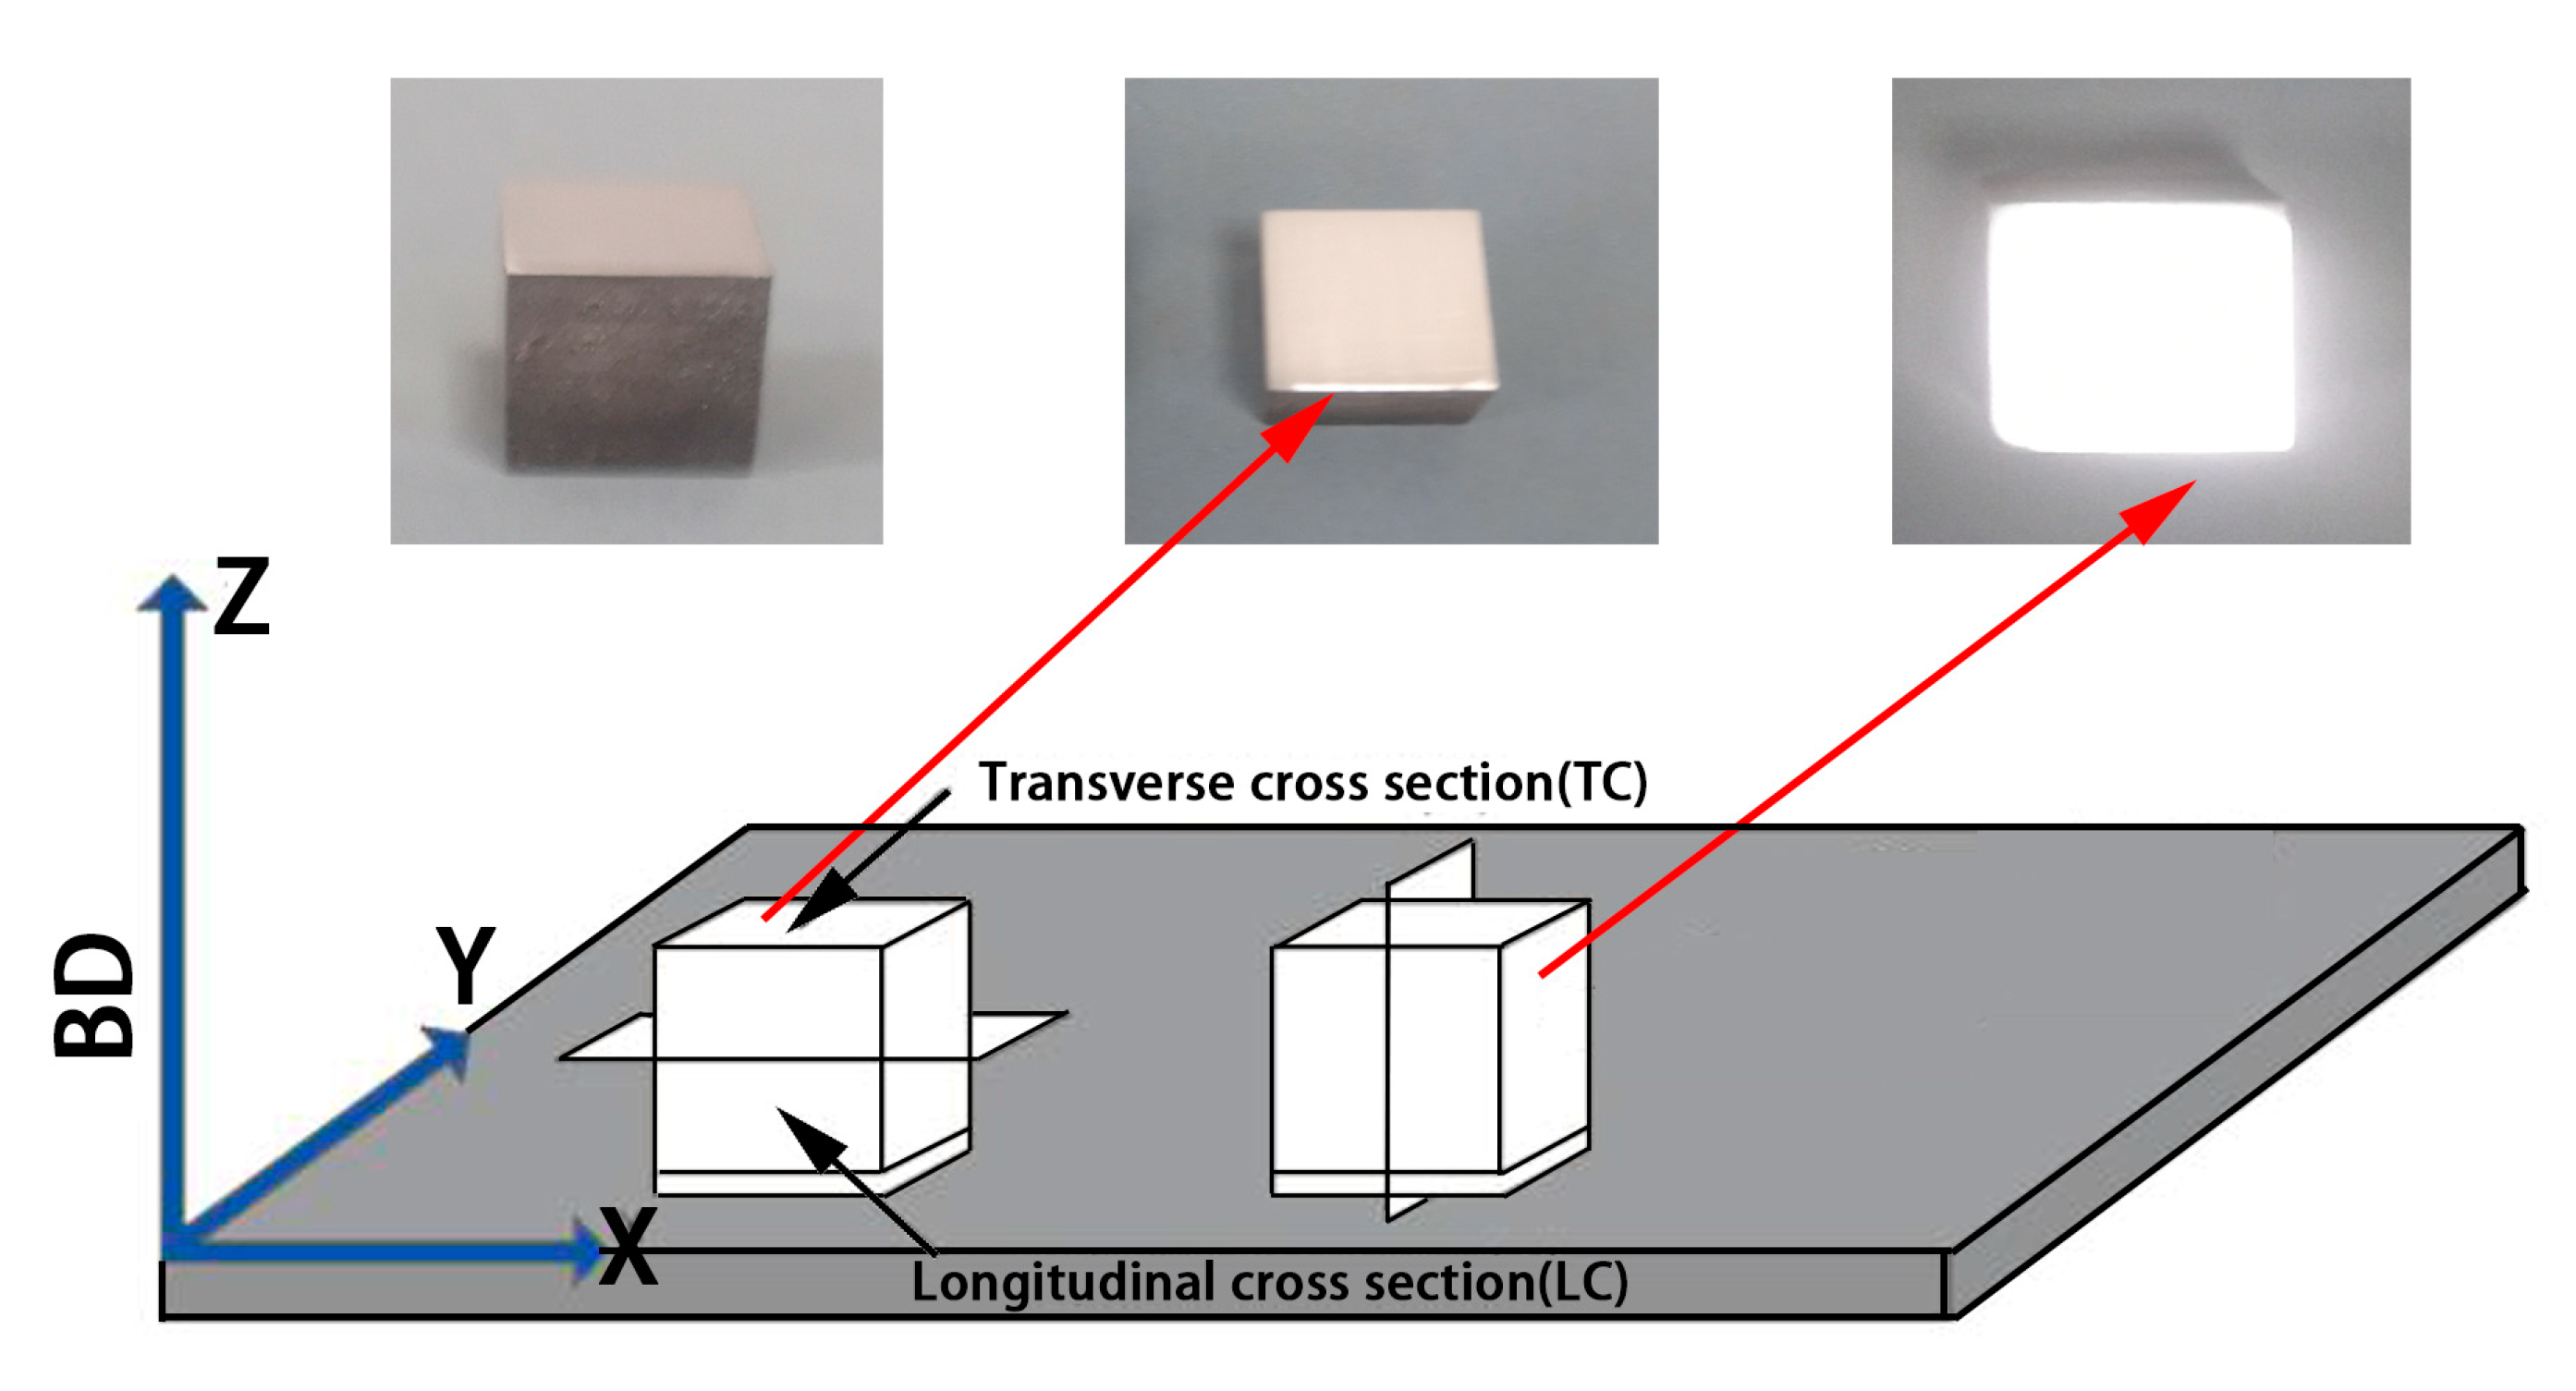
The specimen size was 10 × 10 × 10 mm3. The printing process and shape of the CoCr alloys and the Al2O3/CoCr metal matrix composite samples are shown in Figure 3. SLM manufacturing Al2O3/CoCr metal matrix composite forming process parameters were as follows: P = 200 W, V = 700 mm/s, h = 0.06 mm, and d = 0.03 mm.
2.3.3. Microstructure Measurement and Calculation
The microstructure of the sample was observed with the AXIO ScopeA1 optical microscope. A Hitachi SU5000 thermal field emission scanning electron microscope was used to observe the micromorphology of the samples. The phase composition of the samples was analyzed using D/max-Rb XRD. The TEM test was conducted with a FEI Tecnai G2 F20 device to analyze the micromorphology. For the metallographic corrosion method, aqua reticulum (hydrochloric acid: nitric acid = 3:1) was heated to 100 °C, the sample was put in, and the corrosion time was 10 s.
The content (volume fraction) of the γ phase (face center cubic (FCC) structure, a = 0.35447 nm, ICDD card No. 15-0806) in the CoCr alloy can be calculated using Equation (1):
where I(200)FCC and I(101) hexagonal close packed (HCP) are the diffraction intensities of (200)FCC and (101)HCP of the crystal plane, respectively.
3. Results
3.1. The Physical Nature of CoCr
3.1.1. Crystal Structure
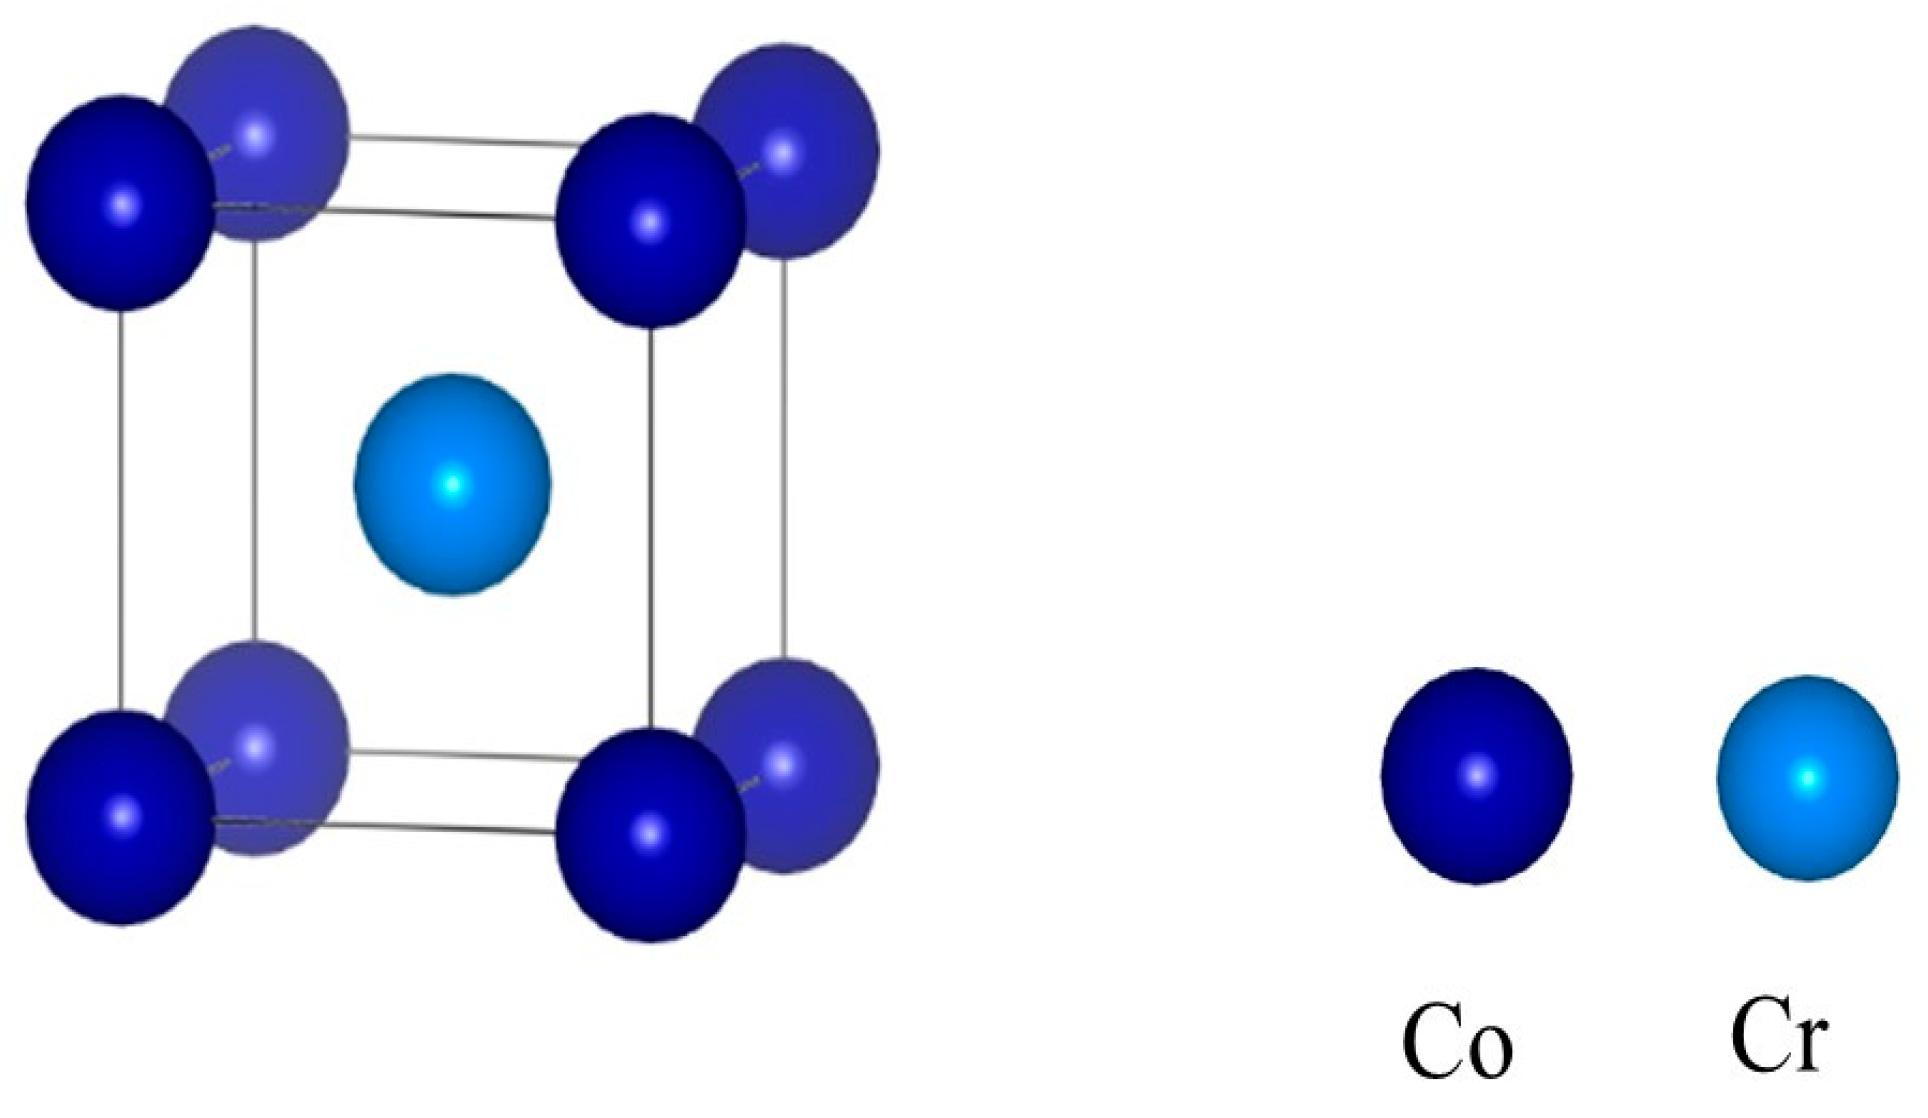
The system studied in this paper is that of Al2O3/CoCr. Before the interface modeling calculations were performed, the crystal structures of Al2O3 and CoCr were optimized to obtain the desired theoretical structure, ensuring the validity and accuracy of the calculations. Existing studies have indicated that CoCr alloys are mainly a-Co at room temperature [23], and its crystal structure is the surface center cubic structure (FCC). Since the lattice constants obtained from the Cambridge Crystallographic Data Centre (CCDC) cannot be directly used to calculate the properties of the material, this study first optimized the model structure into a stable structure to make the model closer to the real structure. The CoCr alloy is mainly a binary alloy, and the main elements are Co and Cr, with Co as the main component and the solid solution of the Cr element forming austenite with FCC crystal structure. Therefore, this paper focuses on Co and Cr elements in 1:1 modeling [24]. Figure 4 shows the optimized CoCr crystal structure, and the established crystal model is calculated as 2 × 2 × 2 crystal supercells.
3.1.2. Electronic Structure
This calculation is based on density functional theory, using a first-principles pseudopotential method, which was implemented in a generalized gradient approximation framework and used the PBE functional, the KS equation, and a super-soft pseudopotential to describe the interaction between valence electrons and the real ions. During the calculation process, the plane-wave cut-off energy ENCUT and K-point values were optimized first to ensure the accuracy of the calculation and then to increase the plane-wave cut-off energy with a very small change in the total energy of the system; we then considered the size of the calculation quantity and chose a reasonable value. After optimization, the maximum cut-off energy calculated by plane waves in inversion space was 450 eV, the convergence accuracy of single-atom energy was 1.0 × 10⁻⁵ eV, there were 8 × 8 × 8 Brillouin area K points, the self-consistent iteration was 300 times, the average atomic force was not more than 0.4 eV/nm, and all parameters converged. The theoretical value of the CoCr lattice constant was obtained by calculating the total crystal cell energy of the bulk material varying with the lattice constant. The lattice parameters obtained after the calculation and optimization are shown in Table 2. The table shows that the optimized lattice parameters are approximated to the theoretical value.
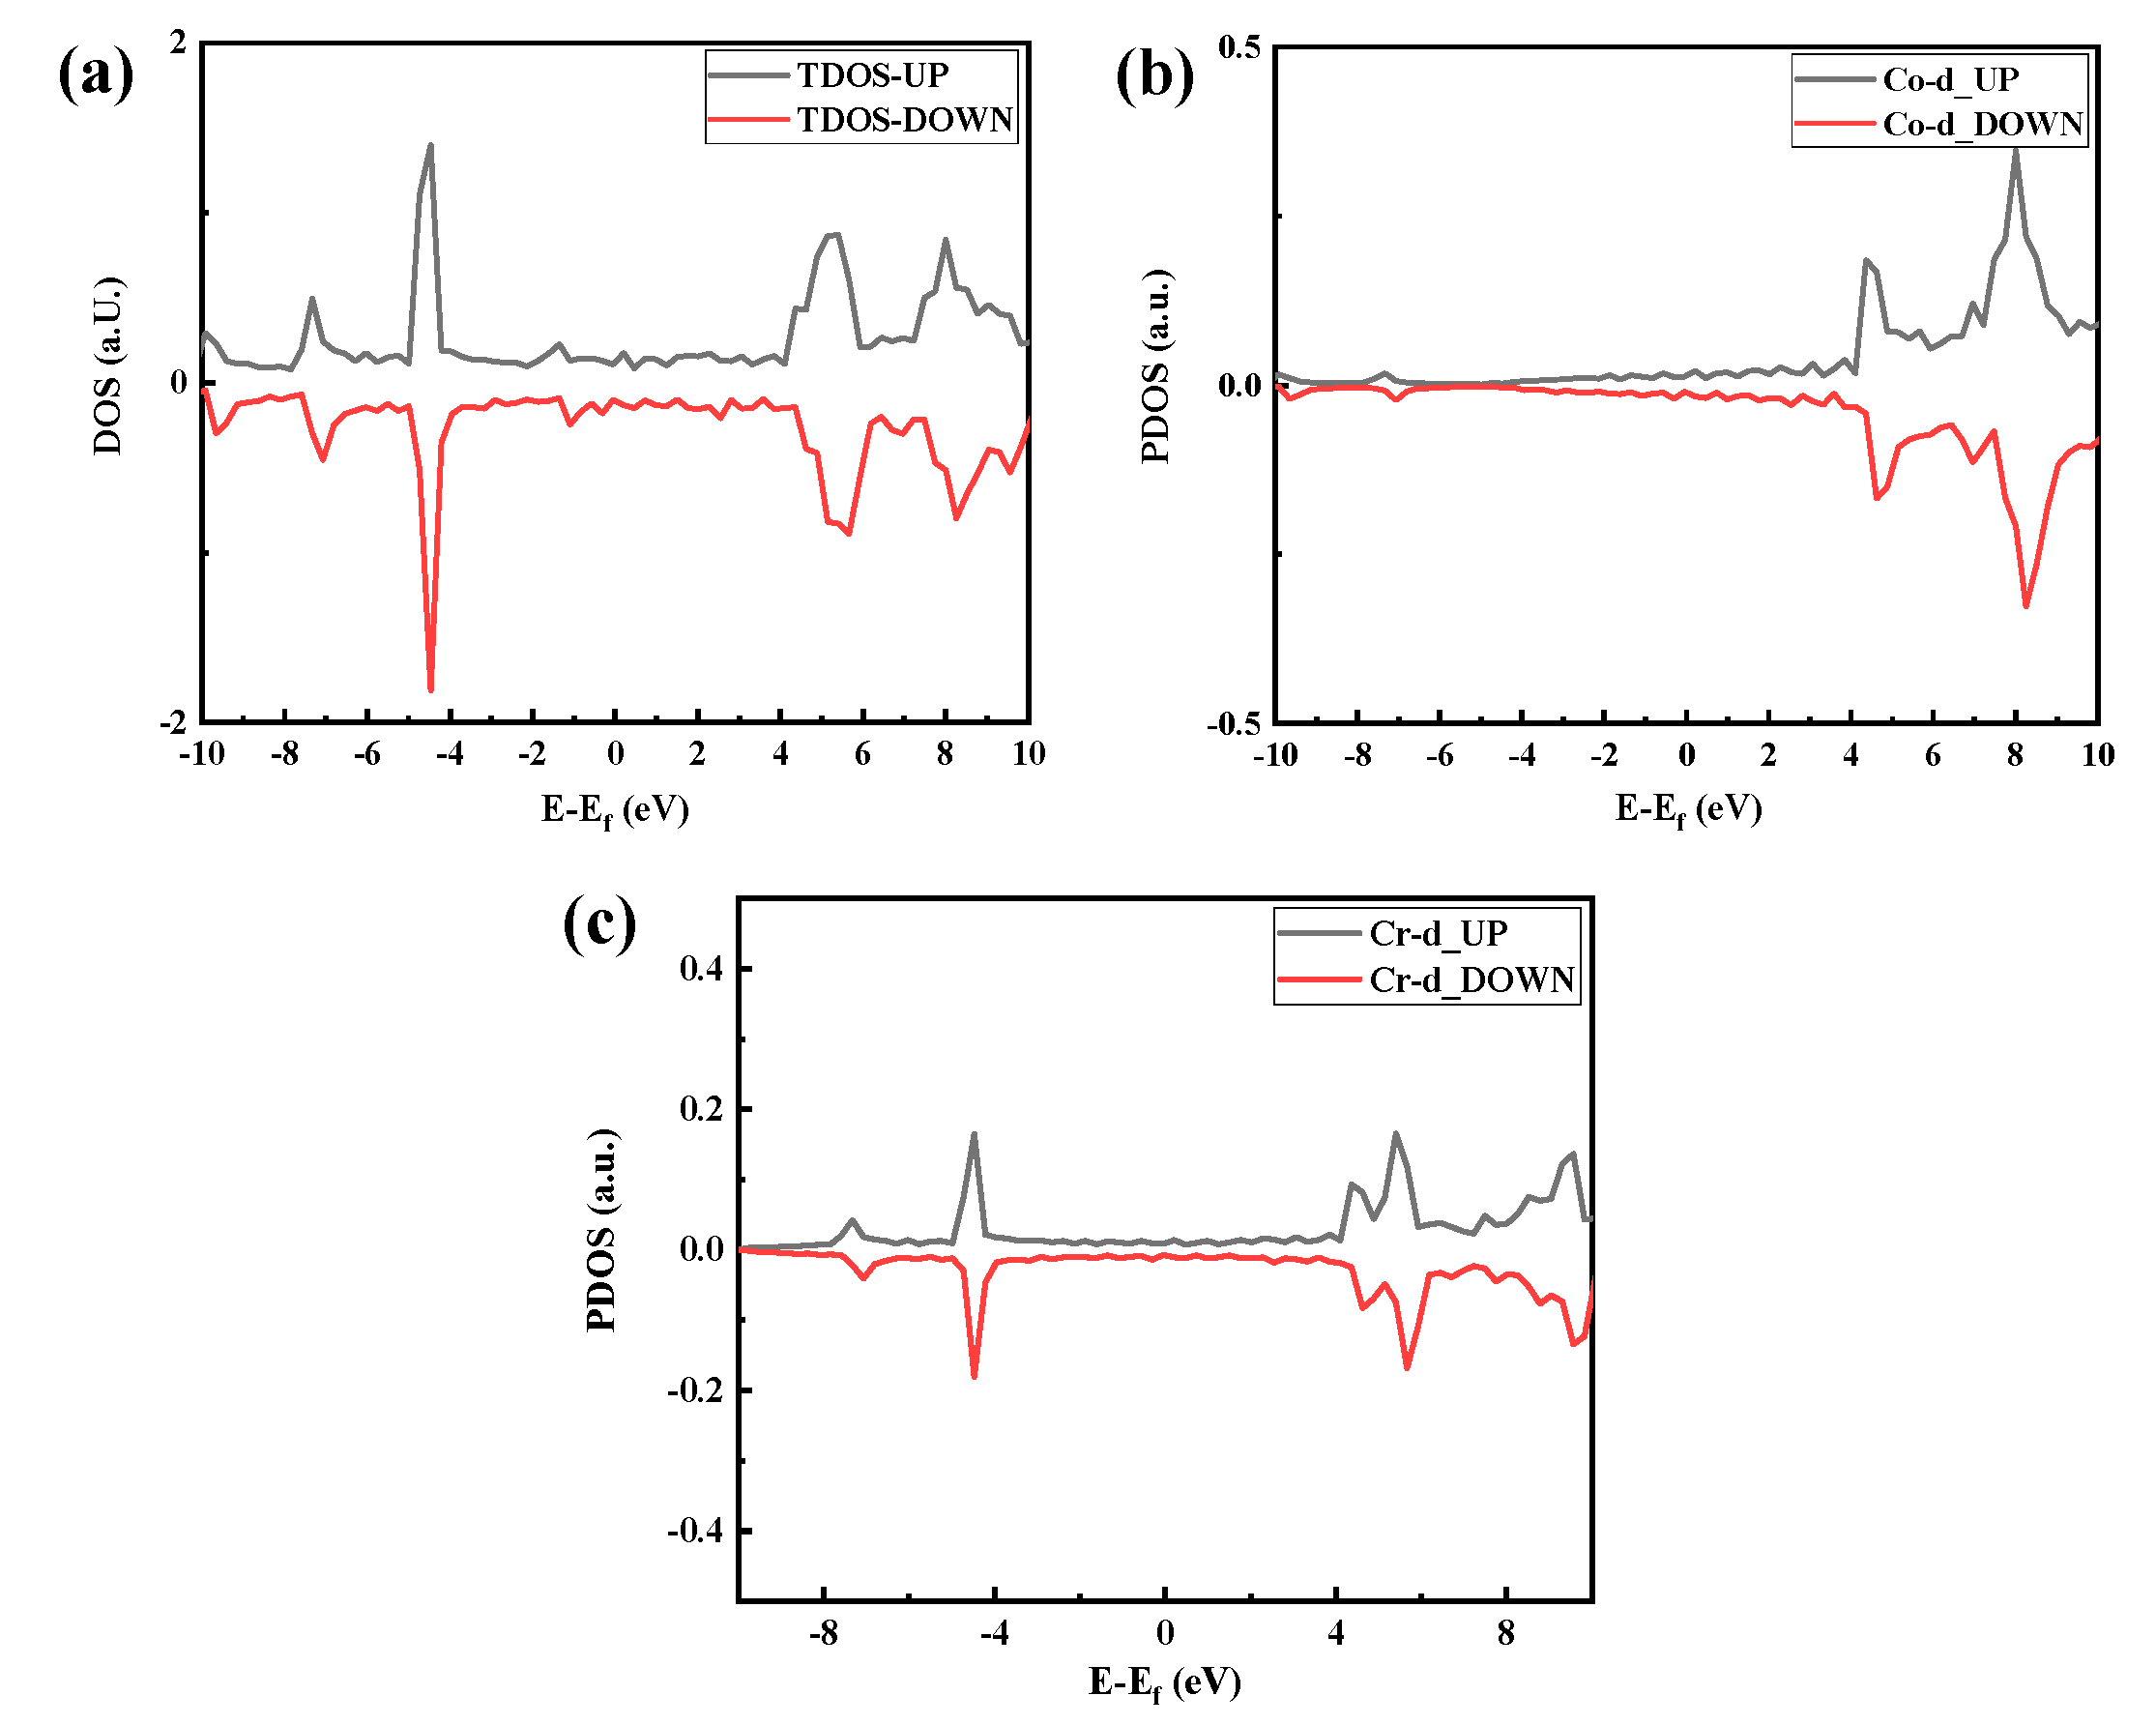
The density of states (DOS) of the optimized CoCr crystal structure is shown in Figure 5. As shown in Figure 5a, the body-phase CoCr DOS has an asymmetric distribution, indicating that the body-phase CoCr is magnetic. Therefore, Figure 5a–c have both spin-up and spin-down parts.
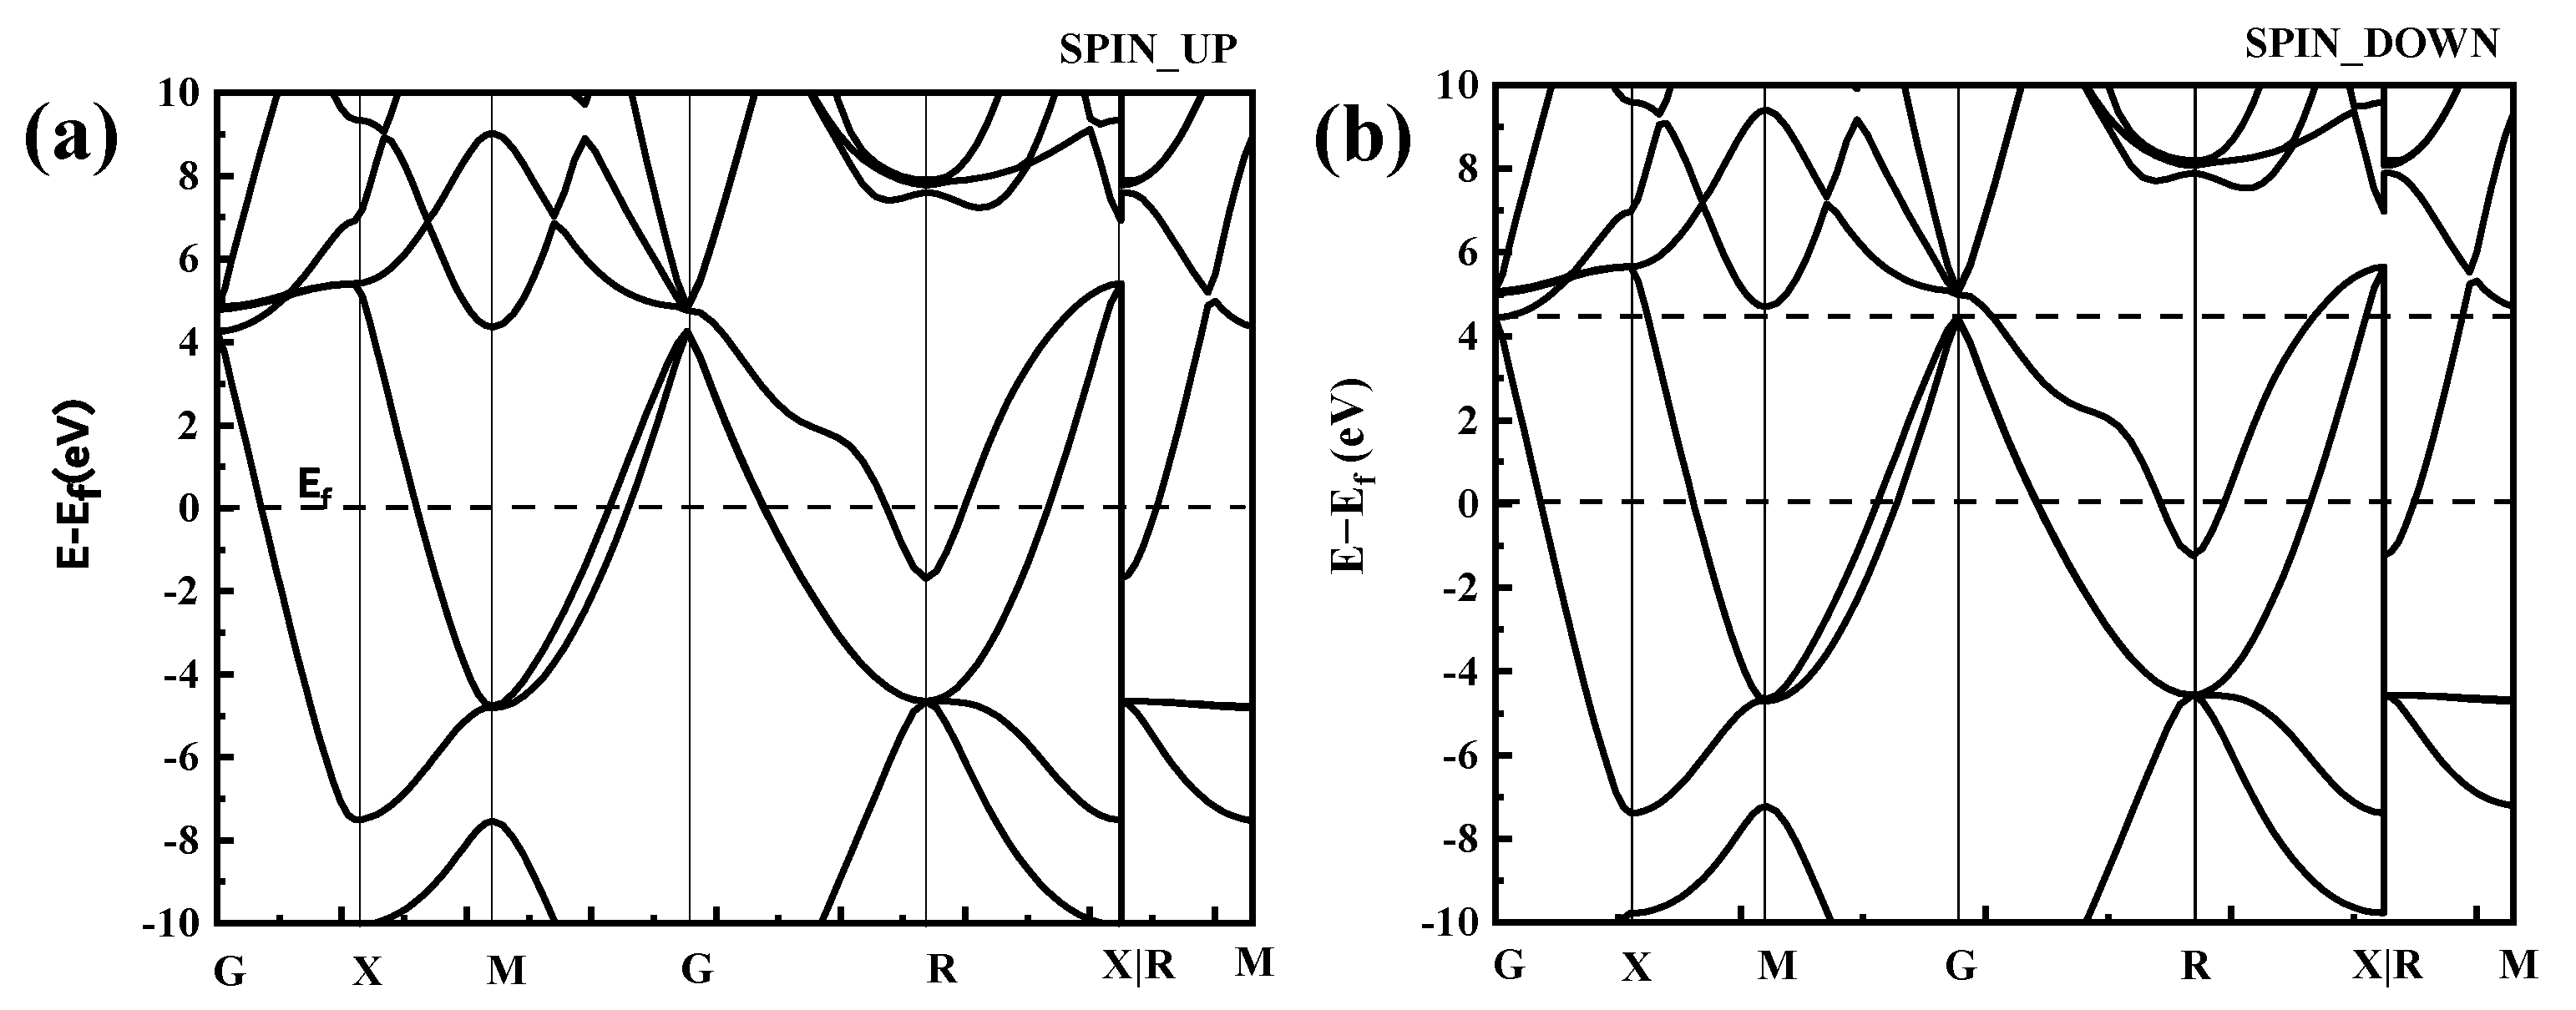
In the distribution of the upward spin density of states shown in Figure 5a, there are three bonded main peaks in the conduction band below the Fermi level at −0.3 eV, −0.5 eV, and −1.8 eV, with a strong electron distribution band gap. Among them, the upper and lower spin densities of states of the −1.8-eV peak close to the Fermi level have a large density of states spanning the Fermi level, and they span the conduction band where the Fermi level continues from the valence band to above the Fermi level; thus, the valence and conduction bands can overlap at the Fermi surface, as shown in Figure 6.
Figure 5c shows that the band gap of the Cr electrons is relatively small, with the spin-up band gap being 0.14 eV and the spin-down band gap being 0.075 eV. The Fermi level line spans the energy band but has a small density of states. The split density of the state map (Figure 5b,c) further shows that both Co and Cr electrons act on the Fermi level and that Co electrons act on the Fermi level more than Cr electrons.
3.2. The Physical Nature of Al2O3
3.2.1. Crystal Structure
The phase structure of Al2O3 includes α-Al2O3, θ-Al2O3, χ-Al2O3, γ-Al2O3, δ-Al2O3, and β-Al2O3, and α-Al2O3 is the most commonly used [26]. O ions accumulate in the HCP, and Al ions fill the octahedral gap because the number ratio is 2:3; thus, there will be position vacancies. Note that γ-Al2O3 is generated by aluminum hydroxide dehydration at lower temperatures, O ions accumulate with ccp, and Al ions irregularly occupy the octahedral and tetrahedral gaps surrounded by oxygen ions. Therefore, the hardness of the crystal is not high, and it has a large surface area, high catalytic activity and adsorption force, and a livelier nature than the α type. The crystal structure properties of all structural Al2O3 are given in Table 3 [27]. As can be seen from Table 3, the γ phase is a cubic structure with small density and particle size in the metastable state. The θ phase is a monoclinic structure, a transition phase, and metastable state. The α phase is the ground-state phase for Al2O3, and the density and particle size are the largest among the three phases.
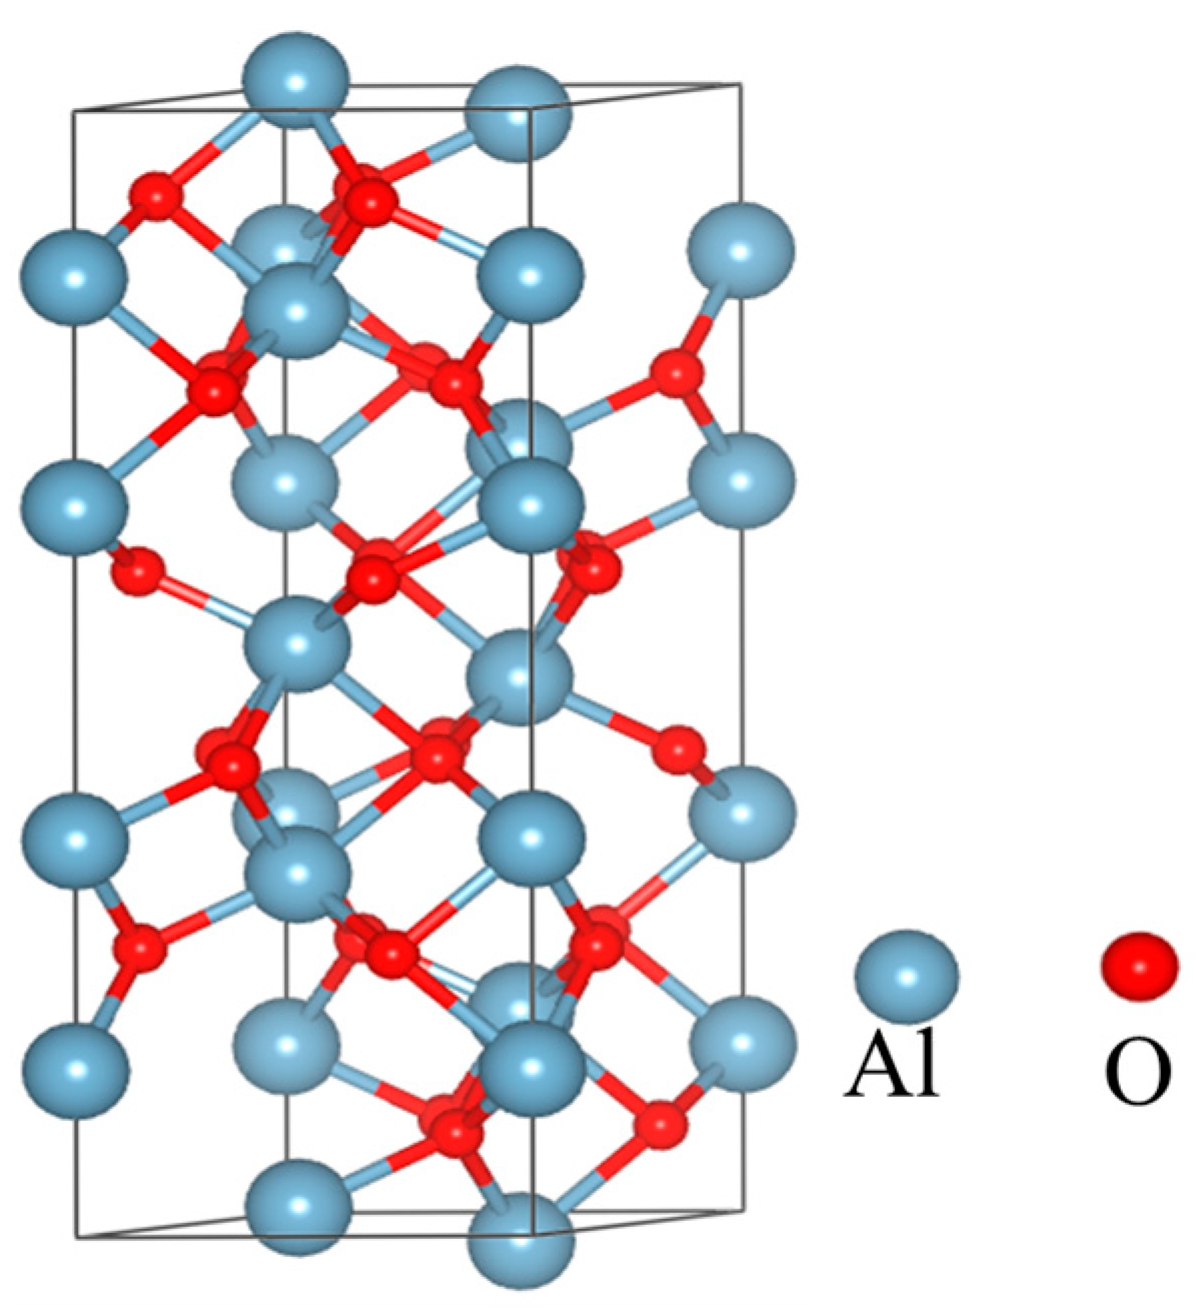
Studies have shown that the crystal structure of α-Al2O3 is the most compact, with high resistivity, good insulation, and thermal stability in all Al2O3 [28,29]. In the field of dental applications, α-Al2O3 has stable chemical properties and is often used to make bioceramics. Therefore, after comprehensive consideration, we decided to use α-Al2O3. After optimization and static calculation, the optimized crystal structure is shown in Figure 7.
The crystal structure parameters are shown in Table 4, and they are optimized to agree with the theoretical values.
3.2.2. Electronic Structure
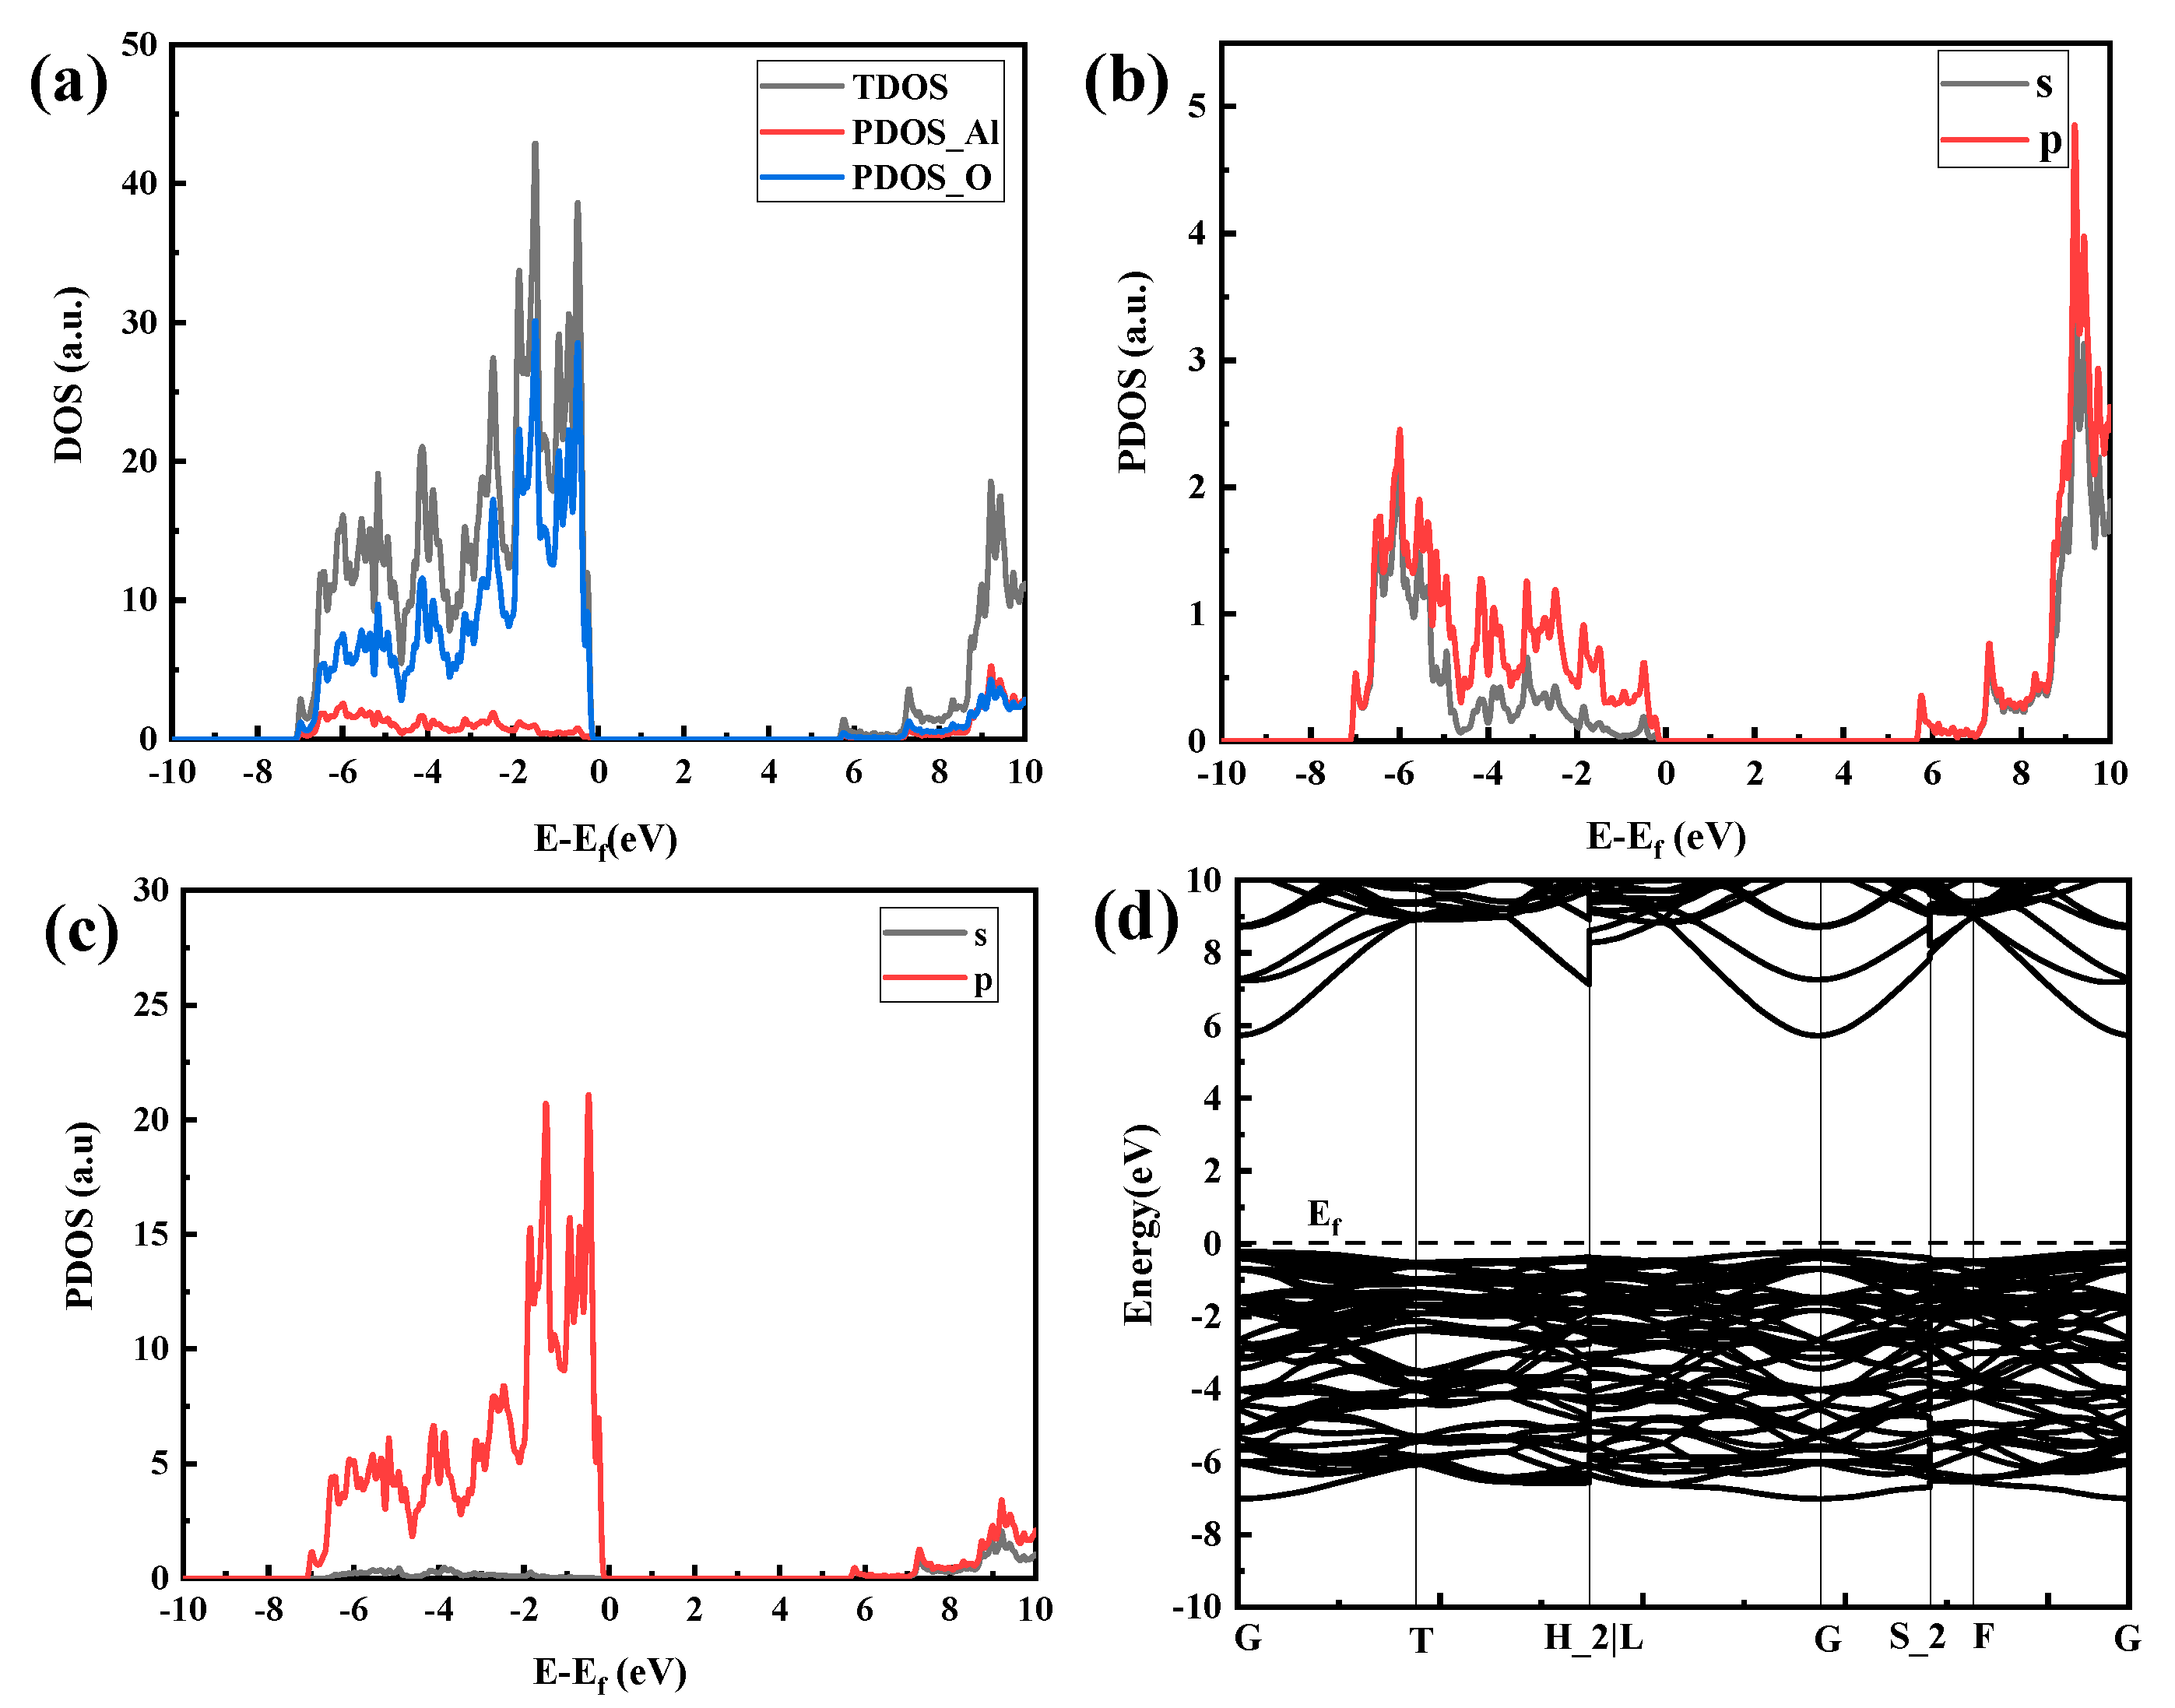
The electronic configuration of O is 1s22s22p4, and the electronic configuration of Al is [He] 3s2 3p1. Figure 8 shows the DOS and band structure of the α-Al2O3 crystal structure. Figure 8a is the total density of states of the system. It can be seen that the density of states near the Fermi level is not zero, indicating that the system has a certain conductivity, and the conduction band’s bottom and the valence band’s top overlap. According to the correspondence between the density of states and the band structure, the density of states of the lower-energy part of Figure 8a–c (−7 eV~−0.1 eV) corresponds to the low-energy band of Figure 8d, and the density of the high-energy part (6 eV~10 eV) of Figure 8a–c is produced by the high-energy band of Figure 8d, where the sharp density peak is relatively flat and the delocalization is stronger. Figure 8b represents the split-wave electron densities of the 3s and 3p orbitals of Al. Figure 8c shows the electron density of split wave states at 2s and 2p orbitals of O. The density of states in the low-energy part corresponds to the bonded molecule orbits of most electronegative atoms, namely, O atoms. It can be seen from Figure 8c that the density of states of O2s electron orbitals contributes the most in the low-energy part. For the density of states at high energies, the opposite is true, which is mainly because of the atomic orbitals of Al atoms. Comparing (b) and (c) in Figure 8, it can be seen that the density of states exhibits a “resonance” phenomenon, indicating that they have been bonded.
3.3. Convergence Test
This section determines the surface convergence tests based on the (100), (110), (111), and (111) faces of α-Al2O3 in CoCr. CoCr (100), (110), and α-Al2O3 (111) are then put into α-Al2O3 (111)/CoCr (100), α-Al2O3 (111)/CoCr (110), and α-Al2O3 (111)/CoCr (111) to calculate the interface binding work and interface energy of the three interface models, as well as to analyze the charge density and state density, explore the bonding and interface binding strength, and explain the heterogeneous nuclear potential of Al2O3 on the CoCr matrix.
3.3.1. The Convergence Test of Al2O3
In order to fully simulate the internal microstructure of the material, the spatial structure of the model must be reasonably established. In the model, the spatial structure is mainly realized by the layer thickness. Only when the atomic layer thickness reaches a certain thickness can the most accurate simulation calculation results be obtained. To maximize computational efficiency, a convergence test is used to obtain the most suitable atomic layer thickness. In this study, the surface energy of atomic layers 4, 5, 6, and 7 are tested, and the surface energy is calculated as shown in Equation (2).
Here, is the total energy after the N-layer atomic model is completely escaped, ΔE is obtained by ()/2, and N indicates the number of atomic layers.
The calculation results of the surface energy are shown in Table 5. The surface energy is an important indicator to measure the surface stability of the model. The smaller the surface energy is, the more stable the surface model is. As can be seen from Table 5, convergence is reached at layer 7, with a surface energy of 0.43239 J/m2.
3.3.2. The Convergence Test of CoCr
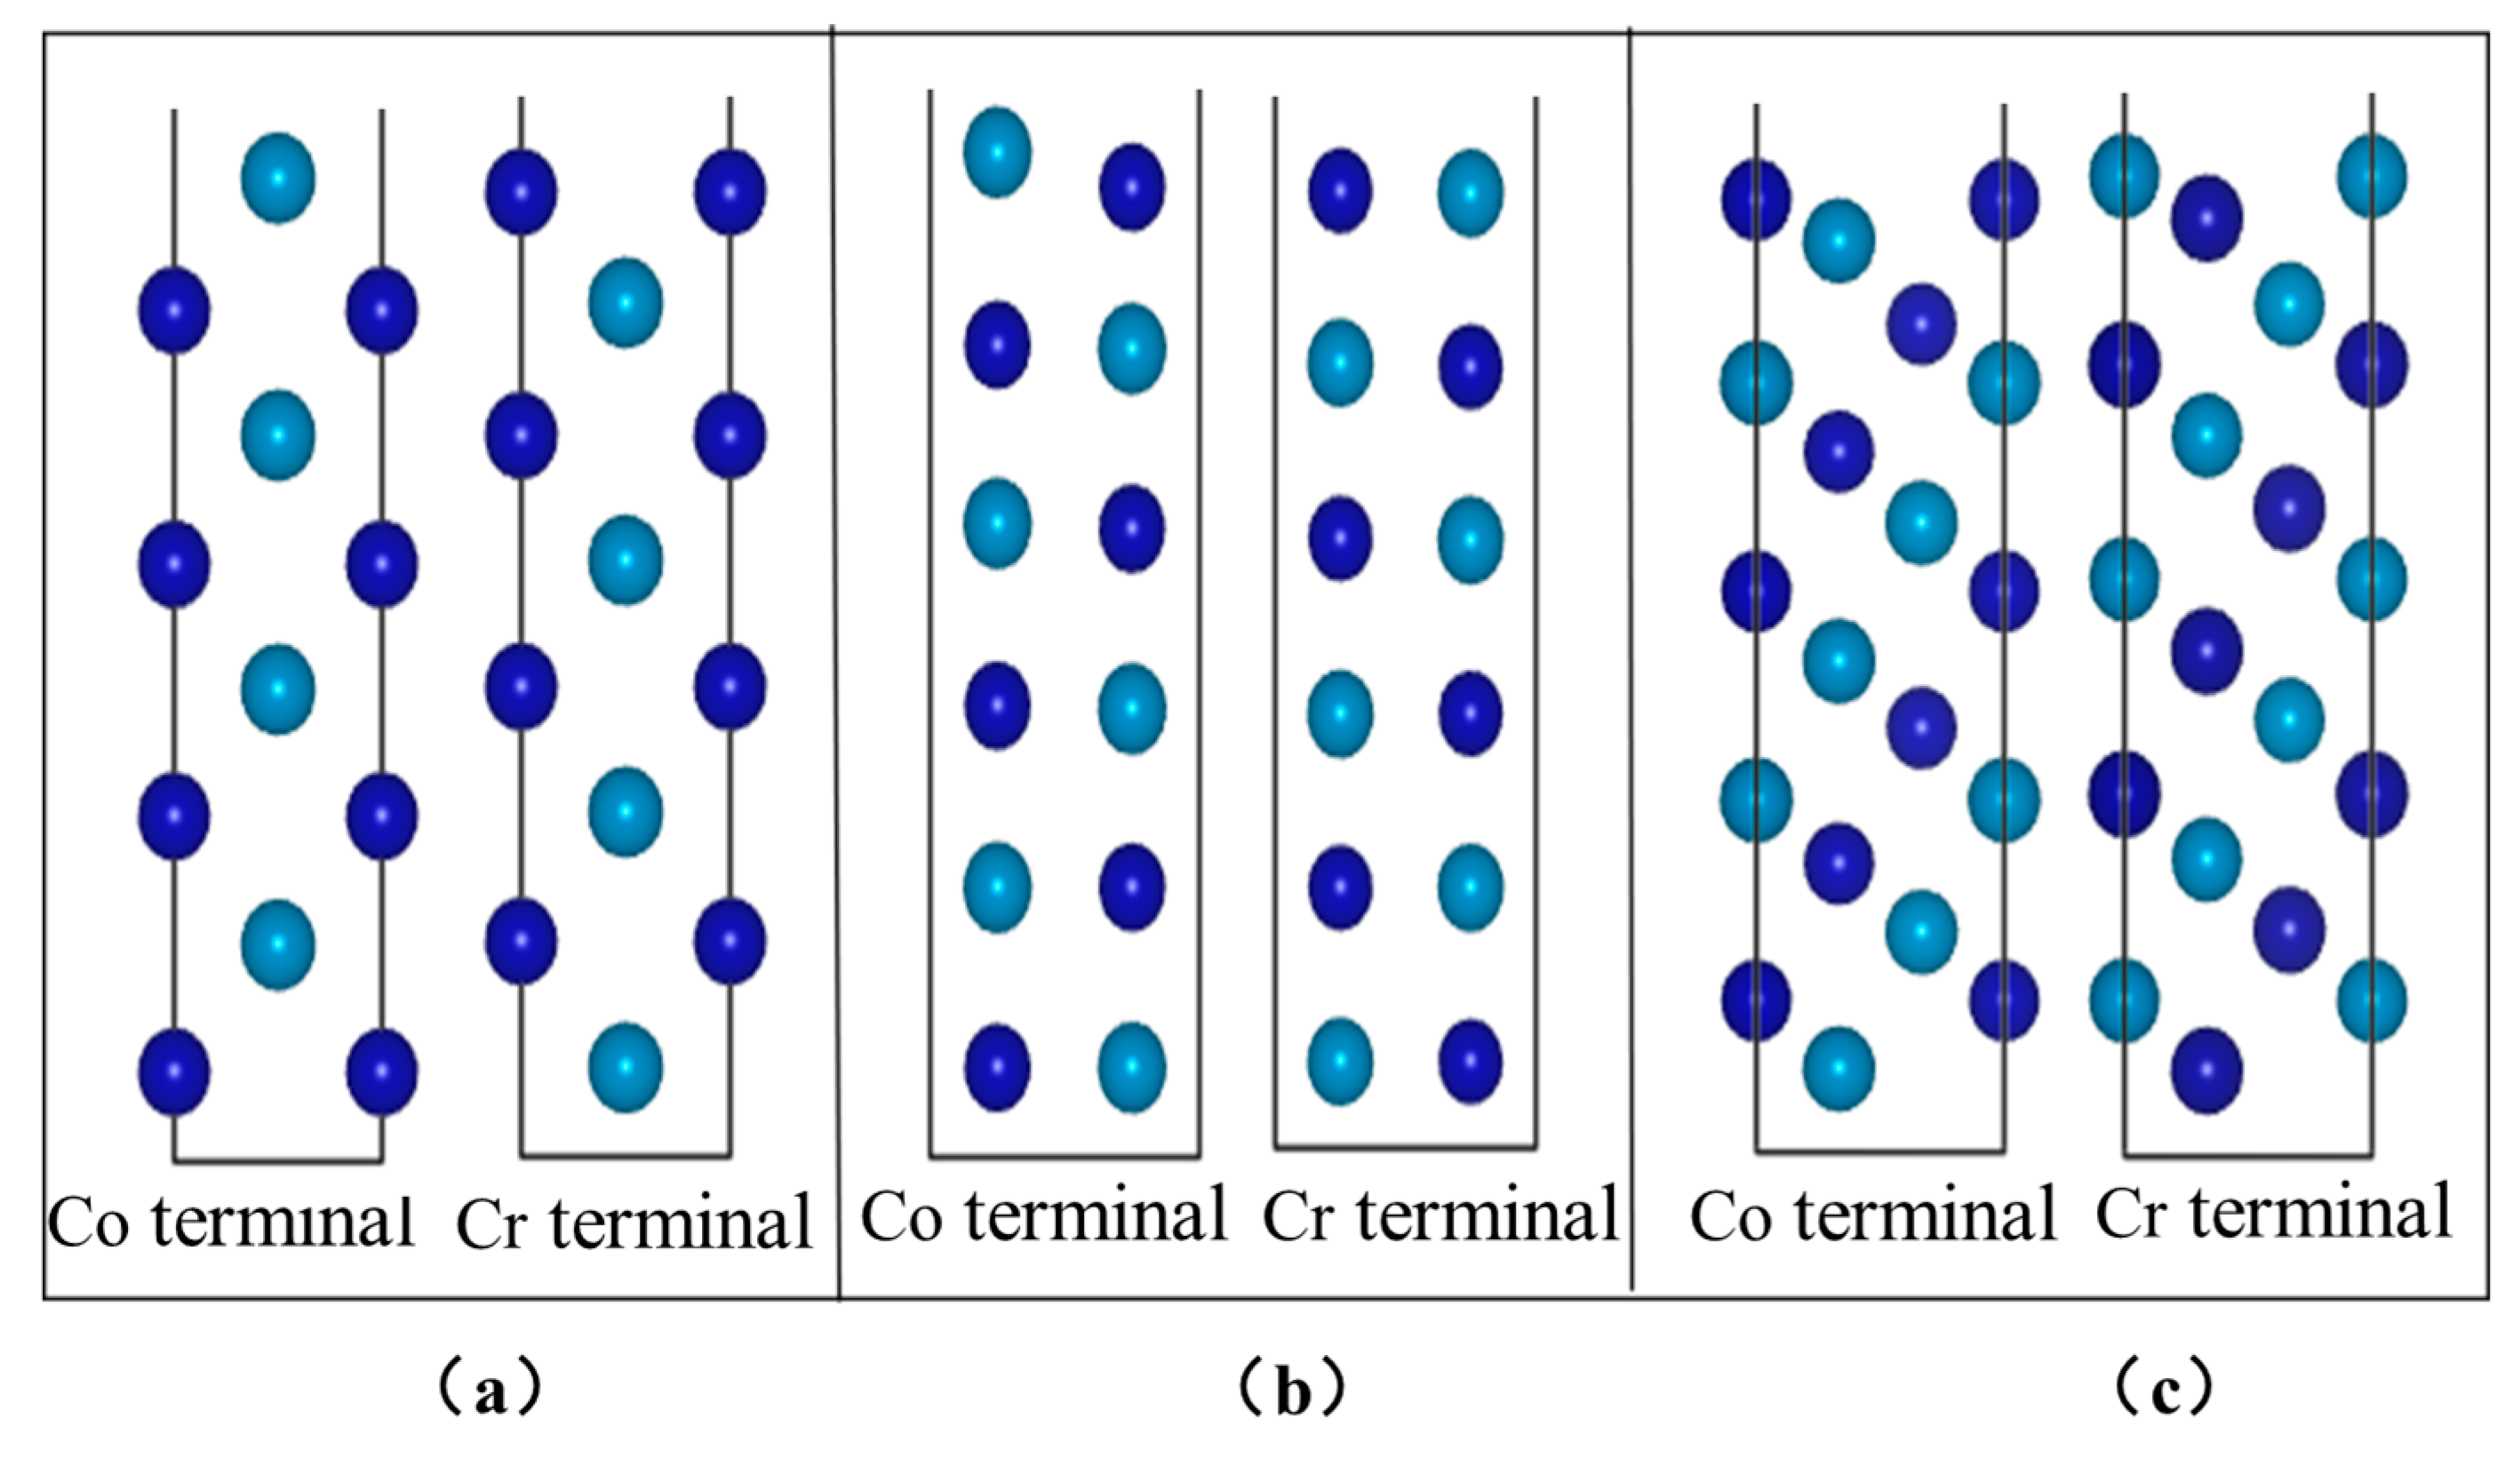
Table 6 shows the surface energy under different exponential surfaces of CoCr calculated using Equation (1). As shown in Table 6, the CoCr (100) surface model achieves convergence at eight layers, with a surface energy of 2.12 J/m2. The CoCr (110) surface model reaches convergence at six layers, with a surface energy of 2.31 J/m2. The CoCr (111) surface model reaches convergence at the seventh layer, with a surface energy of 2.31 J/m2. Figure 9 shows the combination of convergence layers.
3.4. Al2O3/CoCr Interface Calculation
In this study, three interface models of Al2O3 (111)/CoCr (100)/CoCr (111), Al2O3(111), and Al2O3 (111)/CoCr (111) (shown in Figure 10) were constructed. The degree of lattice mismatch of the interface was calculated based on the lattice constants of the experimental study based on Equation (3), and the results can be found in Table 7. When modeling, the interface mismatch constituted by the selected two-body phase is required to be as small as possible, and it is generally considered to constitute a stable interface [30] within 8%. As can be seen from Table 7, among the three interface models constructed, the Al2O3 (111)/CoCr (111) interface structure has the minimum lattice mismatch, only 7.41%, indicating that the Al2O3 (111)/CoCr (111) interface structure is the best of the three interface structures, with the least interface tension, and Al2O3 and CoCr have the best mutual wetting performance. A preliminary analysis showed that the Al2O3 (111)/CoCr (111) interface structure is the most likely to contain heterogeneous nuclei.
In Equation (3), α1 and α2 are the lattice constants at the two-phase interface.
3.4.1. Al2O3/CoCr Interface Model
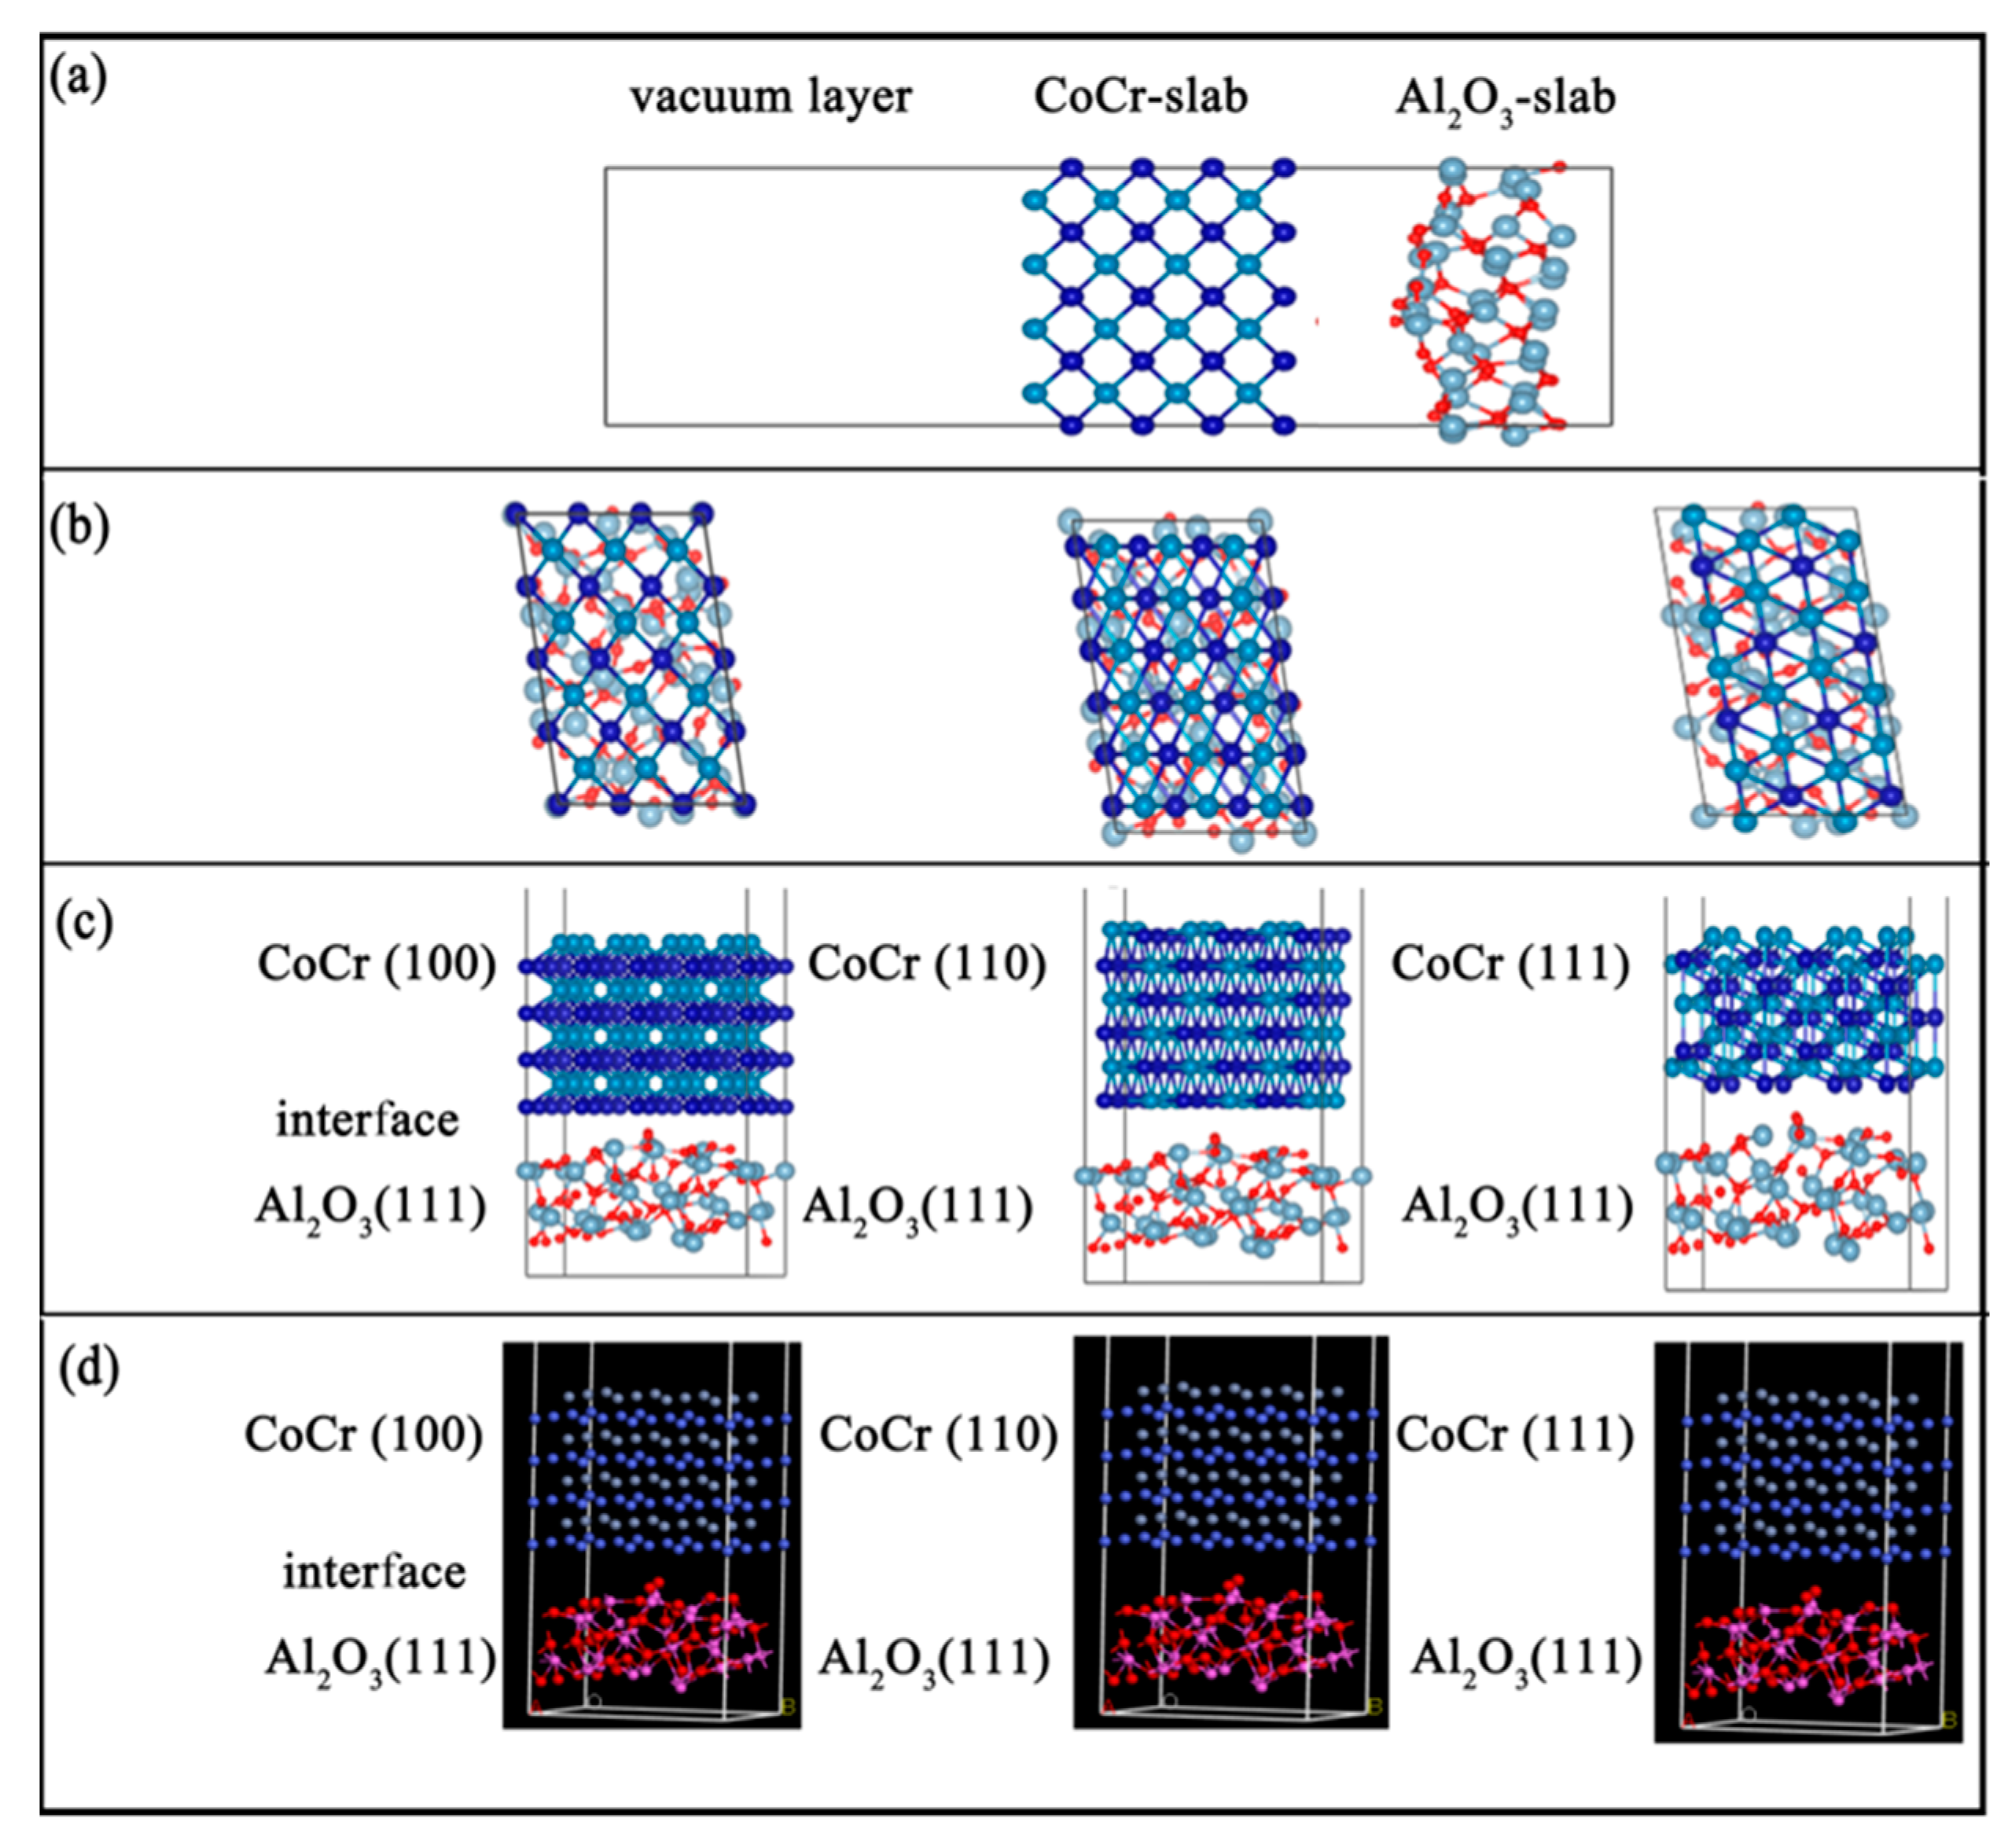
Al2O3 is not consistent with the lattice constant of the CoCr surface protocell model, directly preventing the construction of the interface model. In order to meet the periodic boundary conditions and the lattice coherence relationship, suitable crystal cells in the Al2O3 and CoCr surface atomic supercell model (Figure 10a) were found to construct the interface model (Figure 10b). According to the convergence test results, the surface structure of the Al2O3(111)’s seventh layer, the surface structure of the CoCr (100)’s eighth layer, the surface structure of the CoCr (110)’s seventh layer, and the surface structure of the CoCr (111)’s sixth layer, we built the Al2O3(111)/CoCr (100), Al2O3 (111)/CoCr (110), and Al2O3 (111)/CoCr (111) interface models (Figure 10b–d), and we built a vacuum layer of 15 Å above the models to prevent their interaction.
It can be seen from Figure 11c,d that the interface is mainly combined by the Co–O connection interface. The Co–O key length is 1.936 Å at the Al2O3 (111)/CoCr (100) interface, the Co–O key length is 2.016 Å at the Al2O3 (111)/CoCr (110) interface, and the Co–O key length at the Al2O3 (111)/CoCr (111) interface is 1.782 Å. It can be inferred from the key length that the strongest bond cooperation is between the Co and O atoms on the Al2O3 (111)/CoCr (111) interface, and the interface-binding mode is more conducive to the combination of the two phases; however, the final evaluation of the interface binding ability still requires comprehensive interface binding work and separation work.
3.4.2. Al2O3/CoCr Interface Binding Performance
At present, the ceramic/metal interface binding performance can be determined by combining the work of adhesion (Wad) [7,15], the work of separation (Wsep), and the interface formation energy (Efor) because the greater the ceramic/metal interface binding work, the more energy is needed to separate the interface. The interface binding work is calculated as shown in Equation (4) [18]. Separation work is the energy required to separate the interface into two free surfaces, and its calculation formula is shown in Equation (5). As with the interface binding work, greater separation work of the Al2O3/CoCr interface indicates that the Al2O3 and CoCr interface binds stably and is more difficult to separate, so the interface binding strength is high, which is very desirable in practical applications. Therefore, the physical quantity of separation work can represent the binding strength of the interface very well. The formation energy refers to the required energy per unit area of the system forming the interface model from the two bulk phases, and it is calculated as shown in Equation (6) [31]. Equation (6) is often used as the thermodynamic stability criterion of interface models. It can be seen from Equation (6) that when the interface formation energy is small, the energy required to form the Al2O3/CoCr interface is also small, indicating that the interface model is more stable at this time.
In the equation, , , and are the total energy of both the surface model and the interface model, and A is the surface area of the interface model.
In the equation, Etot and A refer to the total energy and interface area of the Al2O3/CoCr interface, respectively. In addition, EAl2O3 and ECoCr represent the total energy of the Al2O3 and CoCr layers, respectively, after removal of other layers.
In the equation, and represent the total energy of the pure Al2O3 and CoCr layers, respectively.
Interface separation work and interface formation energy are calculated using Equations (4)–(6). The calculation results are shown in Table 8. It can be seen from the calculation results that the Al2O3 (111)/CoCr (111) interface model has a maximum Wad value of 2.33 J/m2, indicating that the Al2O3–CoCr electron interaction and charge transfer are strong at the Al2O3 (111)/CoCr (111) interface. At the same time, Wsep is 2.12 J/m2 and Efor is 0.11 J/m2. It can be inferred that the Al2O3 (111)/CoCr (111) interface model is the model with the most energy advantage and thermal stability. Among the three interface models, the lowest formation energy of the Al2O3/CoCr (111) interface model corresponds to the highest interface binding strength. It is understood that the higher interface strength suggests stronger interactions and interface binding between the interface atoms, resulting in the two bulk phases releasing more energy during the interface formation, thus creating a more stable interface.
3.4.3. Combination Nature of the Al2O3/CoCr Interface
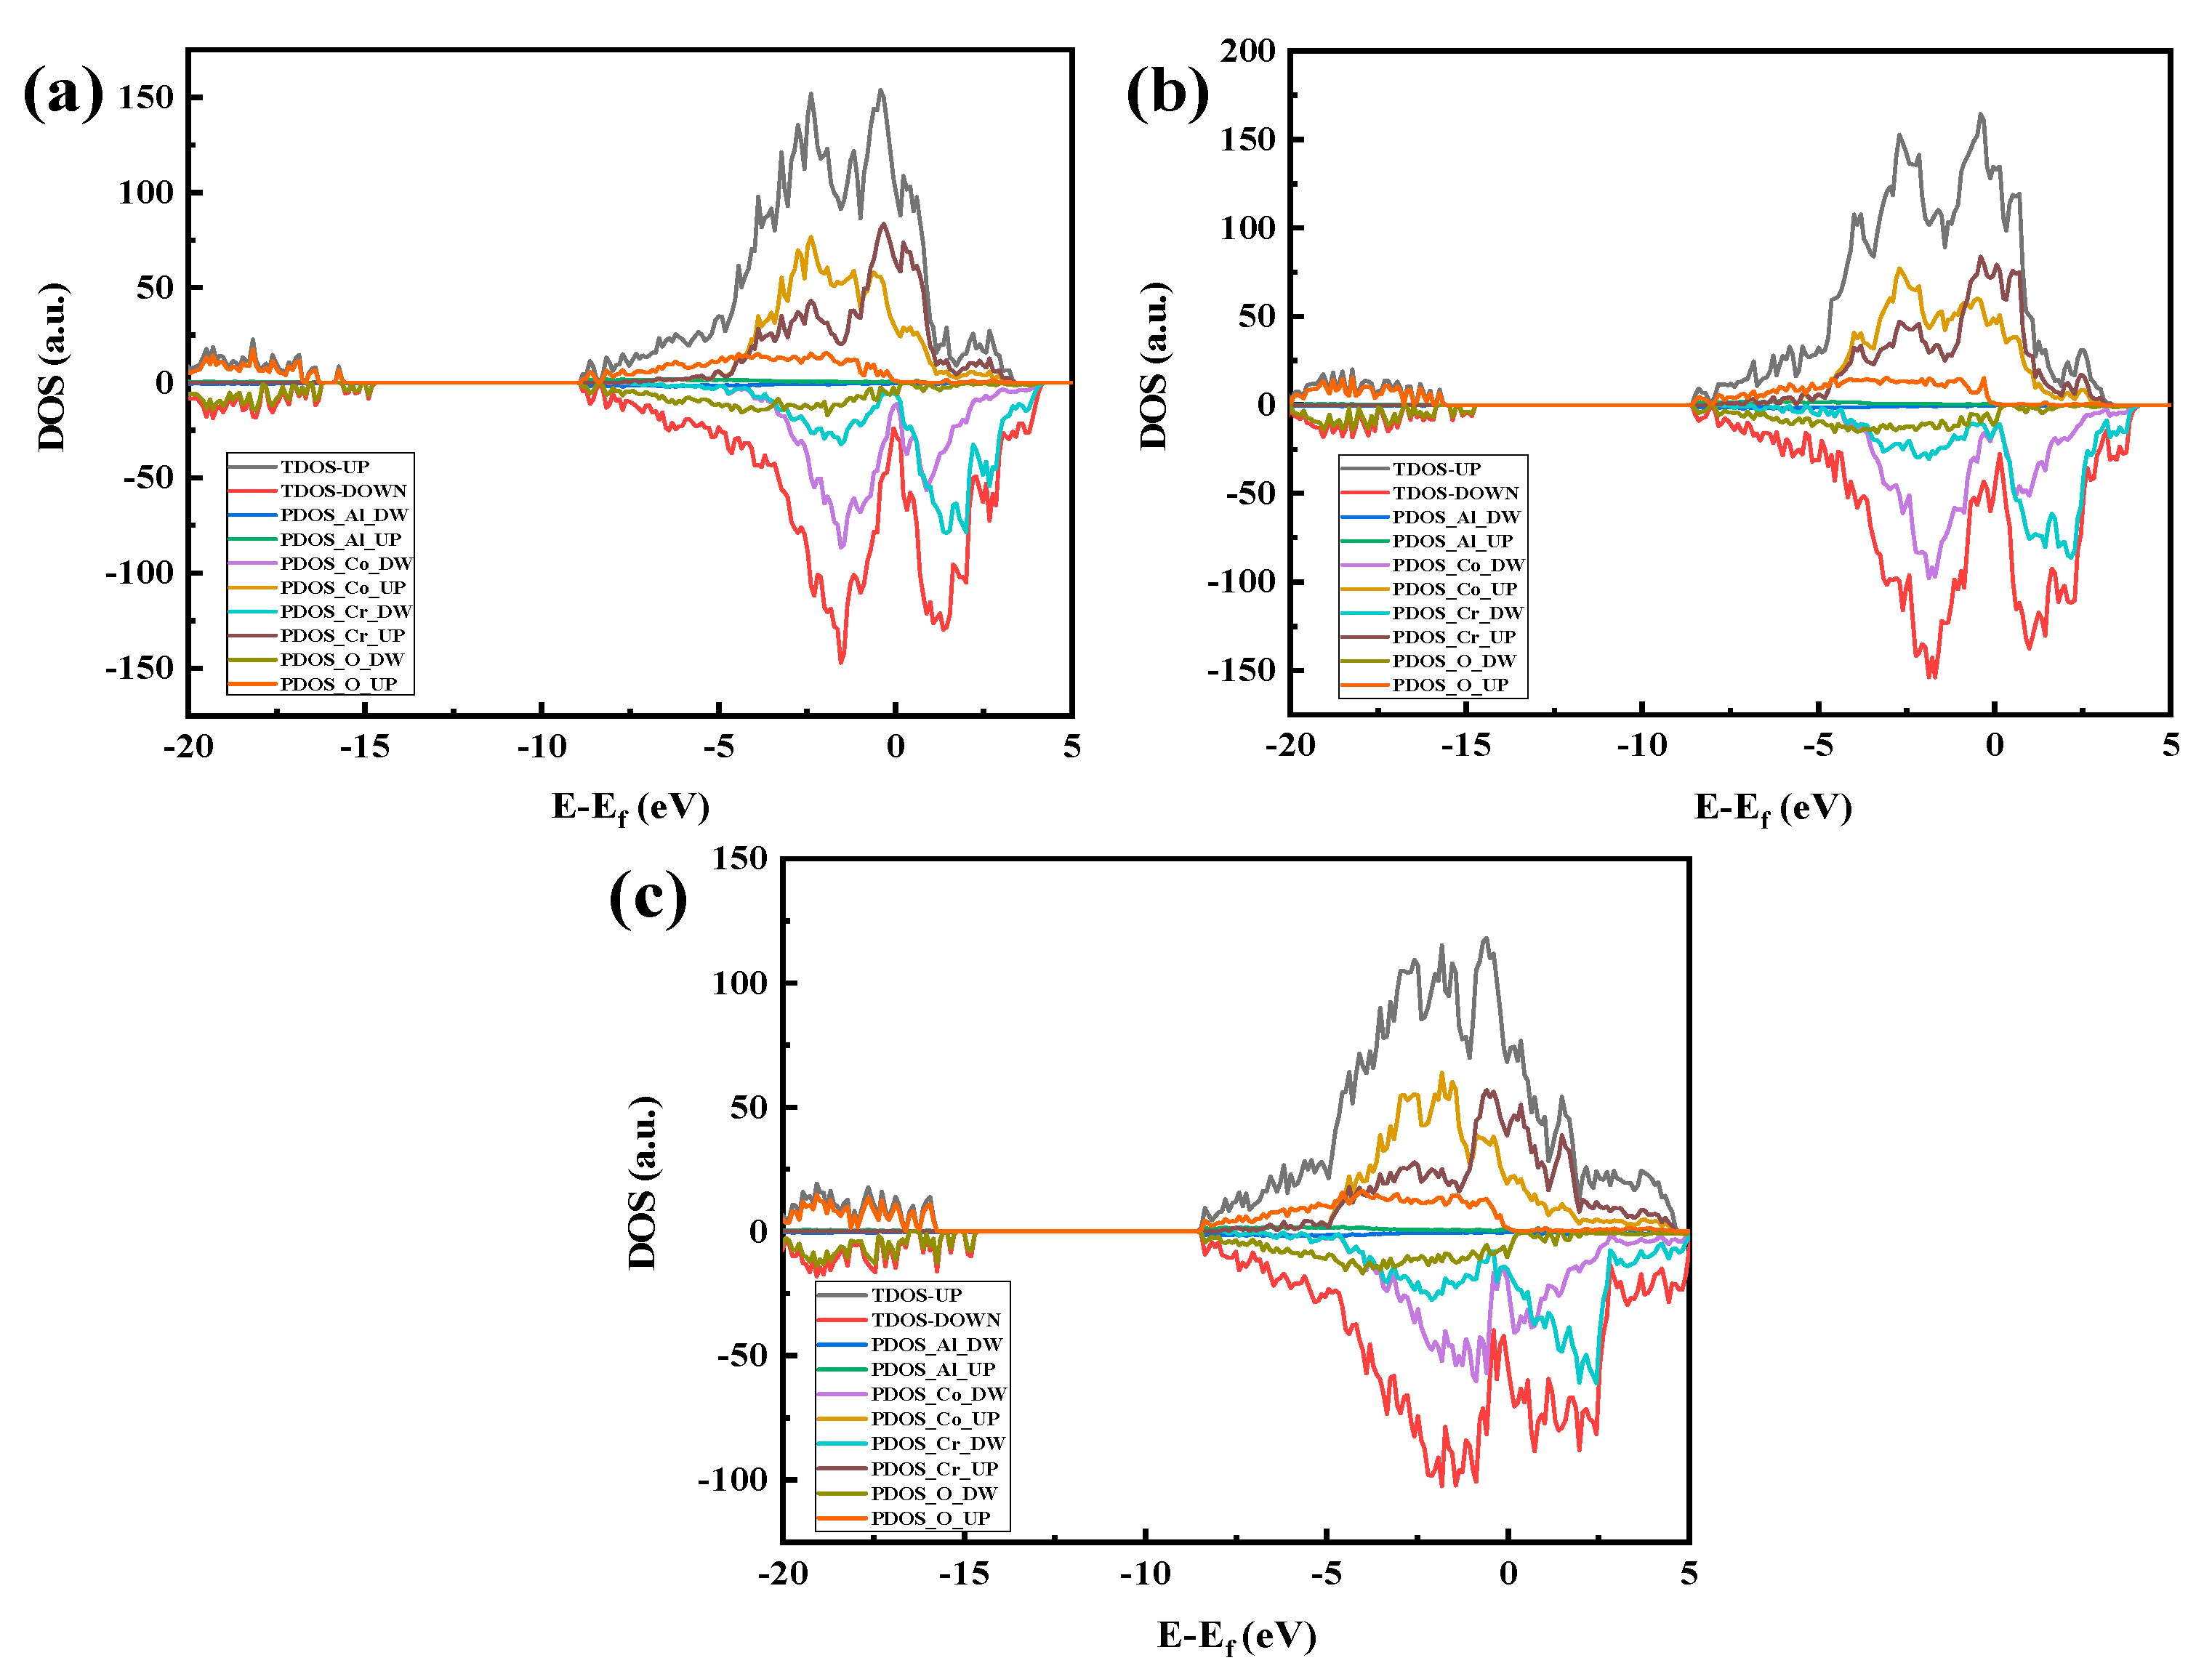
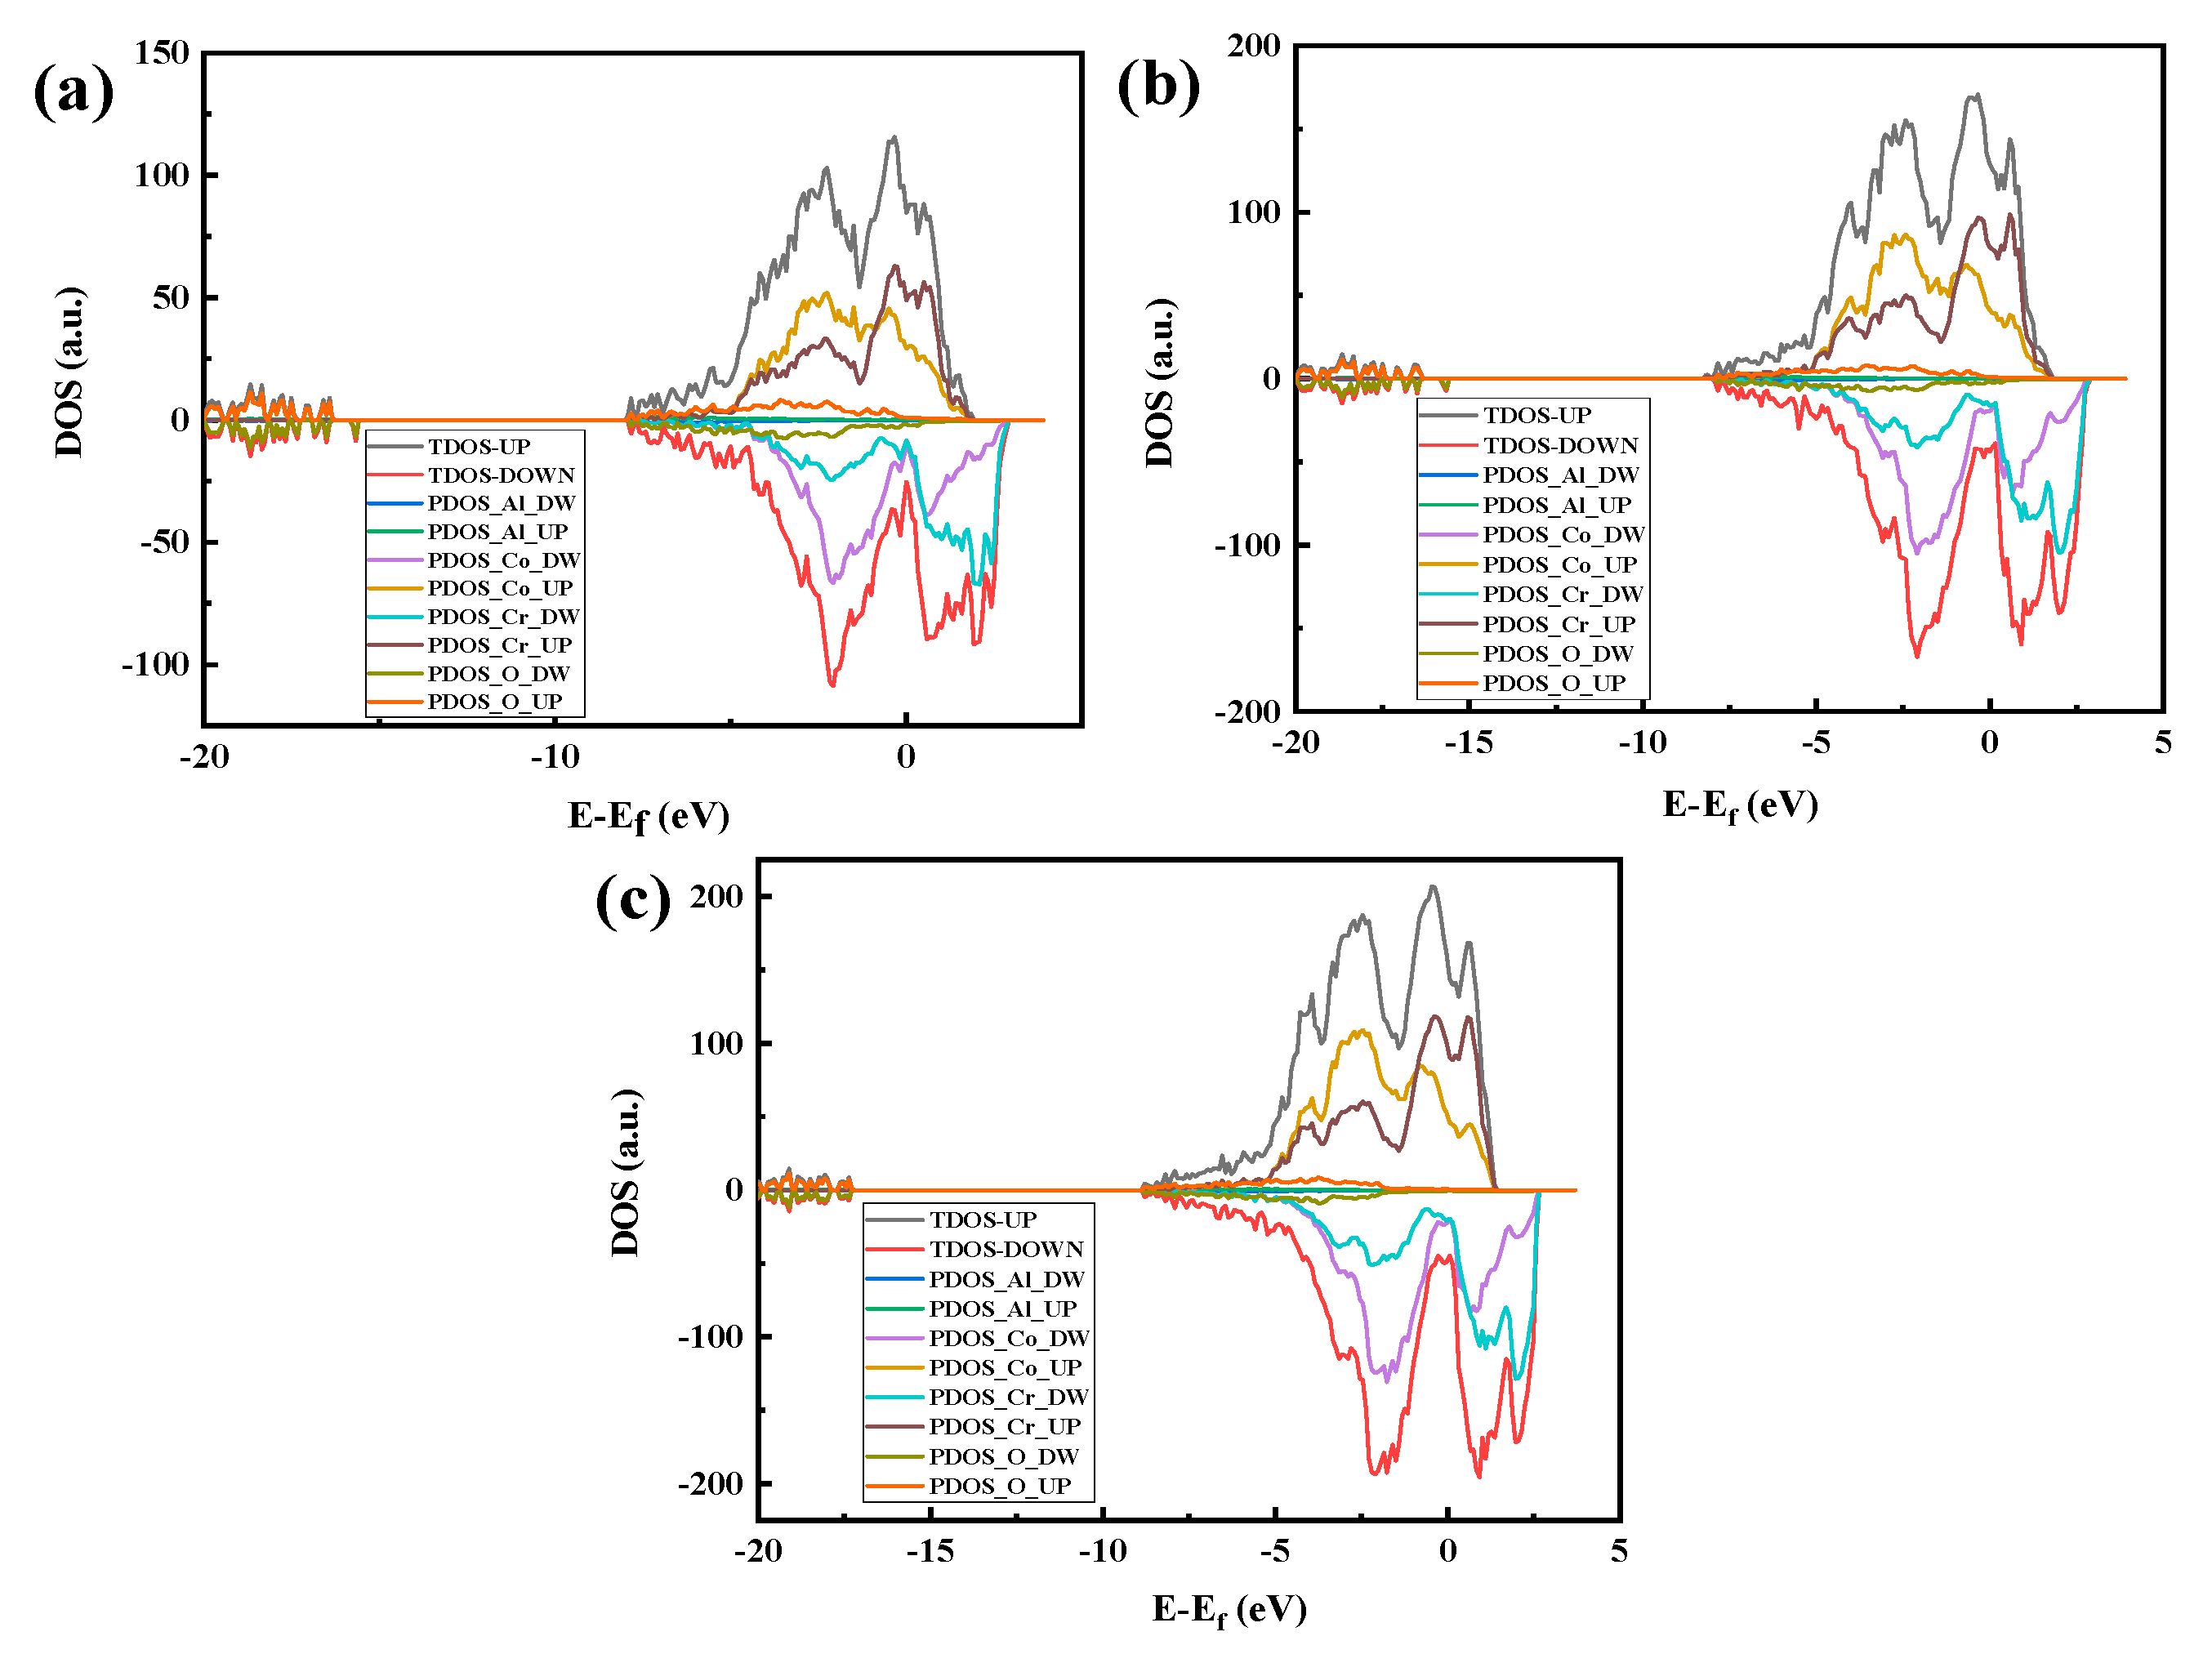
In the previous section, the Al2O3 (111)/CoCr (111) interface was shown to have the strongest binding ability. Next, we continue with the interface electronic structure and bonding situation of the model to reveal the nature of the Al2O3/CoCr interface binding. Figure 12 shows the part-wave electron density of the state diagram of the three crystal structure models, with the peak positive and negative density of states representing the upward and downward density of their spin polarization, respectively. As can be seen from Figure 11, the three models have large electron overlap in the valence bands below the Fermi level (0 eV). These overlaps are bond orbits, forming shoulder-to-side bonds, indicating that covalent bonds are formed between the Co and O atoms and the Cr and O atoms at the interface, which becomes the main source of bond force for the interface binding. According to the basic principles of quantum mechanics and Pauling’s covalent bond theory, the electron cloud distributed on the covalent bonds is strongly distributed in space along the direction of the covalent bonds. The greater the electron density on the heterologous interface, the smaller the difference, the greater the electron cloud overlap, and the greater the binding energy [32]. According to the above theoretical comparison in Figure 11a–c, the electron overlap area in Figure 11a,b is the lowest and the electron overlap in Figure 11c is the highest, indicating that Al2O3 (111)/CoCr (111) has the maximum binding energy, which is consistent with the lattice mismatch calculation and the interface binding energy calculation.
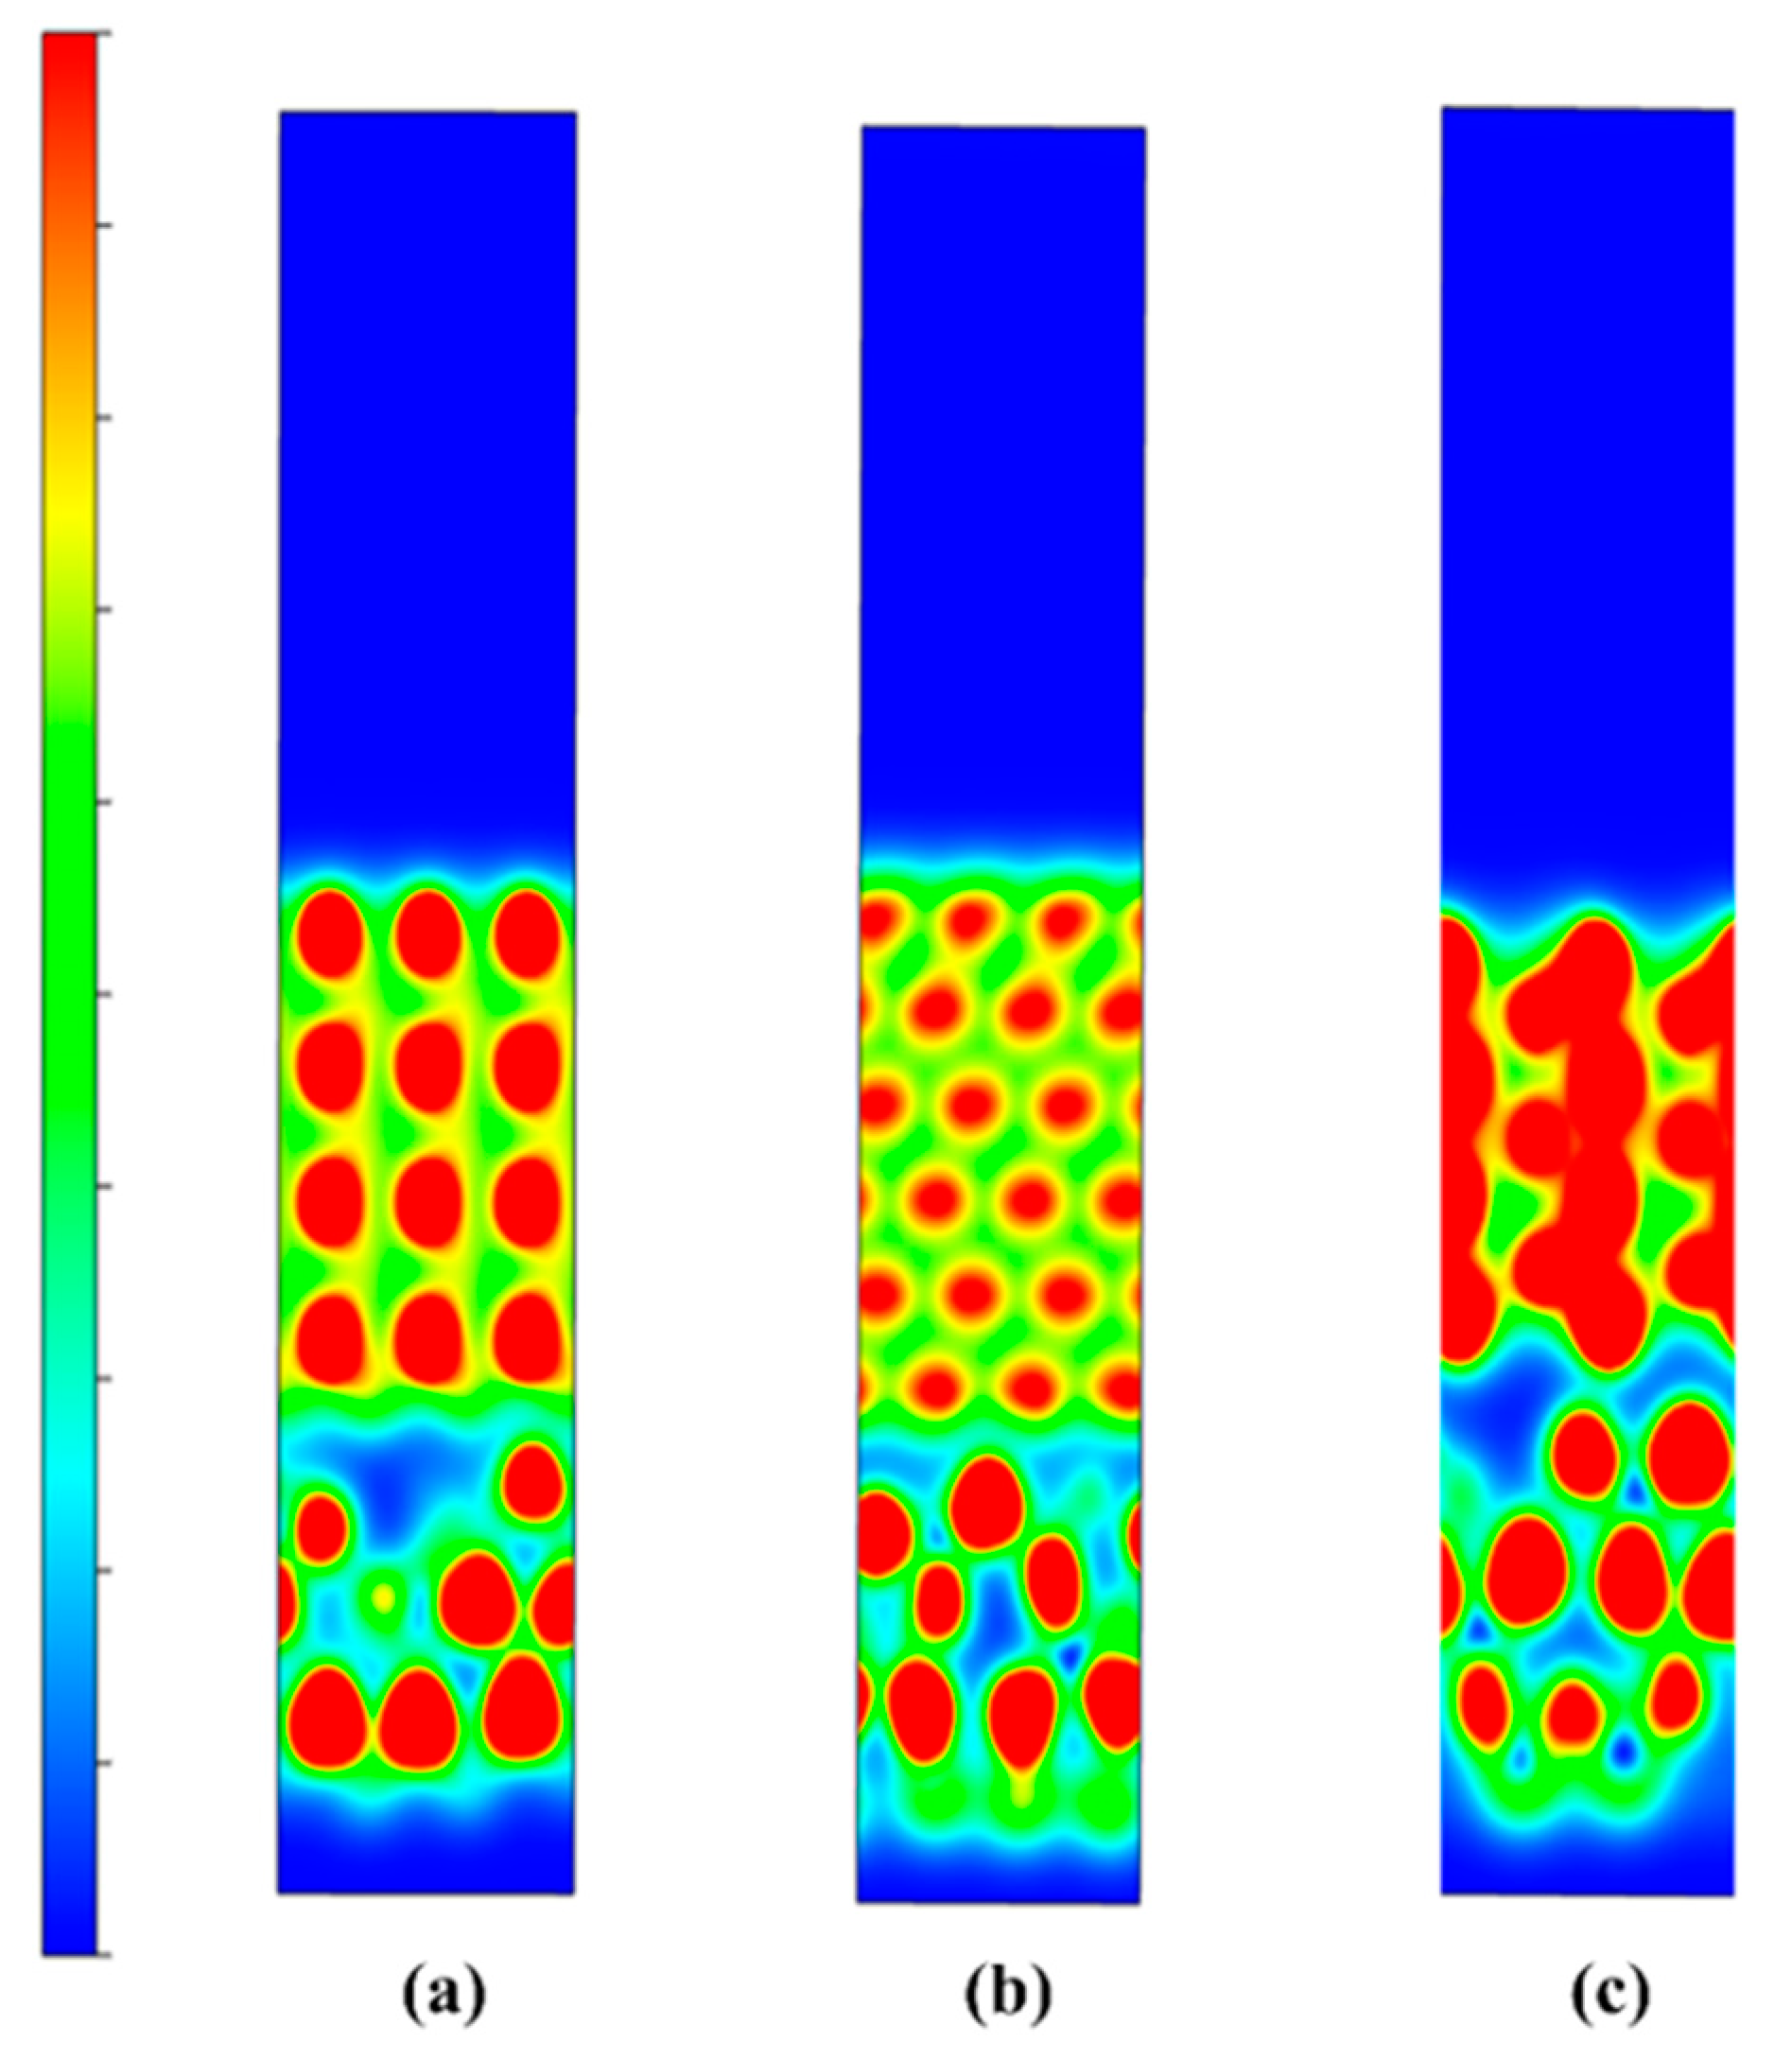
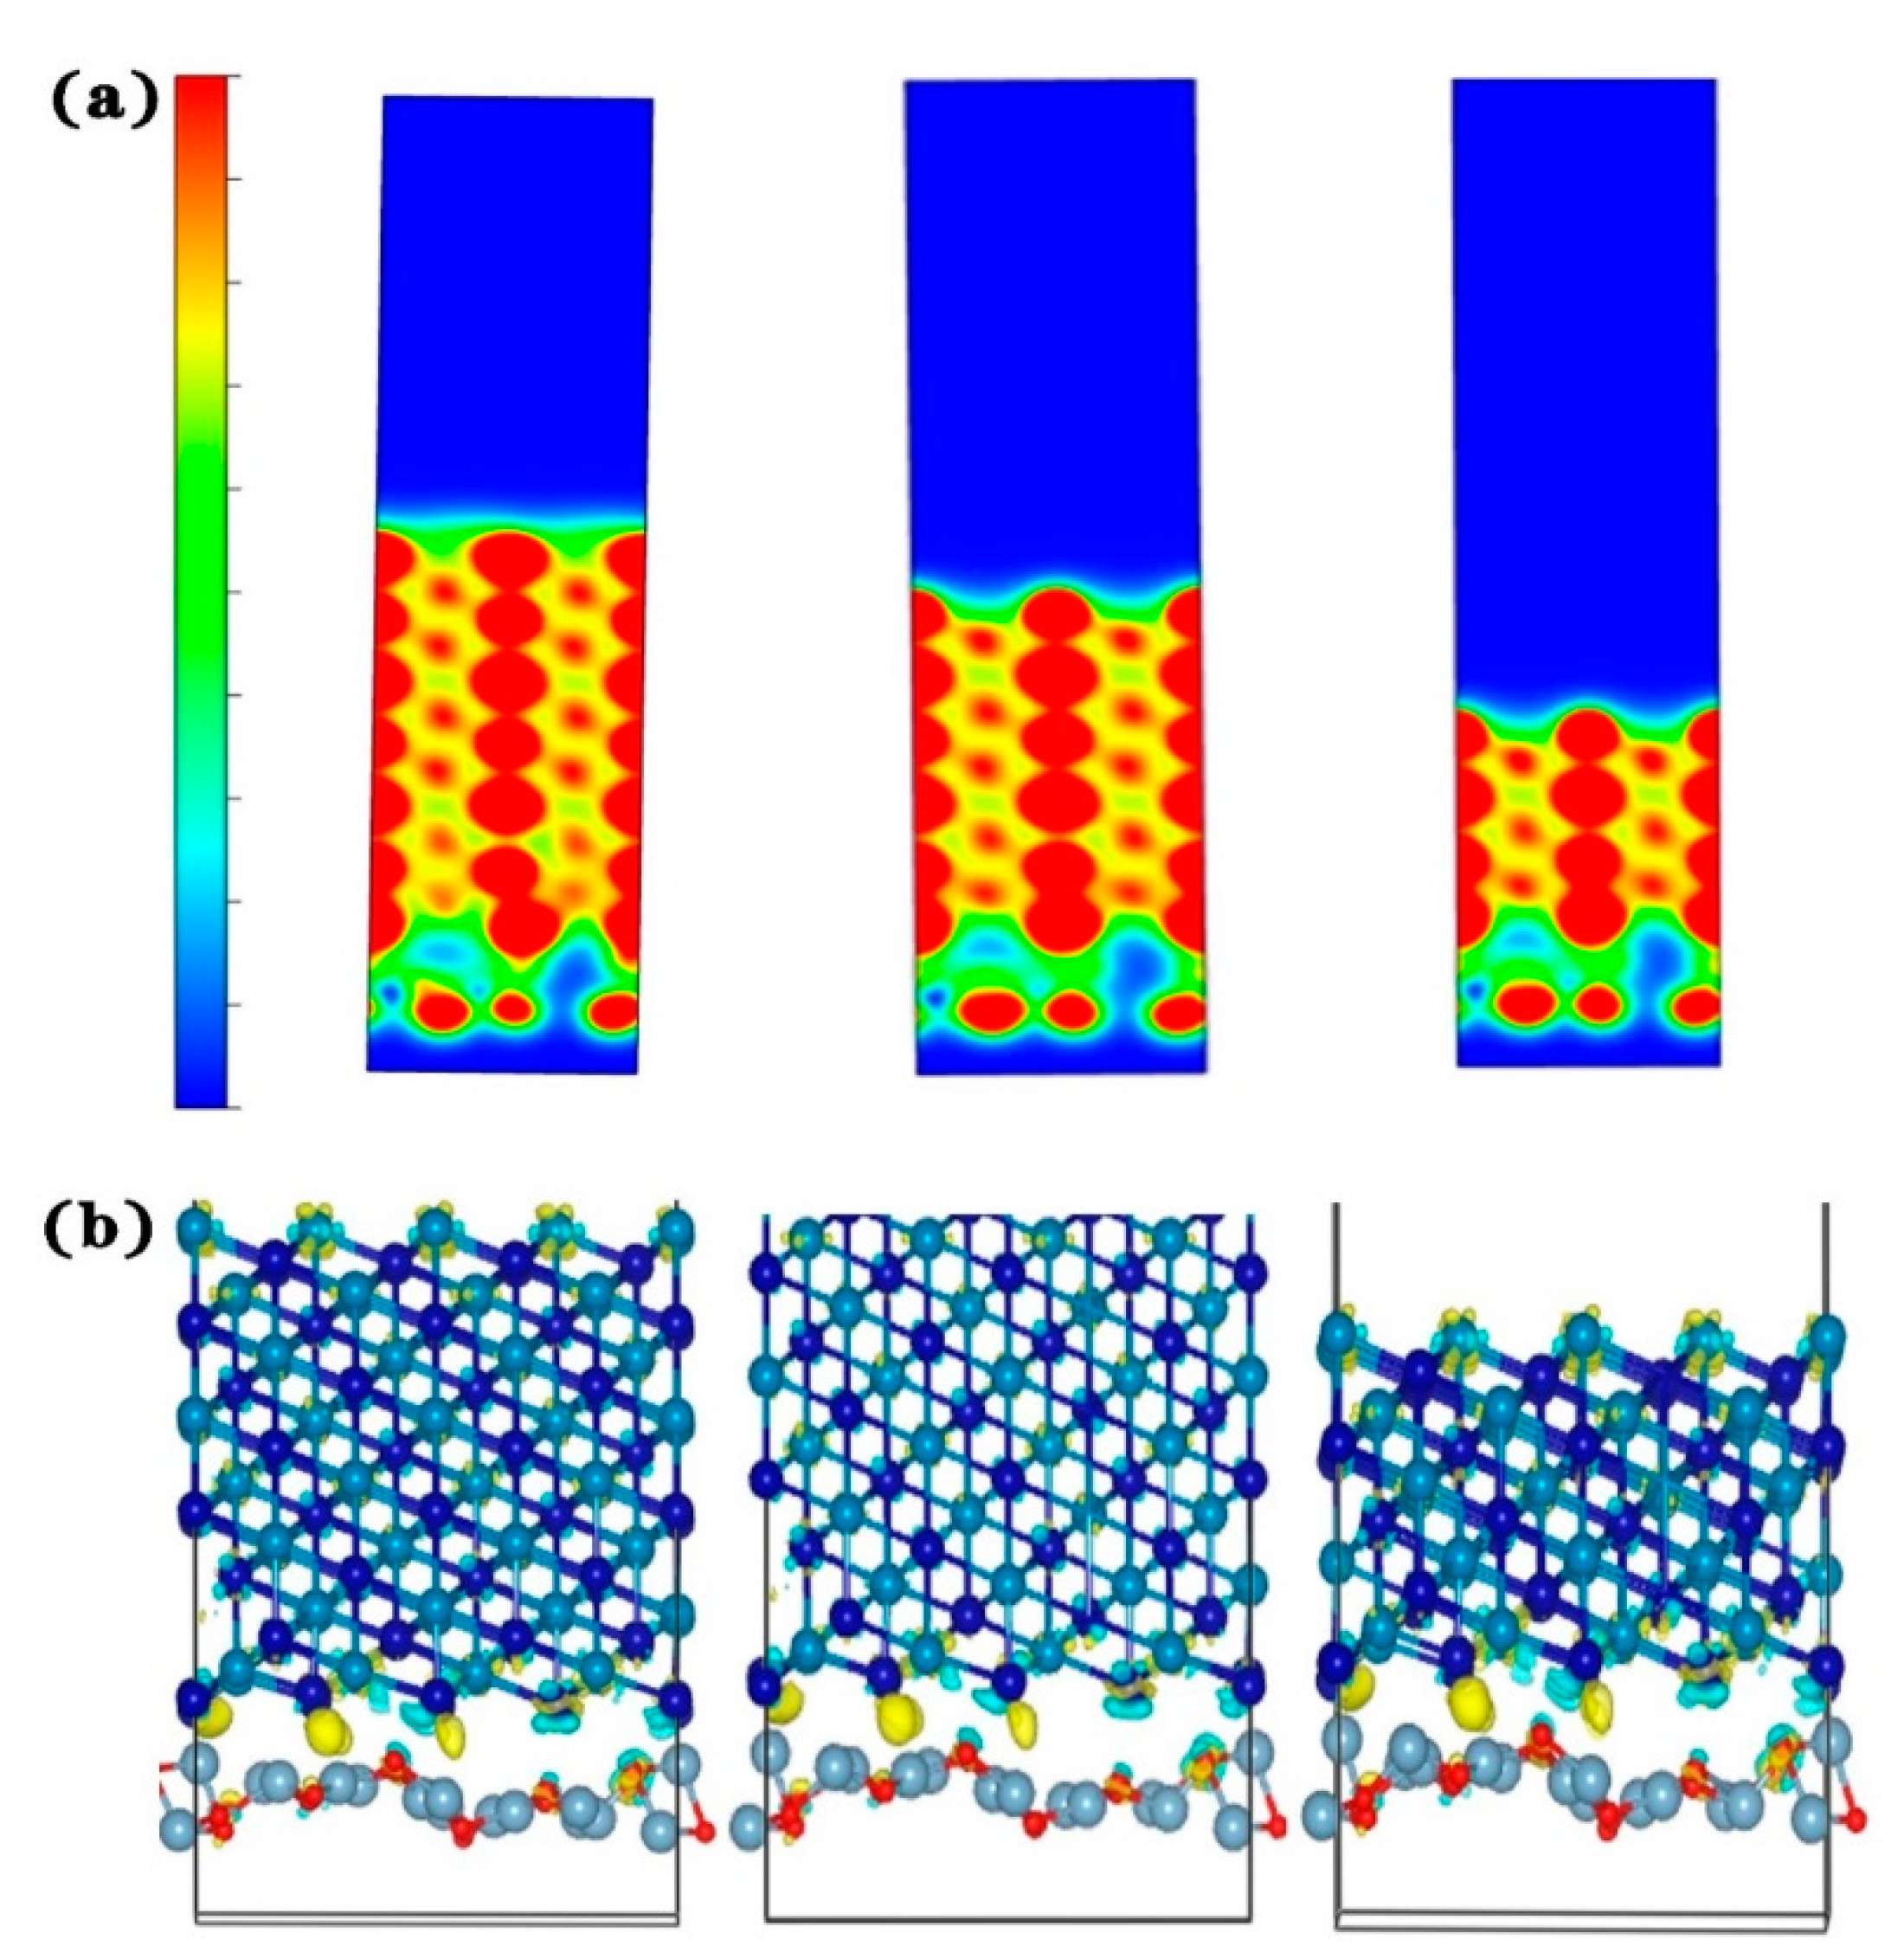
Figure 12 shows the projected charge density distribution along the [010] axis of the three model interfaces, showing the overlap of charge density between Co and O atoms at the Co and O interfaces due to the strong Co–O covalent bond. The Al2O3 (111)/CoCr (111) model has the strongest charge density and the most overlap areas, followed by Al2O3 (111)/CoCr (100), and the weakest charge density is at the Al2O3 (111)/CoCr (110) interface. According to the maximum overlap theory, the more the atomic orbits overlap, the denser the electron cloud between the cores is and the stronger the covalent bond is. In the charge density analysis diagram, Al2O3 (111)/CoCr (111) has the best interface binding ability, which verifies the calculation results of the degree of interface mismatch, interface binding work, and interface formation energy.
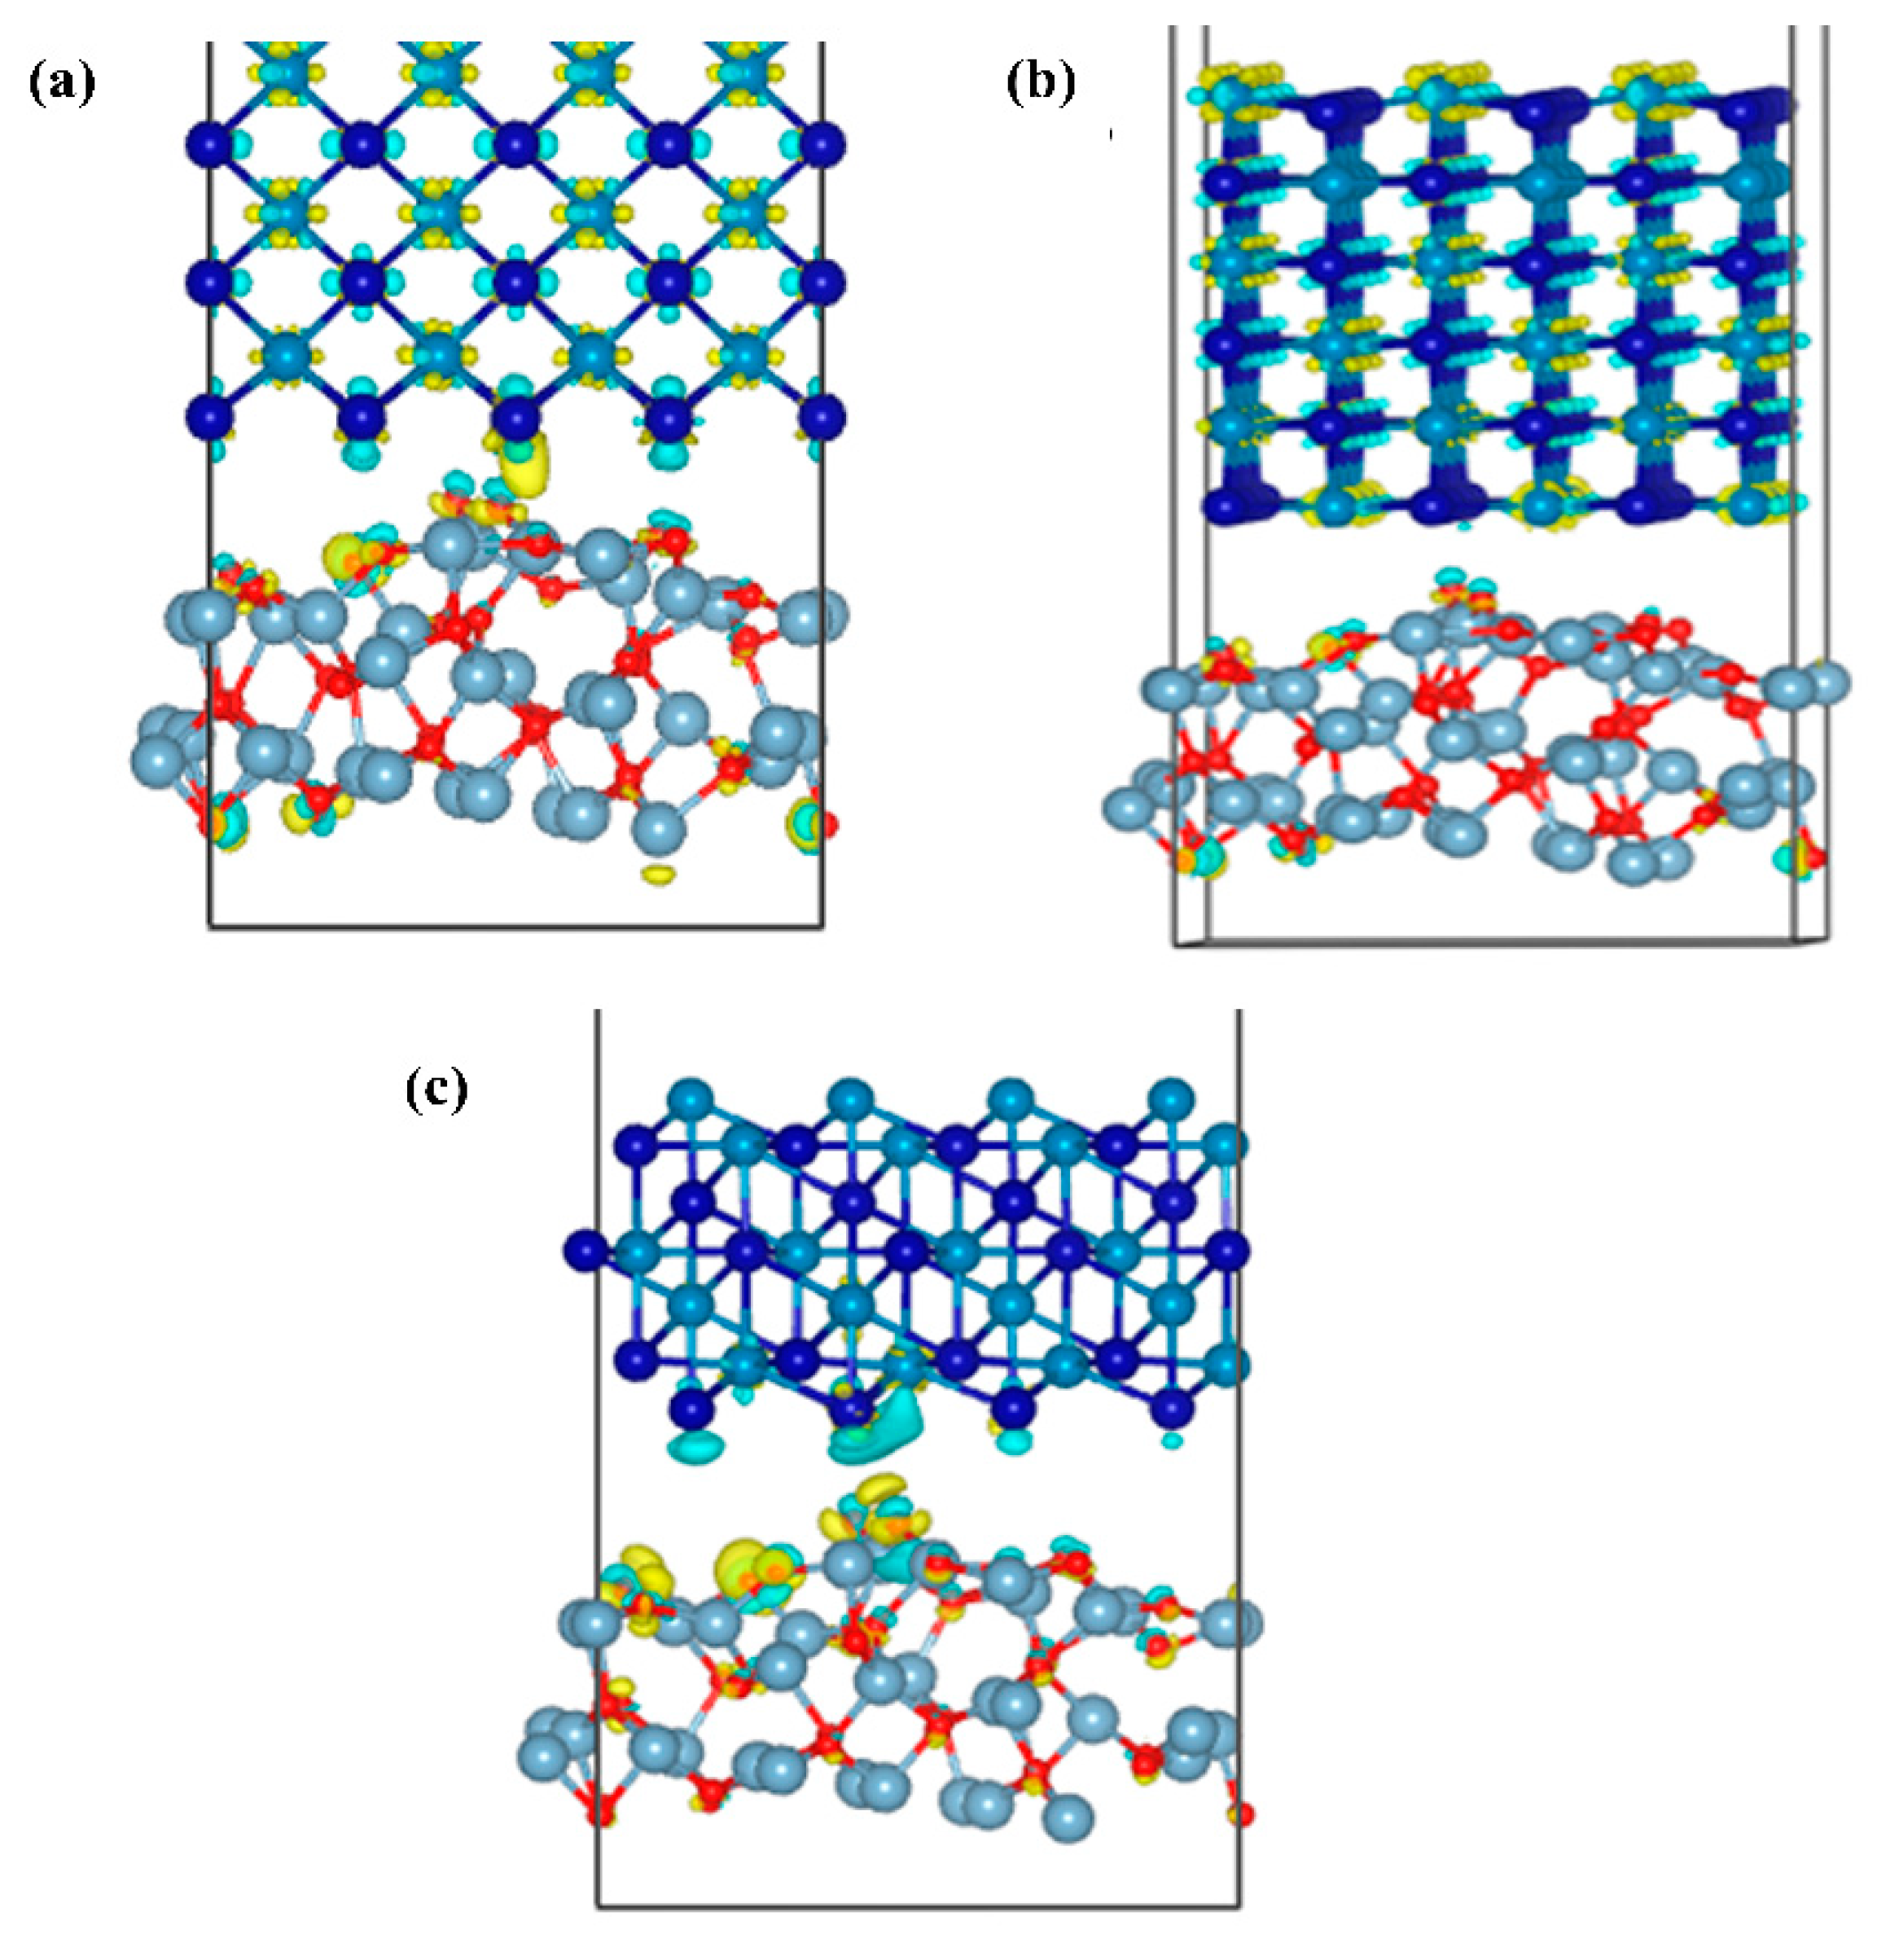
Figure 13 shows the differential charge density map of the three interface models of Al2O3/CoCr, with areas of electron accumulation in yellow and electron dissipation areas in blue. Figure 13a,b shows that the blue electron region around the Co atoms is the most pronounced, with substantial charge depletion. The yellow electron region around Cr atoms is the most pronounced, with a massive accumulation of charges around atoms. Small yellow and blue areas can be found around the O atoms. The charge transfer is not obvious in Figure 13b, and the charge aggregation regions are all inside the bulk phase. As can be seen in Figure 13a,c, there is a charge aggregation area at the interface; the charges consumed by the Co and O atoms are transferred to the interface and across the interface, and a small part of the charges are mixed together and accumulated during the transfer process. As can be seen in Figure 13c, almost all the charges gather at the interface because the O atoms are relatively negative and have a strong electron absorption ability. The exhausted Co atoms cross the interface to form a large number of Co–O polar covalent bonds. The analysis of the differential charge density further shows that the Al2O3 (111)/CoCr (111) interface model has the strongest interface-binding capability.
3.5. Effect of Al2O3 Addition on the Binding Strength of the Al2O3/CoCr Interface
Through the above studies, the optimal interface of Al2O3/CoCr has been determined as the Al2O3 (111)/CoCr (111) interface. In order to better design the Al2O3/CoCr metal base composite, it is necessary to determine the amount of Al2O3 added. Therefore, this section will use first principles to analyze the impact of Al2O3 addition on the interface.
3.5.1. Al2O3 Addition Quantity Theory Study
According to the composite principle of the metal matrix composite material, the mixing law of the composite material density is shown in Equation (7) (ROM is also known as the mixing rate). The density of a composite material is an average performance, depending on the density and the relative proportion of each phase in the composite material, which can be expressed by either the mass fraction or the volume fraction. The mass fraction is easy to calculate and easy to determine by test methods after the fabrication of composites. Therefore, the ratio between composites is related to their volume density.
The subscripts f, m, and v indicate the ceramic phase, matrix, and void, respectively.
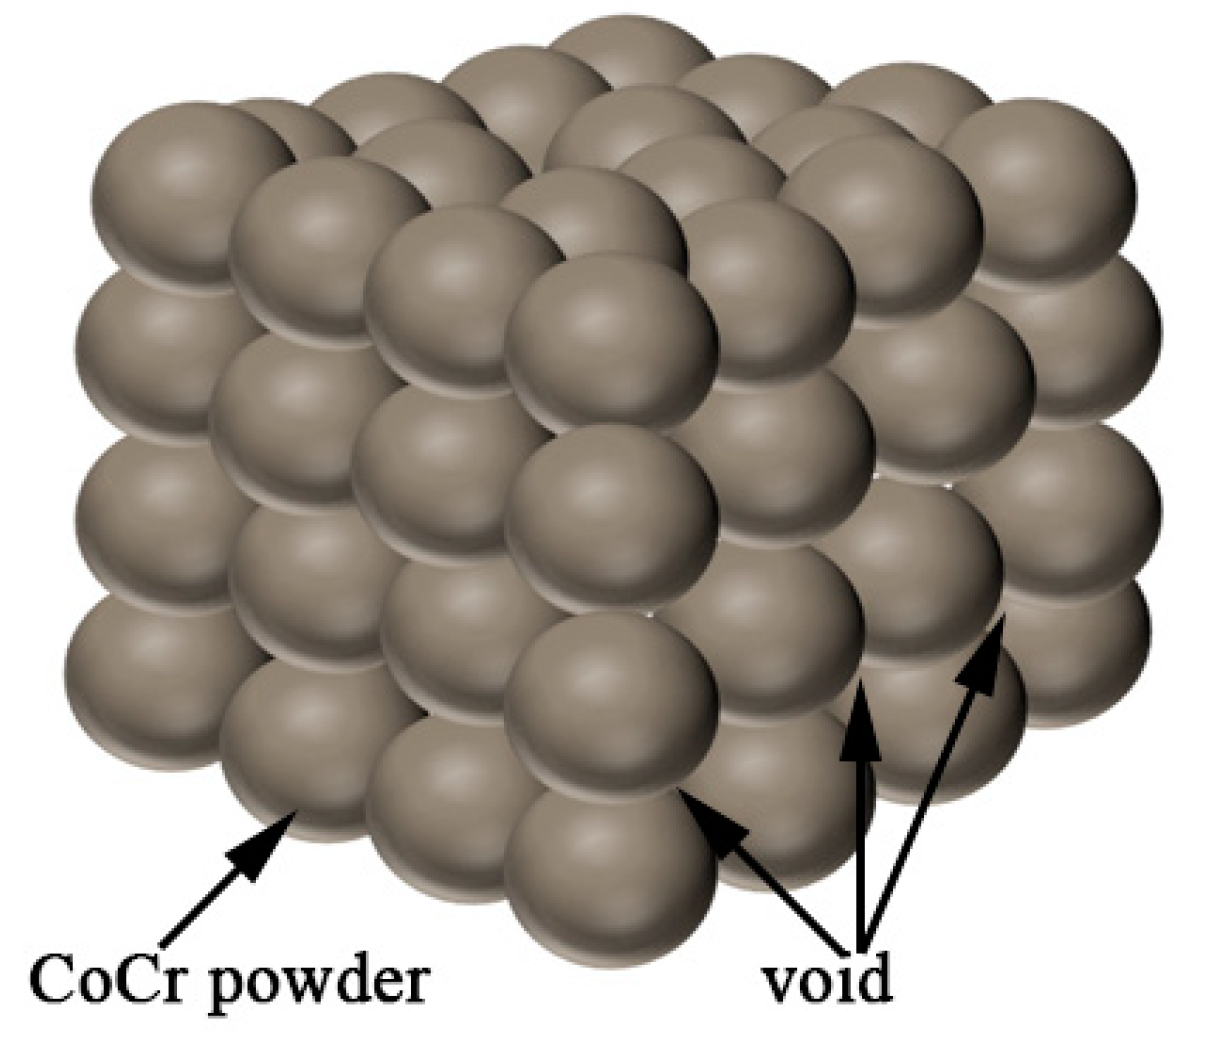
In this study, the ceramics were added to the CoCr alloy. According to the above principles, the amount of ceramic phase addition can be determined from the density. Assuming that the CoCr alloy powder is composed of spherical particles with diameter R = A, the maximum amount of ceramic powder is calculated. A cube model was first built, as shown in Figure 14, with 64 CoCr alloy powders. There are gaps between the spherical powder particles, assuming the uniform addition of the ceramic particles to the CoCr alloy powder particles. This model is used to calculate the maximum volume of the added ceramic powder and to calculate the mass of the ceramic phase.
The volume of the powder is V1, the volume of the cube is V2, and the maximum volume of the ceramic is V3.
Through the calculation, the volume ratio between the CoCr alloy and the ceramic phase can be calculated as 52.33%/47.67%; that is, the maximum added amount of ceramic phase can reach 47.67%. Because the powder pre-prepared in this study retains the main properties of the CoCr alloy, the actual proportion of the alloy with the ceramic added is small. According to the density of the CoCr alloy powder, the mass ratio continues to be calculated because the density of the ceramics is inconsistent and the ceramics are generally greater than 1. The proportion is not required to be too large, so when calculating the mass ratio, the density of the ceramic is assumed to be 1 to estimate the ceramic mass ratio. Then,
According to the calculation, the CoCr alloy powder and ceramic phase mass ratio are 90% of the CoCr alloy powder and 10% of the ceramic powder. Because the CoCr alloy powder is assumed to be in the ideal state to retain the important properties of the CoCr alloy in the same calculation process, the maximum mass ratio of the ceramic powder can reach 10%. The mass ratios of the composite powders prepared in this study are listed in Table 9.
3.5.2. Effect of Al2O3 Content on the Binding Energy of the Al2O3/CoCr Interface
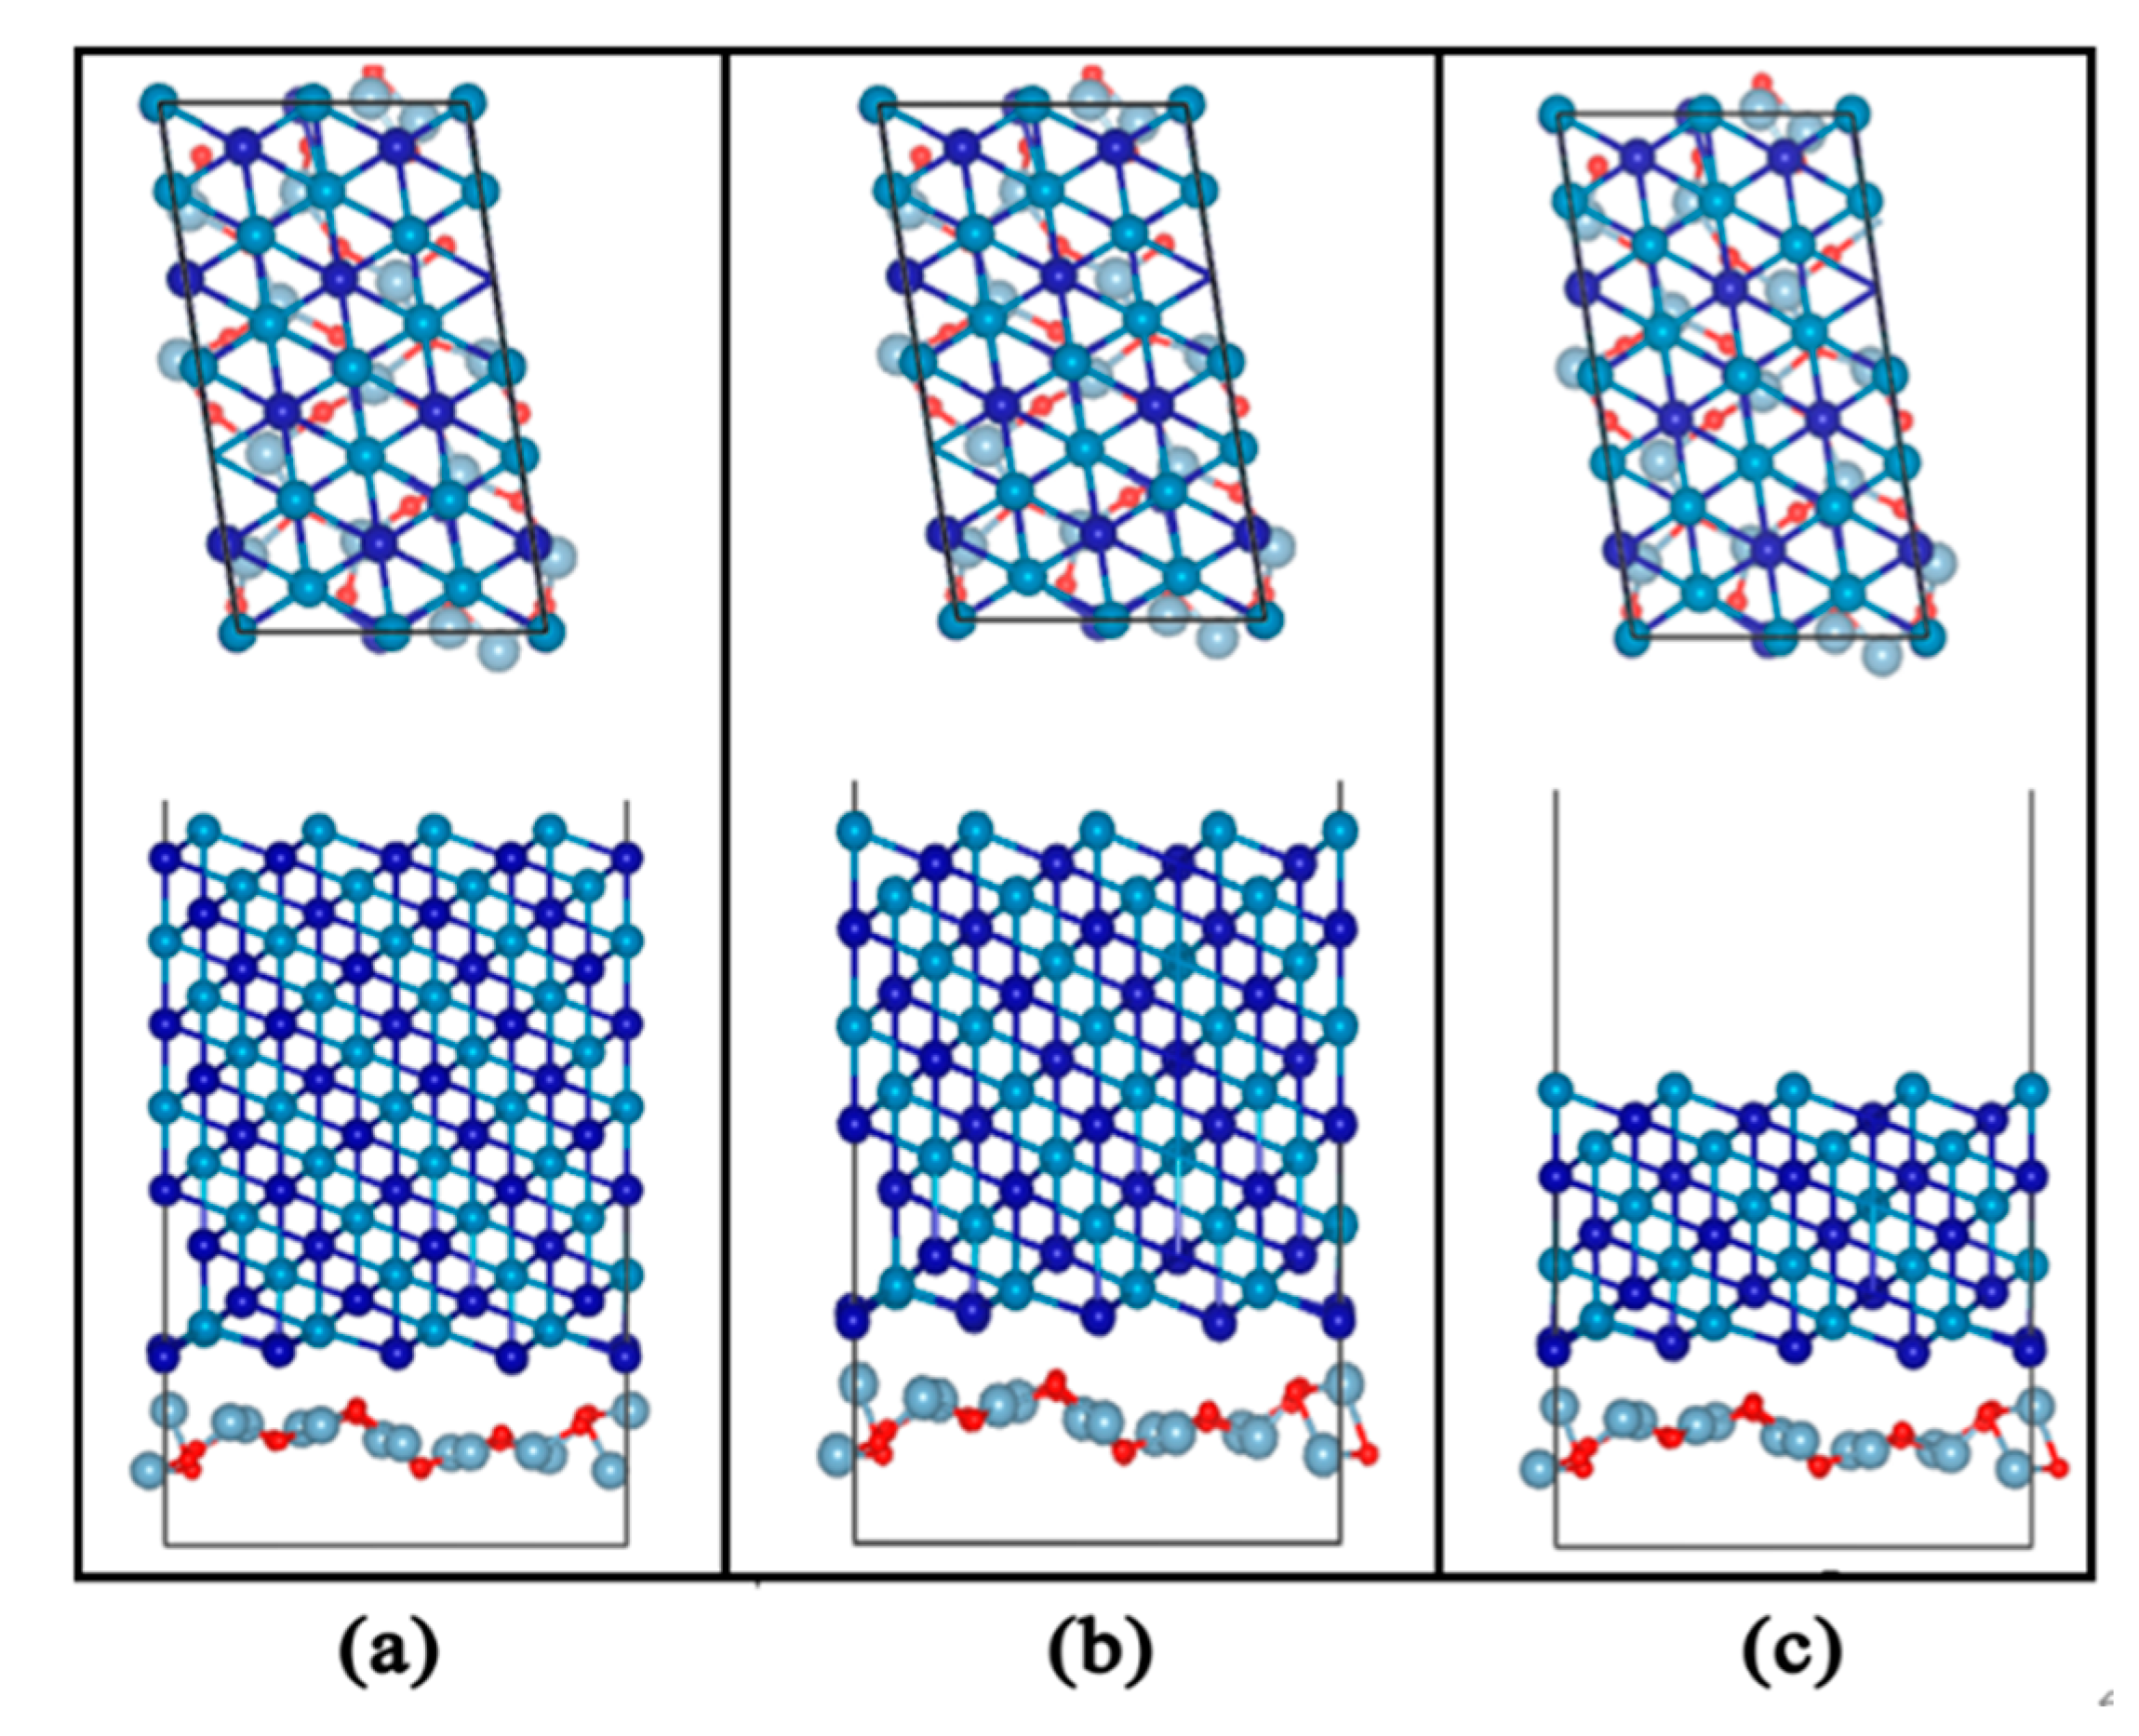
First, we constructed an Al2O3 (111)/CoCr (111) model with different contents, as shown in Figure 15. The model does not converge when calculating the 2.5% content of Al2O3, but the reason for this may be that the incorporation of 2.5% Al2O3 has little impact on the tissue performance of the CoCr alloy; in addition, the combined model calculation does not converge, so the model with this content is not analyzed in this section.
The calculations of the interface binding work, interface separation work, and interface formation energy are shown in Figure 15. The calculation results are shown in Table 10. The results of the calculation show that the Al2O3 (111)/CoCr (111) interface model with 5% Al2O3 has the maximum Wad value of 2.36 J/m2, indicating that the Al2O3–CoCr electron interaction and charge transfer are strong at the interface of Al2O3 (111)/CoCr (111). At the same time, Wsep is 2.24 J/m2 and Efor is 0.15 J/m2. It can be inferred that the Al2O3 (111)/CoCr (111) interface model with 5% Al2O3 has the most energy advantage and thermal stability.
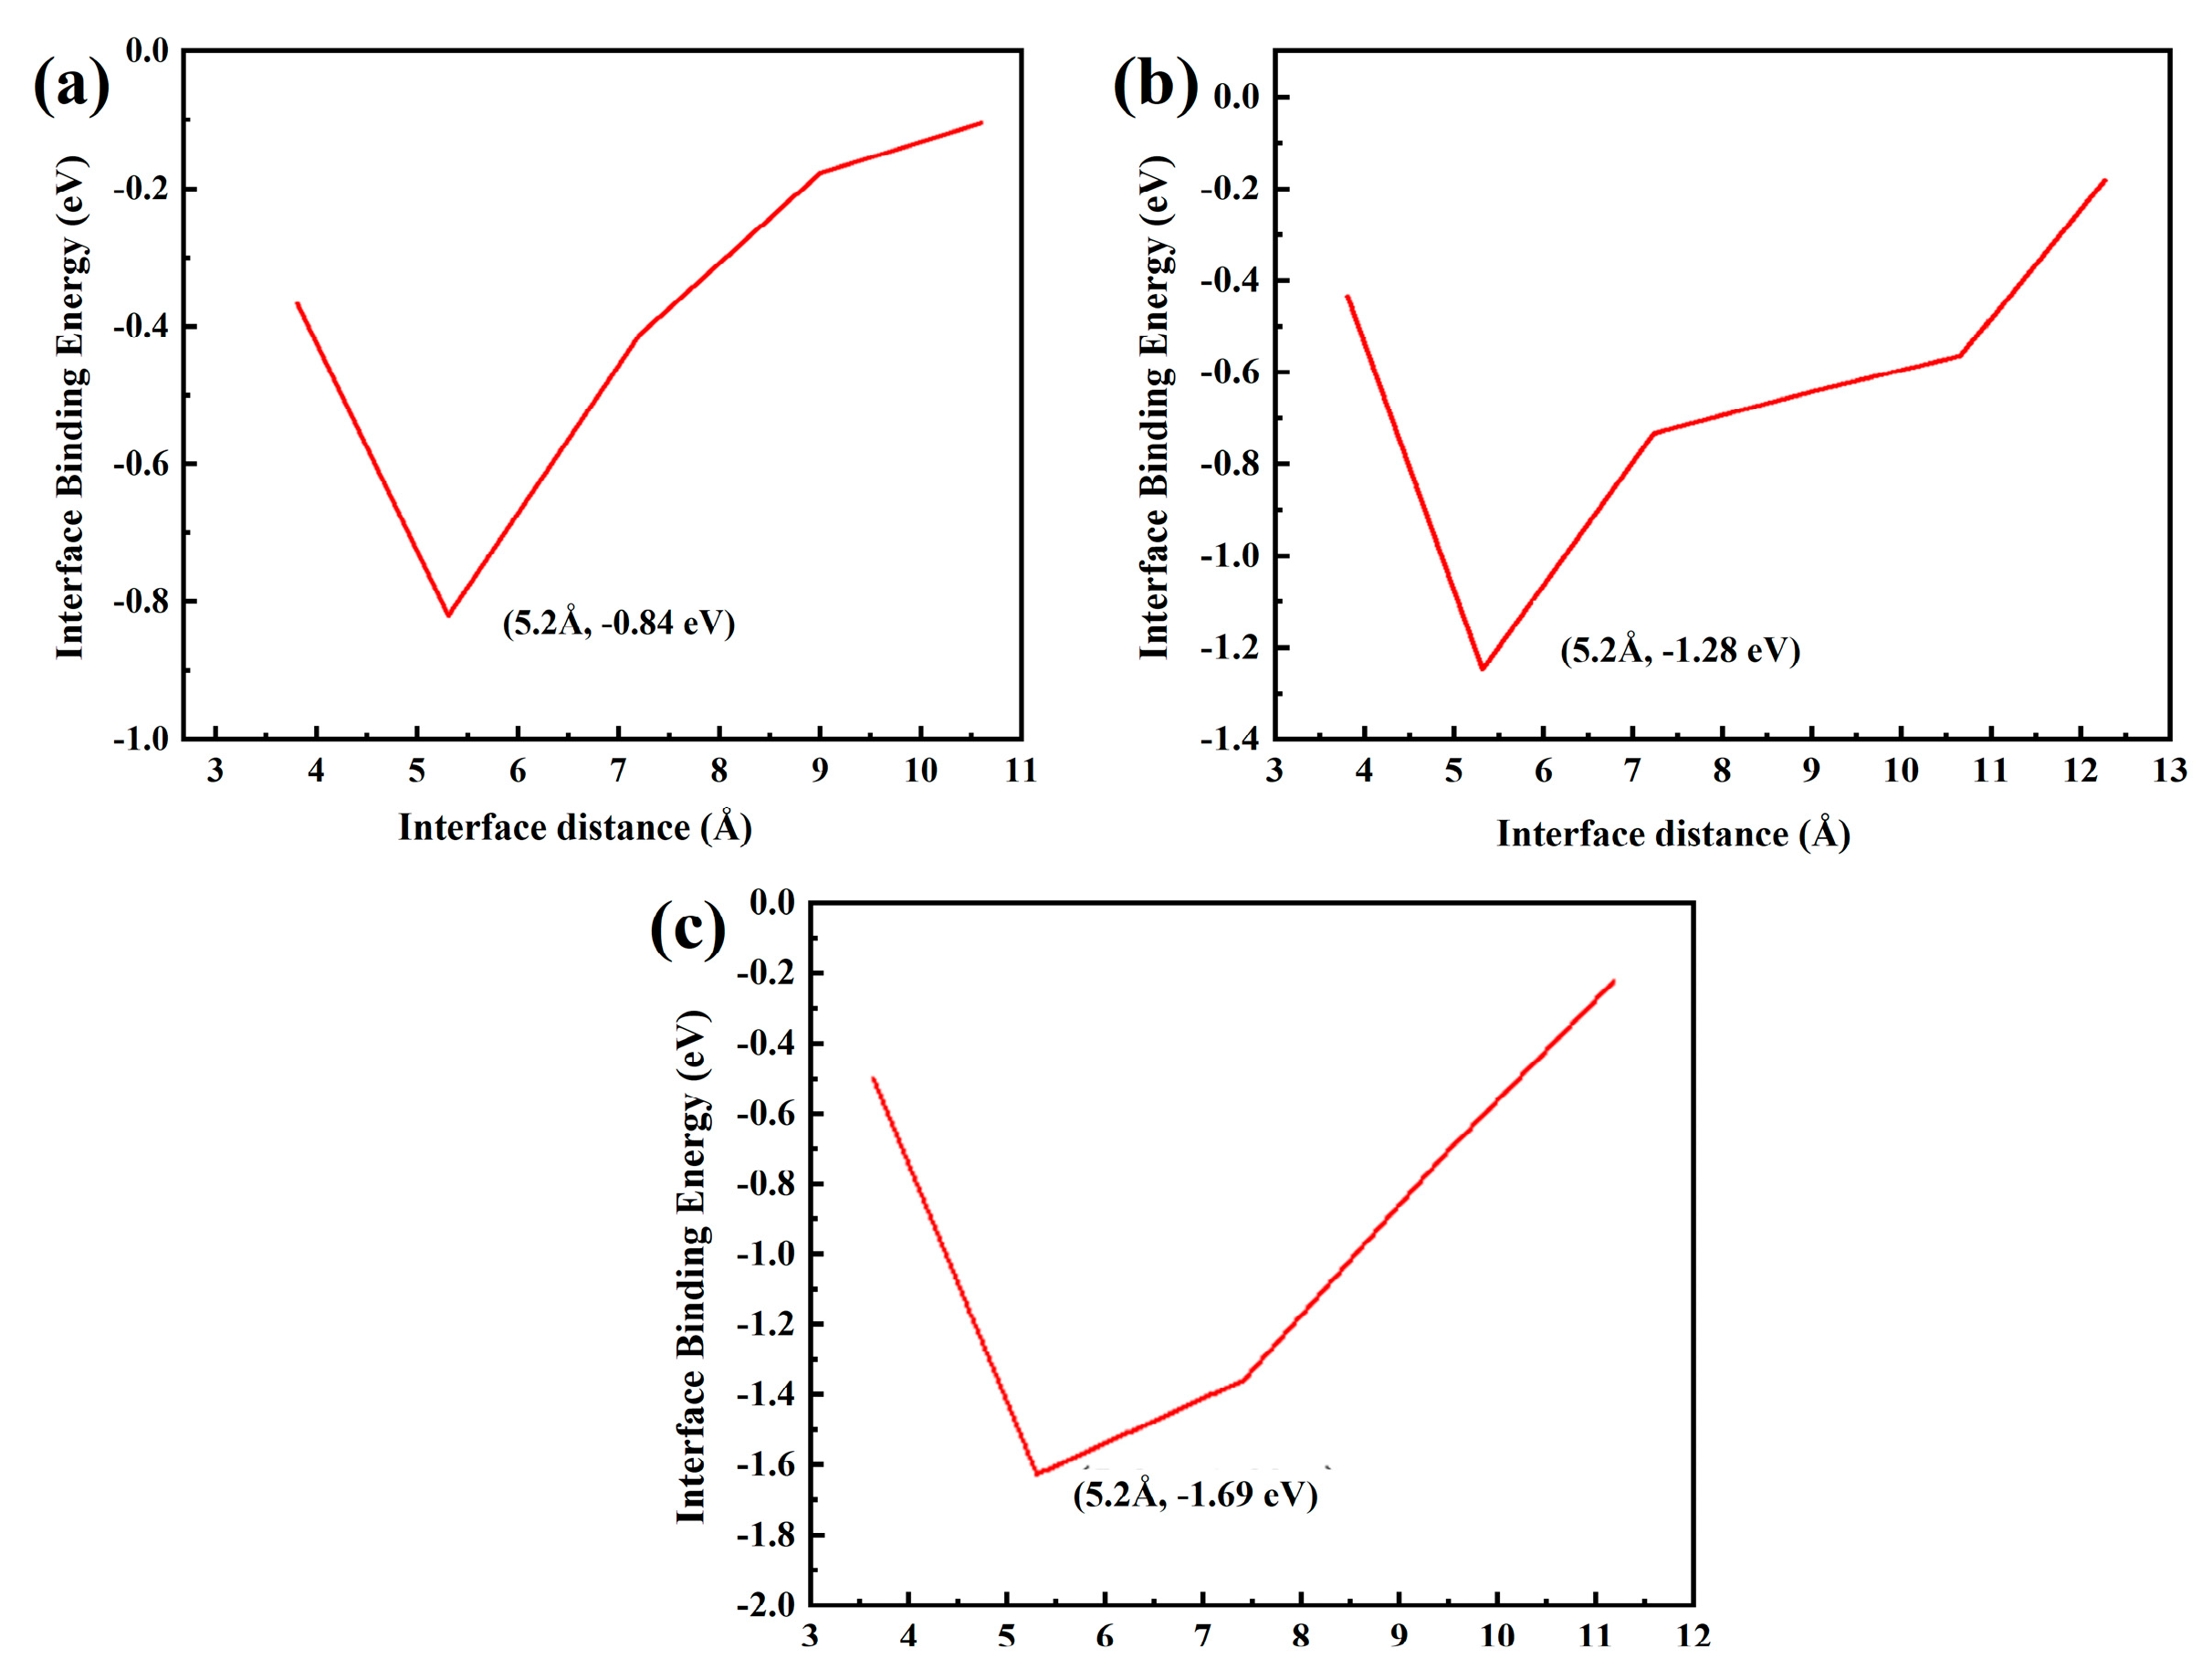
Figure 16 shows the fault work of each model with different Al2O3 content. Figure 16a has the maximum fault work of −0.84 eV. The greater the fracture work is, the stronger the interface bonding ability is, further proving that the Al2O3 (111)/CoCr (111) interface model with 5% Al2O3 added has the best bonding strength.
Figure 17 shows the part-wave electron density of the state map of the three crystal structure models with the Al2O3 content and the peak of the density of states. Figure 17a shows that the density of states has the largest number of overlaps. From the split-wave density of the state map, it can be determined that 5% Al2O3 is more conducive to binding to a stable interface than the interface binding ability, which further proves that the Al2O3 (111)/CoCr (111) interface model with 5% Al2O3 has the best binding strength.
Then, we can observe the charge density and differential charge density of the three models, as shown in Figure 18. Due to the small amount of Al2O3 added, the charge density of the models with 5% and 7.5% added is basically the same. Combined with the calculation results of the split wave density of states, this again shows that the 5% added model is better.
The following conclusions can be drawn from the above analysis. With the increase in Al2O3 content, the interface binding work decreased, as did the interaction between ceramic/metal interface atoms; the interface performance was influenced by the ceramic phase thickness of the interface; and with the increase in Al2O3 content, the outer Co phase atoms on the interface atoms’ electronic interaction gradually strengthened, making the electronic interaction between the heterogeneous atoms weaken the interface binding variation. The properties of the composite material can be improved by changing the properties of the ceramic/metal interface. In addition, it can be speculated that the range of atomic interactions at the metal/ceramic interface is between several atomic layers, so the model selected in this study is not adequate and needs to be explored further. It can be seen that with the thickening of the ceramic phase of the interface layer, the rate of the interface adhesion work decreases gradually and then tends to be constant. According to the Young–Dupre equation, with the increase in the interface-binding work, the wetting angle of the interface gradually decreases, the wetting property is enhanced, and the interface binding strengthens. That is, with the increase in Al2O3 content, the binding degree of the Al2O3/CoCr interface weakens, and the wettability of the interface becomes worse. Moreover, the maximum interface binding work is less than the surface energy of 4.12.5 J/m2 of the single-phase CoCr and the Al2O3 surface energy of 5.97 J/m2. In this study, the best interface was combined with 5% Al2O3, and the composite prepared under this ratio had the best performance.
4. Discussion
4.1. Preparation and Properties of Al2O3/CoCr Composite Powder
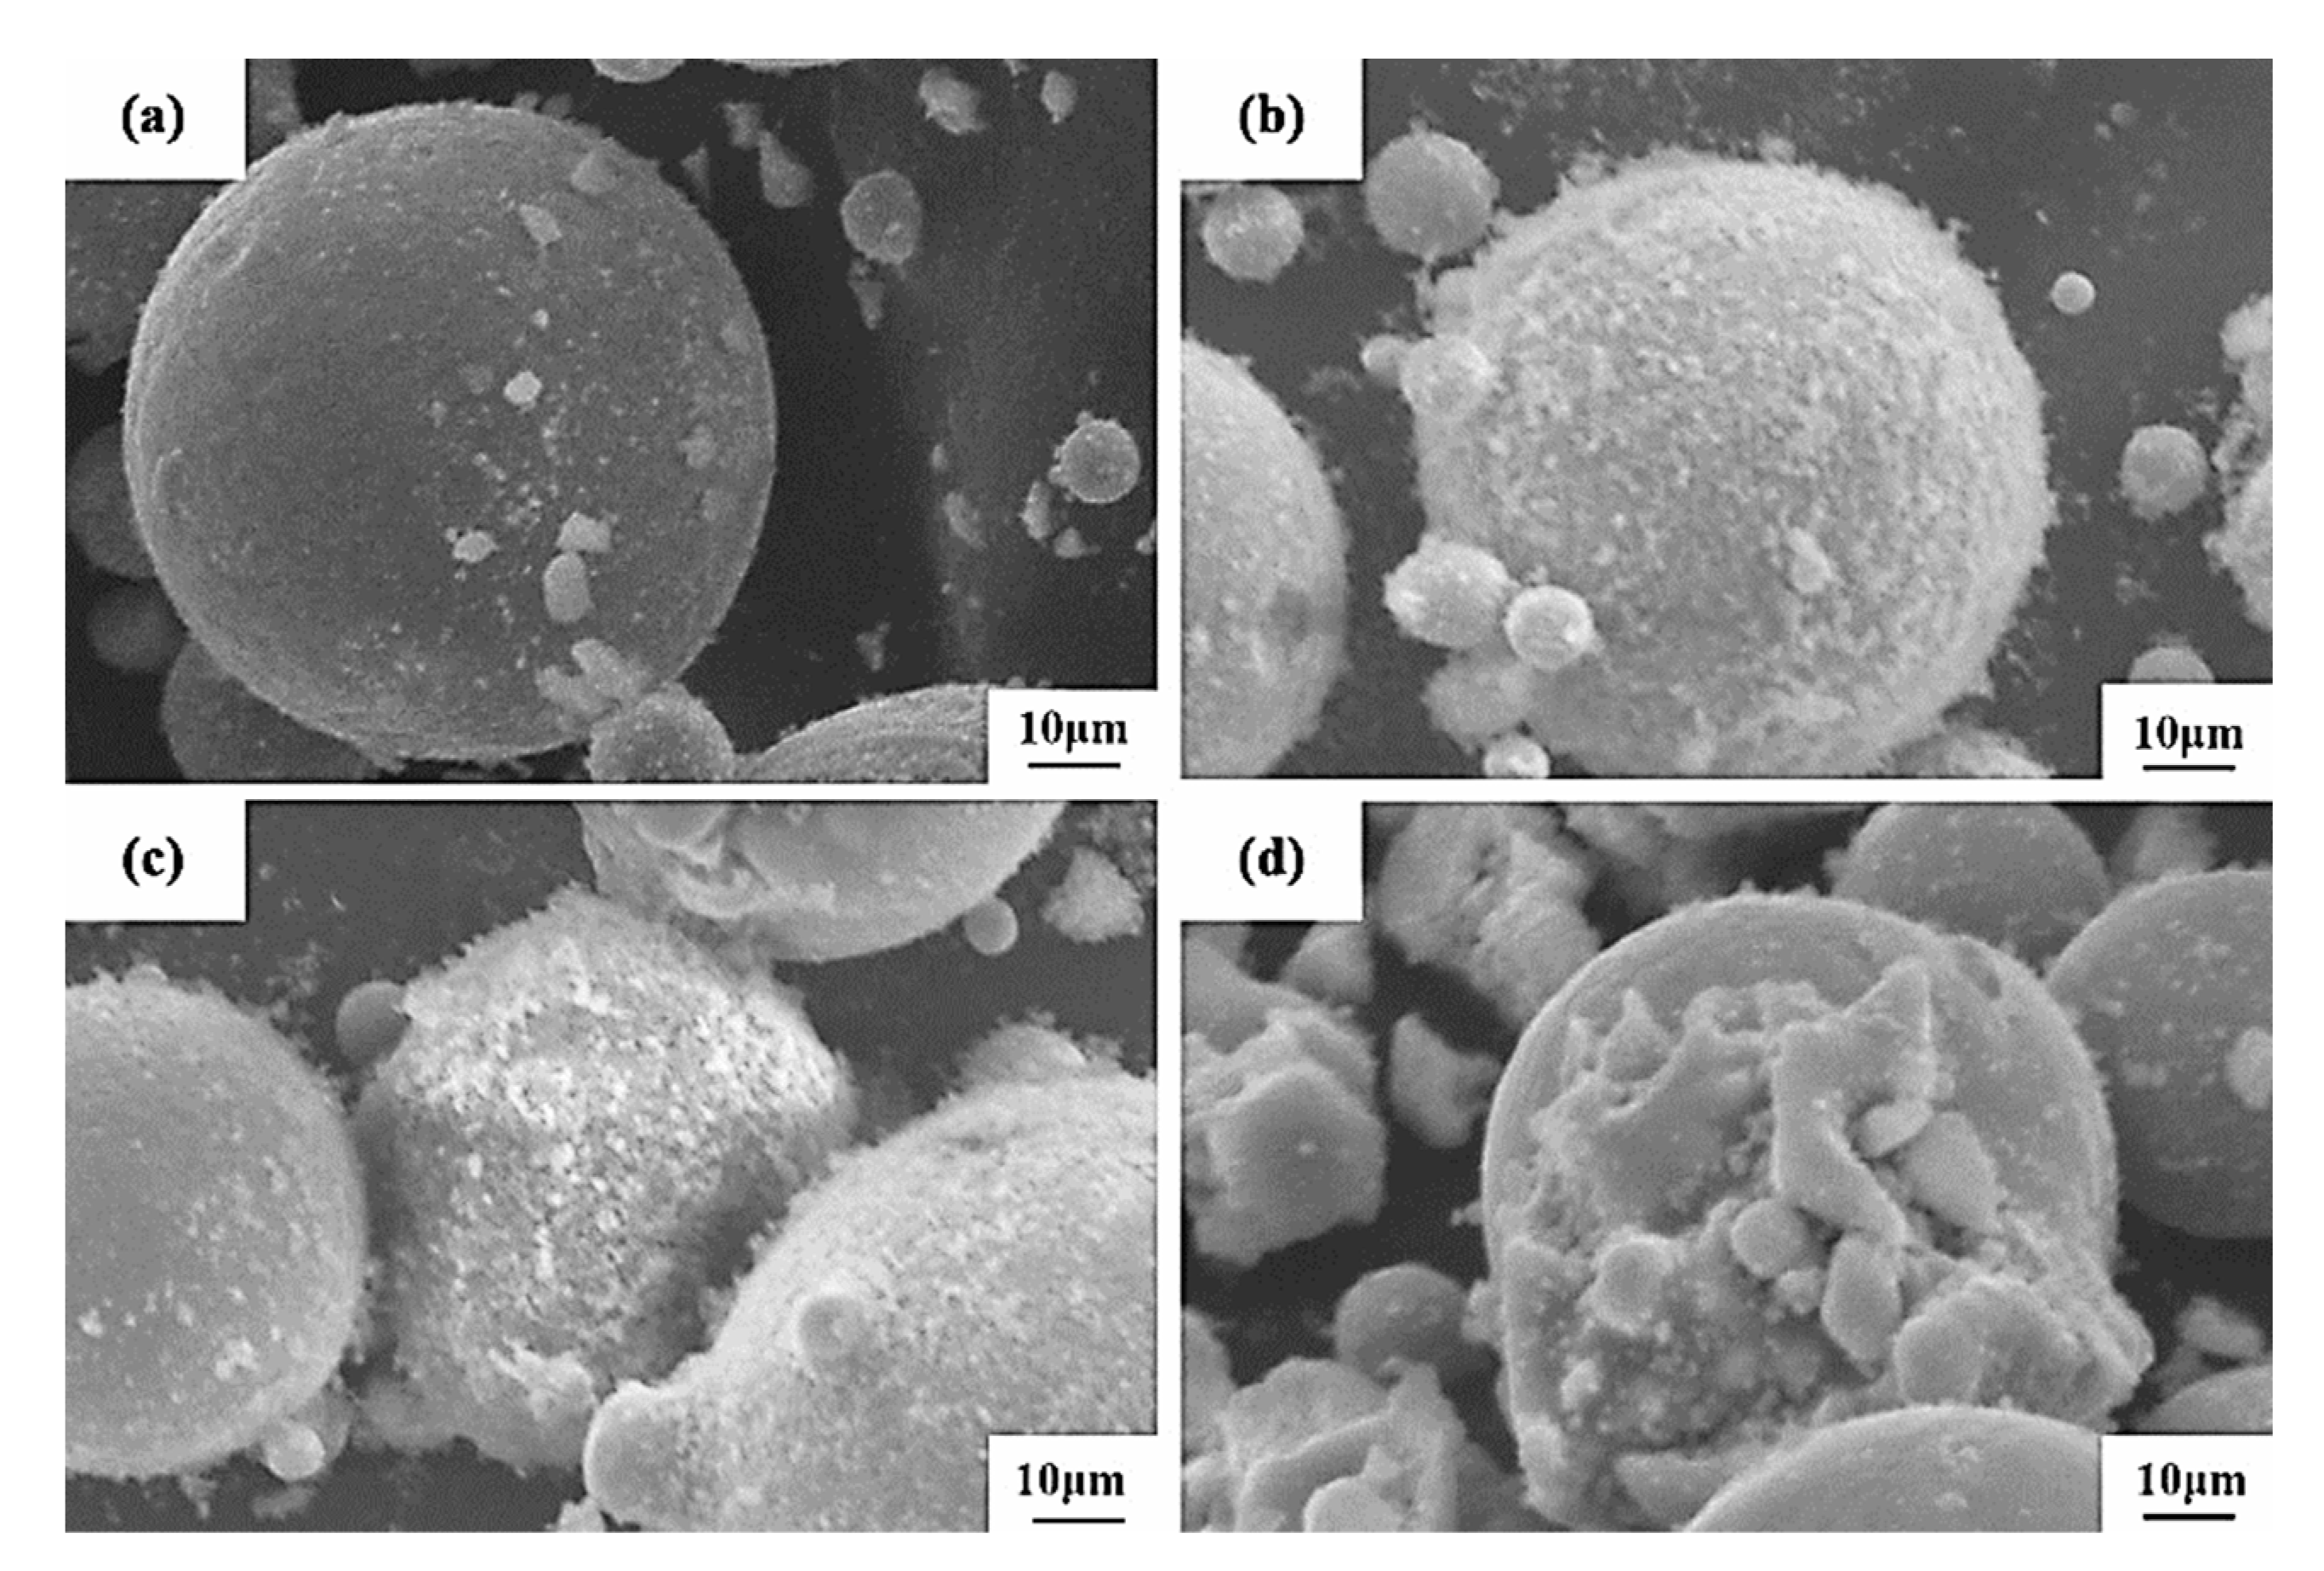
Four Al2O3/CoCr composite powders with different amounts of incorporated Al2O3 were prepared by the vacuum-ball-milling process. The micromorphology is shown in Figure 19. It can be seen that the shape of the powder was still spherical after Al2O3 was added, and small particles could be observed on the surface of the powder. Small particles in 2.5% Al2O3 composite powder were the lowest, and the micromorphology did not change much compared with CoCr alloy powder. The small surface particles of 5% Al2O3 and 7.5% Al2O3 composite powder were basically spherical, and the 5% Al2O3 was added. This morphology was conducive to the flow of the powder and improved the binding force in the SLM process, which was more suitable for the constituency laser melting technology [33,34]. The addition of 10% Al2O3 surface adsorbed the most particles with a poor shape. It can be inferred that the composite powder prepared with 5% Al2O3 is better.
Table 11 shows the distribution range of the powder particle size, and the composite powder particle size with 5% Al2O3 added is wider than that of the CoCr alloy, which is 13.2~43.5 μm. The particle size distribution of the powder is often characterized by D10 and D90 values, as specified by YY/T1702-2020 standards [35], including D10 ≥ 12 μm and D90 ≤ 65 μm. From Table 11, the composite powder prepared here meets the standard requirements.
The physical properties of the CoCr alloy powder and composite powders are listed in Table 12. As can be seen from Table 12, both CoCr alloy powder and composite powder meet the requirements of the YY/T1702-2020 standard.
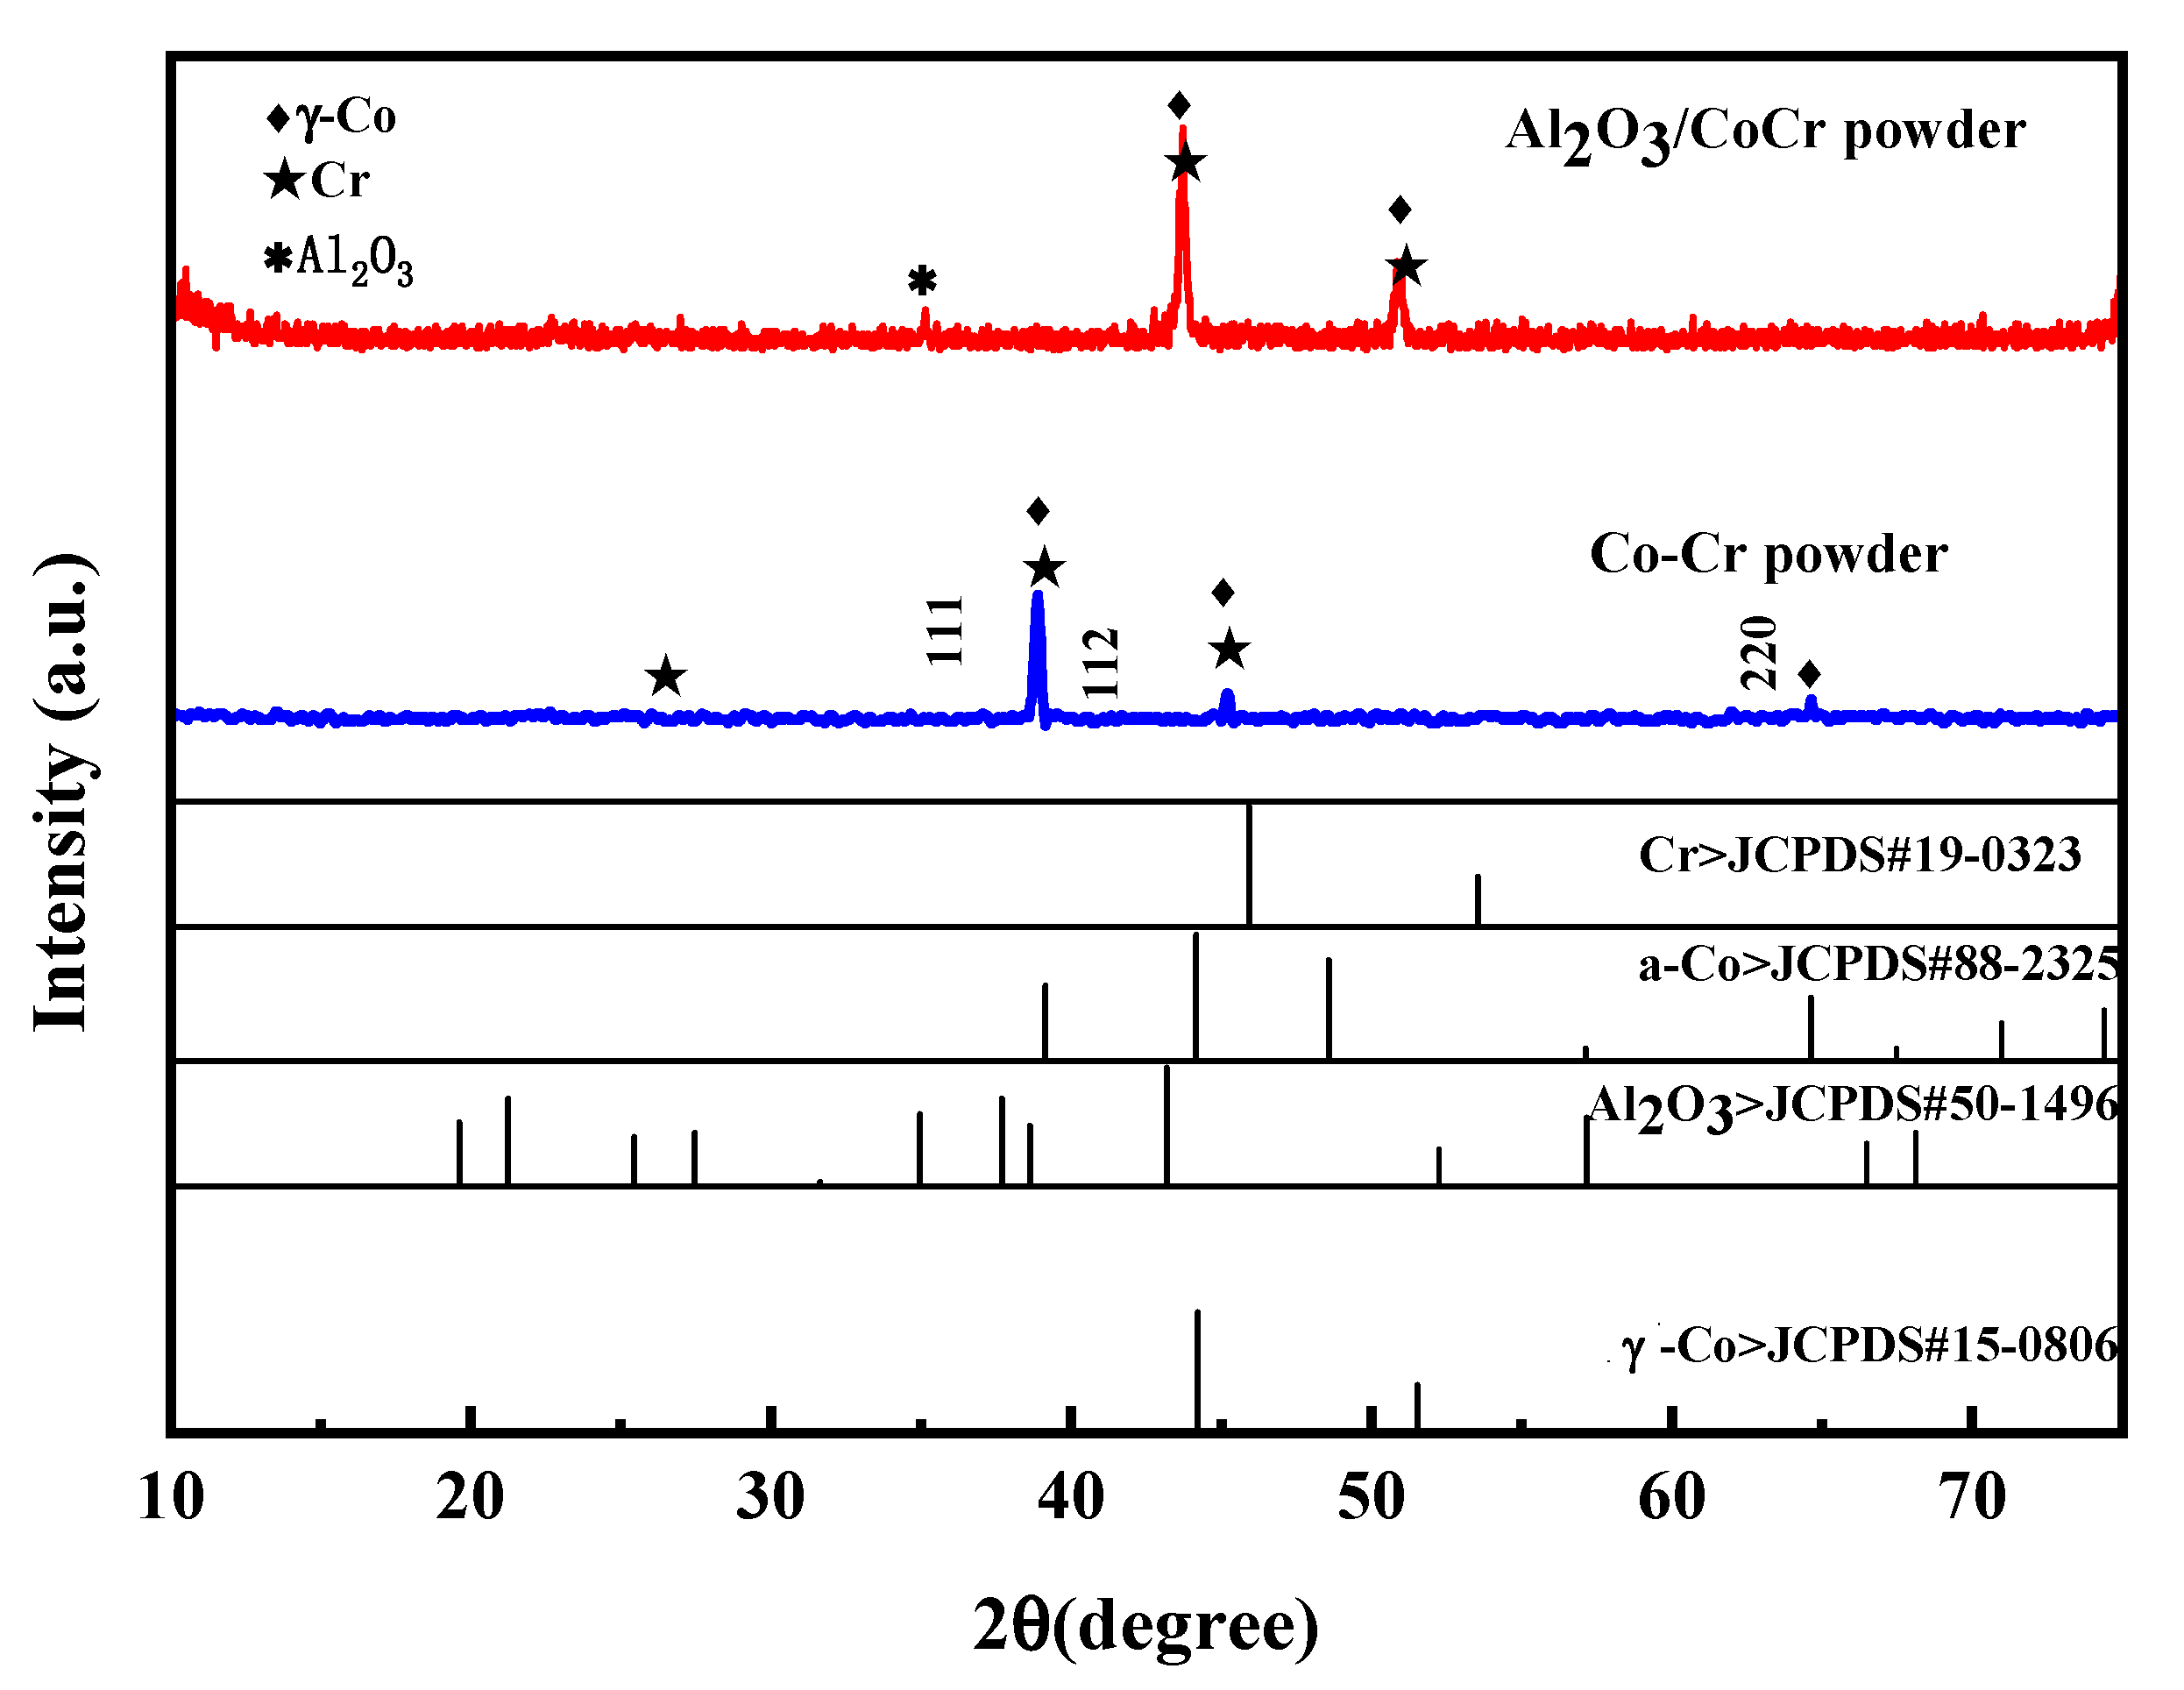
Figure 20 shows the XRD spectra of the CoCr alloy powder and the Al2O3/CoCr composite powder. In the figure, the main peak of the CoCr alloy powder appears between 38 and 39; the main phase composition is the a-Co phase of FCC, and the corresponding crystal surface indices are γ (111), γ (112), and γ (220); and the crystal cell parameter is a = 0.35340 nm, which matches the standard cell parameter a = 0.35447 ± 0.0002 (ICDD card number 15-806). The main crystal phase was basically unchanged after the addition of 5% Al2O3, but the Al2O3 phase appeared. Compared with the PDF standard card of Al2O3, Co, and Cr, the diffraction peak shifted to a high angle, the main peak appeared between 40 and 42, and the main peak shifted to the right. This is because the CoCr alloy powder was added to an appropriate amount of Al2O3 fine powder smaller than its atomic radius; in the powder-making process, these fine powders made the particle size of the mixed powder smaller overall.
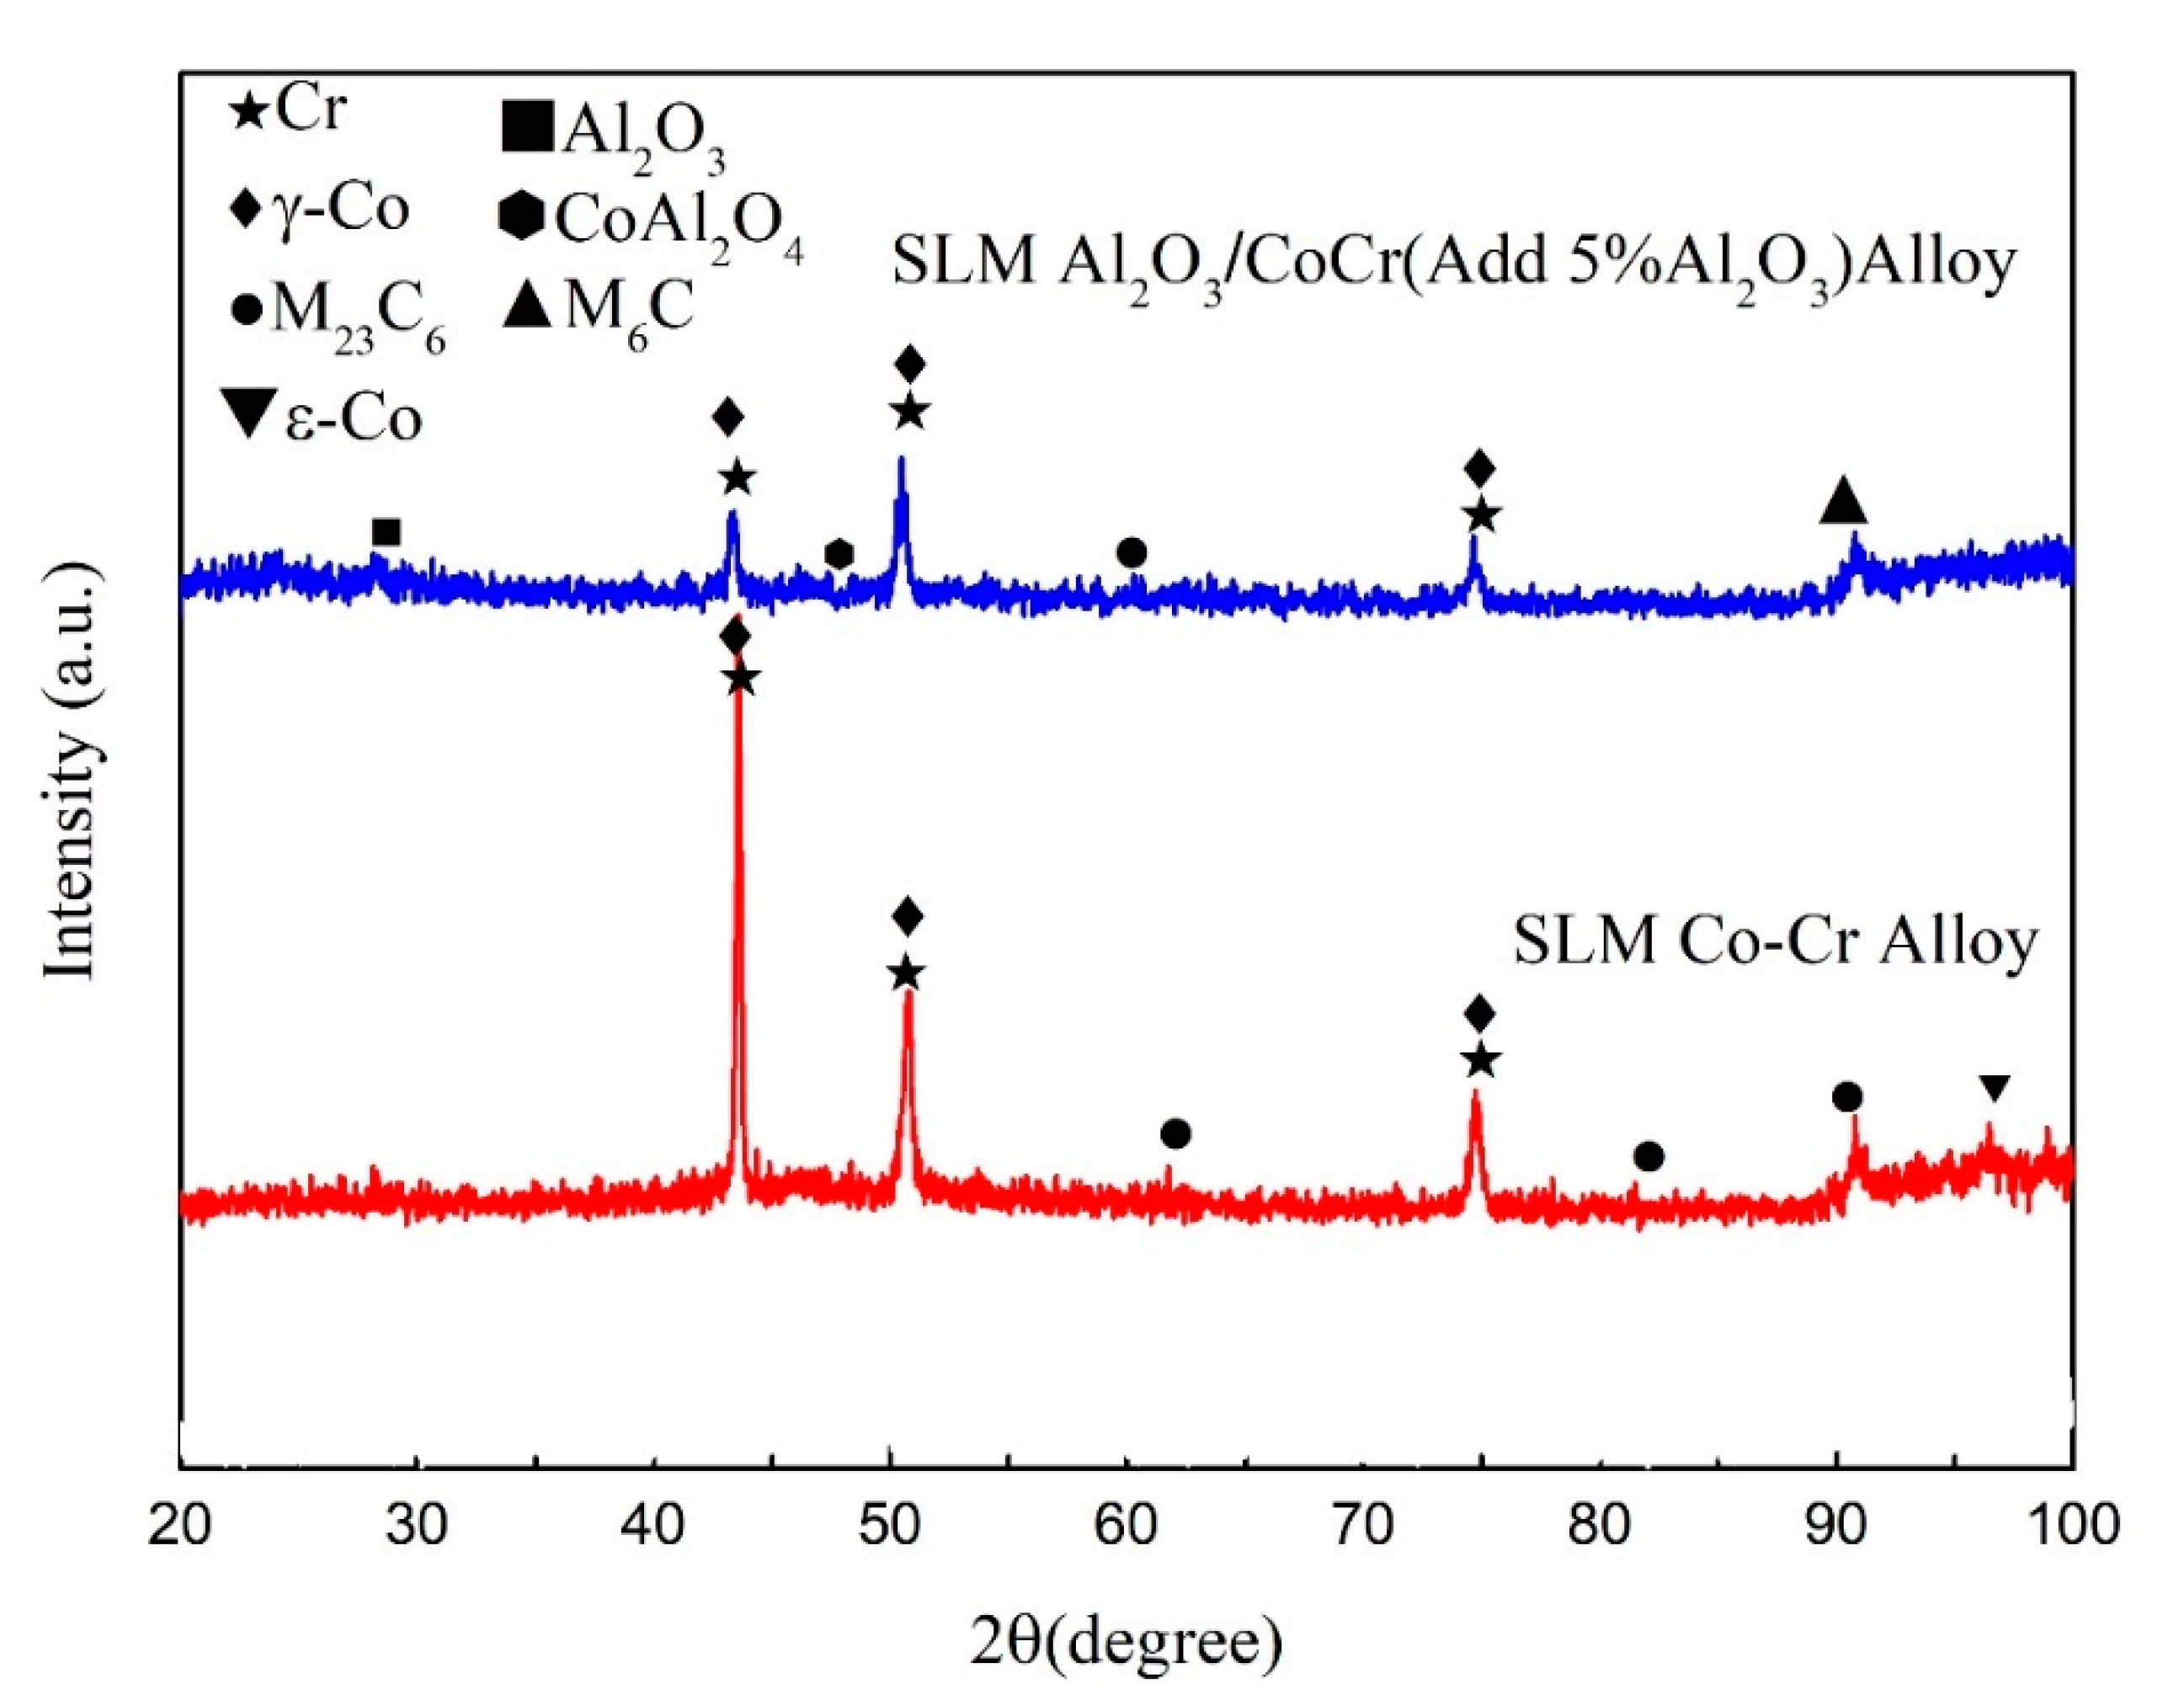
4.2. Composition of the Forming Parts
Figure 21 shows the XRD results of the pure CoCr alloy formed by SLM and Al2O3/CoCr metal matrix composites. As shown in the figure, the sample of CoCr alloy is composed of a-Co (FCC, a = 0.35447 nm, ICDD card number 15-806), ε-Co (HCP, a = 0.25031 nm, c = 0.40605 nm, ICDD card number 5-727), and carbide M23C6. After Al2O3 was added, the alloy phases were a-Co, ε-Co, M23C6, M6C, Al2O3, and CoAl2O4. Unlike with the CoCr alloy, the Al2O3, CoAl2O4, and M6C phases appear. As shown in Figure 21, the diffraction peak of the a-Co in the Al2O3/CoCr metal matrix composite is significantly higher than that of the CoCr alloy. According to Scherrer’s formula [36], the larger the half-height and width of the measured diffraction peak, the smaller the grain. Al2O3 ceramic particles can obviously refine the grain of composites.
Table 13 shows the X-ray diffraction peak analysis results of SLM-forming samples. It can be seen that the cell parameter of the a-Co phase is 0.3573. According to the calculation, the content of the γ phase with the FCC structure in the SLM-formed CoCr alloy is about 70%, which is basically consistent with existing research results [37,38]. The addition of Al2O3 reduces ε-Co compared to the CoCr alloy, which may be due to the lower thermal conductivity of Al2O3 (10.022 W∙m−1∙K−1, 1200 °C). In the alloy melt’s cooling process, the crystals and crystal fronts may contain a large number of fine Al2O3 particles, which disperse in the alloy melt, limiting the γ → ɛ phase transition process. At the same time, these fine particles will be solidly dissolved in the alloy to create a new phase. According to the calculation, the content of the γ phase is about 85%.
4.3. Internal Micro-Organization of the Forming Parts
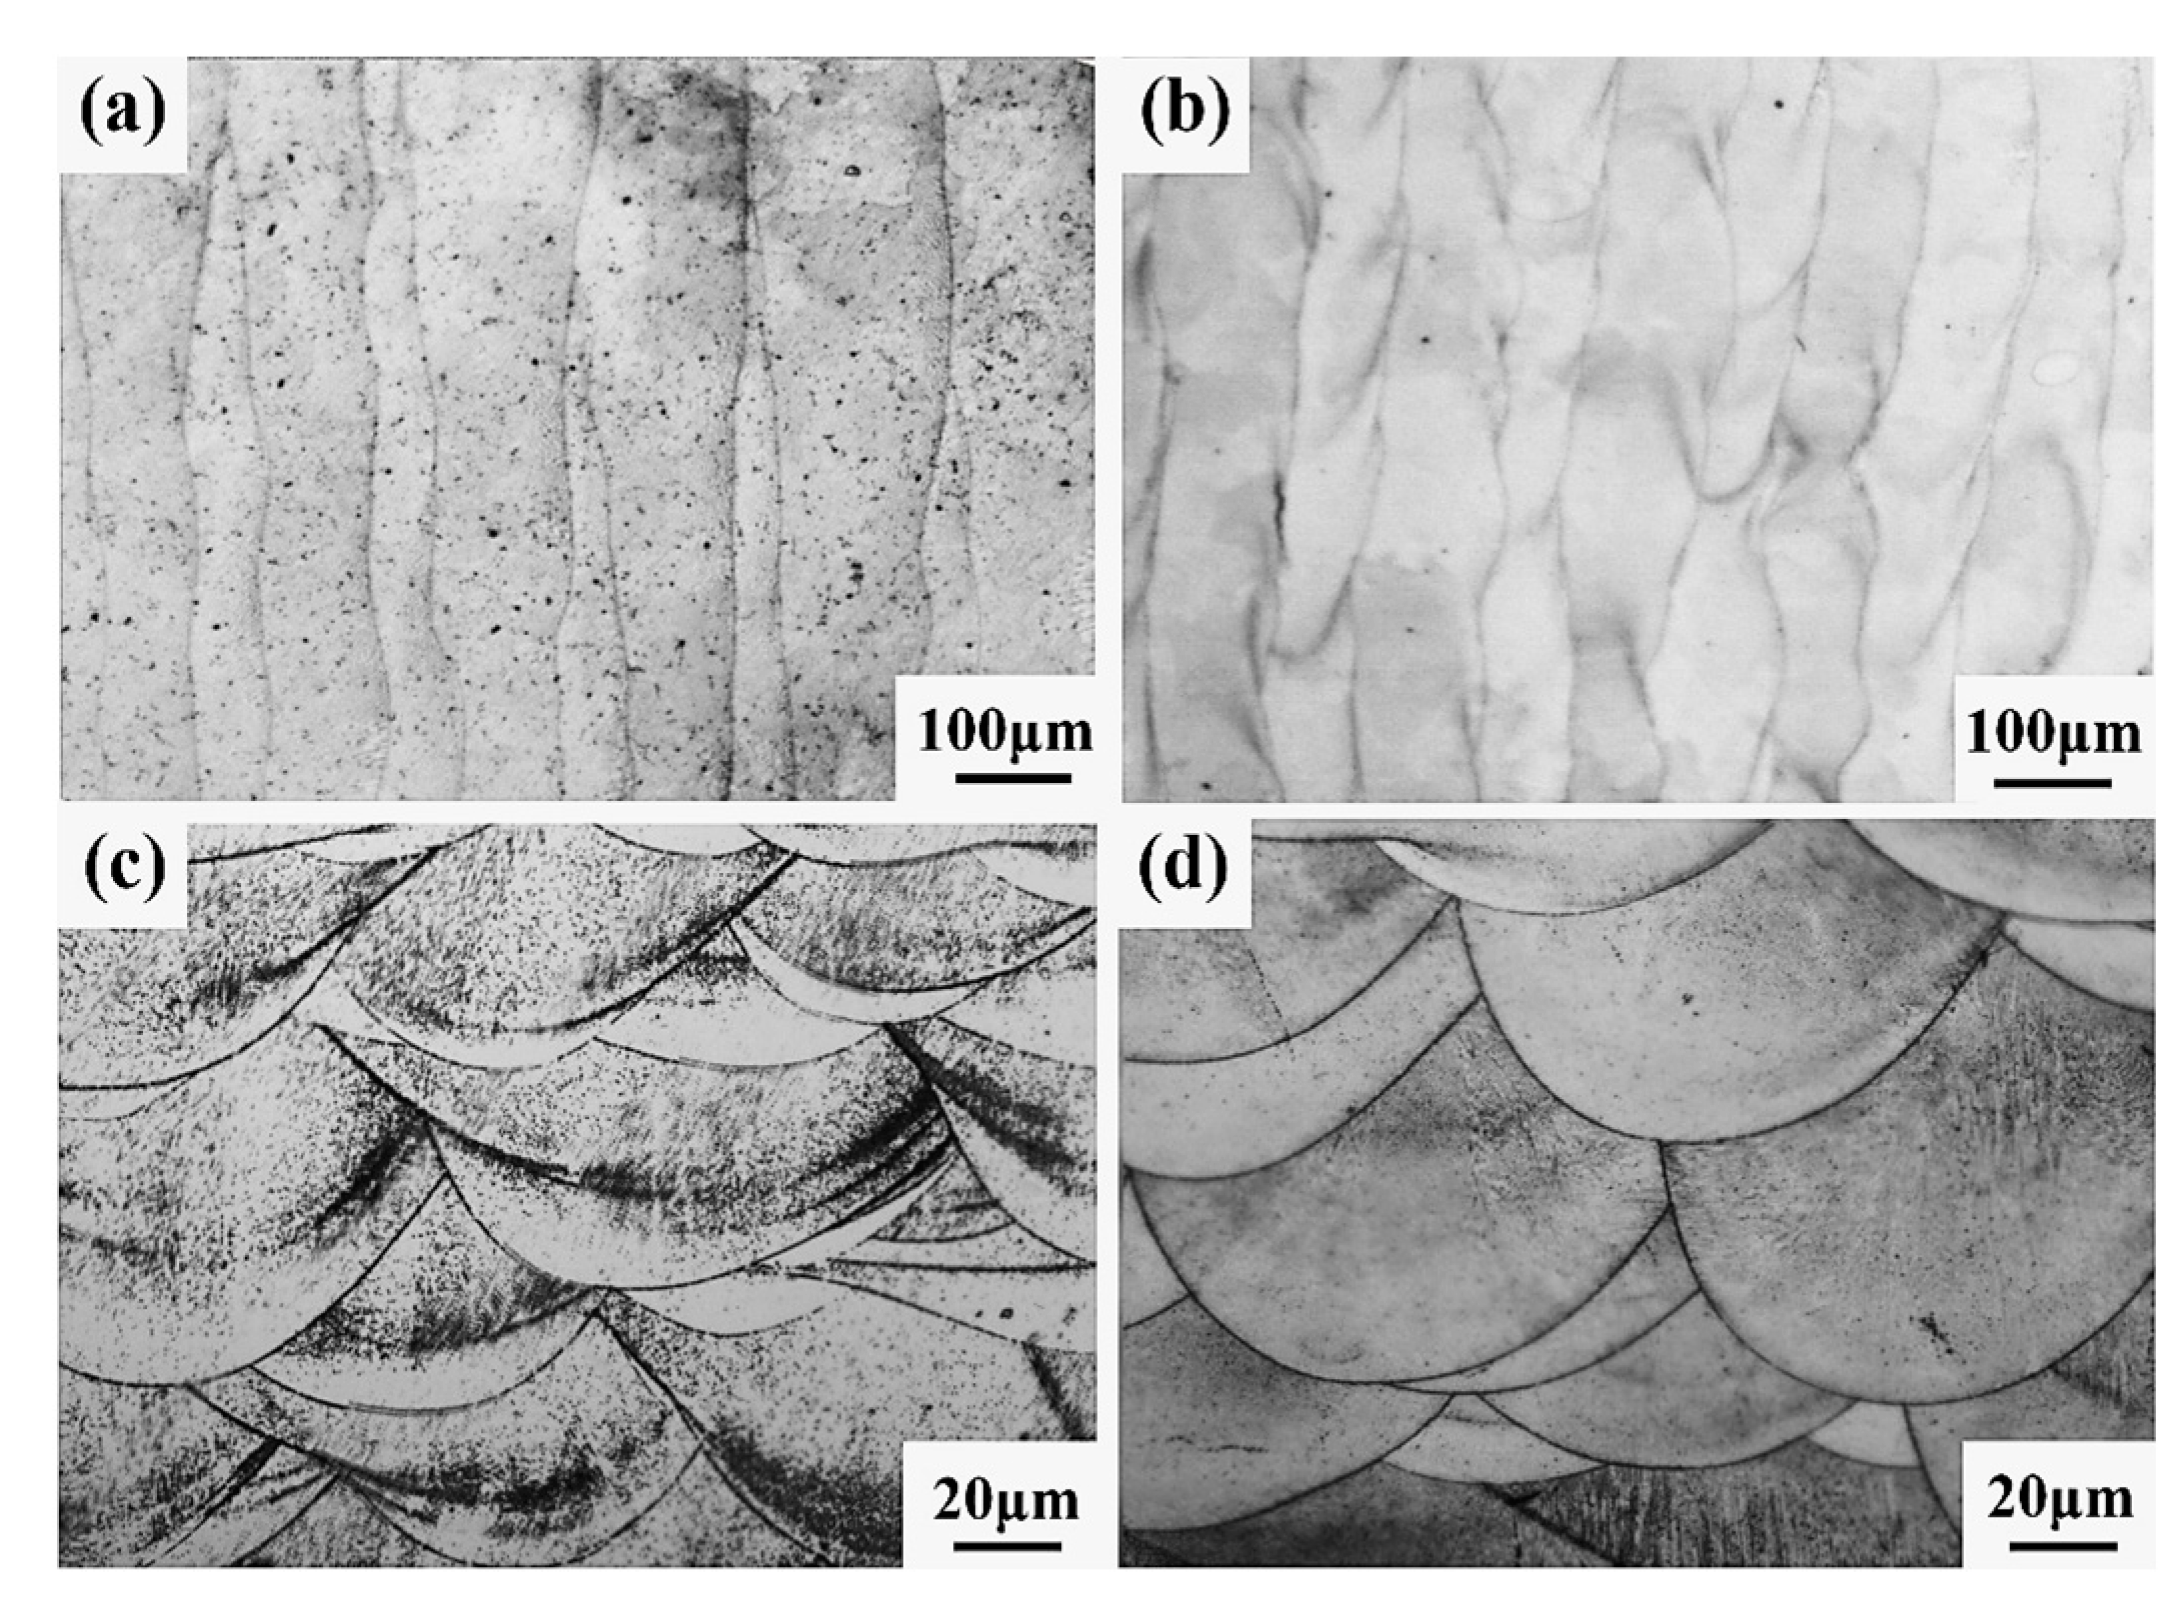
Figure 22 shows the microstructure diagram of SLM-formed samples. It can be seen from Figure 22a,b that there are no large holes or cracks in the samples of the CoCr alloy or Al2O3/CoCr metal matrix composites formed by the SLM formation, and the molten pool presents longitudinal periodic changes with a uniform and dense microstructure. After solidification, each laser molten pool has a good bonding surface. Figure 22c,d shows the metallographic structure of the SLM-formed samples along the z-axis. It can be seen that SLM-formed samples are composed of multiple molten pools with a regular fish-scale shape, and each molten pool has roughly the same size and morphology. However, the Al2O3/CoCr metal matrix composite molten pool is narrow and deep, all the powder is completely melted, and the molten pool presents longitudinal periodic changes. The above phenomenon verifies the results of the first-principles calculation in this paper and proves that the Al2O3/CoCr interface has good bonding performance.
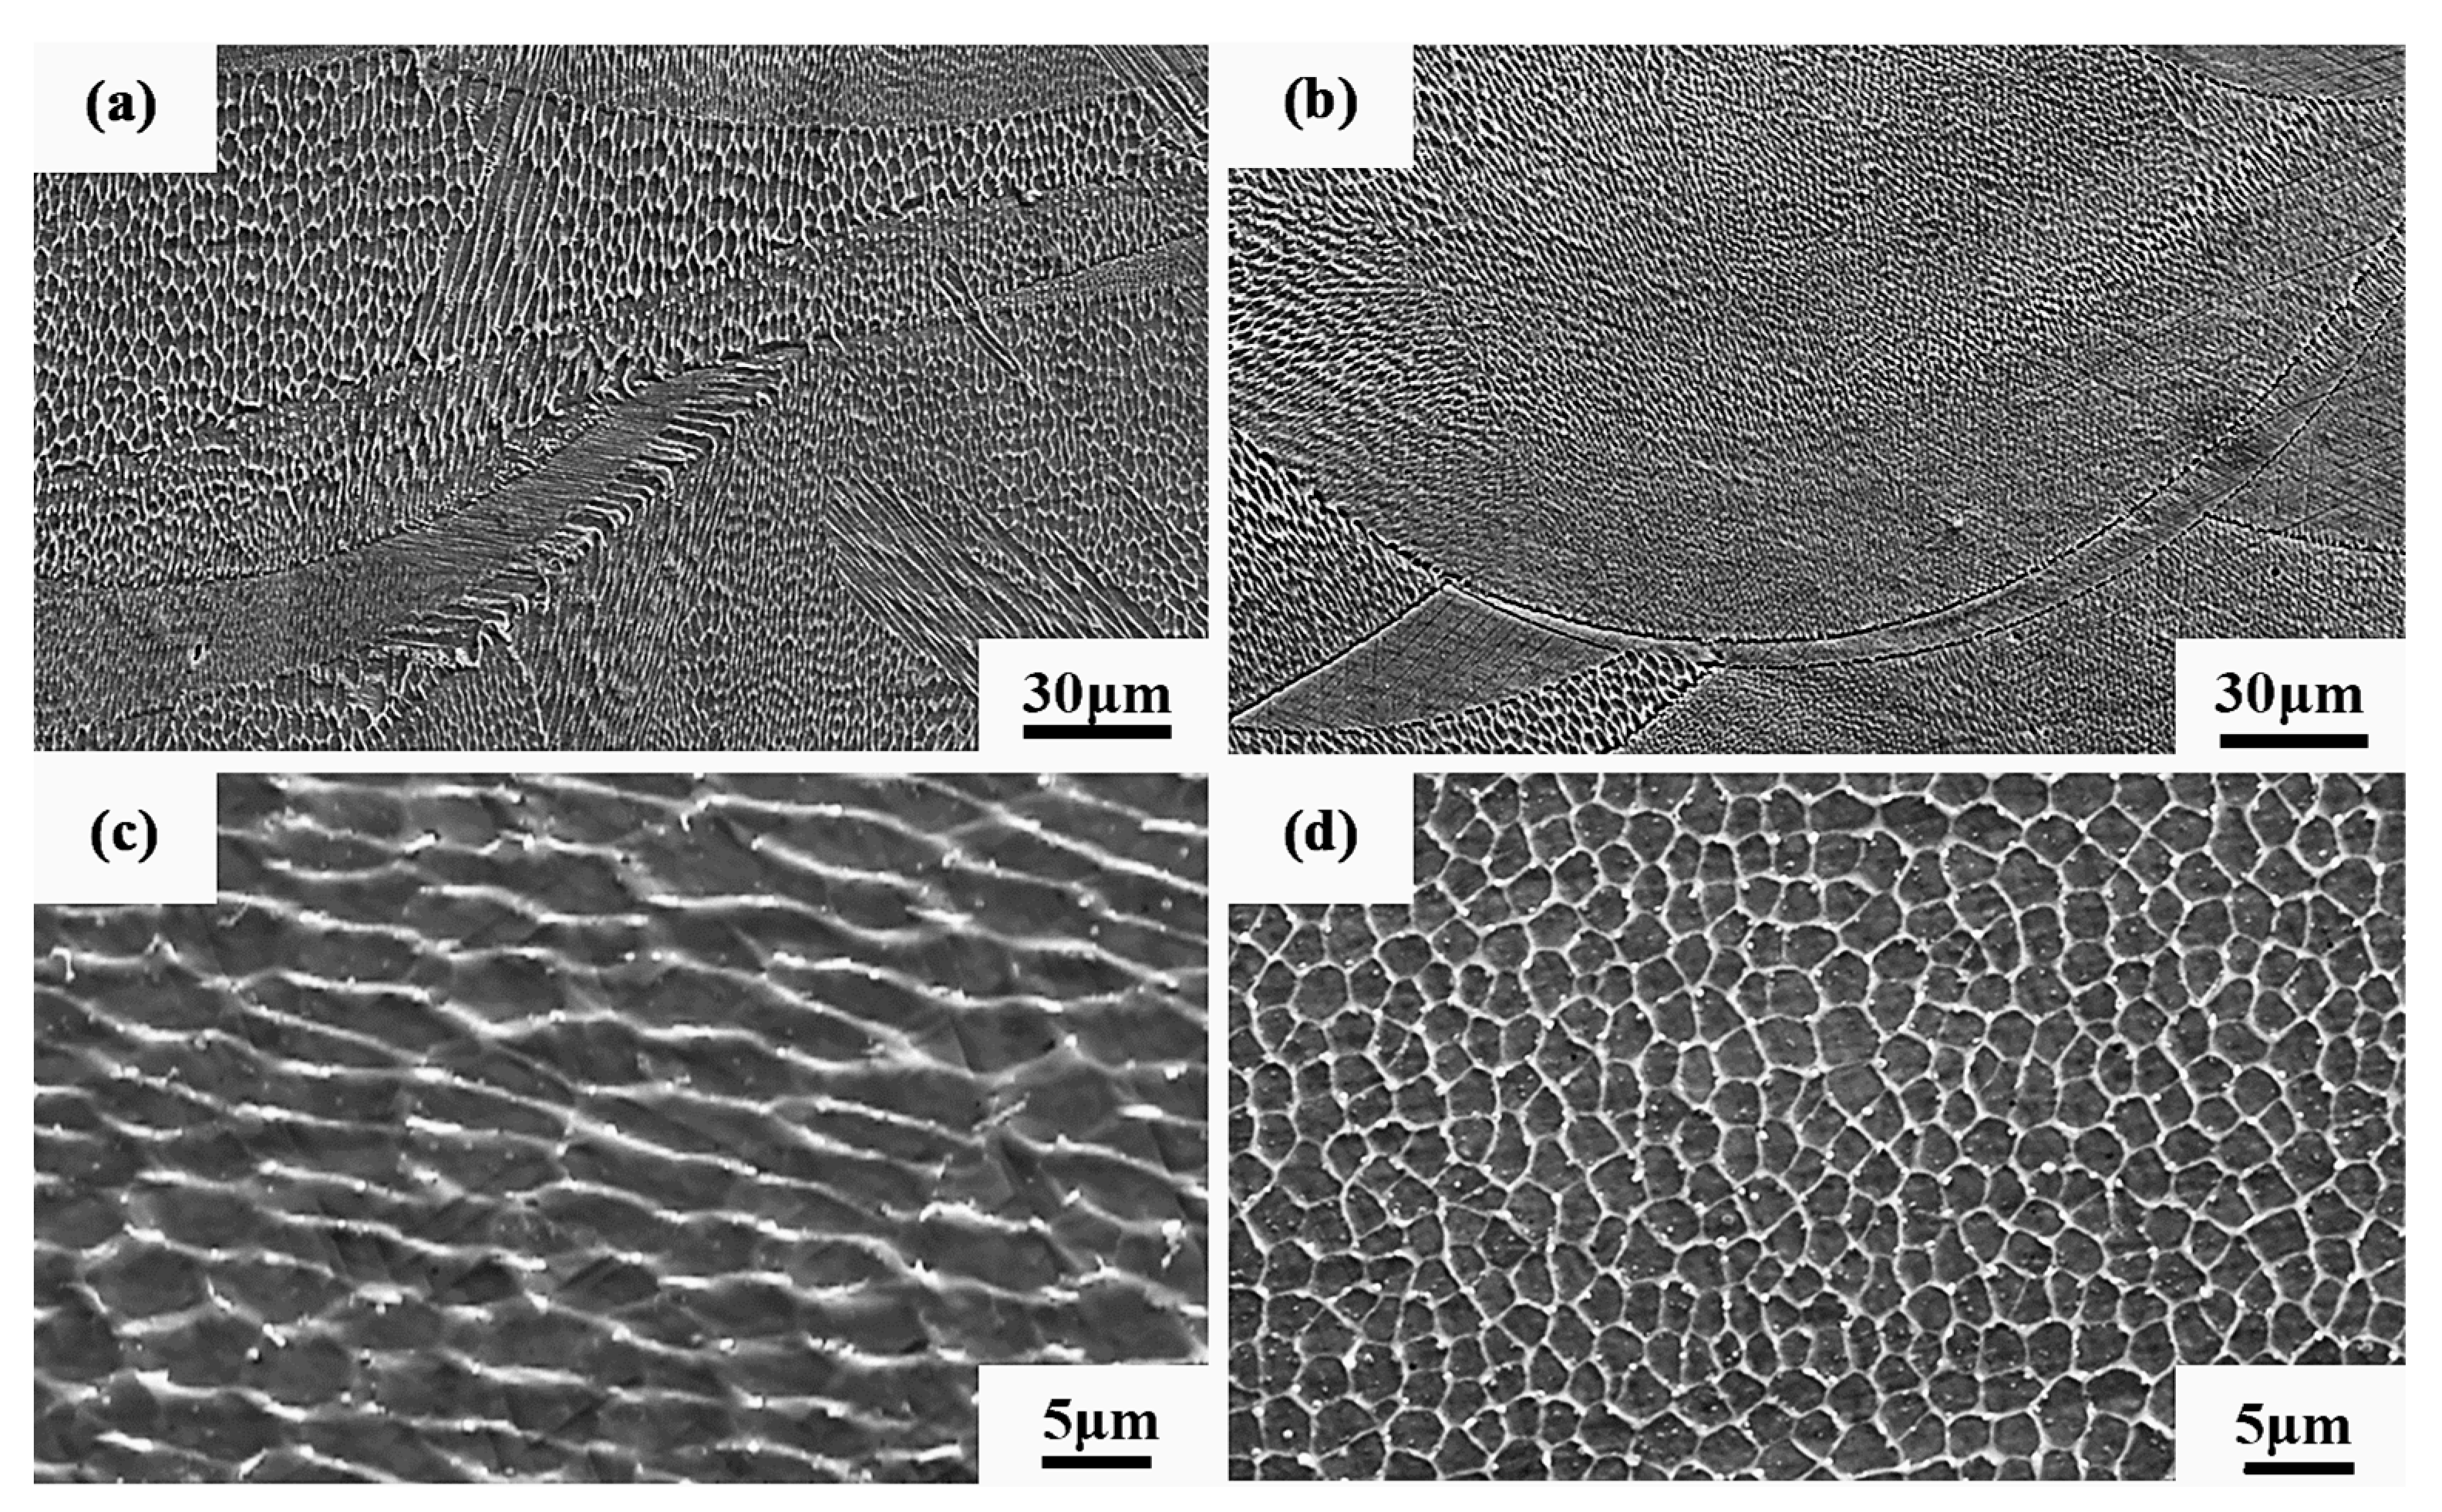
Figure 23 shows the SEM diagram of the sample. It can be seen from Figure 23a,b that the Al2O3/CoCr metal matrix composite has less grain orientation at the molten pool boundary, and further analysis shows that the cell-like grain structure at the molten pool boundary is also finer, as shown in Figure 23c,d, indicating that the alloy has a finer grain size after alumina is added.
Figure 24 shows the TEM bright field image and electron diffraction pattern of the Al2O3/CoCr metal matrix composite SLM-forming parts. In order to further analyze the microstructure of the second phase and acicular phase in the composite, the corresponding region in Figure 24b was selected for TEM analysis (the yellow circle is the second phase region, and the red box is the acicular phase region). Figure 24c,d shows the analysis results. According to the analysis, the Al2O3/CoCr metal matrix composite is different from the CoCr alloy. The structure not only contains M23C6 but also shows the electron diffraction pattern of M6C (as shown in Figure 24c), which is consistent with the XRD analysis. The acicular region of Al2O3/CoCr metal matrix composites is mainly composed of a-Co and ε-Co phases. Although the number of needle phases varies, the diffraction pattern shows that gamma-Co and ε-Co are still coherent interfaces, which are consistent with the microstructure in the CoCr alloy (Figure 24d).
5. Conclusions
- The physical phase structure of Al2O3 and CoCr was optimized, and the convergence test was conducted to obtain the lattice constant. The Al2O3 surface structure converges at layer 7, with a surface energy of 5.97 J/m2. In the CoCr (111) surface, Co converges to layer 7 and the surface energy is 4.5 J/m2, while Cr converges to layer 7 and the surface energy is 4.21 J/m2.
- Three interface models were constructed to study the interface-binding capability, which showed that the strongest interface model with the calculation interface binding ability is Al2O3 (111)/CoCr (111). Under the interface, the Wad value is 2.33 J/m2, Wsep also has a maximum value of 2.12 J/m2, and Efor has a minimum value of 0.11 J/m2.
- Through the analysis of the interface wave density, the charge density, and the differential charge density, the Al2O3 (111)/CoCr (111) interface has the highest electron overlap, the strongest charge density, and the largest overlap interface; the charges of the Co and O atoms are transferred to the interface and across the interface; and a small charge is mixed together and accumulated during the transfer process. It is concluded that the interface binding strength of the Al2O3 (111)/CoCr (111) interface is the highest.
- By studying the effect of the Al2O3 addition amount on the binding strength of the Al2O3/CoCr interface, it can be found that adding a 5% content of Al2O3 makes the interface bind the best.
- The phase composition and microstructure of Al2O3/CoCr composites formed by SLM were analyzed. It was found that the microstructure of Al2O3/CoCr composites was uniform and dense after Al2O3 was added; the main phase composition was a-Co, ε-Co, M23C6, M6C, Al2O3, and CoAl2O4; and the grain size was finer.
Author Contributions
Conceptualization, P.B., J.W. and Z.Z.; methodology, Q.H.; software, Q.H.; validation, P.B., J.W. and Z.Z.; formal analysis, J.W. and Z.Z.; investigation, Q.H. and Z.Z.; resources, P.B., J.W. and Z.Z.; writing—original draft preparation, Q.H. and J.W.; writing—review and editing, P.B. and Z.Z.; visualization, Q.H.; supervision, Z.Z.; project administration, P.B. and Z.Z. All authors have read and agreed to the published version of the manuscript.
Funding
This research work was supported by the Primary Research and Development Plan of Shanxi Province (Grant No. 201603D121020-1). The authors are grateful for the support.
Institutional Review Board Statement
Not applicable.
Informed Consent Statement
Not applicable.
Data Availability Statement
The data presented in this study are available in article.
Acknowledgments
This research work was supported by Primary Research and Development Plan of Shanxi Province (Grant No. 201603D121020-1). The authors are grateful for these grants.
Conflicts of Interest
The authors declare no conflict of interest.
References
- Hedberg, Y.S.; Qian, B.; Shen, Z.; Virtanen, S.; Wallinder, I.O. In vitro biocompatibility of CoCrMo dental alloys fabricated by selective laser melting. Dent. Mater. 2014, 30, 525–534. [Google Scholar] [CrossRef] [PubMed]
- Qian, B.; Saeidi, K.; Kvetková, L.; Lofaj, F.; Xiao, C.; Shen, Z. Defects-tolerant Co-Cr-Mo dental alloys prepared by selective laser melting. Dent. Mater. 2015, 31, 1435–1444. [Google Scholar] [CrossRef]
- Vittayakorn, W.; Poolphol, P.; Aimprakod, K.; Maluangnont, T. Processing Development and Properties of Cobalt-Chromium Alloys Fabricated by Traditional Method. Mater. Today Proc. 2021, 43, 2629–2634. [Google Scholar] [CrossRef]
- Şahin, M.; Ünalan, F.; Mutlu, I. Corrosion, ion release, and surface hardness of Ti-6Al-4V and cobalt-chromium alloys produced by CAD-CAM milling and laser sintering. J. Prosthet. Dent. 2022, 128, 529.e1–529.e10. [Google Scholar] [CrossRef]
- Chen, G.; Wang, Z.; Wang, H.; Zhao, X.; Hu, J.; Wang, S.; Zhang, S. Effects of tetrahedral amorphous carbon film deposited on dental cobalt–chromium alloys on bacterial adhesion. Surf. Coatings Technol. 2012, 206, 3386–3392. [Google Scholar] [CrossRef]
- Javdani, A.; Daei-Sorkhabi, A.H. Microstructural and mechanical behavior of blended powder semisolid formed Al7075/B 4 C composites under different experimental conditions. Trans. Nonferrous Met. Soc. China 2018, 28, 1298–1310. [Google Scholar] [CrossRef]
- Mandal, V.; Tripathi, P.; Kumar, A.; Singh, S.S.; Ramkumar, J. A study on selective laser melting (SLM) of TiC and B4C reinforced IN718 metal matrix composites (MMCs). J. Alloys Compd. 2021, 901, 163527. [Google Scholar] [CrossRef]
- Timbó, I.C.; Oliveira, M.S.; Regis, R.R. Effect of sanitizing solutions on cobalt-chromium alloys for dental prostheses: A systematic review of in vitro studies. J. Prosthet. Dent. 2022, in press. [Google Scholar] [CrossRef]
- Wang, R.; Gu, D.; Huang, G.; Shi, K.; Yuan, L.; Zhang, H. Multilayered Gradient Titanium-Matrix Composites Fabricated by Multi-Material Laser Powder Bed Fusion Using Metallized Ceramic: Forming Characteristics, Microstructure Evolution, and Multifunctional Properties. Addit. Manuf. 2023, 62, 103407. [Google Scholar] [CrossRef]
- Cui, G.; Qian, Y.; Bian, C.; Gao, G.; Hassani, M.; Liu, Y.; Kou, Z. CoCrNi matrix high-temperature wear resistant composites with micro- and nano-Al2O3 reinforcement. Compos. Commun. 2020, 22, 100461. [Google Scholar] [CrossRef]
- Ostolaza, M.; Arrizubieta, J.I.; Queguineur, A.; Valtonen, K.; Lamikiz, A.; Ituarte, I.F. Influence of process parameters on the particle-matrix interaction of WC-Co metal matrix composites produced by laser-directed energy deposition. Mater. Des. 2022, 223, 111172. [Google Scholar] [CrossRef]
- Bandyopadhyay, A.; Shivaram, A.; Isik, M.; Avila, J.D.; Dernell, W.S.; Bose, S. Additively manufactured calcium phosphate reinforced CoCrMo alloy: Bio-tribological and biocompatibility evaluation for load-bearing implants. Addit. Manuf. 2019, 28, 312–324. [Google Scholar] [CrossRef]
- Yan, L.I.U.; Liang, L.I.; Lu, G.L.; Han, Z.W.; Liu, J.D.; Yu, S.R. Fractal characteristics and wettability of Nano-Al2O3/Ni-Co composite coating prepared by electrodeposition. Trans. Nonferrous Met. Soc. China 2011, 21, s380–s383. [Google Scholar]
- Gökog, G. First principles electronic structure calculations of Co2CrBi Heusler system. Phys. B Condens. Matter 2010, 405, 2162–2165. [Google Scholar] [CrossRef]
- Arif, H.; Tahir, M.; Sagir, M.; Alrobei, H.; Alzaid, M.; Ullah, S.; Hussien, M. Effect of potassium on the structural, electronic, and optical properties of CsSrF3 fluro perovskite: First-principles computation with GGA-PBE. Optik 2022, 259, 168741. [Google Scholar] [CrossRef]
- Ke, D.; Pan, Y.; Wu, T.; Wang, J.; Xu, X.; Pan, Y. Effect of W/B atomic ratio on the microstructure and mechanical properties of WCoB-TiC ceramic composites: First-principles calculations and experiment. J. Mater. Res. Technol. 2020, 9, 8744–8753. [Google Scholar] [CrossRef]
- Todorova, T.Z.; Gaier, M.; Zwanziger, J.W.; Plucknett, K.P. Understanding the elastic and thermal response in TiC-based ceramic-metal composite systems: First-principles and mechanical studies. J. Alloys Compd. 2019, 789, 712–719. [Google Scholar] [CrossRef]
- Wang, Q.; Bai, P.; Zhao, Z. First Principle Study of TiB (2) (0001)/gamma-Fe (111) Interfacial Strength and Heterogeneous Nucleation. Materials 2021, 14, 1573. [Google Scholar] [CrossRef]
- Yang, G.; Liu, Y.; Hang, Z.; Xi, N.; Fu, H.; Chen, H. Adhesion at cerium doped metal-ceramic α-Fe/WC interface: A first-principles calculation. J. Rare Earths 2019, 37, 773–780. [Google Scholar] [CrossRef]
- Dmitriev, S.V.; Yoshikawa, N.; Kohyama, M.; Tanaka, S.; Yang, R.; Kagawa, Y. Atomistic structure of the Cu (111) /α-Al2O3 (0001) interface in terms of interatomic potentials fitted to ab initio results. Acta Mater. 2004, 52, 1959–1970. [Google Scholar] [CrossRef]
- Dmitriev, S.V.; Yoshikawa, N.; Kohyama, M.; Tanaka, S.; Yang, R.; Tanaka, Y.; Kagawa, Y. Modeling interatomic interactions across Cu/α–Al2O3 interface. Comput. Mater. Sci. 2006, 36, 281–291. [Google Scholar] [CrossRef]
- Qiu, Z.; Shang, J.; Bi, X.; Gong, S.; Xu, H. Study of electronic structure in Co/Al2O3/Co heterojunctions from first principles. Acta Mater. 2004, 52, 533–537. [Google Scholar] [CrossRef]
- Kim, H.G.; Kim, W.R.; Park, H.W.; Bang, G.B.; Jung, K.H.; Son, Y.; Lim, S.H. Microstructural study of the nano-scale martensitic lamellar α-Co and ε-Co phases of a Co–Cr alloy fabricated by selective laser melting. J. Mater. Res. Technol. 2021, 12, 437–443. [Google Scholar] [CrossRef]
- Antunes, L.H.; de Lima, C.R. Cobalt-Chromium Alloys—Properties and Applications. Ref. Modul. Mater. Sci. Mater. Eng. 2018. [Google Scholar] [CrossRef]
- CCDC. Available online: http://www.ccdc.cam.ac.uk/cgi-bin/catreq.cgi (accessed on 12 July 2020).
- Luo, M.; Li, C.; Liu, Q.; Yang, Z.; Wang, Y.; Li, H. β-Mo2C/γ-Al2O3 catalyst for one step CO hydrogenation to produce alcohols. Catal. Today 2022, 402, 328–334. [Google Scholar] [CrossRef]
- Xie, H.; Zhao, N.; Shi, C.; He, C.; Liu, E. Effects of active elements on adhesion of the Al2O3/Fe interface: A first principles calculation. Comput. Mater. Sci. 2021, 188, 110226. [Google Scholar] [CrossRef]
- Akbarzadeh, A.; Ahmadlouydarab, M.; Niaei, A. Capabilities of α-Al2O3, γ-Al2O3, and bentonite dry powders used in flat plate solar collector for thermal energy storage. Renew. Energy 2021, 173, 704–720. [Google Scholar] [CrossRef]
- Smirnova, N.S.; Baeva, G.N.; Markov, P.V.; Mashkovsky, I.S.; Bukhtiyarov, A.V.; Zubavichus, Y.V.; Stakheev, A.Y. In situ FTIR study of surface site transformations in Pd3In/α-Al2O3 and Pd3Ag/α-Al2O3 induced by CO adsorption. Mendeleev Commun. 2022, 32, 807–809. [Google Scholar] [CrossRef]
- Economist, T. A third industrial revolution. Economist 2012, 403, a3–a4. [Google Scholar]
- Yu, Y.; Zhong, L.; Deng, C.; Bai, H.; Zhu, J.; Zhao, N.; Peng, J. Mechanical properties and chemical bonding transitions of Nb/NbC and α-Fe/NbC interfaces in Fe-Nb-C composites. Mater. Today Commun. 2022, 33, 104791. [Google Scholar] [CrossRef]
- Wood, M.; Ward-Close, M. Fibre-reinforced intermetallic compounds by physical vapour deposition. Mater. Sci. Eng. A 1995, 192, 590–596. [Google Scholar] [CrossRef]
- Mukherjee, S.; De, I. Feature extraction from handwritten documents for personality analysis. In Proceedings of the 2016 International Conference on Computer, Electrical & Communication Engineering (ICCECE), Kolkata, India, 16–17 December 2016; pp. 1–8. [Google Scholar] [CrossRef]
- Ha, S.H.; Yoshimi, K.; Nakamura, J.; Kaneko, T.; Maruyama, K.; Tu, R.; Goto, T. Experimental study of Moss–T2, Moss–Mo3Si–T2, and Mo3Si–T2 eutectic reactions in Mo-rich Mo–Si–B alloys. J. Alloys Compd. 2014, 594, 52–59. [Google Scholar] [CrossRef]
- Y.T. 1702-2020, Dentistry—Additive Manufacturing—Selective Laser Melting Metallic Materials for Fixed and Removable Restorations and Appliances. Available online: https://wenku.so.com/d/bca4f278bb33b53560e3117c4925dfa2 (accessed on 26 April 2020).
- Chang, F.; Gu, D.; Dai, D.; Yuan, P. Selective laser melting of in-situ Al4SiC4 + SiC hybrid reinforced Al matrix composites: Influence of starting SiC particle size. Surf. Coat. Technol. 2015, 272, 15–24. [Google Scholar] [CrossRef]
- Zhao, C.; Zhou, J.; Mei, Q.; Ren, F. Microstructure and dry sliding wear behavior of ultrafine-grained Co-30 at% Cr alloy at room and elevated temperatures. J. Alloys Compd. 2019, 770, 276–284. [Google Scholar] [CrossRef]
- Zhou, Y.; Wei, W.; Yan, J.; Liu, W.; Li, N.; Li, H.; Xu, S. Microstructures and metal-ceramic bond properties of Co-Cr biomedical alloys fabricated by selective laser melting and casting. Mater. Sci. Eng. A 2019, 759, 594–602. [Google Scholar] [CrossRef]
Figure 1.
SEM images of CoCr alloy powders at low (a) and high (b) magnification.

Figure 2.
SEM images of Al2O3 alloy powders at low (a) and high (b) magnification.

Figure 3.
SLM specimen and specimen printing demonstration process.

Figure 4.
Crystal structure of the CoCr alloy.

Figure 5.
Densities of states of the optimized CoCr product: (a) total density of states, (b) Co partial density of states, and (c) Cr partial density of states.
Figure 5.
Densities of states of the optimized CoCr product: (a) total density of states, (b) Co partial density of states, and (c) Cr partial density of states.

Figure 6.
Band structure of CoCr. (a) SPIN UP, (b) SPIN DOWN.

Figure 7.
Crystal structure of Al2O3.

Figure 8.
Densities of states and band density of Al2O3 crystals: (a) overall density-of-states diagram, (b) Al atomic fractional density of states, (c) O atomic fractional density of states, and (d) band structure.
Figure 8.
Densities of states and band density of Al2O3 crystals: (a) overall density-of-states diagram, (b) Al atomic fractional density of states, (c) O atomic fractional density of states, and (d) band structure.

Figure 9.
Combinations of different CoCr atoms: (a) CoCr (100), (b) CoCr (110), and (c) CoCr (111).

Figure 10.
Al2O3/CoCr interface structure model: (a) atomic supercell model, (b) interface structure model from the top view, (c) interface structure model from the front view, and (d) 3D interface model.
Figure 10.
Al2O3/CoCr interface structure model: (a) atomic supercell model, (b) interface structure model from the top view, (c) interface structure model from the front view, and (d) 3D interface model.

Figure 11.
Fractional density of states for each crystal structure model of Al2O3/CoCr: (a) Al2O3 (111)/CoCr (100) crystal structure model’s fractional wave density of states, (b) Al2O3 (111)/CoCr (110) crystal structure model’s fractional wave density of states, and (c) Al2O3 (111)/CoCr (111) crystal structure model’s fractional wave density of states. Note: the equivalent surface value is 0.007 e Å−3.

Figure 12.
Charge density distributions of the three models of Al2O3/CoCr: (a) Al2O3 (111)/CoCr (100) crystal structure model’s charge density distribution, (b) Al2O3 (111)/CoCr (110) crystal structure model’s charge density distribution, and (c) Al2O3 (111)/CoCr (111) crystal structure model’s charge density distribution. Note: the equivalent surface value is 0.005 e Å−3.

Figure 13.
Differential charge density diagrams of the three models of Al2O3/CoCr: (a) differential charge density map of the Al2O3 (111)/CoCr (100) crystal structure model, (b) differential charge density map of the Al2O3(111)/CoCr (110) crystal structure model, and (c) differential charge density map of the Al2O3 (111)/CoCr (111) crystal structure model. Note: the equivalent surface value is 0.007 e Å−3.

Figure 14.
Cobalt–chromium alloy powder cube model.

Figure 15.
Interface structure model of Al2O3 (111)/CoCr (111): (a) Al2O3 content of 5%, (b) Al2O3 content of 7.5%, and (c) Al2O3 content of 10%.
Figure 15.
Interface structure model of Al2O3 (111)/CoCr (111): (a) Al2O3 content of 5%, (b) Al2O3 content of 7.5%, and (c) Al2O3 content of 10%.

Figure 16.
Fracture work of the Al2O3 (111)/CoCr (111) interface structure model: (a) Al2O3 content of 5%, (b) Al2O3 content of 7.5%, and (c) Al2O3 content of 10%.
Figure 16.
Fracture work of the Al2O3 (111)/CoCr (111) interface structure model: (a) Al2O3 content of 5%, (b) Al2O3 content of 7.5%, and (c) Al2O3 content of 10%.

Figure 17.
Al2O3/CoCr crystal structure model partial wave density of states: (a) Al2O3 content of 5%, (b) Al2O3 content of 7.5%, and (c) Al2O3 content of 10%. Note: the equivalent surface value is 0.007 e Å−3.
Figure 17.
Al2O3/CoCr crystal structure model partial wave density of states: (a) Al2O3 content of 5%, (b) Al2O3 content of 7.5%, and (c) Al2O3 content of 10%. Note: the equivalent surface value is 0.007 e Å−3.

Figure 18.
Model charge density and differential charge density of Al2O3/CoCr: (a) charge density for each content, (b) differential charge density for each content (from right to left: 5%, 7.5%, and 10%). Note: the equivalent surface value is 0.005 e Å−3.
Figure 18.
Model charge density and differential charge density of Al2O3/CoCr: (a) charge density for each content, (b) differential charge density for each content (from right to left: 5%, 7.5%, and 10%). Note: the equivalent surface value is 0.005 e Å−3.

Figure 19.
SEM diagram of Al2O3/CoCr composite powder: (a) 2.5 % Al2O3, (b) 5 % Al2O3, (c) 7.5% Al2O3, and (d) 10 % Al2O3.
Figure 19.
SEM diagram of Al2O3/CoCr composite powder: (a) 2.5 % Al2O3, (b) 5 % Al2O3, (c) 7.5% Al2O3, and (d) 10 % Al2O3.

Figure 20.
Powder X-ray diffraction pattern.

Figure 21.
SLM CoCr sample. Al2O3/CoCr sample X-ray diffraction (XRD) pattern.

Figure 22.
SEM images of SLM-forming sample: (a) CoCr gold-phase diagram on the x–y plane, (b) Al2O3/CoCr gold-phase diagram on the x–y plane, (c) CoCr gold-phase diagram on the z-axis, and (d) Al2O3/CoCr gold phase diagram on the z-axis.
Figure 22.
SEM images of SLM-forming sample: (a) CoCr gold-phase diagram on the x–y plane, (b) Al2O3/CoCr gold-phase diagram on the x–y plane, (c) CoCr gold-phase diagram on the z-axis, and (d) Al2O3/CoCr gold phase diagram on the z-axis.

Figure 23.
Microstructure SEM diagram of SLM alloy samples: (a) microstructure of the weld pool boundary on the side (BD) of the CoCr alloy specimen, (b) microstructure of the pool boundary on the side (BD) of the Al2O3/CoCr alloy specimen, (c) cellular microtissue enlargement of the side of the CoCr alloy specimen, and (d) a cell-like microtissue enlargement map of the side of the Al2O3/CoCr alloy specimen.

Figure 24.
TEM bright field image and electron diffraction pattern of Al2O3/CoCr metal matrix composite: (a) bright field image of the composite material, (b) local magnified bright field image of the composite, (c) electron diffraction pattern in the yellow circle area in (b), and (d) magnified bright-field image of the lamellar area.


Table 1.
Main chemical elements of CoCr alloy powders.
| Chemical Composition | Cr | Mo | Si | Mn | Fe | C | Co |
|---|---|---|---|---|---|---|---|
| Content (%) | 29.5 | 5.3 | 0.7 | 0.5 | 0.4 | 1.2 | Others |
Table 2.
Lattice parameters of CoCr.
| CoCr | a | b | c | α = β | γ |
|---|---|---|---|---|---|
| Theoretical parameters [25] | 3.545 | 3.545 | 3.545 | 90 | 90 |
| Parameter after optimization | 3.553 | 3.553 | 3.553 | 90 | 90 |
Table 3.
Performance of Al2O3 crystal.
| Type | Density/(g·cm−3) | Property | Structure | Stability |
|---|---|---|---|---|
| γ-Al2O3 | 3.2~3.4 | Strong reactivity | FCC | Metastable |
| Cubic | state | |||
| θ-Al2O3 | 3.6 | Center | HCP | Metastable |
| Monoclinic | state | |||
| α-Al2O3 | 3.97 | Poor activity High-hardness | HCP Rhombohedral | Steady state |
Table 4.
Lattice parameters of Al2O3.
| Al2O3 | a | b | c | α = β | γ |
|---|---|---|---|---|---|
| Theoretical parameters | 4.759 | 4.759 | 12.991 | 90 | 120 |
| Optimized after parameters | 4.796 | 4.796 | 13.089 | 90 | 120 |
Table 5.
Surface energy of Al2O3 with different layer thicknesses.
| Number of Plies (N) | Eslab (cV) | σ (J/m2) |
|---|---|---|
| 4 | 0.884 | 1.121 |
| 5 | 0.719 | 1.035 |
| 6 | 0.693 | 1.0545 |
| 7 | 0.435 | 0.43239 |
Table 6.
Theoretical value of the lattice constant of CoCr.
| Number of Plies (N) | σ (J/m2) | ||
|---|---|---|---|
| CoCr (100) | CoCr (110) | CoCr (111) | |
| 4 | 2.56 | 2.83 | 2.37 |
| 5 | 2.33 | 2.01 | 2.89 |
| 6 | 2.51 | 1.63 | 1.98 |
| 7 | 1.78 | 1.75 | 1.76 |
| 8 | 1.35 | 1.87 | 2.01 |
Table 7.
Degree of the model misfit of Al2O3 (111)/CoCr interfaces.
| Structure | Lattice Parameters (Å) | ε (%) |
|---|---|---|
| Al2O3 (111)/CoCr (100) | a = 8.32, b = 13.96, c = 22.00 | 7.98 |
| Al2O3 (111)/CoCr (110) | a = 8.56, b = 13.54, c = 21.00 | 8.03 |
| Al2O3 (111)/CoCr (111) | a = 8.62, b = 12.54, c = 27.00 | 7.41 |
Table 8.
Interfacial spacing, interfacial bonding work, and interfacial formation energy of each interface model of Al2O3/CoCr after complete relaxation.
Table 8.
Interfacial spacing, interfacial bonding work, and interfacial formation energy of each interface model of Al2O3/CoCr after complete relaxation.
| Structure | Wad (J/m2) | Wsep (J/m2) | Efor (J/m2) |
|---|---|---|---|
| Al2O3 (111)/CoCr (100) | 2.06 | 2.02 | 0.19 |
| Al2O3 (111)/CoCr (110) | 1.93 | 1.83 | 0.21 |
| Al2O3 (111)/CoCr (111) | 2.33 | 2.12 | 0.11 |
Table 9.
Mixed powder ratios.
| Group | Mixed Ratios |
|---|---|
| 1 | 97.5% CoCr alloy powder + 2.5% Al2O3 |
| 2 | 95% CoCr alloy powder + 5% Al2O3 |
| 3 | 92.5% CoCr alloy powder + 7.5% Al2O3 |
| 4 | 90% CoCr alloy powder + 10% Al2O3 |
Table 10.
Interfacial spacing, interfacial bonding work, and interfacial formation energy after complete relaxation of the interface model with different Al2O3 contents.
Table 10.
Interfacial spacing, interfacial bonding work, and interfacial formation energy after complete relaxation of the interface model with different Al2O3 contents.
| Structure | Wad (J/m2) | Wsep (J/m2) | Efor (J/m2) |
|---|---|---|---|
| 5% Al2O3 | 2.36 | 2.24 | 0.15 |
| 7.5% Al2O3 | 2.01 | 2.08 | 0.16 |
| 10% Al2O3 | 1.99 | 1.87 | 0.19 |
Table 11.
Particle size distribution of alloy powder.
| Type of Powder | Particle Size Distribution (μm) D10–D90 |
|---|---|
| CoCr alloy powder | 18.5–58.6 |
| Add 5% Al2O3 composite powder | 13.2–43.5 |
Table 12.
Physical property parameters of the alloy powder.
| Type of Powder | Loose Pack Density (g/cm3) | Liquidity/(s. (50 g)−1) | Degree of Sphericity |
|---|---|---|---|
| YY/T 1702-2020 | ≥4.0 | ≤40 | ≥0.7 |
| CoCr alloy powder | 4.16 | 22.6 | 0.76 |
| Add 5% Al2O3 composite powder | 4.29 | 22.9 | 0.72 |
Table 13.
X-ray diffraction peak analysis results.
| Sample | Cell Parameter (FCC) a-Co (nm) | Cell Parameter (HCP) ε-Co (nm) | Fraction of Volume HCP FHCP |
|---|---|---|---|
| CoCr powder | a = 0.3534 ± 0.0002 | - | - |
| SLM CoCr alloy | a = 0.3573 ± 0.0005 | a = 0.2533 ± 0.0003 c = 0.392 ± 0.002 c/a = 1.548 | 0.605 ± 0.005 |
| SLM Al2O3/CoCr Composite material | a = 0.3568 ± 0.0001 | a = 0.2528 ± 0.0002 c = 0.399 ± 0.003 c/a = 1.578 | 0.168 ± 0.02 |
Disclaimer/Publisher’s Note: The statements, opinions and data contained in all publications are solely those of the individual author(s) and contributor(s) and not of MDPI and/or the editor(s). MDPI and/or the editor(s) disclaim responsibility for any injury to people or property resulting from any ideas, methods, instructions or products referred to in the content. |
© 2023 by the authors. Licensee MDPI, Basel, Switzerland. This article is an open access article distributed under the terms and conditions of the Creative Commons Attribution (CC BY) license (https://creativecommons.org/licenses/by/4.0/).
Share and Cite
MDPI and ACS Style
Hong, Q.; Bai, P.; Zhao, Z.; Wang, J. First-Principle Study of the Interface of Al2O3/CoCr Metal-Based Composites. Coatings 2023, 13, 680. https://doi.org/10.3390/coatings13040680
AMA Style
Hong Q, Bai P, Zhao Z, Wang J. First-Principle Study of the Interface of Al2O3/CoCr Metal-Based Composites. Coatings. 2023; 13(4):680. https://doi.org/10.3390/coatings13040680
Chicago/Turabian StyleHong, Qin, Peikang Bai, Zhanyong Zhao, and Jianhong Wang. 2023. "First-Principle Study of the Interface of Al2O3/CoCr Metal-Based Composites" Coatings 13, no. 4: 680. https://doi.org/10.3390/coatings13040680
Note that from the first issue of 2016, this journal uses article numbers instead of page numbers. See further details here.