Article

Study on Thixotropic Properties of Asphalt Mastics Based on Energy Viewpoint

1
Engineering Research Center of Transportation Materials, Ministry of Education School of Materials Science and Engineering, Chang’an University, Xi’an 710064, China
2
Research and Development Center of Transport Industry of Technologies, Materials and Equipments of Highway Construction and Maintenance, Gansu Road & Bridge Construction Group Co., Ltd., Lanzhou 730030, China
3
School of Civil Engineering, Lanzhou University of Technology, No. 287, Langongping Road, Qilihe District, Lanzhou 730050, China
*
Authors to whom correspondence should be addressed.
Coatings 2023, 13(3), 650; https://doi.org/10.3390/coatings13030650
Submission received: 30 January 2023 / Revised: 13 March 2023 / Accepted: 14 March 2023 / Published: 20 March 2023
(This article belongs to the Special Issue Asphalt Pavement: Materials, Design and Characterization)

Abstract

:
An asphalt mastic has thixotropic characteristics that significantly influence its fatigue and healing performance. Therefore, understanding the thixotropy of an asphalt mastic is clearly of great importance. However, research in this area is still in the early stages. This study focuses on self-heating as one of the biasing performances of asphalt material by analyzing the viscosity, stress, and hysteresis loops the of asphalt mastics under cyclic shear loading. Twelve types of asphalt mastics fabricated with asphalt, as well as different types of mineral filler, were selected to examine thixotropy. In addition, the filler/asphalt ratio was examined via the hysteresis technique to analyze the hysteresis loop and the viscosity–shear rate. The thixotropic potential function was also studied from the energy viewpoint. The results show that asphalt mastics with different asphalt binders, mineral fillers, and filler volume fractions showed hysteresis loops for shear stress versus shear rate diagrams. With an increase in the loading times of the cyclic load, the area of the hysteresis loop gradually decreases, and the hysteresis area most likely features a relatively stable value. The thixotropy of the asphalt can be significantly reduced by adding filler, and different types of mineral filler can slightly influence the thixotropy. The viscosity decreases with an increase in the shear rate, and it gradually recovers with a decrease in the shear rate. The greater the filler/asphalt ratio, the greater the viscosity, and the faster the viscosity’s descent is with the prolongation of time. Due to the existence of a higher amount of filler content, the recovery of a viscosity crack is more difficult. For asphalt mastics with high filler/asphalt ratios, the thixotropic mechanism can be explained via particle agglomeration and the depolymerization theory. For asphalt mastics with low and medium filler/asphalt ratios, the thixotropic mechanism can be explained via the particle chain theory. The damage and recovery of the internal structure of an asphalt mastic can be characterized by the structural failure potential function and the structural recovery potential function, respectively.

1. Introduction

Over its lifetime, asphalt pavement is subjected to repeated traffic loading, which causes mechanical damage within the constitutive layers. This reduces the pavement’s carrying capacity, accelerates its damage, and shortens its service life. To achieve a better understanding the performance of asphalt pavement, reducing its damages and prolonging its life, cyclic loading tests are commonly carried out in a laboratory setting on asphalt materials of different scales [1]. Many methods exist for simulating the cyclic loading, such as the time sweep (TS) and the linear amplitude sweep (LAS), to evaluate the asphalt material’s fatigue life.
The fatigue of asphalt pavement is defined as the accumulation of damage resulting from repeated loading. Usually, the fatigue of asphalt material is described as a decrease in its complex modulus due to the propagation of initiation microcracks in asphalt materials [2,3]. With continued loading, this propagation of microcracks accelerates and subsequently coalescences to form macrocracks. Based on mechanical properties and damage accumulation, the process of crack propagation can be divided into three main stages. The first stage, which is related to the occurrence of plastic and elastic deformation, self-heating, and thixotropy, showed a rapid increase in damage. The second stage, in which microcracks appear in the material, is quasi-stationary. The third stage, in which the macrocracks coalesce and propagate rapidly, is when the damage rate increases [4,5,6,7].
Classically, the evaluation of fatigue is based on a decrease in the original complex modulus. It does not involve consideration of the self-healing and thixotropic behaviors of asphalt material, which are reversible and have “biasing effects” on fatigue analysis [8,9]. However, the quantification of nonlinearity, heating, thixotropy, and fatigue on asphalt mixture damage showed that nonlinearity, heating, and thixotropy contribute to a decrease of more than 90% in the complex modulus within 100,000 cycles for a strain amplitude of 100 μm/m [10]. Cyclic testing that was applied to test the fatigue of virgin asphalt and was modified also proved that the significant loss of the modulus exhibited at early stages is related to thixotropy and viscoelasticity [11]. Among the factors that have “biasing effects” on fatigue, thixotropy has the most significant influence on the complex modulus decrease and on the phase angle increase. Thixotropy, which is the intrinsic ability of a viscoelastic material to restore the microstructure inside the un-cracked part of the material, corresponds to a stiffness or viscosity decrease in the material over time under cyclic loading, as well as to stiffness or viscosity recovery after rest [12]. This indicates that thixotropy is the most important factor influencing the self-healing ability of asphalt material at the beginning of all occurring and propagating microcracks. A study on the mechanism and factors of asphalt materials’ self-healing ability also proved this conclusion [8].
In addition to its effect on the fatigue of asphalt and mixtures, thixotropy was also applied to explain the reversible behavior occurring during wet conditions of moisture damage between the asphalt and aggregate [13]. Research on thixotropy is considered an effective way to describe the internal damage of different asphalt materials that results from the cyclic loading of the same formalism. Therefore, researchers try their hardest to separate the influence of thixotropy form fatigue [14,15,16].
It is generally accepted that thixotropy stems from the structure that is formed through the interaction between the dispersed particles in the material. The material’s viscosity and stiffness depend on the sizes and shapes of the particle clusters [17]. The Brownian motion and the shear rate affect the formation and failure rate of the clusters. As it is of great importance to study the thixotropy of asphalt materials, previous studies on the thixotropy of an asphalt mixture focused mainly on its recoverable and “biasing effect” on fatigue and healing. The temperature, loading condition, and composition of the asphalt mixture were considered to be the factors influencing the thixotropy of the asphalt mixture [18]. Modeling the thixotropic contribution during fatigue tests of asphalt concrete showed that the evolution of thixotropy is equivalent to an increase in temperature, and viscosity seems to guide thixotropy [7]. Research has been performed on the thixotropic behavior of a fresh cement and asphalt emulsion paste applied to a structure parameter, which is the ratio of the difference between the initial and equilibrium shear stress to the equilibrium shear stress. This research was performed to evaluate the thixotropy of cement asphalt, and it demonstrated that cement asphalt with a high yield stress demonstrated a more pronounced thixotropic behavior [19]. As the proportion of the asphalt emulsion directly influences the cement asphalt’s yield stress, it is reasonable to deduce that the thixotropy of cement asphalt depends on the proportion of the asphalt emulsion. Cement asphalt with a greater asphalt emulsion has better thixotropy.
The thixotropy of the asphalt binder suggests that as the hysteresis loop changes according to the shear rate, the thixotropy of the asphalt binder depends on the shear rate [14]. Reversible molecular structuring and thixotropy in bitumen showed that different types of asphalt binders manifested similar levels of the reversibility of the microstructure [20]. Thixotropy was an intrinsic rheological property of the asphalt binder, which required a longer amount of time to rebuild the structures compared to their breakdown process [20]. The modeling of the thixotropic properties of SBS-modified asphalt showed that the cross-linked polymer network in the SBS-modified asphalt improved its thixotropic characteristics [21].
Many research studies have been conducted on the thixotropy of asphalt binders and mixtures, and much work has been performed to separate thixotropy from the first stage of fatigue: microcrack generation and propagation. However, little research has been performed on the thixotropy of asphalt mastics. An asphalt mastic is a composite of an asphalt binder and mineral filler with a particle size of less than 0.075 mm. The existing literature has explored the relationship between the performance of mixtures and the asphalt mastic properties. The results indicated that testing mastics provides greater insight into asphalt mixture performance compared with testing binders [13,22,23]. Asphalt mastics were considered the actual bonding materials of aggregates of different sizes. In addition, asphalt mastics comprise the weakest phase in an asphalt mixture. A correct understanding of asphalt pavement cracking performance showed that cracking is strictly linked to the properties of the mastic phase and its components. Many research studies carried out in recent years have highlighted the influence of asphalt, filler, and the asphalt–filler interaction on the asphalt mastics’ rheological behavior. Only a few researchers investigated the thixotropy of asphalt mastic. A previous study proved that despite the existence of mineral filler, asphalt mastics exhibited a thixotropic contribution in accordance with pure asphalt. The content of the filler, combined with the physicochemical properties of filler and the asphalt–filler interaction, influences thixotropy of mastics [24,25,26]. The thixotropic tendencies of asphalt mastics are similar to those of asphalt binders, and the type of mineral filler has a minimal effect on the thixotropic model [27].
Although the important effect of thixotropy on the fatigue of asphalt pavement has been recognized and some effort has been taken to explore the thixotropy of asphalt materials, it has not been researched in great depth. Further study remains to be conducted on the mechanism. Therefore, this paper presents the thixotropy of asphalt mastics obtained via different asphalt binders, mineral fillers, and filler volume fractions. The influence of asphalt and filler on the thixotropy of asphalt mastics is explored by analyzing the thixotropic loop and viscosity of asphalt mastics. The thixotropic potential function is also studied from the energy viewpoint.

2. Experimental

2.1. Materials

Three types of PG58-22 asphalt binders and five types of mineral fillers with a diameter of less than 0.075 mm were selected for this study. The performance of the three asphalt binders is listed in Table 1. The average particle size (APS), mineral composition, and densities of the five mineral fillers are listed in Table 2.
The fabrication of asphalt mastics was carried out with the help of a small mixer. Prior to mixing, an asphalt binder and mineral filler were placed in an oven at 135 °C to melt the asphalt binder completely and heat the mineral filler to the same temperature. Then, the heated filler was gradually added to asphalt, and the two were stirred together for at least 20 min until the mix was evenly blended. Finally, the mix was pulled into silicone molds with a diameter of 8 mm to test its rheological property. The combination of the asphalt binder, mineral filler, and the filler volume fraction used to fabricate the asphalt mastics are shown in Table 3.

2.2. Mechanical Testing

The laboratory testing of the asphalt binders and mastics was conducted on an AR2000 dynamic shear rheometer (DSR) by TA Corporation. Silicone molds with a diameter of 8 mm and a height of 2 mm was selected for the asphalt and mastic molding. The temperature for all tests was 25 °C, and three replicates were performed for each test condition. In the case of good repeatability, the average of the three replicates was used for the analysis. Good repeatability was assumed when the difference among the three replicates was smaller than 10% of the mean.
Commonly, two methods are available for analyzing the thixotropy of viscoelastic materials: the hysteresis technique and the stepwise test. The hysteresis technique involves increasing and decreasing the shear rate, as thixotropic materials show hysteresis loops for shear stress versus shear rate diagrams. These loops are used via their enclosed areas to characterize thixotropy. The stepwise test involves subjecting samples to constant change from one value to another in the shear rate or shear stress. Thixotropy is indicated by the growth in viscosity after a sudden decrease in the shear rate. In this study, the hysteresis technique was selected as it has the advantage of being quick and qualitative. The sample was subjected to a series of shear rates, which increased from 0.05 to 2.50 s−1 and then decreased back to 0.05 s−1. One circlecycle of this test lasted for 1262 s. Ten circles were conducted for each sample. The experimental device and the relation of strain vs. time are shown in Figure 1 and Figure 2.

3. Results and Discussion

3.1. Hysteresis Loop and Viscosity

Figure 3 shows the relationship between the shear stress and the shear rate for the asphalt materials. A gradual rise in the shear stress was obtained by continuously increasing the shear rate. Then, a gradual decline in the shear stress was obtained by continuously decreasing the shear rate. The relationship between the rising and falling curves was found to produce a hysteric loop. The stress response of a material with thixotropy lags behind the change of the shear rate. The upward line and the downward line of the stress and the shear rate curve do not coincide; instead, they form a loop, which is called the hysteretic loop. The greater the thixotropy, the larger the area surrounded by the hysteretic loop. The area enclosed by the hysteretic loop is a guide for the thixotropy of asphalt materials. This is an indication of the breakdown and recovery of the mastic structure. The reason beyond the formation of the loop is that the recovery speed is lower than the breaking speed (“Thixotropic Properties of Mastics Incorporates Secondary Filler”). The smaller the loop area, the weaker the thixotropy. This also indicates a shorter structure recovery.
In combination with Figure 1, Table 4 shows that with an increase in the loading time, the shear stress hysteresis loop for each asphalt mastic tends to move toward the shear rate axis. With an increase in the cyclic load’s loading time, the area of the hysteresis loop gradually decreases, and the area of the hysteresis loop will most likely feature a relatively stable value. Therefore, the relationship between the shear stress hysteresis loop change law and the potential function of the structural failure under the corresponding conditions also remains.
The relationship between viscosity and the shear rate can also be obtained at the same time as the hysteresis loop test. The viscosity–shear rate curve is shown in Figure 4. For the first cycle, with an increase in the shear rate, the viscosity decreases gradually. This results from the deformation of the internal structure of asphalt, which stems from a high shear rate. When the shear rate reaches the maximum, the viscosity gradually increases with a decrease in the shear rate to another peak viscosity; however, this viscosity value is far less than the value of the first circle. In the following four cycles, this process is repeated and the viscosity grows smaller and smaller. The general trend is that the viscosity decreases with an increase in the shear rate, and it gradually recovers with a decrease in the shear rate. However, the maximum value of the viscosity cannot return to its initial value and grows smaller and smaller.

3.2. Influence of Materials on Thixotropy of Asphalt Mastics
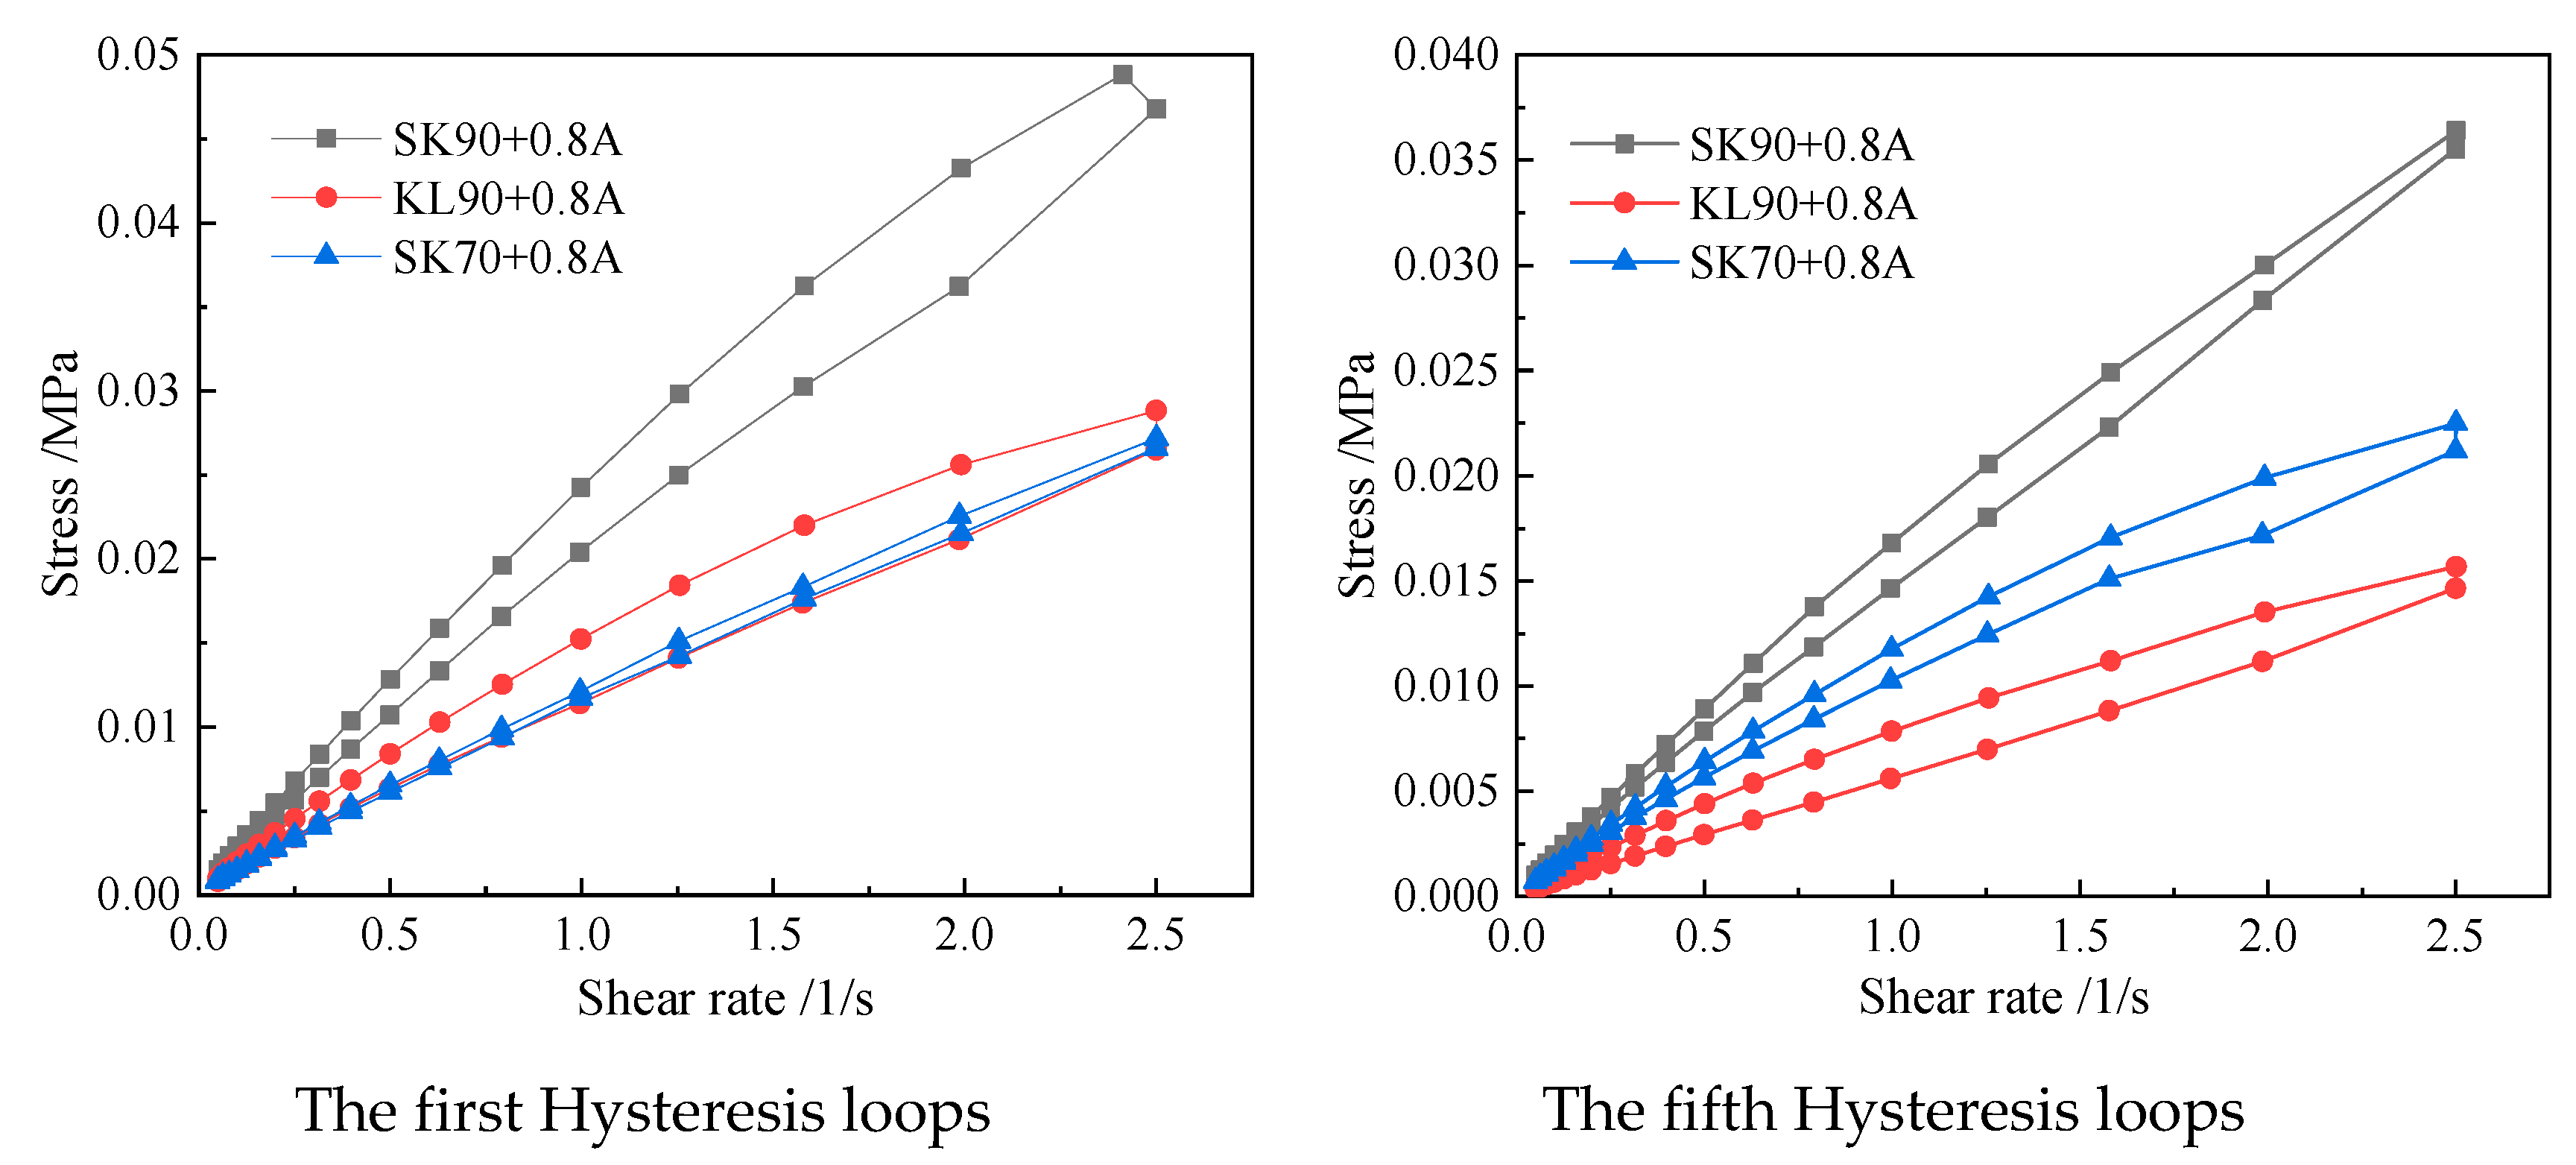
Figure 5 and Figure 6 are the hysteretic loops and viscosity–strain rate curves for SK90, SK70, and KL90 asphalt mastics with a filler/asphalt ratio of 0.8. Figure 7 and 
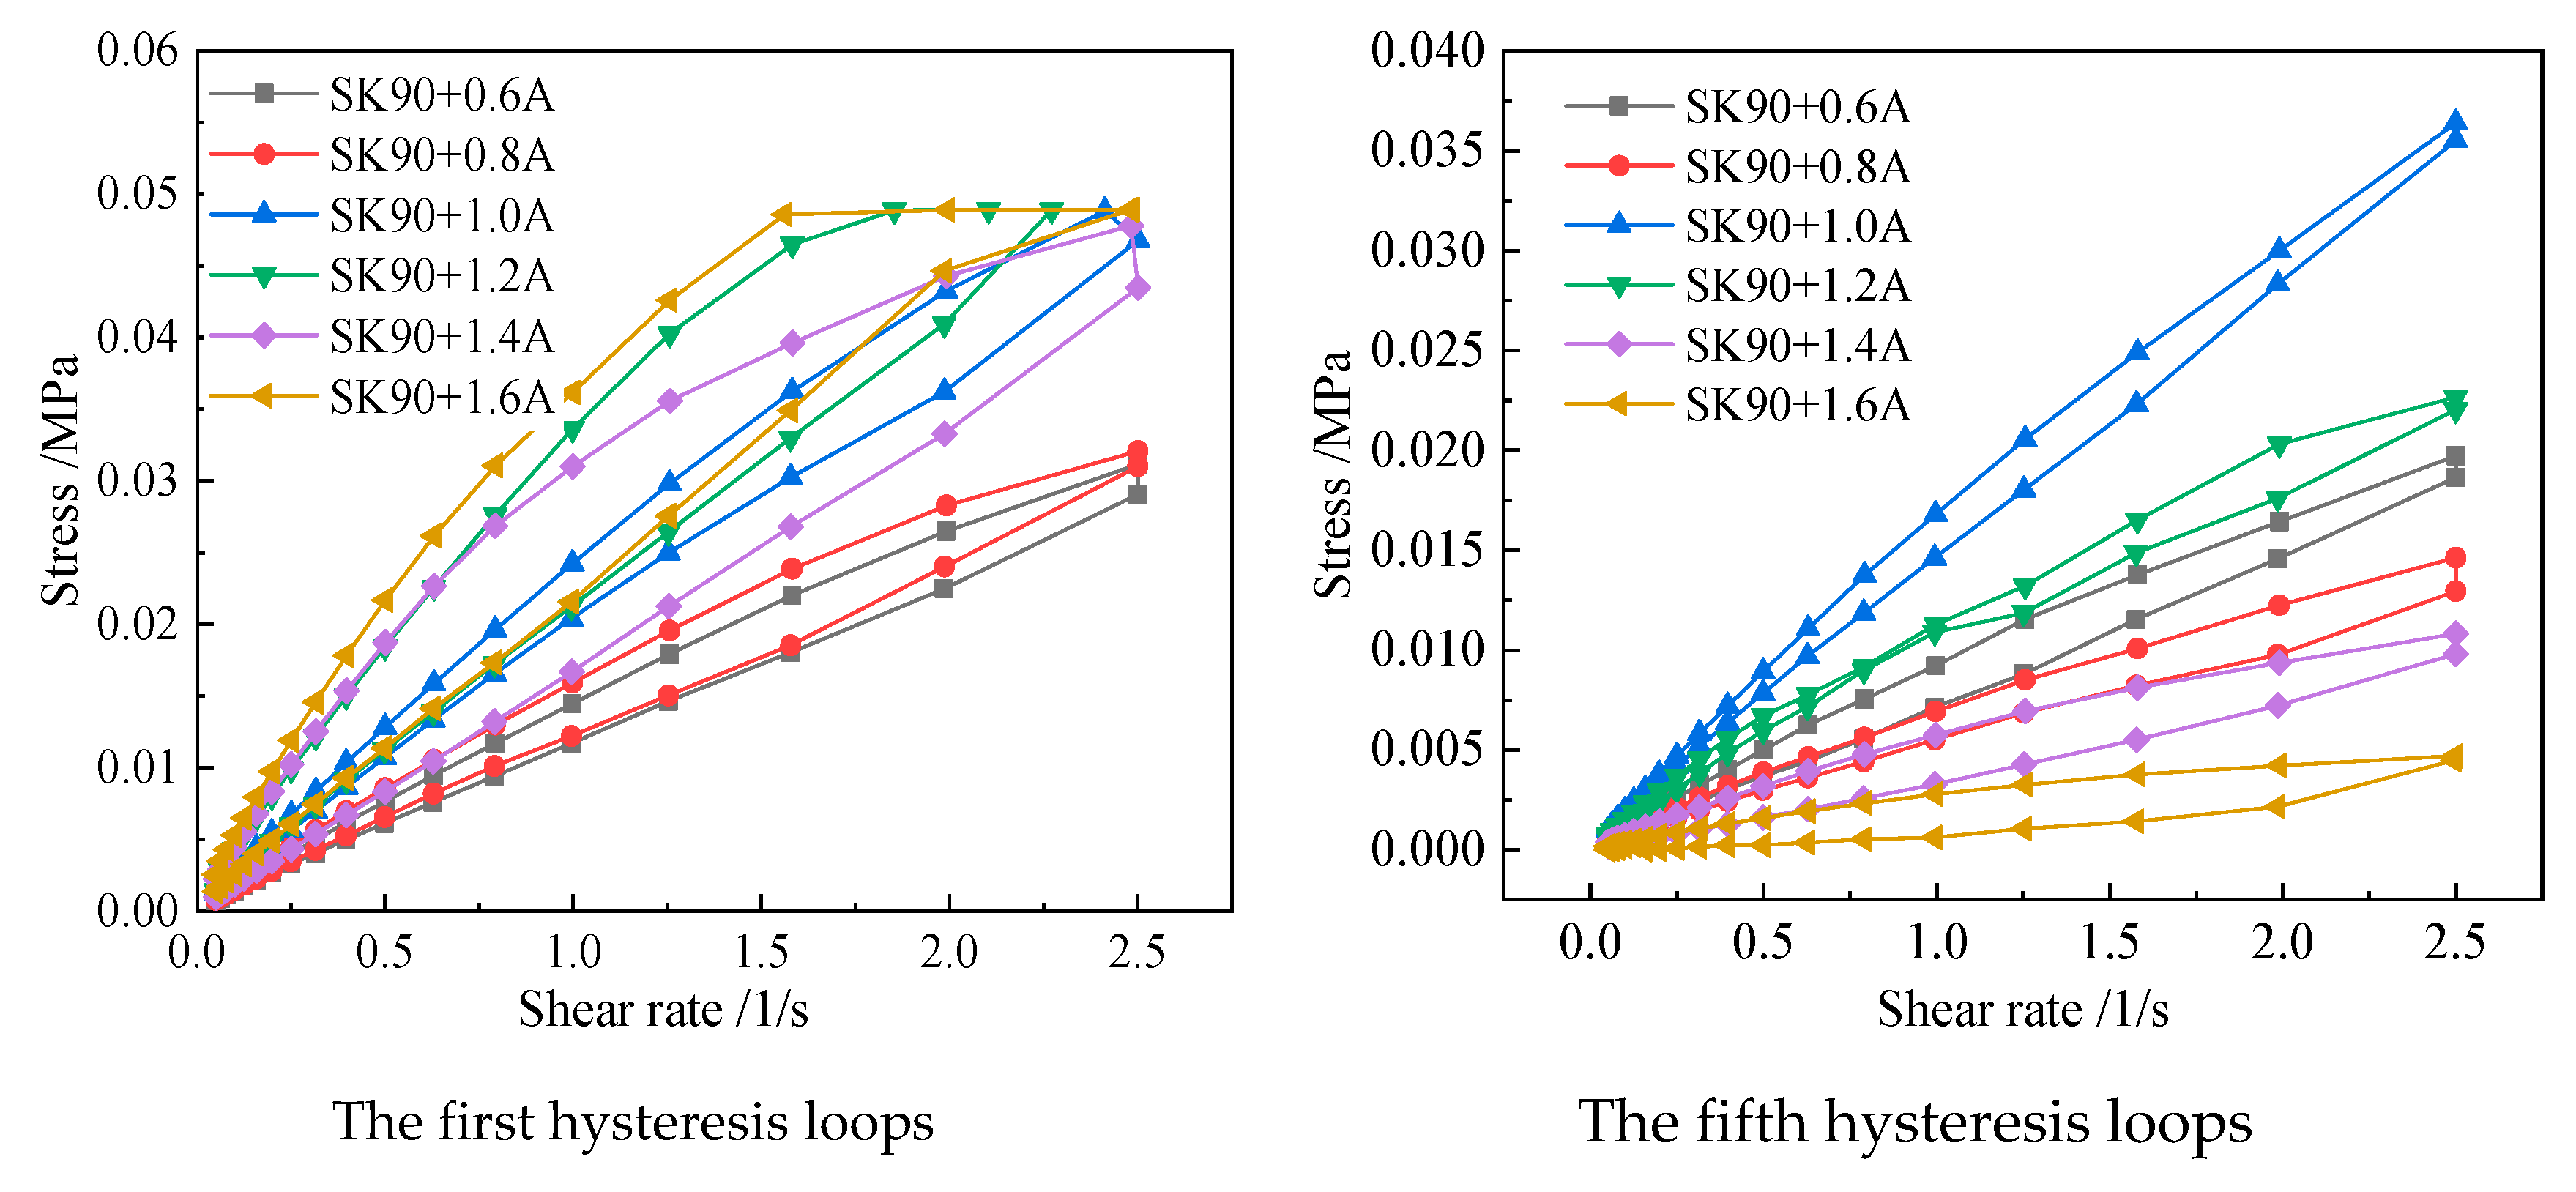
Figure 8 are the hysteretic loops and viscosity–strain rate curves for mastics fabricated with SK90 and filler A, with the filler/asphalt ratio varying from 0.6 to 1.4. Figure 7 and 
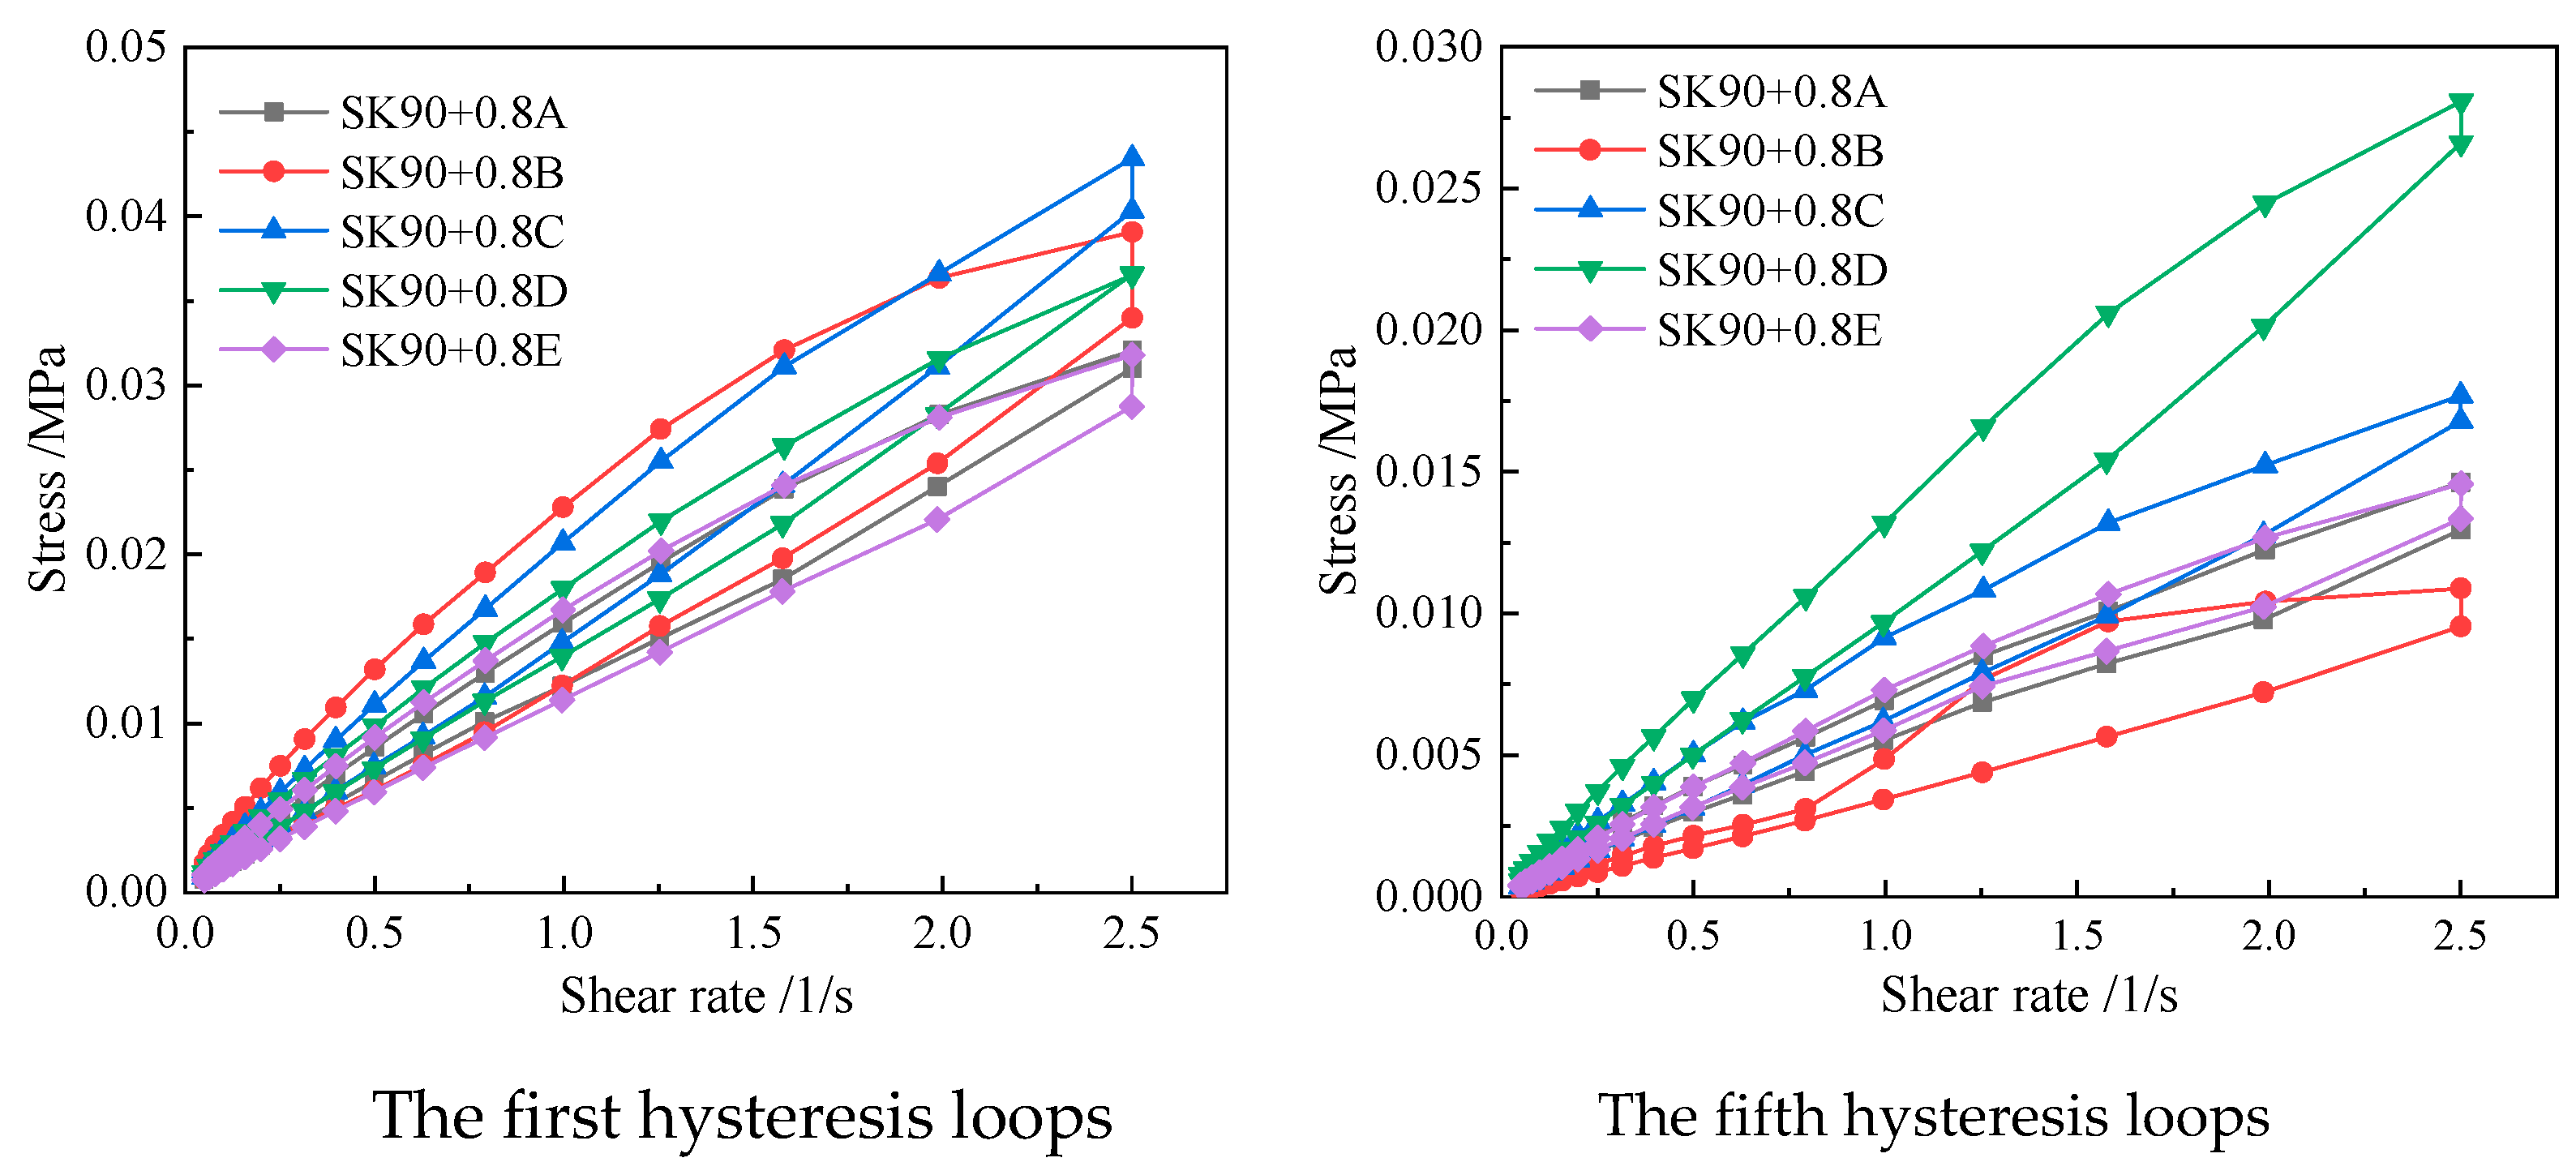
Figure 8 are the hysteretic loops and the viscosity–strain rate curves for mastics made of SK90 and mineral fillers A, B, C, D, and E, with a filler/asphalt ratio of 0.8. These hysteretic loops and the viscosity–strain rate curves were obtained under the same test condition of shear rates that increased from 0.05 to 2.50 s−1 and then decreased to 0.05 s−1. Five hysteretic loops existed for each asphalt mastic.
Figure 5, Figure 6, Figure 7, Figure 8, Figure 9 and Figure 10 show a change in the law of the hysteresis loop shape with an increase in the cyclic loading times. The hysteresis loop tends to gradually move toward the shear rate axis. According to the definition of thixotropy, it is a continuous decrease in viscosity over time when flow is applied to a sample that was previously at rest, as well as the subsequent recovery of viscosity over time when the flow is discontinued. This definition explains that thixotropy is time dependent and has a memory of deformation or flow. Flow-induced structural changes govern thixotropy. Due to the gradual breakdown of the original microstructure of an asphalt mastic with a shear strain rate, the shear stress begins to drop, and the viscosity crack is generated during the first cyclic loading. The shear stress will continue to drop on the basis of the first viscosity crack during the second cycle of shear loading. The shear stress of an asphalt mastic will drop, and the viscosity crack will propagate on the basis of the previous loading until its viscosity reaches an equilibrium. The greater the viscosity crack of an asphalt mastic is, the smaller the shear stress is at the same shear rate. Therefore, the hysteresis loop of an asphalt mastic tends to gradually move toward the shear rate axis with an increase in the cyclic loading.
With an increase in the cyclic loading times, the area of the hysteresis loop gradually decreases, and the area of the hysteresis loop will most likely feature a relatively stable value; that is, a so-called equilibrium loop will be obtained. The hysteresis loop area obtained from the first loading is the largest. The difference between the hysteresis loop area obtained from the first loading and the second loading is the largest. Then, the hysteresis loop area reduction rate becomes increasingly smaller after the second circle, as shown in Table 4.
As the viscosity and the shear stress are large, the viscosity crack propagates quickly when the cyclic load is applied for the first time. The subsequent processing will continue on the basis of the viscosity and the destroyed microstructure at the end of the first circle. Therefore, the change speed of the viscosity and the shear stress will be relatively small, and the hysteresis loop area will become smaller and smaller after several loads.
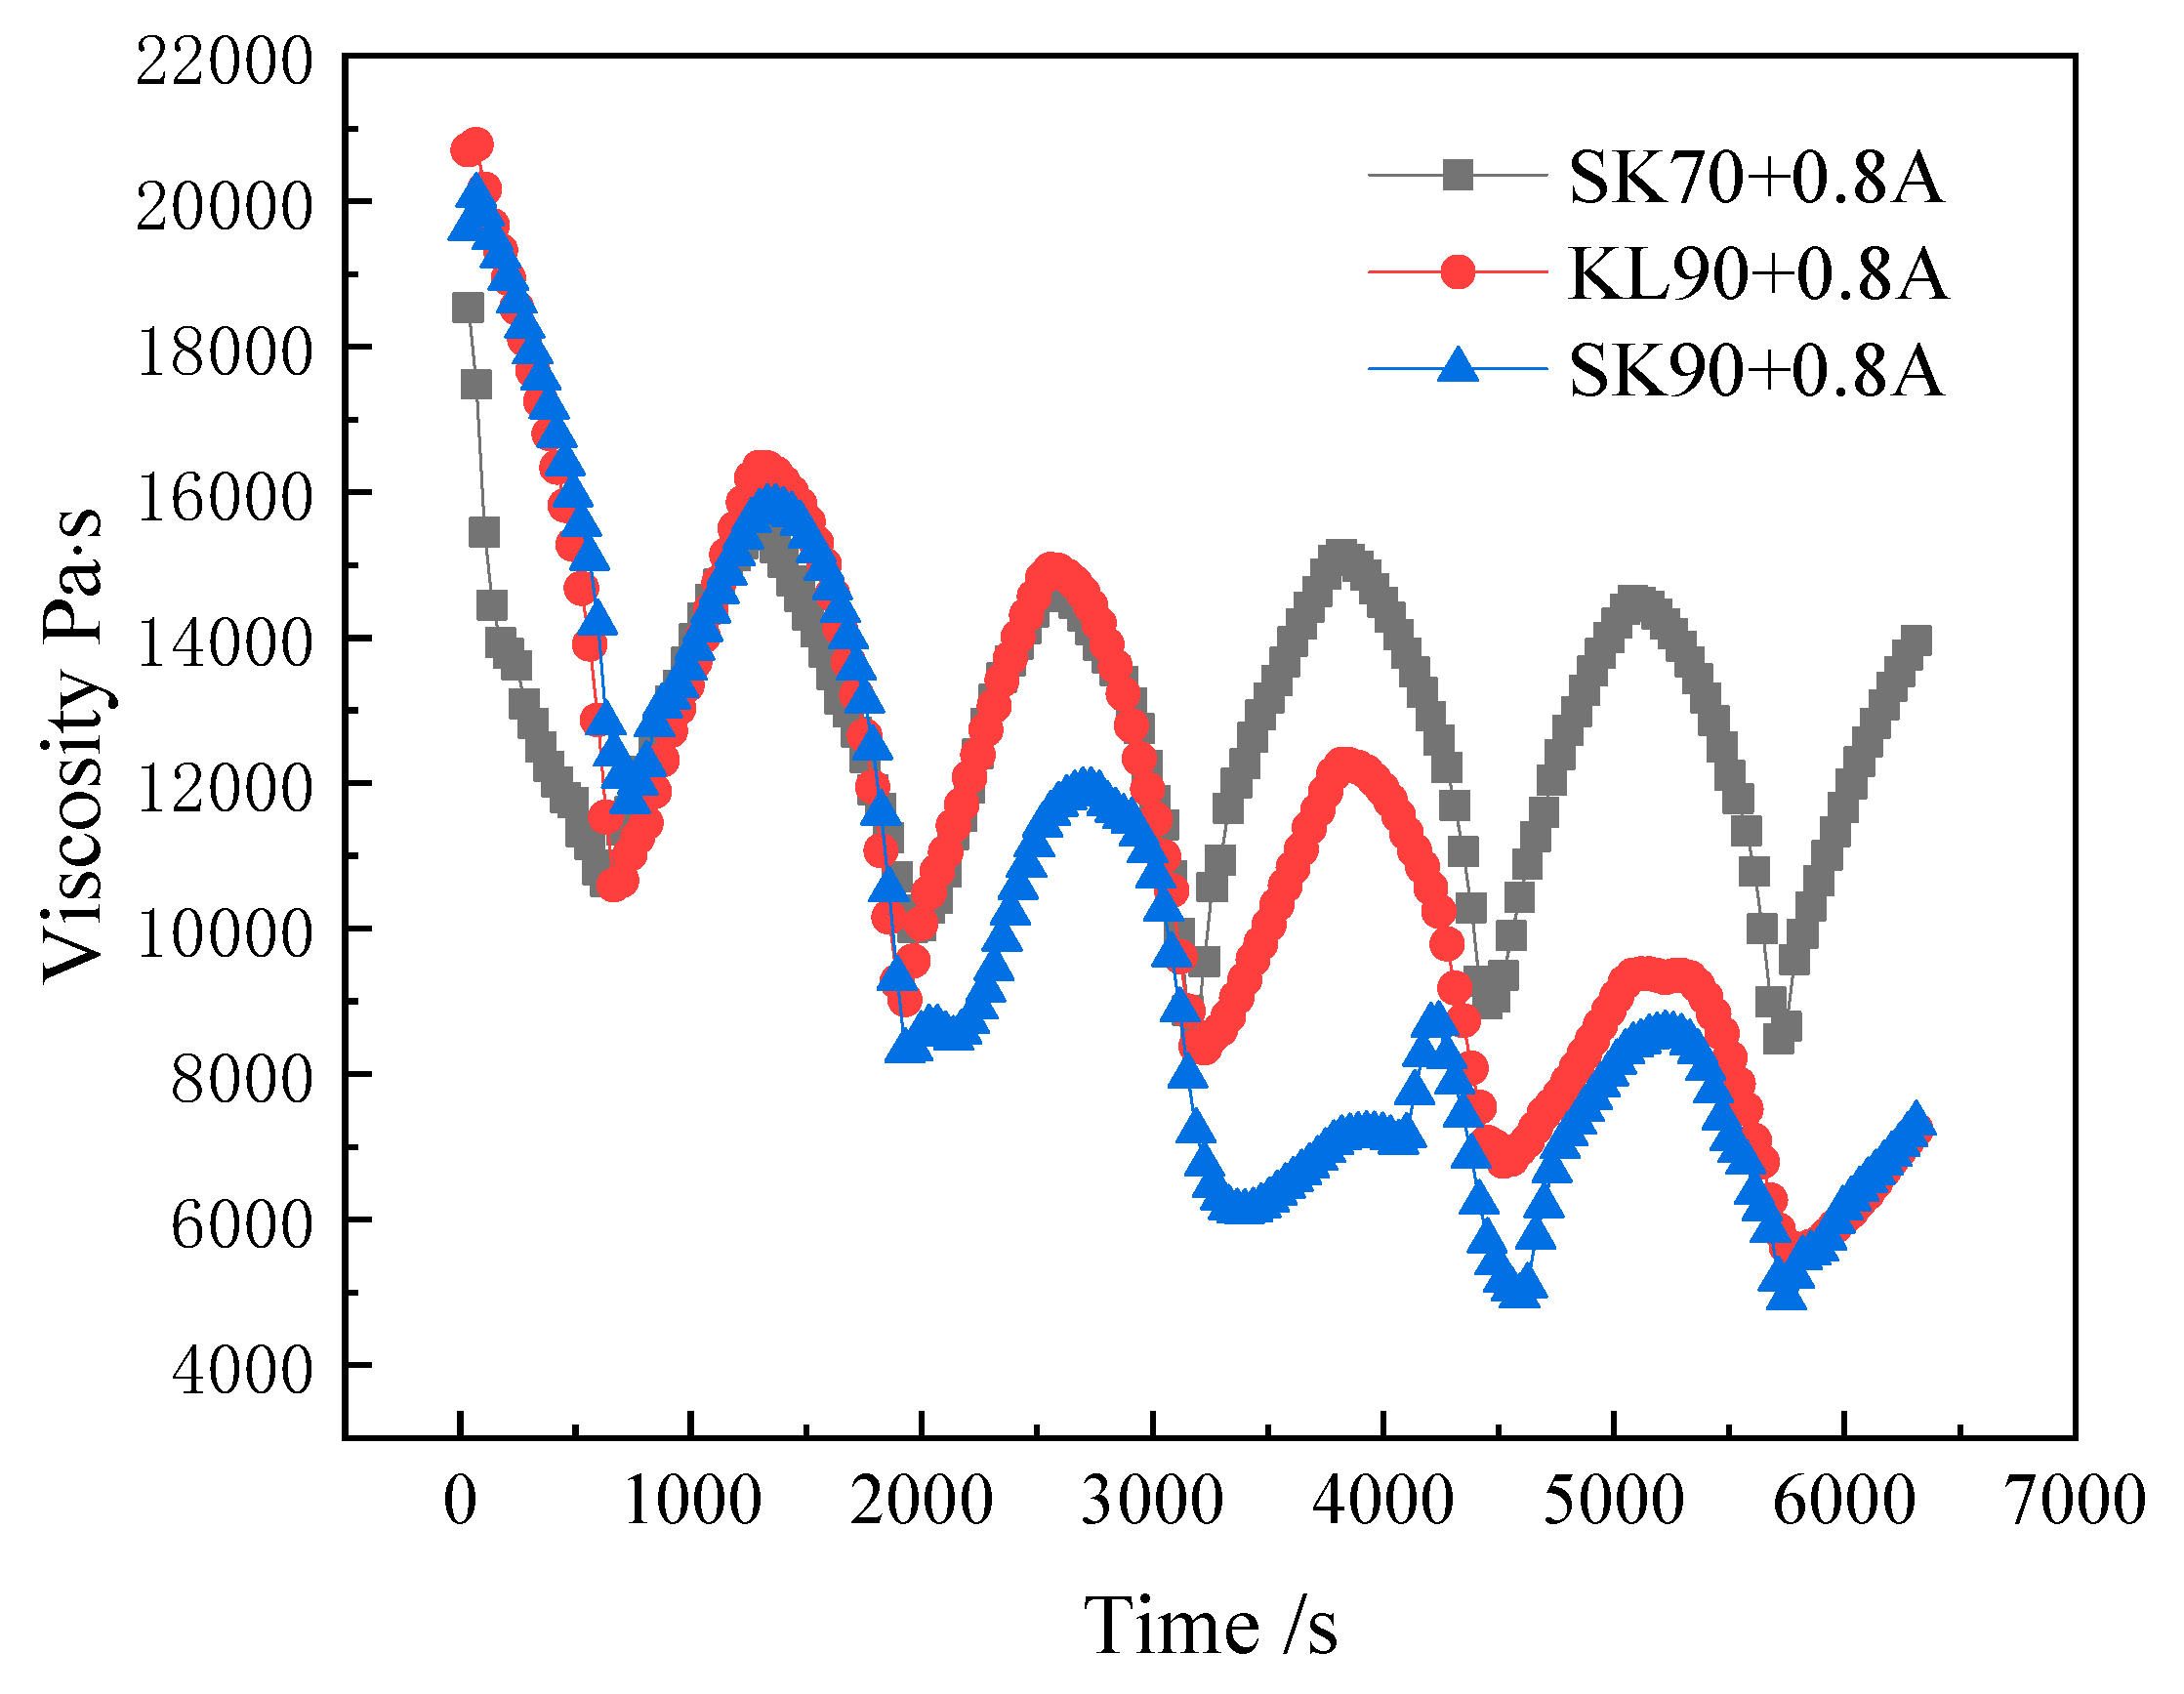
The goal was to compare the thixotropy of the mastics fabricated with different asphalt binders and the same mineral filler. The first and last hysteresis loops, as well as the curves of the viscosity–shear rate of three asphalt mastics fabricated with SK90, SK70, KL70, and mineral filler A, are shown in Figure 5 and 
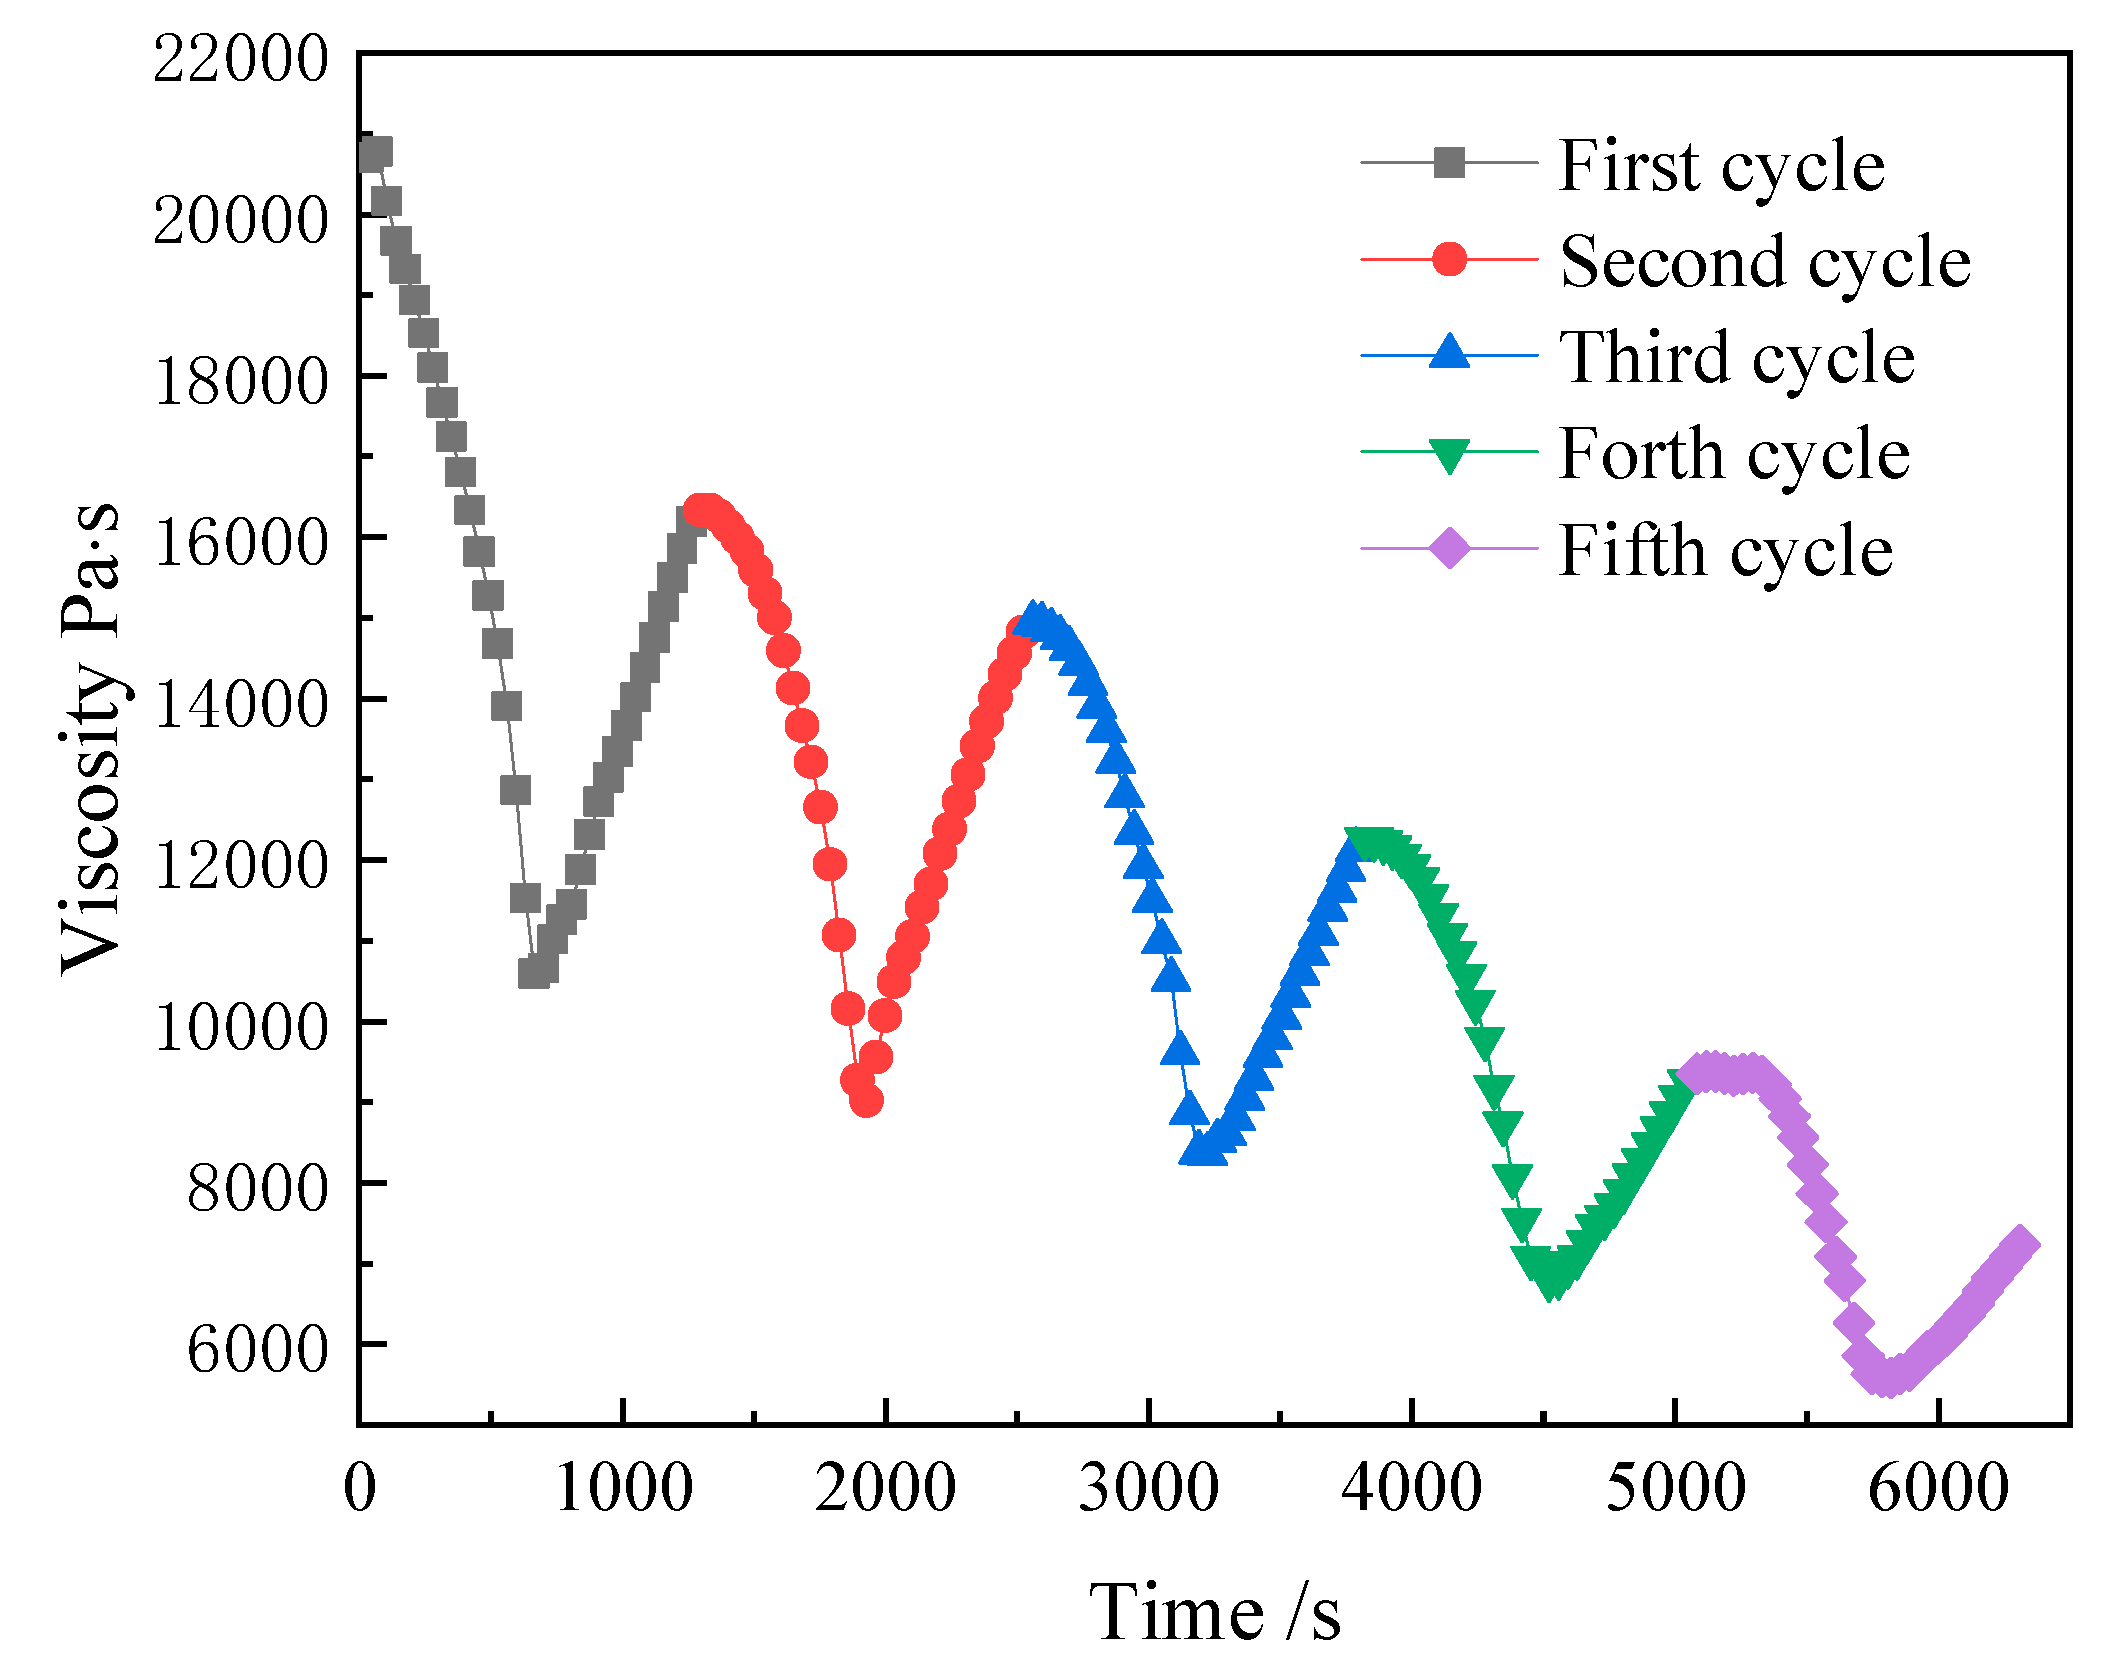
Figure 6. (The filler/asphalt ratio was 0.8.) This demonstrates that no obvious difference existed in the shapes of the hysteresis loops among these asphalt mastics. The shape of the hysteresis loop of each asphalt mastic is a spindle. The viscosity of the three asphalt mastics decreased gradually with an increase in the shear rate, showing typical shear-thinning behavior. After the shear rate reached the maximum value, it gradually decreased, and the viscosity of the asphalt mastic gradually recovered and increased. Shearing induces the direction and arrangement of particles in a mastic change and the damage of its network structure, which manifests as a reduction in its viscosity. With a reduction in the shear rate, the structure of an asphalt mastic can be restored within a certain period. This is shown as an increase in the viscosity. Therefore, the change in viscosity conveyed by the viscosity–shear rate curve in the figure conforms to the basic definition of thixotropy.
The hysteresis loops of the KL70 asphalt are basically above those of the SK70 and SK90 asphalts for each cycle. Obvious differences exist in the maximum shear stress among the three curves. For example, the maximum shear stresses are 32,072 Pa, 36,832 Pa, and 39,183 Pa for the first circle and 14,625 Pa, 15,674 Pa, and 21,487 Pa for the last circle for the SK90, SK70 and KL90 asphalt mastics, respectively. The viscosity of the three asphalt mastics was decreased with the prolonging of the shear time. As prolonging the shear time leads to an increase in internal structure damage and reduces the motion resistance of the internal particles and molecular chains, its Brownian motion is made easier, and it shows the characteristics of the reduced thixotropy of the system. The smaller the viscosity of an asphalt binder, the smaller the hysteresis loop area of an asphalt mastic.
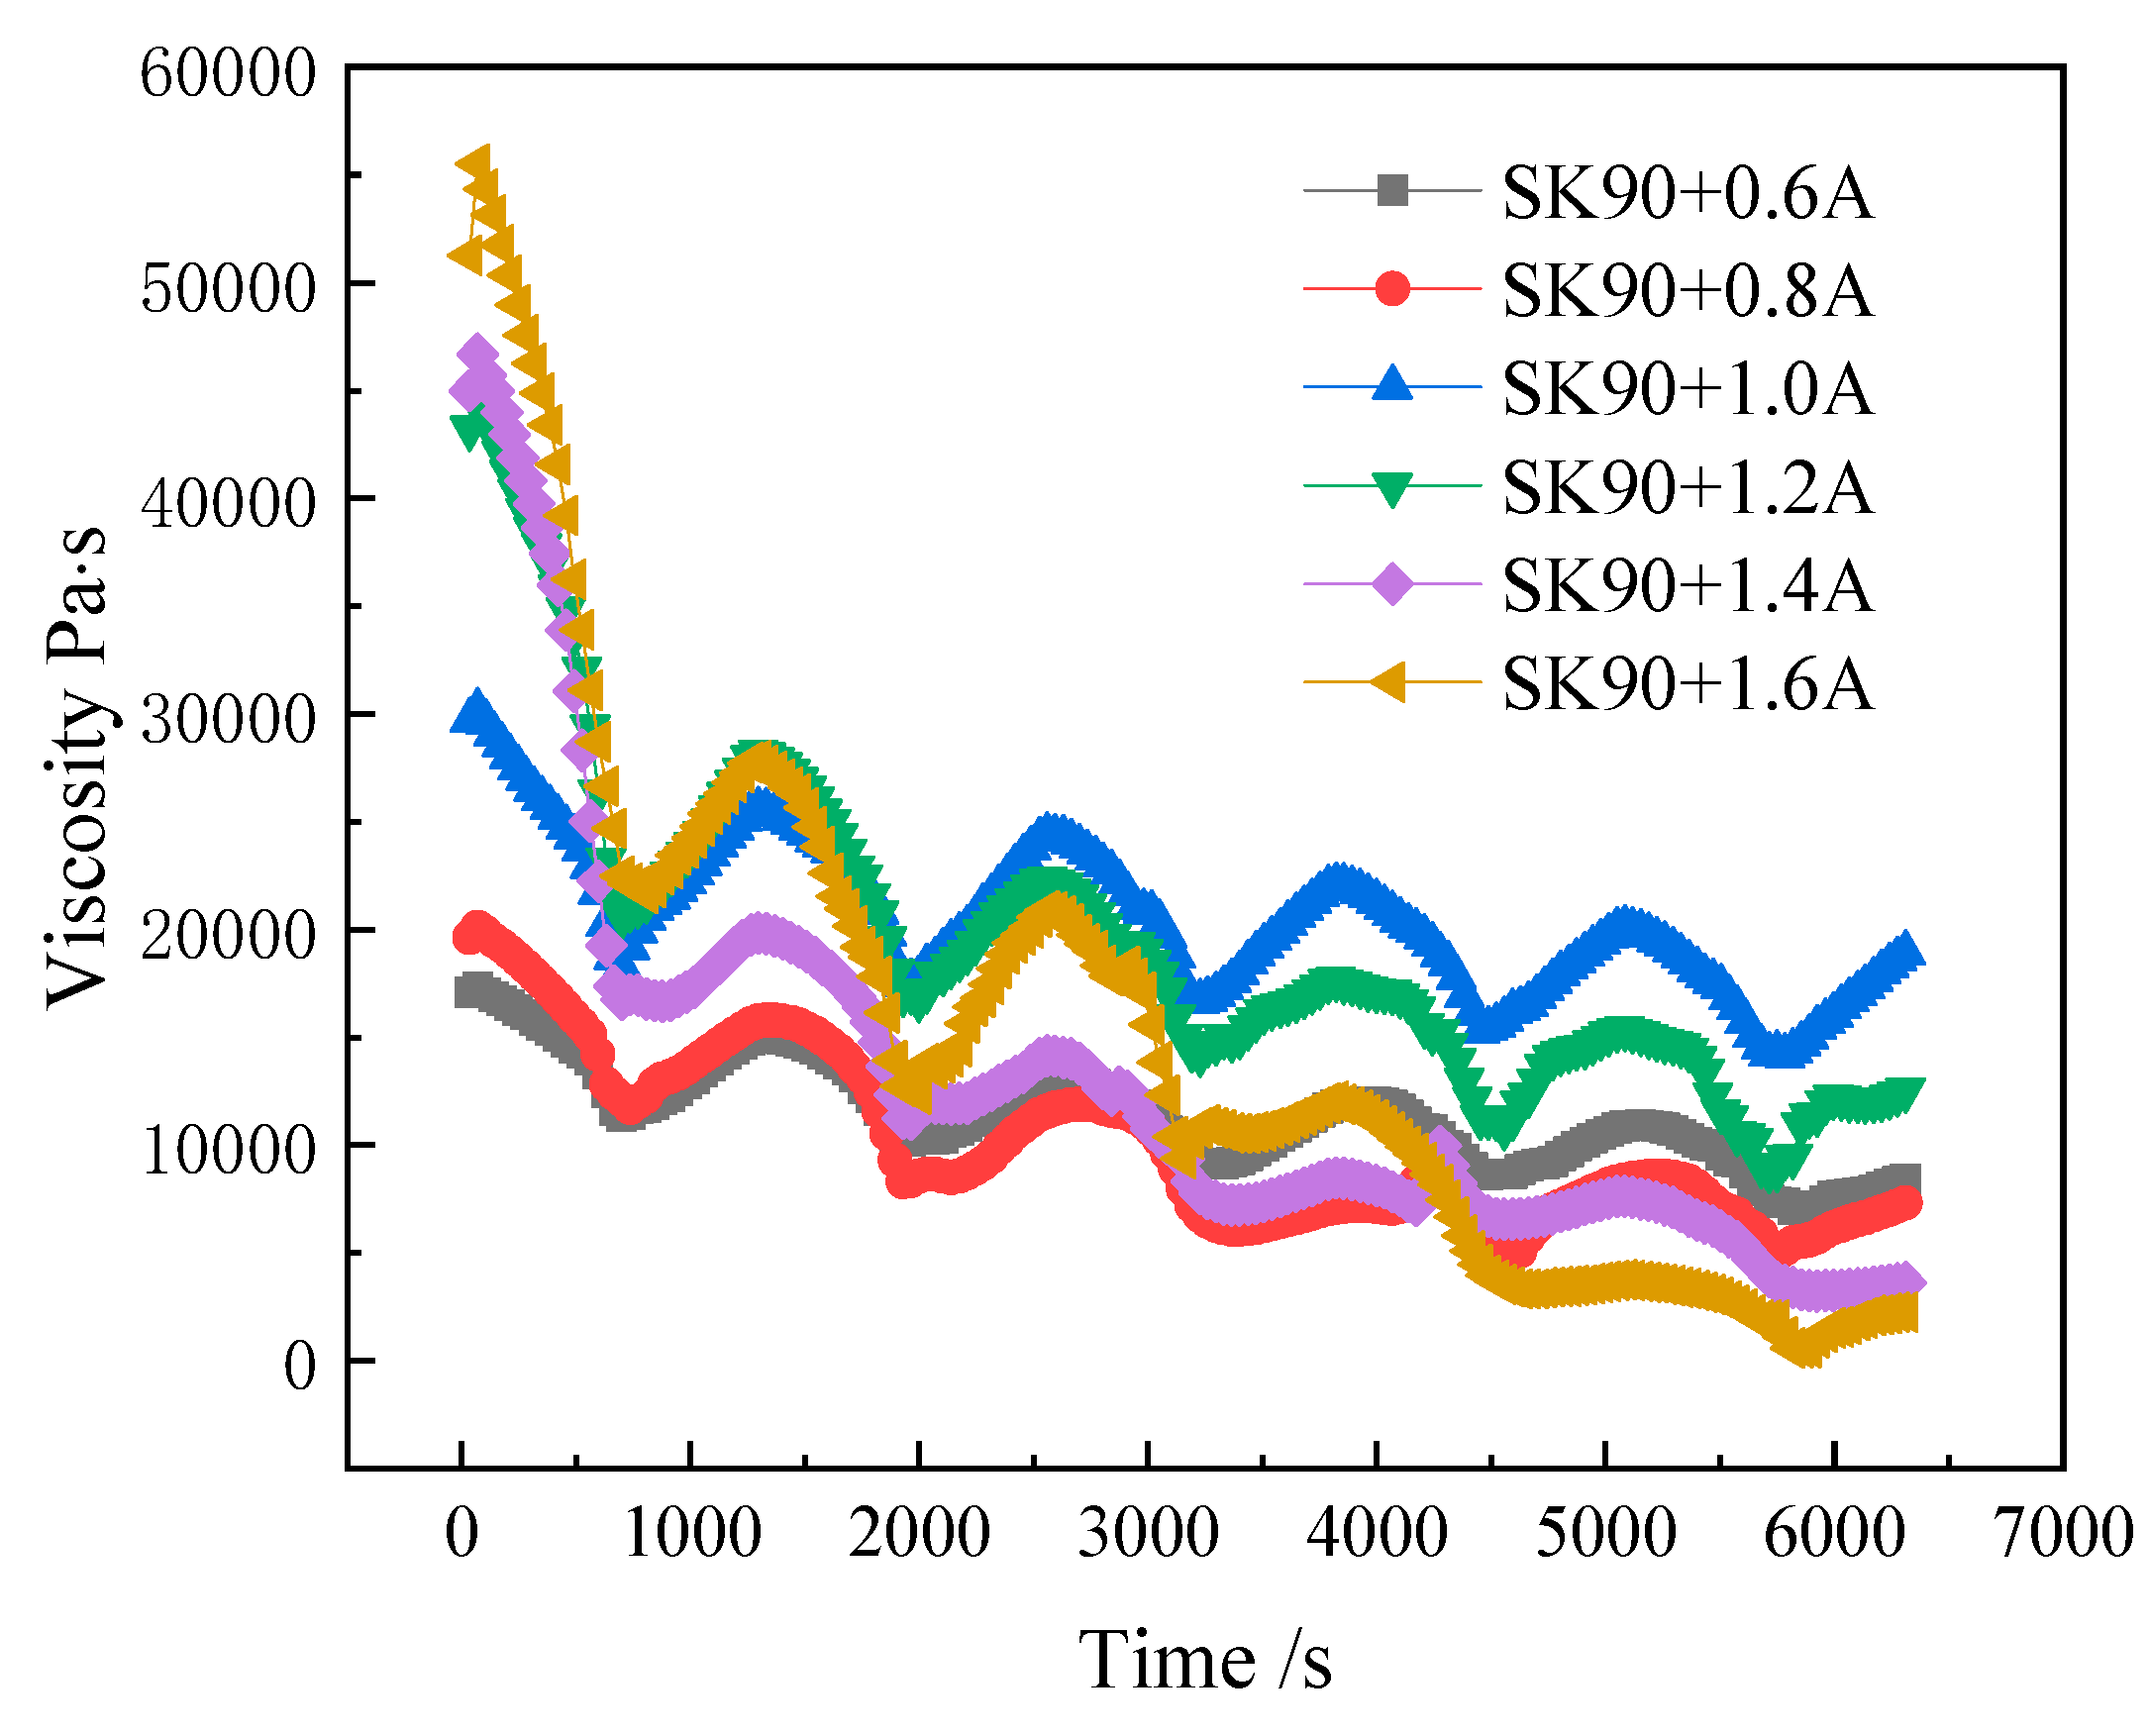
Mineral filler A in filler/asphalt ratios of 0.6, 0.8, 1.0, 1.2, and 1.4 was selected to study the influence of the filler volume fraction on the thixotropy of the mastics fabricated with SK90. This showed that regardless of what the ratio of filler to asphalt is, its viscosity decreases with the extension of the shear time. The last shear time leads to an increase in the internal structure damage of the asphalt mastic system, reduces the motion resistance of its fine aggregate particles and molecular chains, makes its Brownian motion easier, and shows the characteristics of the reduced thixotropy of the system. However, the greater the filler content of the asphalt mastics, the faster the descent of the viscosity over a long period of time is. Although an asphalt mastic with a filler/asphalt ratio of 1.4 has the highest viscosity in the first circle, it has the smallest viscosity at the last circle. This is because with an increase in fine particles comes free volume between the asphalt macromolecules, which slows down the molecules’ irregular thermal movement. This is equivalent to a reduction in molecular spacing, resulting in the difficult movement of the asphalt molecular chain. Therefore, the greater the filler/asphalt ratio, the greater the viscosity. In addition, due to the existence of a higher filler content, the recovery of the viscosity crack is more difficult.
From the figure, it can be seen that the hysteresis loops of the mastic with a filler/asphalt ratio of 1.4 are the largest, followed by the filler/asphalt ratios of 1.2, 1.0, and 0.8. A filler/asphalt ratio of 0.6 is the smallest, indicating that the higher the filler content, the greater the thixotropy of the asphalt mastic. The thixotropy of the asphalt can be significantly reduced by adding filler. The higher the mineral filler content is, the more stable the structure of the suspension is. It takes a long time to recover after the structure is damaged, and the stress response lags behind the change in the shear rate to increase the area of the hysteresis loops.
The filler/asphalt ratio also has a significant influence on the maximum shear stress. As the filler/asphalt ratio increased from 0.6 to 1.4, the maximum shear stress of the asphalt mastics rose from 31,156 Pa to 48,890 Pa and then decreased to 38,892 Pa. This means that a mastic with a filler/asphalt ratio of 1.0 could bear the shear loading better. As mineral fillers have small particle sizes, they have an amorphous structure and a large specific surface area. They can combine with each other through hydrogen bonds on the surface to form particle clusters and agglomerate the particles together. The agglomeration structure is in an unstable state. During shear loading, the agglomerated particles are partially depolymerized, demonstrating that the structure of the suspension and the corresponding shear stress decrease.
For the mastics made of an SK90 asphalt binder and five types of mineral fillers, the maximum shear stress of the asphalt mastics ranged from 31,792 Pa to 36,584 Pa. The results showed that the shear stress of the asphalt mastics changed slightly with different types of mineral fillers. A mineral filler with a higher specific surface area has a slightly higher level of shear stress. This can be explained from the aspect of the filler–asphalt interaction. When the mineral filler was substituted with cement of a certain mass, the filler volume fraction in the asphalt mastic decreased as cement has a larger density (3.045 g/cm3) than mineral filler (2.628 g/cm3) does. However, as the cement/filler ratio increases, the maximum shear stress of the asphalt mastics increases. This is because the interaction between asphalt and cement is higher than that of asphalt and limestone filler. The interaction, which forms asphalt–filler interfaces, is significantly different between various asphalt and mineral fillers. As polar asphalt components that interact with a mineral substrate induce multimolecular structuring in thin films between the filler and asphalt binders, the maximum shear stress and the viscosity of asphalt mastics are significantly increased. Asphalt–filler interaction was more prominent with the increase in cement. For this reason, cement is selected to replace mineral filler to improve the water stability of the asphalt mixture.

3.3. Definition and Analysis of Potential Function

It can be seen that the viscosity of the asphalt mastics gradually decreases with an increase in the shear rate, which is typical shear-thinning behavior. As the shear rate reaches its maximum value and then gradually decreases, the viscosity of the asphalt mastics gradually recovers and increases. When asphalt mastics are thinned via shear, the direction and arrangement of the particles change, and the network structure is damaged to reduce the viscosity. With the reduction in the shear rate, the structure can be restored within a certain period, which is shown as an increase in the viscosity. Therefore, a change in the viscosity with the shear rate conforms to the basic definition of thixotropy, and it is concluded that asphalt mastics fabricated with different asphalt binders and fillers of various volume fractions all demonstrate thixotropy.
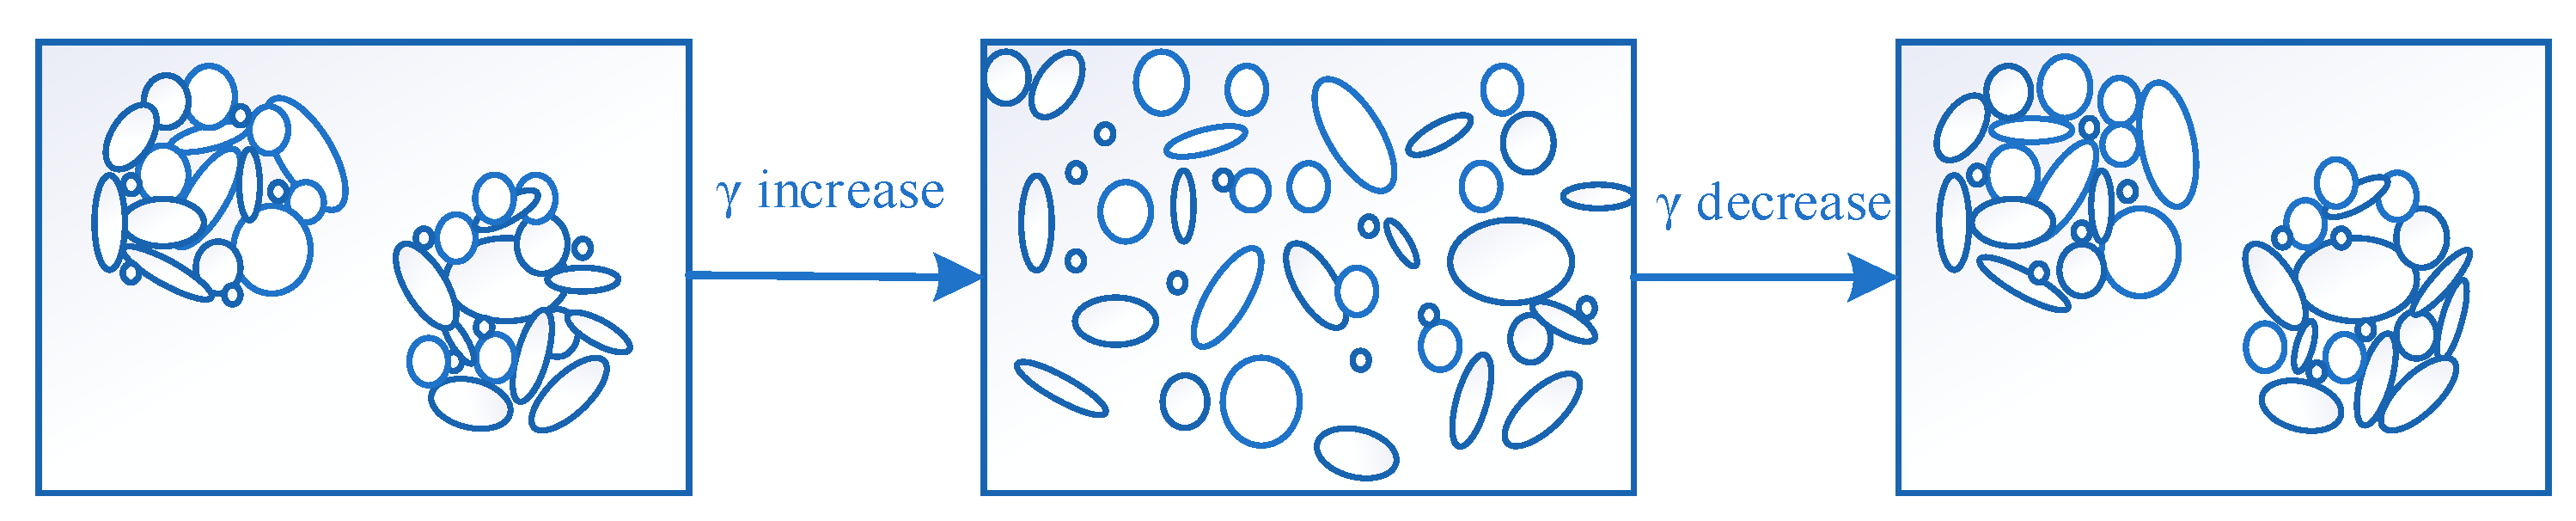
For asphalt mastics with high filler–volume fractions, the microstructure showed the agglomeration of particles. Even the mineral particles were crystal, with a specific, stable composition and a lattice. The surface was covered with asphalt binders, and as these asphalt-covered particles could be regarded as an amorphous structure with a small diameter and a large specific surface area, they can combine with each other through hydrogen bonding on the surface to form particle clusters, making the particles agglomerate together. During high-speed shear loading, the agglomerated particles are depolymerized into many small particles under the action of the shear. In this process, the volume fraction of the asphalt in the suspension increases, demonstrating the shear-thinning phenomenon. After the shear stress is relieved, the suspension gradually returns to its previous status over time. The collision frequency between particles increases, the effective contact between particles increases, and the agglomeration between particles is more serious than before shearing. However, this agglomeration structure is in an unstable state, and it has a reunion trend. Figure 11 shows the thixotropic mechanism explained by particle agglomeration and depolymerization.
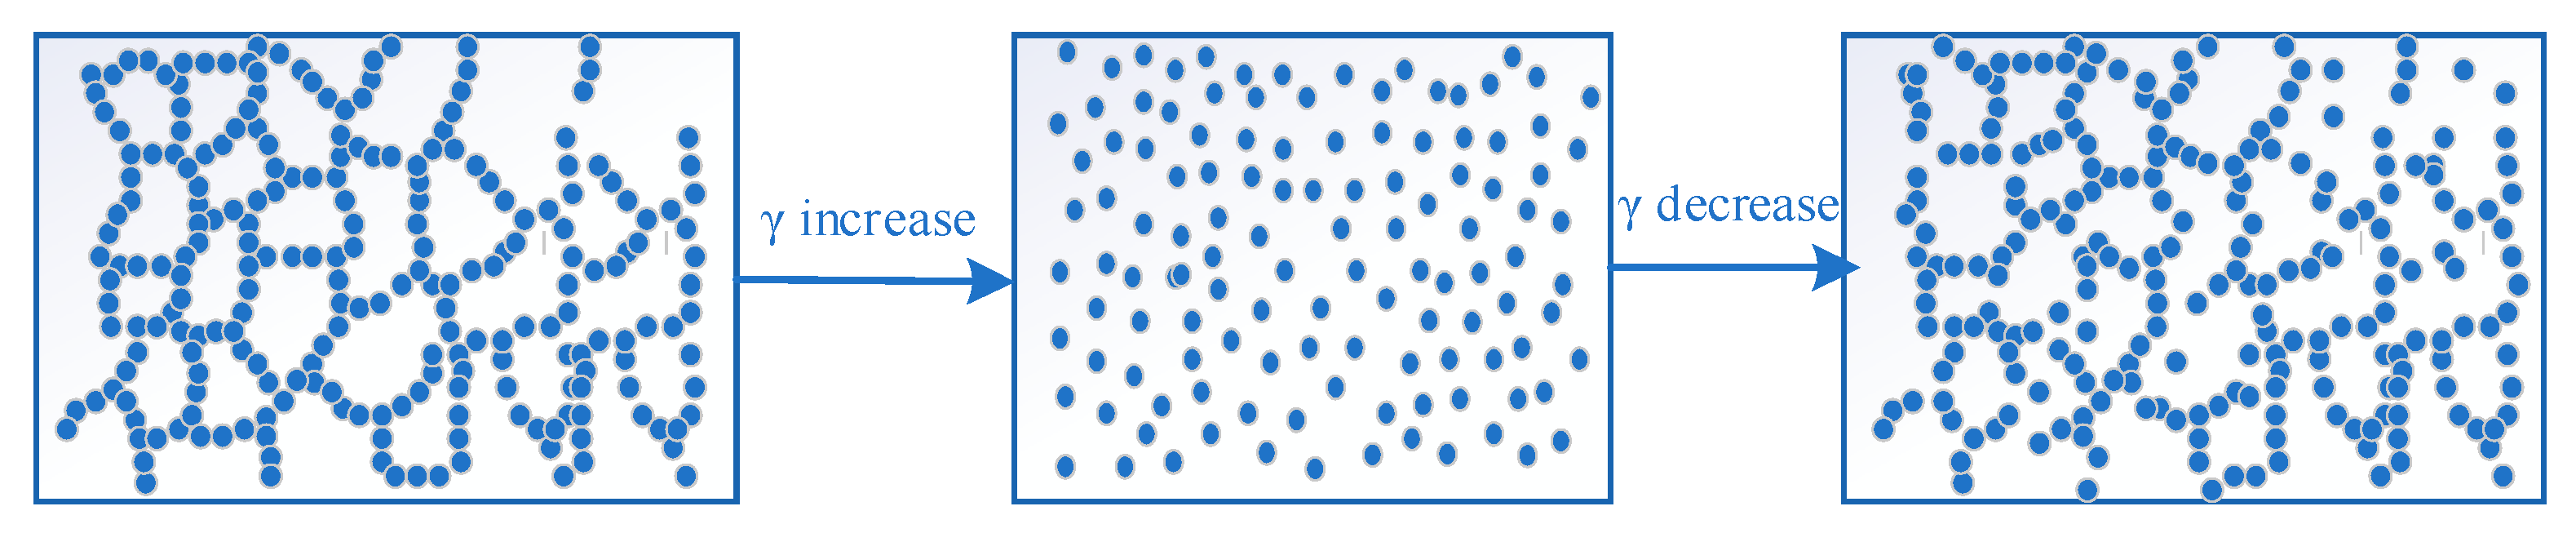
Although the thixotropic behavior of asphalt mastics with a high filler content can be explained well from the perspective of particle agglomeration, the thixotropic behavior of asphalt mastics with a low filler content cannot be well explained; that is, the viscosity decreases after high-speed shear. For suspensions with solid content, the contact between the particles improves. It is considered that in the particle chain model, the particles form a network structure under the interaction between the particles. The particle chain model can be applied to analyze the thixotropy of suspensions as well as asphalt mastics with low and moderate filler content. Figure 12 shows the mechanism of asphalt mastics as it is explained by the particle chain model.

3.4. Asphalt Mastic Thixotropy Based on Energy Viewpoint

The energy viewpoint is a phenomenological method used to study the thixotropy of non-Newtonian fluids. It contains the following three elements: (1) from the energy viewpoint, the apparent viscosity of thixotropic materials is closely related to their microstructure. The destruction of the microstructure leads to a decrease in the apparent viscosity, and the recovery of the microstructure will gradually increase the apparent viscosity of the materials. (2) It is believed that the destruction of the microstructure inside of a thixotropic material will generate potential energy to restore the microstructure inside of the thixotropic material. This potential energy will gradually increase with a decrease in the apparent viscosity, and it will decrease with an increase in the apparent visibility. (3) It is considered that the recovery potential energy in the unit volume of a thixotropic material has the same dimension as shear stress in a rheological test, and the unit is pascal. An analysis of the dimension is shown in the following Formula (1).
J m 3 = N m m 3 = N m 2 = P a
where J is the unit of energy; m is the unit of length; N is the unit of force; Pa is the unit of pressure.
According to the energy viewpoint, the microstructure destruction of a thixotropic material will produce potential energy to restore the interior structure. This potential energy of recovery increases gradually with a decrease in the apparent viscosity, and it decreases gradually with an increase in the viscosity. Assume that the damage and recovery of the internal structure of a thixotropic material can be characterized by two functions, defined as the structural recovery potential function (E) and the structural failure potential function (D). This represents the energy per unit volume, which has the same dimension as stress, and the unit is Pa. Among the two, the structural recovery potential function reflects the trend of the internal structural recovery of asphalt material. The greater its value, the greater the trend of the structural recovery of asphalt material is. The structural failure potential function represents the destruction trend of the internal structure of asphalt material under the comprehensive action of internal and external forces. The larger its value is, the easier it is to destroy the internal structure of crude oil.
With properly made assumptions about the change rate of the structural recovery potential energy and shear stress, the potential energy can be applied to the analysis of the thixotropy of asphalt materials. It is assumed that the rate at which the shear stress and structural recovery potential energy of thixotropic materials change with the amount of time under a constant shear rate can be described as Equation (2), meaning that the change rate of the shear stress and the structural recovery potential energy over time are related not only to their difference but also to the external shear rate. Boundary conditions for solving the model are defined, as shown in Equation (2), and the rate equation, which describes the thixotropy of materials, can be established as Equation (3).
d E d t = b ( τ E ) , b > 0 d τ d t = a γ ˙ ( τ E ) , a > 0
As we have a homogeneous linear differential equation with a constant coefficient, the coefficient matrix of Equation (1) could be expressed as follows:
A = b b a γ · a γ ·
The characteristic matrix could be expressed as Equation (4):
λ + b b a γ · λ + a γ · = λ λ + ( a γ · + b ) = 0 λ 1 = 0 , λ 2 = ( b + a γ · )
The general solution of the equation is as follows:
E ( t ) τ ( t ) = c 1 1 1 + c 2 e ( b + a γ · ) t 1 a γ · b
E ( t ) = c 1 + c 2 e ( b + a γ · ) t = c 1 + c 2 z τ ( t ) = c 1 a γ · b c 2 e ( b + a γ · ) t = c 1 a γ · b c 2 z z = e ( b + a γ · ) t
t = 0 E ( 0 ) = E 0 = c 1 + c 2 = 0 τ ( 0 ) = τ 0 = c 1 a γ · b c 2 t = E ( ) = E = c 1 τ ( ) = τ = c 1 c 1 = c 2 = E = τ
Then, we have structure recovery potential function E ,
z ( t ) = exp ( b + a γ · ) t E ( t ) = c 1 + c 2 z = E E z = E ( 1 z ) τ ( t ) = c 1 a γ · b c 2 z = τ + ( τ 0 τ ) z
where a is the coefficient of the shear stress change rate over time; b is the coefficient of the change rate of the potential energy of the internal structure recovery over time; E is the potential energy function characterizing structural recovery, Pa; τ is the function of the shear stress, Pa; γ ˙ is the shear rate, 1/s; t is the time, s; τ 0 is the shear stress at the point when the shear rate is zero, Pa; τ is the shear stress at the point when the shear rate is infinite, Pa; E 0 is the structural recovery potential energy at the point when the shear rate is zero, Pa; and E is the structural recovery potential energy at the point when the shear rate is infinite, Pa.
Various factors affect the potential functions of structural establishment and structural failure; these include the molecular motion, the intermolecular interaction between the molecular aspects of the asphalt and mineral filler, temperature, and loading. The relationship among these factors will change with changes in the external conditions.
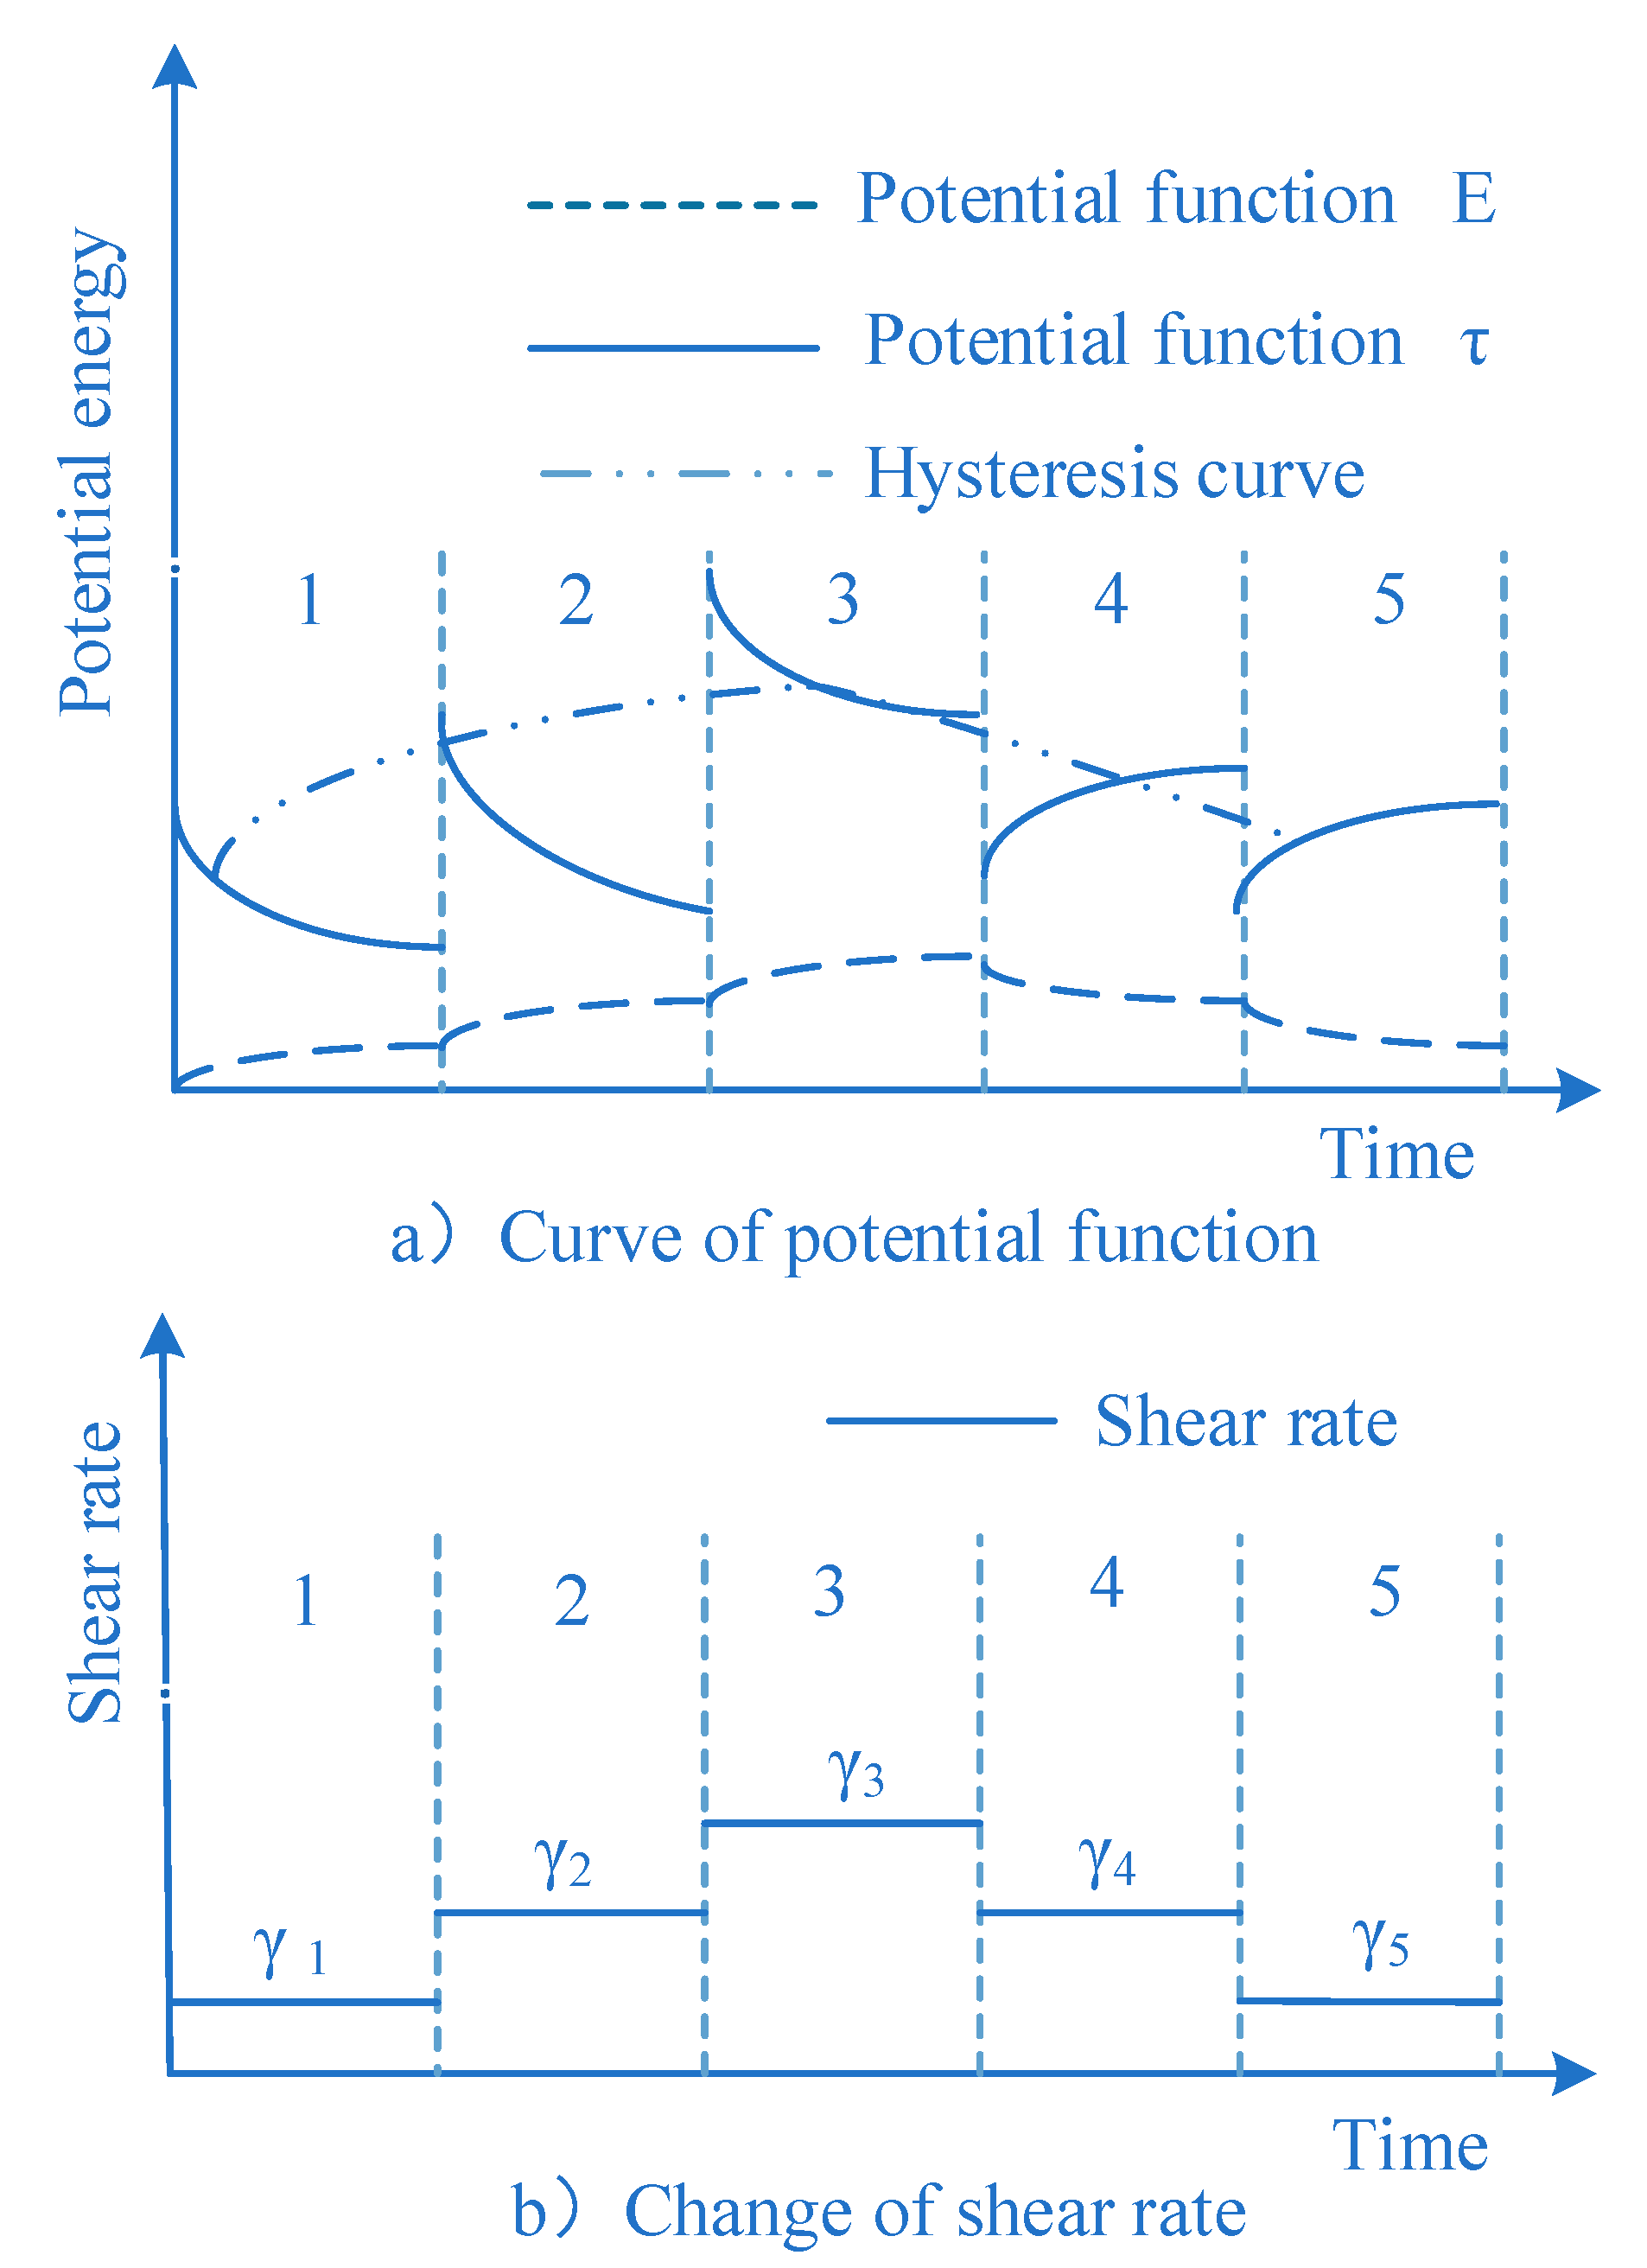
When the cyclic shear rate was applied to an asphalt mastic, the curve of the structural failure potential function also formed a closed hysteresis loop. Figure 13 shows the potential function and variations under the cyclic shear rate, in which Figure 13a is the variation of the two potential functions and Figure 13b is the change in the shear rate.
In Figure 11, the shear rates of zone 1 and zone 5 are the same, the shear rates of zone 2 and zone 4 are the same, the shear rate of zone 3 is greater than that of zone 2, and the shear rate of zone 2 is greater than that of zone 1. If the time of the shear rate in each region is long enough, the potential functions of E and τ in each region of the graph will finally achieve a balance. As the shear rate changes step by step, the two potential functions will also correspondingly increase and decrease (that is, the curve of the potential functions in the graph increases and decreases). In the cyclic test, the shear rate increases or decreases linearly at a constant rate. Therefore, the shear rate of fixed points during the rise and fall of the shear rate can be selected for research. Assuming that the duration of each shear rate point is very long, the curve of the potential function in Figure 11 can also be obtained. However, in fact, the duration of each shear rate in the cyclic test is limited, so the value of the potential function under each shear rate cannot reach the equilibrium. In Figure 11a, points on the curve of the structural failure potential function under the action of the shear rate in each region are taken and connected. The curve formed by the connection of these points is the upward downward curve in the hysteresis loop. If more shear rates are taken in the analysis, a closed hysteresis loop can be obtained. With an increase in the shear times in the cyclic test, the structural failure potential function of an asphalt mastic will gradually decrease until it reaches the corresponding equilibrium state. Therefore, the hysteresis loop of the structural failure potential function would move to the shear rate axis with an increase in the shear time and finally form a hysteresis loop.
Figure 11 also shows that as the shear rate changes from low to high, the shear stress also increases step by step on the basis of the lower shear rate. It then decreases gradually according to a certain law, moving toward the equilibrium value with the extension of the shear rate. When the shear rate changes from high to low, the shear stress will decrease correspondingly until the equilibrium value is reached. Therefore, a change in the shear stress is consistent with a change in the structural failure potential function. In addition, a direct ratio exists between the change in the shear stress (shear rate) and the damage of the internal structure of the asphalt mastic; that is, the greater the shear stress, the stronger the loading damage on the thixotropic materials. This suggests that the characteristic of shear stress is consistent with the structural failure potential function. In addition, according to Table 4 and Figure 11, with an increase in loading times, the shear stress hysteresis loop for each asphalt mastic tends to move toward the shear rate axis. With an increase in the cyclic load’s loading times, the area of the hysteresis loop gradually decreases, moving toward a relatively stable value. Therefore, the relationship between the shear stress hysteresis loop change and the structural failure potential function also remain consistent.

4. Conclusions

This paper explored the thixotropic behavior of asphalt mastics as well as the thixotropic potential function from the energy viewpoint. Based on the results and discussions, the following conclusions can be drawn:
(1) With an increase in the cyclic load’s loading times, the area of the hysteresis loop gradually decreases. Finally, the area of the hysteresis loop moves toward a relatively stable value. Mastics fabricated with asphalts of the same grade and different oil sources had the same hysteresis loop area at the first circle, but they had totally different areas at the last circle. These results all depended on the structure’s stability. The thixotropy of asphalt can be significantly reduced by adding filler, and different types of mineral filler can influence it;
(2) Viscosity decreases with an increase in the shear rate, and it gradually recovers with a decrease in the shear rate. As the viscosity and shear stress are great, the viscosity crack propagates quickly when the cyclic load is applied for the first time. The subsequent processing will continue on the basis of the viscosity and the destroyed microstructure at the end of the first circle. The greater the filler/asphalt ratio, the greater the viscosity, and the faster the descent of the viscosity with the prolonging of time;
(3) For asphalt mastics with high filler/asphalt ratios, the thixotropic mechanism can be explained by particle agglomeration and depolymerization theory. For asphalt mastics with low and medium filler/asphalt ratios, the thixotropic mechanism can be explained by the particle chain theory. When asphalt mastics are thinned via shear, the direction and arrangement of the particles change, and the changes in the microstructure bring forth a variety of the thixotropic qualities of asphalt mastics;
(4) The energy viewpoint is a phenomenological method used to study the thixotropy of non-Newtonian fluids. It was used to analyze the thixotropy of asphalt mastic in this research study. The damage and recovery of the internal structure of an asphalt mastic can be characterized by two functions, defined as the structural recovery potential function (E) and the structural failure potential function (D).

Author Contributions

Investigation, X.M.; data curation, Y.W.; writing—original draft, S.W.; writing—review and editing, J.H. and Y.S.; supervision, W.Z.; funding acquisition, Y.S. All authors have read and agreed to the published version of the manuscript.

Funding

This project was supported by Natural Science Found Committee (NSFC) of China (No. 52208417), China Postdoctoral Science Foundation Funded Project (Project No. 2020M683401), the Natural Science Basis Research Plan in Shaanxi Province of China (No. 2021JQ-262), the Key Research and Development Project of Shaanxi Province (No. 2022GY-427) and the Fundamental Research Funds for the Central Universities of China (No. 300102311402). Key Research and Development Program of Shaanxi Province (No. 2018SF-403). The authors gratefully acknowledge support from Chang’an University and Scientific Observation and and Road & Bridge Construction Group of Gansu Province.

Institutional Review Board Statement

Not applicable.

Informed Consent Statement

Not applicable.

Data Availability Statement

Not applicable.

Conflicts of Interest

The authors declare no conflict of interest.

References

  1. Micaelo, R.; Jiménez, F.P.; Botella, R.; Miró, R.; Martínez, A.; da Costa, M.S. On the analysis of uniaxial cyclic strain sweep test results to bituminous binders: Stiffness-phase angle curve. Mater. Struct. 2022, 55, 90. [Google Scholar] [CrossRef]
  2. Miglietta, F.; Tsantilis, L.; Baglieri, O.; Santagata, E. A new approach for the evaluation of time–temperature superposition effects on the self-healing of bituminous binders. Const. Build. Mater. 2021, 287, 122987. [Google Scholar] [CrossRef]
  3. Fan, S.; Zhu, H.; Lu, Z. Fatigue Behavior and Healing Properties of Aged Asphalt Binders. J. Mater. Civ. Eng. 2022, 34, 04022117. [Google Scholar] [CrossRef]
  4. Di Benedetto, L.R.; Pronk, A.; Lundstrom, R. Fatigue of Bituminous Mixtures. Mater. Struct. 2004, 37, 14. [Google Scholar] [CrossRef]
  5. Grossegger, D. Fatigue Damage Self-Healing Analysis and the Occurrence of an Optimal Self-Healing Time in Asphalt Concrete. J. Mater. Civ. Eng. 2021, 33, 04021098. [Google Scholar] [CrossRef]
  6. Di Benedetto, H.; Nguyen, Q.T.; Sauzéat, C. Nonlinearity, Heating, Fatigue and Thixotropy during Cyclic Loading of Asphalt Mixtures. Road Mater. Pavement Des. 2011, 12, 129–158. [Google Scholar] [CrossRef]
  7. Botella, R.; Pérez-Jiménez, F.E.; López-Montero, T.; Miró, R. Cyclic testing setups to highlight the importance of heating and other reversible phenomena on asphalt mixtures. Int. J. Fatigue 2020, 134, 105514. [Google Scholar] [CrossRef]
  8. Liang, B.; Lan, F.; Shi, K.; Qian, G.; Liu, Z.; Zheng, J. Review on the self-healing of asphalt materials: Mechanism, affecting factors, assessments and improvements. Const. Build. Mater. 2021, 266, 120453. [Google Scholar] [CrossRef]
  9. Meng, Y.; Gou, C.; Zhao, Q.; Qin, Y.; Kong, W.; Fan, L. Study on multiple Damage-Healing properties and mechanism of laboratory simulated recycled asphalt binders. Const. Build. Mater. 2022, 346, 128468. [Google Scholar] [CrossRef]
  10. Phan, C.V.; Di Benedetto, H.; Sauzéat, C.; Dayde, J.; Pouget, S. Quantification of different effects occurring during fatigue tests on bituminous mixtures. Fatigue Fract. Eng. Mater. Struct. 2017, 40, 2169–2182. [Google Scholar] [CrossRef]
  11. Pérez-Jiménez, F.E.; Botella, R.; Miró, R.; Martínez, A.H. Analysis of the thixotropic behavior and the deterioration process of bitumen in fatigue tests. Const. Build. Mater. 2015, 101, 277–286. [Google Scholar] [CrossRef]
  12. Mewis, J.; Wagner, N.J. Thixotropy. Adv. Colloid Interface Sci. 2009, 147–148, 214–227. [Google Scholar] [CrossRef] [PubMed]
  13. Cho, D.-W.; Kim, K. The mechanisms of moisture damage in asphalt pavement by applying chemistry aspects. KSCE J. Civ. Eng. 2010, 14, 333–341. [Google Scholar] [CrossRef]
  14. Shan, L.; Tan, Y.; Underwood, B.S.; Kim, Y.R. Separation of Thixotropy from Fatigue Process of Asphalt Binder. Transp. Res. Rec. J. Transp. Res. Board 2011, 2207, 89–98. [Google Scholar] [CrossRef]
  15. Shan, L.; Tan, Y.; Underwood, S.; Kim, Y.R. Application of Thixotropy to Analyze Fatigue and Healing Characteristics of Asphalt Binder. Transp. Res. Rec. J. Transp. Res. Board 2010, 2179, 85–92. [Google Scholar] [CrossRef]
  16. Pérez-Jiménez, F.E.; Botella, R.; Miró, R. Differentiating between damage and thixotropy in asphalt binder’s fatigue tests. Const. Build. Mater. 2012, 31, 212–219. [Google Scholar] [CrossRef]
  17. Xing, B.; Qian, C.; Sun, H.; Che, J.; Lyu, Y. Reliability study on rheological and cracking behavior of mastics using different sized particles. Adv. Powder Technol. 2021, 32, 2029–2042. [Google Scholar] [CrossRef]
  18. Miglietta, F.; Tsantilis, L.; Baglieri, O.; Santagata, E. Investigating the effect of temperature on self-healing properties of neat and polymer-modified bituminous binders. Road Mater. Pavement Des. 2021, 23, 2–15. [Google Scholar] [CrossRef]
  19. Ouyang, J.; Tan, Y.; Corr, D.J.; Shah, S.P. The thixotropic behavior of fresh cement asphalt emulsion paste. Const. Build. Mater. 2016, 114, 906–912. [Google Scholar] [CrossRef]
  20. Nahar, S.N.; Leegwater, G. Reversible molecular structuring and thixotropy in bitumen. Road Mater. Pavement Des. 2021, 22, S287–S296. [Google Scholar] [CrossRef]
  21. Canestrari, F.; Virgili, A.; Graziani, A.; Stimilli, A. Modeling and assessment of self-healing and thixotropy properties for modified binders. Int. J. Fatigue 2015, 70, 351–360. [Google Scholar] [CrossRef]
  22. Underwood, B.S.; Kim, Y.R. Microstructural investigation of asphalt concrete for performing multiscale experimental studies. Int. J. Pavement Eng. 2013, 14, 498–516. [Google Scholar] [CrossRef]
  23. Yong-Rak Kim, D.N.L. Linear viscoelastic analysis of asphalt mastics. J. Mater. Civ. Eng. 2014, 16, 122–132. [Google Scholar] [CrossRef]
  24. Mazzoni, G.; Virgili, A.; Canestrari, F. Influence of different fillers and SBS modified bituminous blends on fatigue, self-healing and thixotropic performance of mastics. Road Mater. Pavement Des. 2017, 20, 656–670. [Google Scholar] [CrossRef]
  25. Mazzoni, G.; Stimilli, A.; Cardone, F.; Canestrari, F. Fatigue, self-healing and thixotropy of bituminous mastics including aged modified bitumens and different filler contents. Const. Build. Mater. 2017, 131, 496–502. [Google Scholar] [CrossRef]
  26. Mazzoni, G.; Stimilli, A.; Canestrari, F. Self-healing capability and thixotropy of bituminous mastics. Int. J. Fatigue 2016, 92, 8–17. [Google Scholar] [CrossRef]
  27. Hassan, M.M. Thixotropic Properties of Mastics Incorporates Secondary Fille. Airfield Highw. Pavement 2013, 7, 913–920. [Google Scholar]
Figure 1. The experimental device.
Coatings 13 00650 g001
Figure 2. The relation of strain vs. time.
Coatings 13 00650 g002
Figure 3. The hysteresis loops of asphalt materials.
Coatings 13 00650 g003
Figure 4. Change in viscosity during hysteresis.
Coatings 13 00650 g004
Figure 5. The hysteresis loops of asphalt mastic fabricated from different asphalt.
Coatings 13 00650 g005
Figure 6. Change in viscosity during hysteresis of mastics fabricated from different asphalt.
Coatings 13 00650 g006
Figure 7. Hysteresis loops of asphalt mastic fabricated from different filler volume fractions.
Coatings 13 00650 g007
Figure 8. Change of viscosity during hysteresis of mastics fabricated from different asphalt.
Coatings 13 00650 g008
Figure 9. Hysteresis loops of asphalt mastic fabricated with different fillers.
Coatings 13 00650 g009
Figure 10. Change in viscosity during hysteresis of mastics fabricated with different fillers.
Coatings 13 00650 g010
Figure 11. Schematic diagram of thixotropic mechanism explained by particle agglomeration and depolymerization.
Coatings 13 00650 g011
Figure 12. Schematic diagram of thixotropic mechanism explained by particle chains.
Coatings 13 00650 g012
Figure 13. Schematic diagram of potential function change under cyclic shear.
Coatings 13 00650 g013
Table 1. Performance of Asphalt Binders.
AsphaltPenetration 25 °C/0.1 mmSoft Point/°CDuration/cmPG/°C
SK9083.045.585 (10 °C)58–22
KL9081.646.0>100 (10 °C)58–22
SK7063.047.550 (10 °C)58–22
Table 2. Properties of chemical composition.
FillerAPS/μm Chemical Composition/% Densities/g/cm−3
SiO2CaOTiO2Al2O3Fe2O3MgOK2O
A45.676.586.90.01.70.83.60.32.628
B64.5159.113.00.712.45.65.12.62.749
C40.969.1882.460.00 2.671.063.310.352.632
D42.828.1184.240.00 2.280.953.420.332.631
E36.1711.8778.020.00 3.641.323.020.402.636
Table 3. Combination of asphalt mastic.
Asphalt BinderFillerFiller Volume FractionAsphalt Mastic
SK90A0.6SK90 + 0.6A
0.8SK90 + 0.8A
1.0SK90 + 1.0A
1.2SK90 + 1.2A
1.4SK90 + 1.4A
1.6SK90 + 1.6A
B0.8SK90 + 0.8B
CSK90 + 0.8C
DSK90 + 0.8D
ESK90 + 0.8E
KL90AKL90 + 0.8A
SK70ASK70 + 0.8A
Table 4. Area of each hysteresis loop and the corresponding maximum stress.
Asphalt MasticAreaMaximum Stress
1234512345
SK90 + 0.6A6529378740523217423231,15625,98424,06022,45119,733
SK90 + 0.8A7835701568085740369732,07223,30219,95115,59014,625
SK90 + 1.0A9918789075596146423448,83446,11643,74040,28636,399
SK90 + 1.2A20,15113,10170487244485848,89045,20637,63930,34422,656
SK90 + 1.4A26,00419,37379124335474547,78230,83823,43317,96510,829
SK90 + 1.6A21,35812,81589095681327338,89234,82625,76319,73012,346
SK90 + 0.8B11,927529945834700442533,42930,61324,88125,80417,693
SK90 + 0.8C11,225554955093896344631,79225,49221,62017,27014,579
SK90 + 0.8D7326469573565554381636,58432,01229,21426,68818,071
KL90 + 0.8A8047317453575241450436,83223,17822,17918,85915,674
SK70 + 0.8A8567709050574020372339,18326,78423,17722,20718,487
Disclaimer/Publisher’s Note: The statements, opinions and data contained in all publications are solely those of the individual author(s) and contributor(s) and not of MDPI and/or the editor(s). MDPI and/or the editor(s) disclaim responsibility for any injury to people or property resulting from any ideas, methods, instructions or products referred to in the content.

