
Acoustic Emission Monitoring of High-Entropy Oxyfluoride Rock-Salt Cathodes during Battery Operation


Institute of Nanotechnology, Karlsruhe Institute of Technology (KIT), Hermann-von-Helmholtz-Platz 1, 76344 Eggenstein-Leopoldshafen, Germany
*
Authors to whom correspondence should be addressed.
Coatings 2022, 12(3), 402; https://doi.org/10.3390/coatings12030402
Submission received: 21 February 2022
/
Revised: 10 March 2022
/
Accepted: 16 March 2022
/
Published: 18 March 2022
(This article belongs to the Special Issue 10th Anniversary of Coatings: Invited Papers for Thin Films Section)
Abstract
:High-entropy materials with tailorable properties are receiving increasing interest for energy applications. Among them, (disordered) rock-salt oxyfluorides hold promise as next-generation cathodes for use in secondary batteries. Here, we study the degradation behavior of a high-entropy oxyfluoride cathode material in lithium cells in situ via acoustic emission (AE) monitoring. The AE signals allow acoustic events to be correlated with different processes occurring during battery operation. The initial cycle proved to be the most acoustically active due to significant chemo-mechanical degradation and gas evolution, depending on the voltage window. Irrespective of the cutoff voltage on charge, the formation and propagation of cracks in the electrode was found to be the primary source of acoustic activity. Taken together, the findings help advance our understanding of the conditions that affect the cycling performance and provide a foundation for future investigations on the topic.
1. Introduction
Rechargeable lithium-ion batteries (LIBs) represent the most advanced energy-storage technology for use in stationary, portable and automotive applications. Special attention is being paid to anode and cathode active materials with improved properties regarding specific capacity, average operating voltage, diffusion kinetics, longevity, costs, sustainability, etc. Recent advances in high-entropy materials seem to hold promise for the development of next-generation battery technologies [1,2,3,4,5,6]. High-entropy materials are based on the high-entropy concept [7], which aims at introducing a variety of different elements into a single-phase crystal structure. This in principle leads to a large configurational entropy, Sconfig, and unique interactions between the incorporated species [7,8]. The latter, known as the so-called cocktail effect, can result in new and sometimes unprecedented properties [4,8], which makes the high-entropy concept extremely versatile (vast compositional design space) and appealing to materials scientists, in particular. Thus, high-entropy materials, including carbides, borides, nitrides, chalcogenides and oxides, are already being investigated in various fields, such as catalysis and energy storage [7,9,10,11,12,13,14,15].
Wang et al. have shown recently that it is possible to tailor the anion and cation composition of multicomponent materials while retaining a single-phase structure [14]. By introducing different cation and anion species into a rock-salt lattice, a new class of multicomponent battery materials has been developed (exemplified by Lix(Co0.2Cu0.2Mg0.2Ni0.2Zn0.2)OFx, referred to as LiHEOF in the following). A LiHEOF cathode showed much improved cyclability over LiNiOF, which served as a reference material. This result has been attributed to some kind of entropy stabilization, promoting a more robust crystal structure, with the anion lattice also contributing to the configurational entropy. Overall, the application of the high-entropy concept has been demonstrated to be beneficial to the cycling performance.
However, Li+ extraction from the LiHEOF material during charging has been shown to be accompanied by adverse side reactions, with a clear dependency on the cutoff voltage. These side reactions consume electrolyte and lead to gas evolution, among others, as evidenced by in situ gas analysis and pressure measurements [16]. For example, the cumulative amount of released gasses (mainly O2, H2, CO2 and CO) increased considerably as the cutoff voltage increased from 4.6 to 5.0 V vs. Li+/Li due to (chemical/electrochemical) electrolyte decomposition. Interestingly, the gas evolution pattern was strongly correlated with the release of lattice O2 from the LiHEOF particles.
Because significant capacity decay has been observed in the initial cycles [14,16], herein operando acoustic emission (AE) monitoring was used to gain more insight on the degradation behavior of the LiHEOF cathode during battery operation. AE is a non-destructive and widely used method for structural health monitoring (fatigue, crack formation, mechanical damage, etc., in construction materials, for example). It is also used to study (heterogeneous) electrochemical processes, such as corrosion or anodization. Accordingly, it is not surprising that AE technology can be applied to battery materials, too. In general, AE is capable of detecting acoustic events during battery operation that can be associated with different processes, such as solid-electrolyte interphase (SEI) formation and mechanical degradation at the particle/electrode level [17,18,19,20,21,22,23,24,25]. Classifying the AE signals according to peak frequency, rise time, duration or amplitude allows different types of degradation to be distinguished [20,26,27,28,29,30]. AE technology has already been applied in the past to various anode and cathode active materials, including graphite, Si, LiCoO2, LiNiO2 and NiSb2, to name a few. In the present work, we probe LiHEOF|Li cells with operando AE monitoring. The data analysis and interpretation is based, to some extent, on the available literature reports examining both the Li-storage properties and gassing behavior of LiHEOF [14,16]. For more details on AE analysis, the reader is referred to references [17,20,21,29,30,31].
2. Experimental
2.1. Material
LiHEOF was produced by high-energy ball milling of (Co0.2Cu0.2Mg0.2Ni0.2Zn0.2)O (referred to as HEO; prepared by nebulized spray pyrolysis, as reported elsewhere) [32] in the presence of LiF (Alfa Aesar, 99.99%) at 500 rpm for 24 h. The ball-to-powder ratio was set to 40:1 by weight. WC vials and balls were used.
2.2. Electrodes and Testing
The cathodes were prepared by coating a slurry containing 70 wt % LiHEOF, 20 wt % Super C65 carbon black (Imerys Graphite & Carbon Switzerland SA, Bodio, Switzerland) and 10 wt % polyvinylidene difluoride (Solvay SA, Brussels, Belgium) in N-methyl-2-pyrrolidone onto Al foil (15 µm thickness) using a doctor blade. The active material loading was around 1.4 mg LiHEOF/cm2. CR2032 coin half-cells were assembled in an Ar glovebox with H2O and O2 levels < 0.1 ppm by stacking the LiHEOF cathode (12 mm diameter, 25 µm thickness), a GF/D glass microfiber separator (GE Healthcare Life Science, Solingen, Germany; 17 mm diameter, 675 µm thickness) and a Li metal anode (Albemarle Germany GmbH, Frankfurt am Main, Germany; 15 mm diameter, 600 µm thickness). A total of 100 µL of LP57 (1 M LiPF6 in 3:7 by weight of ethylene carbonate and ethyl methyl carbonate) was used as the electrolyte (BASF SE, Ludwigshafen, Germany). The LiHEOF|Li cells were cycled at 25 °C and a rate of C/10 (1C = 160 mA/g LiHEOF) using a BAT-SMALL potentiostat (Astrol Electronics AG, Othmarsingen, Switzerland). The cutoff voltages were set to 2.0 V and either 4.6, 4.8 or 5.0 V vs. Li+/Li.
2.3. Acoustic Emission (AE) Monitoring
The AE setup comprised a differential wideband sensor (MISTRAS Group, Inc., Princeton Junction, NJ, USA), an in-line preamplifier and a data acquisition system (MISTRAS Group, Inc., Princeton Junction, NJ, USA). The preamp gain, analog filter and sampling rate were set to 40 dB, 20–1000 kHz and 5 MSPS, respectively. The AE was recorded for hits exceeding a 27 dB threshold and processed further using AEwin for USB software (MISTRAS Group, Inc., Princeton Junction, NJ, USA). Signals of less than two counts or lower than 100 kHz were eliminated. The sensor coupling was tested by the pencil lead break method [33]. The sensor was attached to the coin cell at the cathode side using silicone grease and a clamp, and the whole setup was placed inside a foam box to decrease background noise. The reproducibility of the AE measurements was verified by testing two individual cells for each upper cutoff voltage.
2.4. Scanning Electron Microscopy (SEM) Imaging
Ex situ SEM imaging was performed at 10 kV with a LEO-1530 electron microscope (Carl Zeiss AG, Oberkochen, Germany). To this end, the cycled CR2032 cells were opened (decrimped using a MSK-160E crimper from MTI Corp., Richmond, VA, USA) in an Ar glovebox and the cathode was rinsed with 3 mL of dimethyl carbonate. Inert sample transfer from the glovebox to the microscope was accomplished by using an airtight container.
3. Results and Discussion
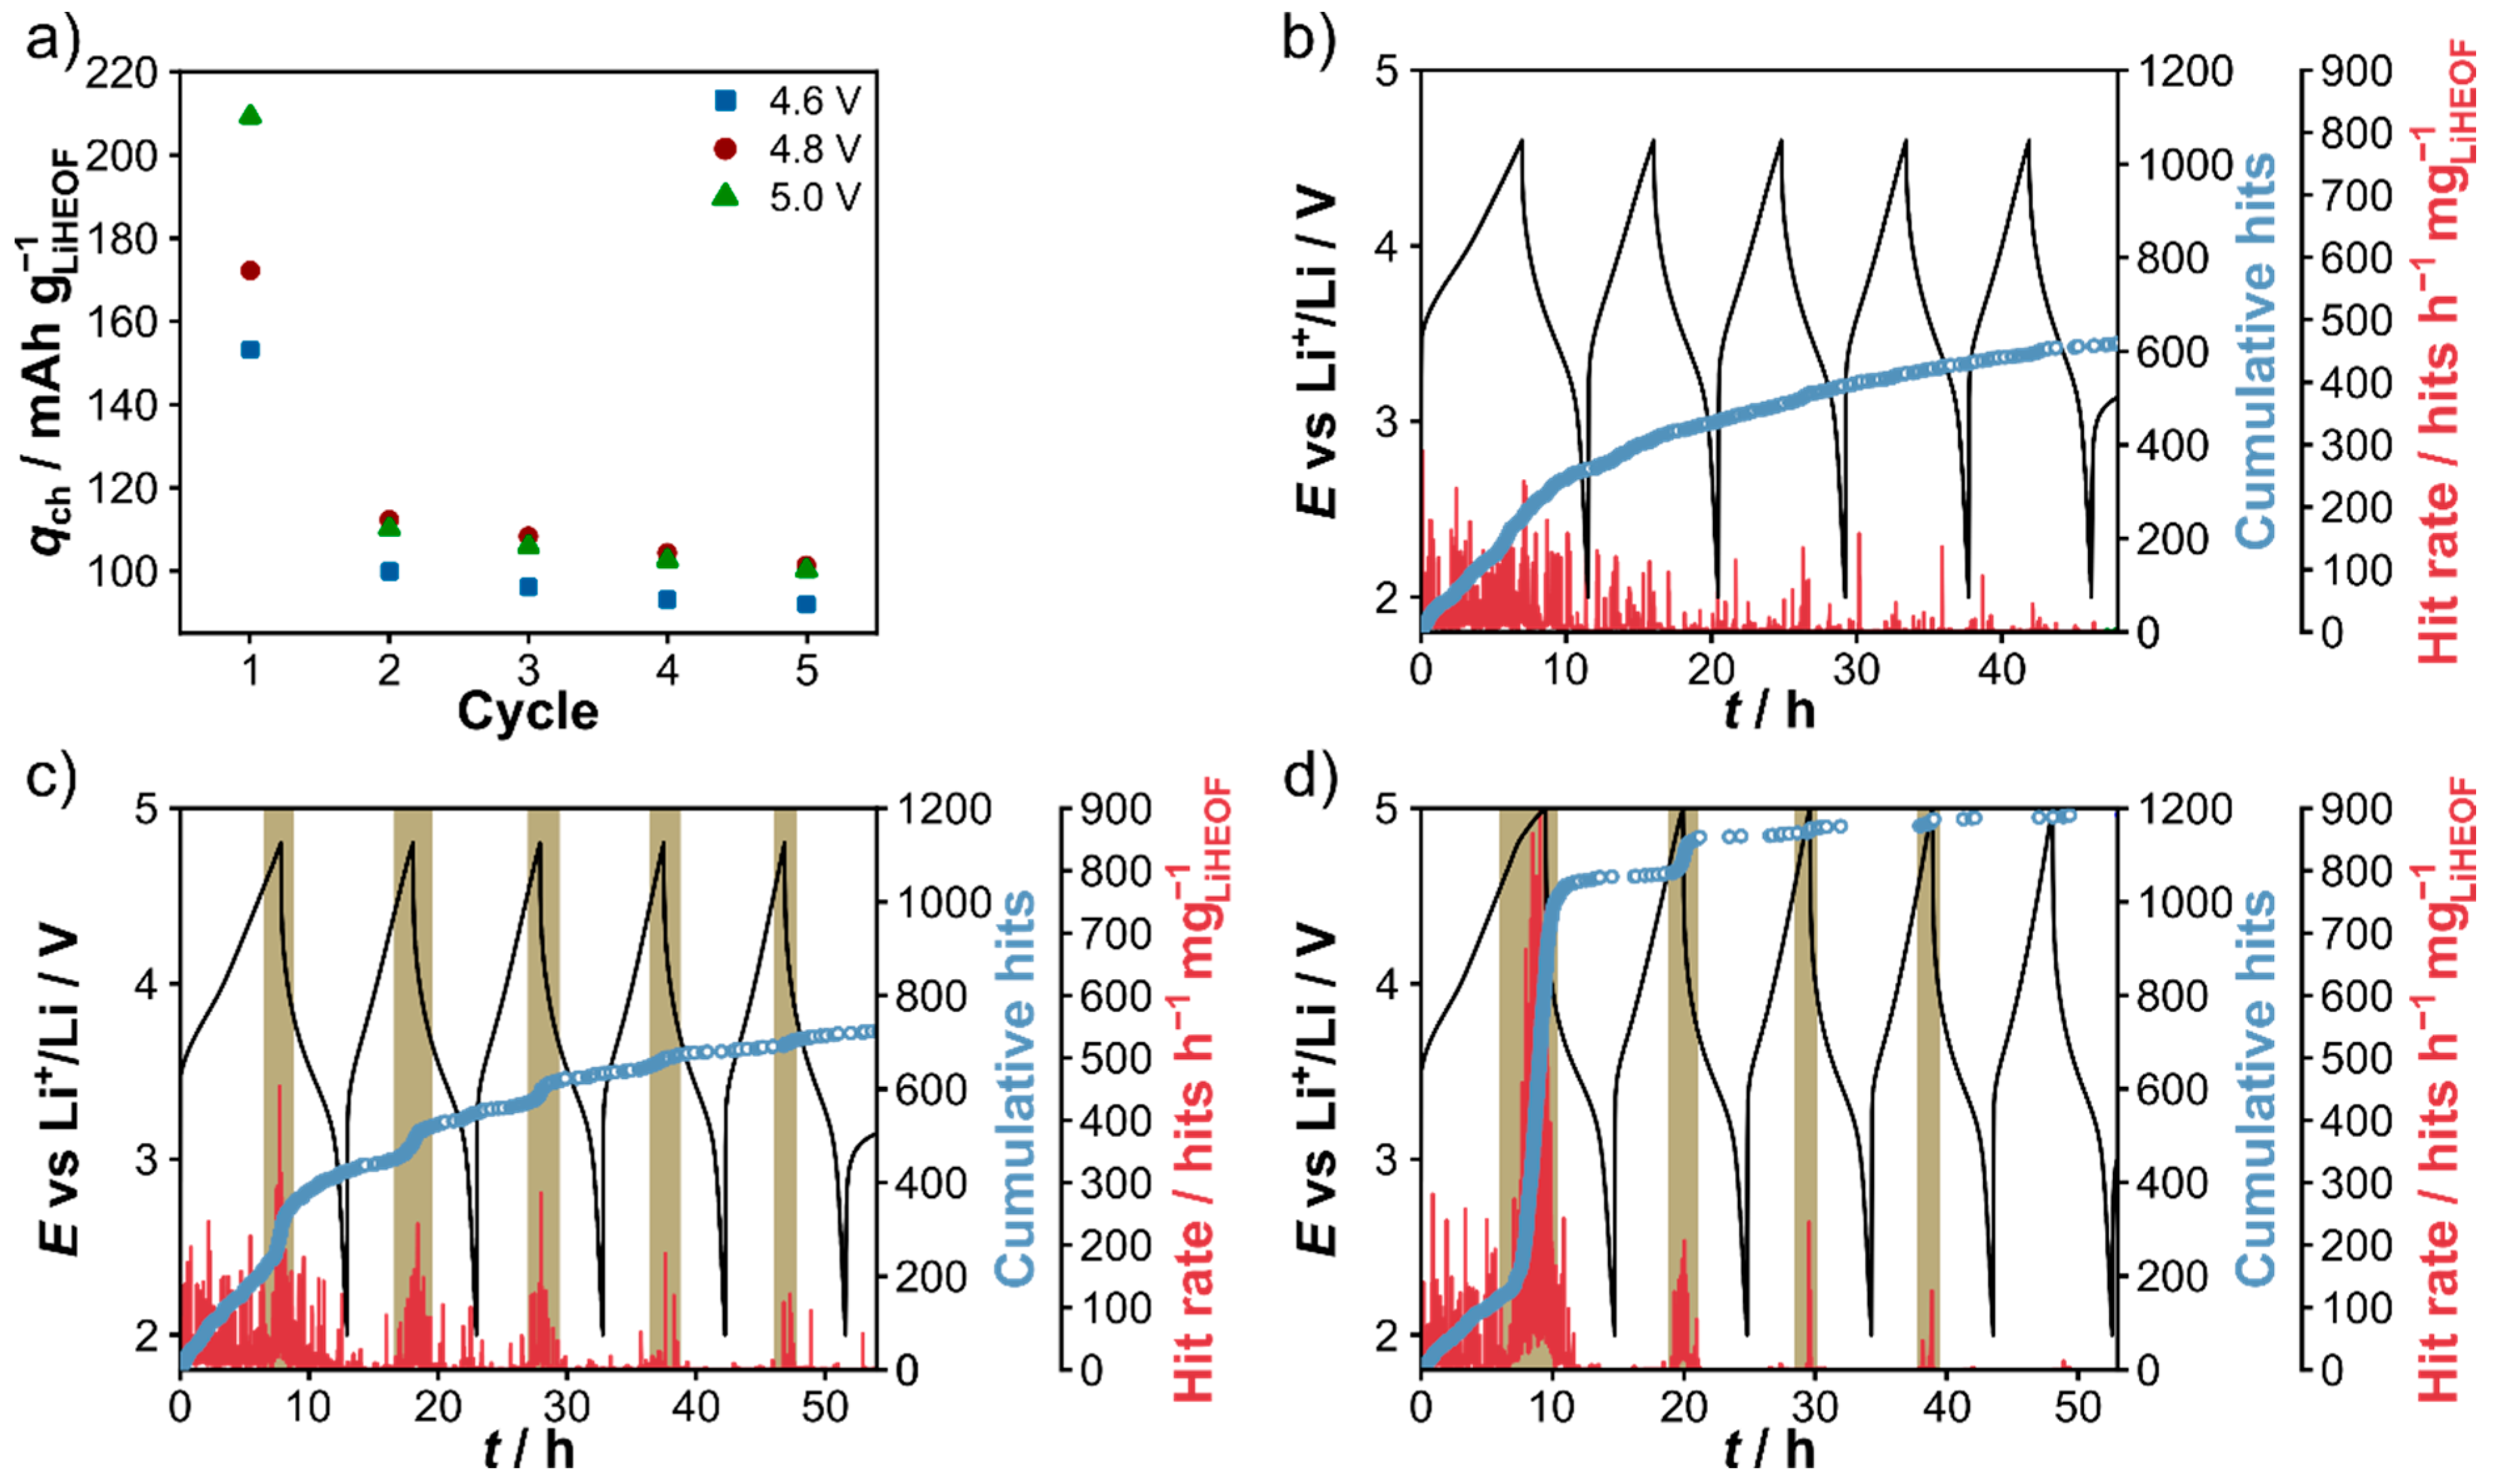
The LiHEOF|Li cells were charged at C/10 rate to 4.6, 4.8 or 5.0 V vs. Li+/Li while keeping the cutoff voltage on discharge constant and probed using a combination of AE monitoring and SEM imaging. The specific charge capacities, voltage profiles and corresponding cumulative AE hits and hit rates are shown for the first five cycles in Figure 1a–d. Both the capacities (see Figure 1a) and the shape of the voltage profiles (see Figure 1b–d) agree well with the results from previous studies [14,16]. As is evident from the data, the initial charge capacity increased strongly as the cutoff voltage increased, and the cell cycled between 2.0 and 5.0 V showed the largest decay (by >50%) after five cycles. This capacity degradation is hypothesized to be due in part to irreversible oxygen redox, chemical and/or electrochemical electrolyte oxidation and cathode SEI (cSEI) formation.
The AE measurements revealed a similar trend in cumulative hits up to about 4.6 V, with a stepwise pattern (see Figure 1b–d), demonstrating the reproducibility of the experiments. Acoustic activity was detected directly after the onset of charging. Beyond 4.6 V, and especially above 4.8 V, the LiHEOF|Li cells exhibited sharp increases in the cumulative hits and the hit rate. The total number of hits increased with the increasing cutoff voltage. However, the difference between the cells charged to 4.6 or 4.8 V was relatively minor. A possible explanation for the immediate appearance of acoustic activity (at low voltages) could be the stress and strain associated with Li+ extraction from the LiHEOF cathode and Li plating at the anode side. Volume changes during cycling can lead to mechanical degradation, including particle fracture and pulverization, as well as electrode cracking, all of which strongly affects the AE [20,21,29,30]. Pressure measurements conducted on LiHEOF|Li cells have shown a gradual increase with the onset of charging [16], probably due to volume change effects, as already demonstrated for other battery materials, such as graphite and LiNiO2 [34,35]. An early increase in pressure because of gas evolution can be largely ruled out, as gaseous species have not been detected by differential electrochemical mass spectrometry (DEMS) below 4.55 V [16]. Furthermore, shifts in the position of X-ray diffraction (XRD) peaks observed by Wang et al. suggested that LiHEOF cathode particles indeed undergo volume changes during cycling [14], with the extent of contraction of the unit cell upon Li+ extraction (accompanied by Ni/Co oxidation) being dependent on the state of charge (SOC). It should also be noted that a major contribution of the Li metal anode to the acoustic activity can be excluded on the basis of previous findings from AE studies conducted on symmetric and asymmetric cells [17,30,36]. Because mechanical degradation leads to distinct acoustic events, it is reasonable to assume that the cumulative AE hits detected at the beginning of charging are directly or indirectly related to mechanical effects at the particle and/or electrode level.
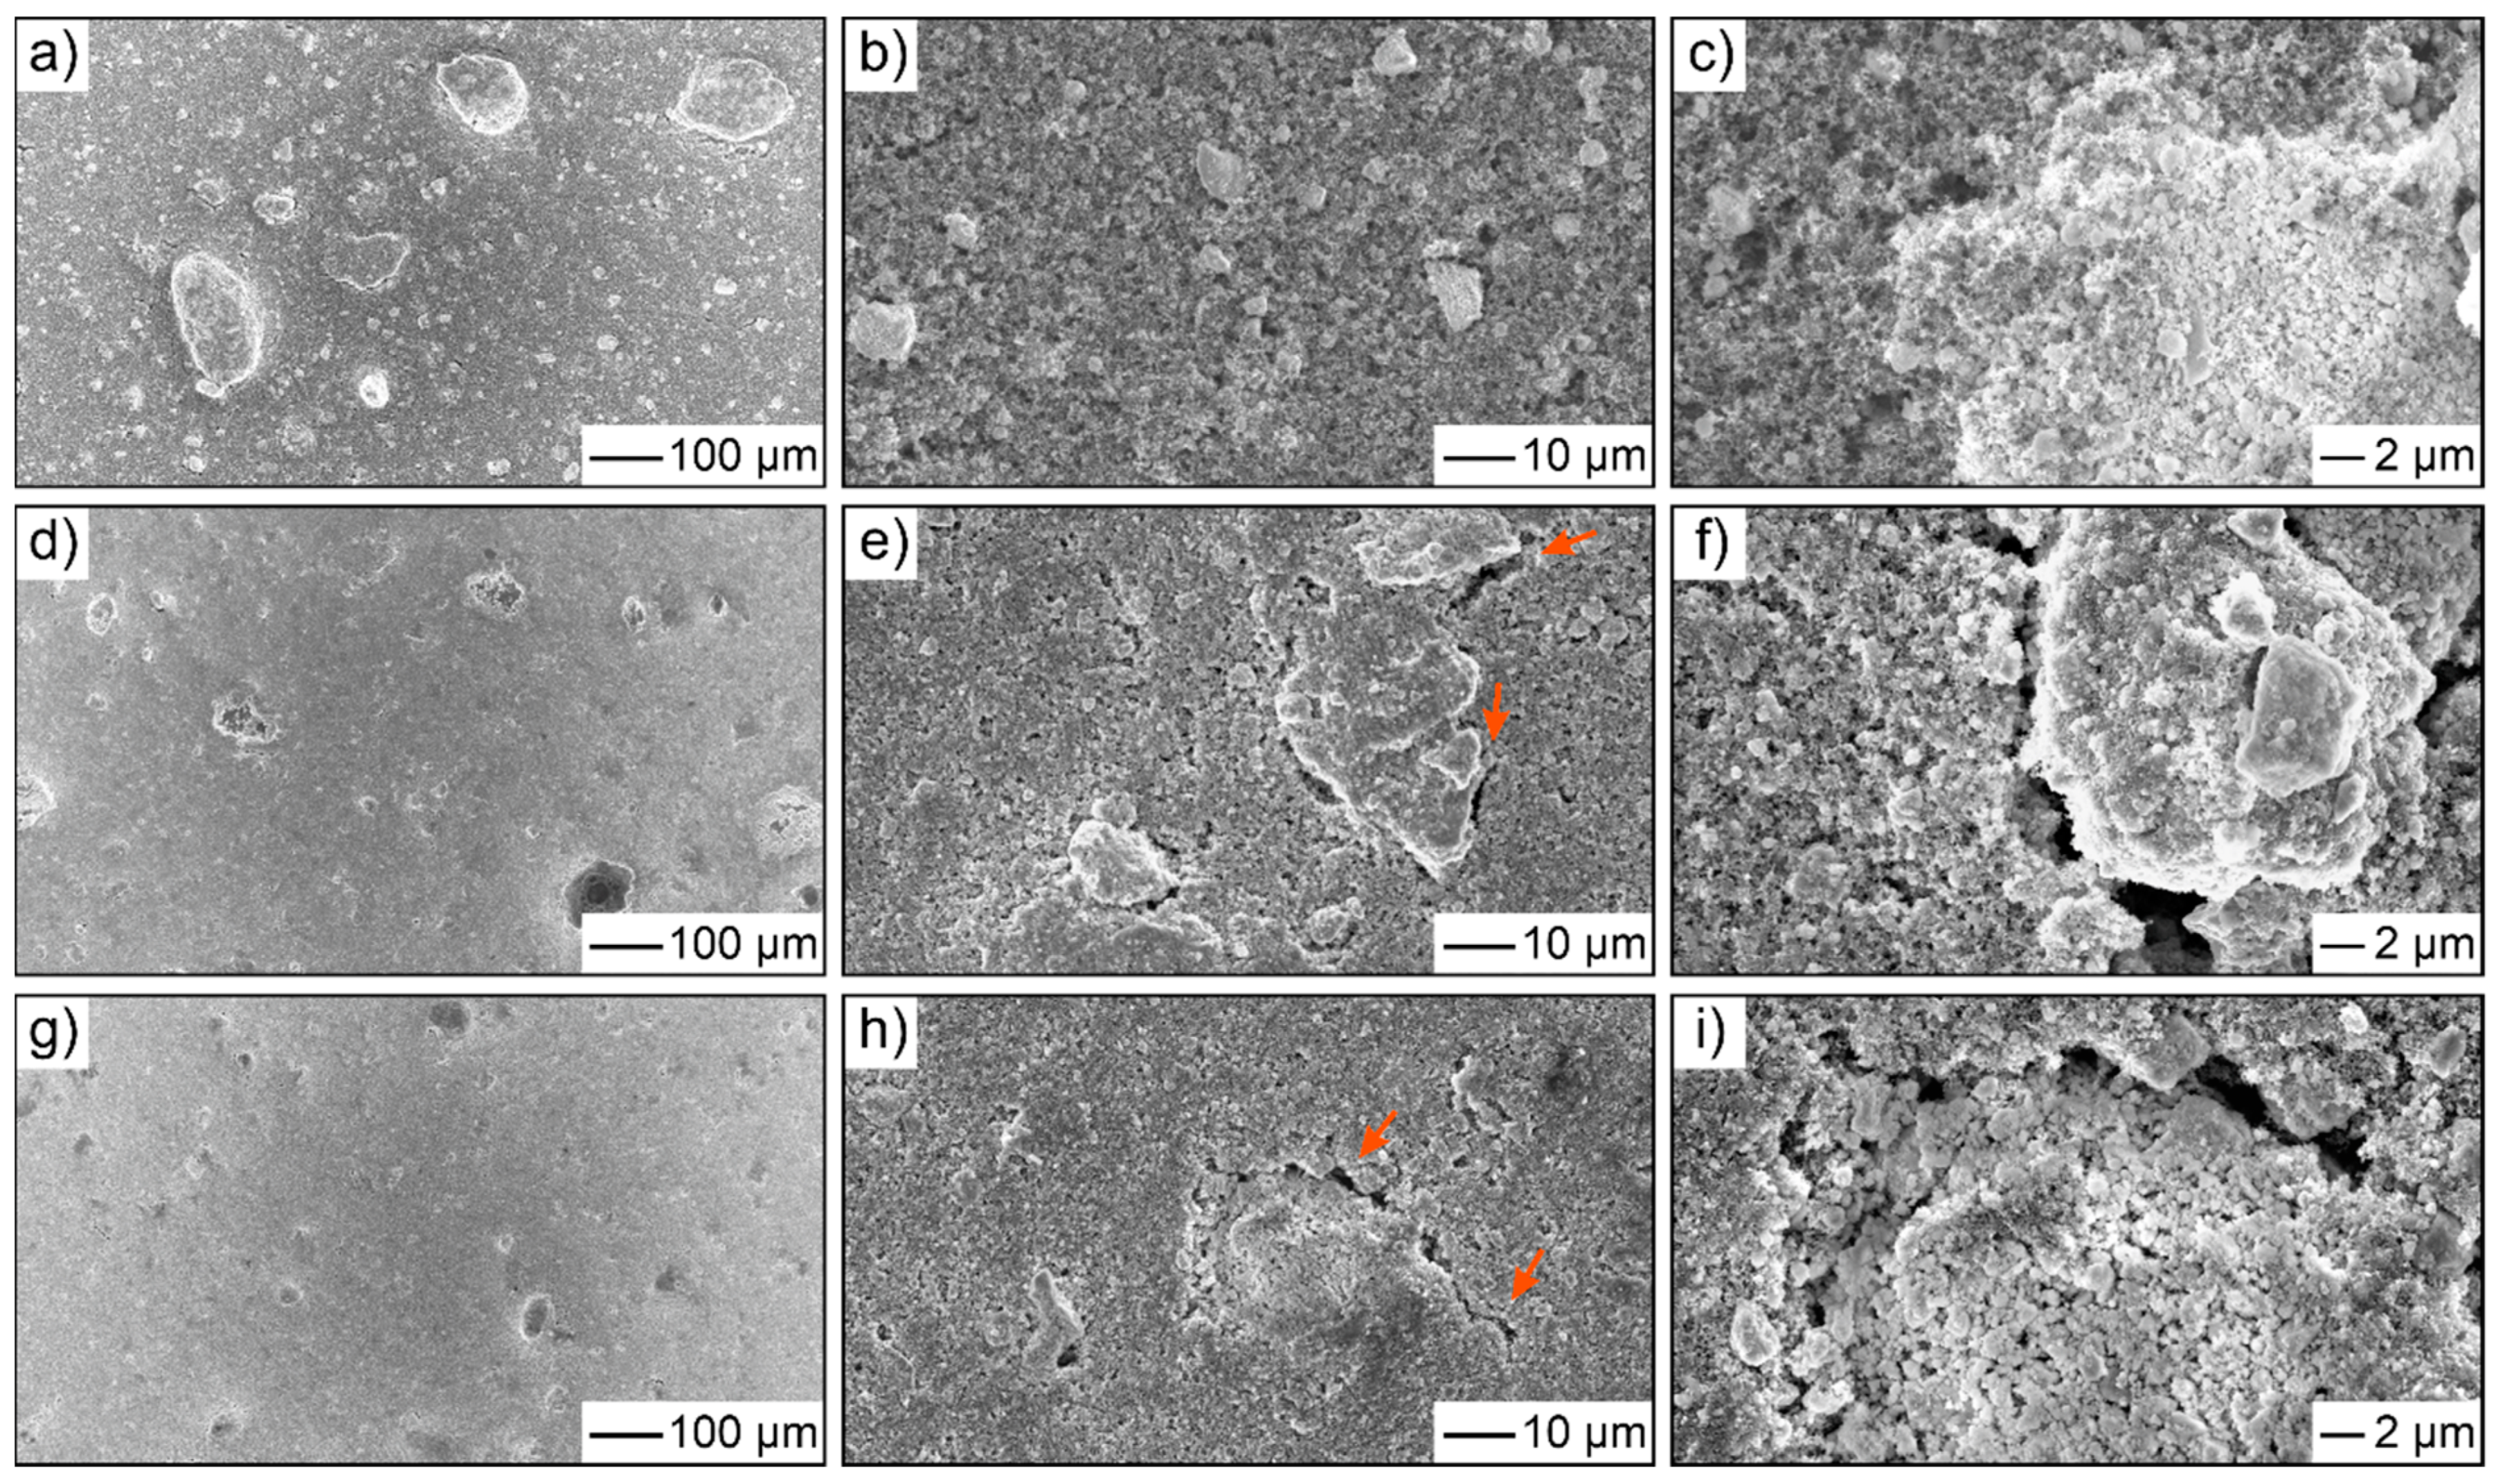
This hypothesis is supported by SEM of the LiHEOF cathodes harvested from the cells charged to different voltages in the initial cycle, see Figure 2a–i and Figure 3a–d. The pristine electrode was virtually crack-free (Figure 2a–c). Apart from that, the presence of (micron-sized) agglomerated LiHEOF particles on the top surface was noted. However, most of the active material was well embedded within the bulk of the electrode, and therefore, could not be visualized by SEM. This makes it difficult to make any general statements about the initial state of the agglomerates. Crack (void) formation was already evident at 3.7 V (Figure 2d–f). We assume that detachment of the agglomerated particles (that were hardly visible in Figure 2d,g) from the surface of the electrode also contributed somewhat to the initial increase in the acoustic activity. Similar processes (e.g., SEI formation, deposition/dissolution of calcium carbonate and sulfur redox (dissolution with polysulfide formation and re-formation upon charging) in lithium-sulfur batteries) have been shown to be acoustically active and detectable using AE technology [17,26,37]. The second stepwise increase in acoustic activity (up to ~4.2 V) was accompanied by further electrode cracking and crack propagation, see Figure 2g–i. In addition, both partial densification of the initially highly porous electrode matrix and breakup of the agglomerates into smaller particles is apparent from the SEM data. Overall, the imaging results suggest that mechanical degradation is mostly responsible for the acoustic activity in this voltage range [38].
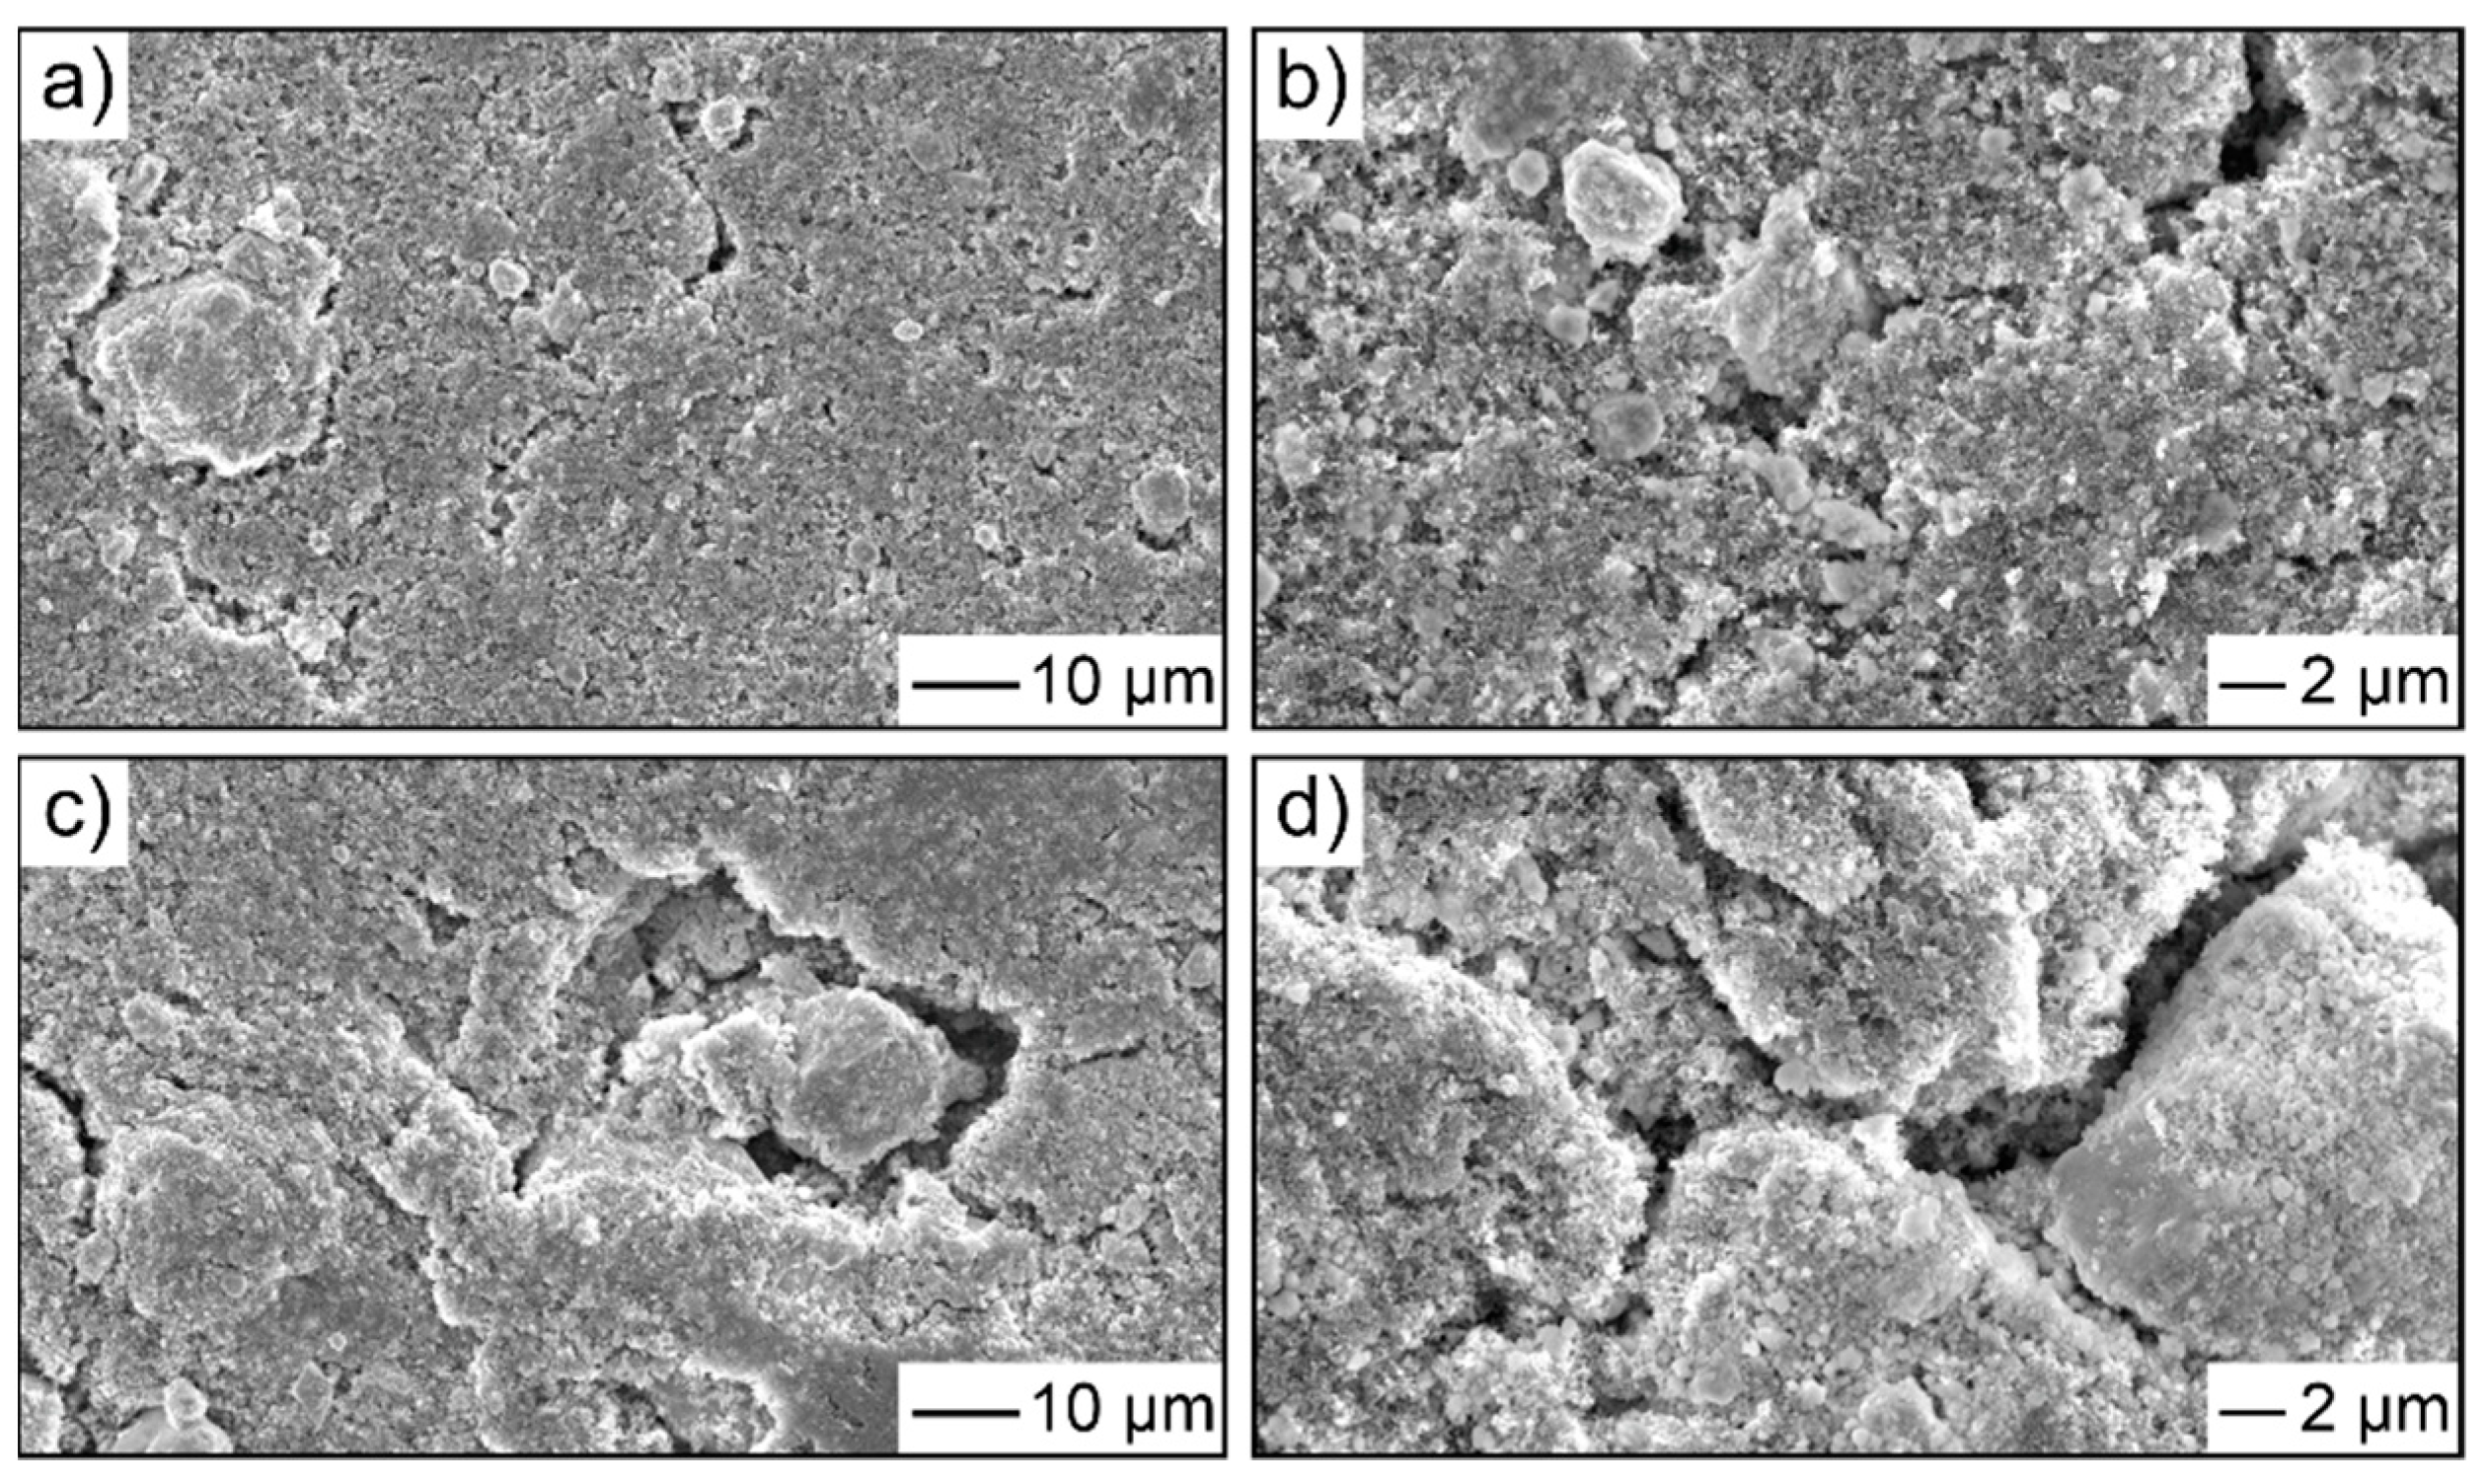
SEM images taken after charging the LiHEOF cathode to 4.6 or 5.0 V show even more pronounced mechanical deformation and void formation, see Figure 3a–d. The loosening of the particle structure with cycling is difficult to assess, as most of the active material was well integrated with the electrode, with few agglomerates present on the surface. In general, the degree of mechanical degradation increased as the cutoff voltage increased, which is also reflected in the AE behavior [20,21,29,30,39]. Note that contact loss between the particles seems to strongly contribute to the capacity decay observed within the first and subsequent cycles.
The formation of the anode/cathode SEI (primarily during the initial charge cycle), an acoustically intense process, could be another source of AE [17,19,20,30,36]. However, in situ gas analysis did not reveal the evolution of specific gaseous species that can be correlated with SEI formation [16]. We therefore assume that it does not contribute much to the initial increase in cumulative AE hits. In addition, the SEM images in Figure 2 and Figure 3 do not show clear signs of cSEI formation. However, the surface layer may be too thin to be visualized by SEM.
Another acoustically intense process that should not be overlooked is the formation and bursting of gas bubbles [40,41,42]. In recent years, it has been shown that the rate of gas evolution can increase considerably with increasing voltage due to chemical/electrochemical electrolyte oxidation [43,44]. In previous studies, we have excluded the effect of gas evolution, since there was no clear correlation with the acoustic activity [30,39,45]. However, the voltage range for gas detection (H2, O2, CO2, CO and POF3) in LiHEOF|Li cells, ranging from 4.55 V (charge) to ~3.7 V (subsequent discharge), coincides with the sharp increase in cumulative AE hits seen in Figure 1c,d [16]. A possible explanation for this could be that the total amount of evolved gas was larger than for the other electrode materials probed before using AE monitoring [35,42,45]. For LiHEOF, the upper cutoff voltage has in fact been shown to have a significant impact on its gassing behavior. Hence, the acoustic activity detected in the initial cycle could result from a combination of outgassing and chemo-mechanical degradation.
The AE behavior (cumulative AE hits and hit rate) in the subsequent cycles was similar for the cells charged to 4.8 or 5.0 V. In both cases, a sudden increase in acoustic activity was observed beyond 4.6 V. However, the 4.8 V cell also showed a steady increase below 4.6 V. Be that as it may, the acoustic activity detected over the whole voltage range was much weaker compared to the first cycle. This indicates that the tendency for particle fracture, electrode cracking, cSEI formation, gas evolution, etc., decreases with an increasing cycle number, which agrees with the trends identified by DEMS and pressure measurements [16]. Note that the cracks that formed during the initial cycle probably affected the propagation of acoustic waves through the electrode, and this can also produce a lower total number of AE signals in the following cycles [20]. The cell cycled between 2.0 and 5.0 V only showed an increase in acoustic activity above 4.6 V (charge) until ~3.6 V (subsequent discharge) from the second cycle onward. After the fourth cycle, hardly any acoustic activity was detected anymore. A different behavior was observed for the 4.6 V cell, which displayed an almost linear increase in cumulative AE hits (featureless hits against time curve). These differences can be explained by the fact that the mechanical degradation and side reactions that occurred during cycling are both dependent upon the cutoff voltage on charge (or SOC).
Since the LiHEOF|Li cells cycled in the voltage range of 2.0–4.6 V and 2.0–4.8 V developed a comparable number of cumulative AE hits after five cycles (616 vs. 723), the mechanical degradation of the two should be similar as well. However, this could not be confirmed by SEM. The results indicated that (i) more cracks were present after the fifth cycle, irrespective of the cutoff voltage, and (ii) the crack (network) formation and propagation were more pronounced for the 4.8 V cell, see Figure S1. In contrast, the cell cycled between 2.0 and 5.0 V revealed almost twice the number of cumulative AE hits and a correspondingly greater tendency towards degradation.
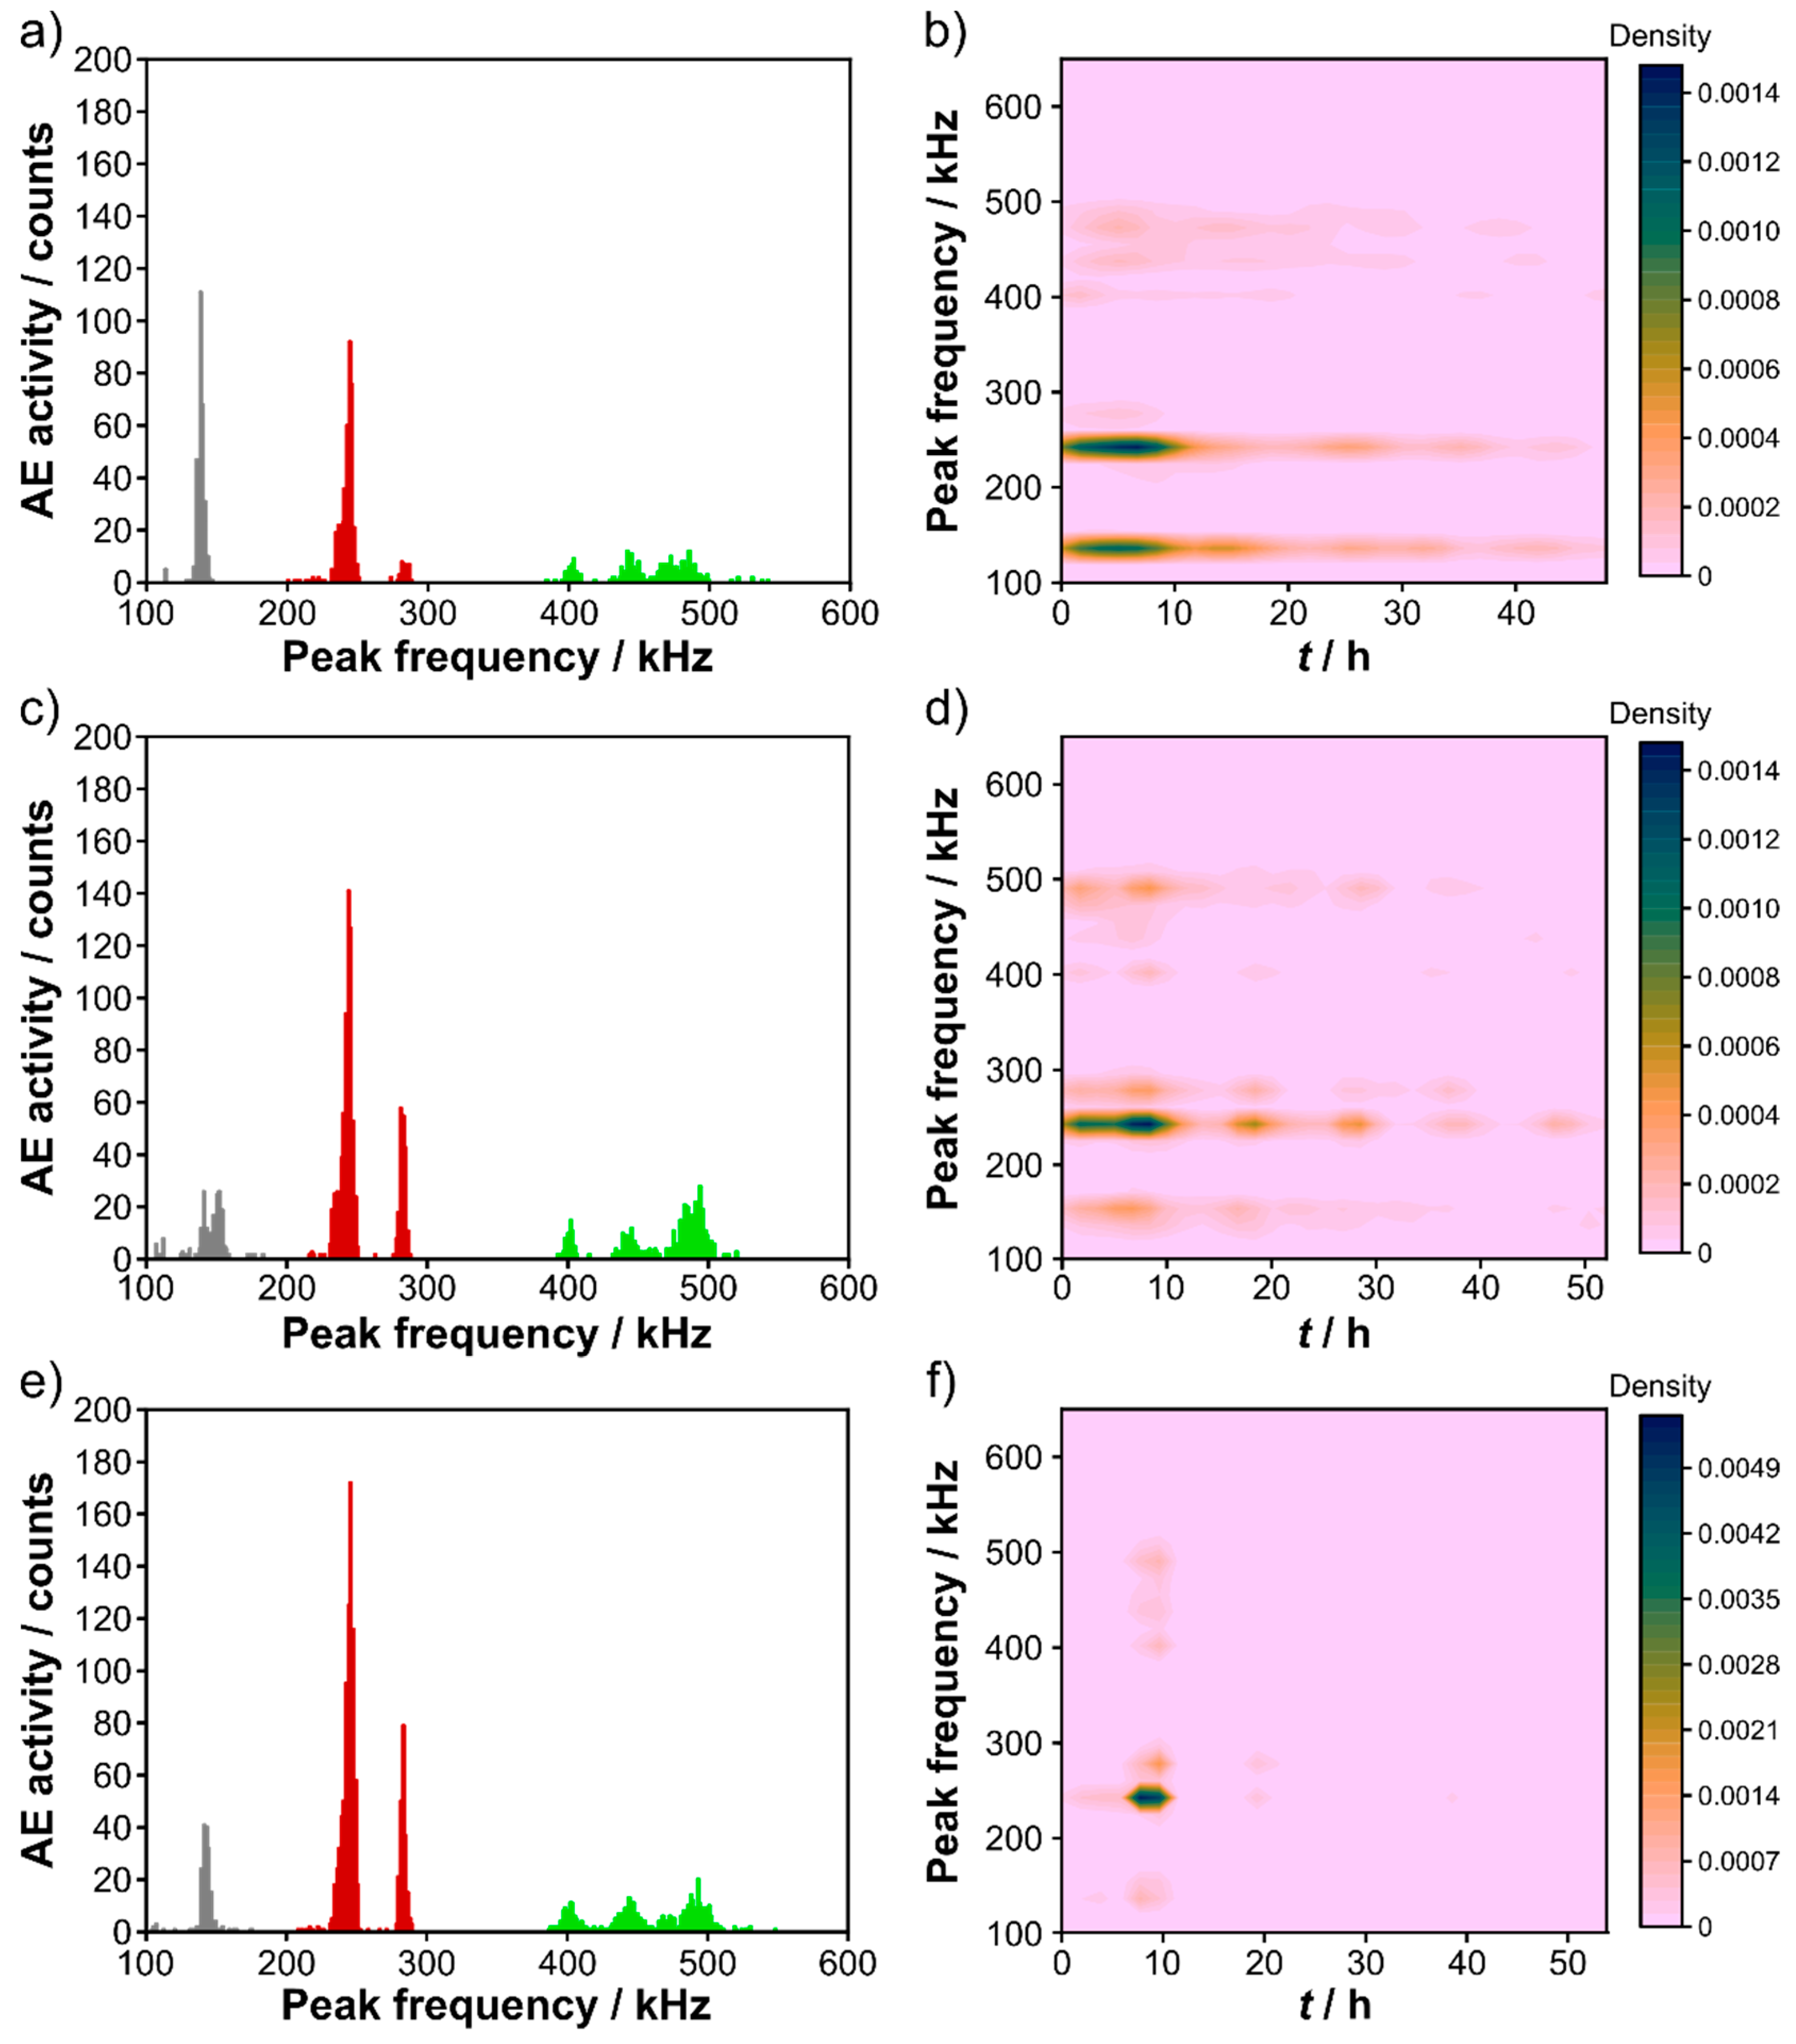
As mentioned earlier, acoustic events can be caused by various processes, including SEI formation, electrolyte decomposition, electrode cracking and restructuring, as well as primary and secondary particle fracturing [17,19,20,21,28,29,30,39]. Each acoustic signal can be described by a number of different parameters, such as rise time, duration, absolute energy, amplitude, peak frequency and so forth [20,29,30,39]. Because the peak frequency was the most distinguishable parameter (see Table S1) in the present work, the AE hits were classified according to their peak frequency. More specifically, the acoustic signals were divided into the following three groups: AE 1 (100–200 kHz); AE 2 (200–300 kHz); AE 3 (300–600 kHz); see Figure 4a–f and Figure S2 and Table S1.
Figure S2 shows the voltage profiles for the LiHEOF|Li cells cycled at 25 °C and C/10 rate between 2.0 V and either 4.6, 4.8 or 5.0 V and the cumulative AE hits for the different peak-frequency ranges. The initial cycle was always found to be the most acoustically intense, with AE 2 contributing strongly, see also Figure 4b,d,f. The proportion of AE 2 events amongst the cumulative hits in the first charge cycle increased significantly as the cutoff voltage increased, from 45% (110 hits) for 4.6 V to 64% (578 hits) for 5.0 V. The proportion of AE 1 and AE 3 signals was similar for all of the cells cycled to the different upper cutoff voltages. The only minor exception concerned AE 1 for the 4.6 V cell, which was slightly larger than for the other cells (see Table S2) for unknown reasons. All peak-frequency clustered signals increased immediately after the onset of charging. Slight differences in the initial increase of AE 1, AE 2 and AE 3 can probably be explained by variations in electrode structure and morphology. The AE 3 signals with the highest mean peak frequency and shortest rise time (and duration) hint at early electrode cracking and/or LiHEOF particle fracture [20,22,25,28,29,30,39]. However, the frequency range was lower than that often associated with micro-cracking (>500 kHz) [20]. Furthermore, no primary particle fracture was evident in the SEM data. Hence, AE 3 appears to be mainly associated with the formation of cracks in the electrode and/or loosening of the LiHEOF particle agglomerates [18,20,25,27,28,29,46]. Based on the SEM results and conclusions drawn in the literature, the AE 2 signals with a lower mean peak frequency and longer rise time (and duration) can be attributed to crack propagation [20,27,39,47]. Regarding AE 1, we assume that these signals are due to some kind of electrode (surface) restructuring during cycling [20,25,28,29]. Previous studies have shown that the peak-frequency range of 100–300 kHz is typical of both mechanical effects and gassing/SEI formation [20,28,29,39]. However, acoustic activity caused by gas evolution is usually characterized by a longer rise time and duration (up to 200 µs) [20,28,48], which was not the case for the AE 1 and AE 2 signals. In addition, the assignment of AE 1 to gas evolution would be questionable, as virtually no further hits were detected after the initial cycle for the 5.0 V cell (in disagreement with previous results from in situ gas analysis) [16]. The same also applies to the AE 2 signals lying at the border between gassing and crack formation/growth [18,20,28,29]. However, the effect of gas evolution, although somewhat ambiguous, cannot be ruled out. Overall, we assume that the lower frequency signals are indicative of mechanical degradation (reflected in the formation and propagation of cracks in the electrode).
This is further highlighted by the contour plots of hit density against time and peak frequency shown in Figure 4b,d,f and Figure S2. The mechanical degradation seen at the beginning of cycling was more severe for the higher upper cutoff voltages. However, for the 5.0 V cell, this quickly leveled off. By contrast, the 4.6 V cell displayed continuous degradation with cycling. Thus, it seems that the maximum degradation converges towards a certain limit. Nevertheless, this hypothesis requires further study (e.g., long-term AE measurements conducted on the LiHEOF cathode), which is beyond the scope of this work.
In summary, the cutoff voltage on charge was found to strongly affect the mechanical degradation of the LiHEOF cathode, showing increased cracking susceptibility and pulverization of the particle agglomerates. This can probably be attributed in part to the strong gas evolution, occurring primarily on the free surface of the active material in the electrode, and to the volume changes that occurred during battery operation.
4. Conclusions
Using operando AE monitoring, the effect of the upper cutoff voltage on the degradation of a LiHEOF cathode was studied in real time. Peak-frequency independent acoustic activity was detected immediately after the onset of charging (Li+ extraction). For E > 4.6 V vs. Li+/Li, a sharp increase in cumulative AE hits was found, which appears to result from chemo-mechanical degradation and gas evolution. In general, most of the acoustic activity occurred in the voltage range between 4.6 V (charge) and 3.7 V (subsequent discharge). After the initial cycle, a different behavior was observed, depending on the cutoff voltage. Peak-frequency analysis and ex situ SEM imaging indicated that the acoustic activity can be mainly attributed to the formation and propagation of cracks in the electrode. Apart from that, the lack of primary particle fracturing, and the associated AE signals (>500 kHz), confirmed the potential of LiHEOF as a next-generation battery material. Overall, AE monitoring provided new insights on the behavior of a promising high-entropy oxyfluoride rock-salt cathode system during electrochemical cycling.
In general, application of this non-destructive method to the study of commercial battery cells or modules for health monitoring seems feasible. However, clear signal assignment would require thorough pre-characterization by other techniques.
Supplementary Materials
The following supporting information can be downloaded at: https://www.mdpi.com/article/10.3390/coatings12030402/s1, Figure S1: Top-view SEM images at different magnifications of the LiHEOF cathode charged to different cutoff voltages; Figure S2: Voltage profile of cells cycled at 25 °C and C/10 rate and corresponding cumulative AE hits for different peak frequency ranges and contour plots of hit density versus the time and peak frequency (from the second cycle onward); Table S1: Mean values of characteristic parameters for the AE 1, AE 2 and AE 3 signals detected over the first five cycles; Table S2: Proportion of cumulative hits detected during the first charge cycle.
Author Contributions
Conceptualization, S.S., B.B. and T.B.; formal analysis, S.S. and S.L.D.; investigation, S.S. and S.L.D.; project administration, T.B.; writing—original draft, S.S.; writing—review & editing, S.L.D., B.B. and T.B. All authors have read and agreed to the published version of the manuscript.
Funding
This research received no external funding.
Institutional Review Board Statement
Not applicable.
Informed Consent Statement
Not applicable.
Data Availability Statement
The datasets generated and/or analyzed during the current study are available from the corresponding author on reasonable request.
Conflicts of Interest
The authors declare no conflict of interest.
References
- Sarkar, A.; Velasco, L.; Wang, D.; Wang, Q.; Talasila, G.; de Biasi, L.; Kübel, C.; Brezesinski, T.; Bhattacharya, S.S.; Hahn, H.; et al. High Entropy Oxides for Reversible Energy Storage. Nat. Commun. 2018, 9, 3400. [Google Scholar] [CrossRef] [PubMed] [Green Version]
- Zhao, C.; Ding, F.; Lu, Y.; Chen, L.; Hu, Y.-S. High-Entropy Layered Oxide Cathodes for Sodium-Ion Batteries. Angew. Chem. Int. Ed. 2020, 59, 264–269. [Google Scholar] [CrossRef] [Green Version]
- Wang, J.; Cui, Y.; Wang, Q.; Wang, K.; Huang, X.; Stenzel, D.; Sarkar, A.; Azmi, R.; Bergfeldt, T.; Bhattacharya, S.S.; et al. Lithium Containing Layered High Entropy Oxide Structures. Sci. Rep. 2020, 10, 18430. [Google Scholar] [CrossRef] [PubMed]
- Lun, Z.; Ouyang, B.; Kwon, D.-H.; Ha, Y.; Foley, E.E.; Huang, T.-Y.; Cai, Z.; Kim, H.; Balasubramanian, M.; Sun, Y.; et al. Cation-Disordered Rocksalt-Type High-Entropy Cathodes for Li-Ion Batteries. Nat. Mater. 2020, 20, 214–221. [Google Scholar] [CrossRef] [PubMed]
- Ma, Y.; Ma, Y.; Wang, Q.; Schweidler, S.; Botros, M.; Fu, T.; Hahn, H.; Brezesinski, T.; Breitung, B. High-Entropy Energy Materials: Challenges and New Opportunities. Energy Environ. Sci. 2021, 14, 2883–2905. [Google Scholar] [CrossRef]
- Ma, Y.; Ma, Y.; Dreyer, S.L.; Wang, Q.; Wang, K.; Goonetilleke, D.; Omar, A.; Mikhailova, D.; Hahn, H.; Breitung, B.; et al. High-Entropy Metal–Organic Frameworks for Highly Reversible Sodium Storage. Adv. Mater. 2021, 33, 2101342. [Google Scholar] [CrossRef]
- Rost, C.M.; Sachet, E.; Borman, T.; Moballegh, A.; Dickey, E.C.; Hou, D.; Jones, J.L.; Curtarolo, S.; Maria, J.-P. Entropy-Stabilized Oxides. Nat. Commun. 2015, 6, 8485. [Google Scholar] [CrossRef] [Green Version]
- Yeh, J.-W. Alloy Design Strategies and Future Trends in High-Entropy Alloys. JOM 2013, 65, 1759–1771. [Google Scholar] [CrossRef]
- Zhang, R.-Z.; Gucci, F.; Zhu, H.; Chen, K.; Reece, M.J. Data-Driven Design of Ecofriendly Thermoelectric High-Entropy Sulfides. Inorg. Chem. 2018, 57, 13027–13033. [Google Scholar] [CrossRef] [Green Version]
- Jin, T.; Sang, X.; Unocic, R.R.; Kinch, R.T.; Liu, X.; Hu, J.; Liu, H.; Dai, S. Mechanochemical-Assisted Synthesis of High-Entropy Metal Nitride via a Soft Urea Strategy. Adv. Mater. 2018, 30, 1707512. [Google Scholar] [CrossRef]
- Sarker, P.; Harrington, T.; Toher, C.; Oses, C.; Samiee, M.; Maria, J.-P.; Brenner, D.W.; Vecchio, K.S.; Curtarolo, S. High-Entropy High-Hardness Metal Carbides Discovered by Entropy Descriptors. Nat. Commun. 2018, 9, 4980. [Google Scholar] [CrossRef] [PubMed] [Green Version]
- Gild, J.; Braun, J.; Kaufmann, K.; Marin, E.; Harrington, T.; Hopkins, P.; Vecchio, K.; Luo, J. A High-Entropy Silicide: (Mo0.2Nb0.2Ta0.2Ti0.2W0.2)Si2. J. Mater. 2019, 5, 337–343. [Google Scholar] [CrossRef]
- Zhai, S.; Rojas, J.; Ahlborg, N.; Lim, K.; Toney, M.F.; Jin, H.; Chueh, W.C.; Majumdar, A. The Use of Poly-Cation Oxides to Lower the Temperature of Two-Step Thermochemical Water Splitting. Energy Environ. Sci. 2018, 11, 2172–2178. [Google Scholar] [CrossRef]
- Wang, Q.; Sarkar, A.; Wang, D.; Velasco, L.; Azmi, R.; Bhattacharya, S.S.; Bergfeldt, T.; Düvel, A.; Heitjans, P.; Brezesinski, T.; et al. Multi-Anionic and -Cationic Compounds: New High Entropy Materials for Advanced Li-Ion Batteries. Energy Environ. Sci. 2019, 12, 2433–2442. [Google Scholar] [CrossRef] [Green Version]
- Strauss, F.; Lin, J.; Duffiet, M.; Wang, K.; Zinkevich, T.; Hansen, A.-L.; Indris, S.; Brezesinski, T. High-Entropy Polyanionic Lithium Superionic Conductors. ACS Mater. Lett. 2022, 4, 418–423. [Google Scholar] [CrossRef]
- Breitung, B.; Wang, Q.; Schiele, A.; Tripković, Đ.; Sarkar, A.; Velasco, L.; Wang, D.; Bhattacharya, S.S.; Hahn, H.; Brezesinski, T. Gassing Behavior of High-Entropy Oxide Anode and Oxyfluoride Cathode Probed Using Differential Electrochemical Mass Spectrometry. Batter. Supercaps 2020, 3, 361–369. [Google Scholar] [CrossRef]
- Kircheva, N.; Genies, S.; Brun-Buisson, D.; Thivel, P.-X. Study of Solid Electrolyte Interface Formation and Lithium Intercalation in Li-Ion Batteries by Acoustic Emission. J. Electrochem. Soc. 2012, 159, A18–A25. [Google Scholar] [CrossRef]
- Choe, C.-Y.; Jung, W.-S.; Byeon, J.-W. Damage Evaluation in Lithium Cobalt Oxide/Carbon Electrodes of Secondary Battery by Acoustic Emission Monitoring. Mater. Trans. 2015, 56, 269–273. [Google Scholar] [CrossRef] [Green Version]
- Villevieille, C.; Boinet, M.; Monconduit, L. Direct Evidence of Morphological Changes in Conversion Type Electrodes in Li-Ion Battery by Acoustic Emission. Electrochem. Commun. 2010, 12, 1336–1339. [Google Scholar] [CrossRef]
- Tranchot, A.; Etiemble, A.; Thivel, P.-X.; Idrissi, H.; Roué, L. In-Situ Acoustic Emission Study of Si-Based Electrodes for Li-Ion Batteries. J. Power Sources 2015, 279, 259–266. [Google Scholar] [CrossRef]
- Tranchot, A.; Idrissi, H.; Thivel, P.-X.; Roué, L. Influence of the Si Particle Size on the Mechanical Stability of Si-Based Electrodes Evaluated by In-Operando Dilatometry and Acoustic Emission. J. Power Sources 2016, 330, 253–260. [Google Scholar] [CrossRef]
- Etiemble, A.; Idrissi, H.; Meille, S.; Roué, L. In Situ Investigation of the Volume Change and Pulverization of Hydride Materials for Ni-MH Batteries by Concomitant Generated Force and Acoustic Emission Measurements. J. Power Sources 2012, 205, 500–505. [Google Scholar] [CrossRef]
- Rhodes, K.; Dudney, N.; Lara-Curzio, E.; Daniel, C. Understanding the Degradation of Silicon Electrodes for Lithium-Ion Batteries Using Acoustic Emission. J. Electrochem. Soc. 2010, 157, A1354–A1360. [Google Scholar] [CrossRef]
- Kalnaus, S.; Rhodes, K.; Daniel, C. A Study of Lithium Ion Intercalation Induced Fracture of Silicon Particles Used as Anode Material in Li-Ion Battery. J. Power Sources 2011, 196, 8116–8124. [Google Scholar] [CrossRef]
- Etiemble, A.; Bernard, P.; Idrissi, H.; Roué, L. New Insights into the Pulverization of LaNi5-Based Alloys with Different Co Contents from Electrochemical Acoustic Emission Measurements. Electrochim. Acta 2015, 186, 112–116. [Google Scholar] [CrossRef]
- Ramadan, S.; Idrissi, H. In Situ Monitoring of Deposition and Dissolution of Calcium Carbonate by Acoustic Emission Techniques Associated to Electrochemical Measurements. Desalination 2008, 219, 358–366. [Google Scholar] [CrossRef]
- Didier-Laurent, S.; Idrissi, H.; Roué, L. In-Situ Study of the Cracking of Metal Hydride Electrodes by Acoustic Emission Technique. J. Power Sources 2008, 179, 412–416. [Google Scholar] [CrossRef]
- Etiemble, A.; Idrissi, H.; Roué, L. On the Decrepitation Mechanism of MgNi and LaNi5-Based Electrodes Studied by in Situ Acoustic Emission. J. Power Sources 2011, 196, 5168–5173. [Google Scholar] [CrossRef]
- Kircheva, N.; Genies, S.; Chabrol, C.; Thivel, P.-X. Evaluation of Acoustic Emission as a Suitable Tool for Aging Characterization of LiAl/LiMnO2 Cell. Electrochim. Acta 2013, 88, 488–494. [Google Scholar] [CrossRef]
- Schweidler, S.; Bianchini, M.; Hartmann, P.; Brezesinski, T.; Janek, J. The Sound of Batteries: An Operando Acoustic Emission Study of the LiNiO2 Cathode in Li-Ion Cells. Batter. Supercaps 2020, 3, 1021–1027. [Google Scholar] [CrossRef]
- Etiemble, A.; Idrissi, H.; Roue, L. On the Use of the Acoustic Emission Technique for In-Situ Monitoring of the Pulverization of Battery Electrodes. J. Acoust. Emiss. 2012, 30, 54–64. [Google Scholar]
- Sarkar, A.; Djenadic, R.; Usharani, N.J.; Sanghvi, K.P.; Chakravadhanula, V.S.K.; Gandhi, A.S.; Hahn, H.; Bhattacharya, S.S. Nanocrystalline Multicomponent Entropy Stabilised Transition Metal Oxides. J. Eur. Ceram. Soc. 2017, 37, 747–754. [Google Scholar] [CrossRef]
- Hsu, N.N. Acoustic Emissions Simulator. U.S. Patent 4018084 A, 19 April 1977. [Google Scholar]
- Schweidler, S.; de Biasi, L.; Schiele, A.; Hartmann, P.; Brezesinski, T.; Janek, J. Volume Changes of Graphite Anodes Revisited: A Combined Operando X-ray Diffraction and In Situ Pressure Analysis Study. J. Phys. Chem. C 2018, 122, 8829–8835. [Google Scholar] [CrossRef]
- de Biasi, L.; Schiele, A.; Roca-Ayats, M.; Garcia, G.; Brezesinski, T.; Hartmann, P.; Janek, J. Phase Transformation Behavior and Stability of LiNiO2 Cathode Material for Li-Ion Batteries Obtained from In Situ Gas Analysis and Operando X-ray Diffraction. ChemSusChem 2019, 12, 2240–2250. [Google Scholar] [CrossRef]
- Kircheva, N.; Thivel, P.-X.; Genies, S.; Brun-Buisson, D.; Bultel, Y. Study of SEI Formation in Li-Ion Batteries by Acoustic Emission Technique. ECS Trans. 2011, 35, 19–26. [Google Scholar] [CrossRef]
- Lemarié, Q.; Alloin, F.; Thivel, P.X.; Idrissi, H.; Roué, L. Study of Sulfur-Based Electrodes by Operando Acoustic Emission. Electrochim. Acta 2019, 299, 415–422. [Google Scholar] [CrossRef]
- Barai, P.; Mukherjee, P.P. Mechano-Electrochemical Model for Acoustic Emission Characterization in Intercalation Electrodes. J. Electrochem. Soc. 2014, 161, F3123–F3136. [Google Scholar] [CrossRef]
- Schweidler, S.; Dreyer, S.L.; Breitung, B.; Brezesinski, T. Operando Acoustic Emission Monitoring of Degradation Processes in Lithium-Ion Batteries with a High-Entropy Oxide Anode. Sci. Rep. 2021, 11, 23381. [Google Scholar] [CrossRef]
- Renfrew, S.E.; McCloskey, B.D. Residual Lithium Carbonate Predominantly Accounts for First Cycle CO2 and CO Outgassing of Li-Stoichiometric and Li-Rich Layered Transition-Metal Oxides. J. Am. Chem. Soc. 2017, 139, 17853–17860. [Google Scholar] [CrossRef]
- Schiele, A.; Hatsukade, T.; Berkes, B.B.; Hartmann, P.; Brezesinski, T.; Janek, J. High-Throughput In Situ Pressure Analysis of Lithium-Ion Batteries. Anal. Chem. 2017, 89, 8122–8128. [Google Scholar] [CrossRef]
- Hatsukade, T.; Schiele, A.; Hartmann, P.; Brezesinski, T.; Janek, J. Origin of Carbon Dioxide Evolved during Cycling of Nickel-Rich Layered NCM Cathodes. ACS Appl. Mater. Interfaces 2018, 10, 38892–38899. [Google Scholar] [CrossRef]
- Rowden, B.; Garcia-Araez, N. A Review of Gas Evolution in Lithium Ion Batteries. Energy Rep. 2020, 6, 10–18. [Google Scholar] [CrossRef]
- Laszczynski, N.; Solchenbach, S.; Gasteiger, H.A.; Lucht, B.L. Understanding Electrolyte Decomposition of Graphite/NCM811 Cells at Elevated Operating Voltage. J. Electrochem. Soc. 2019, 166, A1853–A1859. [Google Scholar] [CrossRef]
- Schiele, A.; Breitung, B.; Mazilkin, A.; Schweidler, S.; Janek, J.; Gumbel, S.; Fleischmann, S.; Burakowska-Meise, E.; Sommer, H.; Brezesinski, T. Silicon Nanoparticles with a Polymer-Derived Carbon Shell for Improved Lithium-Ion Batteries: Investigation into Volume Expansion, Gas Evolution, and Particle Fracture. ACS Omega 2018, 3, 16706–16713. [Google Scholar] [CrossRef] [PubMed]
- Pomponi, E.; Vinogradov, A. A Real-Time Approach to Acoustic Emission Clustering. Mech. Syst. Signal Process. 2013, 40, 791–804. [Google Scholar] [CrossRef]
- Inoue, H.; Tsuzuki, R.; Nohara, S.; Iwakura, C. In Situ Monitoring of Hydrogen Storage Alloy Negative Electrode during Charging by an Acoustic Emission Technique. Electrochem. Solid State Lett. 2006, 9, A504–A506. [Google Scholar] [CrossRef]
- Matsuo, T.; Uchida, M.; Cho, H. Development of Acoustic Emission Clustering Method to Detect Degradation of Lithium Ion Batteries. J. Solid Mech. Mater. Eng. 2011, 5, 678–689. [Google Scholar] [CrossRef] [Green Version]
Figure 1.
(a) Specific charge capacity against cycle number for LiHEOF|Li cells cycled at 25 °C and C/10 rate between 2.0 V and either 4.6, 4.8 or 5.0 V vs. Li+/Li. (b–d) Voltage profiles (black) and corresponding cumulative AE hits (blue) and hit rates (red) for (b) 2.0–4.6 V, (c) 2.0–4.8 V and (d) 2.0–5.0 V vs. Li+/Li.

Figure 2.
Top-view SEM images at different magnifications of the LiHEOF cathode (a–c) before cycling, (d–f) at 3.7 V and (g–i) at 4.2 V vs. Li+/Li in the initial charge cycle. The arrows indicate void formation and electrode cracking.
Figure 2.
Top-view SEM images at different magnifications of the LiHEOF cathode (a–c) before cycling, (d–f) at 3.7 V and (g–i) at 4.2 V vs. Li+/Li in the initial charge cycle. The arrows indicate void formation and electrode cracking.

Figure 3.
Top-view SEM images at different magnifications of the LiHEOF cathode charged to (a,b) 4.6 V and (c,d) 5.0 V vs. Li+/Li in the initial cycle.
Figure 3.
Top-view SEM images at different magnifications of the LiHEOF cathode charged to (a,b) 4.6 V and (c,d) 5.0 V vs. Li+/Li in the initial cycle.

Figure 4.
(a,c,e) Peak-frequency histograms of the AE signals (AE 1 = 100–200 kHz in gray, AE 2 = 200–300 kHz in red and AE 3 = 300–600 kHz in green) detected over the first five cycles in LiHEOF|Li cells cycled at 25 °C and C/10 rate and (b,d,f) corresponding contour plots of the hit density versus the time and peak frequency. (a,b) 2.0–4.6 V, (c,d) 2.0–4.8 V and (e,f) 2.0–5.0 V vs. Li+/Li.

Publisher’s Note: MDPI stays neutral with regard to jurisdictional claims in published maps and institutional affiliations. |
© 2022 by the authors. Licensee MDPI, Basel, Switzerland. This article is an open access article distributed under the terms and conditions of the Creative Commons Attribution (CC BY) license (https://creativecommons.org/licenses/by/4.0/).
Share and Cite
MDPI and ACS Style
Schweidler, S.; Dreyer, S.L.; Breitung, B.; Brezesinski, T. Acoustic Emission Monitoring of High-Entropy Oxyfluoride Rock-Salt Cathodes during Battery Operation. Coatings 2022, 12, 402. https://doi.org/10.3390/coatings12030402
AMA Style
Schweidler S, Dreyer SL, Breitung B, Brezesinski T. Acoustic Emission Monitoring of High-Entropy Oxyfluoride Rock-Salt Cathodes during Battery Operation. Coatings. 2022; 12(3):402. https://doi.org/10.3390/coatings12030402
Chicago/Turabian StyleSchweidler, Simon, Sören L. Dreyer, Ben Breitung, and Torsten Brezesinski. 2022. "Acoustic Emission Monitoring of High-Entropy Oxyfluoride Rock-Salt Cathodes during Battery Operation" Coatings 12, no. 3: 402. https://doi.org/10.3390/coatings12030402
Note that from the first issue of 2016, this journal uses article numbers instead of page numbers. See further details here.