Review

High Entropy Alloys Coatings Deposited by Laser Cladding: A Review of Grain Boundary Wetting Phenomena

1
Osipyan Institute of Solid State Physics of the Russian Academy of Sciences, 142432 Chernogolovka, Russia
2
Chernogolovka Scientific Center of the Russian Academy of Sciences, 142432 Chernogolovka, Russia
3
Department of Materials Science and Engineering, Technion—Israel Institute of Technology, Haifa 3200003, Israel
4
Institute of Solid State Physics, University of Latvia, LV-1063 Riga, Latvia
5
Physics Department, University of the Basque Country UPV/EHU, 48940 Leioa, Spain
6
Institute of Metallurgy and Materials Science, Polish Academy of Sciences, 30059 Cracow, Poland
*
Author to whom correspondence should be addressed.
Coatings 2022, 12(3), 343; https://doi.org/10.3390/coatings12030343
Submission received: 27 December 2021 / Revised: 27 February 2022 / Accepted: 1 March 2022 / Published: 6 March 2022
(This article belongs to the Special Issue Laser Processing Effects on Special Steels and High Entropy Alloys)

Abstract

:
High-entropy alloys (HEAs) are called also alloys without a main component or multiprincipal alloys. They consist of five, six or more components in more or less equal proportions and possess unique properties. Several dozens of thousands of publications have already been devoted to bulk HEAs, while HEA coatings are just beginning to develop. More than half of the works on the deposition of HEA coatings are devoted to laser cladding. In the laser cladding process, a mixture of powders on a substrate is melted in a focused laser beam, which sequentially scans the substrate. In the heated zone, the powder mixture melts. At the end of the crystallization process, a solidified polycrystal and a small amount of residual melt are found in the heated zone. It is possible that the grain boundaries (GBs) in the solidified polycrystal are incompletely or fully wetted by this liquid phase. In this way, the GB wetting with a melt determines the morphology and microstructure of HEAs coatings. This review analyzes GB wetting in single-phase HEAs, as well as in HEAs containing two or more phases. We analyze how the HEAs’ composition, laser scanning speed, laser beam power, external magnetic field or ultrasonic impact affect the microstructure and GB wetting. It is also shown how the microstructure and GB wetting change over the thickness of the rather thick as well as multilayer coatings deposited using a laser cladding.

1. Introduction

Laser cladding is a modern coating technology for surface strengthening and repair [1]. The powder of a cladding material rapidly melts and solidifies under the laser irradiation. Due to the high temperature gradient, the tough and fine-grained coating forms on the substrate with a good metallurgical bond with it. The most frequently used laser cladding schemes are the coaxial and preplaced powder systems (see schemes in Figure 1). In the first variant the laser beam irradiates the surface of the substrate. As a result it forms a liquid melt pool. The pressure of a carrier gas in the nozzle ejects the powder to be melted from this nozzle to the liquid melt pool. The laser beam melts the powder into a cladding layer. The laser beam moves synchronously with the powder feeding nozzle and scans the substrate “line-by-line”. The second case is a preplaced powder system. In this system the substrate is already covered by the cladding material. The laser beam scans the preplaced powder. It melts and rapidly cools down, thus forming a cladding layer. The coated sample usually contains the following four zones: zone of cladding (CZ), zone of interface (IZ), zone influenced by the heating (HAZ) and the substrate zone (SUB).
The idea of high entropy alloys (HEAs) or alloys without main component or multiprincipal alloys has been first proposed by Prof. Brian Cantor with coworkers from the University of Oxford [2] and Prof. Jien-Wei Yeh with his team from NTHU, Taiwan [3]. They checked numerous alloys with 6 to 12 and more components in equiatomic proportions and discovered many compositions where the uniform disordered solid solution is formed. It was the astonishing and fully counter-intuitive discovery. It is because such alloys containing a high number of different elements in more or less equal amounts have a high mixing entropy. This fact would lead, generally speaking, to amorphization. Nevertheless, the novel HEAs have high hardness [4,5] and a reasonable strength at high temperatures [6]; they can also possess excellent oxidation [7], wear [8], and corrosion resistance [9]. The idea soon appeared of depositing coatings of HEAs on the surface of the usual materials. This gives the possibility to combine in such a way the advantages of coatings and substrates. Recently, the focus of interest in HEA investigations shifted from one-phase homogeneous solid solutions to heterogeneous HEAs containing more that one phase, the inhomogeneous distribution of components and other elements of inhomogeneity. Frequently, such non-homogeneous structures can be successfully explained based on the concept of grain boundary (GB) phase transformations. The GB phase transformations include GB wetting by a second liquid or solid phase, and also formation of different thin GB phases [10,11,12,13].
Laser cladding is the most frequently used technology for the manufacturing of HEA coatings [14,15,16]. HEA coatings can also be deposited by plasma cladding [17,18], plasma spray [19,20,21,22,23,24,25,26], thermal spray [27], magnetron sputtering [28,29,30,31,32,33,34,35,36,37], electric arc deposition [38], electron beam physical vapor deposition [39], and vacuum arc deposition [40,41,42,43,44]. The solidification of melted pool during laser cladding and the resulting microstructure can be strongly affected by complete or incomplete GB wetting. GB wetting phenomena caused by laser cladding of HEA coatings is the topic of this review. GB wetting phenomena in other HEA coatings will be discussed elsewhere.

2. Grain Boundary Wetting Phase Transitions

Usually, HEAs contain at least five different components, and respective equilibrium phase diagrams should be constructed in at least 5 dimensions. Nevertheless, we can discuss the most important features of GB wetting phase transitions [45] using the simplest two-dimensional scheme for binary alloys. Such a schematic phase diagram for two components in the system is shown in Figure 2. Bold lines for the bulk phase transitions are liquidus, solidus, solvus and eutectic line. Thin lines at Twmin and Twmax show the tie-lines of the GB transitions. During the cooling, the alloy is first in the liquid area L and then crosses the liquidus line, entering the L + α two-phase area. In this L+α, the liquid phase, L, is in equilibrium with the solid phase, α (strictly speaking it is the solid solution based on component A). By decreasing temperature, the portion of melt L decreases and that of solid solution α increases. The composition of solidifying α-phase follows the solidus line. It means that the first portions of α-phase are free from component B, and afterwards the concentration of B increases. If the concentration of B is low (see lines a,b,c,d in Figure 3e), the solidification finishes at the solidus line. As a result the solid alloy contains only α-phase, but the last solidified portions are enriched by the component B.
In multicomponent HEAs, the GB wetting transitions are not so simple. For example, if HEA contains six components it needs for its description the phase diagram in six dimensions. In such a case an alloy starting to solidify by cooling from the melt, L, may intersect several multiphase areas (and not just one two-phase region, α + L) until it becomes completely solid, α. In such multiphase regions more than one liquid and one solid phase(s) may coexist. The polycrystal in the two-phase region, α + L, contains the GBs as well as boundaries between the α-phase and the melt L called interphase boundaries (IBs). Let us consider now the triple junctions (TJs) between two IBs and GB. Here GB contacts with the melt (see schemes on the left-hand side of Figure 2).
Let us suppose that the GB energy, σGB, is less than the energy of the two solid/liquid IBs, 2σSL (see lower scheme in Figure 2). The GB and IBs form in this case the contact angle, θ > 0, at this TJ, and the GB wetting is called partial (or incomplete). If σGB > 2σSL (see upper scheme in Figure 2) then θ = 0. In this case, the solid α-grains would be separated by a thick liquid layer. This is the case of complete GB wetting by the melt. It is described for many binary alloys. In this case the contact angle θ usually decreases with growing temperature and can reach zero at a certain temperature, Tw [46,48,49,50]. At Tw the incomplete GB wetting changes to the complete one. Tw is the temperature of the GB wetting phase transformation. The GB wetting phase-transition can be of the first or second order as for conventional bulk phase transformations [51,52,53]. If the GB wetting transformation is of a first-order, then the first derivative of θ, with respect to temperature, dθ/dT has a discontinuity at Tw [46,51,52]. In this case, exhibits dθ/dT drops suddenly from a certain finite value to 0 [46,51,52]. If the GB wetting phase transition is continuous (or of a second-order), then dθ/dT continuously decreases with increasing T and reaches zero dθ/dT = 0 at Tw [51,52]. We have to underline here that the σGB value depends on the GB misorientation angle, χ, as well as on the GB inclination angle, ψ [54]. The σGB(χ) and σGB (ψ) dependences possess sharp cusps at certain χ and ψ [55]. Therefore, the interval of σGB values can be very broad. The higher is σGB, the smaller is the θ value at the GB TJ with the melt [56,57]. In other words, the θ values in a two-phase polycrystal could be very different at each fixed temperature. With increasing temperature, these θ values for different GBs would decrease with different rates. This is the reason why the spectrum of Tw temperatures in a polycrystal can be very wide.
Typical examples of such two-phase polycrystals microstructures are shown in Figure 2 for the binary Al–Mg alloys. Thus, regarding the GB wetting phase transitions, the bulk phase diagram becomes two additional GB tie-lines. The Twmin tie-line corresponds to the GBs wetting transition from partial to complete wetting for the grain boundaries having highest energy σGB. Under Twmin one cannot observe in the alloy any fully wetted GB. The polycrystal under Twmin contains only partially wetted GBs with θ > 0. First, completely wetted GBs appear with the heating of the alloy above Twmin. Above Twmin, the portion of fully wetted GBs increases with increasing temperature. At Twmax it reaches unity. Another tie-line shows the temperature Twmax. Above Twmax all GBs contain the melted layer and are, therefore, completely wetted. In this case each grain is completely surrounded by the melt. It cannot contact other abutting grains. This is because the non-wetted GBs are thermodynamically disadvantageous above Twmax. In other words, above Twmax all solid crystallites are detached from their neighbors by the skins of a liquid phase. Thus, a conventional binary phase diagram becomes the new GB tie-lines in the α + L area. Such new tie-lines are due to the GB wetting phase transitions. The conventional phase diagrams suppose that all bulk phases are single crystals and ignore the GBs and GB phenomena.

3. GB Wetting in the HEA Coatings Containing One Phase

In Ref. [47] the FeNiCoCrMox (with atomic ratio x = 0, 0.15, 0.20, 0.25) HEA coatings were prepared by laser cladding on 316 stainless steel substrate. The coatings were named, respectively, Mo0, Mo0.15, Mo0.20 and Mo0.25. The preplaced powder system was used. The X-ray diffraction (XRD) patterns show that with increasing concentrations of Mo the high entropy alloy coatings still have a single-phase face-centered cubic (fcc) structure.
The XRD patterns contain no diffraction peaks except for (111), (200), (220), (311) and (222) fcc solid solution diffraction peaks. They only shift a little due to the change of lattice period. Scanning electron microscopy (SEM) micrographs of these coatings are shown in Figure 3a–d. The composition was locally measured by the energy dispersive spectrometry (EDS). Figure 3e shows the scheme with the binary phase diagram for the explanation of the respective GB wetting processes. The dotted red arrows show the cooling trajectories corresponding to the micrographs (a)–(d). As mentioned above, if the trajectories (a)–(d) do not intersect the line of eutectic transformation, the Mo-poor dendrites solidify first, and last enriched portions of the melt between dendrites solidify at the end. We can see that dendrite grains do not grow together during the solidification, they do not form GBs “dendrite/dendrite”. Thus, these GBs were fully wetted by the Mo-enriched melt. Nevertheless, after solidification the FeNiCoCrMox HEAs contained one fcc phase, but with different composition in bulk and in GBs.
The comparable behavior of GB wetting took place also in the CoCr2FeNiMox HEA with changing Mo content x = 0, 0.1, 0.2, 0.3, 0.4 [58]. In Ref. [59] the AlCoCrFeNiSix HEAs with x = 0, 0.1, 0.2, 0.3, 0.4, and 0.5 have been deposited by laser cladding. The coatings always contain the single fcc phase, as in Ref. [47]. However, the transition between complete and incomplete GB wetting took place with increasing Si content [59]. This means that the Twmin and Twmax tie-lines (see scheme in Figure 3e) are positioned higher, and with increase of Si content the solidification trajectories come to the area below Twmin before the solidification is finished. One can find another pure example of the complete wetting process for the fcc/fcc GBs by the final portions of solidifying melt in the CrFeNiNbTi alloy [60]. The small amount of equiaxial Fe2Ti precipitates does not disturb the perfect picture of a GB wetting. In Ref. [61] the CoCrCu1-xFeNix HEA contains only one fcc phase at all studied x values (namely, x = 0, 0.1, 0.3 and 0.5). However, the wetting conditions change, similar to [59]. Namely, at x = 0 almost all grain boundaries in the face-centred cubic matrix phase are completely wetted by the Cu-rich fcc phase. When x increases, the portion of partially wetted GBs increases as well.

4. GB Wetting in the HEA Coatings Containing Two Phases

Ref. [62] gives another example when the solidified HEA contains two different phases, namely the fcc and bcc (base centered cubic) phases. In that study, the AlCoCrFeNiTi0.5 coating was manufactured by laser cladding with preplaced powder system from pure (>99.5 wt%) Al, Co, Cr, Fe, Ni and Ti elemental powders with particle size ranging from 48 μm to 75 μm. The XRD pattern of the coating demonstrated that it was composed of major fcc and minor bcc phases. The diffraction peaks of the fcc phase were in accordance with the peaks of AlNi2Ti (PDF #65–432) or AlCo2Ti (PDF #65–4682), and the bcc phase corresponded to the Fe–Cr phase (PDF #34–0396). In Figure 4, the matrix fcc phase is called dendrite region (DR1). Its grains are surrounded by the layers of interdendrite bcc phases (IR1 and IR2). It is clearly visible that the bcc phase completely wets all fcc/fcc GBs (Figure 4a).
TEM permitted detailed analysis of the structure of bulk and GB phases. Figure 5 contains the bright field (BF) images for the DR and IR regions. Figure 5b–d are the corresponding selected area diffraction patterns (SADP) of area A (the phase appears light-grey), area B (the phase appears dark-grey), and area C (the phase appears black), respectively. The phase appearing light-grey is the DR one, while the other two phases appearing black and light-grey are the GB IR ones. The indexed SADP in Figure 5b shows that the DR structure is face-centred cubic with a lattice parameter of 0.5761 nm, which is close to the values of 0.5848 nm (AlNi2Ti, PDF #65–0432) and 0.5865 nm (AlCo2Ti, PDF #65–4682). Both GB phases (dark-grey and black) are bcc ones. The SADP in Figure 5c of dark-grey IR phase is in accordance with the bcc structure of Fe–Cr (PDF#34–0396, 0.2876 nm). The SADP in Figure 5d of black IR phase is in accordance with the bcc Cr13Fe35Ni3Ti7 structure (PDF#16–0443, 0.8856 nm).
The schematic binary phase diagram in Figure 4c shows the possible arrangement of GB wetting tie-line(s) as well as liquidus and eutectic lines. In contrast to the previous example given in Section 2, the solidification trajectory (dotted light-red arrow) does not finish in the α-area but crosses the horizontal line of eutectic transition L → α + β. For the studied AlCoCrFeNiTi0.5 coating [62], α in the scheme corresponds to the major fcc phase and β is for the minor bcc phase(s). At a late solidification stage, the last portions of the melt completely wet all fcc/fcc GBs and then decompose according the reaction L → α + β. Another perfect example of two-phases HEA is the FeNiCoCrTi0.6Nb0.4 alloy where the Laves phase completely wets the bcc/bcc GBs in the matrix [63].

5. GB Wetting in the HEA Coatings in Case of Transition from One Phase to Two Phases

We will next discuss the example of GB wetting in HEAs where the transition from one phase to two phases takes place with changing composition. In Ref [64], the HEA coatings AlxCrFeCoNiCu (x: molar ratio, x = 0, 0.1, 0.3, 0.5, 0.7, 0.8, 1.0, 1.2, 1.5, 1.8, or 2.0) were prepared via laser cladding with the preplaced powder system. It can be seen that the Al concentration varied across a broad interval for 11 different concentration values. The XRD patterns (Figure 6a) show that the samples with x = 0, 0.1, 0.3 contain only one fcc phase. Their microstructure (Figure 7a–f) is very similar to that shown in Figure 3. The composition has been measured in the points DR 1,2,3 and 4 inside the dendrites and in the points IR 1, 2, 3 and 4 between the dendrites. The coating in all IR points was strongly enriched by copper and in the IR 2, 3 and 4 it was enriched by Al. In other words, at the last stage of crystallization the solid grains were completely isolated from their neighbors by the Cu- and Al-rich melt before solidification. It means that in the schematic phase diagram (Figure 8g) the samples followed the trajectories (0, 0.1, 0.3) shown by red arrows. In other words, during solidification in the α+L area the samples were above the Twmax tie-line and all fcc/fcc GBs were fully wetted by the liquid phase. In the sample with x = 0.5, a small amount of bcc1 phase appeared (Figure 6a), but the microstructure of this sample (Figure 7d) was still very similar to the samples with x = 0, 0.1, 0.3 (Figure 7a–c). It means that the solidification followed the trajectory “0.5” in the scheme Figure 8g.
The samples x = 0.7, 0.8, 1.0 contained not only the fcc phase but two additional bcc1 and bcc2 phases (Figure 6b). The respective microstructures are shown in Figure 8. They are quite different from those in Figure 7 and have some similarity with microstructures shown in Figure 4. In other words, the matrix grains have fcc structure, and the last portions of the melt are decomposed in the fcc + (bcc1,bcc2) mixture. These portions of Al-rich melt also wetted the fcc/fcc GBs, but the wetting was not as perfect as in Figure 7a–c for x = 0, 0.1, 0.3. Some grains of the matrix fcc phase formed the GBs with each other and, therefore, the GB wetting was only partial for them. This can be schematically explained with trajectories “0.7, 0.8, 1.0” in Figure 8g. Namely, just before the eutectic line, the samples were below the Twmax tie-line (and maybe even below the Twmin tie-line) and, therefore, not all GBs were completely wetted. Moreover, we can see that amount of completely wetted GBs decreases when the Al concentration increases from 0.7 to 1.0. Most probably, this is because the schematic binary phase diagram in Figure 8g is too simple for the six-component AlxCrFeCoNiCu HEAs. It does not take into account that indeed not two α+β but three solid phases fcc + (bcc1,bcc2) were present in the studied samples.
The interesting example of the transition from one-phase to two-phase coatings was observed in the HEA CoCrFeNiAlxMn(1−x) so-called dual-phase coatings [65]. The Al content x in these alloys increased from zero to 0.8 (x = 0, 0.2, 0.4, 0.6, and 0.8). At low x < 0.5 the alloy contains only fcc phase. At x > 0.5 the bcc phase appears. The bcc phase completely wets some fcc/fcc GBs and incompletely wets the rest of the fcc/fcc GBs. In the AlxCoCrFe2Ni (x = 0.3, 0.7, 1.0) HEAs the microstructure at x = 0.3 is similar to the one-phase case shown in Figure 7, the microstructure at x = 1.0 is similar to the two-phase one shown in Figure 4, but at the intermediate concentration x = 0.7 no indications of GB wetting are present at all [66]. In the FeCoNiTiAlx alloys the increase of Al content from zero through 0.5 to 1 promoted the transition from fcc (at x = 0) to bcc (at x = 1) phase [14]. In two-phase fcc+bcc alloys at x = 0.5 some matrix bcc/bcc GBs were fully wetted and others were partially wetted by the fcc phase.
HEA coatings can also contain more than two phases as, for example, in AlCrCoNiFeCTax HEAs with x = 0, 0.5 and 1.0 [64], TiZrAlNbCo HEAs [67], ceramic particle reinforced FeCoNiCrMnTi HEA with Laves phase, bcc-phase and TiN in the fcc/fcc GB wetting layers [68], and CoCr2FeNb0.5NiSi coating with fcc, Laves and chromium oxide phases [69]. In these cases the microstructures and GB wetting-dewetting phenomena are even more complicated.

6. Influence of Laser Scanning Speed on GB Wetting in HEA Coatings

This section will look at how laser scanning speed can affect the GB wetting in HEA coatings. In Ref. [70] the Al16.80Co20.74Cr20.49Fe21.28Ni20.70 HEAs were fabricated by laser cladding with different laser scanning speeds. The thickness of the powder layer was 1 mm. Laser cladding was carried out by IPG YLS-5000 fiber system with a protective gas and laser power 3000 W. The laser scanning speeds were 7, 9, 11, 13, 15, 17, 19 and 21 mm/s for eight HEA coatings named as V7, V9, V11, V13, V15, V17, V19 and V21. The XRD patterns show that the as-deposited Al16.80Co20.74Cr20.49Fe21.28Ni20.70 HEAs contain the major phase with bcc lattice and minor phase with fcc lattice. Figure 9 shows the SEM micrographs of these coatings deposited with different laser scanning speeds. At low speeds of 7 and 9 mm/s, the 5–7 μm thick layers of fcc phase (appears bright in SEM micrographs) completely wetted the GBs between bcc matrix grains (appear dark). Moreover, the slow formation rate of HEA coatings allowed the growth of Widmanstätten plates of fcc phase from the GBs into the bulk of the bcc matrix. Only a few fcc nanoparticles precipitated in the bulk. At 11 mm/s the Widmanstätten plates disappeared. Only a thick “coat” of fcc precipitates covers the bcc/bcc GBs. At speeds of 13, 15, 17 and 19 mm/s, the portion of nanoprecipitates increased and the thickness of fcc GB layers continuously increased. Nevertheless, all bcc/bcc GBs were still completely wetted by the thin fcc layers. However, at the highest studied speed of 21 mm/s, only about one half of bcc/bcc GBs were completely wetted, while the other half contained separated particles of fcc-phase. These GBs were partially wetted. Thus, the increasing speed of the laser scanning is equivalent to the shift of Twmin value to higher temperatures (see the dotted red arrow in the scheme at Figure 4c) and not all bcc/bcc GBs become completely wetted by the last portion of the melt before eutectic crystallization.

7. Influence of Laser Beam Power on GB Wetting in HEA Coatings

The laser beam power can also influence the GB wetting conditions in HEA coatings. In ref. [71] the ((CoCrFeNi)95Nb5)100-xMox HEA coatings with x = 1, 1.5 and 2 were fabricated under different laser power of 800, 1000 and 1200 W. At low Mo content of x = 1 and 1.5, the coating contained only one fcc phase (see XRD patterns in Figure 10a). The microstructure of these coatings at constant laser beam power of 800 W demonstrates the complete wetting of Mo-depleted grains with the Mo-rich melt (Figure 10 b,c). This structure is similar to that shown in Figure 3 and Figure 7 where the solidification trajectories do not cross the line of eutectic transition (dotted red arrows a,b,c,d in Figure 3e, as well as dotted red arrows 0, 0.1, 0.3 in Figure 8g). At x = 2 the small amount of second phase (Laves phase, Figure 10a) appears. However, the few precipitates of Laves phase do not disturb the complete GB wetting of fcc/fcc GBs by the last portions of solidified melt (see Figure 10d). This situation is similar to that shown in Figure 6g,h (micrographs) and dotted red arrow “0.5” in the scheme of Figure 8g.
Figure 11 shows the SEM images for the microstructure of ((CoCrFeNi)95Nb5)99Mo1 HEA coatings (i.e., for x = 1) deposited with different laser beam power, namely 800, 1000 and 1200 W. It is clearly visible that as a result of the increase of laser beam power a transition of complete GB wetting to incomplete wetting takes place (compare Figure 11b,c for 800 and 1000 W, respectively). Further increase of laser beam power up to 1200 W (Figure 11d) completely destroys the wetting of fcc/fcc GBs with the last portions of the melt. In Ref. [72], the (CoCrFeNi)95Nb5 HEA coating was deposited with laser energy densities E of 100, 111, 125, 143, and 167 J/mm2. The coatings have the fcc phase as a matrix and minor Laves phase. The Laves phase completely separated the fcc grains at 100 J/mm2. With increasing E the portion of completely wetted fcc/fcc GBs continuously decreased from ~100% at 100 J/mm2 to only ~10% at 167 J/mm2 [72]. Thus, the increase of laser beam power corresponds in the framework of our scheme to the shift of Twmin value to higher temperatures. Therefore, the increase of laser beam power has an influence similar to the growth of laser beam speed (see the Section 6 above).
Not only laser beam power or laser beam speed can influence the microstructure and GW wetting behavior. For example, the magnetic field of 1 T applied during laser cladding of AlCoCrFeNiTi HEAs arranges the ferromagnetic precipitates in the ordered rows and modifies in this way the conditions for GB wetting [73,74]. Another example is the ultrasonic impact treatment of the Al1.5CoCrFeMnNi HEA [75]. The ultrasonic treatment also influences the distribution of liquid phase (and, therefore, of the minor bcc phase) between the crystallites of the solidifying fcc phase.

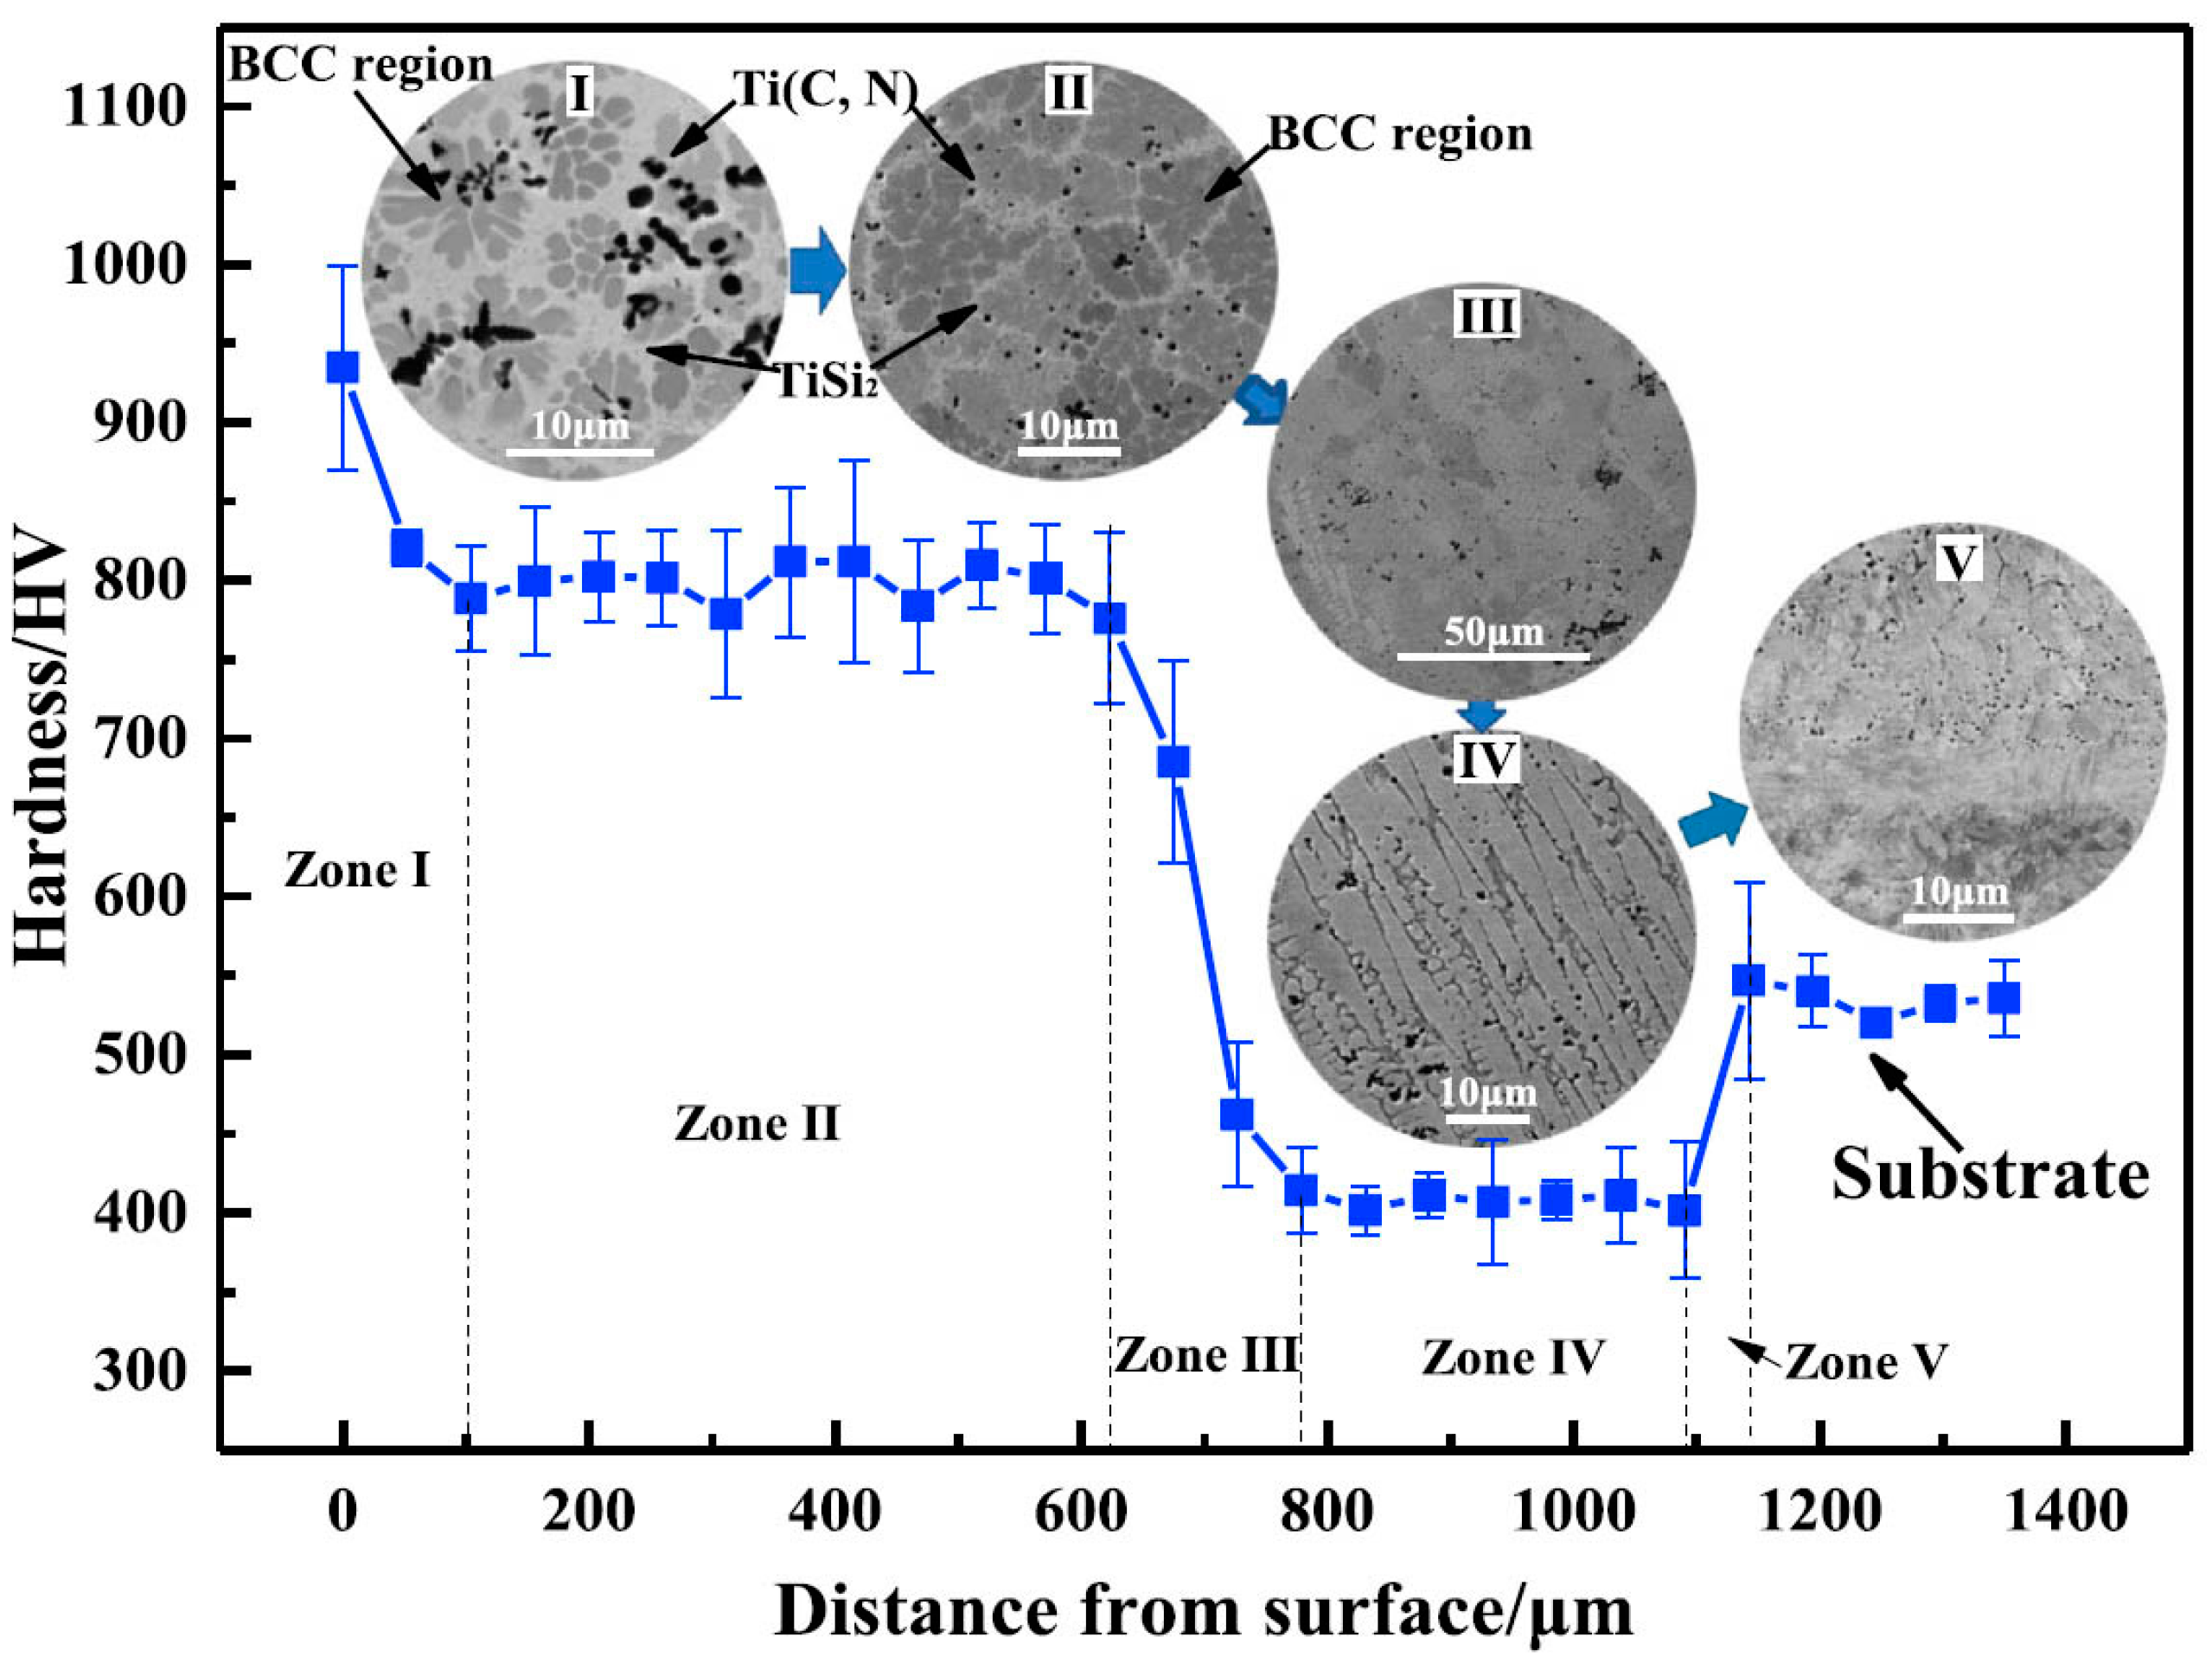
8. Influence of Distance from the Surface on GB Wetting in HEA Coatings

In this section we give examples of how the microstructure of a laser cladded coating changes with its depth and also how the GB wetting changes. We start with the one-phase HEAs similar to those discussed in the Section 3. Figure 12 shows the cross-section of the laser cladded FeCoCrNiWC coating [26]. It contains one fcc-phase with interdendritic areas enriched by Cr and W. Similar to microstructures shown in Figure 3, the portions of the Cr- and W-rich melt fully or partially wet the fcc/fcc matrix GBs. The micrographs in Figure 12b–d show the magnifications of the top, middle and the bottom regions, respectively. It is clearly visible, how the morphology of fcc dendrites changes, and the top layer contains a lower portion of completely wetted GBs. The columnar grains in the bottom part of the AlCoCrFeNiSi laser cladded coatings change to the equiaxial ones [76]. They are almost completely separated by the thin Al-enriched GB layers. In the FeCrCoNiTiAlBC HEA reinforced with self-generated TiC particles, the equiaxed grains with completely wetted GBs were observed close to the substrate [77]. In the middle part of the coating the grains became elongated and switched to flower-like structures close to the surface [77].
Consider now the HEA coatings containing two phases like alloys shown in Figure 4, Figure 7 and Figure 8. In Ref. [78], the MgMoNbFeTi2Yx HEAs were studied for x = 0, 0.4%, 0.8% and x = 1.2% with average coating thickness of 1.3 mm after laser cladding. The coatings contained the major bcc phase rich in Mo and Nb, minor bcc phase rich in Mg and Ti as well as small amounts of oxides and (Nb,Ti)C carbide. Figure 13 shows the SEM micrographs of MgMoNbFeTi2Yx HEA for (a) x = 0, (b) x = 0.4%, (c) x = 0.8%, (d) x = 1.2%. These are the cross sections made at the 0.3 mm depth from the coating surface. The microstructure is very similar to those shown in Figure 4, Figure 7 and Figure 8 for the GB wetting of two-phase HEAs. Here, the minor bcc-phase also wets the majority of GBs in the major bcc-phase. The black arrows in Figure 13a show the particles of iron, magnesium and yttrium oxides. The red circles in Figure 13a,b mark black particles of intermetallic compounds. The addition of yttrium leads to the obvious grain refinement. The cross-sections through all thickness of the coating and substrates in Figure 14 show that the double-phase structure with wetted GBs does not form immediately at the beginning of solidification. To the contrary, close to the substrate the 2–4 μm thick layer of the major bcc-phase crystallizes first. The double-phase structure with wetted GBs forms later. Similar behavior of the GB wetting in the cross-section of two-phase laser-cladded HEAs was observed for the AlxMo0.5NbFeTiMn2 (x = 1, 1.5, 2) alloys [79], AlCrFeNi2W0.2Nbx (x = 0.5, 1, 1.5, 2) alloys [80], FeCrCoAlMn0.5Mo0.1 HEA [81], and Fe5Cr5SiTiCoNbMoW HEA [82]. In the last case, the 5–7 μm thick one-phase layer close to the substrate is clearly seen.
Therefore, the conditions for GB wetting can change across the HEA coating during laser cladding. We have to remember that the thin upper part of the substrate can also melt during laser cladding and, therefore, modify the composition of the bottom layer of the coating. One can also find other cases of changing GB wetting in HEA coatings: These are, for example, the NiTi-based HEAs such as NiTiCuAl functionally graded coatings on Mg–Li substrates [83] and NiTiCrNbTax refractory coatings with variable Ta content (x = 0.1, 0.3, 0.5, 1) [84]. Another group of coatings builds the FeCoNi-based HEAs such as FeCoNiCrMo alloy containing the CeO2 particles [85], the ceramic p6rticle reinforced FeCoNiCrMnTi HEAs [68], single-phase fcc CoCrFeNiSi coatings [86], the Al2CrFeCoxCuNiTi coatings with x = 0.0, 0.5, 1.0, 1.5, 2.0 [16], AlFeCuCrCoNi-WCx HEA coatings with carbon content of 5, 10 and 15 at.% [87] and Ni1.5CrCoFe0.5Mo0.1Nbx eutectic HEA coatings with x = 0.55 (hypoeutectic), 0.68 (eutectic), 0.8 (hypereutectic alloys) [15]. Final important examples are the NbTaTiZr refractory medium-entropy alloy coatings [88] as well as carbide-containing Fe50Mn30Co10Cr10-xNbC composite coatings [89].

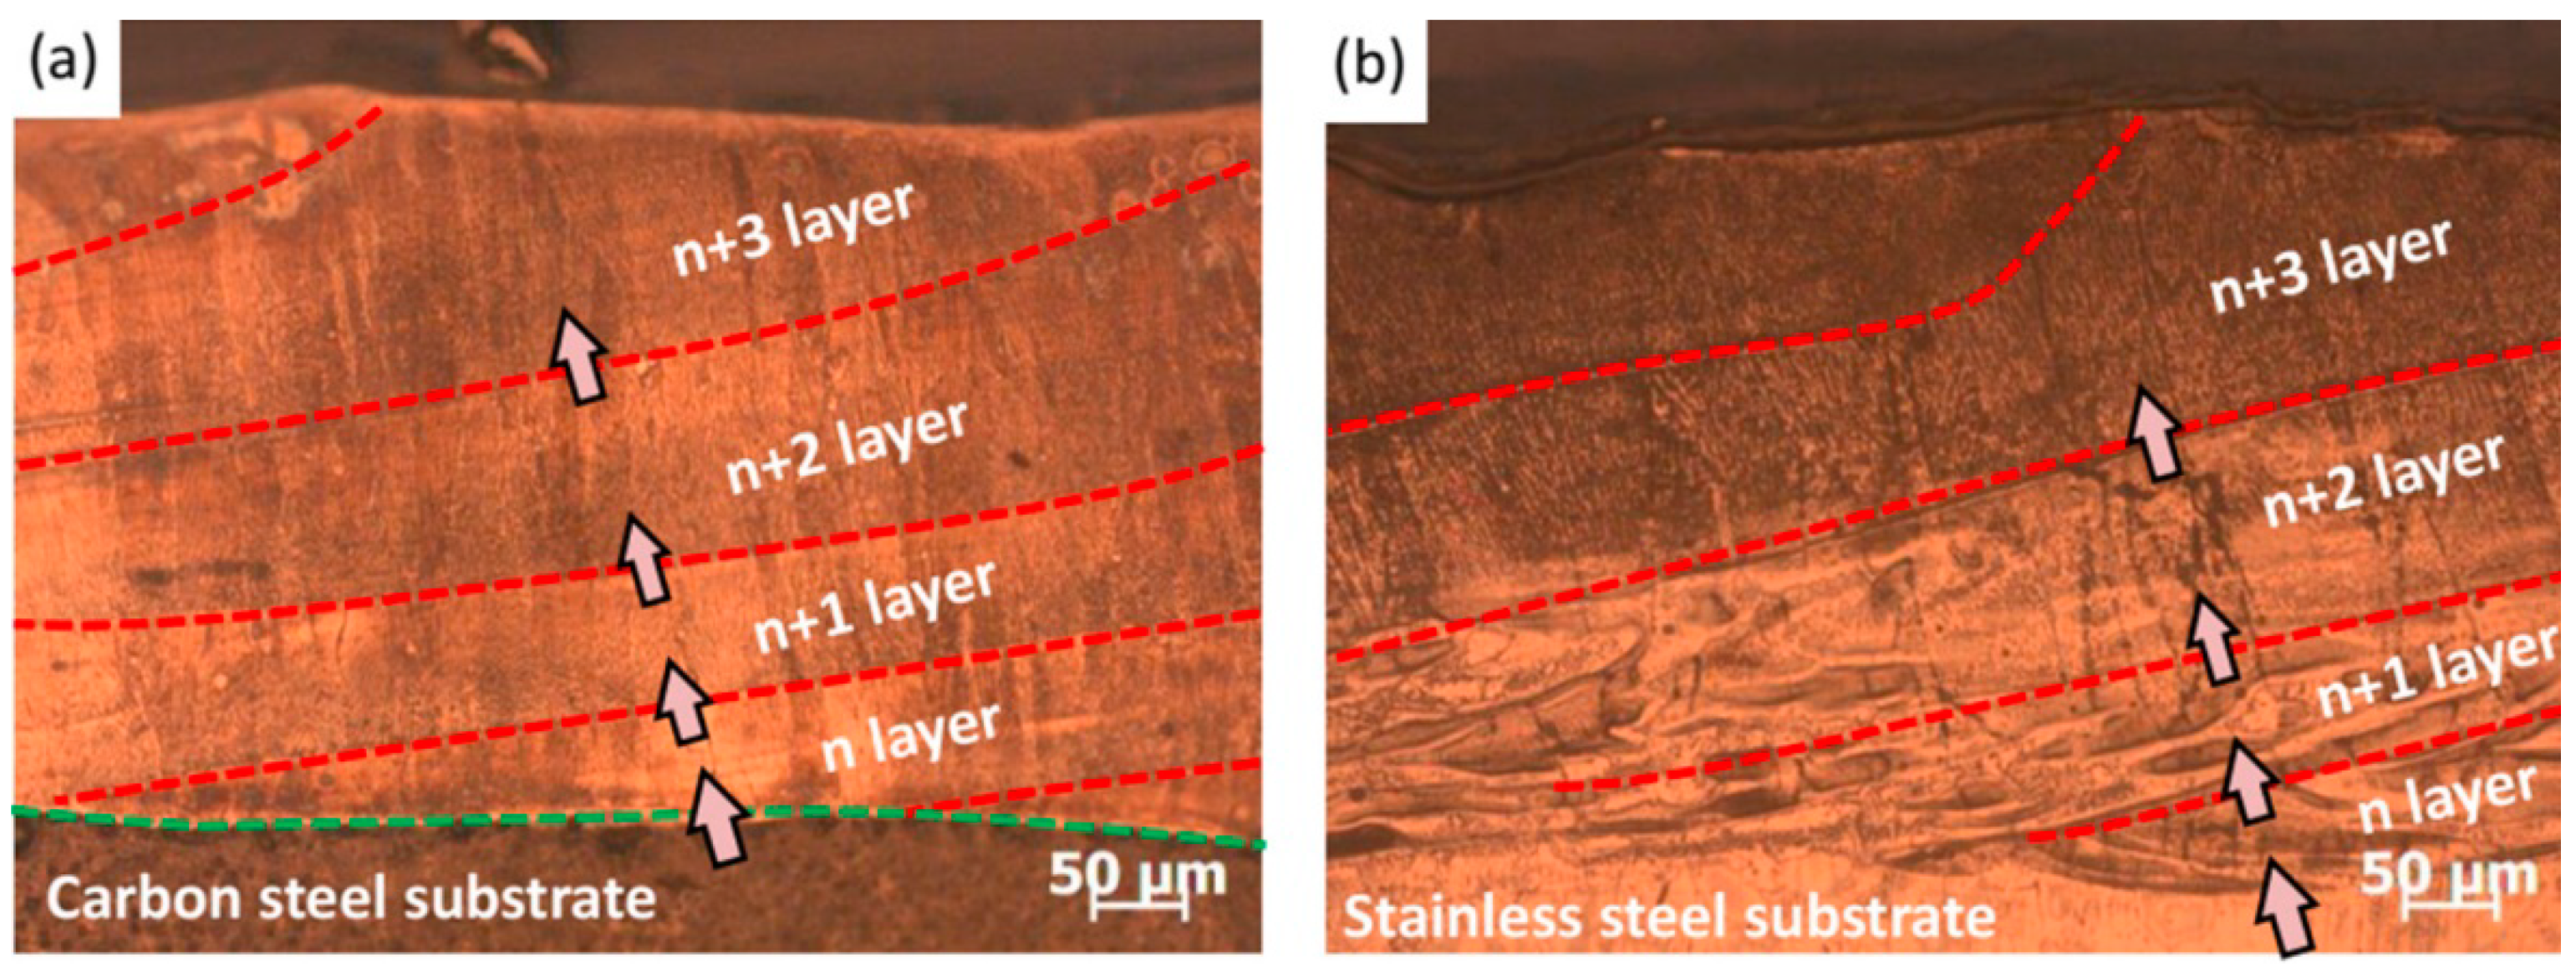
9. GB Wetting in Multitrack and Multilayer HEA Coatings

In Section 8 we considered the change of GB wetting conditions with depth in single-layer and single-track HEA coatings deposited by the laser cladding. We had in mind the possible melting of a thin substrate layer. However, during the laser cladding of a big substrate the laser beam successively scans one track after another (Figure 1). During such scanning the previous track is partially melted during the next step of the coating process, and as a result the tracks overlap and coat all substrate [90]. During laser cladding, the molten metal would form an arc shape under the action of surface tension. If the pass-by-pass cladding method is adopted, in some cases a complete cladding layer can be obtained in the first pass, but the volume of the cladding layer could decrease due to insufficient powder in the second pass, as shown in Figure 15a,b. To avoid this situation, the separated layer cladding method was proposed in Ref. [91] for the FeCoCrNiMnAlx HEA coatings as shown in Figure 15a,c–e. The cladding layers with odd numbers (Figure 15c,d) were produced first, and then the surface was cleaned. The gaps between adjacent cladding layers were then filled with the powder, and then the even-numbered cladding layers were produced to complete the laser cladding process.
In case of the deposition of an HEA coating by the laser cladding on a pipe (Figure 16), the consecutive layers strongly overlap each other [92]. During the cladding process, the powder becomes a liquid alloy after heating by a laser beam and falls on the surface of the substrate. During the cladding process, the steel pipe (substrate) is rotated at a high speed. The powder feeding nozzle and laser beam move along the TD.
In Figure 17, the microstructure of the cross-section of a FeCoNiCrAl coating on a carbon steel pipe (Figure 17a) and on a stainless steel pipe (Figure 17b) is shown. Five overlapping subsequent layers are visible in these micrographs. The wetting of the grain boundaries in the dark phase by the layers of a phase appearing light is clearly visible in Figure 17b in the layers n, n + 1 and n + 2 close to the stainless steel substrate. The GB wetting layers are enriched by iron but have the same fcc cristal lattice [92]. The upper layers with numbers n + 3 and n + 4 are more uniform and do not reveal almost any GB wetting. The FeCoNiCrAl multilayer coating on a carbon steel pipe (Figure 17a) is more uniform and does not demonstrate any GB wetting. Therefore, the GB wetting in Figure 17b is most probably due to the partial melting of a stainless steel substrate.
In some cases, an intermediate coating is deposited between substrate and main HEA coating [93]. For example, in Ref. [93] the CoCrFeMnNi HEA cladding layer was pre-coated on the substrate in order to improve the crack resistance of CoCrFeMnNi + x(TiC) composite coating (CC), before fabricating the composite cladding layer. Figure 18 shows the cross-section of the H13 steel substrate in the bottom, HEA cladding layer in the middle and CoCrFeMnNi + x(TiC) composite coating on the top. It can be seen how the “pure” CoCrFeMnNi HEA layers (appearing white) wet the arc-shaped boundaries between subsequent tracks of the upper CoCrFeMnNi + x(TiC) composite coating (appearing grey).
In Ref. [94], the AlCoCrCuFeNi HEA coatings after one, two and three layers were laser cladded on the substrate of a AZ91D Mg-based alloy. Close to the interface with a HEA coating, the substrate was composed of Mg dendrites and interdendritic Mg+Q eutectics. The multilayer coating contains the thin composite bottom layer and a top thick dense HEA region. The dominated microstructures in the dense HEA region are columnar dendrites of a bcc phase (Figure 19). Figure 19 shows the microstructure close to the interface between the first and second layer. In both layers the last portions of a melt (enriched on Al) wet the GBs between the bcc matrix grains (like in Figure 3). However, the morphology of GB wetting layers is different in the first and second layer. This may be due to the higher Mg concentration in the first layer due to the partial melting of a substrate.
In Ref. [95], the double layer AlCoCrFeNiSi-based HEA coating reinforced in situ by Ti(C, N) was fabricated on the H13 steel substrate using laser cladding with coaxial powder feeding direct laser deposition system equipped with an ytterbium fiber laser. The equiatomic CoCrFeNi HEA powders were mixed with high-purity Ti and C powders giving the molar ratio of CoCrFeNi, Al, Si, Ti to C powder as 8:1:1:1:1. Considering the dilution of melted substrate in the HEA molten pool, a double-layer gradient coating is fabricated on the substrate. Therefore, the coating has the functional gradient structure (see Figure 20). From the depths of the five zones shown in Figure 20, it can be deduced that zone I and zone II constitute the second layer, and zone IV is the first layer. Zone III is the transition region between first layer and second layer, while zone V is the transition region between first layer and H13 substrate.
In zone I the bcc solid-solution matrix is formed with titanium disilicide TiSi2 layers in GBs (Figure 20). The titanium disilicide TiSi2 (appearing white in Figure 21b) completely wets about 80% of GBs in the bcc phase in Zone I (appearing blue in Figure 21b). The titanium carbonitride Ti(CN) (appears red in Figure 21c) has a shape of isolated round particles and does not “participate” in GB wetting. It is supposed in [95] that the titanium diffusion into carbon powder particles leads to the nucleation of TiC carbide particles in the melt. Afterwards, the TiC carbide particles grow during solidification. In Ref. [95], the nitrogen played the role of shielding gas for the laser cladding. The nitrogen atoms dissolved in the molten pool and replaced some carbon atoms allowing the precipitation of Ti(C,N) particles. The highest average hardness was in the zone I with a depth of ~100 μm (see Figure 20). With the increasing depth, the hardness gradually decreased from 934 ± 65HV to about 800HV. In the deeper layer II (see Figure 20) the amount of matrix bcc phase increased and that of the TiSi2 and Ti(CN) phases decreased. Nevertheless, the layers of TiSi2 phase completely wet almost all bcc/bcc GBs (see Figure 20). In the Zones III and IV the TiSi2 and Ti(CN) phases disappear and the ordered Al-Ni-Ti B2 phase appears instead. In this two-phase mixture no GB wetting is present. Therefore, the dilution of a H13 steel substrate in the first melted layer during laser cladding, indeed, modifies not only composition, but also the GB wetting conditions.
Thus, for the deposition of coatings using laser cladding, the preparation of multi-pass thick coatings by the overlay processing is very important. This process allows production of the gradient functional structure on the coated surface [96]. The cladding layer always includes the partially melted substrate in its bottom part in the interface dilution region [97]. In case of multi-pass thick coatings not the substrate but the previous partially remelted and solidified HEA layer is included instead. One can expect, therefore, that the portions with less pronounced GB wetting (like Zones IV and V in Figure 20) would be excluded from the multilayer HEA coatings and only periodically repeated layers with good GB wetting similar to Zones I and II (see Figure 20) would be present. Such a structure could prevent unwanted cracking through the whole multilayer coating [98]. The remelting takes place also in the overlapping neighboring laser line scans [90,91,92,98]. Therefore, the lateral shift of the scan tracks or even their axial rotation for the subsequent coating layers could additionally improve the wear properties [99] or prevent the cracking of a hard coating [100,101].

10. Conclusions

This review analyzes the grain boundary (GB) wetting in the high-entropy alloys (HEAs) coatings deposited by laser cladding. If an HEA contains only one phase, this means that during solidification, the HEAs intersect only the liquidus and solidus lines in the phase diagram. In this case, the melt enriched with 1–3 components wets the GBs in the solid phase, poor in these components, and then solidifies, forming a phase with the same crystal lattice as the matrix. HEAs can also contain two or more phases. In this case, during solidification, the HEA crosses the liquidus line, and then the line of eutectic transformation. In this instance, the last portions of the melt, which completely or partially wet the GBs, decompose into a mixture of two or more solid phases. Then, in the solid state, the second, third, and further phases form interlayers in GBs. They separate the crystallites in the matrix phase from their neighbors. The transition from complete to incomplete GB wetting occurs, as a rule, when the laser beam power of the scanning speed increases. The microstructure and GB wetting can also be influenced by the HEAs composition, the external magnetic field or ultrasonic impact. The microstructure and GB wetting also change significantly over the thickness of the (rather thick) coatings deposited by the laser cladding. Especially interesting is the phenomenon of remelting of HEAs in neighboring tracks or double and multilayer coatings. In this case, the composition gradient in the depth can also modify the conditions for GB wetting.

11. Patents

This section is not mandatory but may be added if there are patents resulting from the work reported in this manuscript.

Author Contributions

Conceptualization, B.B.S., A.B.S., G.A.L. and A.K. (Anna Korneva); methodology, A.K. (Anna Korneva), A.B.S., A.K. (Alexei Kuzmin), B.B.S., A.B.S. and N.V.; formal analysis, A.K. (Anna Korneva), A.K. (Alexei Kuzmin), A.B.S., A.S.G. and N.V.; writing—original draft preparation, A.K. (Anna Korneva), A.K. (Alexei Kuzmin), A.B.S., L.K. and N.V.; writing—review and editing, B.B.S.; supervision, B.B.S. and A.K. (Anna Korneva); project administration, B.B.S. and A.K. (Anna Korneva); funding acquisition, A.K. (Anna Korneva) and B.B.S. All authors have read and agreed to the published version of the manuscript.

Funding

This research was funded by the Russian Ministry of Science and Higher Education (contract no. 075-15-2021-945 grant no. 13.2251.21.0013) Support from the University of the Basque Country under the GIU19/019 project is also acknowledged.

Institutional Review Board Statement

Not applicable.

Informed Consent Statement

Not applicable.

Data Availability Statement

All the data required to reproduce these experiments are present in the article.

Acknowledgments

This review was written during the preparation of M-era.Net full proposal “Grain boundaries in multicomponent alloys without principal component” (A.Ko., A.Ku., G.A.L. and L.K., application No 9345). The Institute of Solid State Physics, University of Latvia, as a center of excellence, has received funding from the European Union’s Horizon 2020 Framework Programme H2020-WIDESPREAD-01-2016-2017-TeamingPhase2 under grant agreement no. 739508, project CAMART2.

Conflicts of Interest

The authors declare no conflict of interest.

References

  1. Zhu, L.; Xue, P.; Lan, Q.; Meng, G.; Ren, Y.; Yang, Z.; Xu, P.; Liu, Z. Recent research and development status of laser cladding: A review. Opt. Laser Technol. 2021, 138, 106915. [Google Scholar] [CrossRef]
  2. Cantor, B.; Chang, I.T.H.; Knight, P.; Vincent, A.J.B. Microstructural development in equiatomic multicomponent alloys. Mater. Sci. Eng. A 2004, 375, 213–218. [Google Scholar] [CrossRef]
  3. Yeh, J.-W.; Chen, S.-K.; Lin, S.-J.; Gan, J.-Y.; Chin, T.-S.; Shun, T.-T.; Tsau, C.-H.; Chang, S.-Y. Nanostructured high-entropy alloys with multiple principal elements: Novel alloy design concepts and outcomes. Adv. Eng. Mater. 2004, 6, 299–303. [Google Scholar] [CrossRef]
  4. Zhu, J.M.; Fu, H.M.; Zhang, H.F.; Wang, A.M.; Li, H.; Hu, Z.Q. Synthesis and properties of multiprincipal component AlCoCrFeNiSix alloys. Mater. Sci. Eng. A 2010, 527, 7210–7214. [Google Scholar] [CrossRef]
  5. Zhou, Y.J.; Zhang, Y.; Wang, Y.L.; Chen, G.L. Solid solution alloys of AlCoCrFeNiTix with excellent room-temperature mechanical properties. Appl. Phys. Lett. 2007, 90, 181904. [Google Scholar] [CrossRef]
  6. Hsu, C.Y.; Juan, C.C.; Wang, W.R.; Sheu, T.S.; Yeh, J.W.; Chen, S.K. On the superior hot hardness and softening resistance of AlCoCrxFeMo0.5Ni high-entropy alloys. Mater. Sci. Eng. A 2011, 528, 3581–3588. [Google Scholar] [CrossRef]
  7. Liu, C.; Wang, H.; Zhang, S.; Tang, H.; Zhang, A. Microstructure and oxidation behavior of new refractory high entropy alloys. J. Alloy. Compd. 2014, 583, 162–169. [Google Scholar] [CrossRef]
  8. Chuang, M.H.; Tsai, M.H.; Wang, W.R.; Lin, S.J.; Yeh, J.W. Microstructure and wear behavior of AlxCo1.5CrFeNi1.5Tiy high-entropy alloys. Acta Mater. 2011, 59, 6308–6317. [Google Scholar] [CrossRef]
  9. Lee, C.P.; Chen, Y.Y.; Hsu, C.Y.; Yeh, J.W.; Shih, H.C. The effect of boron on the corrosion resistance of the high entropy alloys Al0.5CoCrCuFeNiBx. J. Electrochem. Soc. 2007, 154, C424. [Google Scholar] [CrossRef]
  10. Chang, L.-S.; Straumal, B.B.; Rabkin, E.; Gust, W.; Sommer, F. The solidus line of the Cu–Bi phase diagram. J. Phase Equil. 1997, 18, 128–135. [Google Scholar] [CrossRef]
  11. Molodov, D.A.; Czubayko, U.; Gottstein, G.; Shvindlerman, L.S.; Straumal, B.B.; Gust, W. Acceleration of grain boundary motion in Al by small additions of Ga. Phil. Mag. Lett. 1995, 72, 361–368. [Google Scholar] [CrossRef]
  12. Chang, L.-S.; Rabkin, E.; Straumal, B.B.; Hoffmann, S.; Baretzky, B.; Gust, W. Grain boundary segregation in the Cu–Bi system. Defect Diff. Forum 1998, 156, 135–146. [Google Scholar] [CrossRef]
  13. Schölhammer, J.; Baretzky, B.; Gust, W.; Mittemeijer, E.; Straumal, B. Grain boundary grooving as an indicator of grain boundary phase transformations. Interf. Sci. 2001, 9, 43–53. [Google Scholar] [CrossRef]
  14. Sun, Z.; Zhang, M.; Wang, G.; Yang, X.; Wang, S. Wear and corrosion resistance analysis of FeCoNiTiAlx high-entropy alloy coatings prepared by laser cladding. Coatings 2021, 11, 155. [Google Scholar] [CrossRef]
  15. Wen, X.; Cui, X.; Jin, G.; Liu, Y.; Zhang, Y.; Fang, Y. In-situ synthesis of nano-lamellar Ni1.5CrCoFe0.5Mo0.1Nbx eutectic high-entropy alloy coatings by laser cladding: Alloy design and microstructure evolution. Surf. Coat. Technol. 2021, 405, 126728. [Google Scholar] [CrossRef]
  16. Qiua, X. Microstructure and corrosion properties of Al2CrFeCoxCuNiTi high entropy alloys prepared by additive manufacturing. J. Alloy. Compd. 2021, 887, 161422. [Google Scholar] [CrossRef]
  17. Gao, P.-H.; Fu, R.-T.; Chen, B.-Y.; Zeng, S.-C.; Zhang, B.; Yang, Z.; Guo, Y.-C.; Liang, M.-X.; Li, J.-P.; Lu, Y.-Q.; et al. Corrosion resistance of CoCrFeNiMn high entropy alloy coating prepared through plasma transfer arc claddings. Metals 2021, 11, 1876. [Google Scholar] [CrossRef]
  18. Zhang, B.; Yu, Y.; Zhu, S.; Zhang, Z.; Tao, X.; Wang, Z.; Lu, B. Microstructure and wear properties of TiN–Al2O3–Cr2B multiphase ceramics in-situ reinforced CoCrFeMnNi high-entropy alloy coating. Mater. Chem. Phys. 2022, 276, 125352. [Google Scholar] [CrossRef]
  19. Zhang, D.; Yu, Y.; Feng, X.; Tian, Z.; Song, R. Thermal barrier coatings with high-entropy oxide as a top coat. Ceram. Int. 2022, 48, 1349–1359. [Google Scholar] [CrossRef]
  20. Wang, L.; Zhang, F.; Yan, S.; Yu, G.; Chen, J.; He, J.; Yin, F. Microstructure evolution and mechanical properties of atmosphere plasma sprayed AlCoCrFeNi high-entropy alloy coatings under post- annealing. J. Alloy. Compd. 2021, 872, 159607. [Google Scholar] [CrossRef]
  21. Xue, M.; Mao, X.; Lv, Y.; Chi, Y.; Yang, Y.; He, J.; Dong, Y. Comparison of micro-nano FeCoNiCrAl and FeCoNiCrMn coatings prepared from mechanical alloyed high-entropy alloy powders. J. Therm. Spray Tech. 2021, 30, 1666–1678. [Google Scholar] [CrossRef]
  22. Zhang, Z.; Zhang, B.; Zhu, S.; Yu, Y.; Wang, Z.; Zhang, X.; Lu, B. Microstructural characteristics and enhanced wear resistance of nanoscale Al2O3/13 wt. % TiO2-reinforced CoCrFeMnNi high entropy coatings. Surf. Coat. Technol. 2021, 412, 127019. [Google Scholar] [CrossRef]
  23. Xiao, J.-K.; Li, T.-T.; Wu, Y.-Q.; Chen, J.; Zhang, C. Microstructure and tribological properties of plasma-sprayed CoCrFeNi-based high-entropy alloy coatings under dry and oil-lubricated sliding conditions. J. Therm. Spray Tech. 2021, 30, 926–936. [Google Scholar] [CrossRef]
  24. Meghwal, A.; Anupam, A.; Luzin, V.; Schulz, C.; Hall, C.; Murty, B.S.; Kottada, R.S.; Berndt, C.C.; Ang, A.S.M. Multiscale mechanical performance and corrosion behaviour of plasma sprayed AlCoCrFeNi high-entropy alloy coatings. J. Alloy. Compd. 2021, 854, 157140. [Google Scholar] [CrossRef]
  25. Zhu, S.; Zhang, Z.; Zhang, B.; Yu, Y.; Wang, Z.; Zhang, X.; Lu, B. Microstructure and properties of Al2O3-13 wt. % TiO2-reinforced CoCrFeMnNi high-entropy alloy composite coatings prepared by plasma spraying. J. Therm. Spray Tech. 2021, 30, 772–786. [Google Scholar] [CrossRef]
  26. Peng, Y.B.; Zhang, W.; Li, T.C.; Zhang, M.Y.; Wang, L.; Song, Y.; Hu, S.H.; Hu, Y. Microstructures and mechanical properties of FeCoCrNi high entropy alloy/WC reinforcing particles composite coatings prepared by laser cladding and plasma cladding. Int. J. Refract. Met. Hard Mater. 2019, 84, 105044. [Google Scholar] [CrossRef]
  27. Ma, X.; Ruggiero, P.; Bhattacharya, R.; Senkov, O.N.; Rai, A.K. Evaluation of new high entropy alloy as thermal sprayed bondcoat in thermal barrier coatings. J. Therm. Spray Tech. 2021, 30, 2951–2960. [Google Scholar] [CrossRef]
  28. Hussien, M.; Walton, K.; Vishnyakov, V. Synthesis and corrosion resistance of FeMnNiAlC10 multi-principal element compound. Materials 2021, 14, 6356. [Google Scholar] [CrossRef]
  29. Rao, S.G.; Shu, R.; Boyd, R.; le Febvrier, A.; Eklund, P. The effects of copper addition on phase composition in (CrFeCo)1-yNy multicomponent thin films. Appl. Surf. Sci. 2022, 572, 151315. [Google Scholar] [CrossRef]
  30. Cai, Z.; Wang, Z.; Yang, W.; Zhang, P.; Lu, Y.; Pu, J. Microstructure and corrosion behavior of AlCrTiV-X (X = Cu, Mo, CuMo) high-entropy alloy films in 3.5 wt.% NaCl solution. Surf. Interf. 2021, 27, 101558. [Google Scholar] [CrossRef]
  31. Peighambardoust, N.S.; Alamdari, A.A.; Unal, U.; Motallebzadeh, A. In vitro biocompatibility evaluation of Ti1.5ZrTa0.5Nb0.5Hf0.5 refractory high-entropy alloy film for orthopedic implants: Microstructural, mechanical properties and corrosion behaviour. J. Alloy. Compd. 2021, 883, 160786. [Google Scholar] [CrossRef]
  32. Huang, T.-C.; Hsu, S.-Y.; Lai, Y.-T.; Tsai, S.-Y.; Duh, J.-G. Effect of NiTi metallic layer thickness on scratch resistance and wear behavior of high entropy alloy (CrAlNbSiV) nitride coating. Surf. Coat. Technol. 2021, 425, 127713. [Google Scholar] [CrossRef]
  33. Yang, J.; Zhang, F.; Chen, Q.; Zhang, W.; Zhu, C.; Deng, J.; Zhong, Y.; Liao, J.; Yang, Y. Liu, N.; et al. Effect of Au-ions irradiation on mechanical and LBE corrosion properties of amorphous AlCrFeMoTi HEA coating: Enhanced or deteriorated? Corr. Sci. 2021, 192, 109862. [Google Scholar] [CrossRef]
  34. Xu, Y.; Li, G.; Li, G.; Gao, F.; Xia, Y. Effect of bias voltage on the growth of super-hard (AlCrTiVZr)N high-entropy alloy nitride films synthesized by high power impulse magnetron sputtering. Appl. Surf. Sci. 2021, 564, 150417. [Google Scholar] [CrossRef]
  35. Lee, S.; Chatain, D.; Liebscher, C.H.; Dehm, G. Structure and hardness of in situ synthesized nano-oxide strengthened CoCrFeNi high entropy alloy thin films. Scr. Mater. 2021, 203, 114044. [Google Scholar] [CrossRef]
  36. Liu, D.; Ma, Z.; Zhao, H.; Ren, L.; Zhang, W. Nano-indentation of biomimetic artificial bone material based on porous Ti6Al4V substrate with Fe22Co22Ni22Ti22Al12 high entropy alloy coating. Mater. Today Comm. 2021, 28, 102659. [Google Scholar] [CrossRef]
  37. Liang, J.-T.; Cheng, K.-C.; Chen, Y.-C.; Chiu, S.-M.; Chiu, C.; Lee, J.-W.; Chen, S.H. Comparisons of plasma-sprayed and sputtering Al0.5CoCrFeNi2 high-entropy alloy coatings. Surf. Coat. Technol. 2020, 403, 126411. [Google Scholar] [CrossRef]
  38. Voiculescu, I.; Geantă, V.; Vasile, I.M.; Ştefănoiu, R.; Tonoiu, M. Characterisation of weld deposits using as filler metal a high entropy alloy. J. Optoel. Adv. Mater. 2013, 15, 650–654. [Google Scholar]
  39. Ustinova, A.I.; Demchenkova, S.A.; Melnychenko, T.V.; Skorodzievskii, V.S.; Polishchuk, S.S. Effect of structure of high entropy CrFeCoNiCu alloys produced by EB PVD on their strength and dissipative properties. J. Alloy. Compd. 2021, 887, 161408. [Google Scholar] [CrossRef]
  40. Chang, Y.-Y.; Chung, C.-H. Tribological and mechanical properties of multicomponent CrVTiNbZr(N) coatings. Coatings 2021, 11, 41. [Google Scholar] [CrossRef]
  41. Pogrebnjak, A.D.; Bagdasaryan, A.A.; Horodek, P.; Tarelnyk, V.; Buranich, V.V.; Amekura, H.; Okubo, N.; Ishikawa, N.; Beresnev, V.M. Positron annihilation studies of defect structure of (TiZrHfNbV)N nitride coatings under Xe14+ 200 MeV ion irradiation. Mater. Lett. 2021, 303, 130548. [Google Scholar] [CrossRef]
  42. Chen, S.N.; Zhang, Y.F.; Zhao, Y.M.; Yan, W.Q.; Wu, S.; Chen, L.; Pang, P.; Liao, B.; Wu, X.Y.; Ouyang, X.P. Preparation and regulation of AlCrNiTiSi high entropy alloy coating by a multi-arc magnetic filter cathode vacuum arc system. Surf. Interf. 2021, 26, 101400. [Google Scholar] [CrossRef]
  43. Xu, W.; Liao, M.; Liu, X.; Ji, L.; Ju, P.; Li, H.; Zhou, H.; Chen, J. Microstructures and properties of (TiCrZrVAl)N high entropy ceramics films by multi-arc ion plating. Ceram. Int. 2021, 47, 24752–24759. [Google Scholar] [CrossRef]
  44. Xia, A.; Dedoncker, R.; Glushko, O.; Cordill, M.J.; Depla, D.; Franz, R. Influence of the nitrogen content on the structure and properties of MoNbTaVW high entropy alloy thin films. J. Alloy. Compd. 2021, 850, 156740. [Google Scholar] [CrossRef]
  45. Rabkin, E.I.; Shvindlerman, L.S.; Straumal, B.B. Grain boundaries: Phase transitions and critical phenomena. Int. J. Mod. Phys. B 1991, 5, 2989–3028. [Google Scholar] [CrossRef]
  46. Straumal, B.B.; Korneva, A.; Kuzmin, A.; Lopez, G.; Rabkin, E.; Straumal, A.B.; Gerstein, G.; Gornakova, A.S. The grain boundary wetting phenomena in the Ti-containing high entropy alloys: A review. Metals 2021, 11, 1881. [Google Scholar] [CrossRef]
  47. Wu, H.; Zhang, S.; Wang, Z.Y.; Zhang, C.H.; Chen, H.T.; Chen, J. New studies on wear and corrosion behavior of laser cladding FeNiCoCrMox high entropy alloy coating: The role of Mo. Int. J. Refract. Met. Hard Mater. 2022, 102, 105721. [Google Scholar] [CrossRef]
  48. Straumal, B.B.; Gust, W.; Watanabe, T. Tie lines of the grain boundary wetting phase transition in the Zn-rich part of the Zn–Sn phase diagram. Mater. Sci. Forum 1999, 294, 411–414. [Google Scholar] [CrossRef]
  49. Straumal, A.B.; Yardley, V.A.; Straumal, B.B.; Rodin, A.O. Influence of the grain boundary character on the temperature of transition to complete wetting in Cu–In system. J. Mater. Sci. 2015, 50, 4762–4771. [Google Scholar] [CrossRef]
  50. Kogtenkova, O.A.; Straumal, A.B.; Afonikova, N.S.; Mazilkin, A.A.; Kolesnikova, K.I.; Straumal, B.B. Grain boundary wetting phase transitions in peritectic copper—cobalt alloys. Phys. Sol. State 2016, 58, 743–747. [Google Scholar] [CrossRef]
  51. Straumal, B.B.; Gornakova, A.S.; Kogtenkova, O.A.; Protasova, S.G.; Sursaeva, V.G.; Baretzky, B. Continuous and discontinuous grain boundary wetting in the Zn–Al system. Phys. Rev. B 2008, 78, 054202. [Google Scholar] [CrossRef]
  52. Gornakova, A.S.; Straumal, B.B.; Tsurekawa, S.; Chang, L.-S.; Nekrasov, A.N. Grain boundary wetting phase transformations in the Zn–Sn and Zn–In systems. Rev. Adv. Mater. Sci. 2009, 21, 18–26. [Google Scholar]
  53. Straumal, B.; Muschik, T.; Gust, W.; Predel, B. The wetting transition in high and low energy grain boundaries in the Cu(In) system. Acta Metall. Mater. 1992, 40, 939–945. [Google Scholar] [CrossRef]
  54. Maksimova, E.L.; Shvindlerman, L.S.; Straumal, B.B. Transformation of Σ17 special tilt boundaries to general boundaries in tin. Acta Metall. 1988, 36, 1573–1583. [Google Scholar] [CrossRef]
  55. Ernst, F.; Finnis, M.W.; Koch, A.; Schmidt, C.; Straumal, B.; Gust, W. Structure and energy of twin boundaries in copper. Z. Metallk. 1996, 87, 911–922. [Google Scholar]
  56. Straumal, B.B.; Kogtenkova, O.A.; Gornakova, A.S.; Sursaeva, V.G.; Baretzky, B. Review: Grain boundary faceting-roughening phenomena. J. Mater. Sci. 2016, 51, 382–404. [Google Scholar] [CrossRef]
  57. Straumal, B.; Gust, W.; Molodov, D. Wetting transition on the grain boundaries in Al contacting with Sn-rich melt. Interface Sci. 1995, 3, 127–132. [Google Scholar] [CrossRef]
  58. Fu, Y.; Huang, C.; Du, C.; Li, J.; Dai, C.; Luo, H.; Liu, Z.; Li, X. Evolution in microstructure, wear, corrosion, and tribocorrosion behaviour of Mo-containing high-entropy alloy coatings fabricated by laser cladding. Corr. Sci. 2021, 191, 109727. [Google Scholar] [CrossRef]
  59. Liu, H.; Sun, S.; Zhang, T.; Zhang, G.; Yang, H.; Hao, J. Effect of Si addition on microstructure and wear behavior of AlCoCrFeNi high-entropy alloy coatings prepared by laser cladding. Surf. Coat. Technol. 2021, 405, 126522. [Google Scholar] [CrossRef]
  60. Zhang, T.; Liu, H.; Hao, J.; Chen, P.; Yang, H. Evaluation of microhardness, tribological properties, and corrosion resistance of CrFeNiNbTi high-entropy alloy coating deposited by laser cladding. J. Mater. Eng. Perform. 2021, 30, 9245–9255. [Google Scholar] [CrossRef]
  61. Moghaddam, A.O.; Samodurova, M.N.; Pashkeev, K.; Doubenskaia, M.; Sova, A.; Trofimov, E.A. A novel intermediate temperature self-lubricating CoCrCu1-xFeNix high entropy alloy fabricated by direct laser cladding. Trib. Int. 2021, 156, 106857. [Google Scholar] [CrossRef]
  62. Zeng, X.; Liu, Z.; Wu, G.; Tong, X.; Xiong, Y.; Cheng, X.; Wang, X.; Yamaguchi, T. Microstructure and high-temperature properties of laser cladded AlCoCrFeNiTi0.5 high-entropy coating on Ti–6Al–4V alloy. Surf. Coat. Technol. 2021, 418, 127243. [Google Scholar] [CrossRef]
  63. Zhang, Y.; Xiao, M.; Zhou, Y.; Shen, Y. Thermal stability of eutectic FeNiCoCrTi0.6Nb0.4 high-entropy alloy coating. Powder Met. 2021, 64, 1341–1350. [Google Scholar] [CrossRef]
  64. Li, Y.; Shi, Y. Microhardness, wear resistance, and corrosion resistance of AlxCrFeCoNiCu high-entropy alloy coatings on aluminum by laser cladding. Opt. Laser Technol. 2021, 134, 106632. [Google Scholar] [CrossRef]
  65. Sun, S.; Liu, H.; Hao, J.; Yang, H. Microstructural evolution and corrosion behavior of CoCrFeNiAlxMn(1−x) dual-phase high-entropy alloy coatings prepared by laser cladding. J. Alloy. Compd. 2021, 886, 161251. [Google Scholar] [CrossRef]
  66. Zhang, G.J.; Tian, Q.W.; Yin, K.X.; Niu, S.Q.; Wu, M.H.; Wang, Y.N.; Huang, J.C. Microstructure, hardness and wear behavior of AlxCoCrFe2Ni (x = 0.3, 0.7, 1.0) high entropy alloy coatings prepared by laser cladding. JOM 2021, 73, 11. [Google Scholar] [CrossRef]
  67. Jiang, X.J.; Wang, S.Z.; Fu, H.; Chen, G.Y.; Ran, Q.X.; Wang, S.Q.; Han, R.H. A novel high-entropy alloy coating on Ti–6Al–4V substrate by laser cladding. Mater. Lett. 2022, 308, 131131. [Google Scholar] [CrossRef]
  68. Liu, S.S.; Zhang, M.; Zhao, G.L.; Wang, X.H.; Wang, J.F. Microstructure and properties of ceramic particle reinforced FeCoNiCrMnTi high entropy alloy laser cladding coating. Intermetallics 2022, 140, 107402. [Google Scholar] [CrossRef]
  69. Ma, M.; Han, A.; Zhang, Z.; Lian, Y.; Zhao, C.; Zhang, J. The role of Si on microstructure and high-temperature oxidation of CoCr2FeNb0.5Ni high-entropy alloy coating. Corr. Sci. 2021, 185, 109417. [Google Scholar] [CrossRef]
  70. Wei, X.; Zhang, P.; Yu, Z.; Yan, H.; Wu, D.; Shi, H.; Chen, J.; Lu, Q.; Tian, Y.; Ma, S.; et al. Effect of phase transformation on mechanical properties of Al16.80Co20.74Cr20.49Fe21.28Ni20.70 high entropy alloy coatings processed by laser cladding. J. Alloy. Compd. 2021, 862, 158563. [Google Scholar] [CrossRef]
  71. Wang, W.; Sun, Q.; Wang, D.; Hou, J.; Qi, W.; Li, D.; Xie, L. Microstructure and mechanical properties of the ((CoCrFeNi)95Nb5)100-xMox high-entropy alloy coating fabricated under different laser power. Metals 2021, 11, 1477. [Google Scholar] [CrossRef]
  72. Wang, W.; Qi, W.; Zhang, X.; Yang, X.; Xie, L.; Li, D.; Xiang, Y. Superior corrosion resistance-dependent laser energy density in (CoCrFeNi)95Nb5 high entropy alloy coating fabricated by laser cladding. Int. J. Miner. Metal. Mater. 2021, 28, 888. [Google Scholar] [CrossRef]
  73. Liang, G.; Jin, G.; Cui, X.; Qiu, Z.; Wang, J. The directional array TiN-reinforced AlCoCrFeNiTi high-entropy alloy synthesized in situ via magnetic field-assisted laser cladding. Appl. Surf. Sci. 2022, 572, 151407. [Google Scholar] [CrossRef]
  74. Liang, G.; Jin, G.; Cui, X.; Qiu, Z.; Wang, J. Synthesis and characterization of directional array TiN-reinforced AlCoCrCuNiTi high-entropy alloy coating by magnetic-field-assisted laser cladding. J. Mater. Eng. Perform. 2021, 30, 3568–3576. [Google Scholar] [CrossRef]
  75. Zhang, Q.; Li, M.; Han, B.; Zhang, S.; Li, Y.; Hu, C. Investigation on microstructures and properties of Al1.5CoCrFeMnNi high entropy alloy coating before and after ultrasonic impact treatment. J. Alloy. Compd. 2021, 884, 160989. [Google Scholar] [CrossRef]
  76. Zhang, G.; Liu, H.; Tian, X.; Chen, P.; Yang, H.; Hao, J. Microstructure and properties of AlCoCrFeNiSi high-entropy alloy coating on AISI 304 stainless steel by laser cladding. J. Mater. Eng. Perform. 2020, 29, 278. [Google Scholar] [CrossRef]
  77. Chen, S.; Chen, X.; Wang, L.; Liang, J.; Liu, C. Laser cladding FeCrCoNiTiAl high entropy alloy coatings reinforced with self-generated TiC particles. J. Laser Appl. 2017, 29, 012004. [Google Scholar] [CrossRef]
  78. Gu, Z.; Mao, P.; Gou, Y.; Chao, Y.; Xi, S. Microstructure and properties of MgMoNbFeTi2Yx high entropy alloy coatings by laser cladding. Surf. Coat. Technol. 2020, 402, 126303. [Google Scholar] [CrossRef]
  79. Gu, Z.; Xi, S.; Mao, P.; Wang, C. Microstructure and wear behavior of mechanically alloyed powder AlxMo0.5NbFeTiMn2 high entropy alloy coating formed by laser cladding. Surf. Coat. Technol. 2020, 401, 126244. [Google Scholar] [CrossRef]
  80. Liang, H.; Yao, H.; Qiao, D.; Nie, S.; Lu, Y.; Deng, D.; Cao, Z.; Wang, T. Microstructures and wear resistance of AlCrFeNi2W0.2Nbx high-entropy alloy coatings prepared by laser cladding. J. Therm. Spray Tech. 2019, 28, 1318. [Google Scholar] [CrossRef]
  81. Wen, X.; Cui, X.; Jin, G.; Zhang, X.; Zhang, Y.; Zhang, D.; Fang, Y. Design and characterization of FeCrCoAlMn0.5Mo0.1 high-entropy alloy coating by ultrasonic assisted laser cladding. J. Alloys Compd. 2020, 835, 155449. [Google Scholar] [CrossRef]
  82. Guo, Y.X.; Liu, Q.B.; Zhou, F. Microstructure and properties of Fe5Cr5SiTiCoNbMoW coating by laser cladding. Surf. Eng. 2018, 34, 283. [Google Scholar] [CrossRef]
  83. Jiang, L.; Cui, X.; Jin, G.; Tian, H.; Tian, Z.; Zhang, X.; Wan, S. Synthesis and microstructure, properties characterization of Ni-Ti-Cu/Cu-Al functionally graded coating on Mg–Li alloy by laser cladding. Appl. Surf. Sci. 2022, 575, 151645. [Google Scholar] [CrossRef]
  84. Zhang, X.; Cui, X.; Jin, G.; Ding, Q.; Zhang, D.; Wen, X.; Jiang, L.; Wan, S.; Tian, H. Microstructure evolution and properties of NiTiCrNbTax refractory high-entropy alloy coatings with variable Ta content. J. Alloy. Compd. 2021, 891, 161756. [Google Scholar] [CrossRef]
  85. Cui, C.; Wu, M.; Miao, X.; Zhao, Z.; Gong, Y. Microstructure and corrosion behavior of CeO2/FeCoNiCrMo high-entropy alloy coating prepared by laser cladding. J. Alloy. Compd. 2021, 890, 161826. [Google Scholar] [CrossRef]
  86. Vyas, A.; Menghani, J.; Natu, H. Influence of WC particle on the metallurgical, mechanical, and corrosion behavior of AlFeCuCrCoNi-WCx high-entropy alloy coatings. J. Mater. Eng. Perform. 2021, 30, 2449–2461. [Google Scholar] [CrossRef]
  87. Li, X.; Yang, X.; Yi, D.; Liu, B.; Zhu, J.; Li, J.; Gao, C.; Wang, L. Effects of NbC content on microstructural evolution and mechanical properties of laser cladded Fe50Mn30Co10Cr10-xNbC composite coatings. Intermetallics 2021, 138, 107309. [Google Scholar] [CrossRef]
  88. Guan, H.; Chai, L.; Wang, Y.; Xiang, K.; Wu, L.; Pan, H.; Yang, M.; Teng, C.; Zhang, W. Microstructure and hardness of NbTiZr and NbTaTiZr refractory medium-entropy alloy coatings on Zr alloy by laser cladding. Appl. Surf. Sci. 2021, 549, 149338. [Google Scholar] [CrossRef]
  89. Zhang, S.; Han, B.; Li, M.; Zhang, Q.; Hu, C.; Jia, C.; Li, Y.; Wang, Y. Microstructure and high temperature erosion behavior of laser cladded CoCrFeNiSi high entropy alloy coating. Surf. Coat. Technol. 2021, 417, 127218. [Google Scholar] [CrossRef]
  90. Liu, H.; Li, X.; Hua, P.; Song, K.; Teng, P.; Zhou, W. Microstructure and properties of laser-cladded Fe50Mn30Co10Cr10 high entropy alloy coatings. J. Therm. Spray Tech. 2022. [Google Scholar] [CrossRef]
  91. Cui, Y.; Shen, J.; Manladan, S.M.; Geng, K.; Hua, S. Wear resistance of FeCoCrNiMnAlx high-entropy alloy coatings at high temperature. Appl. Surf. Sci. 2020, 512, 145736. [Google Scholar] [CrossRef]
  92. Du, C.; Hu, L.; Ren, X.; Li, Y.; Zhang, F.; Liu, P.; Li, Y. Cracking mechanism of brittle FeCoNiCrAl HEA coating using extreme high-speed laser cladding. Surf. Coat. Technol. 2021, 424, 127617. [Google Scholar] [CrossRef]
  93. Cai, Y.; Sun, D.; Cui, Y.; Manladan, S.M.; Wang, T.; Shan, M.; Han, J. Effect of CoCrFeMnNi transition cladding layer on crack resistance of CoCrFeMnNi + x(TiC) composite cladding layer. Mater. Lett. 2021, 304, 130700. [Google Scholar] [CrossRef]
  94. Meng, G.H.; Protasova, N.A.; Kruglov, E.P.; Lin, X.; Xie, H.; Ding, X. Solidification behavior and morphological evolution in laser surface forming of AlCoCrCuFeNi multi-layer high-entropy alloy coatings on AZ91D. J. Alloy. Compd. 2019, 772, 994. [Google Scholar] [CrossRef]
  95. Yan, G.; Zhen, M.; Ye, Z.; Gu, J.; Li, C.; Wu, C.; Wang, B. In-situ Ti(C, N) reinforced AlCoCrFeNiSi-based high entropy alloy coating with functional gradient double-layer structure fabricated by laser cladding. J. Alloy. Compd. 2021, 886, 161252. [Google Scholar] [CrossRef]
  96. Luo, J.; Gao, J.J.; Gou, S.W.; Li, Y.L.; Lin, H.X.; Wu, X.R.; Qi, S.Y. Study on microstructure and mechanical properties of Ni60+WC/Ni35/AISI1040 functional surface gradient structure of remanufacturing chute plate for the mining scraper by a low cost high power CO2 laser cladding technique. Mater. Res. Express 2020, 7, 086521. [Google Scholar] [CrossRef]
  97. Lee, C.; Park, H.; Yoo, J.; Lee, C.; Woo, W.C.; Park, S. Residual stress and crack initiation in laser clad composite layer withCo-based alloy and WC + NiCr. Appl. Surf. Sci. 2015, 345, 286–294. [Google Scholar] [CrossRef]
  98. Zhang, P.; Liu, Z. Machinability investigations on turning of Cr-Ni-based stainless steel cladding formed by laser cladding process. Int. J. Adv. Manuf. Technol. 2016, 82, 1707–1714. [Google Scholar] [CrossRef]
  99. Desale, G.R.; Paul, C.P.; Gandhi, B.K.; Jain, S.C. Erosion wear behavior of laser clad surfaces of low carbon austenitic steel. Wear 2009, 266, 975–987. [Google Scholar] [CrossRef]
  100. Mendez, P.F.; Barnes, N.; Bell, K.; Borle, S.D.; Gajapathi, S.S.; Guest, S.D.; Izadi, H.; Gol, A.K.; Wood, G. Welding processes for wear resistant overlays. J. Manuf. Proc. 2014, 16, 4–25. [Google Scholar] [CrossRef]
  101. Mueller-Grunz, A.; Alveen, P.; Rassbach, S.; Useldinger, R.; Moseley, S. The manufacture and characterization of WC-(Al)CoCrCuFeNi cemented carbides with nominally high entropy alloy binders. Int. J. Refract. Met. Hard Mater. 2019, 84, 105032. [Google Scholar] [CrossRef]
Figure 1. Scheme showing the laser cladding systems for coaxial (left) and preplaced (right) powder cases. Reprinted with permission from Ref. [1]. Copyright 2021 Elsevier.
Coatings 12 00343 g001
Figure 2. Scheme explaining the GB wetting phenomena in a binary A–B phase diagram. The bulk phase transformations are shown by the thick lines. The tie-lines at Twmin and Twmax are for the GB wetting by the liquid phase and are shown by the thin lines. On the right-hand side of the diagram the micrographs are shown for the microstructure of Al–Mg samples. Case (a) is for the alloy annealed above Twmax (in this sample all GBs were completely wetted). Case (b) is for the alloy annealed between Twmin and Twmax (in this sample several GBs are fully wetted and the other GBs are incompletely wetted). Case (c) is for the alloy annealed below Twmin (no completely wetted GBs at all). The micrographs are reprinted with permission from Ref. [46].
Coatings 12 00343 g002
Figure 3. SEM micrographs of Mo0, Mo0.15, Mo0.20 and Mo0.25 HEA coatings (a) Mo0; (b) Mo0.15; (c) Mo0.20; (d) Mo0.25. The red points and letters A and B mark the locations of composition measurements. (e) Scheme with the binary phase diagram for the explanation of respective GB wetting processes. The dotted red arrows show the cooling trajectories corresponding to the micrographs (ad). Micrographs (ad) are reprinted with permission from Ref. [47]. Copyright 2021 Elsevier.
Coatings 12 00343 g003
Figure 4. (a) The microstructure of the cross-section of an AlCoCrFeNiTi0.5 coating. (b) Local magnified view of dotted frame in (a). (c) Schematic phase diagram with GB wetting tie-lines. The dotted red arrow shows the cooling trajectory corresponding to the micrographs (a,b). Micrographs (a,b) are reprinted with permission from Ref. [62]. Copyright 2021 Elsevier.
Coatings 12 00343 g004
Figure 5. TEM micrographs for the AlCoCrFeNiTi0.5 coating: (a) bright field image of DR and IR phases, (b) SADP of bulk area A, (c) SADP of GB area B, (d) SADP of GB area C. Reprinted with permission from Ref. [62]. Copyright 2021 Elsevier.
Coatings 12 00343 g005
Figure 6. XRD patterns of AlxCrFeCoNiCu HEA coatings. (a) coatings with low Al content, (b) coatings with medium-Al content. Reprinted with permission from Ref. [64]. Copyright 2021 Elsevier.
Coatings 12 00343 g006
Figure 7. The microstructure of coatings with low Al content. (a) FeCoNiCrCu. (b) is the enlarged image for Figure 7a. (c) Al0.1CrFeCoNiCu. (d) is the enlarged image for Figure 7c. (e) Al0.3CrFeCoNiCu. (f) is the enlarged image for Figure 7e. (g) Al0.5CrFeCoNiCu. (h) is the enlarged image for Figure 7g. DR1, 2, 3 and 4 show the points for concentration measurements inside the dendrites. IR1, 2, 3 and 4 show the points for concentration measurements between the dendrites. Reprinted with permission from Ref. [64]. Copyright 2021 Elsevier.
Coatings 12 00343 g007
Figure 8. The microstructure of coatings with medium Al content. (a) Al0.7CrFeCoNiCu. (b) is the enlarged image for Figure 8a. (c) Al0.8CrFeCoNiCu. (d) is the enlarged image for Figure 8c. (e) Al1.0CrFeCoNiCu. (f) is the enlarged image for Figure 8e. (g) Schematic phase diagram with GB wetting tie-lines. The dotted red arrows with Al concentrations on the top show the cooling trajectories corresponding to the micrographs in Figure 7 and Figure 8. Micrographs (af) are reprinted with permission from Ref. [64]. Copyright 2021 Elsevier.
Coatings 12 00343 g008
Figure 9. SEM micrographs of Al16.80Co20.74Cr20.49Fe21.28Ni20.70 HEA coatings deposited with different laser scanning speeds: (a,b) are the coatings named as V7 and V9. They contain Widmanstätten side plate and nanoprecipitates; (ch) the coatings named as V11–V21 contain only nanoprecipitates, without Widmanstätten plate. Reprinted with permission from Ref. [70]. Copyright 2021 Elsevier.
Coatings 12 00343 g009
Figure 10. (a) XRD patterns for the HEA coatings ((CoCrFeNi)95Nb5)100−xMox (x = 1, 1.5, 2), (bd) SEM images for the microstructure of the HEA coatings ((CoCrFeNi)95Nb5)100−xMox (x = 1, 1.5, 2). Reprinted with permission from Ref. [71]. Copyright 2021 MDPI.
Coatings 12 00343 g010
Figure 11. (a) XRD patterns of the ((CoCrFeNi)95Nb5)99Mo1 HEA coatings prepared under various power values of laser beam. (bd) SEM images of the microstructure for HEA coatings ((CoCrFeNi)95Nb5)99Mo1 prepared under various power values of laser beam. Reprinted with permission from Ref. [71]. Copyright 2021 MDPI.
Coatings 12 00343 g011
Figure 12. Back scattered electron images of longitudinal-section of FeCoCrNiWC coating deposited by the laser cladding: (a) microstructure of the coating; (b) magnification of the top region; (c) magnification of the middle region; (d) magnification of the bottom region. Reprinted with permission from Ref. [26]. Copyright 2019 Elsevier.
Coatings 12 00343 g012
Figure 13. SEM micrographs of MgMoNbFeTi2Yx HEAs (a) x = 0, (b) x = 0.4%, (c) x = 0.8%, (d) x = 1.2%. The black arrows in Figure 13a show the particles of iron, magnesium and yttrium oxides. The red circles in Figure 13a,b mark black particles of intermetallic compounds. Reprinted with permission from Ref. [78]. Copyright 2020 Elsevier.
Coatings 12 00343 g013
Figure 14. SEM micrographs of MgMoNbFeTi2Yx HEAs with x = 0.4% (a), x = 0.8% (b), and x = 1.2% (c). Reprinted with permission from Ref. [78]. Copyright 2020 Elsevier.
Coatings 12 00343 g014
Figure 15. Scheme of the separated layer cladding method for the FeCoCrNiMnAlx HEA coatings. (a) First pass, a complete cladding layer. (b) Second pass, decrease of the volume of the cladding layer due to insufficient powder. (c) Separated layer cladding method. (d) The cladding layers with odd numbers are produced first. (e) The gaps between adjacent cladding layers are then filled with the powder, and then the even-numbered cladding layers were produced to complete the laser cladding process. Reprinted with permission from Ref. [91]. Copyright 2020 Elsevier.
Coatings 12 00343 g015
Figure 16. Scheme of the laser cladding process for a pipe coating. The normal direction (ND), transverse direction (TD), and cladding direction (CD) are indicated. Reprinted with permission from Ref. [92]. Copyright 2021 Elsevier.
Coatings 12 00343 g016
Figure 17. Microstructure of FeCoNiCrAl coating: (a) on carbon steel pipe, (b) on stainless steel pipe. Reprinted with permission from Ref. [92]. Copyright 2021 Elsevier.
Coatings 12 00343 g017
Figure 18. SEM micrographs of the cross-section of the H13 steel substrate (bottom), HEA cladding layer (middle) and CoCrFeMnNi + x(TiC) composite coating (top). Reprinted with permission from Ref. [93]. Copyright 2021 Elsevier.
Coatings 12 00343 g018
Figure 19. SEM micrograph revealing the morphologies on the both side of the re-melted boundary between 1st and 2nd layers of the AlCoCrCuFeNi HEA coating (denoted by the line). Reprinted with permission from Ref. [94]. Copyright 2019 Elsevier.
Coatings 12 00343 g019
Figure 20. The HEA gradient coating: the hardness depth profile. The microstructures are placed at corresponding depth. The meaning of Zones I to V is explained in the text. Reprinted with permission from Ref. [95]. Copyright 2021 Elsevier.
Coatings 12 00343 g020
Figure 21. The microstructures with EBSD and EDS results of in the zone I (see Figure 12), (a) EBSD band contrast (BC) map, (b) EBSD phase map, (cf) EDS element distribution maps for Si, Ti, N and C. Reprinted with permission from Ref. [95]. Copyright 2021 Elsevier.
Coatings 12 00343 g021
Publisher’s Note: MDPI stays neutral with regard to jurisdictional claims in published maps and institutional affiliations.

