Based on the basic tests’ results stated in
Section 4.1, it can be concluded that the monitored properties of the NBR coating using 25% of waste windshield glass—shards—were very similar to the properties of the reference material, i.e., filler of rounded particles. It was chosen for further testing, namely, testing the filler particle shape’s influence on the chemical resistance, which was the focus of this research, not only for this reason but also regarding the specific shape of the particles of ground shards—sharp-edged particles. Furthermore, the NBR-GF formulation containing glass flakes, which were added to the polymer coatings to improve their chemical resistance, and the NBR-REF reference coating were also subjected to this testing. Thus, differently shaped particles were chosen to monitor the influence of the selected filler on the chemical resistance. The contact zone between the filler and the binder was also unique for all tested formulations. This test was not normative; its methodology was designed to be applicable under laboratory conditions and to be evaluable.
4.2.1. Visual Assessment
The visual assessment evaluation of the chemical resistance of the NBR epoxy coating material containing the silica flour filler with rounded parts—the NBR-REF formulation—is presented in
Table 6. It follows from the results that the coating was least resistant against 30% CH
2O
2, where complete degradation of the material already occurred after 90 days (5). Generally, the coating was best able to withstand the NaOH solution. Almusallam et al. [
49] stated that their epoxy and polyurethane coatings were found to be relatively intact, with just the corners of the specimens damaged, after 60 days in a 2.5% sulfuric acid solution. Dębska et al. [
50] found that in their samples of epoxy mortars immersed in aqueous solutions of acids, over time, the connection between the polymer matrix and aggregate weakened, which resulted in an increase in their weight and increasing fragility.
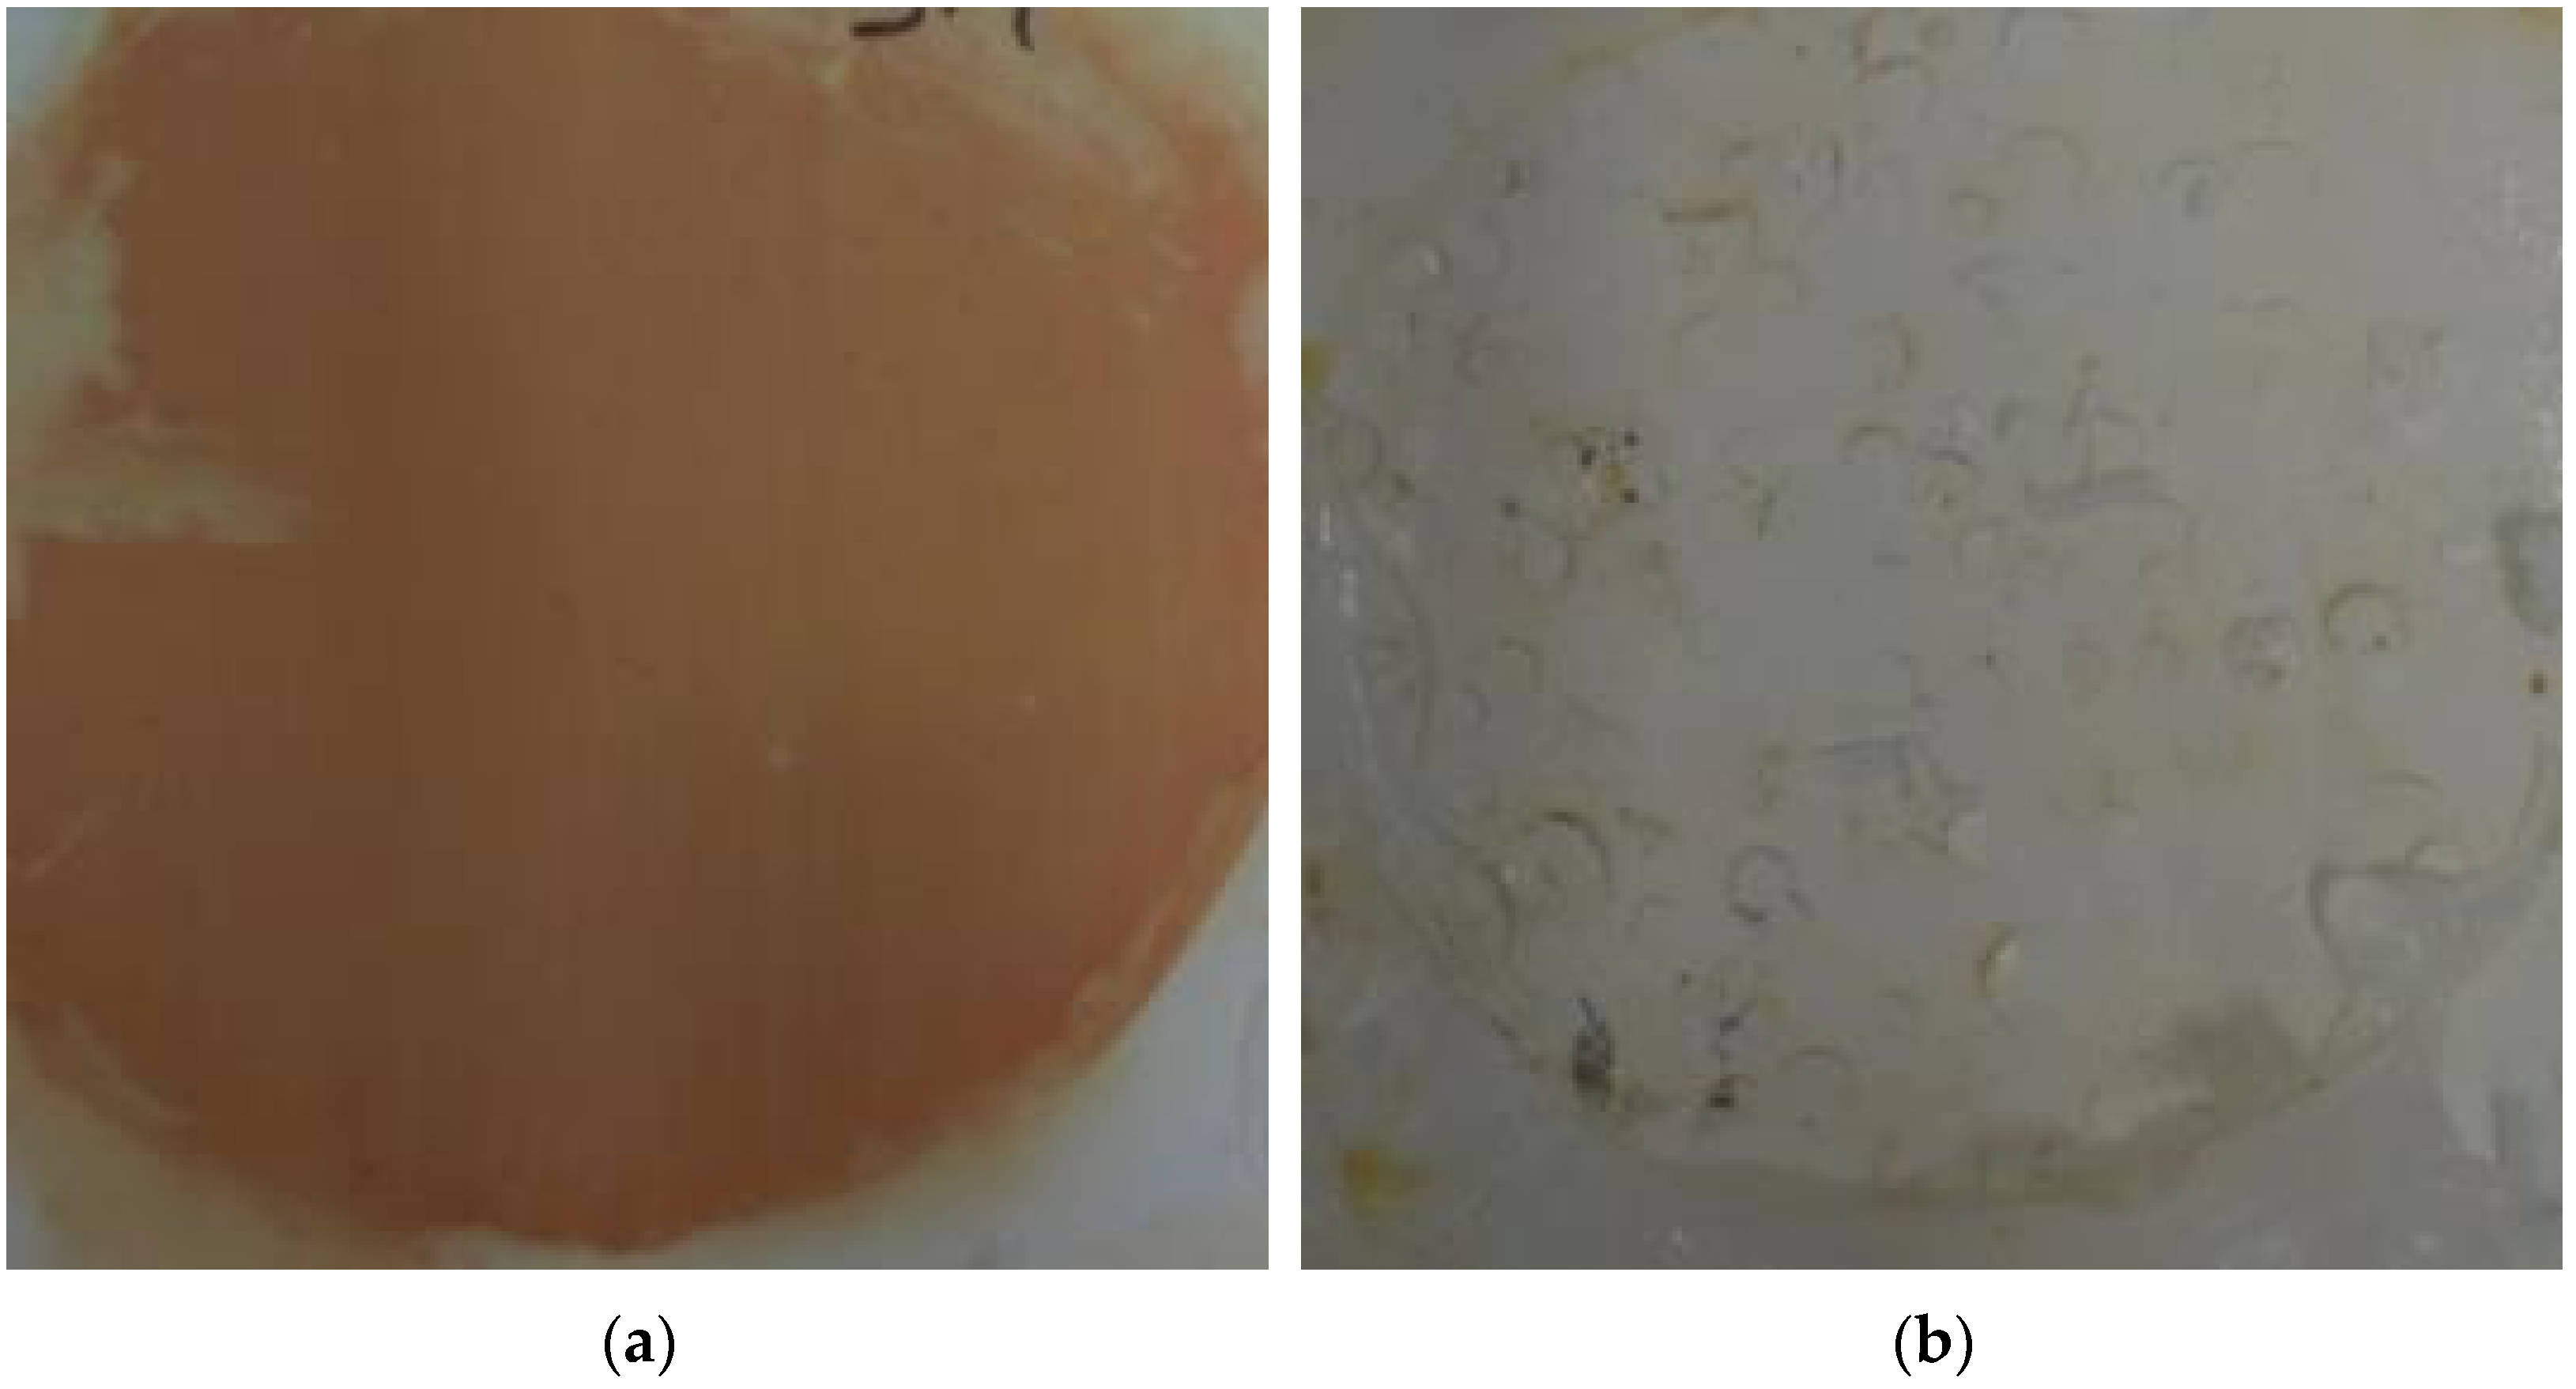
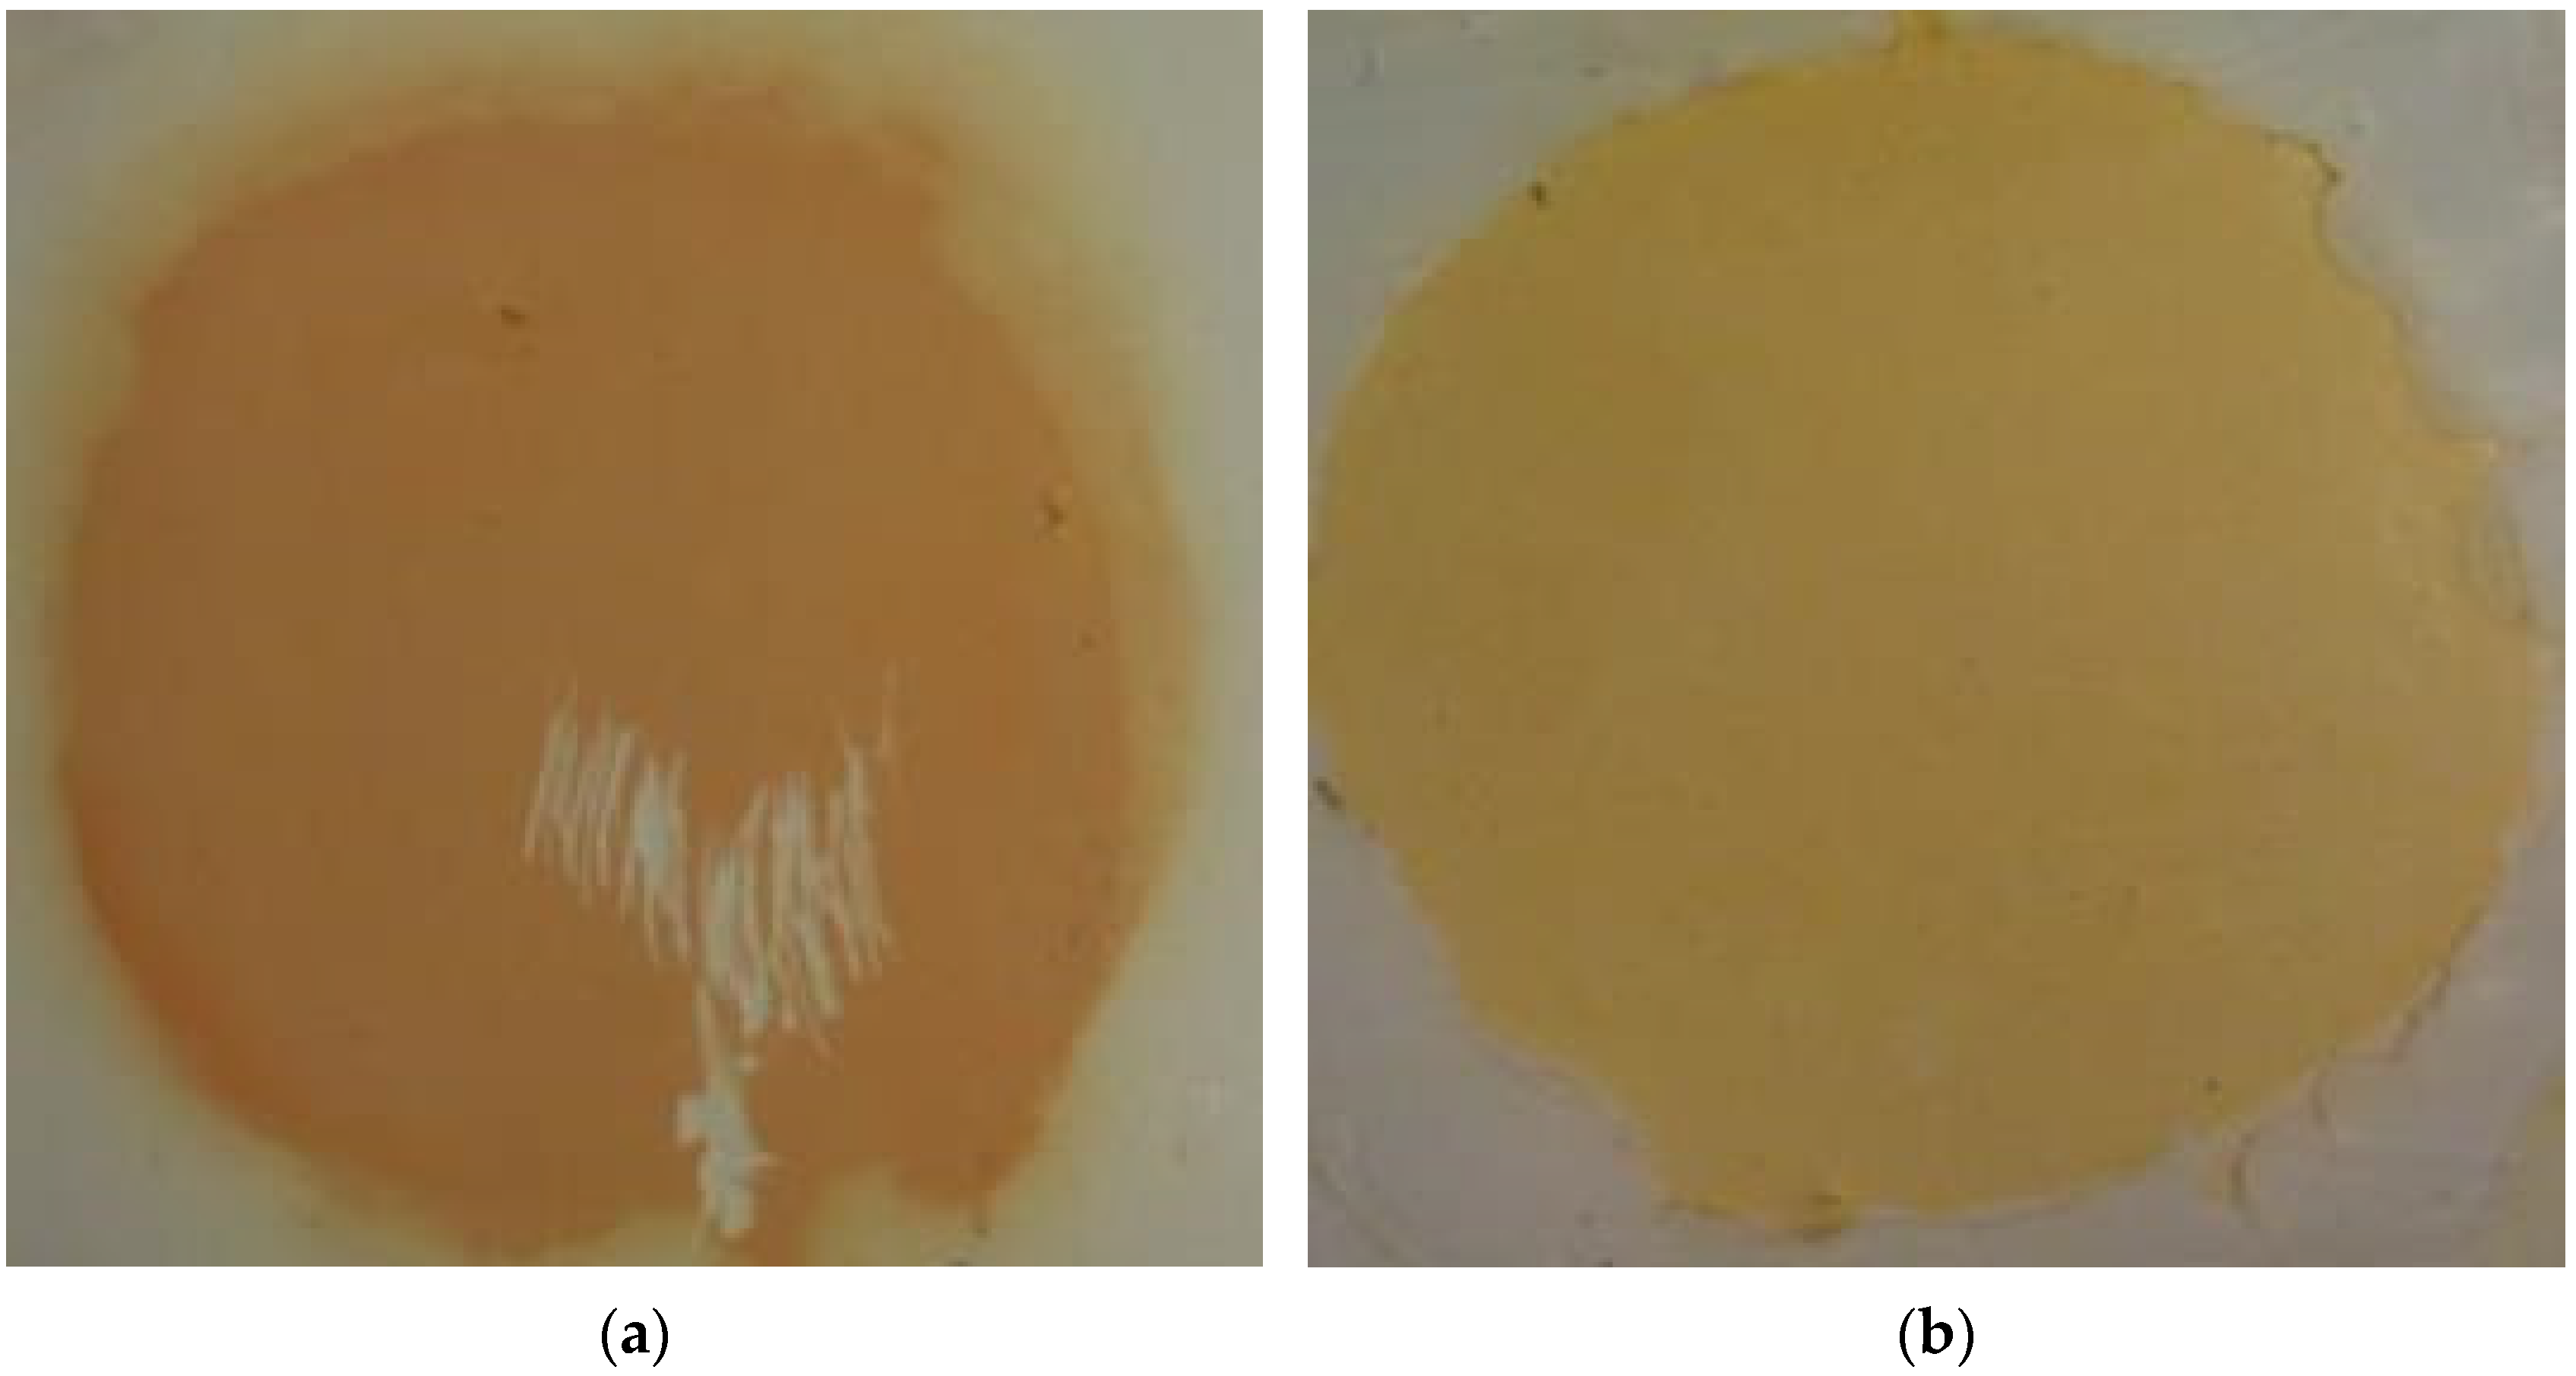
In
Figure 6a, the colour change of the coating can be seen after exposure to 30% HCl for 90 days, where only the surface colour has changed without any disruption, cracking, etc. Contrastingly,
Figure 6b depicts the same coating after 60 days of exposure to the 30% CH
2O
2 solution when the material peeled off the base and cracked.
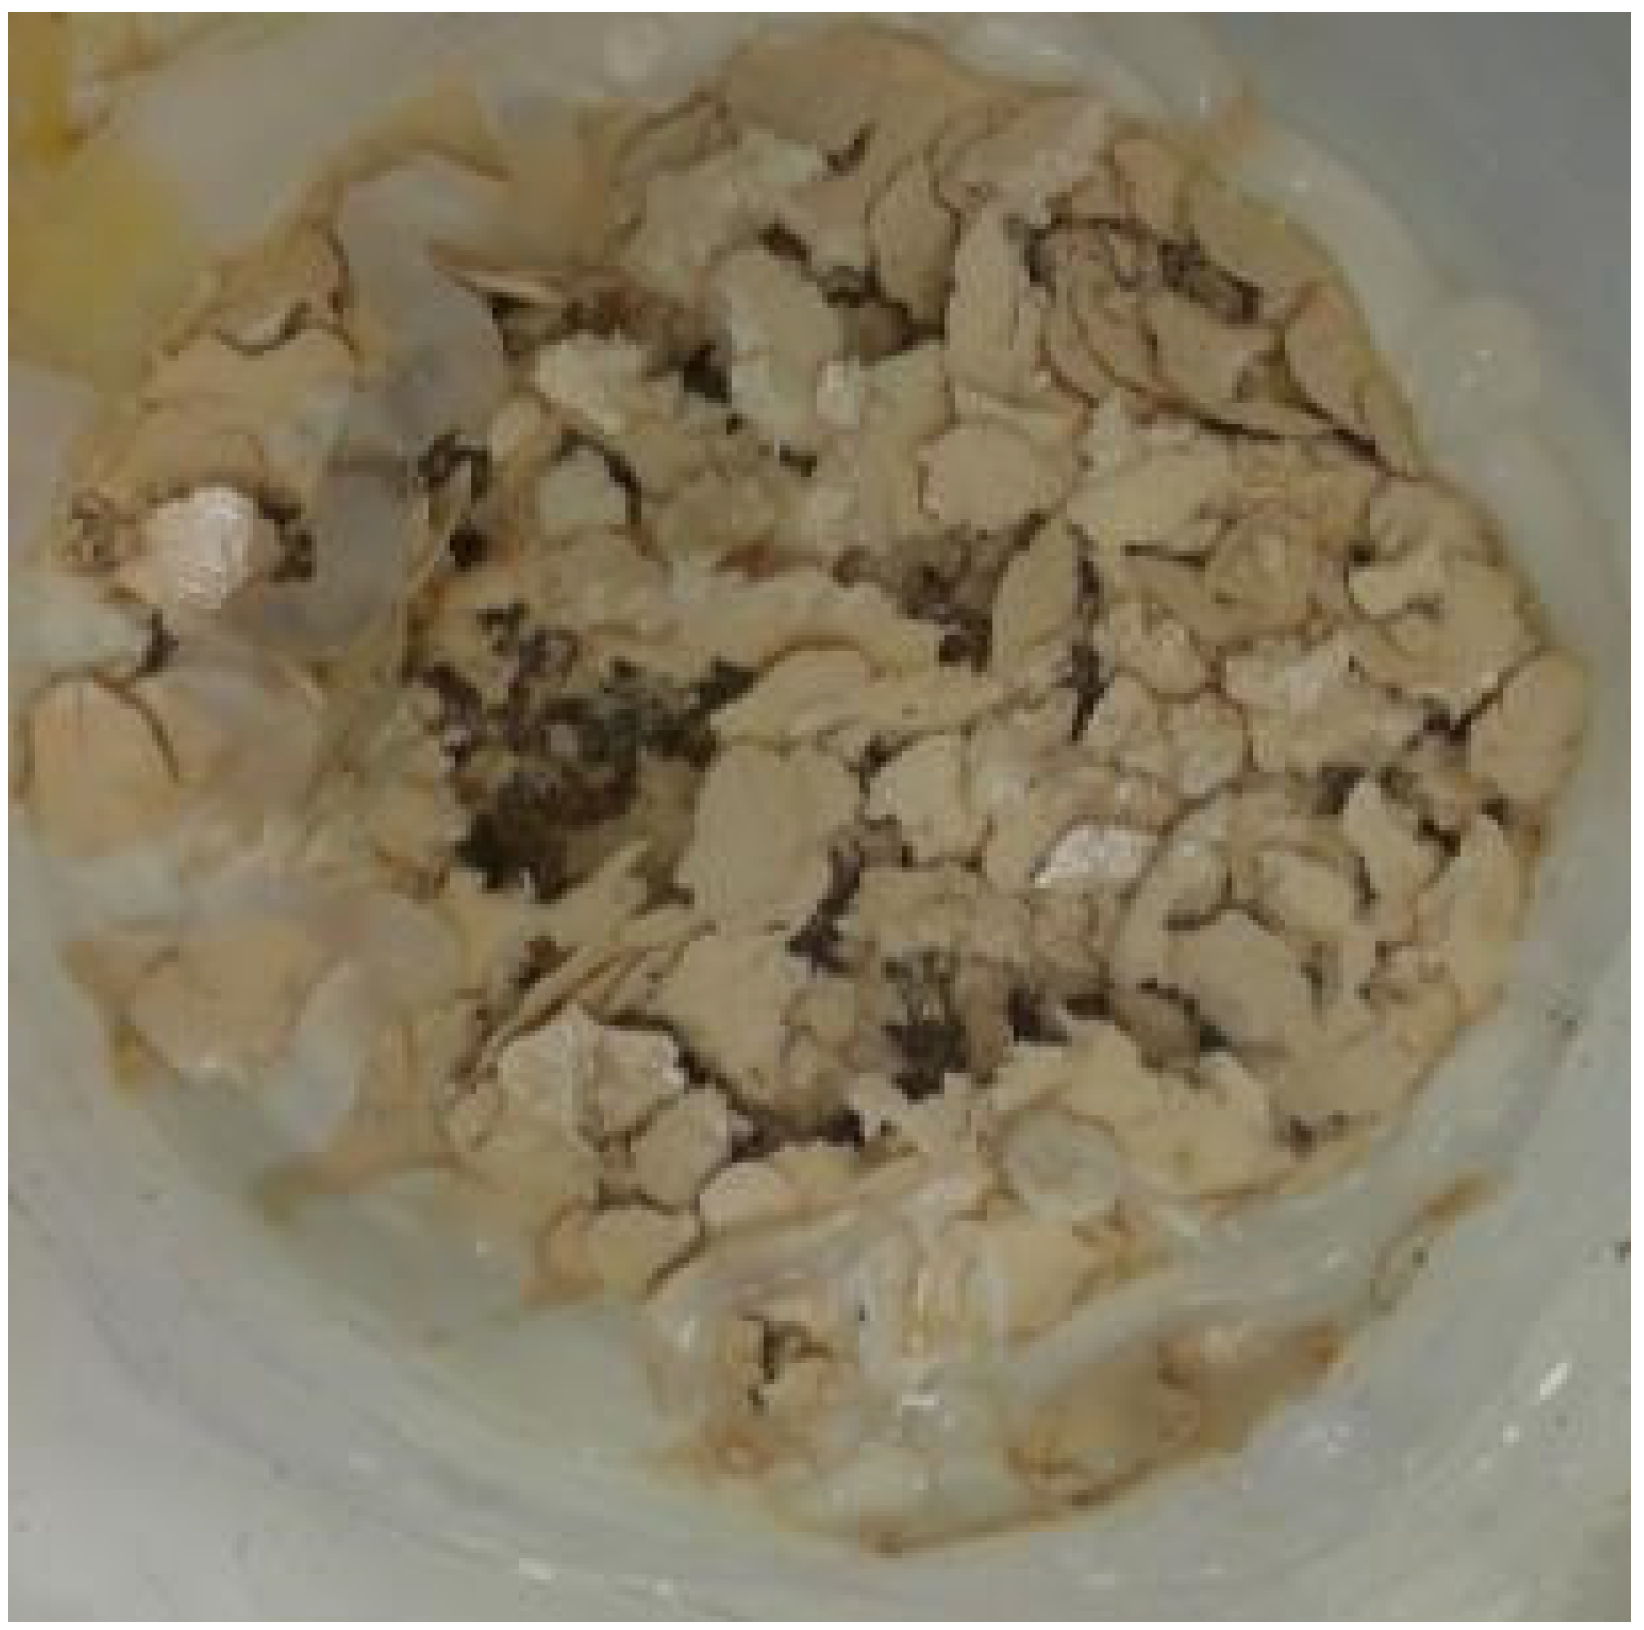
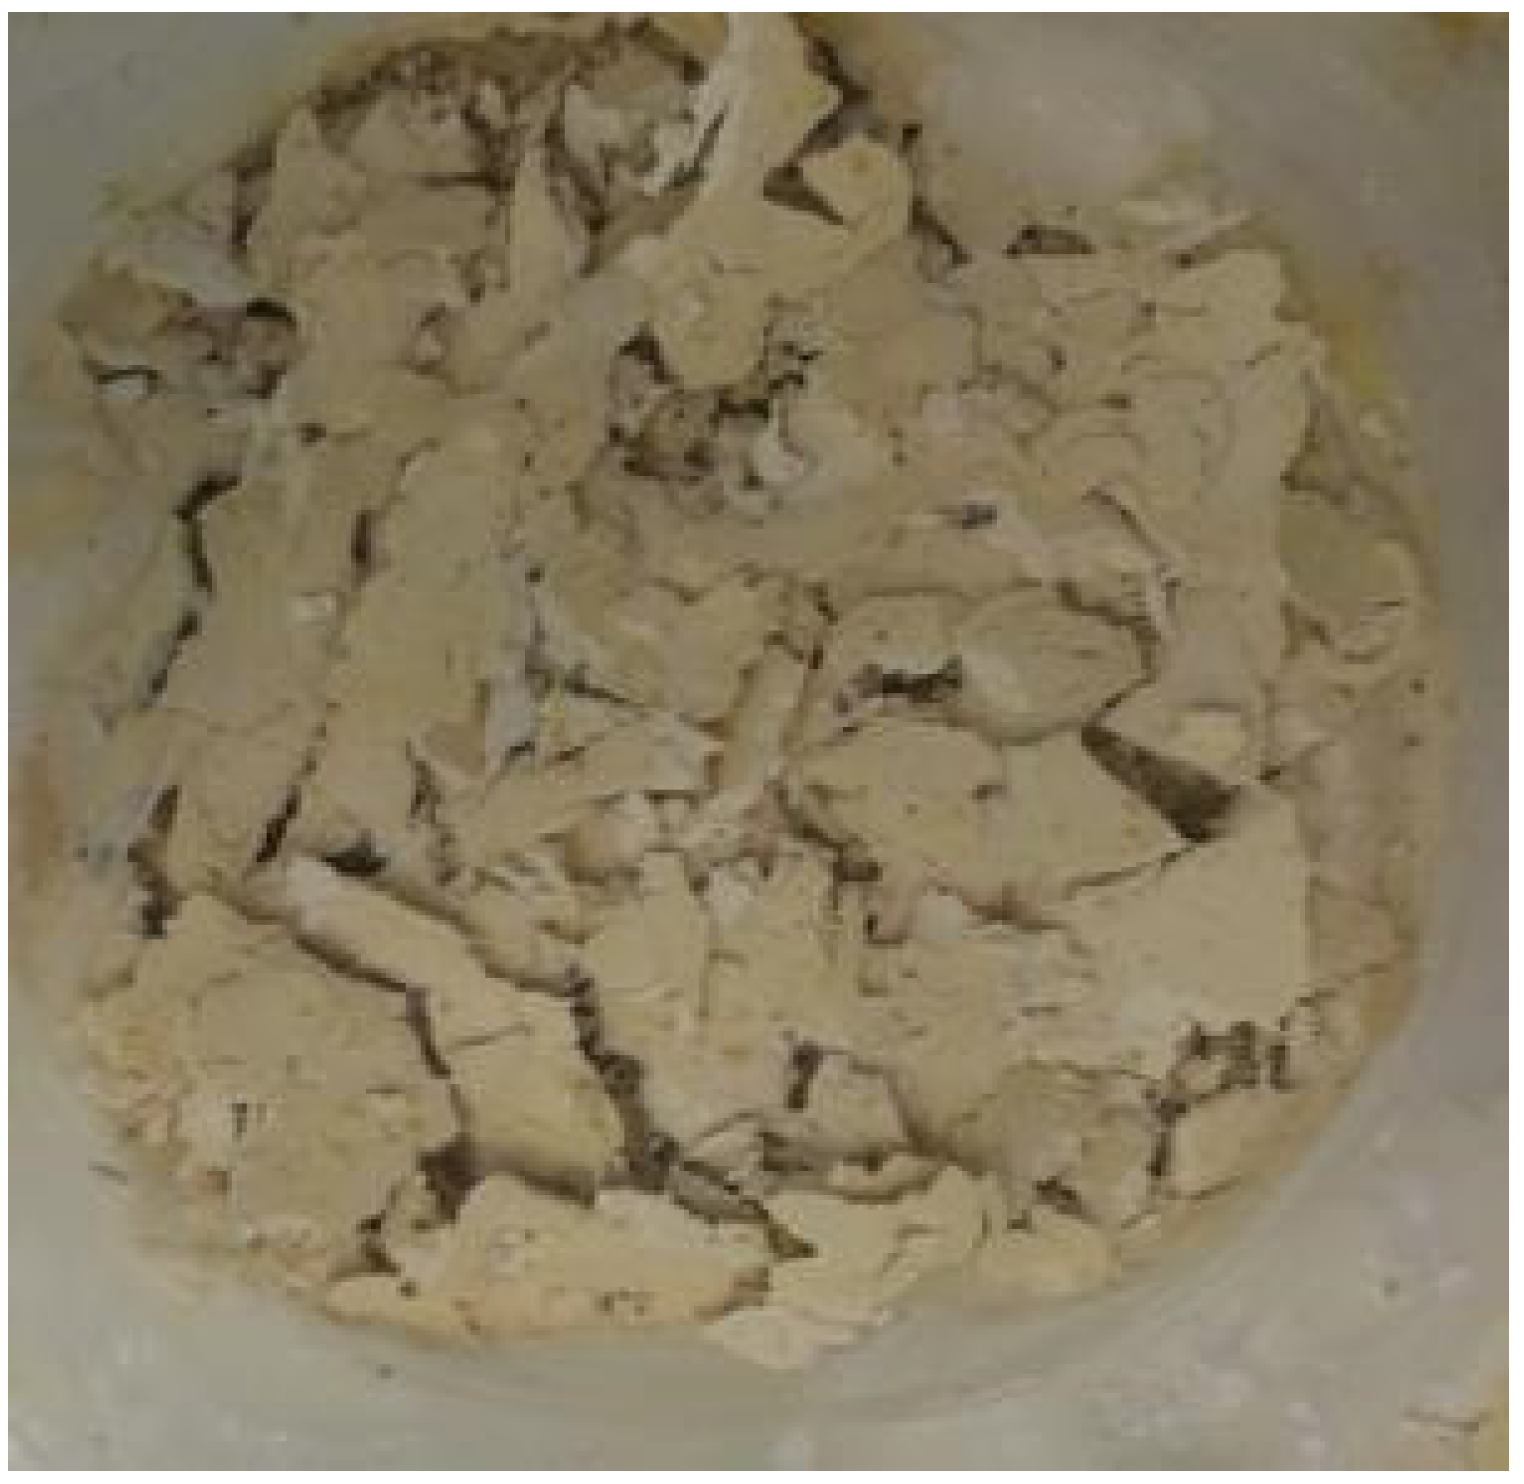
The total collapse of the polymer system of the NBR-REF coating with silica flour exposed to a chemically aggressive environment in the form of 30% CH
2O
2, which occurred after 120 days of exposure, is obvious from
Figure 7.
In recent years, anticorrosive coatings containing glass flakes are being investigated in relation to metal protection in highly corrosive media because they are expected to greatly prevent the aggressive solution’s transport through the polymeric matrix [
51]. The evaluation of the chemical resistance in terms of the visual assessment according to the NBR-GF assessment system is presented in
Table 7. As for the NBR-REF material, the maximum degradation was recorded after exposure to 30% CH
2O
2. Similarly, only slight colour changes occurred after exposure to inorganic acids and the NaOH solution.
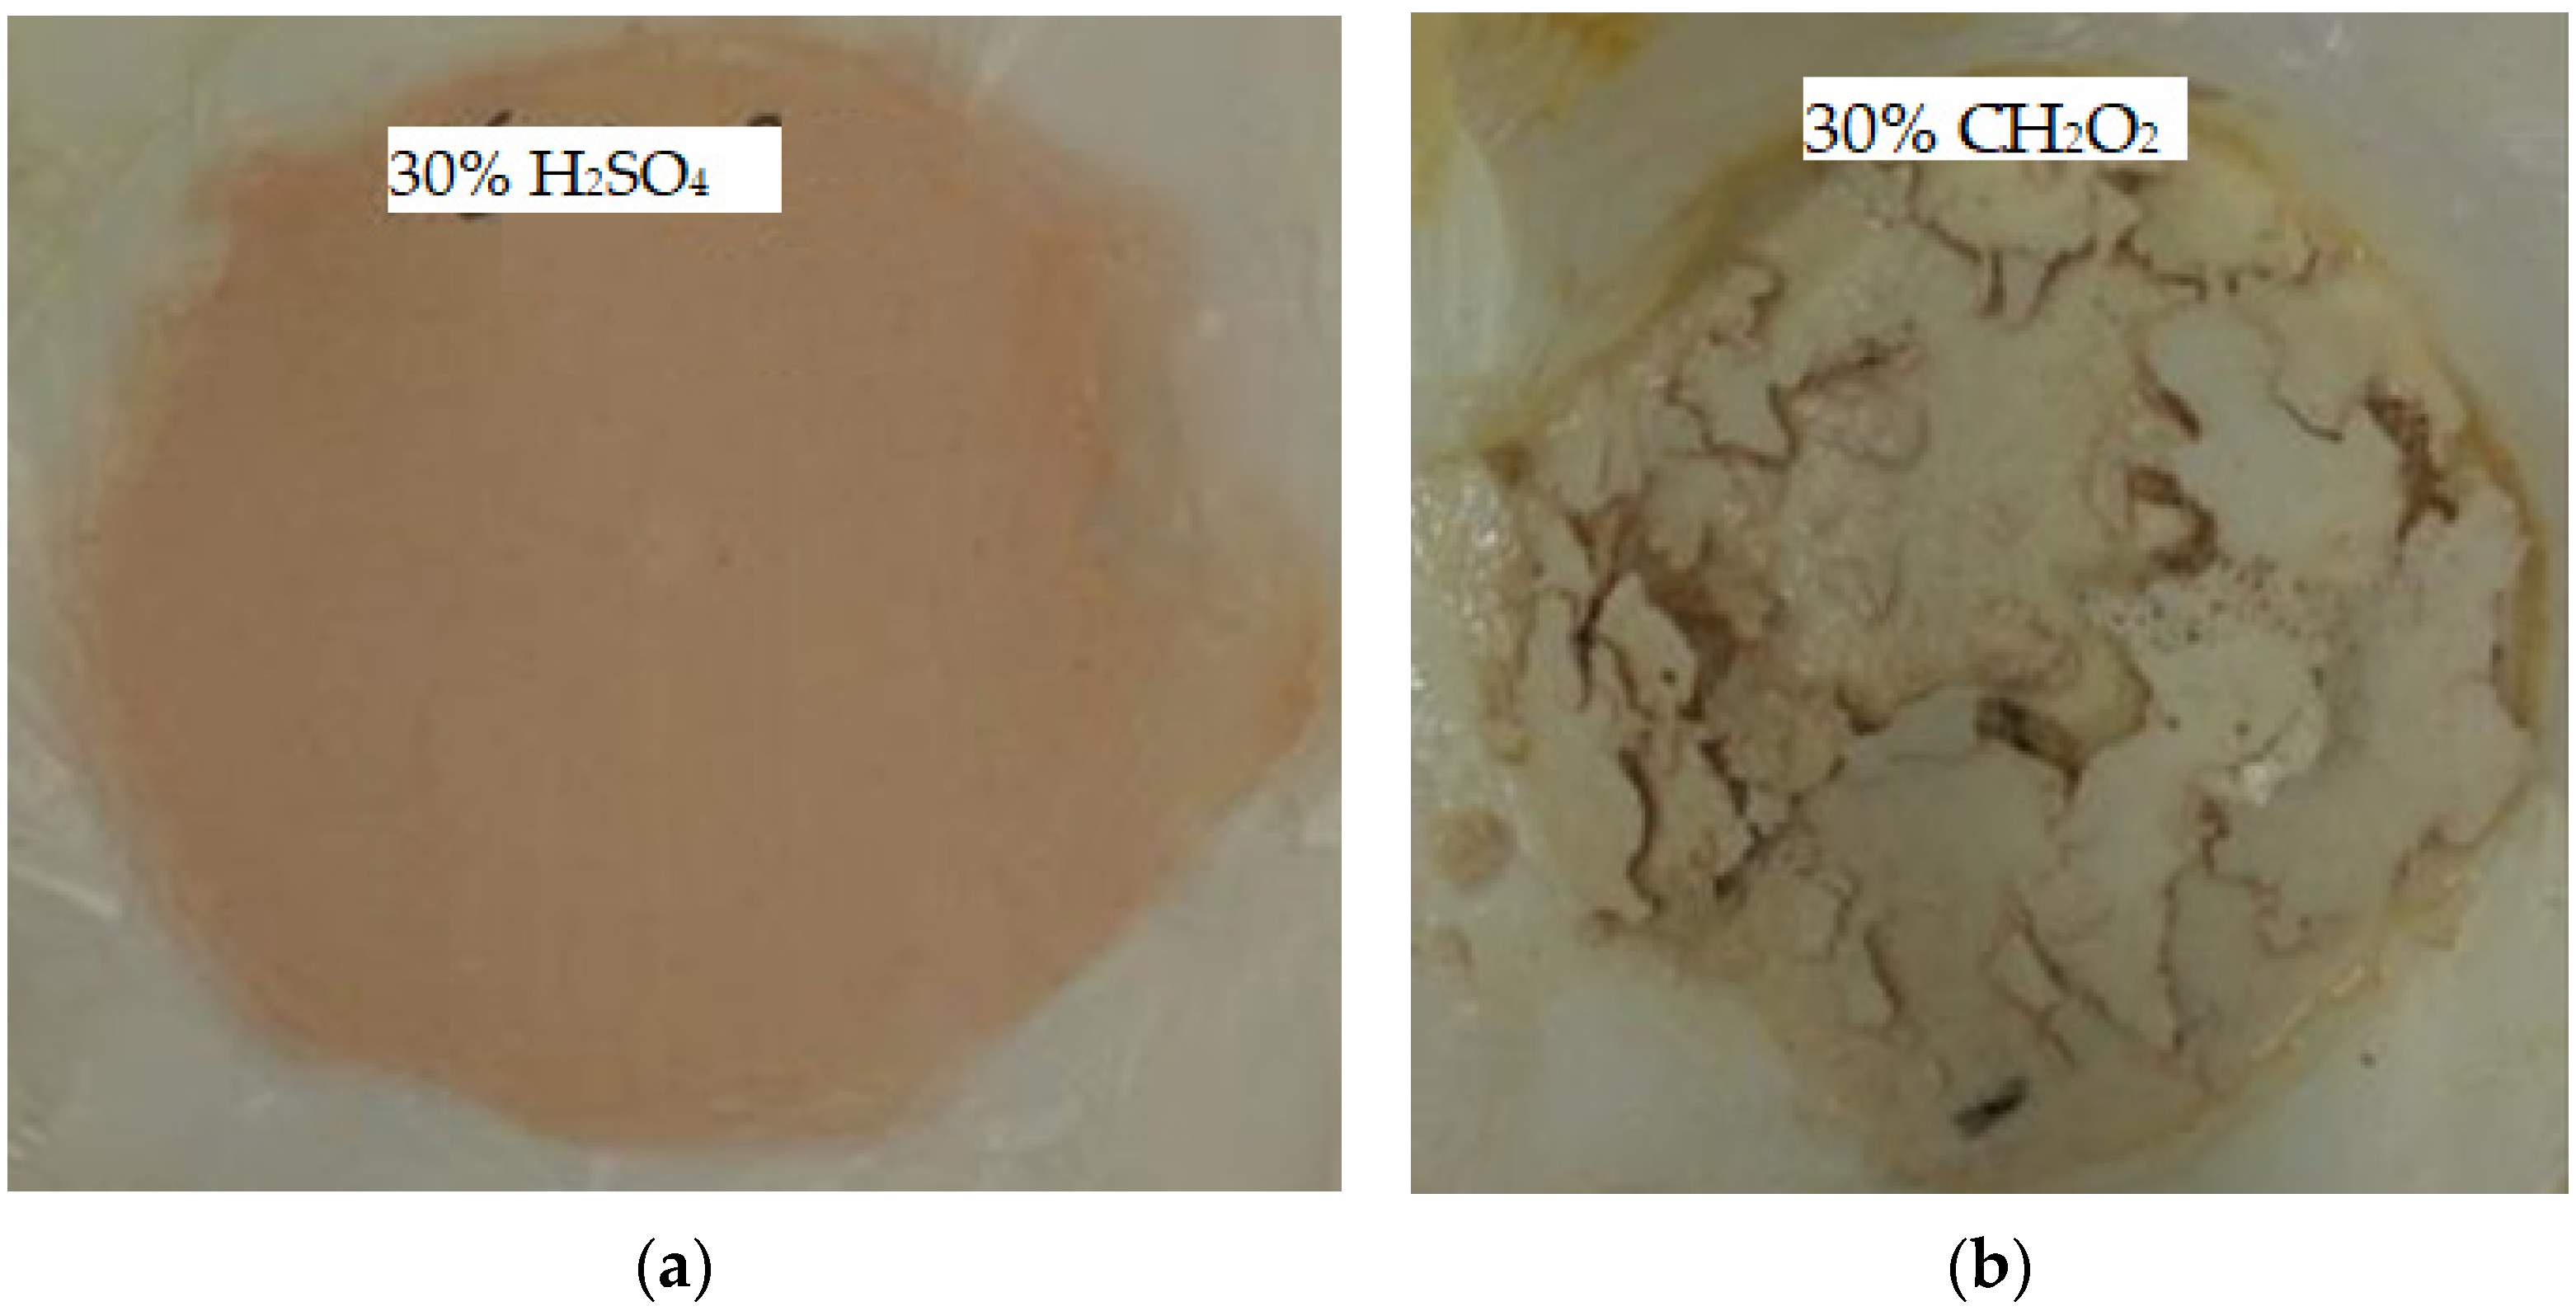
Figure 8a shows the surface of the NBR-GF coating sample exposed to 30% H
2SO
4 for 120 days, where only a colour change occurred. Pacheco-Torgal et al. [
52] stated that the use of the polymer impregnation process or coatings enhances the chemical resistance of hardened concrete used in the pipe industry against sulphuric acid.
Figure 8b illustrates the degradation of the polymer system after 90 days of exposure to 30% CH
2O
2, when glass flakes, in this case, as a filler, ensured the cohesion of larger pieces of the tested surface; therefore, the surface released from the base in cohesive pieces. It follows that the filler in the glass flakes has a positive influence on the chemical resistance against the tested organic acid.
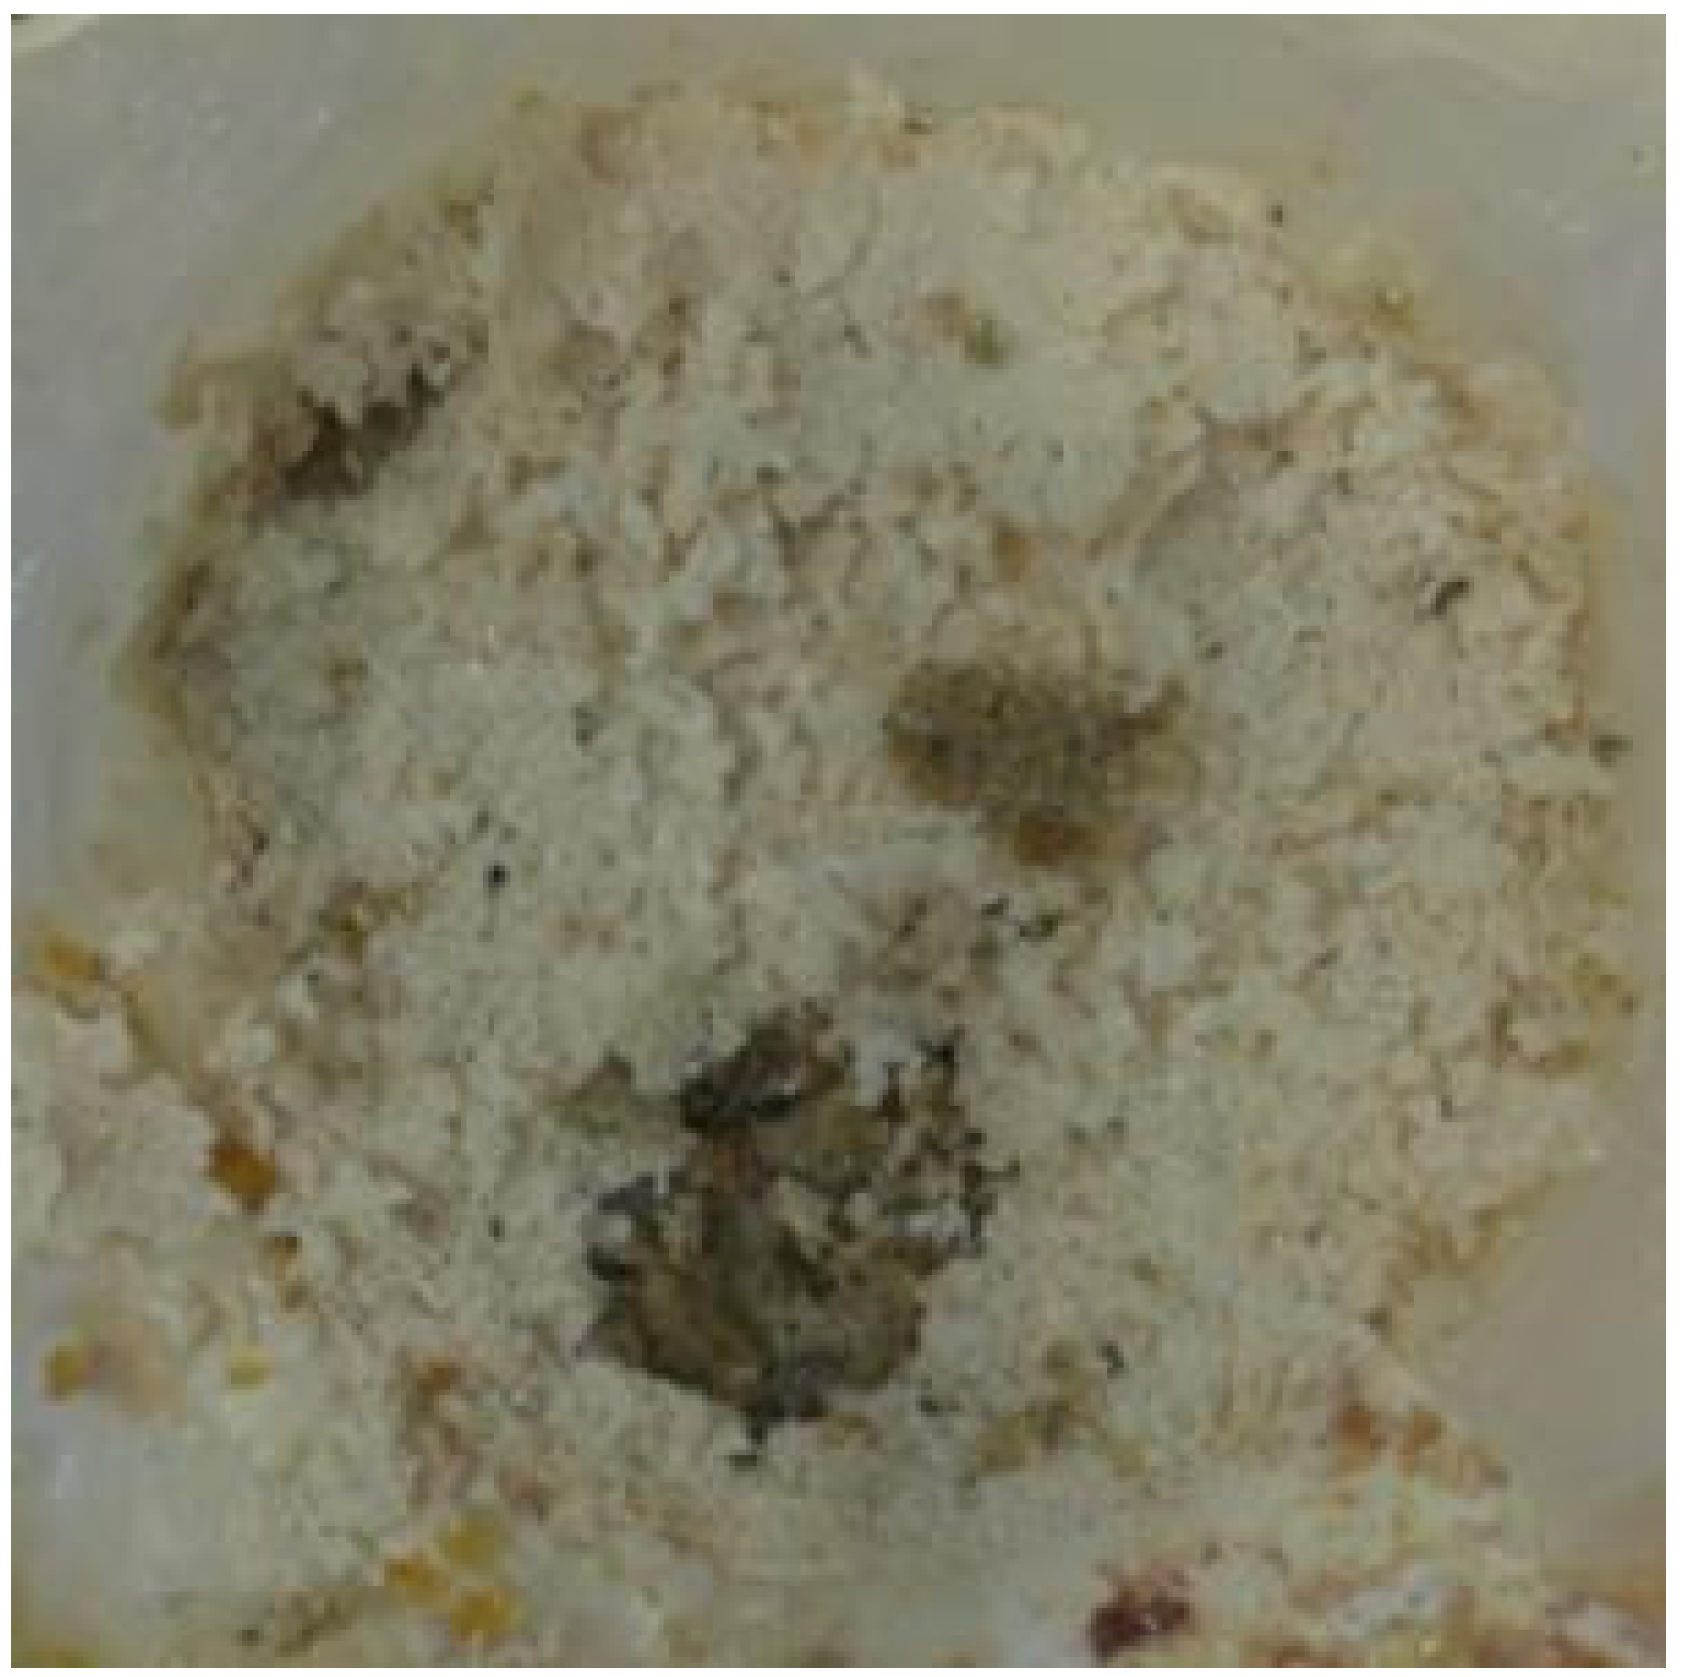
Figure 9 illustrates the NBR-GF coating containing glass flakes after another 30 days of exposure to 30% CH
2O
2—after 120 days in total—when initially cohesive pieces of the tested material almost degraded to dust, and the use of glass flakes did not prevent this significant degradation.
The evaluation of the chemical resistance of the coating containing sharp-edged shards from waste windshield glass (NBR-CW) as a filler is presented in
Table 8. By comparing the evaluation with other coatings containing only primary raw materials, it is possible to notice that the NBR-CW coating containing a secondary raw material shows slightly higher chemical resistance against weakly concentrated solutions. After 120 days of exposure to 5% H
2O
4, there was no colour change on the material’s surface. Total degradation of the material after exposure to 30% CH
2O
2 occurred anyway; however, after 90 days of exposure to 5% CH
2O
2, no visual changes on the surface of the material were monitored. It is possible to assume that a micro filler in the form of sharp-edged shards slightly improves the chemical resistance of epoxy coatings.
Figure 10a shows the surface of the NBR-CW sample in which only a colour change of the material occurred after exposure to 30% HCl for 90 days. After scratching the surface, it was possible to easily remove the coloured layer, by which it was found that the colouring is only superficial and does not go through the whole layer of the surface.
Figure 10b captures the colour change and surface cracks of the coating after 120 days of exposure to 5% CH
2O
2.
The visual assessment of the NBR-CW sample filled with ground shards from a windshield after exposure to 30% CH
2O
2 for 120 days (see
Figure 11) was classified by the value of 5—total collapse of the system. This was due to the complete degradation of the tested layer of the coating throughout its thickness.
Based on the evaluation of the chemical resistance, it can be concluded that in all tested chemically aggressive solutions, except for 30% CH2O2, the degradation of coatings did not start to show visually until 60 days, and therefore it was not necessary to assess the chemical resistance after 30 days of exposure to chemicals. As for 30% formic acid, it can be assumed that the first coating defects occurred after 14 days of exposure to this strong organic acid. Furthermore, it can be assumed that even after 180 days of the coatings’ exposure to the selected inorganic acid solutions, the functionality and integrity would not deteriorate significantly. On the other hand, exposure of the epoxy coatings to CH2O2, even at a weak 5% concentration, could lead to significant defects in the tested coatings.
The selected concentrations of 5% and 30% proved to be very suitable because it was possible to observe a difference in the resistance of the coatings to solutions of different concentrations, especially for the formic acid. With smaller differences in concentrations, it would not be possible to observe such significant changes in the chemical resistance of the coatings to the selected aggressive solutions. Epoxy coatings are only rarely exposed to higher concentrations of aggressive substances, and therefore solutions with higher concentrations, which could cause greater degradation of coatings, did not need to be tested.
4.2.2. Microscopic Analysis (SEM)
The structure of the NBR polymer coatings exposed to chemical substances was verified by scanning electron microscopy in the samples with a visual assessment of five. For all tested samples, they were always surfaces exposed to formic acid CH
2O
2 at a concentration of 30%. Additionally, they were always compared to a material that was not exposed to the chemically aggressive environment but had the same composition—reference coating with rounded particles, reference coating with glass flakes and reference coating with shards. The age of these reference (comparing) coating materials was 120 days. Tasnim et al. [
53] stated that SEM analysis showed evidence of micro gaps between fillers and the polymer matrix when exposed to chemicals, and these micro gaps slightly increased in width with an increase in the exposure duration to these solutions.
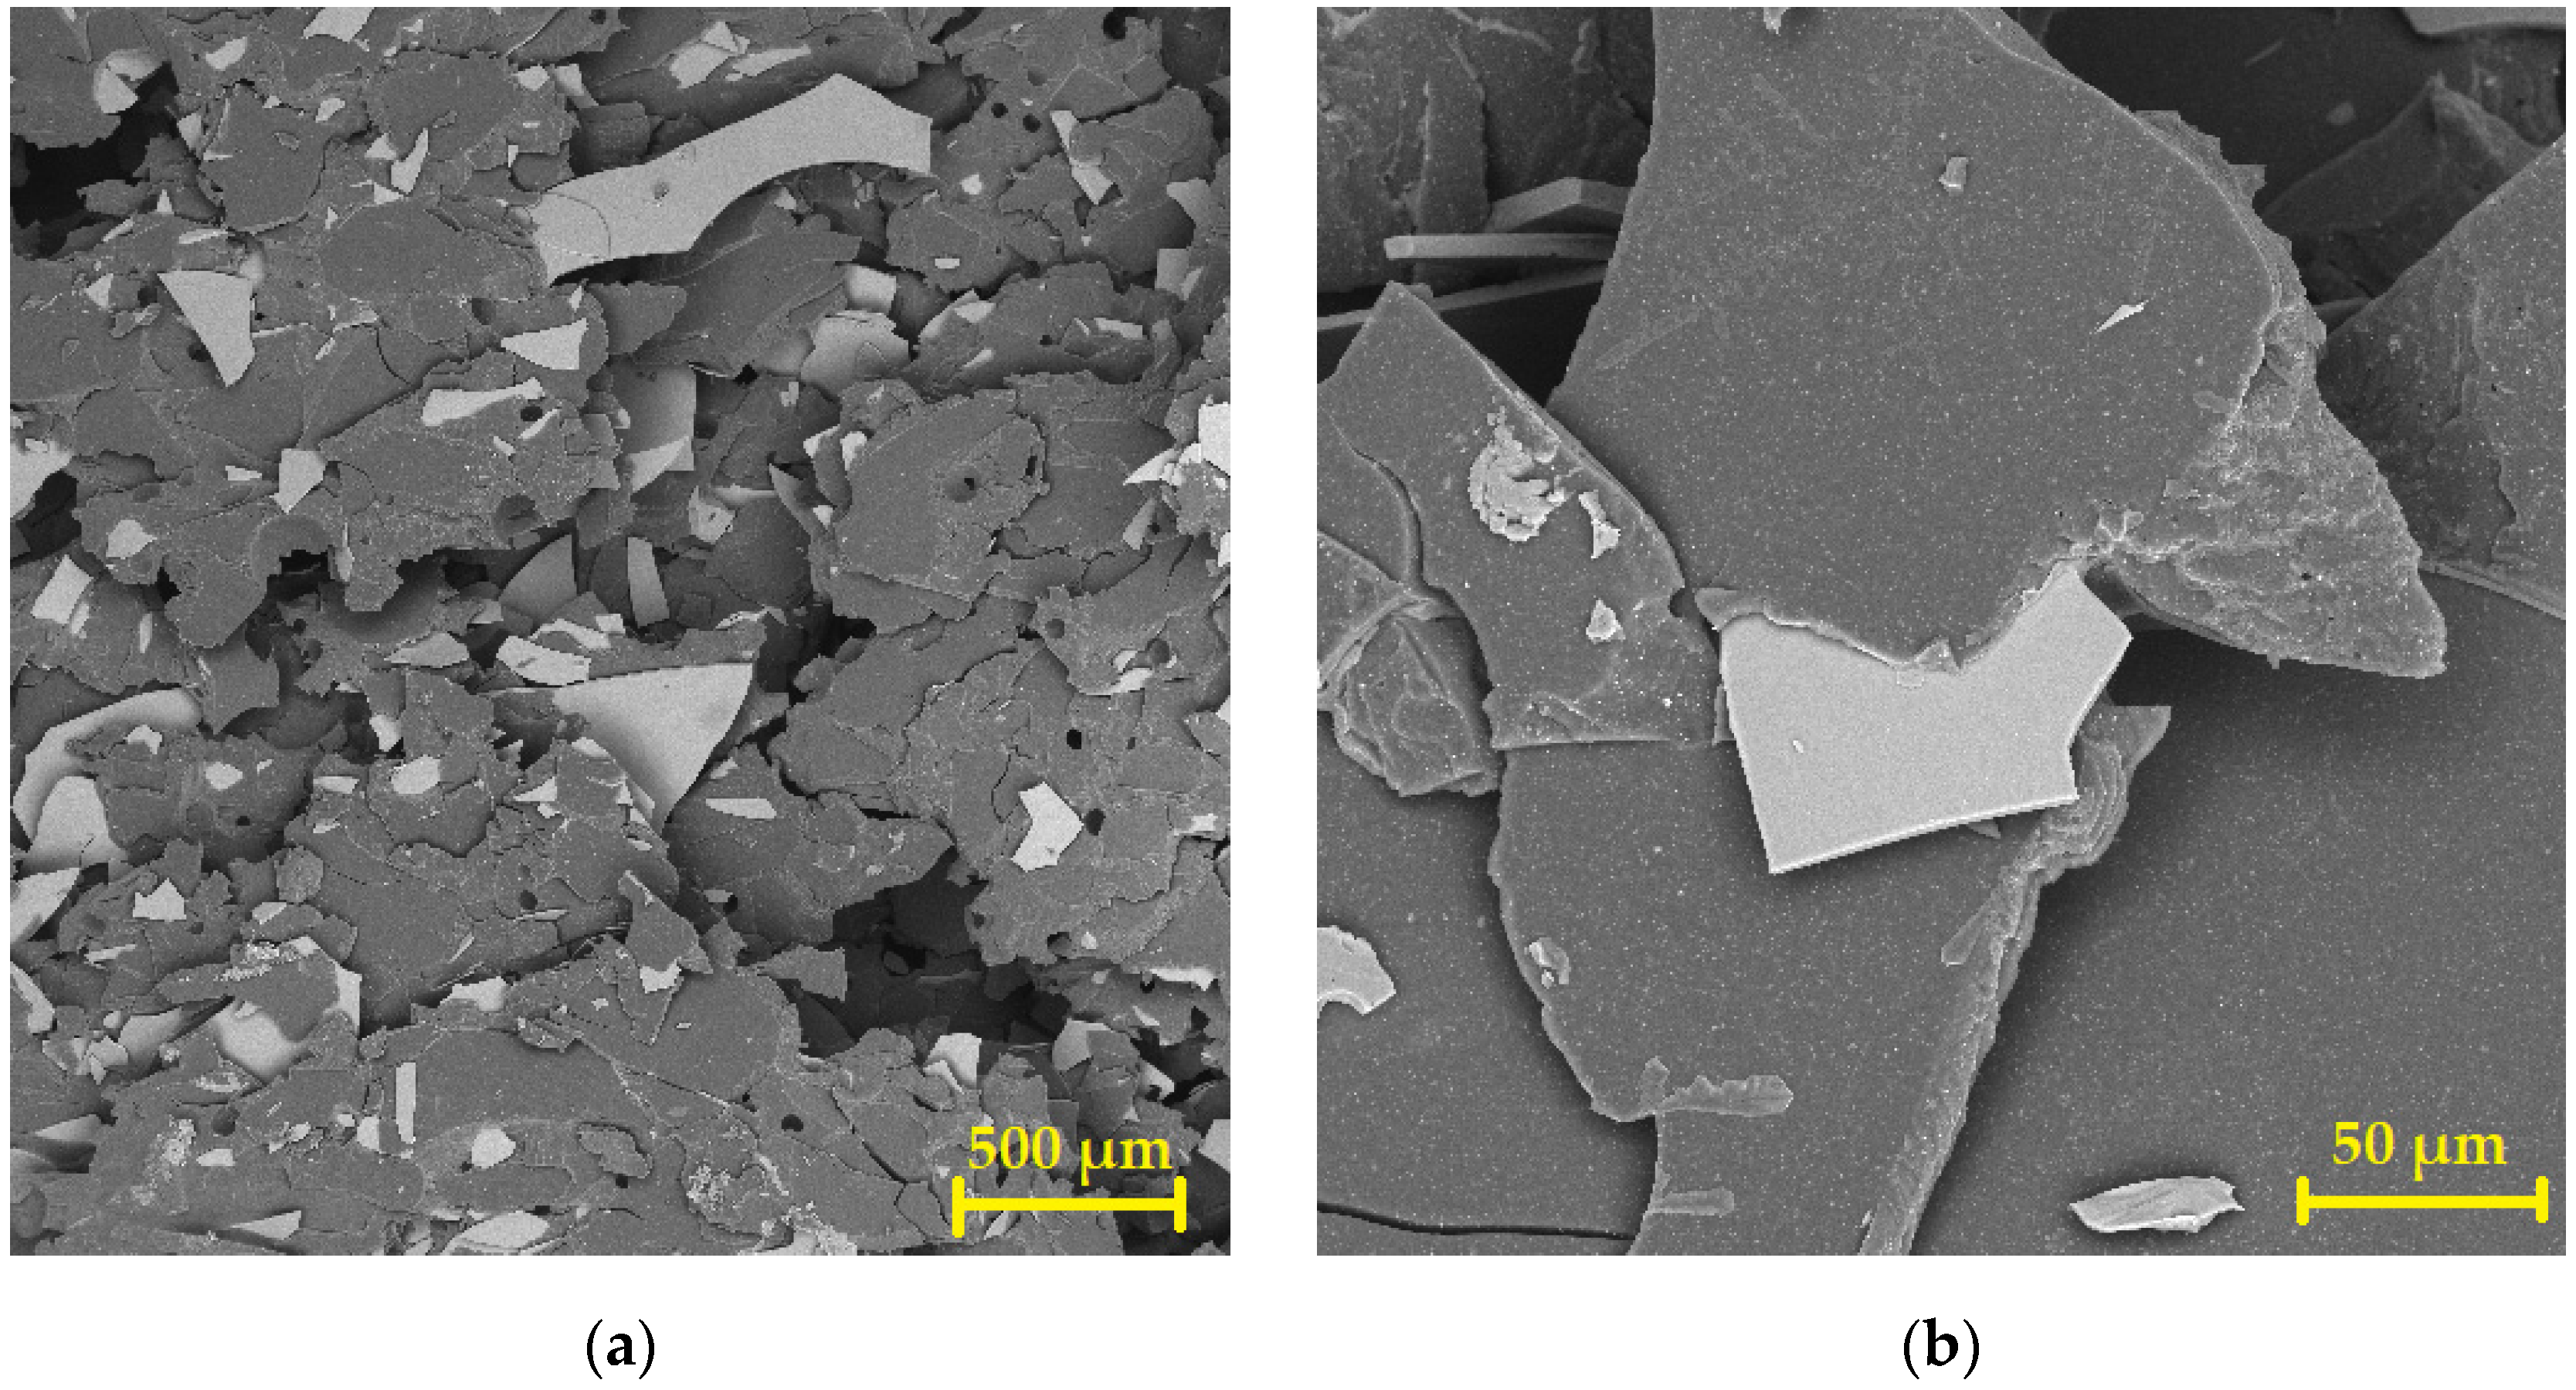
The SEM picture in
Figure 12a shows the structure of the 120-day-old material without exposure to chemicals. The structure has a solid, smooth surface at the fractured edge caused during sampling. It can also be seen that the filler is completely embedded in the polymer, and individual grains are fully coated in the polymer. The material showed no colour changes or disruptions on the surface. It is possible to see several air bubbles in the matrix, which were probably caused by the imperfect mixing of the material prior to its application. Tiny dust particles on the surface were caused by sampling—sample cut-off.
Figure 12b illustrates the structure of the same polymer coating after 120 days of exposure to CH
2O
2 at a concentration of 30% that is completely disrupted. Rounded grains of a filler protrude from the structure of the composite; they are broken and exposed. The surface degraded to small pieces, which still retain a similar shape and size. The matrix is also degraded, and there is a disruption of the cross-linking chains and depolymerisation of the system. The smaller a molecule of an active chemical, the more aggressive it acts. A smaller molecule can diffuse to the polymer structure more easily and invade the polymer. The chemical resistance of polymers decreases with increasing temperature. Generally, it can be claimed that the better the polymer is cross-linked, the better its chemical resistance [
54].
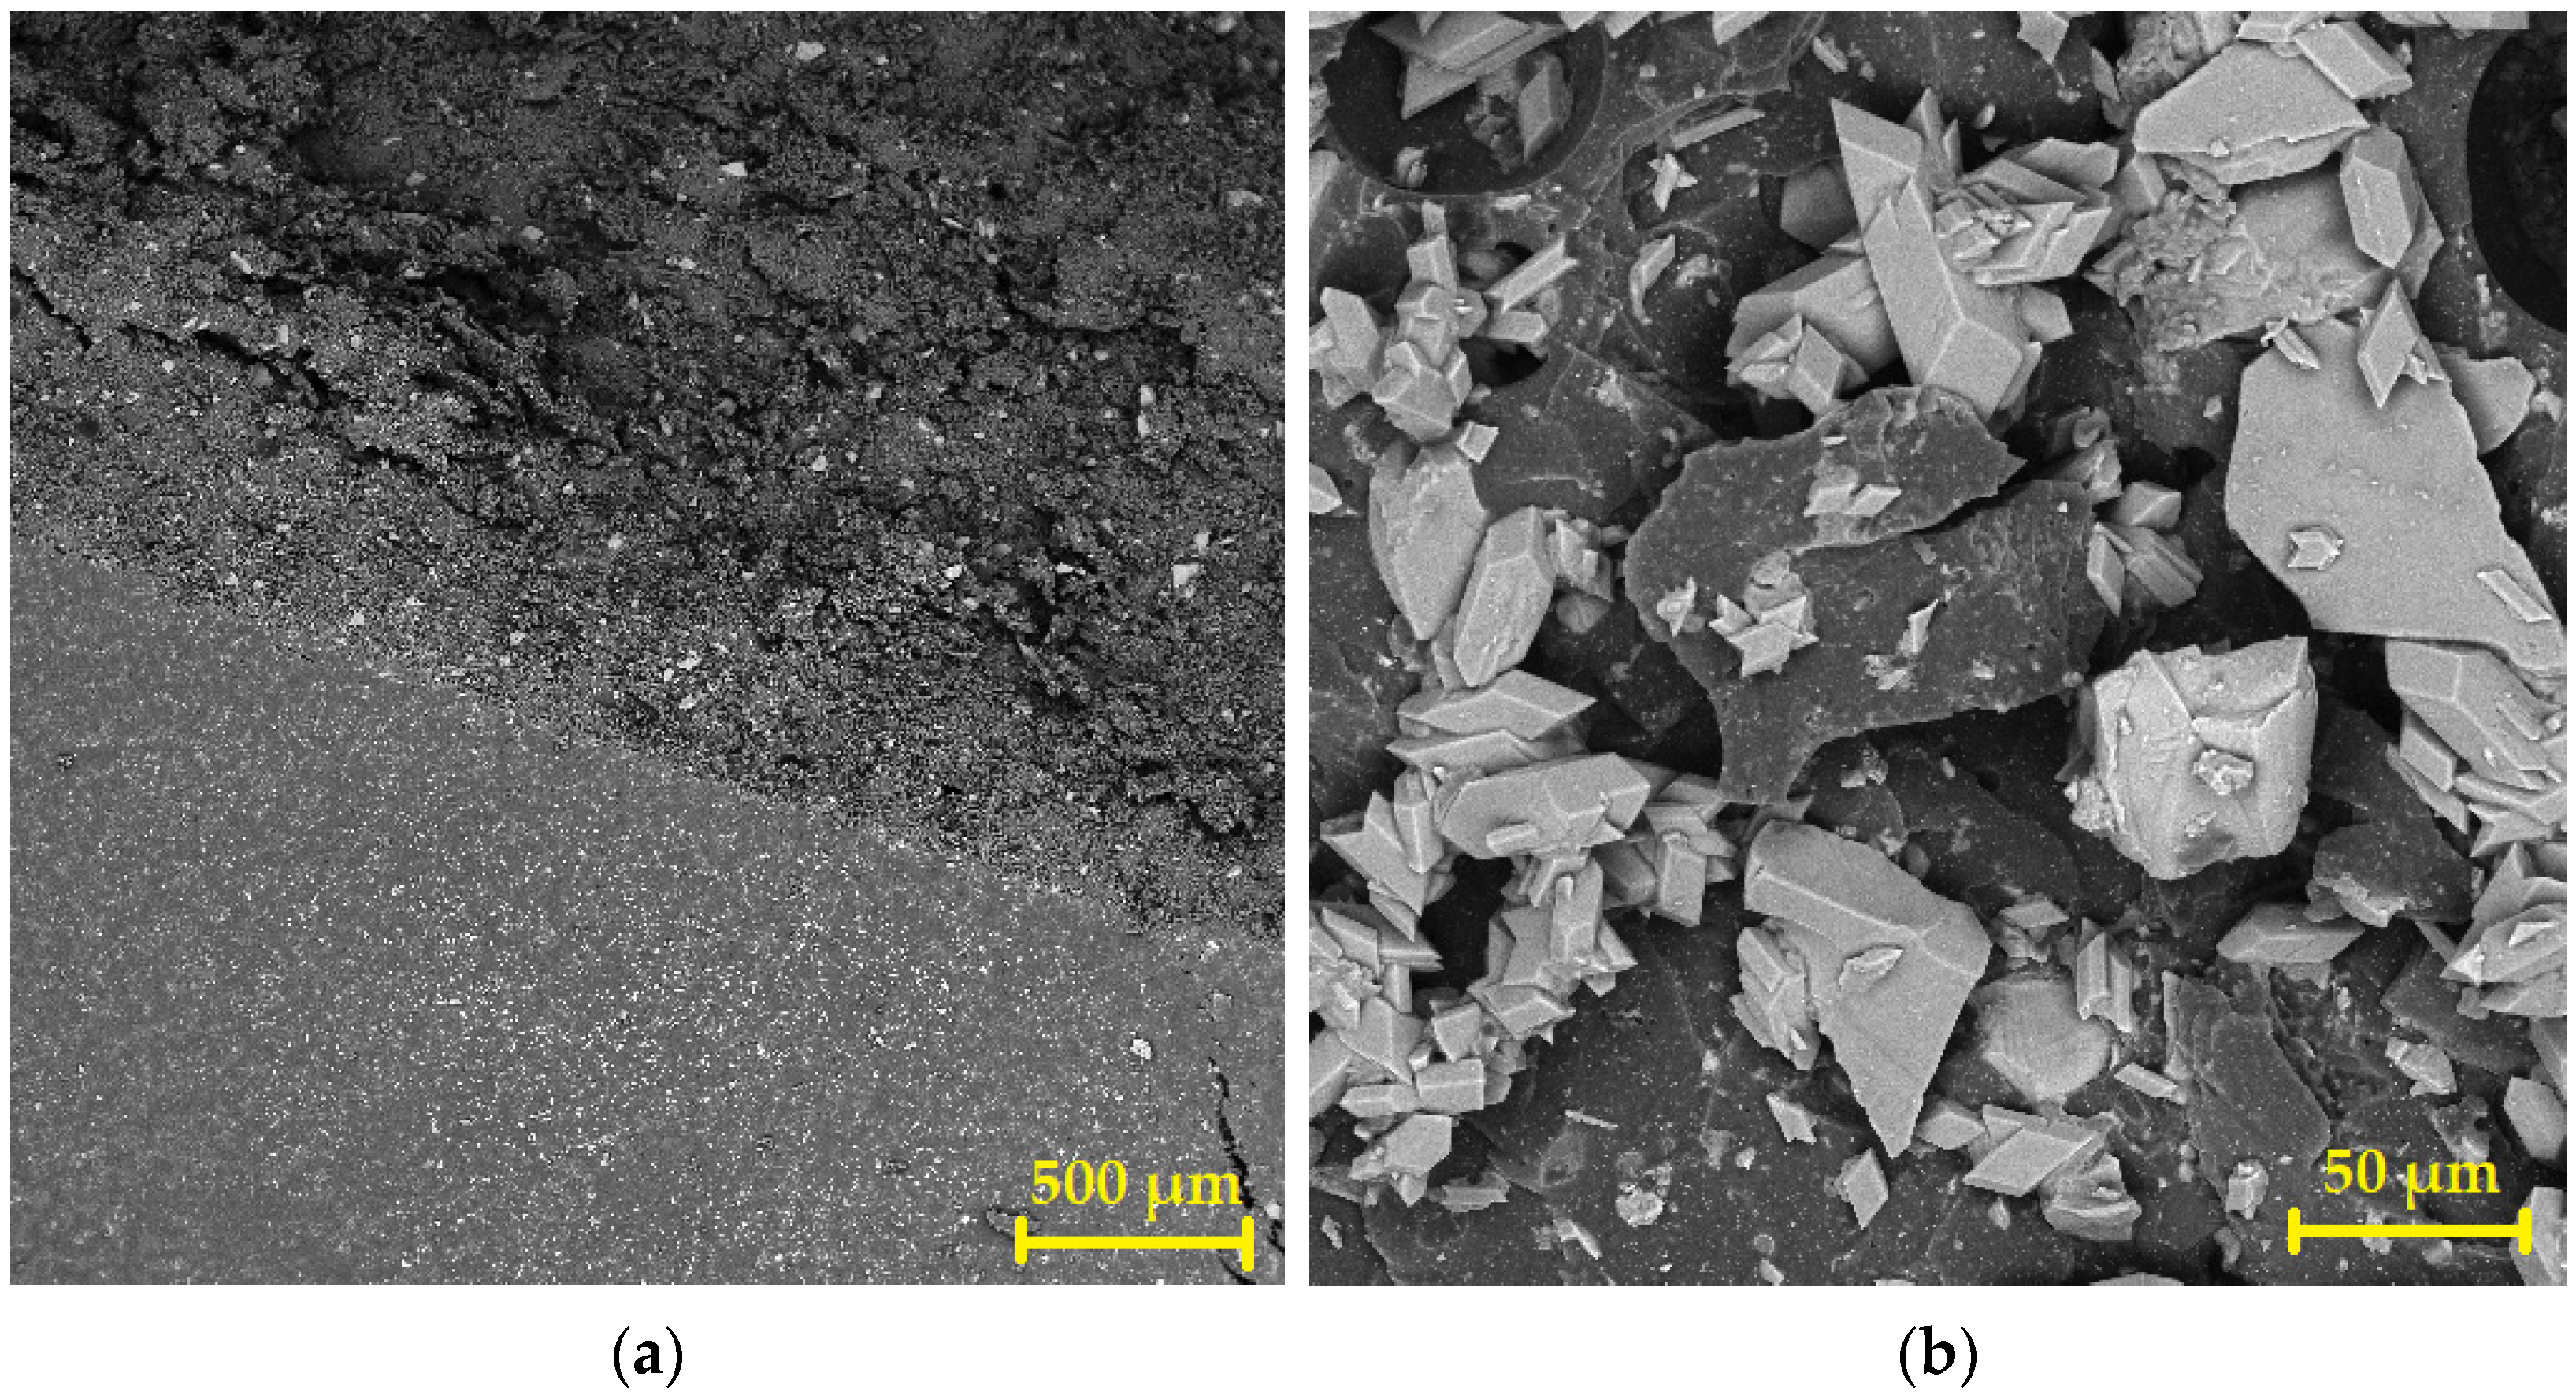
It follows from
Figure 13a that after 120 days of storage of the coating in a laboratory environment, the polymer structure is solid and the surface is smooth and has no signs of any disruption, including colour changes. Glass flakes create a stable slatted system; they are not disrupted or exposed in the structure. The polymer matrix is intact, except for tiny air bubbles that were probably caused by the imperfect mixing of the mixture prior to its application. Tiny dust particles on the surface were caused by sampling—sample cut-off. In the micrograph in
Figure 13b, it can be seen that the structure of the polymer completely degraded after 120-day exposure to CH
2O
2 at a concentration of 30%. Glass flakes protrude from the slatted structure, which is damaged, and grains of the filler are broken and exposed. The surface is degraded to small pieces, while the grains of the filler are visible even without using a microscope—by the naked eye. The matrix contains air bubbles that were probably caused by the imperfect mixing of the mixture prior to its application.
Figure 14a depicts that after 120 days, the structure of the polymer coating NBR-CW stored in laboratory conditions is also solid, and the surface is smooth and has no signs of any disruptions, including colour changes. The grains of the filler are more noticeable on the smooth surface. Particles in the form of shards are completely coated by the polymer matrix, creating a stable, homogeneous structure. Furthermore, it can be observed that individual grains of the filler are evenly distributed in the polymer. The polymer matrix is intact, except for the spots of the sample fracture that were caused during sampling—sample cut-off. In
Figure 14b, on the other hand, it is possible to see that the polymer structure is completely disrupted after exposure to CH
2O
2 at a concentration of 30% for 120 days. The filler’s shards protrude from the disrupted structure, and filler grains are already visible under a microscope at 50× magnification. The matrix contains air bubbles probably caused by the imperfect mixing of the mixture prior to its application. At a higher magnification, pigment grains that protrude from the polymer matrix are noticeable.
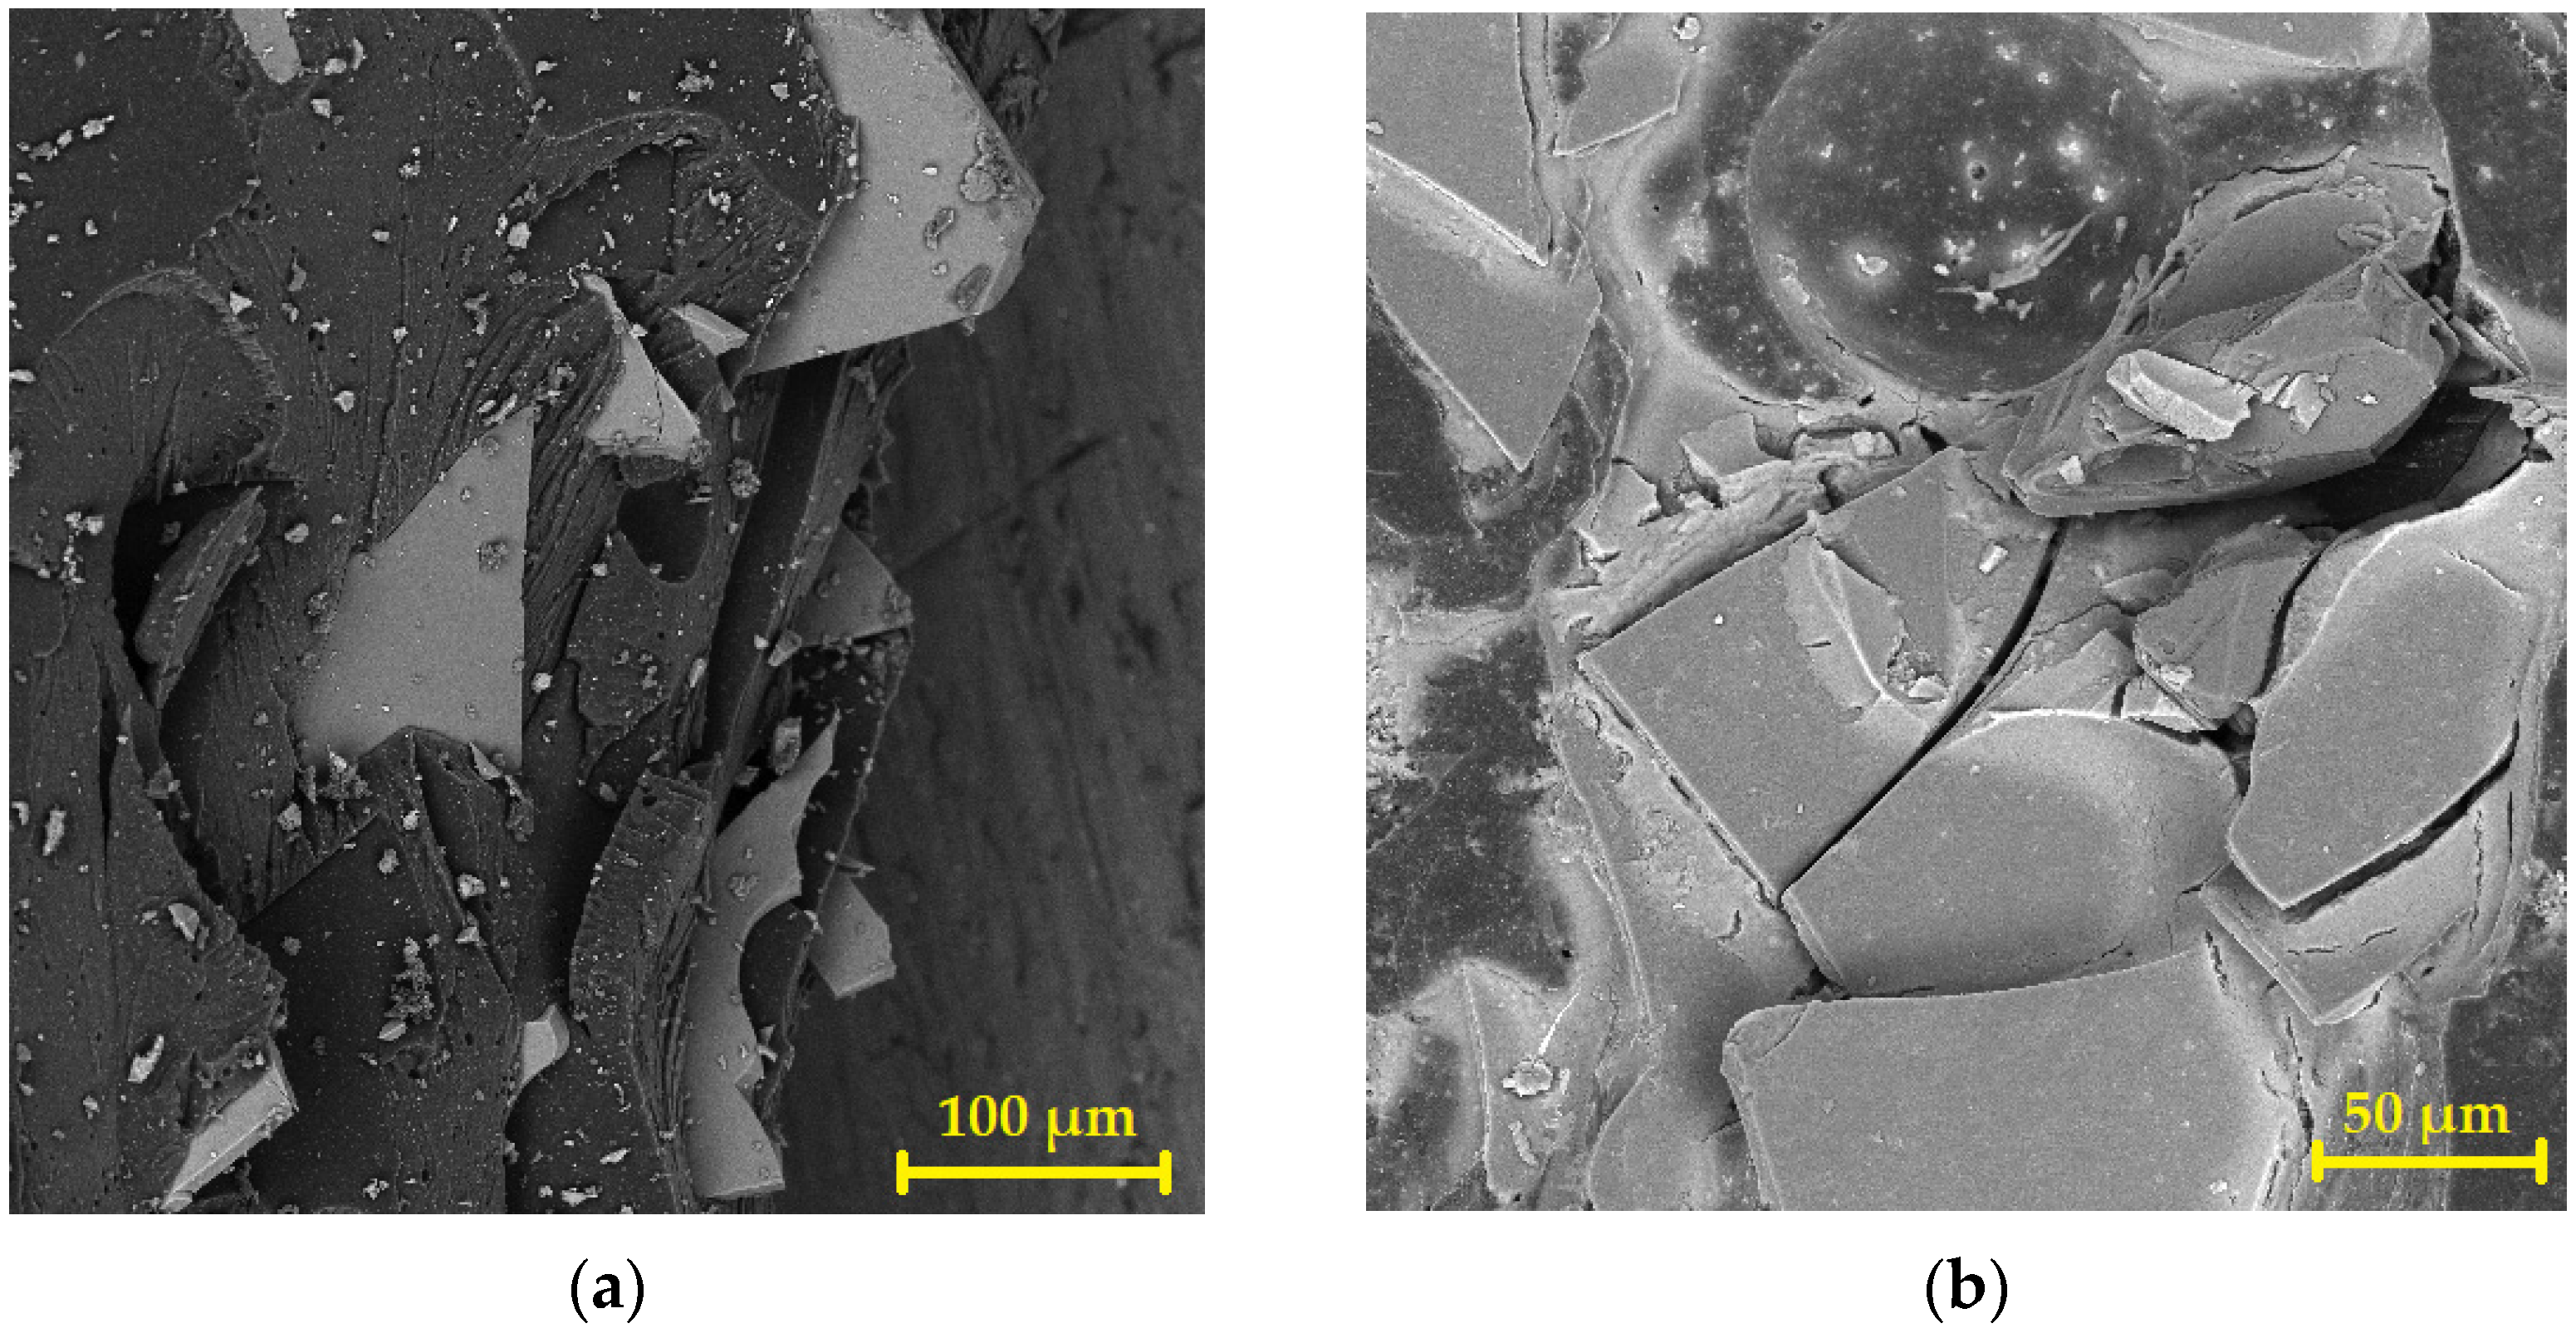
Figure 15a shows waste glass particles (shards) emerging from the polymer matrix, which has been severely disrupted after exposure to formic acid for 120 days. It is possible to observe the sharp edges of shards characteristic of this type of filler.
Figure 15b shows the microstructure of the strongly degraded NBR-REF coating, showing that CH
2O
2 also disrupted the structure of the quartz flour particles. By comparing these SEM images, it can be concluded that the coating containing shards from a windshield resists the selected chemically aggressive environment better than the reference coating. The incorporation of glass flakes in the polymer matrix can be seen in
Figure 16a—the flakes are perfectly coated with an epoxy matrix.
Figure 16b shows the disruption of the contact zone between the flakes and the polymer matrix after 90 days of the coating’s exposure to 30% CH
2O
2.


