Article

Optimization of Laser Shock Process Parameters for 40Cr Steel

College of Marine Equipment and Mechanical Engineering, Jimei University, Xiamen 361000, China
*
Author to whom correspondence should be addressed.
Coatings 2022, 12(12), 1872; https://doi.org/10.3390/coatings12121872
Submission received: 3 November 2022 / Revised: 25 November 2022 / Accepted: 29 November 2022 / Published: 2 December 2022

Abstract

:
Laser shock peening (LSP) process parameters have an important influence on the strengthening effect. In this study, theoretical calculations were used to determine a suitable range of stress wave peaks (5.09 GPa–6.36 GPa) for laser shocking, which consider the material properties of alloy steel 40Cr. In addition to theoretical calculations, the finite element numerical simulation of a single-point laser shock was also performed. The residual stresses of specimens under different shock pressure waves were simulated, and then the optimal pulse width was determined as 20 ns and the optimal pulse energy was determined as 10 J. Finally, the influences of different pulse energies on the microhardness, residual stress, microstructure, and shock-affected layer thickness of metallic materials were comprehensively investigated through experiments, and the optimization of the laser shock energy was proved to be 10 J. An optimized combination of parameters of a single-point laser shock for 40Cr was obtained, in which the spot diameter was 3 mm, the pulse width was 20 ns, and the pulse energy was 10 J. The study has implications for the selection of LSP process parameters for alloy steels.

1. Introduction

Laser shock processing (LSP) is a mechanical surface treatment process used to shock the surface of a part. During LSP, strong laser-induced shock waves generate plastic deformations on the part’s surface layer, and residual compressive stresses and grain refinement are introduced into the component, improving its mechanical properties [1,2,3]. LSP has been studied globally, with many studies reporting the significant strengthening effects that LSP can induce in metal specimens such as aluminum alloys, stainless steels, alloy steels, carbon steels, titanium alloys, and nickel-based high-temperature alloys [4,5,6,7,8,9,10]. All studies demonstrated that LSP could inhibit the initiation and expansion of fatigue cracks in materials, thus extending the life of parts effectively. Currently, the technology is widely employed in equipment generation for industries such as aerospace, maritime, nuclear energy, and other fields.
In recent years, with the advancement of LSP research, maximizing the strengthening effect of laser shocks has become a popular goal for many researchers. Experiments into this area have shown that the laser shock process parameters significantly influence the effect of shock strengthening [11,12,13,14]. For instance, Kumar et al. [15] found that with an increasing number of laser shocks, there was a greater effect on increasing the high-temperature oxidation resistance of P91 steel. Zhi et al. [16] and Zhaoru et al. [17] investigated the impacts of variations in laser pulse energy and a higher number of laser shocks on the residual compressive stress, hardness, microstructure, and fatigue life of aluminum alloy specimens. Furthermore, Siddaiah et al. [18] investigated the influence that variation in laser power density had on the surface roughness and friction properties of magnesium alloys. As with shot peening, more LSP, or more intense LSP, is not necessarily better in terms of extending life. In the case of LSP, the resulting residual stress state is also known to exhibit a fair degree of variability [19]. Umapath et al. [20] experimentally investigated laser power density increases to a certain value, and the residual stress region decreased. The residual compressive stress is one of the important factors affecting the fatigue life [21]. Related research supports the conclusion that the selection of the laser shock process parameters influences the effect of shock strengthening observed in LSP, and variation in laser pulse energy/power density appears to have the most significant influence [22]. However, there are few studies on the optimal parameter combination of laser shocks.
The large-area laser shock of parts was accumulated by a single point shock. In this study, the influences of the LSP parameters of 40Cr were comprehensively investigated via theoretical calculations, numerical simulations, and experiments. Theoretical calculations were used to determine the appropriate ranges of the peak value of the laser shocking stress wave for 40Cr. Finite element numerical simulation of a single point shock was conducted to examine the mechanical response of material with different shock waves. The microhardness, residual stress, microstructure, and shock-affected layer thickness resulting from different pulse energies were examined through experiments. The machining mechanism of the laser shocks was analyzed, and the optimal parameters of laser shocking were obtained by comprehensive analysis.

2. LSP

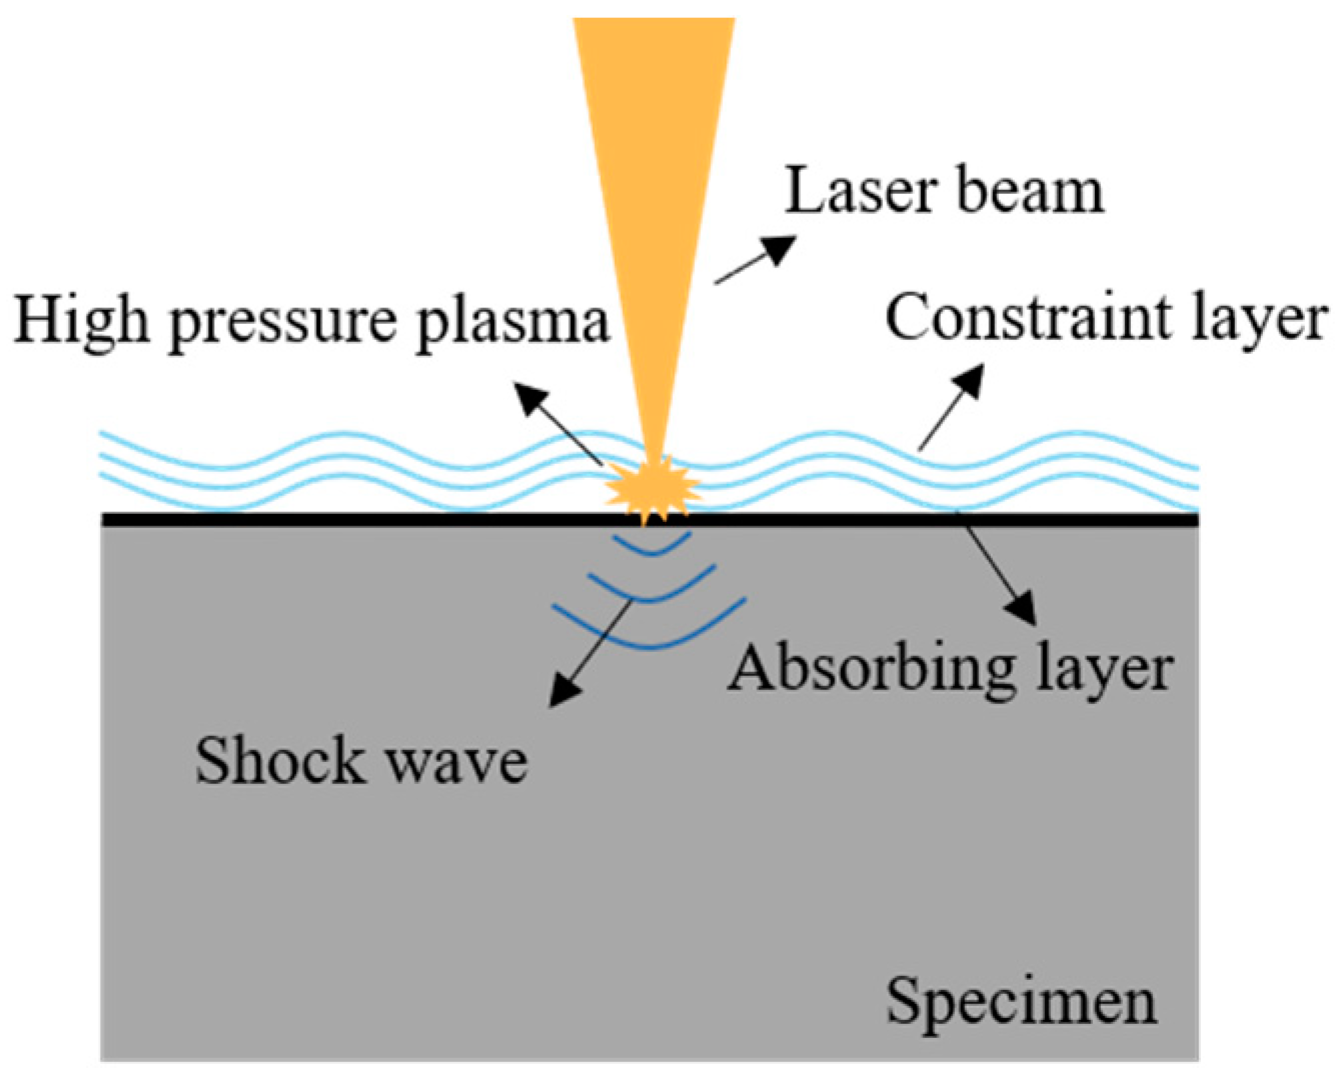
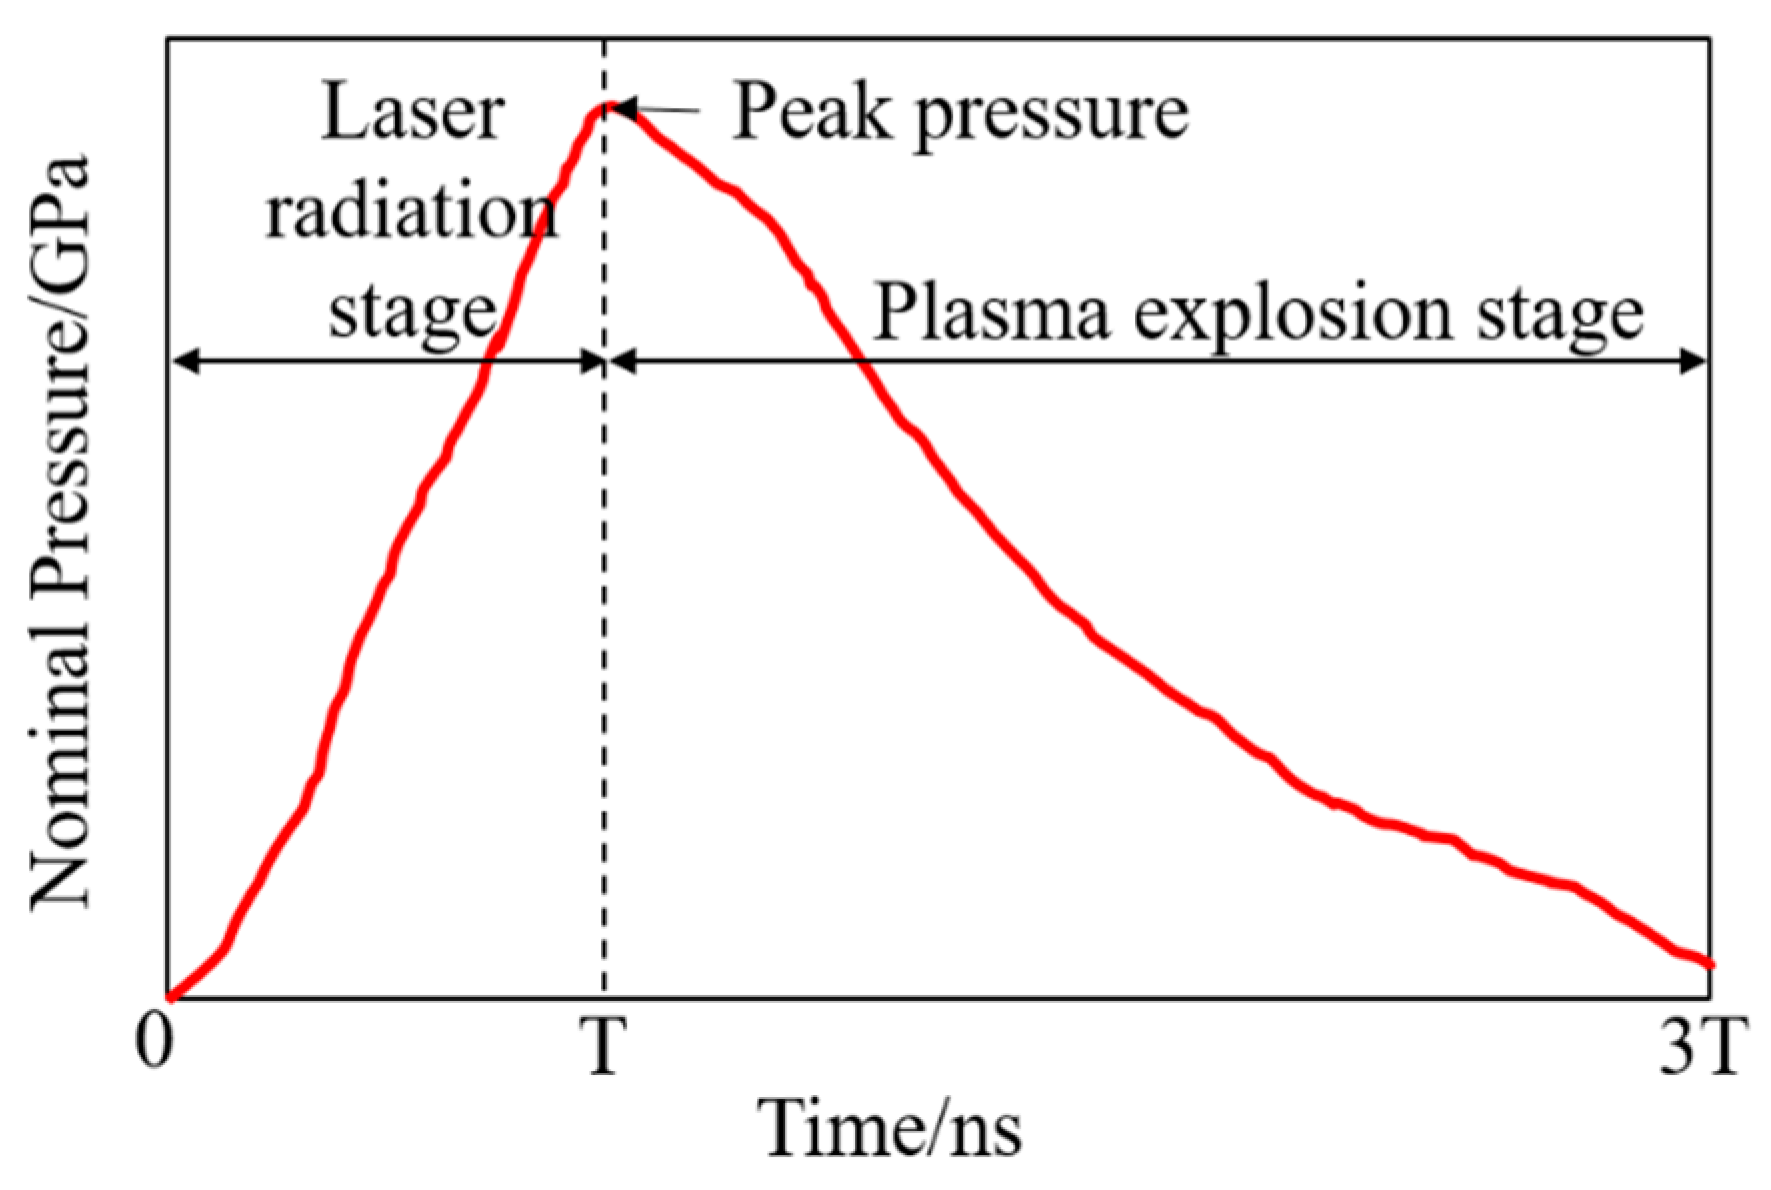
2.1. Laser-Induced Plasma Shock Effect

During the LSP, a combination of high peak power density and short pulses of a high-energy laser beam is directed on the absorption layer above the metal surface. The absorption layer absorbs this energy and instantaneous vaporization occurs, almost simultaneously forming high-temperature and high-pressure (>1 GPa) plasma shock waves. These shock waves then propagate into the specimen with the constraints of the constraint layer. Plastic deformation at an ultra-high strain rate occurs, forming a residual compressive stress layer at a specific depth and causing microstructural changes [23,24,25]. A schematic of LSP is shown in Figure 1.
The laser beam used for LSP is a nanosecond laser. The Q-switched Nd:YAG high-power pulsed laser system is used in this study, and the wavelength is 1064 nm. The spatial energy distribution of the laser is a flat top, and the intensity of the laser beam energy is approximately evenly distributed in the spot region. Due to the uniform energy distribution of the laser beam within the spot range, it is assumed that no radiation loss occurs. During the unconstrained laser shock, the relationship between the shock wave pressure and the laser power density was obtained through a set of hydrodynamic equations [26] as follows:
P = 2 γ b 1 2 3 γ b + 1 ρ 1 1 3 P 1 2 3
where P 1 is the laser power density; γ b is the adiabatic index of the plasma; and ρ 1 is the gaseous density of the shock wave.
The shock wave pressure within the spot range of the spatial distribution can be calculated from Equation (1) when the gaseous density of the shock wave is known. The LSP shock load is induced with the thermal expansion of laser pulse-induced plasma, which is related to the laser power density and the duration of the laser pulse. According to the research of Fabbro et al. [27], the peak pressure of the laser pulse-induced plasma (Pmax) can be estimated by
P m a x = 0.01 α 2 α + 3 Z I 0
2 Z = 1 Z 1 + 1 Z 2
where Z1 and Z2 are the reduced shock impedances of the confining medium and the target material, Z1 = 2.39 × 10⁵ g/(cm⋅s) for water and Z2 = 4.58 × 10⁶ g/(cm⋅s) for 40Cr alloy steel, α represents the efficiency of the interaction between the laser pulse-induced plasma and target material, and α = 0.4 in this work [27]; I0 is the laser power density and can be estimated by
I 0 = W τ · π r 2
where W is the laser energy, r is the radius of the spot, and τ is the duration of the laser pulse.
The duration of the laser-induced shock wave is approximately 2–3 times greater than the laser pulse width [28]. In this type of pressure pulse, pressure rises rapidly at first and then decreases gradually. The schematic depicting the time course of the laser-induced shock wave pressure is shown in Figure 2.

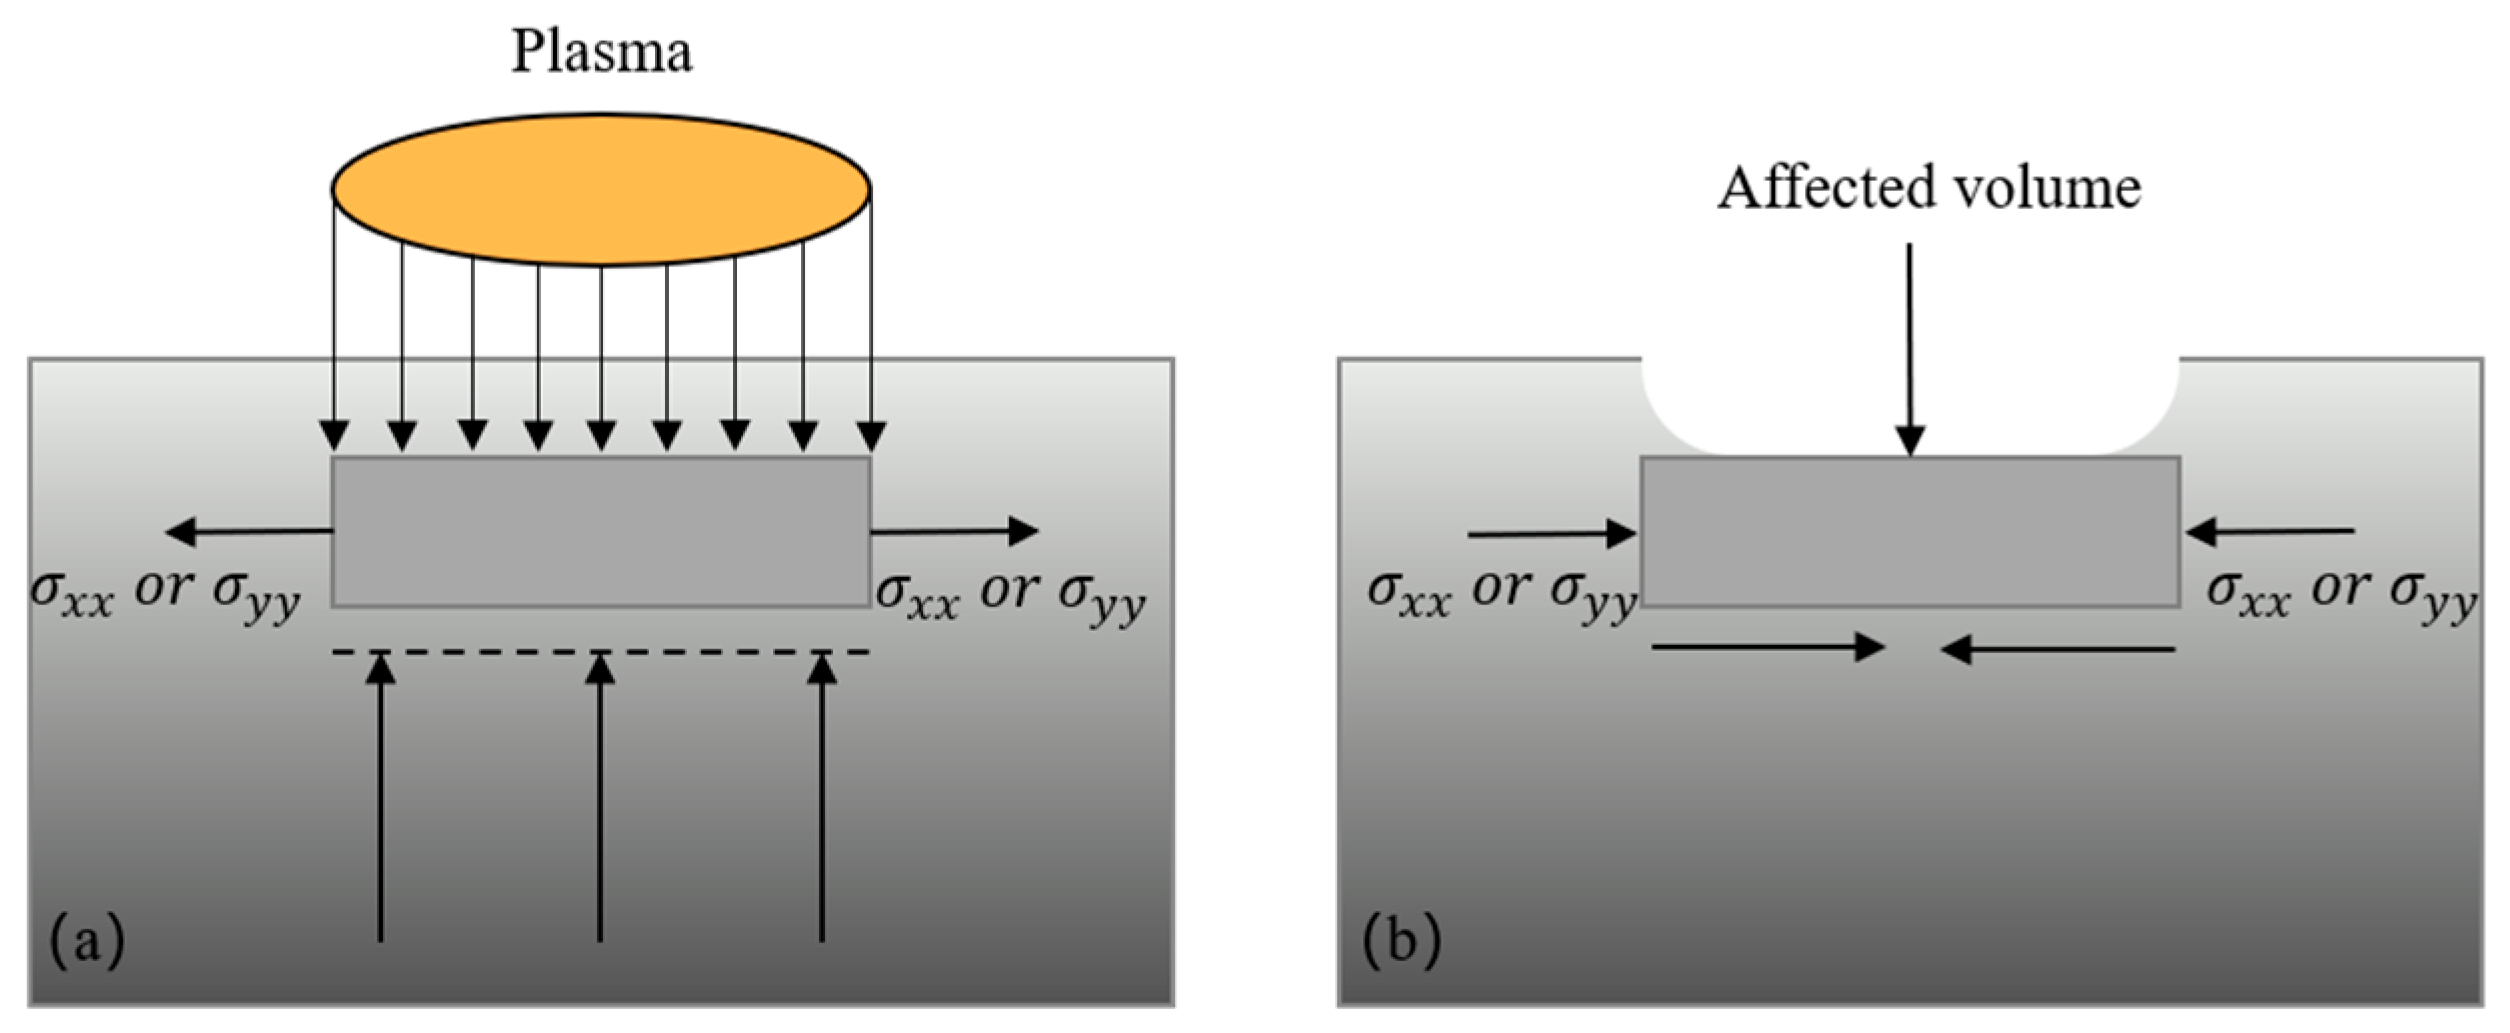
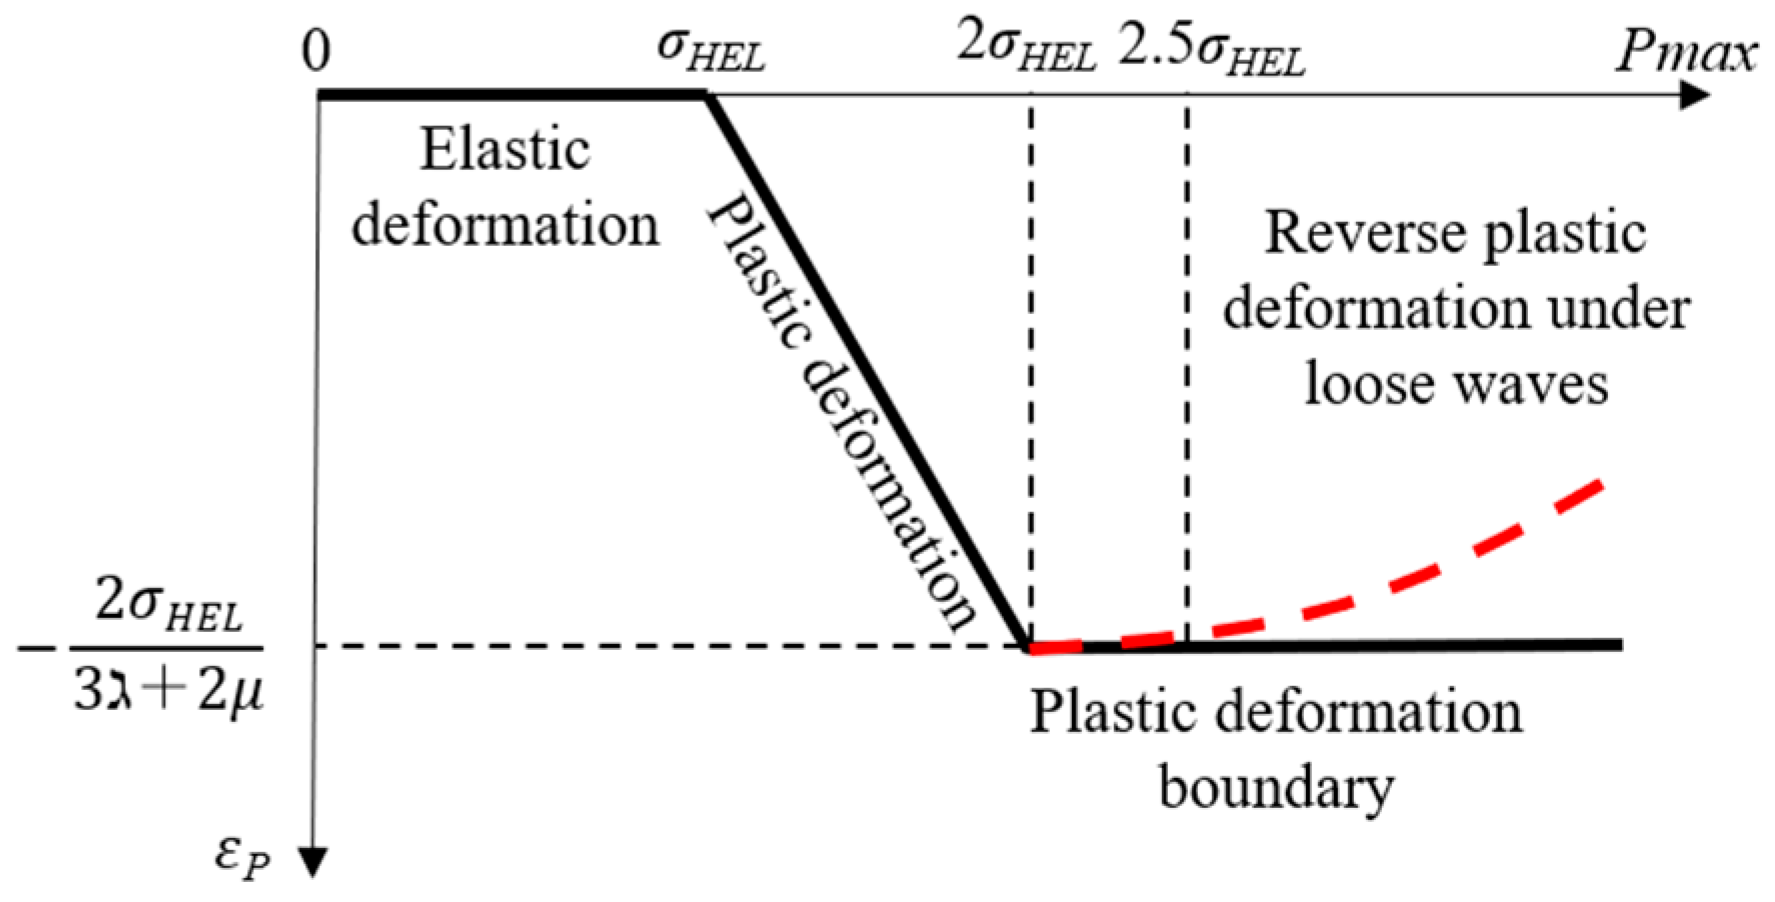
2.2. Mechanical Analysis of Specimens under the Action of Laser Shock Waves

The laser-induced high-pressure shock wave cannot escape outward. It can therefore only act upon the surface of the specimen with the confinement of the constraint layer. As displayed in Figure 3a, the shock wave produces uniaxial compressive stresses along the direction of propagation, while tensile stresses act in a direction parallel to the material’s surface. Due to the high pressure of the shock wave, the surface layer of the shocked specimen undergoes plastic deformation at an ultra-high strain rate. Residual compressive stress is generated in the shock-deformed material to resist this deformation (Figure 3b). σ xx and σ yy indicate residual stresses and arrows indicate directions.
As soon as the laser-induced shock pressure during LSP reaches a pressure higher than the dynamic yield strength of the material (Hugoniot Elastic Limit, σ H E L ), plastic deformation and compressive residual stress occur in the surface subsurface layer of the specimen. According to Johnson et al. [29], the formula for σ H E L can be expressed as
σ H E L = 1 ν 1 2 ν σ d y
The material σ H E L can be calculated with Poisson’s ratio ν and the dynamic yield strength σ d y of the material. The LSP technology can produce a high strain rate of the material, up to 106 S−1, and the dynamic yield strength is usually about 2–4 times that of the static one [30].
Based on the peak shock wave pressure and σ H E L , the plastic deformation εp [31] on the surface of the LSP specimen can be obtained from
ε p = 2 σ H E L 3 + 2 μ P m a x σ H E L 1
where ℷ and μ are Lamé coefficients (ℷ = Ev/[(1 + v)(12v)], μ = G = E/[2(1 + v)]).
Ballard et al. [31] proposed a theoretical model for laser shock wave loading, which assumes that the material to be strengthened is an ideal elastic–plastic material of semi-infinite size. In this scenario, the laser shock wave is an ideal planar longitudinal wave with a pressure pulse that is uniformly distributed throughout space. The material also undergoes strain, obeying the Von Miss yield criterion. Based on this theoretical model, the material’s mechanical response varies with the laser shock wave peak pressure [32], as revealed in Figure 4.
Figure 4 shows that the material only undergoes elastic deformation when Pmax < σHEL. When σHEL < Pmax < 2σHEL, the material undergoes plastic deformation accompanied by elastic reversion, and the deformation increases linearly with increasing peak pressure Pmax. When 2σHEL < Pmax < 2.5σHEL, the plastic deformation saturates, plastic unloading occurs, and the deformation volume reaches the maximum (−2σHEL)/(3ℷ + 2μ). Under the condition of Pmax > 2.5σHEL, loose surface waves are produced, and the residual compressive stress on the surface of the target is reduced to some extent. In summary, when the peak shock wave pressure reaches a value between 2σHEL to 2.5σHEL of the material, a better shock effect can be obtained. The σdy of 40Cr is 1570 MPa; thus, the range of the peak shock wave pressure is between 5.09 GPa and 6.36 GPa.

3. Numerical Simulation

3.1. Material Setting

40Cr with a chemical composition (mass fraction) of 0.39%C, 0.25%Si, 0.6%Mn, and 1.0%Cr is one of the most commonly used alloy steels for manufacturing key components such as gears, axle sleeves, cams, etc. [33]. Therefore, in this study, 40Cr alloy steel was selected as the specimen material, and its mechanical properties are shown in Table 1 [34].

3.2. Model Construction and Computational Solution

The finite element method was used to construct a numerical simulation model of the 40Cr specimen for single point shock. A combination of dynamic explicit analysis and explicit rebound analysis was used to simulate and analyze the equivalent plastic deformation, as well as the residual stress distribution of LSP observed in 40Cr. The specific simulation process, outlined in Figure 5, was divided into four main sections: finite element modeling of the metal specimen, laser shock pressure input, computational solution (dynamic explicit analysis and explicit rebound analysis), and analysis of results.
The model size was set to 9 mm × 9 mm × 4 mm. The hexahedral element, Hex, was used to mesh the numerical model, with an element mesh size of 0.3 mm and a shock area mesh refinement size of 0.03 mm. The infinite boundaries were imposed around and at the bottom of the model with a thickness of 0.2 mm. The mesh type of the infinite boundaries was CIN3D8, while the other mesh cell type was C3D8R, as shown in Figure 6a.
Considering the strain rate, the Johnson–Cook material model fits the best for LSP. Equation (7) depicts the Johnson–Cook relationship between the flow stress of the material at high impact rates and various parameters [35].
σ = A + B ε n 1 + In ε ε 0 1 T T 0 T m T 0 m
where σ and ε are the flow stress and effective plastic strain, ε and ε 0 are the effective plastic strain and effective plastic strain rate, and the term ( 1 T T 0 T m T 0 m ) represents thermal softening. However, in the case of LSP with water confinement, thermal softening can be considered neligible. A, B, C, m and n are constants determined experimentally. The JC constants for 40Cr are listed in Table 2 [36].
The shock wave pressure was varied with time, as previously shown in Figure 3. The shock wave pressure curve was loaded to a circular area with diameter of 3 mm on the top surface of model, and the bottom surface was completely restricted, as shown in Figure 7b. The solution time of the laser shock explicit analysis was selected based on the energy balance principle, and 3500 ns was selected as the solution time, during which the internal mass kinetic energy of the material increases and then decreases to a stable value. After laser shock explicit analysis, the explicit rebound of the material revealed a similar result as that obtained for the implicit rebound. A multi-analytical step strategy was set for shock explicit analysis and explicit rebound, and the rebound time was determined as 80,000 ns, which was based on the kinetic energy tending to 0. The stress distribution of the metal specimen was obtained after the multi-analytical step simulation.

3.3. Influence of the Laser Pulse Width

The peak shock wave pressure of 40Cr was between 5.09 GPa and 6.36 GPa, as mentioned. When the spot diameter is determined, the laser shock intensity depends on the laser energy and pulse width. The pulse width has an effect on the mechanical response by changing the peak shock wave pressure and loading time. When the spot diameter was 3 mm, the laser pulse energy was set as 6 J and10 J, the pulse width was set as 10 ns, 15 ns, 20 ns, and 25 ns for simulation, and the corresponding curves of the shock wave pressure were loaded into the FEM model; the results are shown in Figure 7. When the pulse width changed from 10 ns to 20 ns, the surface residual stress gradually increased, as shown in Figure 7a,d. Along the depth direction of the center of the spot, the residual stress first increased and then decreased, and with the increase in the pulse width, the maximum residual stress on the subsurface gradually increased, as shown in Figure 7b,e. The residual stress in the depth direction of 0.6 mm from the spot center showed a decreasing trend, and the maximum surface residual stress gradually increased with the increase in the pulse width, as shown in Figure 7c,f. However, when the pulse width changed from 20 ns to 25 ns, the residual stress in the surface and depth directions tended to saturate, as shown in Figure 7. This shows that the longer the shock wave acting on the sample surface, the more obvious the impact-strengthening effect. However, with the increase in the pulse width, when the pulse width was greater than 20 ns, the impact strengthening effect was no longer obvious because the laser power density decreased with the increase in the pulse width. The effect of LSP was proportional to the laser power density. Therefore, when the pulse width was greater than 20 ns, the laser power density decreased, and the residual stress did not increase. If the pulse width of the laser continues to increase and the shock wave acts for too long, it will have a thermal effect and ablate the metal, thus destroying the integrity of the material surface, which is not good. This means the optimal pulse width for 40Cr under laser shock was 20 ns.

3.4. Influence of Laser Pulse Energy

When the spot diameter and pulse width are determined, the laser impact intensity depends on the laser energy. The laser energy has effect on the mechanical response by changing the shock wave peak pressure. When the spot diameter was 3 mm and the pulse width was 20 ns, the laser pulse energy was set as 6 J, 8 J, 10 J, and 12 J for the simulation, and the corresponding curve of the shock wave pressure was loaded into the FEM model; the results are shown in Figure 8. When the pulse energy changed from 6 J to 10 J, the surface residual stress increased, as shown in Figure 8a. Due to the generation of a “residual stress hole”, the residual stress at 6 J along the depth direction of the center of the spot reached its maximum at the subsurface, and the phenomenon of the “residual stress hole” intensified with the increase in the pulse energy, as shown in Figure 8b. The residual stress at a depth of 0.6 mm from the spot center showed a decreasing trend, and with the increase in the pulse energy, the maximum residual stress on the surface gradually increased, as shown in Figure 8c. When the pulse energy changed from 10 J to 12 J, the surface residual stress and the residual stress in the depth direction of 0.6 mm from the spot center decreased, as shown in Figure 8. This is because when the pulse energy is greater than 10 J, the peak pressure exceeds 2.5σHEL. In LSP, the laser-induced shock wave oscillates on the surface of the target material, and the loose wave acts on the surface of the sample in reverse, inducing reverse plastic deformation and reducing the residual stress.

4. Single-Point Laser Shock Experiment

4.1. Experimental Conditions

Experiments were conducted by using the LAMBER-12 solid-state laser made by Zhuo Radium (Beijing, China). In the experiments, the 40Cr specimens were shocked with a single laser pulse, with the laser shock process parameters outlined in Table 3. The spot diameter was defined as 3 mm based on the structure of the laser impact device, and the laser pulse width was defined as 20 ns. The peak shock wave pressure range was between 5.09 GPa and 6.36 GPa, with an energy range between 7.7 J and 12.06 J. The energy of 6 J was used as a contrast. As shown in Table 3, the value of the laser pulse energy varied, while the pulse width and spot diameter were defined. During the experiments, flowing deionized water (2 mm thick) was used as the constraint layer, and black tape (0.1 mm thick) was used as the absorption layer.

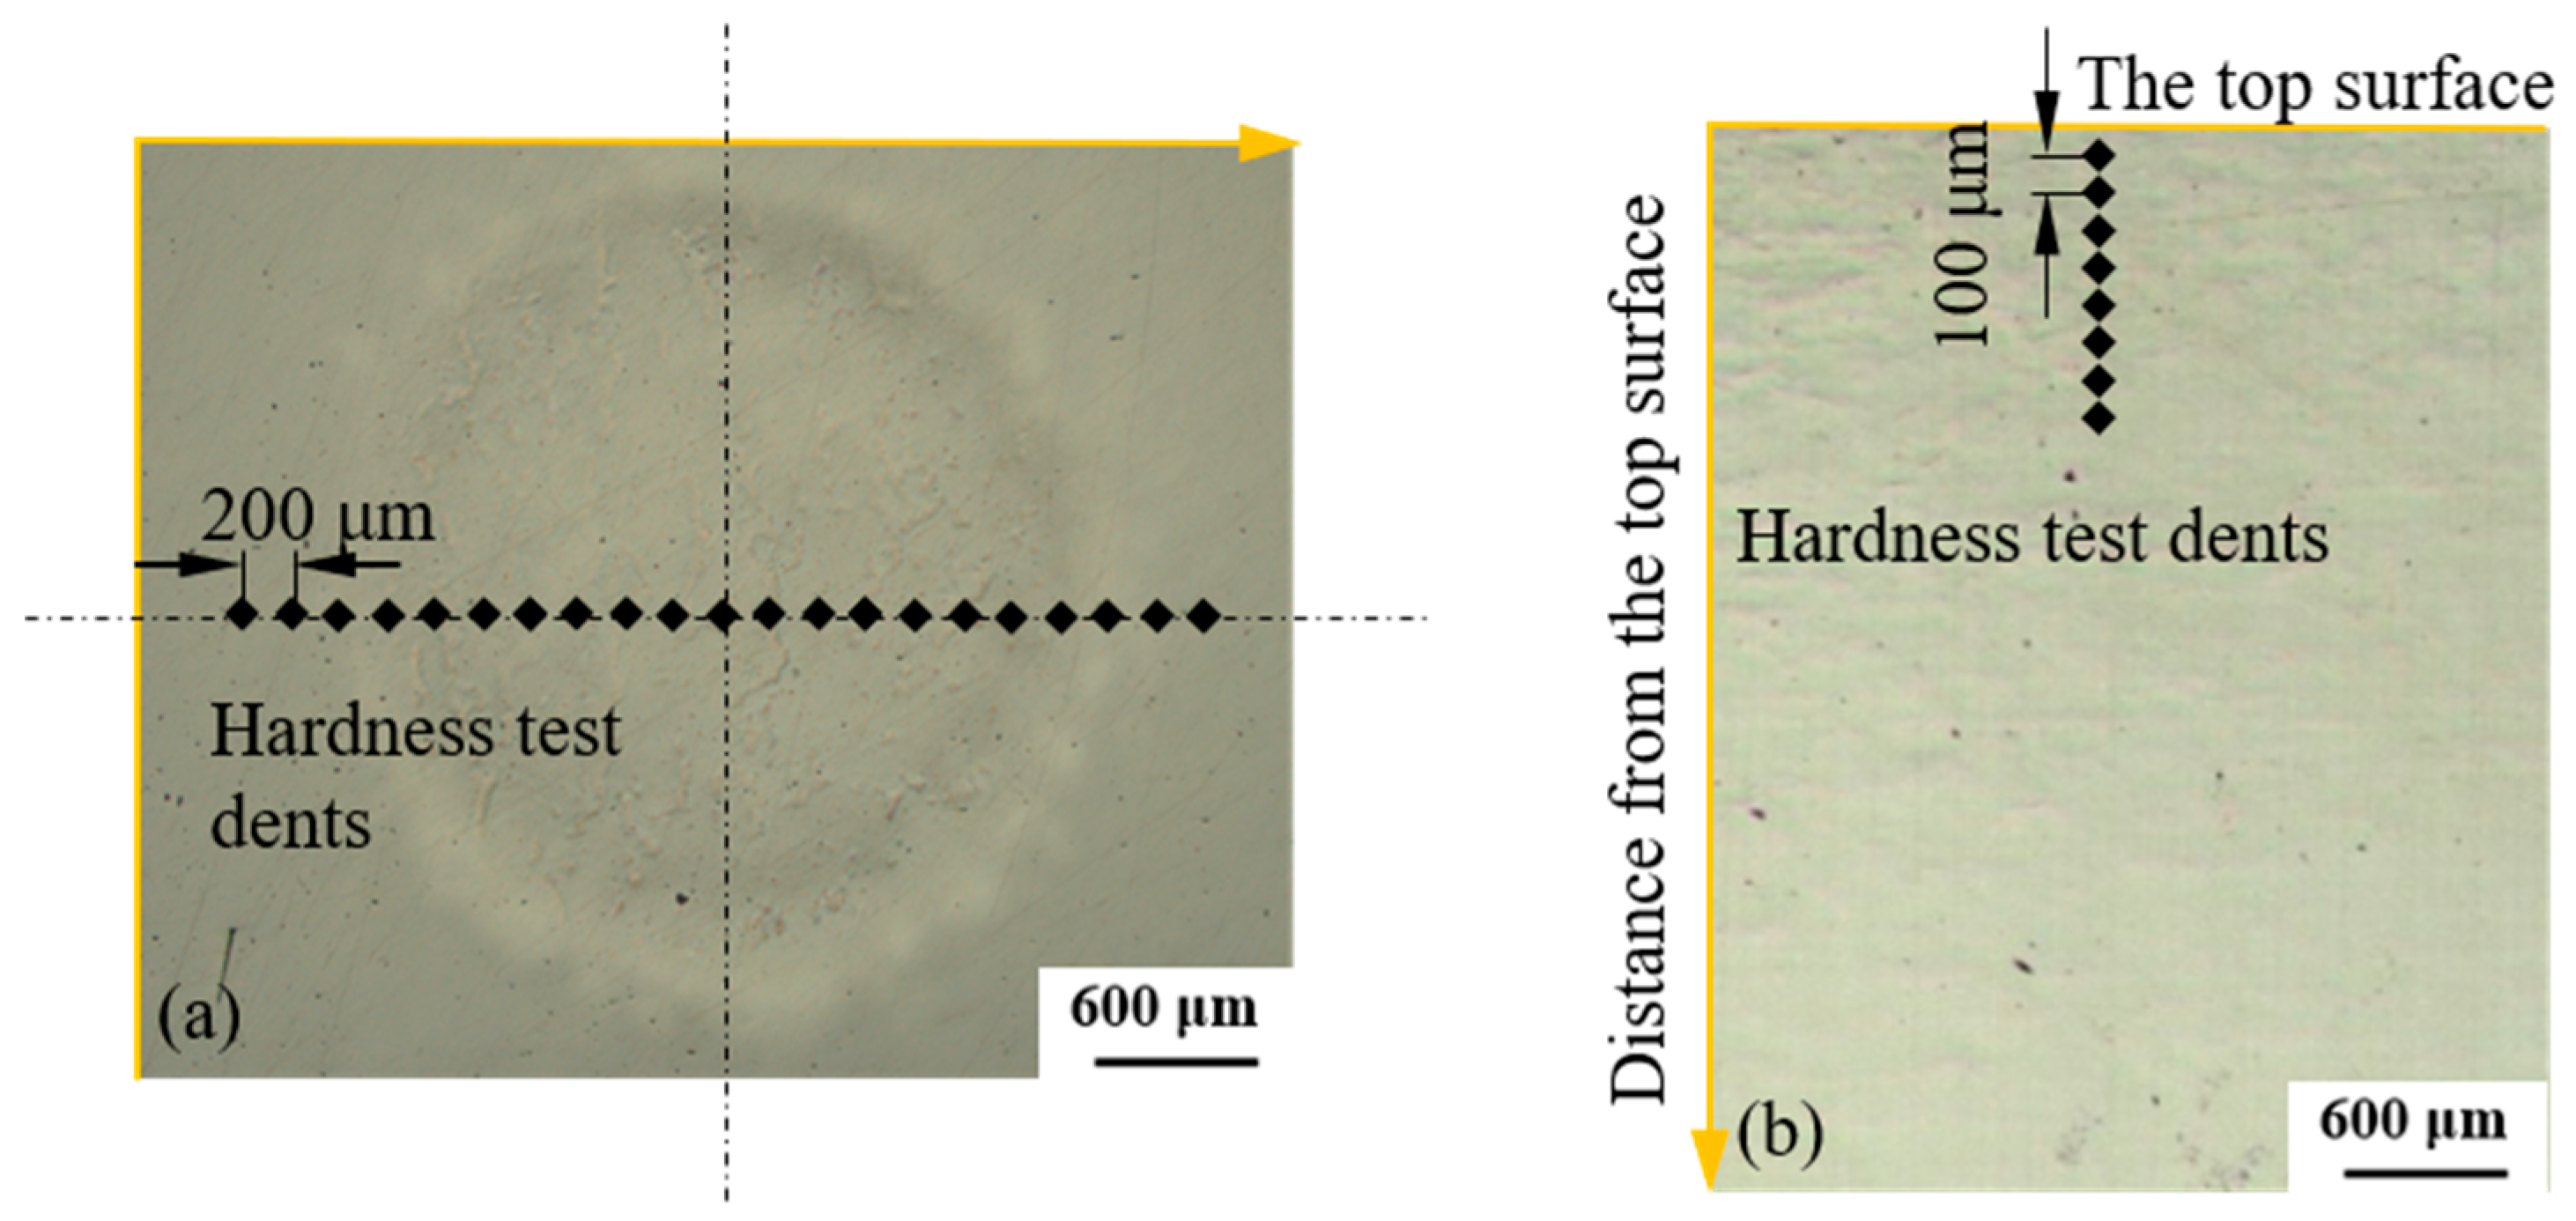
4.2. Detection Methods

The surface microhardness of the strengthened area and along the cross-sectional direction was measured by using a FALCAN-511 digital microhardness tester (Yicuo Instrument Co., LTD, Shanghai, China), with a holding time of 10 s and a load of 50 g. The surface microhardness of the strengthened area was measured by pointing at 0.2 mm spacings. The surface microhardness for the cross-sectional direction was also measured by pointing at every 0.1 mm spacing, as revealed in Figure 9.
The residual stresses at the surface and depth direction of the strengthened area were measured using an HDS-I type X-ray residual stress tester. The residual stress of the surface was measured at a 0.2 mm spacing. The surface material was removed layer by layer, with electrolytic polishing, and then the residual stresses for the depth direction were measured. The microstructure of the specimens was observed using a KEYENCE VK-X1000 confocal microscope (Keenshi Co., LTD, Shanghai, China) and a Phenom XL scanning electron microscope (FEI Corporation, Shanghai, China).

4.3. Experimental Results and Analysis

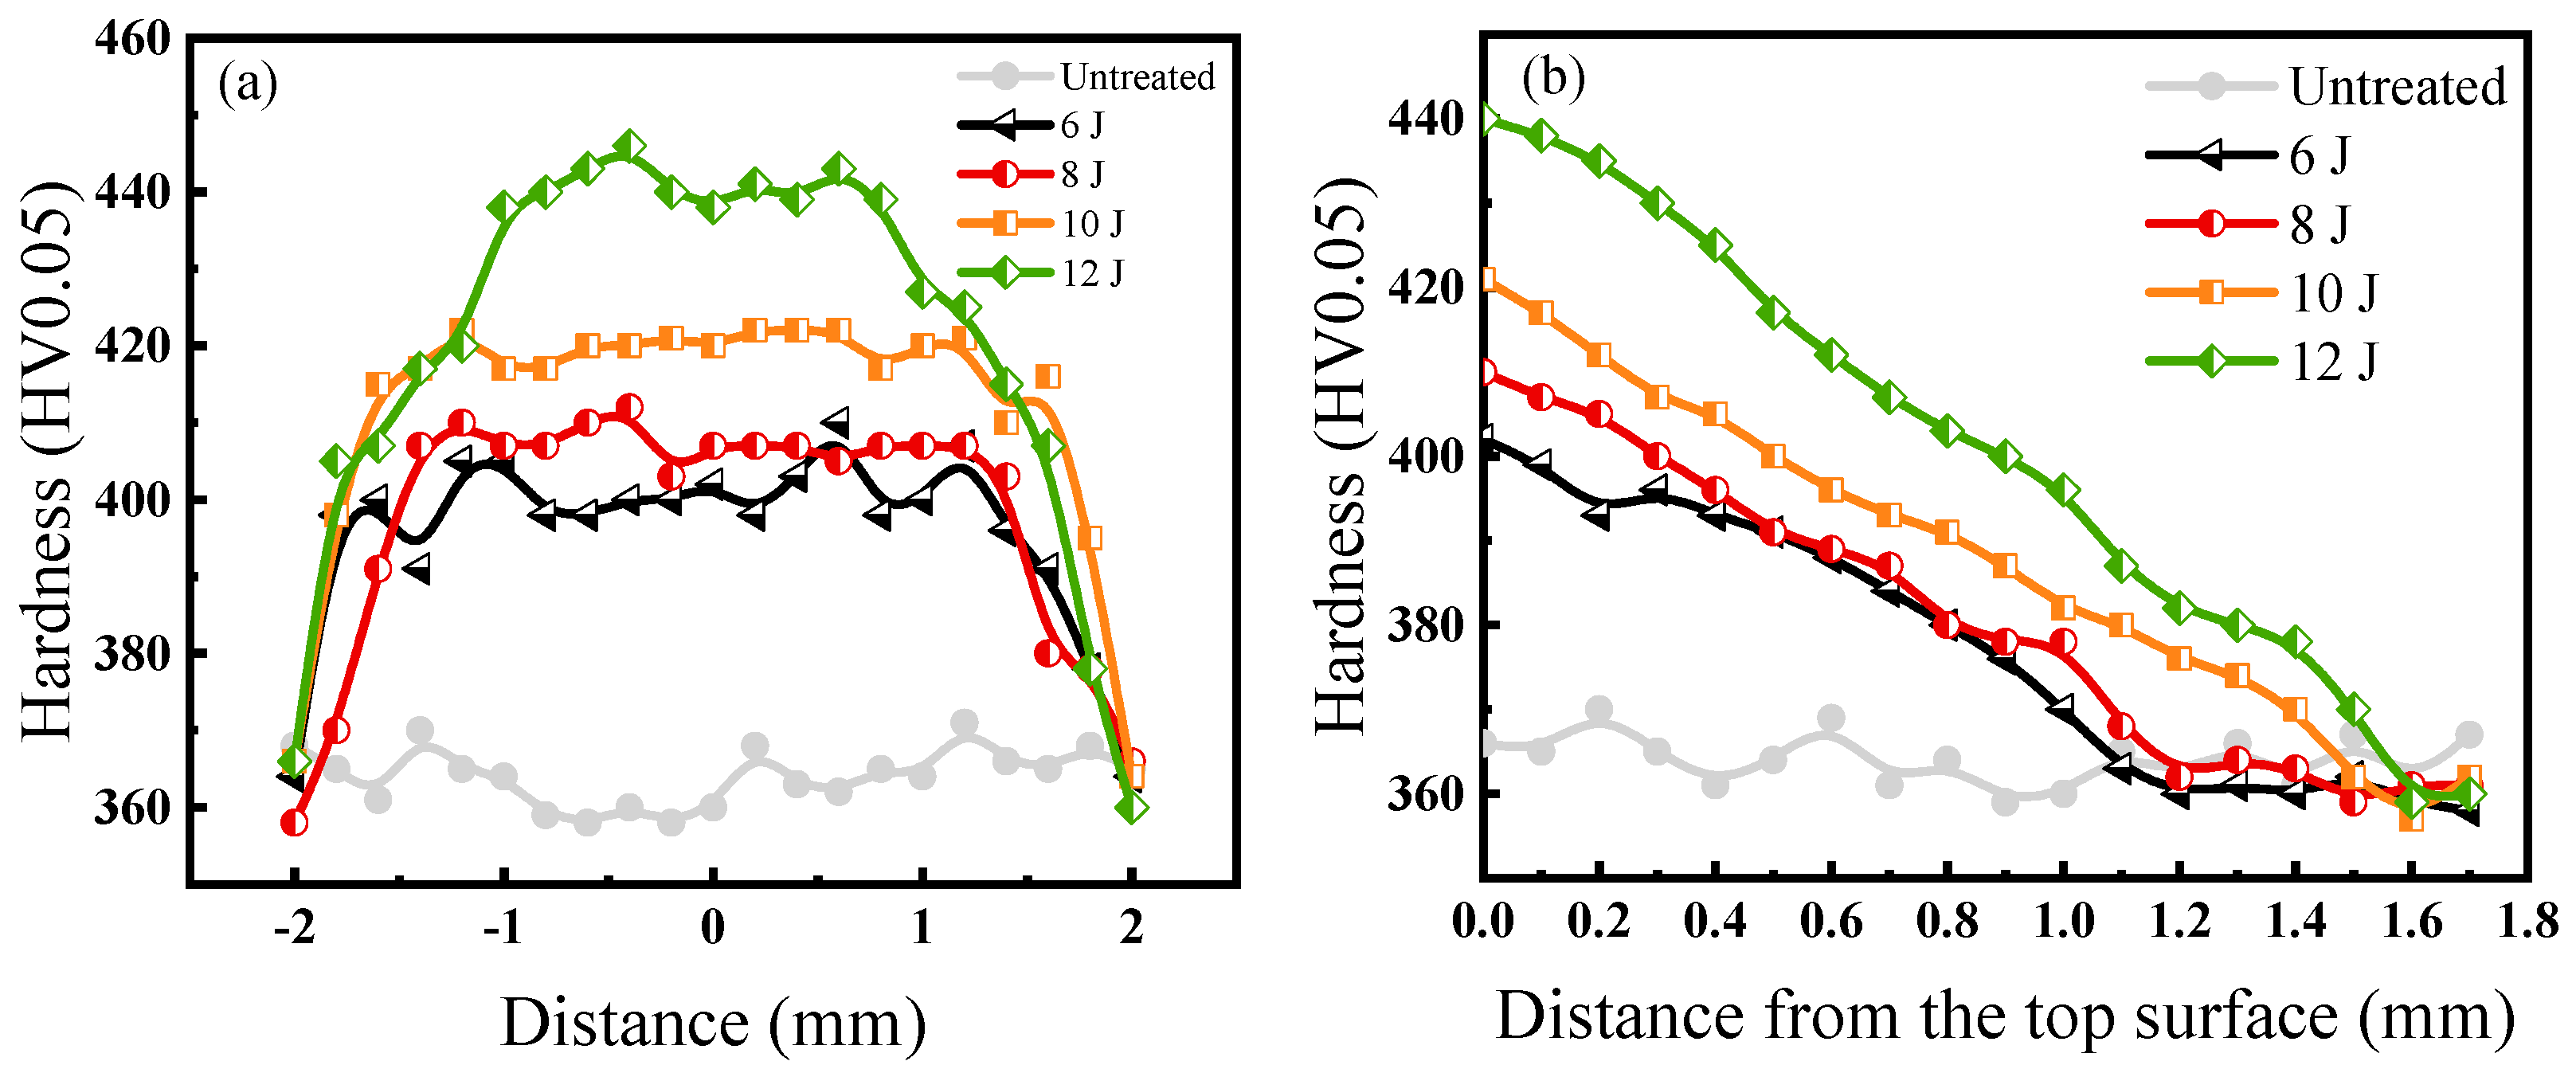
4.3.1. Hardness with Different Laser Pulse Energy Shocks

Figure 10 shows the microhardness distribution curves of the 40Cr specimens in the surface and cross-sectional directions of the shock-strengthened area under different laser pulse energies. From Figure 10a, it can be seen that the average surface microhardness of the specimens without shocks was 363HV0.05. It was found that the magnitude of the surface microhardness increased by 10.7%, 12.9%, 16.0%, and 21.2% after 6 J, 8 J, 10 J, and 12 J pulse energy shocks, respectively, demonstrating that surface microhardness increased with increasing pulse energy. However, the hardness improvement area was found to decrease. Even a small decrease in hardness was observed in some areas within the spot shock range, under pulse energies of 12 J. From Figure 10b, it can be seen that the laser pulse energy significantly affected the microhardness value of the specimen surface layer. Specifically, the microhardness of the specimen surface layer clearly increased with increasing pulse energy. Furthermore, the microhardness of 40Cr steel along the depth direction of the cross-section had a gradient distribution, with a microhardness value that decreased with increasing depth, gradually tending towards that of the matrix. Due to the laser shock wave propagating with attenuation in the specimen and reaching a certain depth with very little energy, it has almost no influence on the material [37]. The positive effect of LSP treatment on the hardness of the material may be attributed to the ultra-high strain rate of plastic deformation on the structure’s surface layers under the action of the laser shock wave, which forms more dislocations and produces surface hardening due to grain refinement [38].

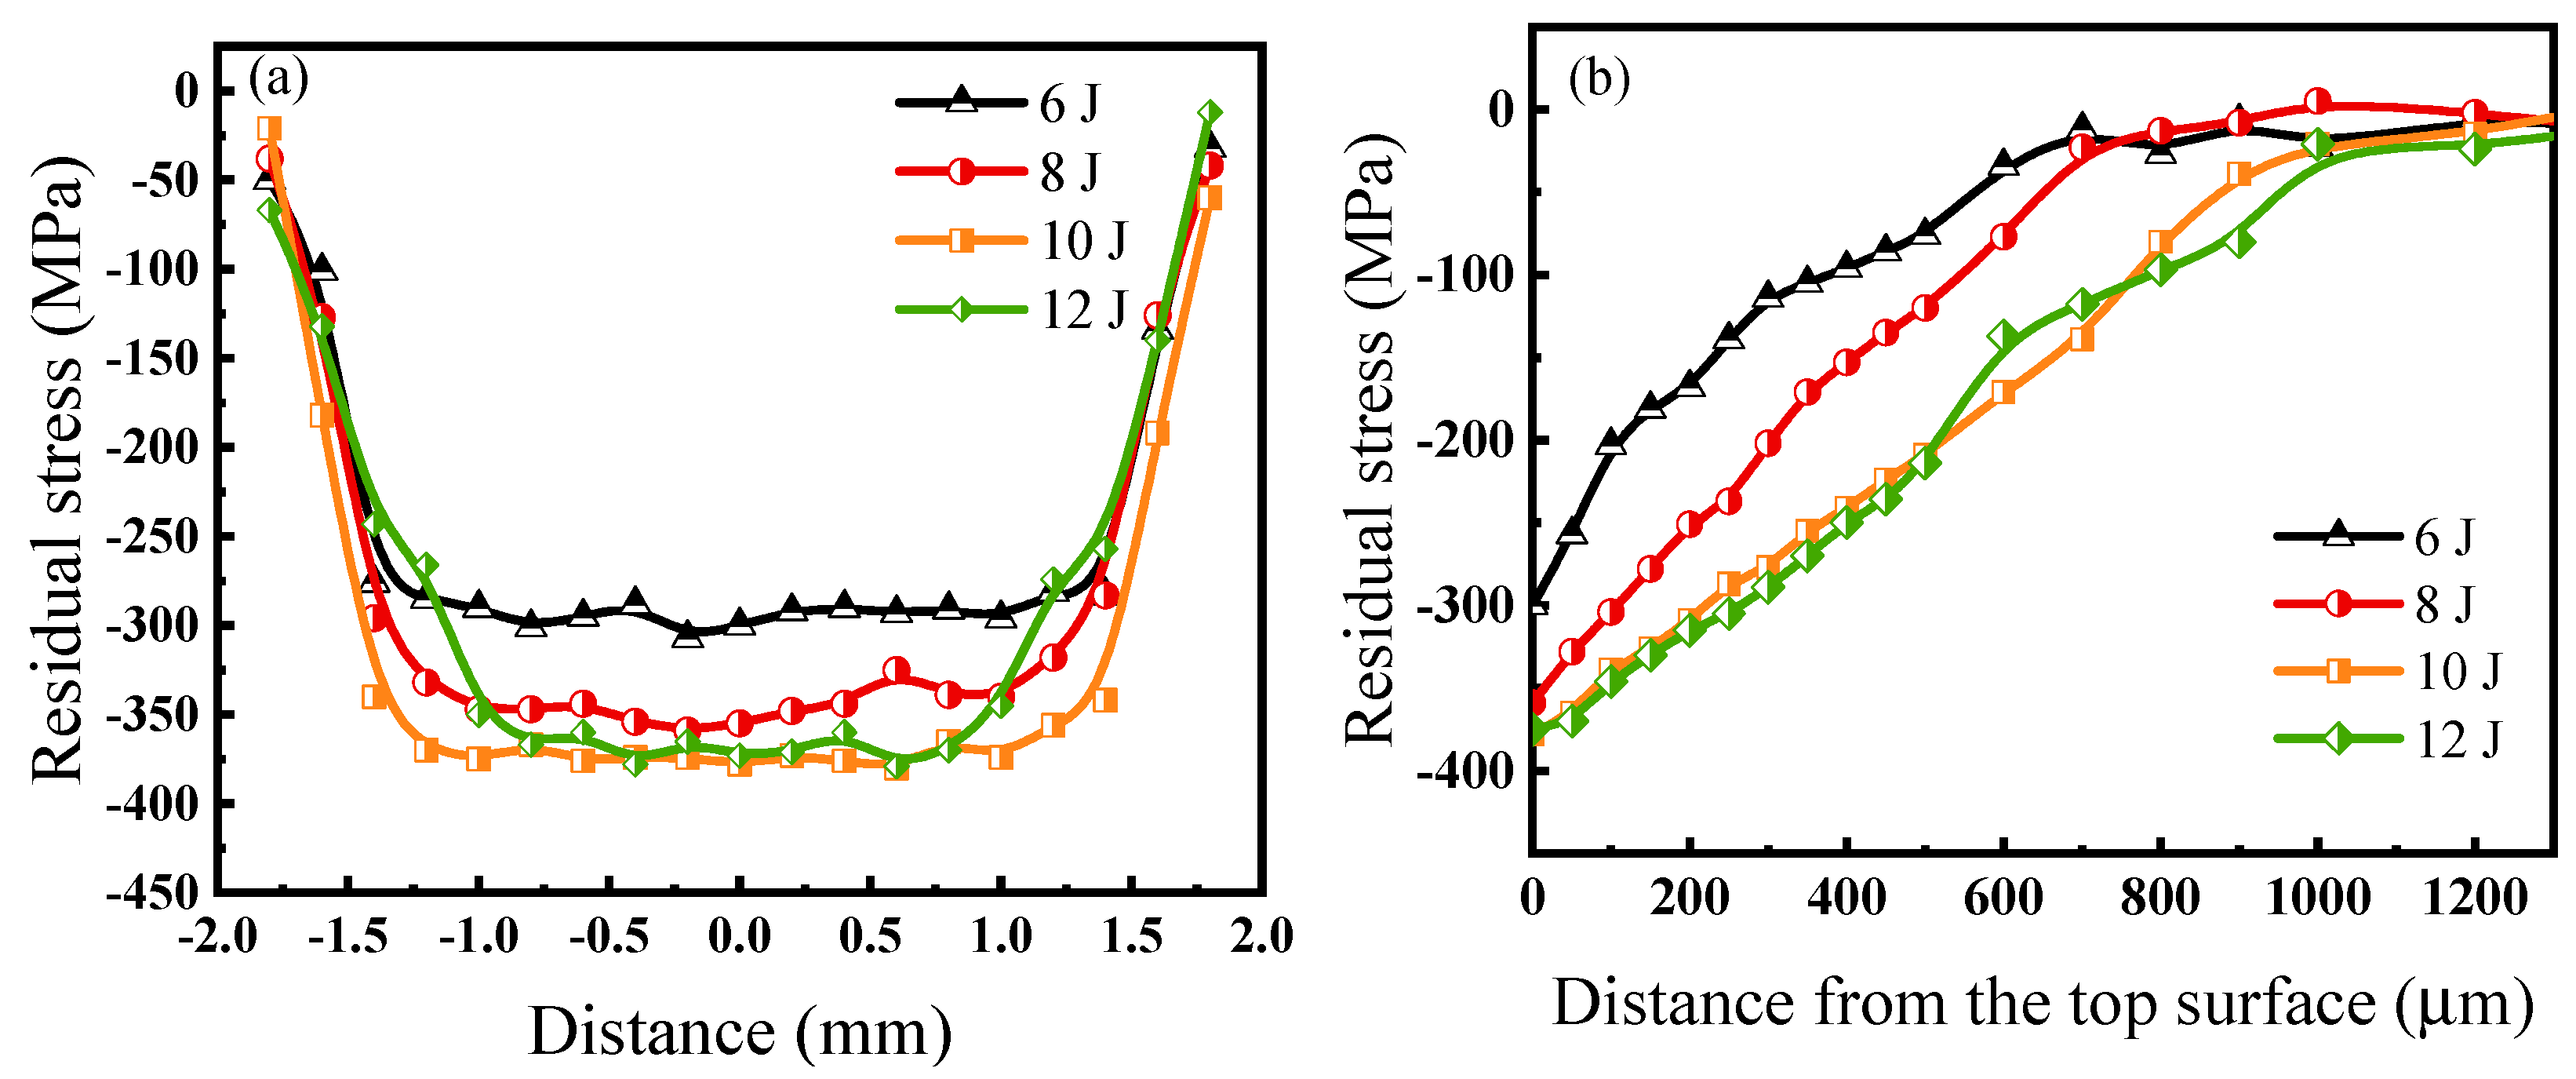
4.3.2. Residual Stress with Different Laser Pulse Energy Shocks

The residual compressive stress can inhibit the generation and expansion of cracks on the surface of the specimen [39,40]. After laser shock, residual compressive stress occurred on the surface of the specimen. Figure 11 shows the residual stress distribution on the surface and depth direction of the specimen with different pulse energy shocks. From Figure 11a, when the energy was less than 10 J, the surface residual stress increased with the increase in the pulse energy. Similarly, when the energy exceeded 10 J, the surface residual stress decrease with the increase in the pulse energy. When the pulse energy of 12 J was combined with a peak pressure of the induced shock wave close to 2.5 times the σHEL of 40Cr, loose waves occurred on the surface, causing the relaxation of the residual stress on the surface.
From Figure 11b, the residual stress of 40Cr steel along the depth direction had a decreasing trend. The maximum residual stresses corresponding to pulse energies of 6 J, 8 J, 10 J, and 12 J were −300 MPa, −359 MPa, −378 MPa, and −375 MPa, and the residual stress-affected layer depths were 690 μm, 810 μm, 1050 μm, and 1058 μm, respectively. With increasing energy, the depth of the residual stress-affected layer also increased. However, when the energy value exceeded 10 J, the maximum residual stress slightly decreased.

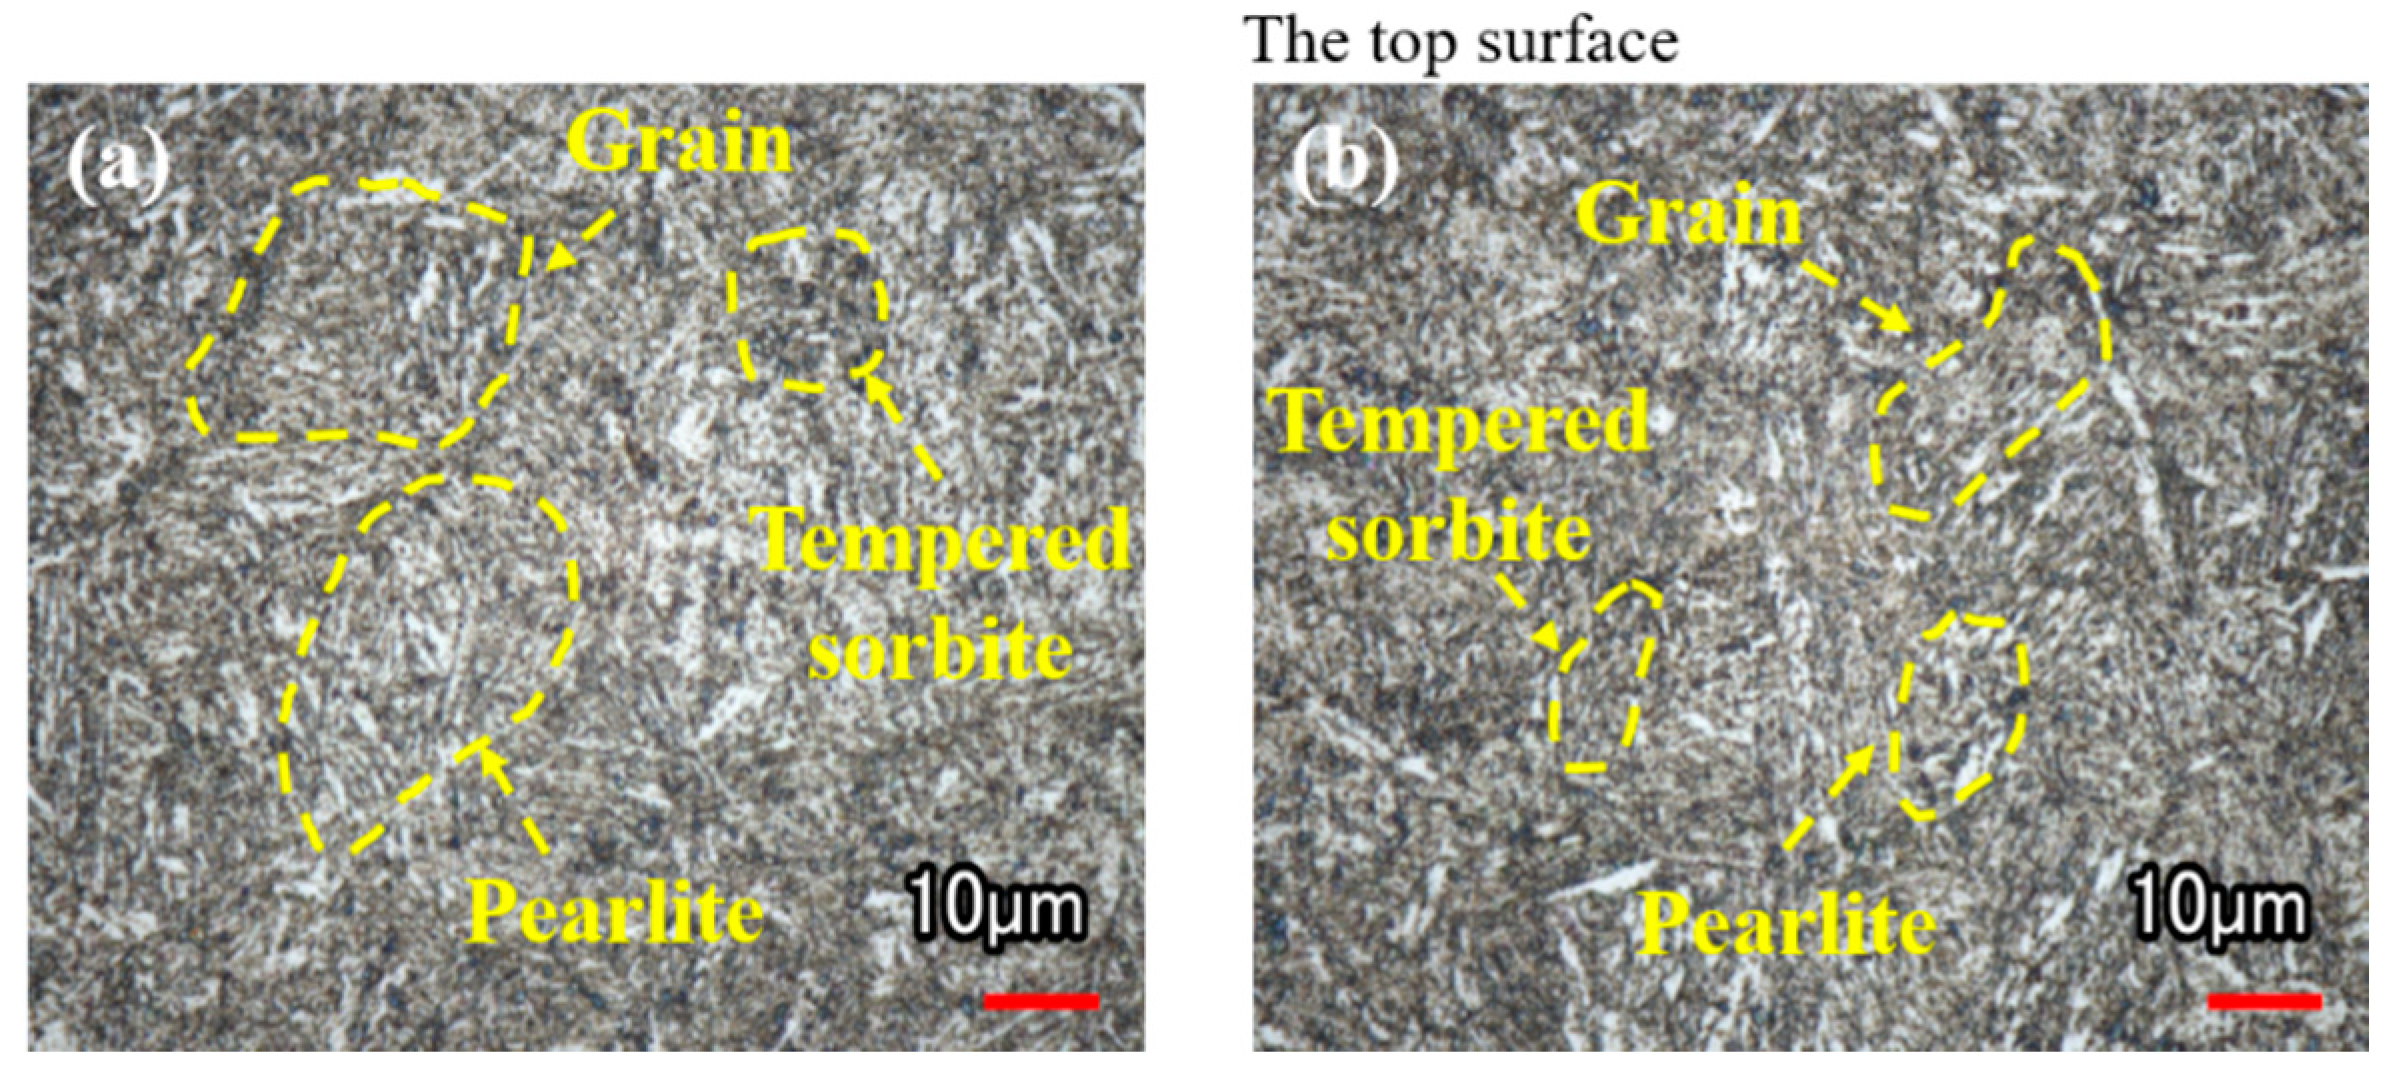
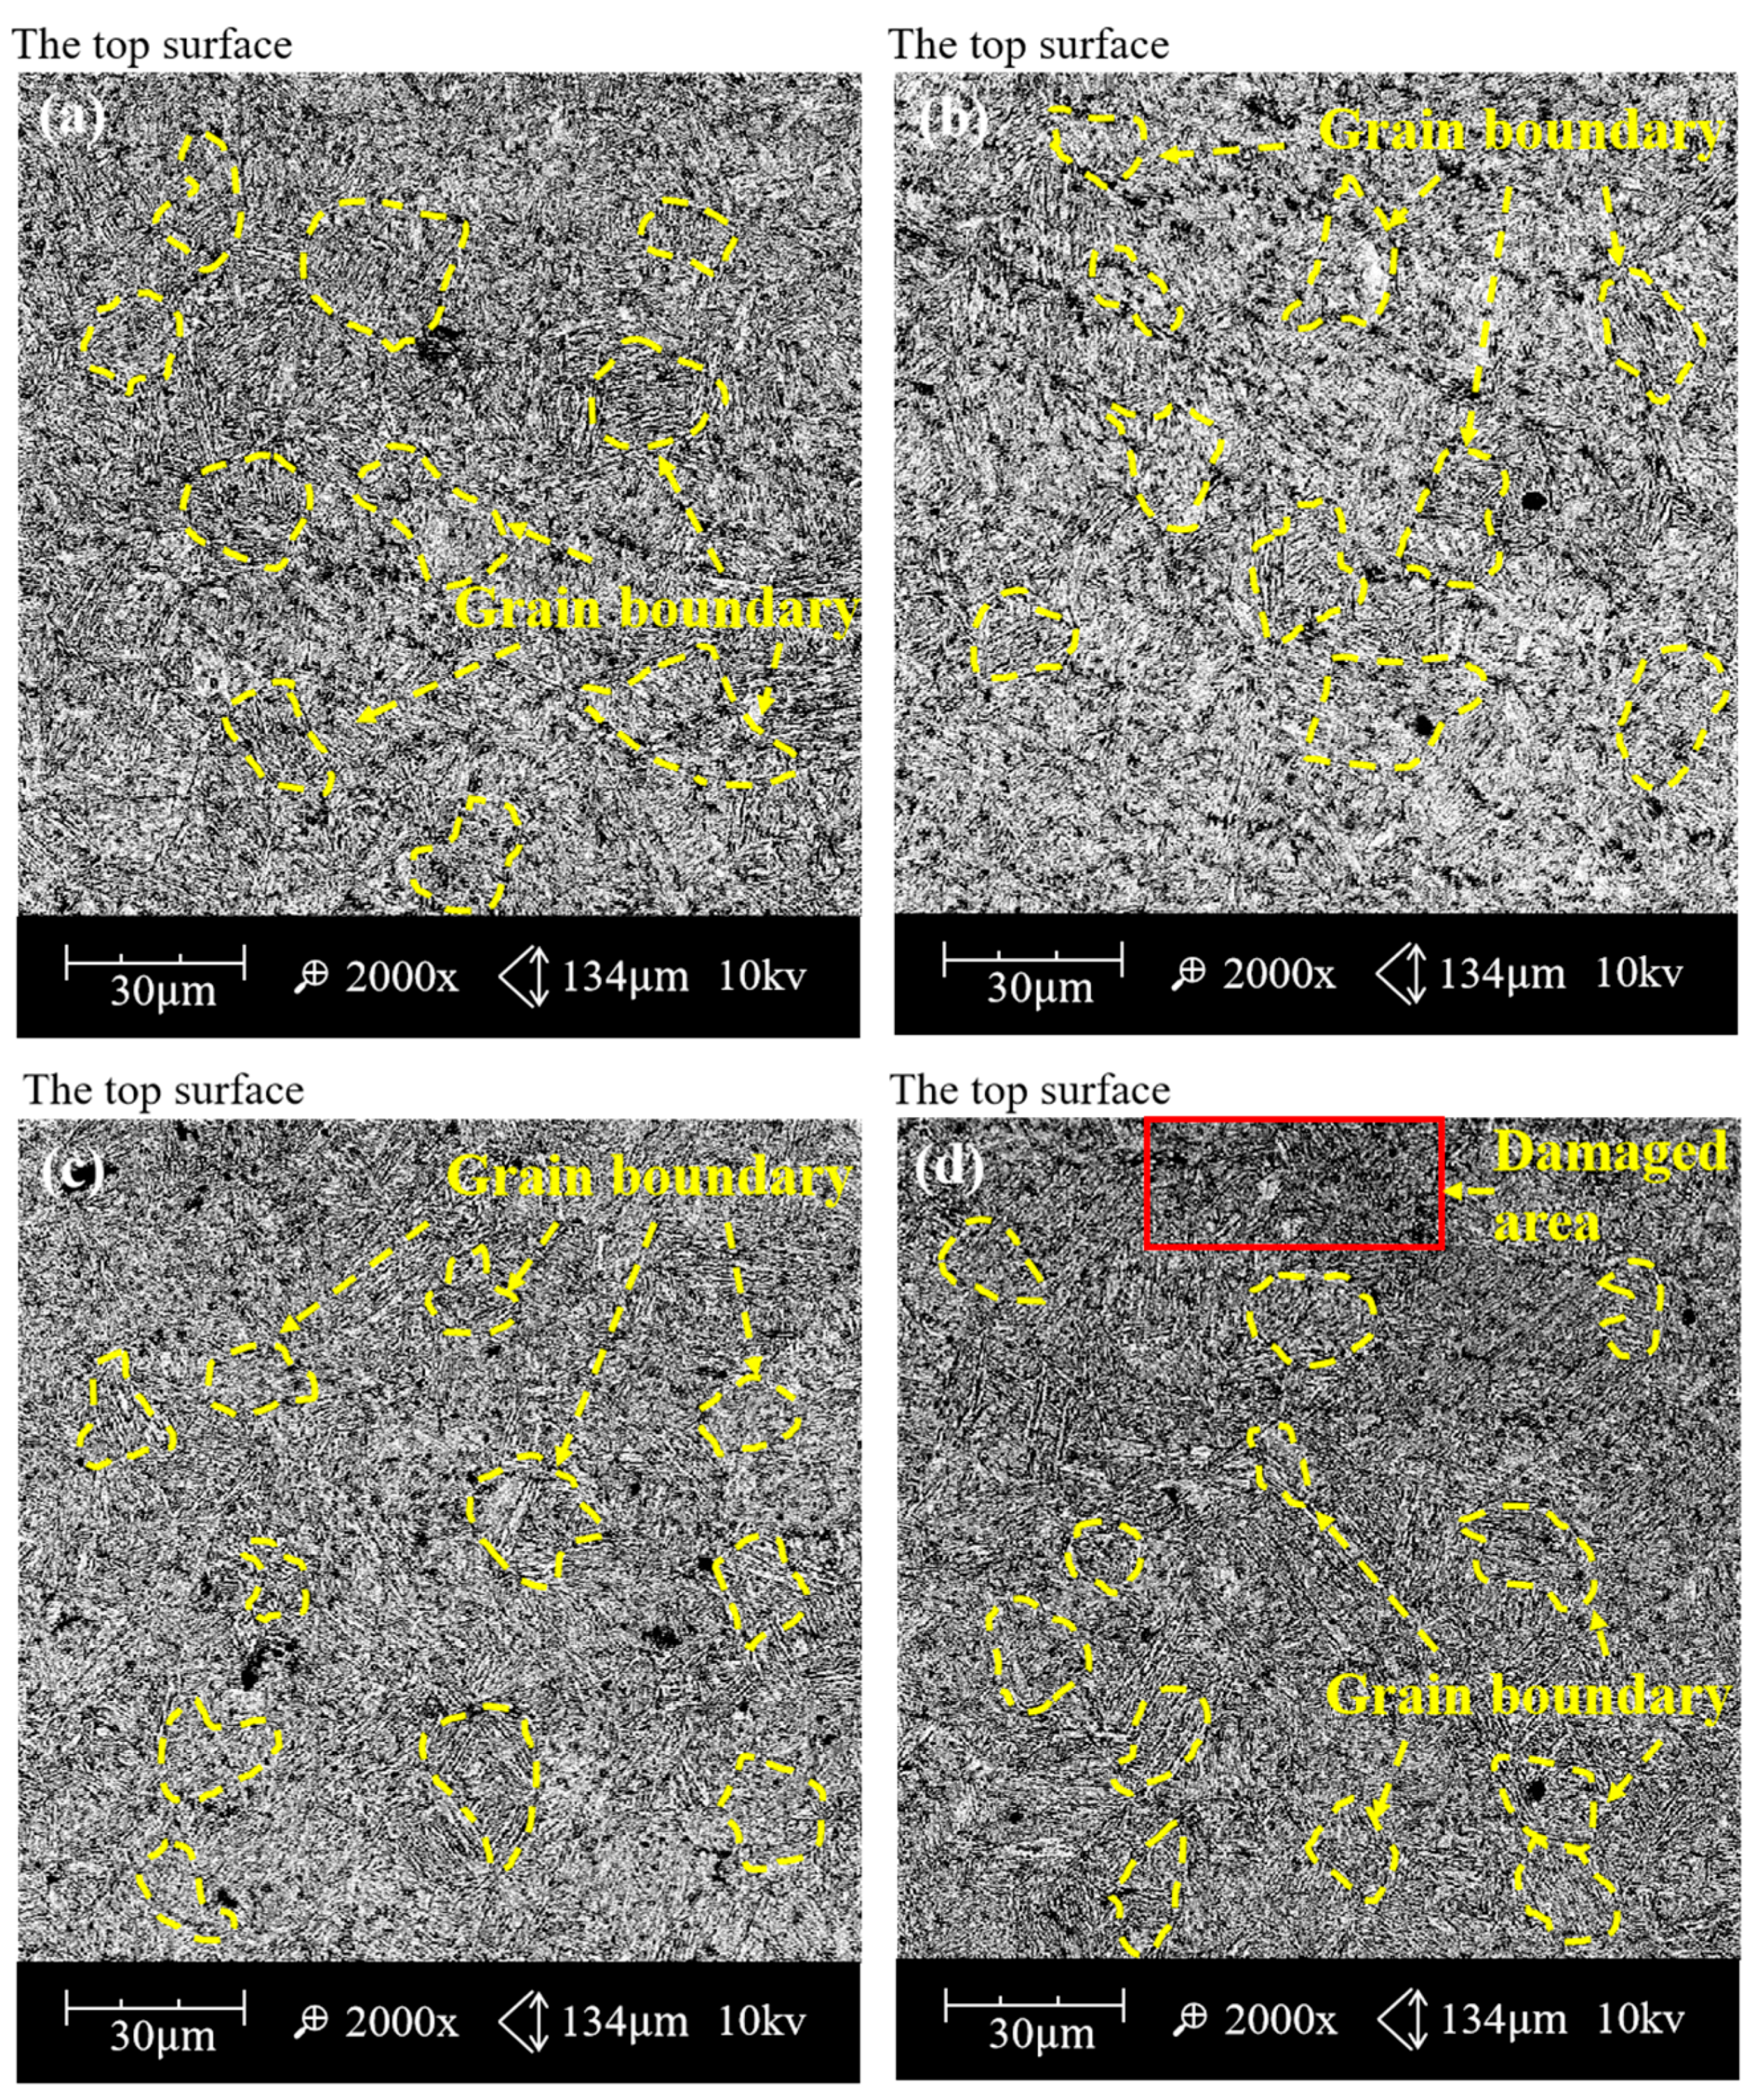
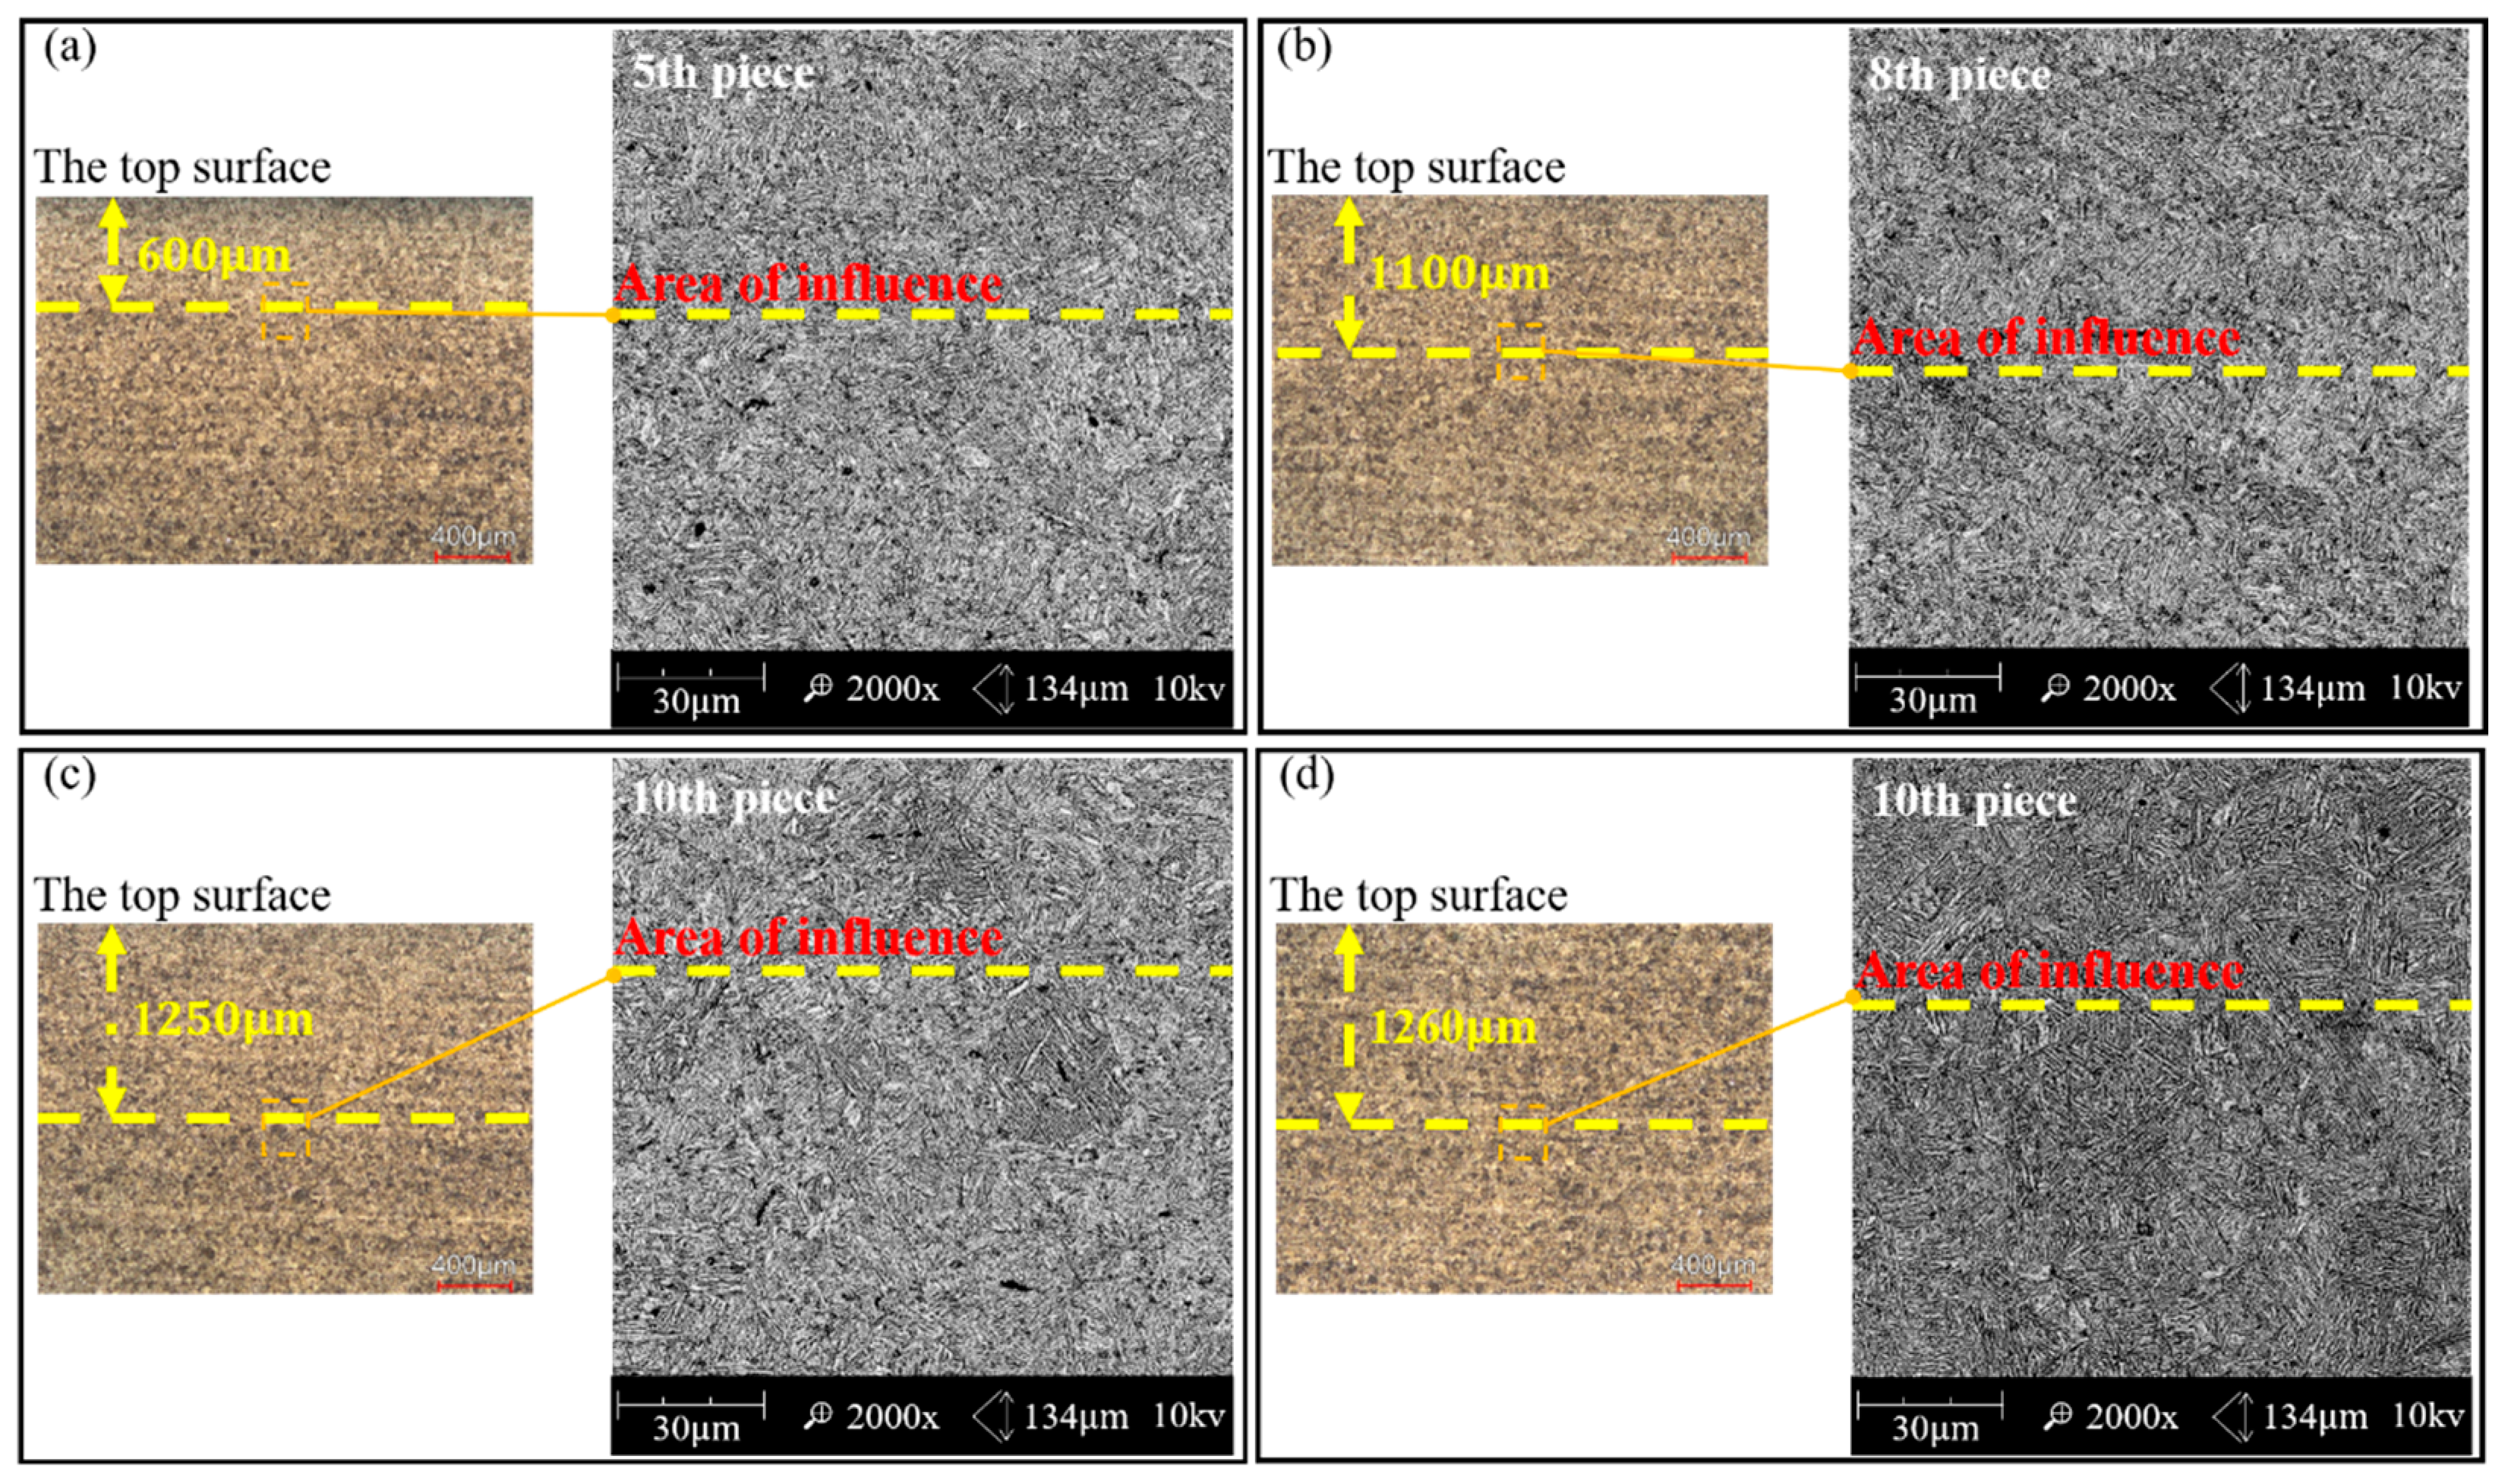
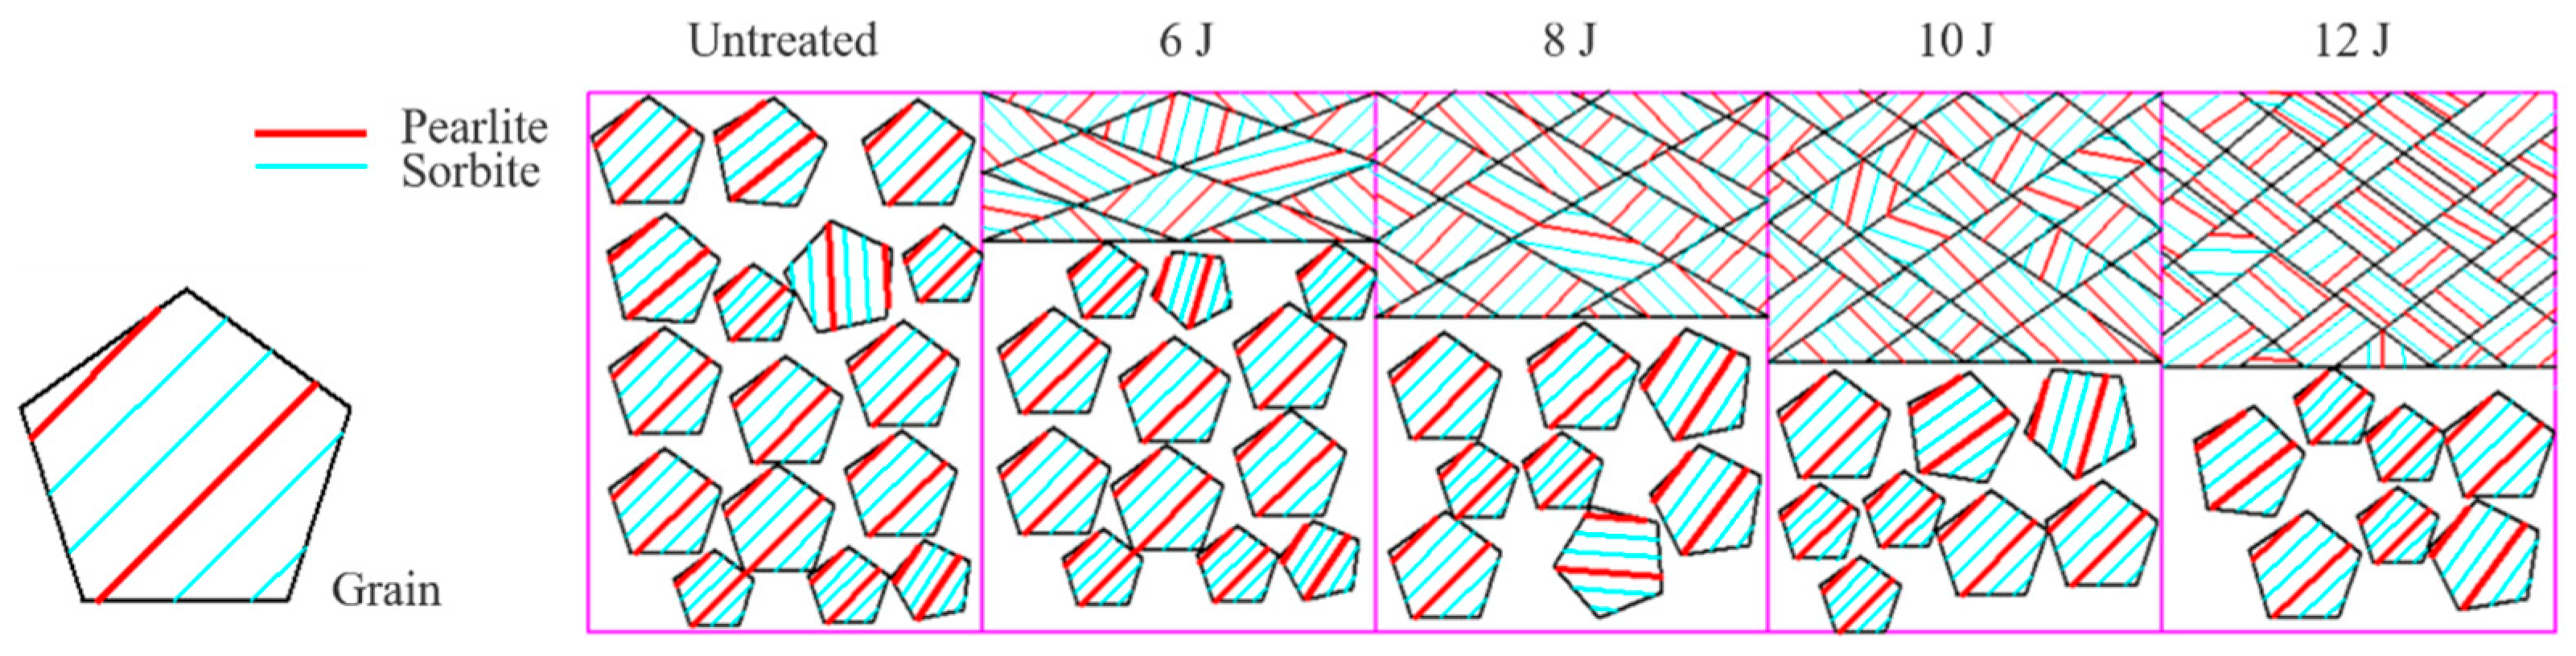
4.3.3. Microstructure with Different Laser Pulse Energy Shocks

After the test cross-sections were ground and polished, they were observed and photographed using a confocal microscope and a scanning electron microscope after corrosion for 10 s at room temperature using 4% nitric acid alcohol. Figure 12 shows the metallographic structure of untreated specimens and laser-shocked specimens with 10 J pulsed energy. As Figure 12a displays, for the untreated specimen, the metallographic structure was mainly tempered sorbite and pearlite. Figure 12b illustrates that after laser shock treatment, the structure of the laser shock-affected layer was refined, with finer pearlite and tempered sorbite structures compared without the shock. The grains in Figure 12b are finer than the grains in Figure 12a, indicating that the material was refined by laser shock under shock waves for both sorbite and pearlite, and the grains were also refined. Shock waves induced by plasma explosion after the absorption of laser beam energy produced severe plastic deformation on the surface of the samples [41]. Here, the ultrahigh strain rate produced by LSP effectively refined the crystals of the plastic deformation layer and improved the mechanical properties of the plastic deformation layer [42].
Figure 13 shows SEM images of the surface layer with different pulse energies. As can be seen from Figure 12, the average grain size of the unimpacted sample measured by the liner intercept method was about 30 μm. When the pulse energies were 6 J, 8 J, 10 J, and 12 J, the average grain sizes were about 25 μm, 21 μm, 16 μm, and 12 μm, respectively. The figures show that the refinement of the pearlite and sorbite structures of the surface layer deepened, with the grain size decreasing as the energy increased. Laser shock resulted in the plastic deformation of the metal surface and a large amount of dislocation in the grain. With the increase in pulse energy, plastic deformation accumulates, and twins occur easily at the entanglement of dislocation; the twins interact with dislocation, finally achieving the effect of refining the grains [43]. As revealed in Figure 13d, the pulsed energy 12 J laser shock on the specimen caused damage to their surface, which weakened the surface properties, although the damaged area was small. This makes sense because of the thermal effect in our LSP experiment.
A picture was taken every 134 μm along the downward surface of the specimen until the microstructure became consistent with the matrix after delineating the boundary line. Then, the depth of the shock-affected layer was defined, as shown in Figure 14. In order of demarcation, the boundary line of the 6 J, 8 J, 10 J, and 12 J laser shock specimens appeared in the 5th, 8th, 10th, and 10th piece, respectively. These, in turn, corresponded to the shock-affected depth layers of 600 μm, 1100 μm, 1250 μm, and 1260 μm. The depth of the impact area gradually increased with the increase in the pulse energy. During LSP, the topmost surface experiences the highest plastic strain and it gradually decreases to zero as the depth increases, so the plastic-induced grain refinement has a gradient distribution. However, the depth of the shock-affected layer slowed and tended towards saturation after the energy reached 10 J, showing that the increase in the pulse energy led to an increase in the shock wave pressure and thus the grain refinement depth. However, when the pulse energy exceeded a certain range, the induced stress wave propagated downward in the sample, resulting in the reverse loose wave effect. This makes the grain refinement depth of the material in a certain depth range gradually saturate with the increase in the pulse energy [44].

5. Discussion

The LSP-induced shock wave causes severe plastic deformation on the material’s surface, resulting in many defects such as twins and dislocation inside the material, which eventually evolve into fine particles [45]. However, defects such as dislocation, twins, and lattice distortion can induce residual stress fields and work hardening [46]. Therefore, grain refinement is the direct cause of microhardness and an increase in the residual stress. The degree of grain refinement depends on the action time and laser power density. The action time depends on the pulse width of the laser pulse, and the simulation showed that the optimal pulse width was 20 ns. When the pulse width and spot diameter are constant, the laser power density depends on the pulse energy. As shown in Figure 15, with the increase in the pulse energy, the laser power density increased, and the instantaneous impact force of the plasma shock wave increased, resulting in more significant plastic deformation and grain refinement depth and degree increases. When the pulse energy was greater than 10 J, the grain refinement depth did not increase significantly and tended to saturation. The changes in hardness and residual stress with pulse energy also followed a similar trend. The main reason is that the increase in the pulse energy leads to the rise of the dynamic yield limit of the sample surface, the plastic deformation tends to saturation, and the effect of laser shock on the grain refinement depth of the material is gradually weakened. The LSP-induced compressive residual stress distribution, hardening level, and grain refinement are different for different materials, but the influence pattern is similar.

6. Conclusions

Selecting LSP parameters directly affects the strengthening effect. In this paper, process parameters were selected by using theoretical analysis, numerical simulation, and experiments. The following conclusions were drawn.
(1)
The peak value of the shock wave was determined by theoretical analysis, based on the properties of the target material. The range of the peak value of shock wave was 5.09 GPa–6.36 GPa for 40Cr.
(2)
The optimal pulse width was selected by FEM simulation, 20 ns for 40Cr.
(3)
For the 40Cr specimen, the surface microhardness and surface residual stress gradually increased with increasing energy. However, when the energy exceeded 10 J, their uniformity became worse and decreased in some areas. The maximum surface layer residual stress gradually increased as the energy increased; above 10 J, it no longer increased. The thickness of the surface shock-affected layer gradually increased with increasing energy. However, when the energy exceeded 10 J, the thickness of the influence layer almost stopped increasing. Based on the influence on microhardness, residual stress, and microstructure, the optimal pulse energy for 40Cr specimens was 10 J, which is consistent with the simulation result.
Different materials need different optimal process parameters when they are strengthened by LSP. In the study, the influence of laser shock parameters, especially the pulse width and pulse energy, was analyzed comprehensively for 40Cr, providing a reference for selecting the LSP parameters of other metallic materials.

Author Contributions

Conceptualization, X.C., J.S., Z.X., J.C. (Junying Chen), Q.J., Y.L., J.L. and J.C. (Jun Cheng); Methodology, X.C., J.S., Q.J. and Y.L.; Software, X.C.; Validation, J.C. (Jun Cheng); Formal analysis, X.C., J.S. and Z.X.; Investigation, X.C. and J.S.; Resources, X.C. and J.S.; Writing—original draft, X.C. and J.S.; Writing—review & editing, X.C.; Visualization, Z.X.; Supervision, J.L.; Project administration, X.C.; Funding acquisition, X.C., Z.X. and J.C. (Junying Chen). All authors have read and agreed to the published version of the manuscript.

Funding

The authors gratefully acknowledge the support of the Natural Science Foundation of Fujian, China (Grant No. 2021J05168, 2021J01855, 2020J01693). The authors gratefully acknowledge the support of the Major Science and Technology Projects of Fujian, China (Grant No. 2021HZ0109). The authors gratefully acknowledge the support of the Marine Economic Development Project of Fujian, China (Grant No. FJHJF-L-2021-9).

Institutional Review Board Statement

Not applicable.

Informed Consent Statement

Not applicable.

Data Availability Statement

Not applicable.

Conflicts of Interest

The authors declare no conflict of interest.

References

  1. Hereñú, S.; Strubbia, R.; Rubio-González, C.; Spadaro, L.; Bolmaro, R.; Gomez-Rosas, G. High cycle fatigue life improvement of superferritic stainless steel by laser shock peening without coating. J. Opt. Laser Technol. 2022, 152, 108083. [Google Scholar] [CrossRef]
  2. Wei, G.; Hao, W.; Guangzhi, H.; Peng, P.; Dongsheng, H.; Guofeng, H.; Jianfeng, Y. Comparison of mechanical and corrosion properties of 7050 aluminum alloy after different laser shock peening. J. Opt. Laser Technol. 2022, 151, 108061. [Google Scholar] [CrossRef]
  3. Xiaoya, L.; Rui, M.; Xin, L.; Qibing, L.; Xiao, W.; Zeng, T. Effect of laser shock peening on fatigue properties of U75VG rail flash-butt welding joints. J. Opt. Laser Technol. 2022, 149, 107889. [Google Scholar] [CrossRef]
  4. Bohan, W.; Li, C.; Dongchun, L. Study on very high cycle fatigue properties of forged TC4 titanium alloy treated by laser shock peening under three-point bending. Int. J. Fatigue 2022, 156, 106668. [Google Scholar] [CrossRef]
  5. Jingdong, S.; Sihai, L.; Xiaoqing, L.; Zhenyang, C.; Wang, Z.; Changgeng, P.; Weifeng, H. Rolling contact fatigue and damage characteristic of AISI 9310 steel with pre-laser shock peening treatment. Int. J. Fatigue 2022, 155, 106588. [Google Scholar] [CrossRef]
  6. Wei, L.; Huitao, C.; Weiying, H.; Jian, C.; Shuaipeng, A.; Guoyuan, X.; Shengde, Z. Optimization of multiple laser shock peening on high-cycle fatigue performance of aluminized AISI 321 stainless steel. Int. J. Fatigue 2021, 153, 106505. [Google Scholar] [CrossRef]
  7. Tang, Z.; Wang, K.; Dong, X.; Duan, W.; Mei, X. Effect of Warm Laser Shock Peening on the Low-Cycle Fatigue Behavior of DD6 Nickel-Based Single-Crystal Superalloy. J. Mater. Eng. Perform. 2021, 30, 2930–2939. [Google Scholar] [CrossRef]
  8. Yi, G.; Wenyu, Y.; Zhouzhou, H.; Zixuan, L. Effects of residual stress and surface roughness on the fatigue life of nickel aluminium bronze alloy under laser shock peening. J. Eng. Fract. Mech. 2021, 244, 107524. [Google Scholar] [CrossRef]
  9. van Aswegen, D.C.; Polese, C. Experimental and analytical investigation of the effects of laser shock peening processing strategy on fatigue crack growth in thin 2024 aluminium alloy panels. Int. J. Fatigue 2021, 142, 105969. [Google Scholar] [CrossRef]
  10. Yong, W.; Xibin, W.; Zhibing, L.; Shuyao, L.; Hui, C.; Xiaoyu, P.; Hongtao, C. Effects of laser shock peening in different processes on fatigue life of 32CrNi steel. J. Mater. Sci. Eng. A 2020, 796, 139933. [Google Scholar] [CrossRef]
  11. Ding, H.; Li, Y.; Zhang, Z.; Yuan, D. Analysis of microstructural evolution properties based on laser shock peening. J. Optik 2019, 179, 361–366. [Google Scholar] [CrossRef]
  12. Prabhakaran, S.; Kalainathan, S.; Shukla, P.; Vasudevan, V.K. Residual stress, phase, microstructure and mechanical property studies of ultrafine bainitic steel through laser shock peening. J. Opt. Laser Technol. 2019, 115, 447–458. [Google Scholar] [CrossRef]
  13. Yang, K.; Huang, Q.; Zhong, B.; Wang, Q.; Chen, Q.; Chen, Y.; Su, N.; Liu, H. Enhanced extra-long life fatigue resistance of a bimodal titanium alloy by laser shock peening. Int. J. Fatigue 2020, 141, 105868. [Google Scholar] [CrossRef]
  14. Yella, P.; Rajulapati, K.V.; Reddy, G.V.P.; Sandhya, R.; Kiran, P.P.; Buddu, R.K.; Rao, K.B.S. Effect of laser shock peening on high cycle fatigue characteristics of 316LN stainless steel. Int. J. Press. Vessels Pip. 2019, 176, 103972. [Google Scholar] [CrossRef]
  15. Kumar, R.A.; Ramakanta, B.; Kishor, G.R.; Kumar, R.S.; Rashmi, S.; Kumar, G.U.; Ranganathan, K.; Ganesh, P.; Rakesh, K.; Singh, B.K. Enhancement of oxidation resistance of modified P91 grade ferritic-martensitic steel by surface modification using laser shock peening. J. Appl. Surf. Sci. 2019, 495, 143611. [Google Scholar] [CrossRef]
  16. Zhi, Q.; Bin, L.; Xia, H.; Han, Z.; Rui, C.; Muhammad, A.; Hongqian, X. The effect of laser shock peening on surface integrity and high and very high cycle fatigue properties of 2024-T351 aluminum alloy. J. Opt. Laser Technol. 2022, 149, 107897. [Google Scholar] [CrossRef]
  17. He, Z.; Shen, Y.; Tao, J.; Chen, H.; Zeng, X.; Huang, X.; El-Aty, A.A. Laser shock peening regulating aluminum alloy surface residual stresses for enhancing the mechanical properties: Roles of shock number and energy. J. Surf. Coat. Technol. 2021, 421, 127481. [Google Scholar] [CrossRef]
  18. Siddaiah, A.; Mao, B.; Kasar, A.K.; Liao, Y.; Menezes, P.L. Influence of laser shock peening on the surface energy and tribocorrosion properties of an AZ31B Mg alloy. J. Wear 2020, 462–463, 203490. [Google Scholar] [CrossRef]
  19. Brockman, R.A.; Braisted, W.R.; Olson, S.E.; Tenaglia, R.D.; Clauer, A.H.; Langer, K.; Shepard, M.J. Prediction and characterization of residual stresses from laser shock peening. Int. J. Fatigue 2012, 361, 96–108. [Google Scholar] [CrossRef]
  20. Umapathi, A.; Swaroop, S. Mechanical properties of a laser peened Ti-6Al-4V. J. Opt. Laser Technol. 2019, 119, 105568. [Google Scholar] [CrossRef]
  21. Spadaro, L.; Hereñú, S.; Strubbia, R.; Rosas, G.G.; Bolmaro, R.; González, C.R. Effects of laser shock processing and shot peening on 253 MA austenitic stainless steel and their consequences on fatigue properties. J. Opt. Laser Technol. 2020, 122, 105892. [Google Scholar] [CrossRef]
  22. Wu, J.; Li, Y.; Zhao, J.; Qiao, H.; Lu, Y.; Sun, B.; Hu, X.; Yang, Y. Prediction of residual stress induced by laser shock processing based on artificial neural networks for FGH4095 superalloy. J. Mater. Lett. 2021, 286, 129269. [Google Scholar] [CrossRef]
  23. Jiang, Q.; Li, S.; Zhou, C.; Zhang, B.; Zhang, Y. Effects of laser shock peening on the ultra-high cycle fatigue performance of additively manufactured Ti6Al4V alloy. J. Opt. Laser Technol. 2021, 144, 107391. [Google Scholar] [CrossRef]
  24. Wang, C.; Luo, K.; Wang, J.; Lu, J. Carbide-facilitated nanocrystallization of martensitic laths and carbide deformation in AISI 420 stainless steel during laser shock peening. Int. J. Plast. 2022, 150, 103191. [Google Scholar] [CrossRef]
  25. Wang, L.; Zhou, L.; Liu, L.; He, W.; Pan, X.; Nie, X.; Luo, S. Fatigue strength improvement in Ti-6Al-4V subjected to foreign object damage by combined treatment of laser shock peening and shot peening. Int. J. Fatigue 2022, 155, 106581. [Google Scholar] [CrossRef]
  26. Fan, J. Research on the Surface around Rivet Holes of Laser Shock Processing; Nanjing University of Aeronautics and Astronautics: Nanjing, China, 2011. [Google Scholar]
  27. Fabbro, R.; Peyre, P.; Berthe, L.; Scherpereel, X. Physics and applications of laser-shock processing. J. Laser Appl. 1998, 106, 265–279. [Google Scholar] [CrossRef]
  28. Peyre, P.; Berthe, L.; Scherpereel, X.; Fabbro, R.; Bartnicki, E. Experimental study of laser-driven shock waves in stainless steels. J. Appl. Phys. 1998, 8411, 5985–5992. [Google Scholar] [CrossRef]
  29. Johnson, J.; Rohde, R. Dynamic deformation twinning in shock-loaded iron. J. Appl. Phys. 1971, 4211, 4171–4182. [Google Scholar] [CrossRef]
  30. Zhao, Y.; Jiang, Y.-J. The effect of laser irradiation on ZnO thin films. J. Acta Phys. Sin. 2010, 59, 2679–2684. [Google Scholar] [CrossRef]
  31. Ballard, P.; Fournier, J.; Fabbro, R.; Frelat, J. Residual stresses induced by laser-shocks. J. Phys. IV 1991, 1, C3-487–C3-494. [Google Scholar] [CrossRef]
  32. Obata, M.; Sano, Y.; Mukai, N.; Yoda, M.; Shima, S.; Kanno, M. Effect of laser peening on residual stress and stress corrosion cracking for type 304 stainless steel. In Proceedings of the 7th International Conference on Shot Peening, Warsaw, Poland, 28 September−1 October 1999; pp. 387–394. [Google Scholar]
  33. Yao, Y.; Xiu, S.; Sun, C.; Kong, X.; Hong, Y. Investigation on grinding-induced dynamic recrystallization behavior of 40Cr alloy steel. J. Alloys Compd. 2021, 867, 158773. [Google Scholar] [CrossRef]
  34. Hua, Y.; Chen, R.; Yang, J.; Zhang, Y.; Yin, J. Study on experiments and mechanism of 40Cr steel surface by laser compound processing. Chin. J. Lasers 2005, 3210, 1445–1448. [Google Scholar]
  35. Frija, M.; Ayeb, M.; Seddik, R.; Fathallah, R.; Sidhom, H. Optimization of peened-surface laser shock conditions by method of finite element and technique of design of experiments. Int. J. Adv. Manuf. Technol. 2018, 971, 51–69. [Google Scholar] [CrossRef]
  36. Feng, Z. Influence of Process Parameters on Residual Stress and Parameter Optimization of High-Speed Cold Rolling; Henan University of Science and Technology: Luoyang, China, 2014. [Google Scholar]
  37. Wan, T.; Cui, C.; Peng, X. Microstructures and properties of melted layer of gray cast iron with laser shock processing. Chin. J. Rare Metals 2020, 4409, 967–973. [Google Scholar] [CrossRef]
  38. Liu, L.; Wang, J.; Zhou, J. Characterization and analysis on micro-hardness and microstructure evolution of brass subjected to laser shock peening. J. Opt. Laser Technol. 2019, 115, 325–330. [Google Scholar] [CrossRef]
  39. Jiménez, C.A.V.; Strubbia, R.; Rosas, G.G.; González, C.R.; Hereñú, S. Fatigue life rationalization of laser shock peened SAF 2205 with different swept direction. J. Opt. Laser Technol. 2019, 111, 789–796. [Google Scholar] [CrossRef]
  40. Pavan, M.; Furfari, D.; Ahmad, B.; Gharghouri, M.; Fitzpatrick, M. Fatigue crack growth in a laser shock peened residual stress field. Int. J. Fatigue 2019, 123, 157–167. [Google Scholar] [CrossRef]
  41. Dwivedi, P.K.; Vinjamuri, R.; Rai, A.K.; Ganesh, P.; Ranganathan, K.; Bindra, K.S.; Dutta, K. Effect of laser shock peening on ratcheting strain accumulation, fatigue life and bulk texture evolution in HSLA steel. Int. J. Fatigue 2022, 163, 107033. [Google Scholar] [CrossRef]
  42. Montross, C.S.; Wei, T.; Ye, L.; Clark, G.; Mai, Y.-W. Laser shock processing and its effects on microstructure and properties of metal alloys: A review. Int. J. Fatigue 2002, 24, 1021–1036. [Google Scholar] [CrossRef]
  43. Chen, C.; Bo, L.; Feng, X.; Zhang, F.; Beladi, H. Strain hardening and nanocrystallization behaviors in Hadfield steel subjected to surface severe plastic deformation. J. Mater. Sci. Eng. A 2018, 729, 178–184. [Google Scholar] [CrossRef]
  44. Wang, B.; Cheng, L.; Ding, J.; Cui, W.; Wang, C.; Li, D. Numerical simulation on laser shock peening of TC4 titanium alloy. J. Aerosp. Power 2021, 36, 959–968. [Google Scholar] [CrossRef]
  45. Luo, K.Y.; Lu, J.Z.; Zhang, Y.K.; Zhou, J.Z.; Zhang, L.; Dai, F.Z.; Zhang, L.; Zhong, J.W.; Cui, C.Y. Effects of laser shock processing on mechanical properties and micro-structure of ANSI 304 austenitic stainless steel. J. Mater. Sci. Eng. A 2011, 528, 4783–4788. [Google Scholar] [CrossRef]
  46. Schino, A.D.; Kenny, J.M. Grain size dependence of the fatigue behaviour of a ultrafine-grained AISI 304 stainless steel. J. Mater. Lett. 2003, 57, 3182–3185. [Google Scholar] [CrossRef]
Figure 1. Schematic diagram of LSP.
Coatings 12 01872 g001
Figure 2. Schematic diagram of time course of the shock wave pressure.
Coatings 12 01872 g002
Figure 3. Schematic diagram of the residual compressive stress under laser shock (a) Laser shock process (b) After the laser shock.
Coatings 12 01872 g003
Figure 4. Relationship between the peak pressure and specimen deformation.
Coatings 12 01872 g004
Figure 5. LSP simulation process.
Coatings 12 01872 g005
Figure 6. The FEM model of the single-point laser shock. (a) Numerical modal (b) Loading area.
Coatings 12 01872 g006
Figure 7. Residual stress distribution of samples with different pulse widths (a) Pulse energy 6 J: surface residual stress (b) Pulse energy 6 J: residual stress in the depth direction of the spot center (c) Pulse energy 6 J: residual stress at a depth of 0.6 mm from the spot center (d) Pulse energy 10 J: surface residual stress (e) Pulse energy 10 J: residual stress in the depth direction of the spot center (f) Pulse energy 10 J: residual stress at a depth of 0.6 mm from the spot center.
Coatings 12 01872 g007
Figure 8. Residual stress distribution of specimens with different pulse energies (a) Pulse width 20 ns: surface residual stress (b) Pulse width 20 ns: residual stress in the depth direction of the spot center (c) Pulse width 20 ns: residual stress at a depth of 0.6 mm from the spot center.
Coatings 12 01872 g008
Figure 9. Schematic diagram of the hardness testing points (a) Surface microhardness testing (b) Microhardness testing in the cross-sectional direction.
Coatings 12 01872 g009
Figure 10. Microhardness at different pulse energies (a) Surface microhardness (b) Microhardness in the cross-sectional direction.
Coatings 12 01872 g010
Figure 11. Residual stress distribution in the surface layer of the specimen at different pulse energies (a) Surface residual stress distribution (b) Depth direction residual stress distribution.
Coatings 12 01872 g011
Figure 12. Metallographic structure before and after LSP (a) Untreated (b) Energy: 10 J.
Coatings 12 01872 g012
Figure 13. SEM images of the surface layer of specimens at different pulse energies (a) 6 J; (b) 8 J; (c) 10 J; (d) 12 J.
Coatings 12 01872 g013
Figure 14. Thickness of the shock-affected layer of the specimen at different pulse energies (a) 6 J; (b) 8 J; (c) 10 J; (d) 12 J.
Coatings 12 01872 g014
Figure 15. Schematic diagram of the microstructure changes of different pulse energies.
Coatings 12 01872 g015
Table 1. Mechanical properties of 40Cr alloy steel.
QuantitySymbolValueUnit
Density ρ 7.87Kg/m3
Poisson’s ratio ν 0.277-
Young’s modulus E 211GPa
Tensile strength σ b 980MPa
Yield strength σ 0.2 750MPa
Dynamic yield strength σ d y 1570MPa
Table 2. 40Cr alloy steel J-C model parameters.
MaterialA/MPaB/MPaCnm
40Cr9052260.030.260.83
Table 3. Laser shock process parameters.
ParametersValues
Pulse energy/J6 J/8 J/10 J/12 J
Pulse width/ns20 ns
Spot diameter/mm3 mm
Wavelength/nm1064 nm
Publisher’s Note: MDPI stays neutral with regard to jurisdictional claims in published maps and institutional affiliations.

