Article

Solidification Microstructure Prediction of Ti-6Al-4V Alloy Produced by Laser Melting Deposition

1
Key Laboratory of Advanced Technologies of Materials, Ministry of Education, School of Materials Science and Engineering, Southwest Jiaotong University, Chengdu 610031, China
2
AVIC Chengdu Aircraft Industrial (Group) Co., Ltd., Chengdu 610073, China
3
Digital R&D Center of China Steel Research & Technology Group Co., Ltd., Beijing 100081, China
*
Authors to whom correspondence should be addressed.
Coatings 2022, 12(11), 1610; https://doi.org/10.3390/coatings12111610
Submission received: 21 September 2022 / Revised: 4 October 2022 / Accepted: 18 October 2022 / Published: 22 October 2022
(This article belongs to the Section Laser Coatings)

Abstract

:
The ability to achieve a predictable solidification microstructure would greatly accelerate the qualification of the additive manufacturing process. Solidification microstructure control is a challenging issue for the additive manufacturing of metallic components using the laser melting deposition (LMD) method. To obtain desirable microstructure characteristics and mechanical properties, it is essential to research the solidification mechanism of microstructures initiated during the LMD process. In this study, the grain morphology and size of an LMD-fabricated Ti-6Al-4V alloy were predicted using a three-dimensional cellular automaton (CA) model coupled with a finite element (FE) model (CA–FE). First, the temperature distribution and solidification microstructure were established with the multi-scale CA–FE model, and the simulated results were shown to be in qualitative agreement with the experimental results. Moreover, the effects of the process parameters on both the thermal characteristics and the solidification microstructure were identified, and the morphologies and sizes of prior β grains under different laser power levels and scanning speeds were compared. The average grain size of the molten pool was shown to decrease with decreasing incident energy (lower laser power/higher scanning speed), and columnar-to-equiaxed transformation could be achieved under the proper processing parameters. This work will serve as a guide for the optimization and regulation of microstructures in the LMD process.

1. Introduction

Ti-6Al-4V alloy is widely used in the aerospace, petrochemical, shipbuilding, and biomedical industries due to its corrosion resistance, low density, and high strength properties even at elevated temperatures [1,2]. The performance of Ti-6Al-4V alloy is deeply dependent on the solidification microstructure. Generally, the solidification microstructure of Ti-6Al-4V alloy produced by additive manufacturing (AM) methods differs from that of the wrought and cast alloy. It is well known that Ti-6Al-4V is a diphasic titanium alloy, and the β phase with a body-centered cubic (BCC) structure transforms into the α phase with a hexagonal close-packed (HCP) structure during solidification. For AM-produced Ti-6Al-4V alloy, prior β crystals with different sizes usually form during the solidification process. The term solidification microstructure in this article refers to the β grain size and morphology, which is controlled by the thermal conditions during solidification. The β grain size is determined by the cooling rate at the liquidus temperature (1660 °C), and the grain morphology is decided by both the thermal gradient and the cooling rate. Further more, it has been suggested that the β grain morphology and size are the dominating factors for many properties.
Consequently, thermal history and solidification behavior have a great impact on the solidification microstructure and performance of AM-produced Ti-6Al-4V alloy [3]. Therefore, it is crucial to tailor the solidification microstructure of AM-produced Ti-6Al-4V alloy and obtain desirable mechanical properties.
While it is time-consuming and expensive to investigate the influences on solidification microstructure using traditional experimental approaches, computational materials science is an effective tool for researching and optimizing material properties. Simulation is an economic and efficient method to bridge the gap between the macroscopic sample behavior and microstructure of a material. To date, many researchers have modeled and predicted microstructure evolution using simulation methods for AM-produced materials [4].
Hitherto, the most common predictive tools for simulating the β-grain evolution of AM-produced alloys have been the phase-field (PF) and cellular automata (CA) models. Over the last two decades, the CA model has generally been applied to calculate solidification and recrystallization due to its intrinsic advantages of simplicity and scalability as well as its lower calculation requirement. This model has been widely applied in the casting industry, for instance, to calculate directional solidification [5], and to compute the grain morphology of an equiaxed turbine-blade airfoil for comparison with an experimental transverse-section micrograph [6]. In the metal welding sector, the CA model has matched well with experimental results [7,8]. Similarly, it is of practical and scientific significance for predicting the solidification microstructure of AM-produced materials [9,10,11]. A. Zinoviev et al. [9] developed a two-dimensional numerical model to investigate the influence of different heat source parameters on the microstructure during the laser AM process. Yin and Felicelli [12] applied a two-dimensional CA model to simulate the dendritic growth occurring in the molten pool during the LENS production of Fe-C alloy. Zhang et al. [13] used a two-dimensional CA model to simulate the microstructure evolution and thermal history during a laser-based additive manufacturing process. The fidelity characterization of the microstructure was uncertain, although these 2D results could be transformed to 3D results through stereological interpolations [14]. Therefore, 3D prediction is necessary to obtain the true grain shapes and sizes of the microstructure. Dezfoli et al. [15], Panwisawas et al. [16], and Feiyu Xiong et al. [17] utilized a three-dimensional CA model for microstructure prediction during the AM production of Ti-6Al-4V alloys. However, some of these simulation results lacked experimental verification, while others lacked research into the process parameter variables. Currently, systematic research using simulations to predict the 3D grain structure evolution of Ti-6Al-4V alloy during the LMD process with different combinations of process parameters and experimental validation is rarely reported. It would be valuable to explore and establish a high-fidelity numerical model to tailor the microstructure and obtain desirable mechanical properties during the LMD process.
In this work, a 3D CA–FE model was proposed to study the problem described above. First, a 3D FE model was established to obtain the temperature field in a macroregion around the molten pool of a single layer during deposition. The temperature distribution was then mapped onto a microregion inside the molten pool, where the grain growth was calculated with the CA method. Moreover, a thermocouple temperature measurement was carried out during the LMD process, and the profiles and grain morphology/size of the deposition layer were observed using electron backscatter diffraction (EBSD) and an optical microscope (OM). Subsequently, the experimental and simulation results were compared and analyzed to calibrate the numerical model. Furthermore, an investigation of the effects of variations in the laser power and laser scanning speed on the grain morphology and grain size was undertaken using the verified CA–FE model to explore the relationships between the microstructural characteristics and the processing conditions. Based on this method, this work can provide a theoretical basis for optimizing the processing parameters and tailoring the microstructure in the LMD process.

2. Experiment

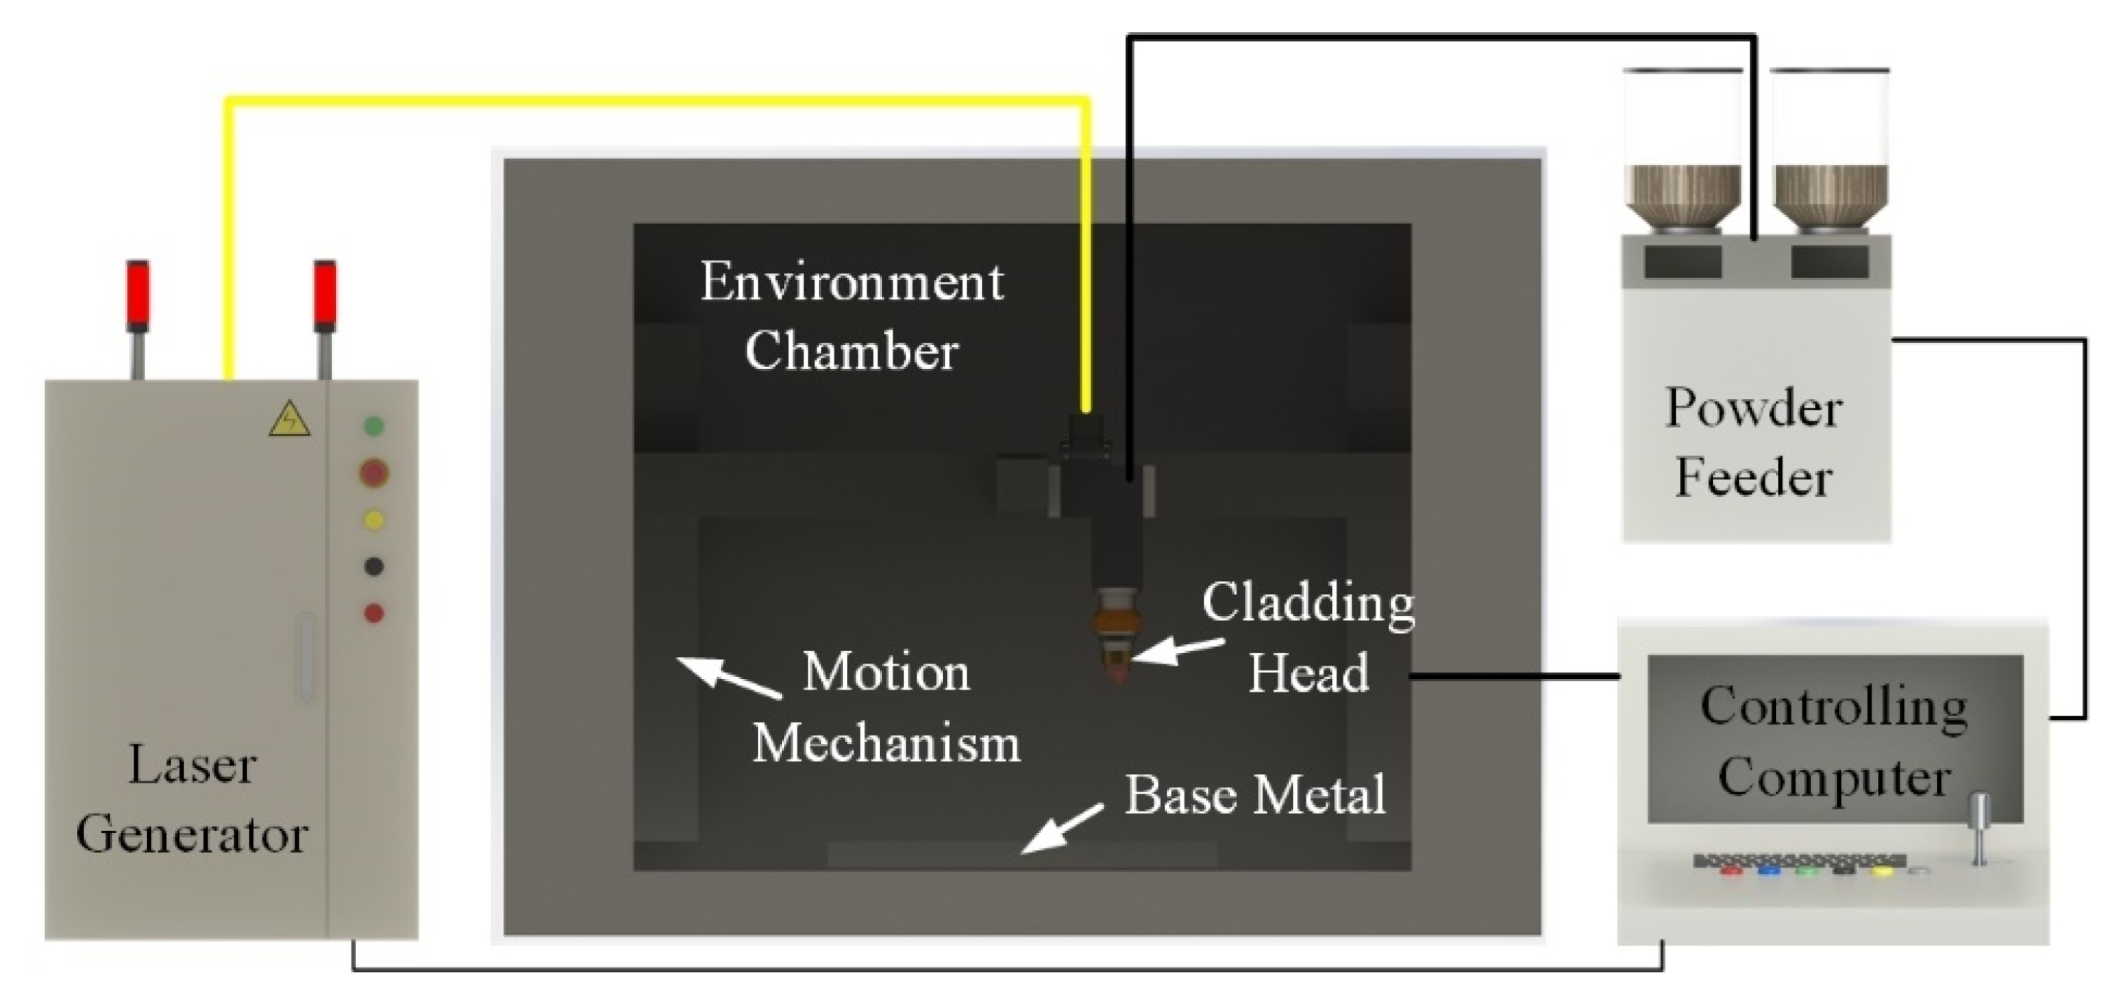
2.1. Material and Equipment

Commercial Ti-6Al-4V alloy powder (provided by Avimetal Powder Metallurgy Technology Co., Ltd., Beijing, China) with a size distribution of 53~150 μm and forged Ti-6Al-4V alloy plate were used as feedstock material and substrate, respectively. The chemical composition of the forged Ti-6Al-4V alloy substrate and powder is shown in Table 1. The powder morphology under a scanning electron microscope (ZEISS Gemini 300, Oberkochen, Germany) is shown in Figure 1. The powder had a regular spherical morphology with a small amount of satellite ball adhesion. Figure 2 shows a schematic diagram of the LMD system, which consisted of a fiber laser generator (IPG YLS-4000, IPG Photonics Corporation, Delaware, America), a robot, a double-barrel powder feeder, an enclosed chamber, and a controlling system. A shielding gas (high-purity argon) was used to protect the molten pool from nitriding and oxidation. Technical information regarding the laser generator is provided in Table 2.

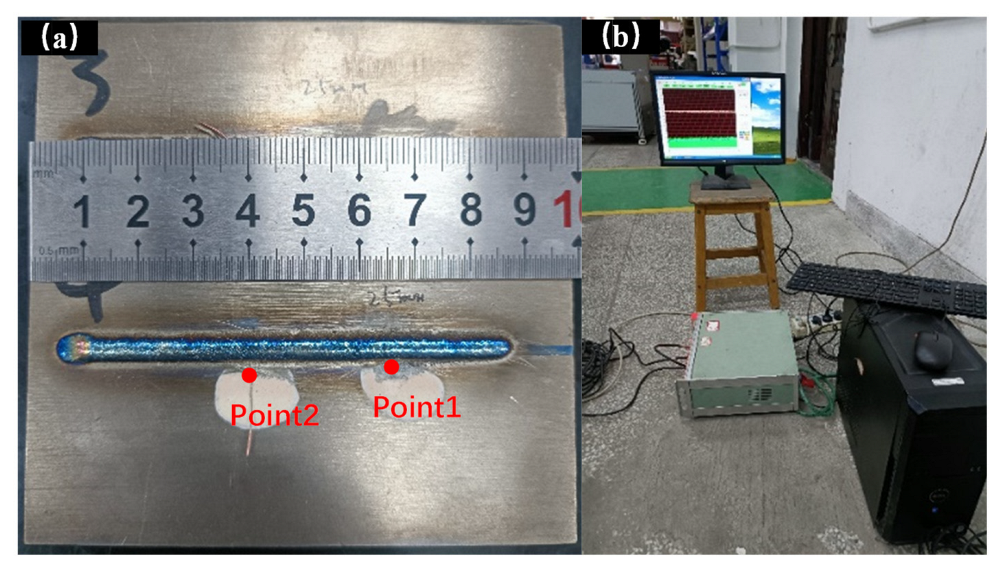
2.2. Experimental Procedures

Before the experiment, we removed the moisture from the Ti-6Al-4V alloy powder in a vacuum furnace at 100 °C for more than 1 h and the contamination and rust from the substrate surface using a grinding machine. The optimum processing parameters in this study were determined through previous single-track trials, which are also presented in Table 2. Figure 3 shows a schematic diagram of the formation process of the molten pool with the laser beam motion. The metal powder, which was ejected from the powder tube, was melted on the substrate surface under the irradiation of the laser heat source.
K-type thermocouples were used to accurately obtain the temperature at two points on the substrate near the deposition layer. The thermocouples were reinforced with high-temperature-resistant cement. The distance between the two thermocouples and the edge of the deposition layer was 2 mm and 4 mm, respectively. Meanwhile, the spacing between two thermocouples in the scanning direction was 25 mm. The layout and configuration of the thermocouples are illustrated in Figure 4, where Point1 and Point2 are the temperature points.
The metallographic specimen was prepared according to standard procedures, including electric discharge machining, mounting, and polishing. Afterwards, the transverse cross-sections of the specimen were etched with a reagent named Kroll (HF:HNO3:H2O = 1:1:18). The microstructure of the deposition layer was observed under an optical microscope (ZEISS Observer, A1m, Gottingen, Germany). In order to further analyze the microstructure, EBSD measurements were carried out using a scanning electron microscope (JEOL JSM-7800F, JEOL, Tokyo, Japan) equipped with an OXFORD NordlysMax detector under a step size of 1 μm.

3. Model Description
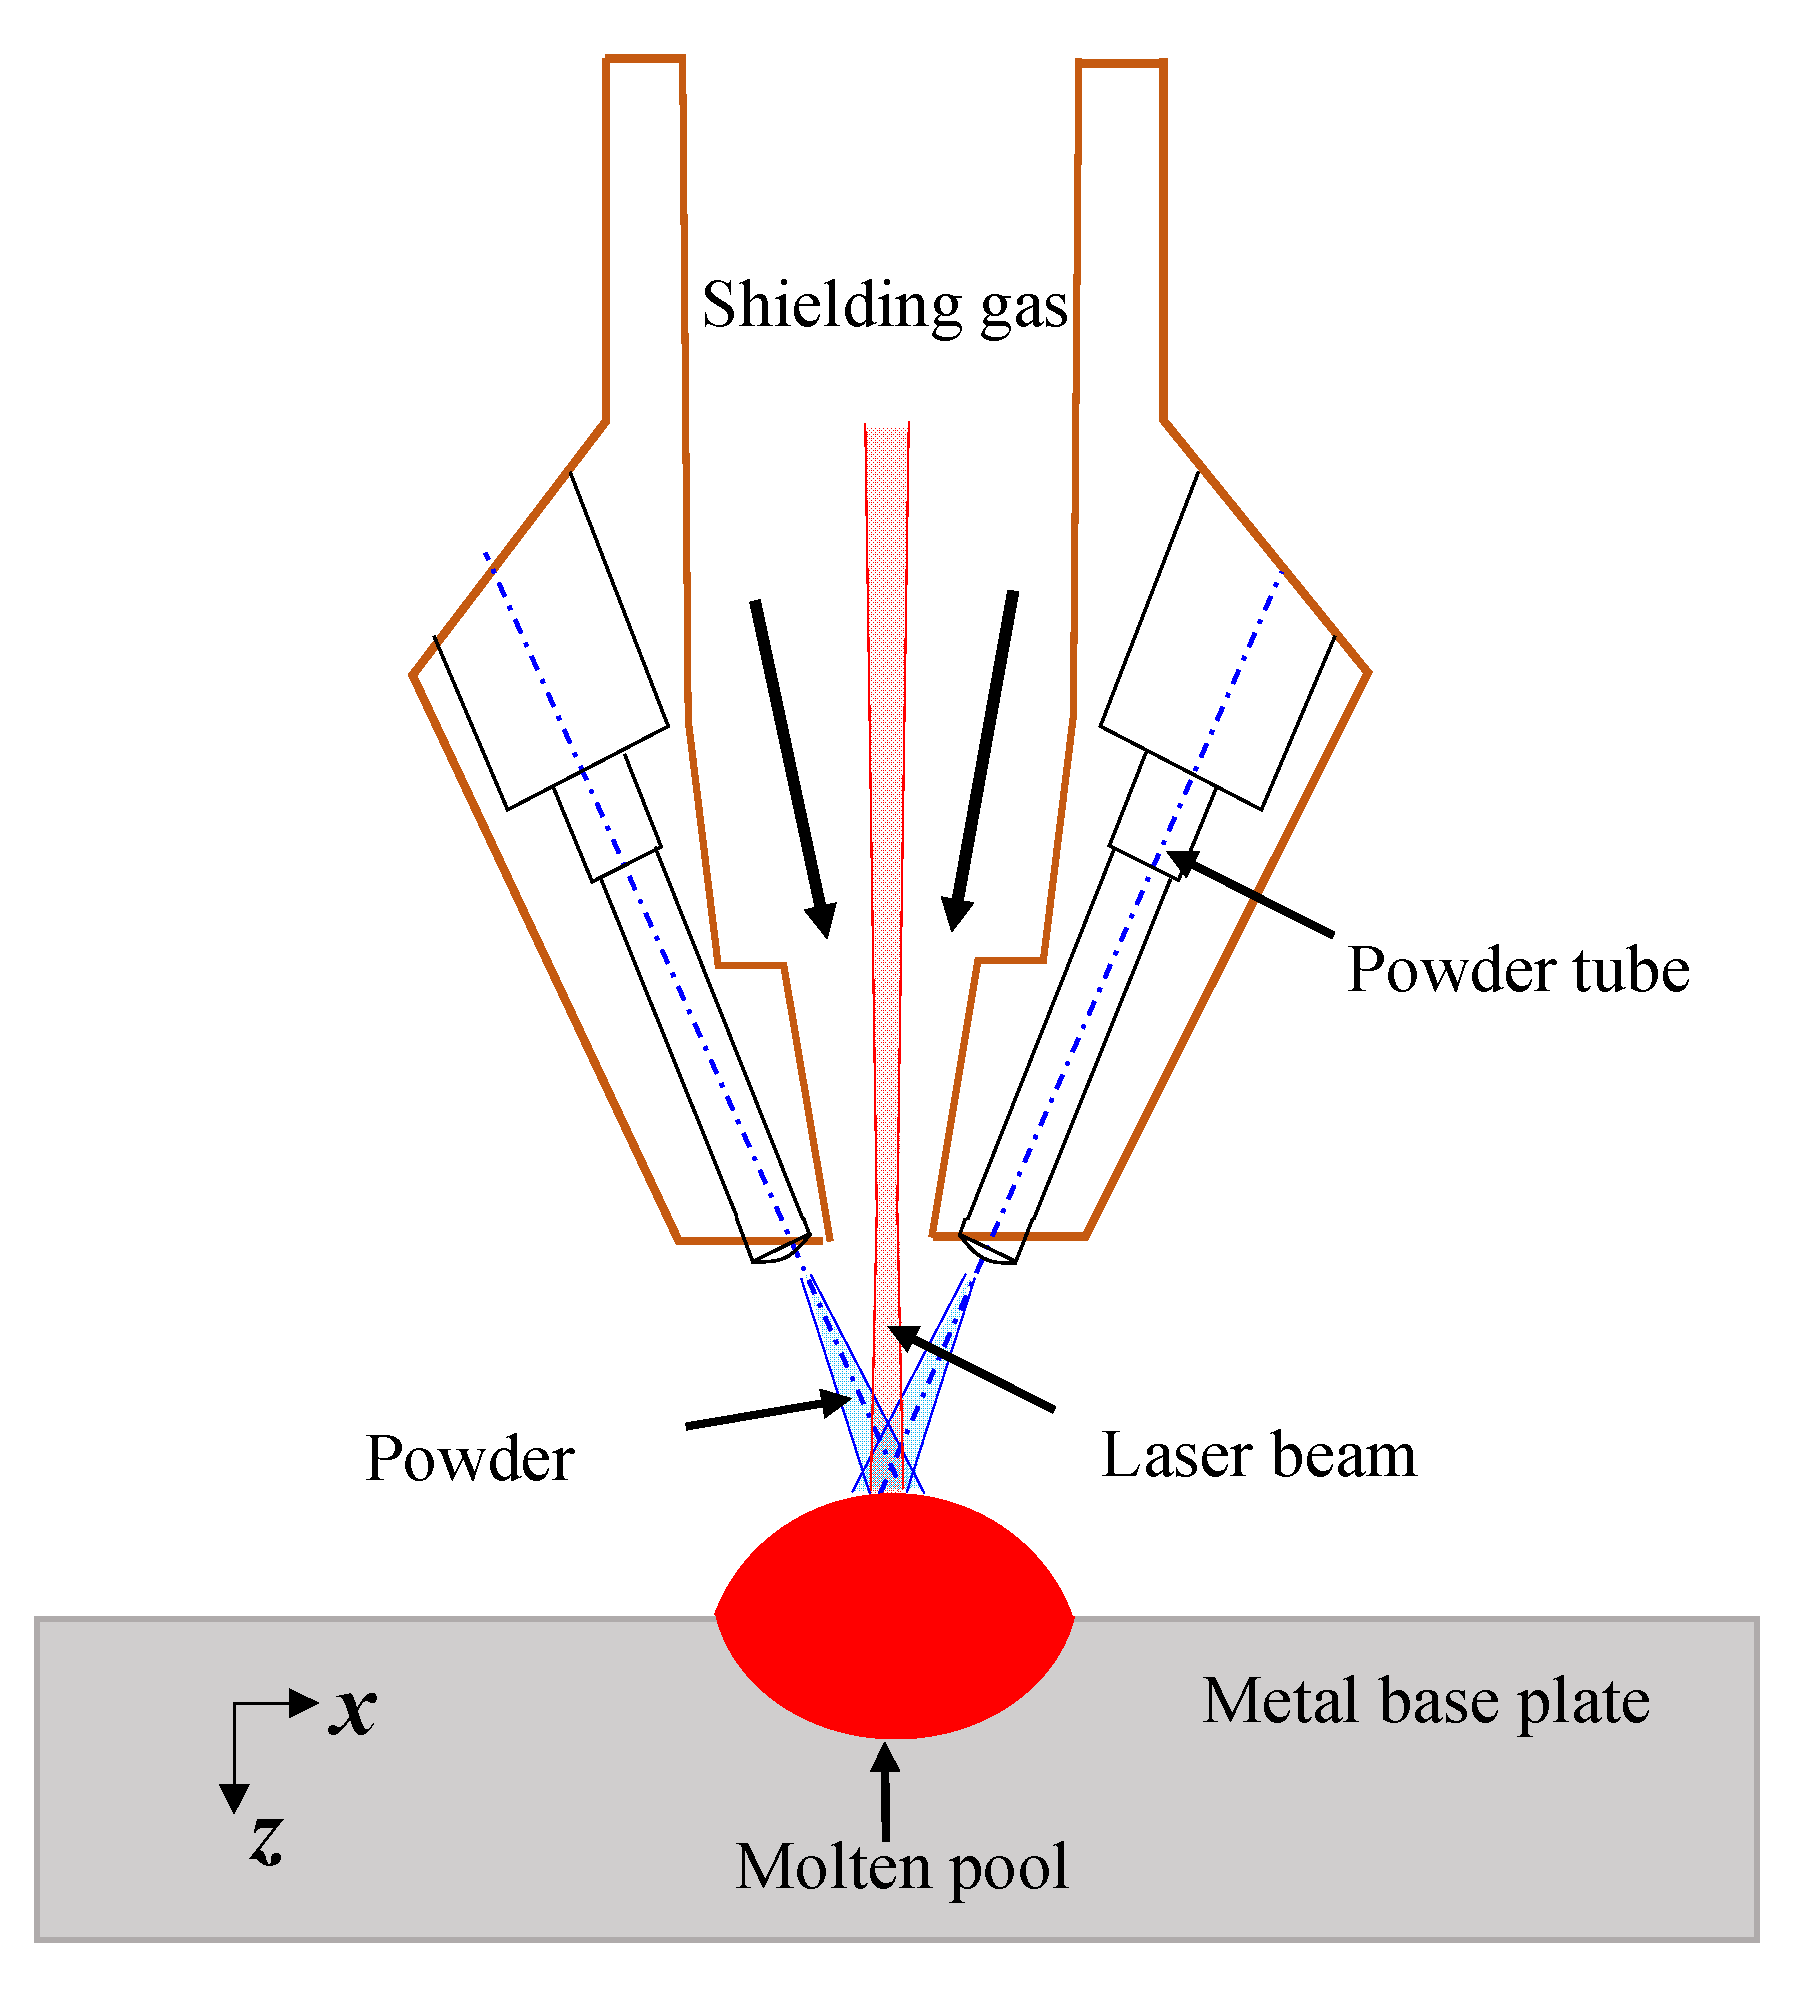
3.1. Physical Model

Figure 5 shows the 3D finite element model. The geometrical dimensions of the substrate were 120 × 120 × 10 mm3, and the length of the deposition layer was 80 mm. The quantity and quality of the mesh were optimized in order to ensure calculation accuracy and efficiency: the finite element mesh near the deposition layer was fine-meshed, whereas the mesh in other parts of the model was coarse-meshed. The thermophysical property parameters of the Ti-6Al-4V alloy are shown in Table 3.

3.2. Governing Equations and Boundary Conditions

The equation governing 3D nonlinear transient heat conduction during LMD was defined as follows:
ρ c T t = x ( k T x ) + y ( k T y ) + z ( k T z ) + Q
where ρ is the material density, k is the thermal conductivity, c is the specific heat capacity, and Q is the heat generated.
The radiation and convection boundary conditions on the surface of the laser deposition and substrate were considered as follows:
q c = h ( T T 0 )
q r = σ ε ( T 4 T 0 4 )
where q c is the convective heat transfer quantity; q r is the radiative heat transfer quantity; h is the convective heat transfer coefficient; and σ and ε are the Boltzmann’s constant and radiant coefficient, respectively. The initial temperature is considered as room temperature was T0 = 25 °C.

3.3. Heat Source Model

The net heat flux equation of the translating laser heat source was established to achieve good agreement with the molten pool [18].
The Gaussian surface heat source model and Gaussian body heat source model distribution were considered to be:
q 1 ( r , z ) = 3 f 1 Q π D 1 2 e x p ( 3 r 2 D 1 2 )
q 2 ( r , z ) = 6 f 2 Q π R 1 H ( m H + 2 D 2 ) e x p ( 3 r 2 D 2 2 ) ( m h + D 2 D 2 )
where both f1 (Gaussian area heat source) and f2 (Gaussian body heat source) are heat distribution functions, with f 1 + f 2 = 1 ; Q is the effective laser power; D1 and D2 are the effective radii; r is the distance between an arbitrary node and the center of the heat source; h is the height of the heat source; m is the linear attenuation coefficient; and H is the depth of the heat source.

3.4. Cellular Automaton Model

The cellular automaton (CA) model is an algorithm reflecting the states of a collection of cells based on transformation rules that is widely used for the recrystallization and solidification calculation of metal materials. According to the heterogeneous nucleation model with Gaussian distribution proposed by Rappaz [19,20,21], the density of grains (n) depends on the degree of undercooling ( Δ T ), which can be calculated by Equation (6):
n ( Δ T ) = 0 Δ T d n d ( Δ T ) d ( Δ T )
The grain density distribution can be expressed as Equation (7) according to the Gaussian distribution:
dn d ( Δ T ) = n max 2 π Δ T σ exp [ 1 2 ( Δ T Δ T n Δ T σ ) 2 ]
where Δ T n is the mean undercooling, Δ T σ is the standard deviation of the undercooling, and n max is the maximum grain density; these characteristic parameters can be determined experimentally for each alloy.
The total dendrite tip undercooling, ΔT, is made up of many kinds of undercooling, as shown in Equation (8) [14]:
Δ T = Δ T c + Δ T t + Δ T k + Δ T r
where Δ T c , Δ T t , Δ T k , and Δ T r are the undercooling related to solute diffusion, thermal diffusion, attachment kinetics, and solid–liquid interface curvature, respectively.
Δ T t , Δ T k , and Δ T r in Equation (8) are small for most alloys, and Δ T c is predominant. Thus, the KGT (Kunur, Giovanola, and Trivedi) model can be used for the growth kinetics of both columnar and equiaxed morphologies [17]. To simplify the calculation process of the CA model, the KGT model can be polynomial, as in Equation (9):
vT) = a2T)2 + a3T)3
Here, a2 is the 2D kinetic coefficient (m·s−1·K−3) and a3 is the 3D kinetic growth coefficient (m·s−1·K−3).

4. Results and Discussion

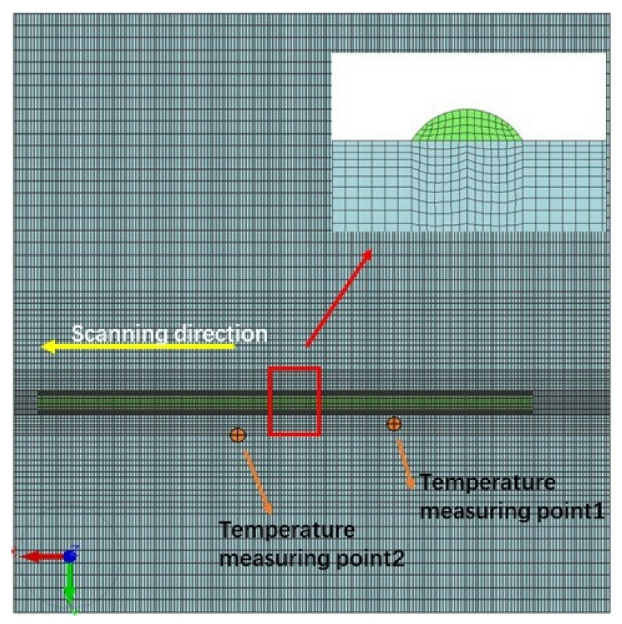
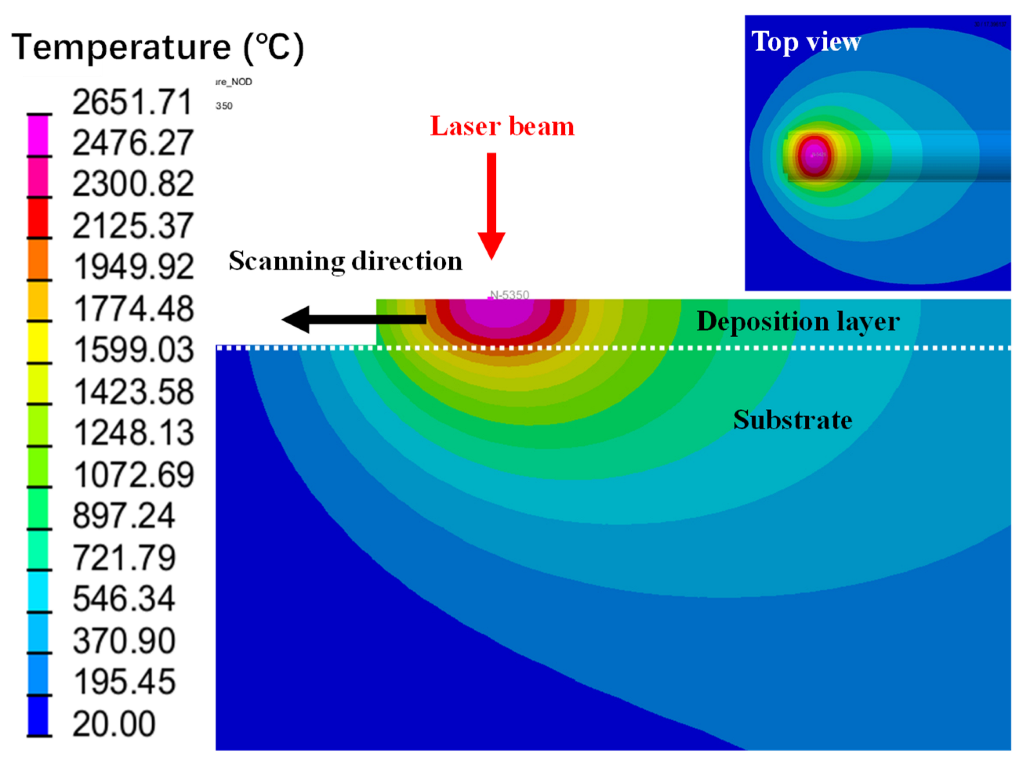
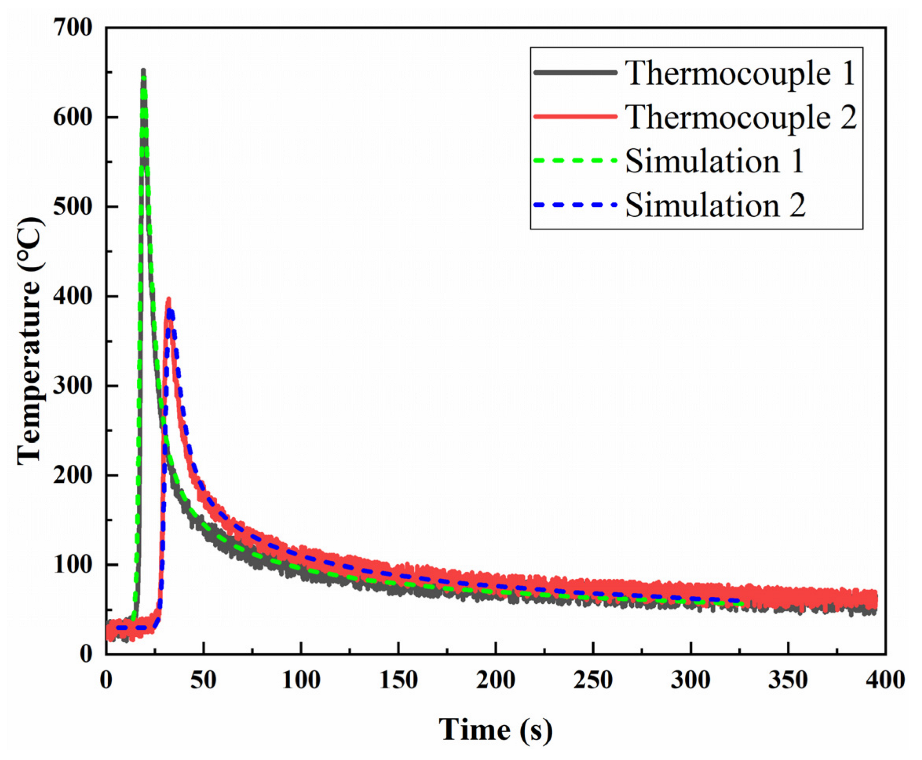
4.1. Temperature Field Analysis and Verification

Figure 6 illustrates the predicted temperature distributions for the single-track LMD. Due to the high concentration of the laser heat source, the temperature under the irradiation of the laser heat source rose sharply and then dropped sharply after laser scanning, showing the typical characteristics of rapid heating and rapid cooling. Moreover, the isotherms in front of the molten pool were much denser than those behind the molten pool, indicating that the temperature gradient changed substantially in the small area in front of the molten pool but relatively little in other areas, showing a certain tailing phenomenon.
Furthermore, the temperature field contours indicated that the molten pool was formed during laser motion, and the temperature at the center of the laser spot of the deposition layer reached 2651 °C, which far exceeded the melting point of Ti-6Al-4V alloy (1660 °C). As observed in Figure 6 and Figure 7, the temperature of the part of the substrate near the molten pool exceeded 1660 °C, which caused the substrate to partially melt. Consequently, the substrate and deposition layer achieved metallurgical bonding to obtain a higher bonding strength.
To validate the FE model, the temperature field on a longitudinal cross-section was used to provide a visual comparison with the experimental results, as shown in Figure 7. The diagram depicts the isotherms extracted for the fusion zone (FZ) boundary (dashed red line) and HAZ boundary [22] (between the dashed red line and the dashed white line). The results showed that the simulated profile of the deposition layer including the FZ boundary and the HAZ boundary was well predicted by the FE model.
The establishment of a correct temperature distribution is a prerequisite for obtaining a high-fidelity solidification microstructure. It should be noted that the cross-section shape may not be consistent throughout a whole track due to the following factors: contamination on the substrate surface, the instability of the powder flow or the argon, the adhesion of partially melted particles to the track surface, and so on. Thus, the visual comparison of the longitudinal cross-section was not sufficient to accurately verify the temperature field, and a more accurate and efficient method was required.
Two feature points were measured using K-type thermocouples. As shown in Figure 8, the measured and simulated thermal cycle curves were compared. Thermocouple 1 and Thermocouple 2 are two temperature curves determined by K-type thermocouples. The peak temperature value of Themocouple1 was 652 °C, and the peak temperature value of Thermocouple 2 was about 397 °C. The distance along the horizontal axis between the two temperature curves was about 12.5 s, which was consistent with the experiment. In Figure 8, the dashed green curve (Simulation 1) and the dashed blue curve (Simulation 2) are the two temperature curves simulated by the FE model, and they were in good agreement with the curves of Thermocouple 1 and Thermocouple 2, respectively. On the whole, the simulated and measured results presented very good agreement, which verified the accuracy and reliability of the temperature field model.

4.2. Microstructure Analysis and Verification

4.2.1. Solidification Microstructure Analysis

Based on the macroscopic temperature distribution in the molten pool, the solidification microstructure was calculated using the micro-CA model.
Figure 9 is a schematic illustration of grain growth simulated by the CA–FE model. R is the solidification rate, and V is the laser scanning speed.
R = V c o s α
where α is the angle between the solidification rate R and the laser scanning speed V. R was calculated using Equation (11).
R = V n / G
where G is the temperature gradient, and V n is the cooling rate. V n and G could be obtained by FE model calculation. Figure 10 shows cross-sectional contours of the cooling rate V n and temperature gradient G of the molten pool during the LMD process.
The thermal gradient G and solidification rate R have a significate influence on the directional growth and grain structure characteristics of the deposition layer. A columnar grain is a common microstructural characteristic in the deposition layer, as reported by many metal additive manufacturing (AM) studies [23]. Considering the G and R values at the bottom of the molten pool in the AM process, the cooling conditions are mostly located in the columnar zone of the G–R diagram, which leads to columnar grains growing upward to the center of the molten pool from the boundary [24,25,26].
Prior conditions for grain nucleation existed due to the higher value of the cooling rate V n and temperature gradient R at the bottom edge of the molten pool, as presented in Figure 10, so coarser β columnar crystals were initiated based on the epitaxial growth of the initial nucleation. Because most of the heat produced by both the laser heat source and the latent heat of crystallization was expelled through the solid, and the direction of the grain growth and negative temperature gradient presented a small angle, the growth of the columnar crystals occurred along the normal direction of the molten pool boundary; moreover, the grain growth in other directions was inhibited [27,28]. Thus, the solidified microstructure comprised columnar crystals parallel to the direction of G in the bottom of the molten pool, as presented in Figure 9 [17].
Although most of the columnar grains arose due to nucleation at the bottom of the molten pool, there was a small area of equiaxed grains at the top of the molten pool that were formed by volume nucleation, as shown in Figure 9a. With the V n and G in the molten pool reduced to small values, nucleation conditions around the molten pool were approximated, which provided the conditions for equiaxed grain growth. Therefore, many equiaxed crystals were initiated at the top of the molten pool. Although many studies have shown that near-surface fine equiaxed grains are produced by heterogeneous nucleation sites containing residual or partially melted titanium powders [26], this was not considered by the CA–FE model in this paper.

4.2.2. Solidification Microstructure Verification

Many microstructural parameters, such as the grain density parameters and the growth kinetics parameters, of Ti-6Al-4V were considered in the CA model, and the fidelity of the microstructure simulation results was sensitive to these parameters, as described in [9]. Therefore, it was necessary to calibrate these parameters to ensure the calculation accuracy of the CA model.
Figure 11 presents a comparison of the experimental and simulation results relating to the β grain morphology and size of the Ti-6Al-4V alloy. Figure 11d–f show the grain morphology and size results calculated by the CA model using optimized parameters. In the experimental results (Figure 11b), the grain morphology of the deposition layer was of a mixed columnar and equiaxed type, with fine equiaxed grains located at the near-surface region and columnar grains in the near-bottom region. The columnar grains tended to elongate at a certain angle to the scanning direction, approximately parallel to the preferential growing direction of the crystals.
In order to further observe the morphology of the grains, local EBSD scanning was carried out for the deposition layer. Figure 11a presents a β grain reconstruction diagram of the Ti-6Al-4V alloy deposition layer. Figure 11d shows the local simulated grain morphology diagram. By comparing the experimental and simulation results, it was clearly found that the experimental grain morphology was in good agreement with the CA-simulated results.
Figure 11c shows the grain size distribution in the experiment: the grain size was concentrated within 0.2 mm2, and the maximum grain size did not exceed 0.75 mm2. Figure 11f presents the statistical histogram of the simulated results, which were well matched to those of the experiment.
On the whole, the simulated and experimental results showed very good agreement. The predicted solidification morphologies agreed with the observed grain morphologies, and the same was true for the grain sizes. Consequently, the comparison results verified the reliability and accuracy of the CA–FE model.

4.3. Grain Morphologies Simulation

Variables such as laser power, laser spot size/shape, and laser scanning speed, as well as the microstructure and texture of the substrate, all have a significant effect on direct laser fabrication. However, the effects of variations in laser power and scanning speed on the grain morphology and grain size of the deposition are the most significant [3].
Therefore, the grain size and morphology of the Ti-6Al-4V alloy under different LMD laser power levels and scanning speeds were simulated using the verified CA–FE model to assess the effect of these two variables on the evolution of the microstructure.

4.3.1. Effect of Laser Power

It has been reported that the cooling rate and thermal gradient, and hence the resulting microstructure, are significantly sensitive to variations in laser power during the LMD process [24]. To investigate the effect of laser power on the grain morphology and size, we considered a laser power range of 1000–4000 W, while the laser scanning speed was held constant at 100 mm/min, and the other parameters also remained constant.
Figure 12 shows the simulated grain morphology and size at different laser power levels. The grain morphology was of a mixed columnar and equiaxed type, and the cross-section was composed of a large portion of columnar grains with a few equiaxed grains at the centerline. The evolution of these parameters is depicted in Figure 12a–d, which show that with an increase in laser power, the proportion of columnar crystals gradually increased.
Figure 12a,b show the grain morphology and size results under a laser power of P = 1000 W, with a molten area depth of 2.7 mm and a grain size concentrated in the range of 0–0.2 mm2. Figure 12c,d depict the simulated results for a laser power of 2000 W, with a molten area depth of 3.4 mm and an average grain size of about 0.1 mm2. Figure 12e,f present the results for P = 3000 W, with the melting area depth increased to 4.0 mm and the average grain size increased compared to the laser power of 2000 W. Figure 12g,h show the grain morphology and size under P = 4000 W, with a molten area depth of 4.3 mm and an obvious increase in the grain size. All these results indicated that the grain size became coarser as the laser power increased. This trend was attributed to the variation in the cooling rate, with the average cooling rate decreasing as the laser power increased; this conclusion was in agreement with the findings of [17,29].
The above results can be summarized as follows: with the increase in the laser power, the energy input per unit length increased; the grain morphology of the laser deposition layer gradually transformed from equiaxed crystals to columnar crystals; the number of equiaxed crystals decreased and the number of columnar crystals increased; the depth of the molten area gradually increased; and the dendrite width and spacing gradually increased.

4.3.2. Effect of Laser Scanning Speed

To study the effects of the laser scanning speed on the grain morphology, according to the experimental production conditions, laser scanning speeds ranging from 50 mm/min to 200 mm/min were considered, while the laser power was held constant at P = 1000 W, and the other parameters remained constant.
Figure 13a,c,e,g indicate that columnar grain crystals were the common microstructural characteristics in the deposition layer, and a change from a columnar to a mixed/equiaxed microstructure was possible with an increasing laser scanning speed.
With an increasing laser scanning speed, the energy input per unit length decreased, and the depth of the molten pool obviously decreased. Furthermore, the cooling rate of the liquid metal in the molten pool increased, resulting in higher nucleation undercooling, and the grain size decreased due to the higher cooling rate. The histograms in Figure 13b,d,f,h show that the average grain size decreased with the increase in the laser scanning speed. The morphological characteristics presented here were in qualitative agreement with the results reported in [30].
As indicated above, a lower incident energy (higher laser scanning speed) led to a transformation in the grain morphology from columnar to mixed/equiaxed, and a lower incident energy caused a higher cooling rate in the molten pool, resulting in a smaller grain size.

5. Conclusions

This work presented a multi-scale CA–FE model to simulate the grain morphology and size during the solidification of Ti-6Al-4V alloy in the molten pool within the LMD process. The results from experiments and numerical simulations were compared to draw the following conclusions:
(1)
Both the thermal cycles and transverse cross-sections of the molten pool simulated by the FE model were in good agreement with the experimental results.
(2)
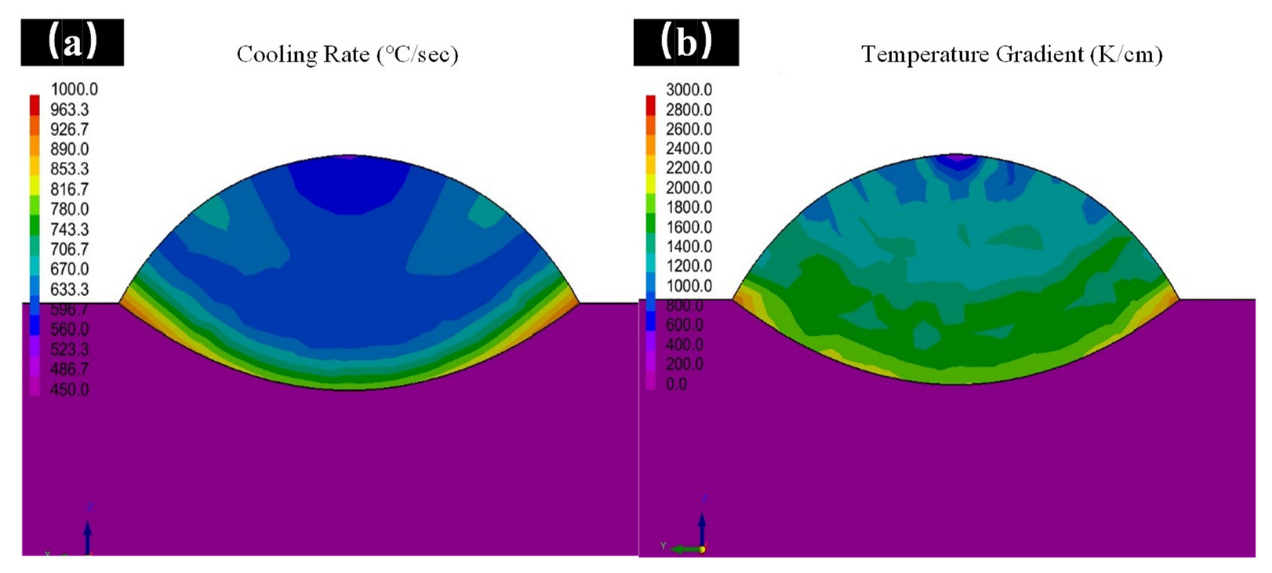
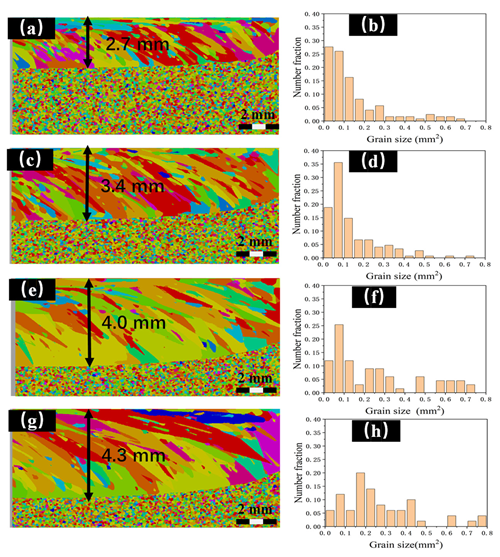
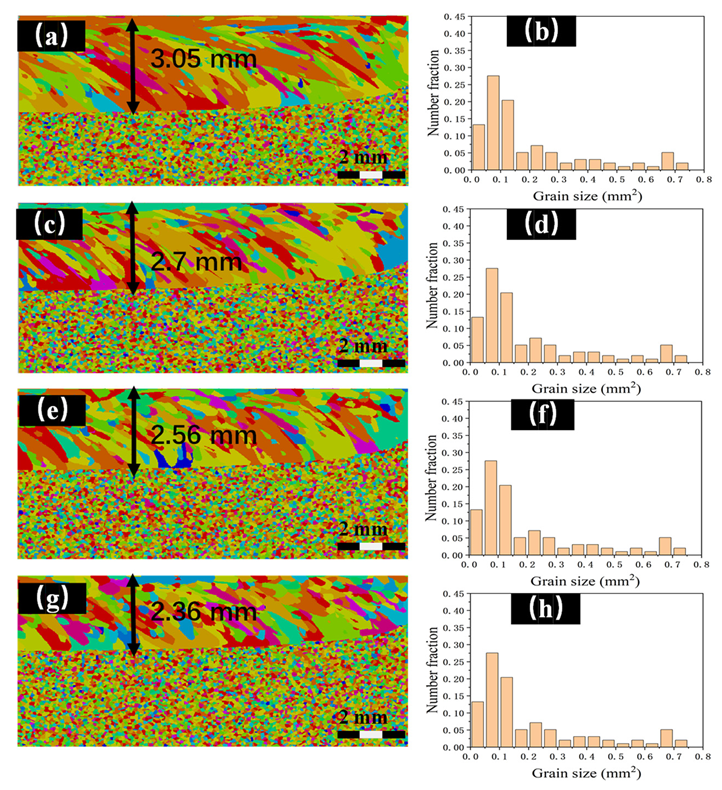
The results suggested that the grain size of the LMD-produced Ti-6Al-4V alloy was strongly affected by the incident energy. A high incident energy (higher laser power/lower laser scanning speed) resulted in a lower cooling rate and a larger grain size. Conversely, a low incident energy effectively refined the microstructure.
(3)
The columnar-to-equiaxed transformation (CET) was achieved by reducing the laser incident energy.
(4)
The cellular automata model coupled with the finite element model (CA–FE) was an effective approach for studying the evolution of the solidification microstructure during the LMD process.

Author Contributions

Funding acquisition, H.C.; investigation, J.L. and Z.Z.; methodology, J.L., Z.Z. and H.C.; project administration, Z.Z., Y.L. and H.C.; resources, R.H., H.C., Y.C. and J.S.; software, D.H.; validation, S.X.; writing—original draft, J.L.; writing—review and editing, J.L., H.L., Z.Z. and Y.L. All authors have read and agreed to the published version of the manuscript.

Funding

This research was funded by the National Natural Science Foundation of China (52205419) and Sichuan Science and Technology Program (2021YJ0004 and 2022YFG0101).

Institutional Review Board Statement

Not applicable.

Informed Consent Statement

Not applicable.

Data Availability Statement

The raw/processed data required to reproduce these findings are available from the corresponding author upon reasonable request.

Acknowledgments

The authors would like to thank Shiyanjia Lab (www.shiyanjia.com accessed on 31 August 2021) for the EBSD measurements.

Conflicts of Interest

The authors declare no conflict of interest.

References

  1. Weng, F.; Chen, C.; Yu, H. Research status of laser cladding on titanium and its alloys: A review. Mater. Des. 2014, 58, 412–425. [Google Scholar] [CrossRef]
  2. Napoli, G.; Paura, M.; Vela, T.; di Schino, A. Colouring titanium alloys by anodic oxidation. Metalurgija 2018, 57, 111–113. [Google Scholar]
  3. Kobryn, P.A.; Semiatin, S.L. Microstructure and texture evolution during solidification processing of Ti-6Al-4V. J. Mater. Processing Technol. 2003, 135, 330–339. [Google Scholar] [CrossRef]
  4. Zinovieva, O.; Zinoviev, A.; Ploshikhin, V. Three-dimensional modeling of the microstructure evolution during metal additive manufacturing. Comput. Mater. Sci. 2018, 141, 207–220. [Google Scholar] [CrossRef]
  5. Gandin, C.A.; Desbiolles, J.L.; Rappaz, M.; Thevoz, P. A three-dimensional cellular automaton-finite element model for the prediction of solidification grain structures. Metall. Mater. Trans. A 1999, 30, 3153–3165. [Google Scholar] [CrossRef]
  6. Gandin, C.A.; Rappaz, M.; Tintillier, R. 3-Dimensional simulation of the grain formation in investment castings. Metall. Mater. Trans. A 1994, 25, 629–635. [Google Scholar] [CrossRef] [Green Version]
  7. Saluja, R.S.; Narayanan, R.G.; Das, S. Cellular automata finite element (CAFE) model to predict the forming of friction stir welded blanks. Comput. Mater. Sci. 2012, 58, 87–100. [Google Scholar] [CrossRef]
  8. Shojaeefard, M.H.; Akbari, M.; Khalkhali, A.; Asadi, P.; Parivar, A.H. Optimization of microstructural and mechanical properties of friction stir welding using the cellular automaton and Taguchi method. Mater. Des. 2014, 64, 660–666. [Google Scholar] [CrossRef]
  9. Zinoviev, A.; Zinovieva, O.; Ploshikhin, V.; Romanova, V.; Balokhonov, R. Evolution of grain structure during laser additive manufacturing. Simulation by a cellular automata method. Mater. Des. 2016, 106, 321–329. [Google Scholar] [CrossRef]
  10. Li, X.; Tan, W. Numerical investigation of effects of nucleation mechanisms on grain structure in metal additive manufacturing. Comput. Mater. Sci. 2018, 153, 159–169. [Google Scholar] [CrossRef]
  11. Koepf, J.A.; Gotterbarm, M.R.; Markl, M.; Körner, C. 3D multi-layer grain structure simulation of powder bed fusion additive manufacturing. Acta Mater. 2018, 152, 119–126. [Google Scholar] [CrossRef]
  12. Yin, H.; Felicelli, S.D. Dendrite growth simulation during solidification in the LENS process. Acta Mater. 2010, 58, 1455–1465. [Google Scholar] [CrossRef]
  13. Zhang, J.; Liou, F.; Seufzer, W.; Taminger, K. A coupled finite element cellular automaton model to predict thermal history and grain morphology of Ti-6Al-4V during direct metal deposition (DMD). Addit. Manuf. 2016, 11, 32–39. [Google Scholar] [CrossRef]
  14. Lian, Y.; Gan, Z.; Yu, C.; Kats, D.; Liu, W.K.; Wagner, G.J. A cellular automaton finite volume method for microstructure evolution during additive manufacturing. Mater. Des. 2019, 169, 107672. [Google Scholar] [CrossRef]
  15. Dezfoli, A.R.A.; Hwang, W.; Huang, W.; Tsai, T. Determination and controlling of grain structure of metals after laser incidence: Theoretical approach. Sci. Rep. 2017, 7, 41527. [Google Scholar] [CrossRef] [Green Version]
  16. Panwisawas, C.; Qiu, C.; Anderson, M.J.; Sovani, Y.; Turner, R.P.; Attallah, M.M.; Brooks, J.W.; Basoalto, H.C. Mesoscale modelling of selective laser melting: Thermal fluid dynamics and microstructural evolution. Comput. Mater. Sci. 2017, 126, 479–490. [Google Scholar] [CrossRef]
  17. Xiong, F.; Huang, C.; Kafka, O.L.; Lian, Y.; Yan, W.; Chen, M.; Fang, D. Grain growth prediction in selective electron beam melting of Ti-6Al-4V with a cellular automaton method. Mater. Des. 2021, 199, 109410. [Google Scholar] [CrossRef]
  18. Chew, Y.; Pang, J.H.L.; Bi, G.; Song, B. Thermo-mechanical model for simulating laser cladding induced residual stresses with single and multiple clad beads. J. Mater. Processing Technol. 2015, 224, 89–101. [Google Scholar] [CrossRef]
  19. Yang, J.; Yu, H.; Yang, H.; Li, F.; Wang, Z.; Zeng, X. Prediction of microstructure in selective laser melted Ti 6Al 4V alloy by cellular automaton. J. Alloys Compd. 2018, 748, 281–290. [Google Scholar] [CrossRef]
  20. Jin, Y.Z.; Song, Y.L.; Liu, Y.H.; Sun, C.; Liu, H.F.; Liu, J. Effect of Rare Earth Refinement on the Microstructure Simulation of an AlSi7Cu3Mg Alloy Based on the Cellular Automata Method. Strength Mater 2021, 53, 73–82. [Google Scholar] [CrossRef]
  21. Thévoz, P.; Desbiolles, J.L.; Rappaz, M. Modeling of equiaxed microstructure formation in casting. Metall. Trans. A 1989, 20, 311–322. [Google Scholar] [CrossRef]
  22. Liu, S.; Hong, K.; Katinas, C.; Shin, Y.C. Multiphysics modeling of phase transformation and microhardness evolution in laser direct deposited Ti6Al4V. J. Manuf. Processes 2019, 45, 579–587. [Google Scholar] [CrossRef]
  23. Li, J.; Zhou, X.; Brochu, M.; Provatas, N.; Zhao, Y.F. Solidification microstructure simulation of Ti-6Al-4V in metal additive manufacturing: A review. Addit. Manuf. 2020, 31, 100989. [Google Scholar] [CrossRef]
  24. Bontha, S.; Klingbeil, N.W.; Kobryn, P.A.; Fraser, H.L. Thermal process maps for predicting solidification microstructure in laser fabrication of thin-wall structures. J. Mater. Processing Technol. 2006, 178, 135–142. [Google Scholar] [CrossRef]
  25. Gäumann, M.; Henry, S.; Cléton, F.; Wagnière, J.D.; Kurz, W. Epitaxial laser metal forming: Analysis of microstructure formation. Mater. Sci. Eng. A 1999, 271, 232–241. [Google Scholar] [CrossRef]
  26. Wang, T.; Zhu, Y.Y.; Zhang, S.Q.; Tang, H.B.; Wang, H.M. Grain morphology evolution behavior of titanium alloy components during laser melting deposition additive manufacturing. J. Alloys Compd. 2015, 632, 505–513. [Google Scholar] [CrossRef]
  27. Zhan, X.; Lin, X.; Gao, Z.; Qi, C.; Zhou, J.; Gu, D. Modeling and simulation of the columnar-to-equiaxed transition during laser melting deposition of Invar alloy. J. Alloys Compd. 2018, 755, 123–134. [Google Scholar] [CrossRef]
  28. Tian, F.; Li, Z.; Song, J. Solidification of laser deposition shaping for TC4 alloy based on cellular automation. J. Alloys Compd. 2016, 676, 542–550. [Google Scholar] [CrossRef]
  29. Ma, P.; Wu, Y.; Zhang, P.; Chen, J. Solidification prediction of laser cladding 316L by the finite element simulation. Int. J. Adv. Manuf. Technol. 2019, 103, 957–969. [Google Scholar] [CrossRef]
  30. Ao, X.; Xia, H.; Liu, J.; He, Q. Simulations of microstructure coupling with moving molten pool by selective laser melting using a cellular automaton. Mater. Des. 2020, 185, 108230. [Google Scholar] [CrossRef]
Figure 1. Morphology of the Ti-6Al-4V alloy powder under SEM.
Coatings 12 01610 g001
Figure 2. Schematic diagram of laser melting deposition (LMD) system.
Coatings 12 01610 g002
Figure 3. Schematic diagram of molten pool formation.
Coatings 12 01610 g003
Figure 4. Thermocouple experiment equipment: (a) layout of the thermocouples; (b) image of the testing equipment.
Coatings 12 01610 g004
Figure 5. 3D physical model (top view).
Coatings 12 01610 g005
Figure 6. Transverse section and top view of temperature distributions for single-track LMD.
Coatings 12 01610 g006
Figure 7. Comparison diagram of simulated and experimental profile results of deposition layer.
Coatings 12 01610 g007
Figure 8. Comparison between simulated and experimental thermal cycle curves.
Coatings 12 01610 g008
Figure 9. Schematic illustration of grain growth: (a) longitudinal cross-section; (b) transverse cross-section.
Coatings 12 01610 g009
Figure 10. (a) Cross-sectional contours of cooling rate V n   ; (b) cross-sectional contours of temperature gradient G .
Coatings 12 01610 g010
Figure 11. Transverse cross-section of solidification microstructure during single-track deposition: (a) EBSD prior β phase reconstruction diagram; (b) experimental grain morphology; (c) experimental grain size distribution; (d) local simulated grain morphology; (e) simulated grain morphology; (f) simulated grain size distribution.
Coatings 12 01610 g011
Figure 12. Grain morphologies and sizes at different laser power levels: (a,b) P = 1000 W; (c,d) P = 2000 W; (e,f) P = 3000 W; (g,h) P = 4000 W.
Coatings 12 01610 g012
Figure 13. Grain morphology and size at different laser scanning speeds: (a,b) V = 50 mm/min; (c,d) P = 100 mm/min; (e,f) P = 150 mm/min; (g,h) P = 200 mm/min.
Coatings 12 01610 g013
Table 1. Chemical composition of Ti-6Al-4V alloy powder and plate (wt.%).
MaterialAlVFeCNHOTi
Powder6.113.970.300.0050.0060.00280.062Bal.
Substrate5.6~6.53.5~4.50.30.080.050.0150.2Bal.
Table 2. Technical information pertaining to laser generator and optimum processing parameters for LMD process.
ItemValue
Laser generator manufacturerRaycus (China, Wuhan)
Laser wavelength1064 nm
Spot diameter3 mm
Maximum output power6000 W
Laser power1200 W
Scanning speed120 mm/min
Shielding gas flow40 L/min
Powder feeding rate8.1 g/min
Table 3. Thermophysical properties of Ti-6Al-4V alloy.
Temperature
(°C)
Thermal Conductivity
(W/m·K)
Specific Heat Capacity
(J/kg·K)
Density
(kg/m3)
207.05404420
1007.455504406
2008.755754395
40011.356254366
80017.87004309
100019.37604283
120022.98004252
150025.88754205
170034.69303886
Publisher’s Note: MDPI stays neutral with regard to jurisdictional claims in published maps and institutional affiliations.

