Article

Bone Density around Titanium Dental Implants Coating Tested/Coated with Chitosan or Melatonin: An Evaluation via Microtomography in Jaws of Beagle Dogs

by
Nansi López-Valverde
1,
Antonio López-Valverde
1,*,
Juan Manuel Aragoneses
2,
Francisco Martínez-Martínez
3,
María C. González-Escudero
4 and
Juan Manuel Ramírez
5
1
Department of Surgery, Instituto de Investigación Biomédica de Salamanca (IBSAL), University of Salamanca, 37007 Salamanca, Spain
2
Dean of The Faculty of Dentistry, Universidad Alfonso X El Sabio, 28691 Madrid, Spain
3
Orthopaedic and Trauma Service, Virgen de la Arrixaca University Hospital, El Palmar, 30120 Murcia, Spain
4
Faculty of Health Sciences, Universidad Católica San Antonio de Murcia (UCAM), 30107 Murcia, Spain
5
Department of Morphological Sciences, University of Cordoba, Avenida Menéndez Pidal s/n, 14071, 14004 Cordoba, Spain
*
Author to whom correspondence should be addressed.
Coatings 2021, 11(7), 777; https://doi.org/10.3390/coatings11070777
Submission received: 5 June 2021 / Revised: 20 June 2021 / Accepted: 28 June 2021 / Published: 29 June 2021
(This article belongs to the Special Issue Bioactive Coatings for Implantable Devices)

Abstract

:
Peri-implant bone density plays an important role in the osseointegration of dental implants. The aim of the study was to evaluate via micro-CT, in Hounsfield units, the bone density around dental implants coated with chitosan and melatonin and to compare it with the bone density around implants with a conventional etched surface after 12 weeks of immediate post-extraction placement in the jaws of Beagle dogs. Six dogs were used, and 48 implants were randomly placed: three groups—melatonin, chitosan, and control. Seven 10 mm × 10 mm regions of interest were defined in each implant (2 in the crestal zone, 4 in the medial zone, and 1 in the apical zone). A total of 336 sites were studied with the AMIDE tool, using the Norton and Gamble classification to assess bone density. The effect on bone density of surface coating variables (chitosan, melatonin, and control) at the crestal, medial, and apical sites and the implant positions (P2, P3, P4, and M1) was analyzed at bivariate and multivariate levels (linear regression). Adjusted effects on bone density did not indicate statistical significance for surface coatings (p = 0.653) but did for different levels of ROIs (p < 0.001) and for positions of the implants (p = 0.032). Micro-CT, with appropriate software, proved to be a powerful tool for measuring osseointegration.

1. Introduction

Due to its excellent mechanical and biological properties, pure titanium (Ti) and different alloys have been widely used in the fields of orthopedics and dentistry. The use of Ti dental implants has revolutionized the field of dentistry, with implant treatments being performed all over the world, with exponential growth over the years [1,2].
Current dental implant surfaces (SLA, sandblasted, large-grain, acid-etched) require periods of 3 to 6 months to achieve adequate osseointegration [3]. On the other hand, such surfaces are prone to certain bacterial infections, and it is not known whether this propensity is due to the dubious antibacterial properties of Ti, or to the compromised defenses of a certain type of host [4]. For all these reasons, the surfaces of Ti implants are under constant study and evolution, with the aim of shortening waiting times and ensuring osseointegration.
Chitosan (Ch) is a cationic polysaccharide derived from chitin, composed of N-acetylglucosamine and D-glucosamine [5]. It is a biopolymer with interesting properties such as biodegradability, biocompatibility, nontoxicity, and low allergenicity, which, together with other antimicrobial and antifungal properties, make Ch one of the most widely used polymers in the study of antimicrobial chemotherapies in therapeutic development [6,7,8,9]. Its favorable biological properties, together with its availability and variety of forms, have made it a good candidate for medical applications, such as periodontal and bone regeneration [10]. Several studies have demonstrated its usefulness as an osteoconductor and for enhancing bone formation, both in vitro and in vivo [11,12,13,14], as well as an inducer of apatite and calcium/phosphorus ion deposition, with active biomineralization properties, and its broad potential as a bone regenerator has been demonstrated [15,16,17,18]. In vitro and in vivo studies have shown that chitosan stimulates polymorphonuclear and progenitor cell migration, enhancing angiogenesis and extracellular matrix reformation, resulting in accelerated wound healing [19].
Melatonin (Mt, N-acetyl 5-methoxytryptamine), derived from tryptophan, is a hormone synthesized and produced mainly in the pineal gland in a circadian manner [20], with outstanding importance in angiogenesis, bone formation, and remodeling, due to its antioxidant and anti-inflammatory effects and its extraordinary capacity to destroy reactive oxygen species [21,22], the benefits of its application being known as a coating of dental implants to improve their osseointegration [23,24,25].
In 1972, Godfrey Hounsfield communicated to the scientific community an imaging technique called transverse computed axial tomography. Currently, CT is the only diagnostically justifiable imaging technique that allows approximate conclusions about the structure and density of the maxillary bones and is considered an excellent tool for assessing the distribution of compact and cancellous bone. Bone density (BD) can be assessed using Hounsfield units (HU), which are directly related to tissue attenuation coefficients. The Hounsfield scale is based on density values for air, water, and dense bone, which are arbitrarily assigned values of −1000, 0, and +1000, respectively [26].
X-ray microtomography (micro-CT) is a conservative technique used in the evaluation of bone morphometry, and several studies have demonstrated its usefulness in the quantification of bone tissue [27,28,29,30]. Micro-CT systems developed in the early 1980s have a high spatial resolution, producing voxels approximately 1,000,000 times smaller in volume than CT voxels [31], making it possible to measure trabecular and cortical bone and provide a spatial representation of bone structure in the peri-implant region while assessing the qualitative and quantitative morphometry of the bone integration of dental implants, having become one of the most widely used anatomical imaging modalities for both research and clinical purposes [32,33].
The purpose of this study was to evaluate and compare, via micro-CT, the BD around Ti dental implants coated with Ch and Mt, with implants with the SLA-type conventional etched surface (Bioetch®, Bioner, Spain), after 12 weeks of immediate post-extraction placement, in the jaws of Beagle dogs.

2. Materials and Methods

2.1. Study Design

Six Beagle breed dogs, aged approximately 5 years and weighing between 15 and 16 kg, were used, following the 3R principle in animal experimentation (replacement, reduction, and refinement). A total of 48 implants were inserted, 4 implants in each hemiarch, and randomly divided into three groups: melatonin test group (MtG), chitosan test group (ChG), and control group (CG). It has been approved by the Ethics Committee of the Catholic University of Murcia (Spain), study protocol, date 24 July 2020, code CE072004. All dogs were in good health prior to the start of the study.

2.2. Implant Surface Preparation

The manufacturer packaged the melatonin test group (MtG) implants immersed in 5% Mt-containing saline (TM-M5250 Sigma-Aldrich®, St. Louis, MO, USA), according to Salomó-Coll et al. [34], and Ch group (ChG) implants immersed in a film-forming solution according to the procedure described by Zhang et al. with slight modifications [35]. Ch (1.6 g) and glycerol (0.4 g) were dispersed in 80 mL of an acetic acid solution (1% w/v), shaking for at least 12 h (4 °C). Similarly to the control group (CG) implants, they were sterilized by gamma irradiation. The control group implants (CG) did not receive any type of surface coating.

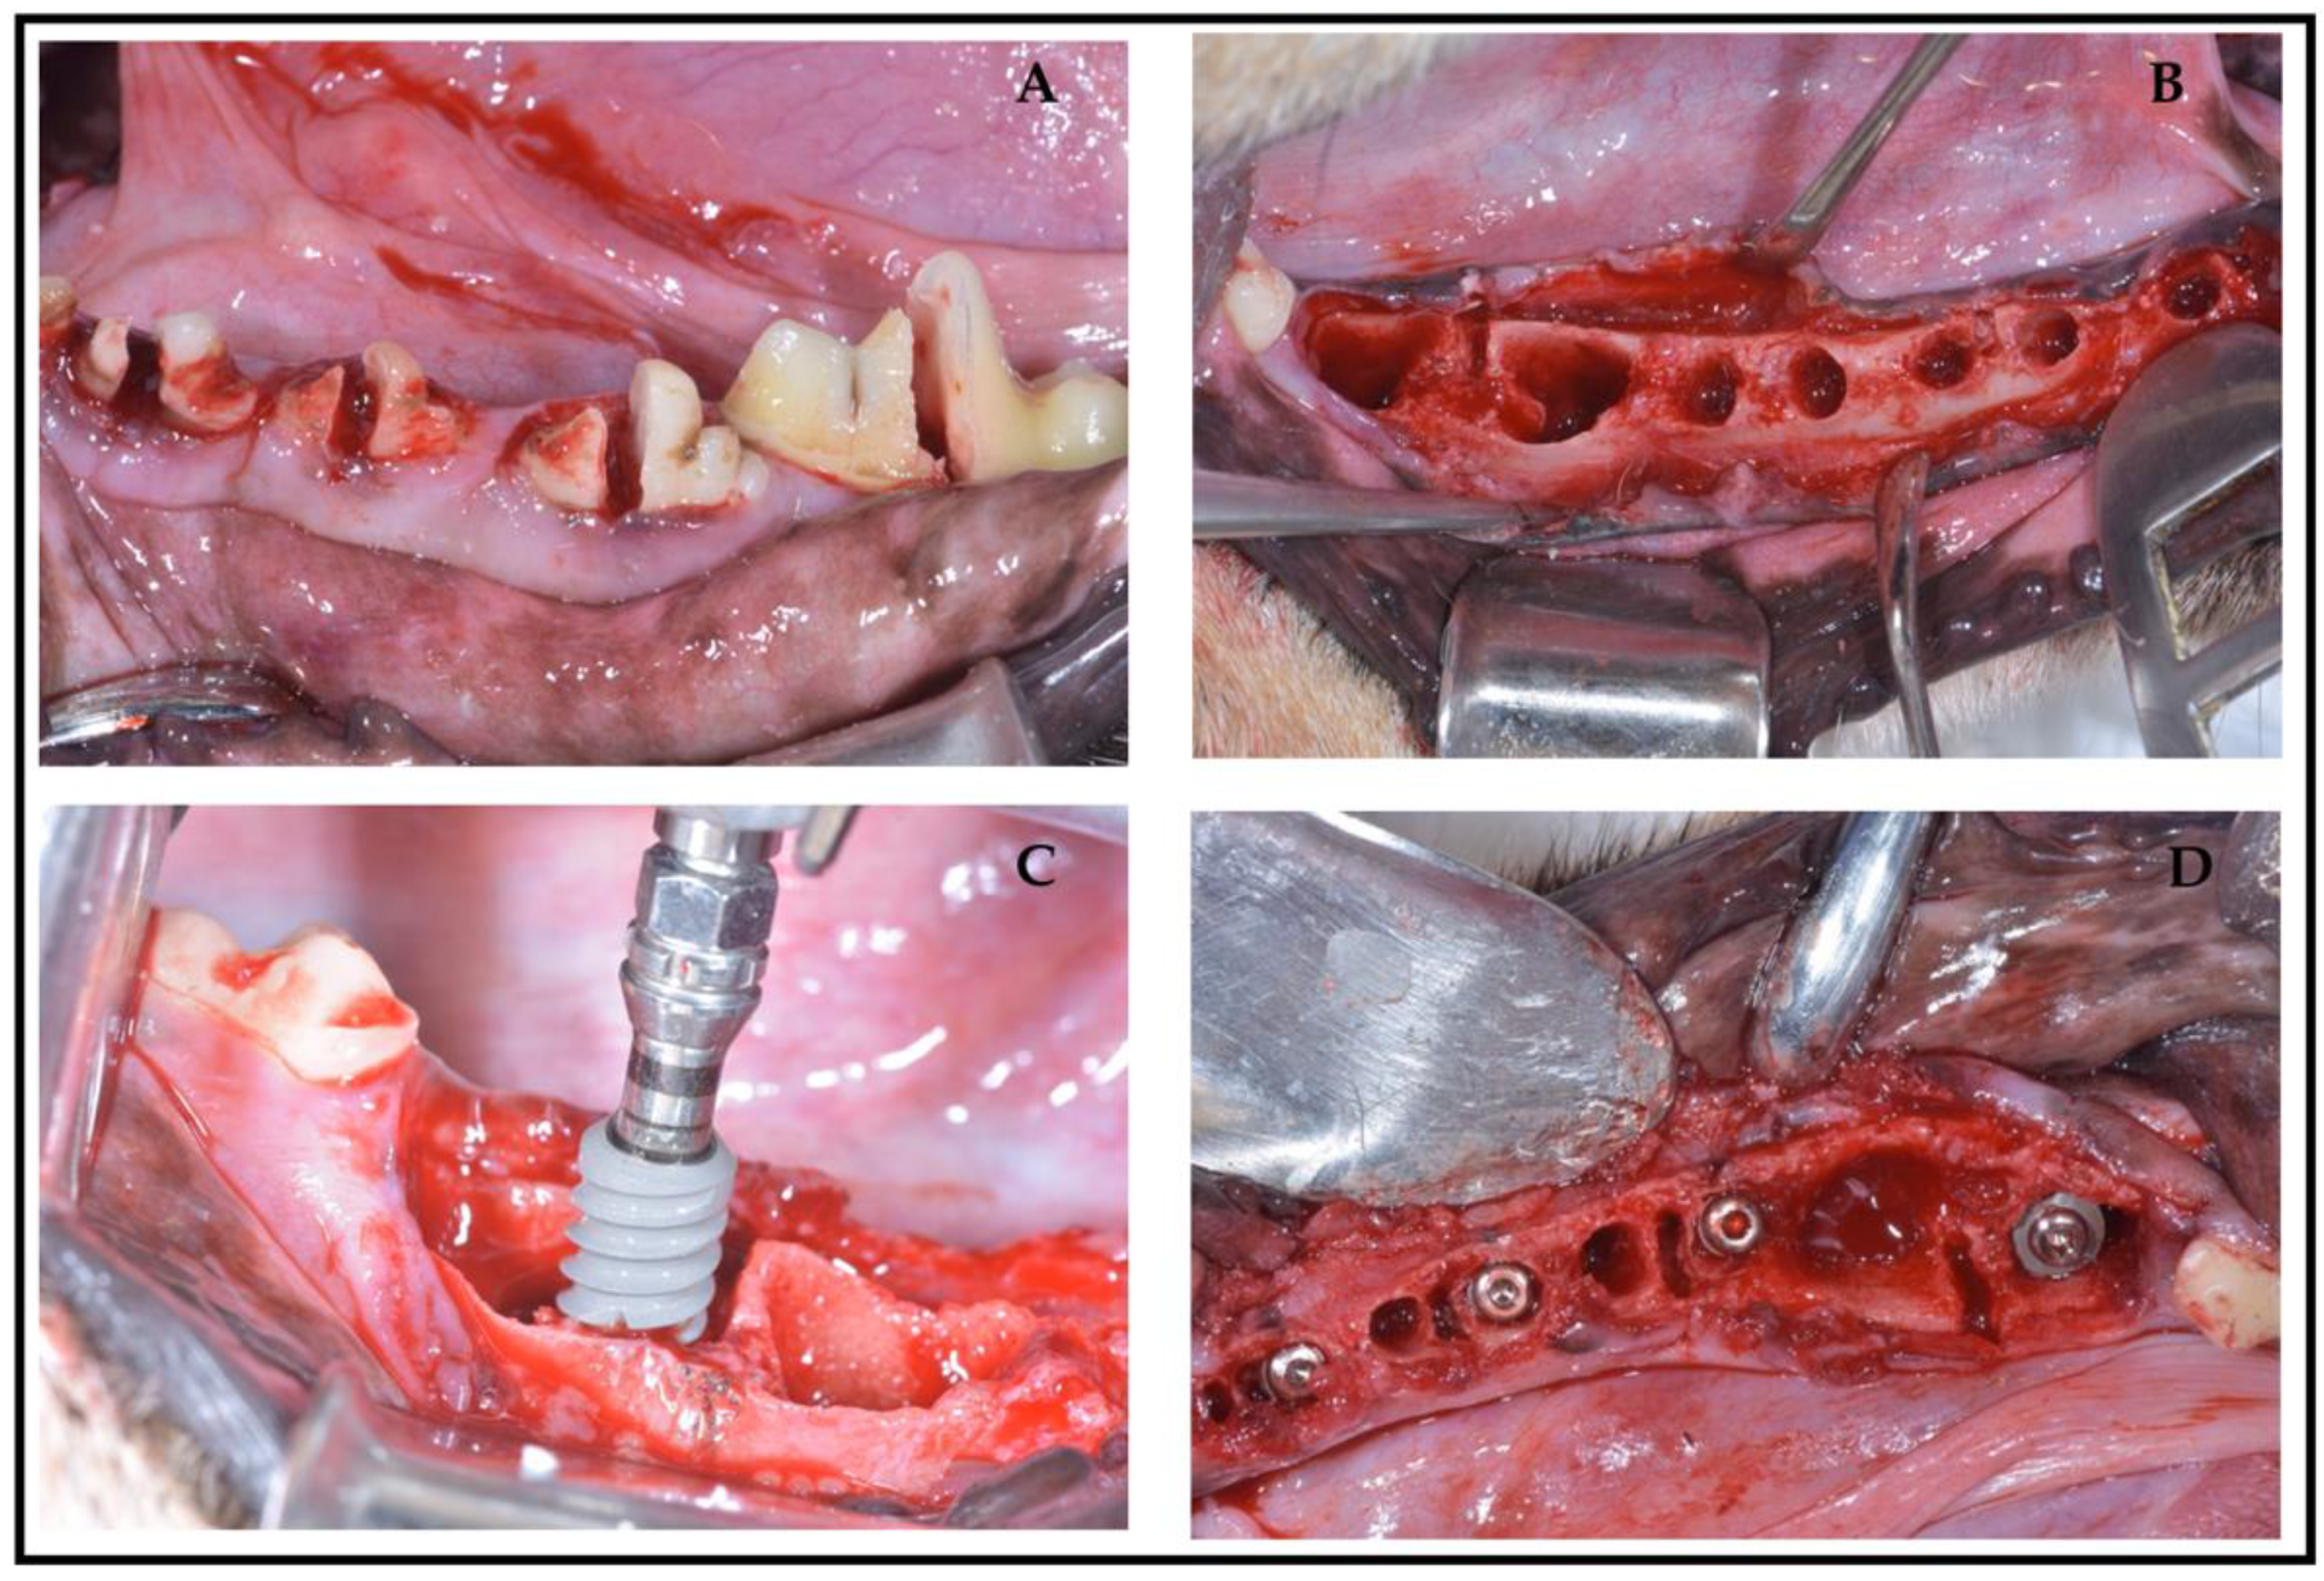
2.3. Surgical Protocol

All surgical procedures were performed under general anesthesia via an intravenous catheter in the cephalic vein, infusing Propofol® (Propovet, Abbott Laboratories Ltd., Queensborough, Kent, UK). Maintenance anesthesia was performed with volatile anesthetics. Local anesthesia (Articaine 40 mg, with 1% epinephrine, Ultracain®, Normon, Madrid, Spain) was administered at the surgical sites. All procedures were performed under the supervision of a veterinary surgeon. Extractions of premolars and the mandibular first molar (P2, P3, P4, and M1) were performed in the mandibular hemiarch of each animal. Implant placement was determined by the randomization program (http://www.randomization.com) (29 October 2020), in which the experimental animals were assigned to the three different implant surfaces: 16 implants with Mt (MtG), 16 implants with Ch from the test group (ChG), and 16 uncoated implants from the commercial company Bioner (Bioetch®, Bioner Sistemas Implantológicos, Barcelona, Spain) (CG), randomly distributed in six dogs. Each dog received eight conical screw implants (Bioner®, Barcelona, Spain) (Ø3.5 mm × 8.5 mm in the premolar area and Ø5 mm × 8.5 mm in the molar area), four per hemiarch, randomly and bilaterally in the mandible. After placement, closure screws were placed to allow for a submerged healing protocol (Figure 1A–D). No grafting materials were used in the gaps between the bone cortices and the implants. The flaps were closed with simple nonabsorbable interrupted sutures (Silk 4-0®, Lorca Marín, Lorca, Spain). Sacrifice was performed 12 weeks after implant placement using pentothal natrium (Abbot Laboratories, Madrid, Spain) perfused through the carotid arteries after anesthesia. Sectioned bone blocks were obtained. The animals were maintained on a soft diet from the time of surgery until the end of the study.

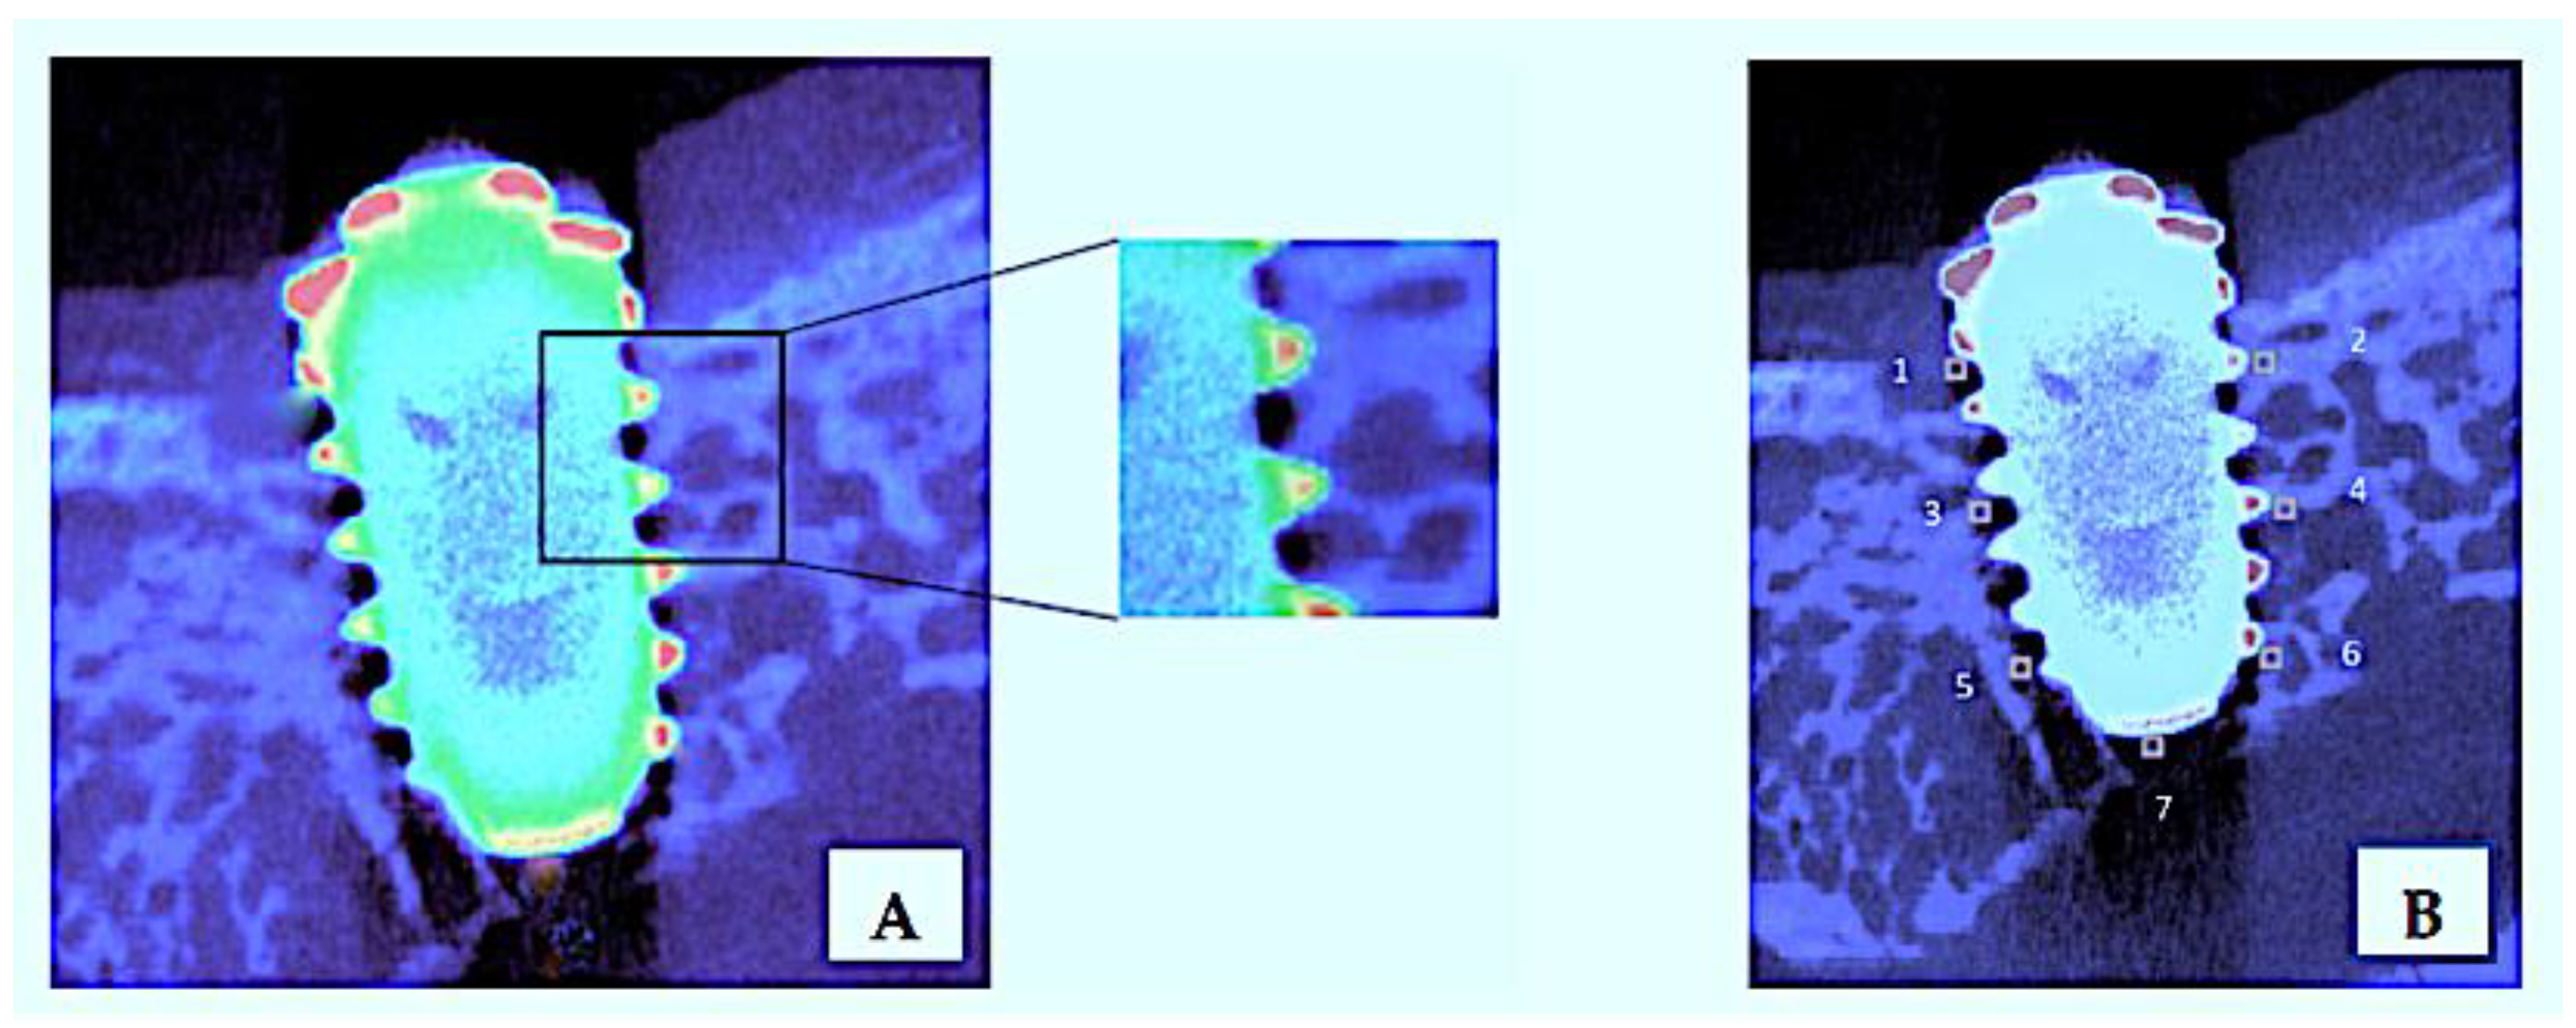
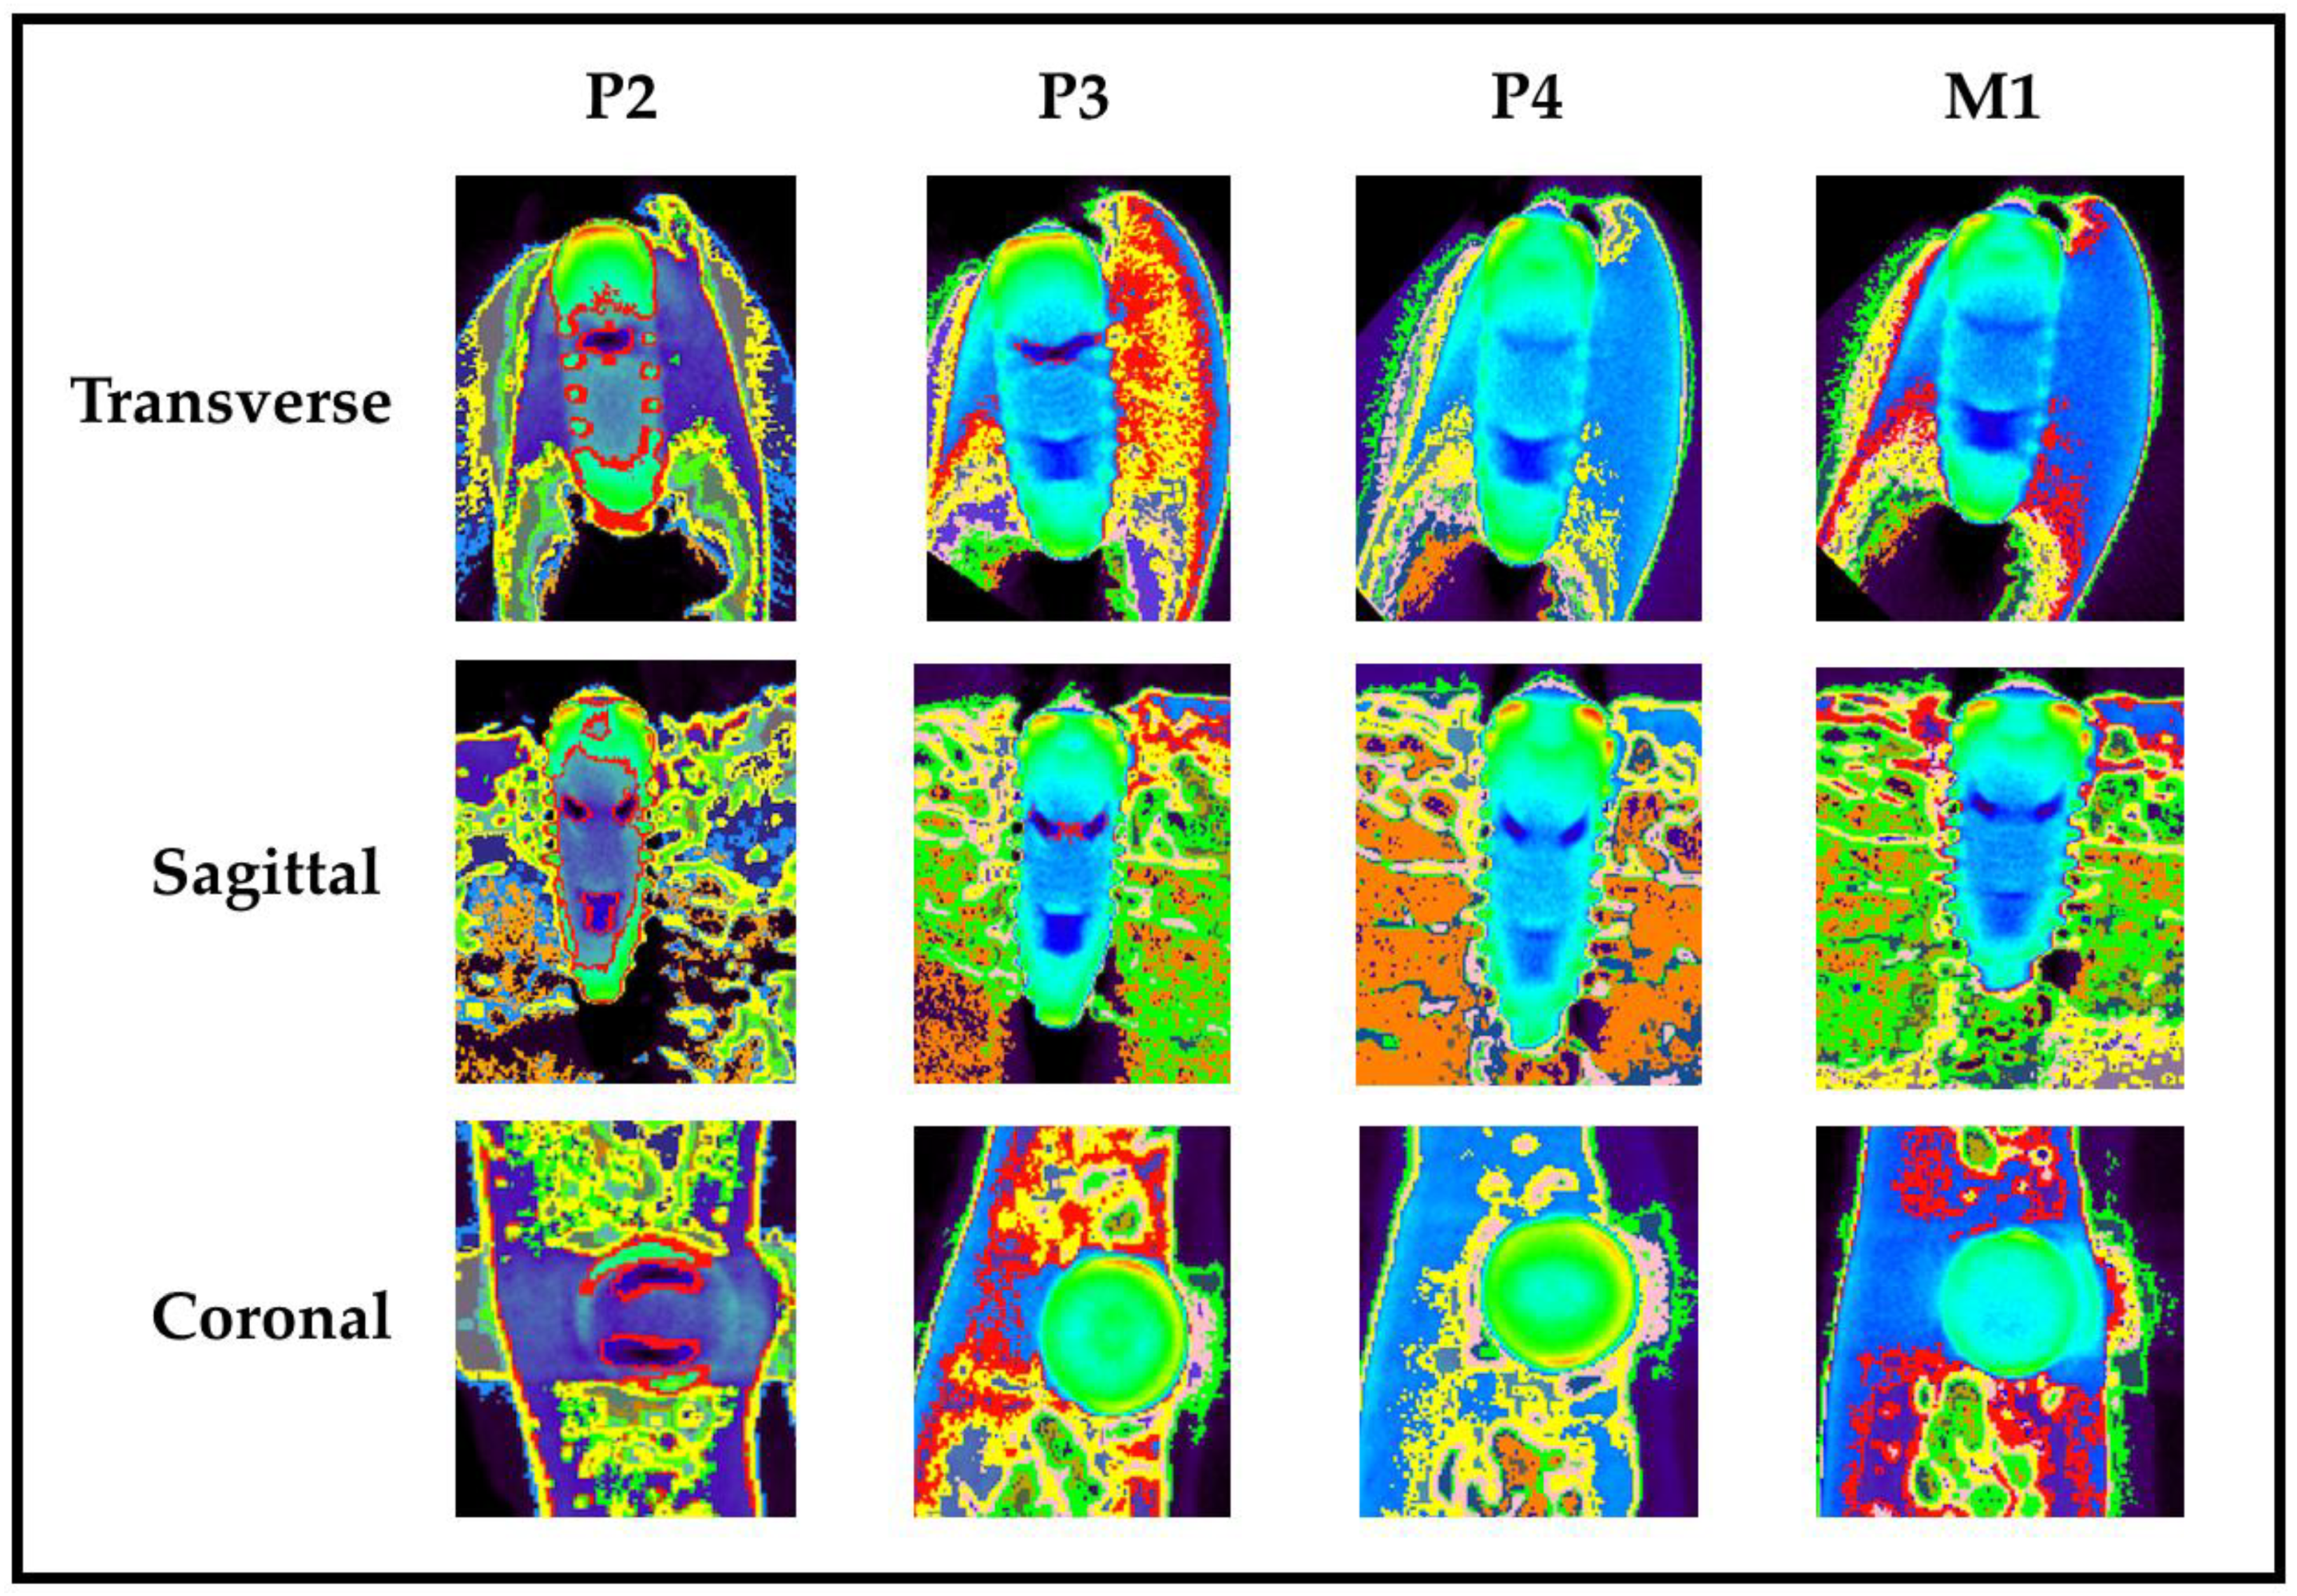
2.4. Micro-Computed Tomography Analysis

After euthanasia of animals (after 12 weeks of implants placement), the sections of the block were preserved and fixed in 10% neutral formalin. Image acquisitions were performed using a multimodal SPECT/CT Albira II ARS scanner (Bruker® Corporation, Karksruhe, Germany). The acquisition parameters were 45 kV, 0.2 mA, and 0.05 mm voxels. The acquisition slices were axial, 0.05 mm thick, and 800 to 1000 images were obtained from each piece through a flat panel digital detector with 2400 × 2400 pixels and a FOV (field of view) of 70 mm × 70 mm. The implants were grouped according to the three axes (transverse, coronal, and sagittal). The sagittal section was used for BD measurements, as it provided the best details of the bone structure. In all the images, the same color scale was used (0 min and 3 max) with the same parameters in FOV (%): 90 and zoom: 0.6, with a hardness of 1. BD around the implant was quantified in HU, using seven 10 mm × 10 mm squares or regions of interest (ROI) in the bone implant contact area, two in the crestal area, four in the medial area, and one in the apical area of the implant, using a medical image data examiner (Figure 2A,B).
The Norton and Gamble classification [36], modified by Misch [37], was used to assess BD according to Lekholm and Zarb [38]. Once the 7 ROIs (Figure 2B) were positioned, the AMIDE tool allowed us to obtain the data in statistical form, with maxima, minima, and standard deviations; AMIDE is a tool for visualizing, analyzing, and registering volumetric medical image data sets (AMIDE, UCLA University, Los Angeles, CA, USA). It allows one to draw three-dimensional ROIs directly on the images and to generate statistics for these ROIs. In addition, the program supports the following color maps: Black/White, Red/Orange, Blue/Pink, and Green/Yellow, and each color has a given UH range (Figure 3).

2.5. Statistical Analysis

BD variables were analyzed in crestal, mid, and apical areas. Descriptive analysis was performed with SPSS Windows 20.0 and the calculation of p-values was performed with SUDAAN 7.0 (RTI, RTP, NC) to account for clustering (multiple sites around implants). We estimated a posteriori, and using Sample Power 2.0 (SPSS, Chicago, IL, USA), the statistical power obtained with those 336 studied locations (=6 dogs × 8 implants/dog × 7 locations/implant), i.e., 112 locations/group. We initially considered from our experience a large design effect (owing to locations being clustered within implants) of 1.33 in estimating the HU measurements. This means that the effective sample size per group would be 84 (=112/1.33). These sample sizes allow, by using the t-test for independent groups and with a power of 80% and 5% alpha error, the detection of an estimated Cohen’s d of 0.45 (below a medium effect size according to Cohen’s scale [39] when comparing HU measurements between two groups). For crestal sites, the effective sample size per group is 24 (=32/1.33), and this allows the detection of an effect size of 0.8 (large) [39]; for medial sites, the corresponding figure is 48 (=64/1.33) with the capacity to detect an effect size of 0.6, which is between medium (0.5) and large (0.8) [39]; and for apical sites, it is 12 (=16/1.33) and the detectable effect size is 1.2 (very large) (1.2) [40].

3. Results

The total sample consisted of 336 sites (ROIs). A wide range of BD was observed in the different ROIs, depending on their location or level (crestal, medial, and apical) and implant position (P2, P3, P4, and M1). In terms of surface coating, the highest BD (+986 HU) was recorded in the medial of left P2, in CG, with mean values of 0.58 ± 0.20, 0.54 ± 0.13, and 0.59 ± 0.14 for ChG, MtG, and CG, respectively, and the lowest BD was recorded in the apical area (−243 HU) in left P4 in MtG, with mean values of −0.20 ± 0.32, −0.18 ± 0.38, and −0.11 ± 0.33 for ChG, MtG, and CG, respectively. The lower BD in the apical area could be explained by the proximity of the dental nerve canal in this region. Regarding implant position, the highest BD (+995 HU) was recorded in left P3 and the lowest (−330 HU) in left M1; mean values ranged from 0.12 ± 0.35 for P2 with the Mt coating to 0.05 ± 0.23 for M1 with the Ch coating. Mean values and standard deviations are shown in Table 1. Statistical analysis by linear regression showed no statistical significance for surface coatings (ChG, MtG, and CG); however, we found statistical significance in UH for ROIs in the different levels (crestal, medial, and apical) (p < 0.001) and implant positions (P2, P3, P4, and M1) (p = 0.032) (Table 2).

4. Discussion

The aim of this study was to evaluate, via micro-CT, the BD around Ch- and Mt-coated Ti dental implants and to compare it with conventional SLA-type etched surface implants, after 12 weeks of immediate post-extraction placement, in the jaws of Beagle dogs.
Micro-CT has proven to be the most suitable technique for the assessment of bone mass in animal models; it is also a valuable tool for evaluating human biopsies and necropsies [41,42], having been used not only qualitatively, but also quantitatively in different clinical situations [43,44,45,46]. It is a noninvasive diagnostic tool that allows the reuse of samples for other types of measurements and is also of great interest in the clinic, where, for obvious reasons, conventional histomorphometry cannot be performed [47]. It is currently used to evaluate morphometric characteristics as a complementary alternative to conventional histological analysis [48]. Particularly in dentistry, it is an extremely useful method for the study of human maxillary bone tissue associated with different conditions and pathologies, and to evaluate the changes when the bone evolves after certain injuries or is subjected to surgical procedures. In addition, it is an accurate and time-saving technique for determining bone morphometry compared to manual methods [49,50,51].
Ch is considered an excellent material for osteoblast growth, due to its structural characteristics similar to hyaluronic acid; some authors have reported its osteoconductive capacity as a coating for implant materials, so it is widely used for bone regeneration methods, due to its biocompatibility and anti-inflammatory power [52,53,54]. Khajuria et al. [55] demonstrated in a periodontitis rat model that the local administration of Ch preparations produced significant improvements in periodontal bone support ratios and bone mineral density. In addition, López-Valverde et al. [56] reviewed the literature and concluded that Ch-coated Ti dental implants may have a higher osseointegration capacity and could become a commercial option in the future.
Mt has the capacity to stimulate osteoblastic differentiation and inhibit osteoclast differentiation. Koyama et al. [57] demonstrated in mice that, at pharmacological doses, causes an increase in bone mass by inhibiting bone resorption. Cutando et al. [58] first applied it topically to the surface of dental implants. In vivo studies have shown that local Mt administered at the ostectomy site at the time of implant placement can induce increased contact between the trabecular bone and the implant and increased density of the trabecular area [59]. Similarly, a recent meta-analysis [60] reported that the topical application of Mt to implant sites could induce increased BD around Ti dental implants in the early stages of healing. In this sense, certain studies support the hypothesis that wettability, together with surface micro-texture, would be the determining factors in osteoblast response [61]; therefore, the surface preparation of implants has become a technical challenge.
Different studies have assessed the effectiveness of Ch and Mt as biofunctionalizers of the surface of Ti dental implants, but, to our knowledge, our study was the first to compare both coatings with each other and with a conventional SLA-type coating.
In our investigation, HU measurements ranged from −330 to +995, when all 336 sites were evaluated, 12 weeks after implantation. A total of 112 sites were analyzed in the crestal, medial, and apical levels (ROIs) and at the implant locations (P2, P3, P4, and M1), for the three surfaces studied. In the Norton and Gamble study [36], taken as a reference, a single standard implant of Ø3.5 mm × 11 mm L was used to allow the software to calculate the BD values and, in our study, two implants of different thicknesses (Ø3.5 mm × 8.5 mm and Ø5 mm × 8.5 mm) were used, depending on the premolar or molar area, so there could be a bias in the reporting of the Hounsfield values.
The results of our study provided valuable information on different coatings of dental implants in order to achieve better and faster osseointegration: the surfaces coated with Ch and Mt achieved similar BD values around the implants to the control surface, with conventional SLA etching (Bioetch®), with no significant statistical association observed in the BD measurement values of Mt- and Ch-coated implants and conventional etched surface implants. In this regard, Sultankulov et al. [62] in a recent review concluded that the Ch could introduce valuable properties, such as antimicrobial activity and mucoadhesiveness, recommending further studies on this biopolymer and its osteogenic properties. Similarly, Lu et al. [63] in another recent review highlighted the protective role of melatonin in periodontitis, bone lesions, and osteoporosis, but, because a number of studies have shown adverse effects, they recommended exploring and investigating the optimal conditions of administration.
However, it is possible that these types of surface coatings are eliminated by the action of the forces used during implantation, due to their low mechanical resistance, which would explain the absence of statistical differences between the coated surfaces and the control surfaces.
The most validated strategy to improve the bone-implant interface continues to be the modification of the surface topography by increasing macro-, micro-, and nano-roughness [64].
However, in order to improve the bioactivity of implants, some studies have proposed surface modification by incorporating organic and inorganic ions and molecules, through peptides, proteins, enzymes, and pharmaceuticals, on the Ti oxide layer (TiO2). All this would lead to an improvement in the biological performance of Ti implants, which would directly influence the local response of the surrounding tissues, improving the apposition of the newly formed bone. In this regard, it is believed that the combination of organic and inorganic components in Ti surface re-coatings would lead to bone-like coatings and, thus, to new generations of surface-modified implants with improved functionality and biological efficacy [65,66].
Another finding of our study was the statistical significance we found for BD in different levels (crestal, medial, and apical) (p < 0.001) and positions (P2, P3, P4, and M1) (p = 0.032) of the implants. In this regard, our results agreed with Shapurian et al. and Di Stefano et al. [67,68] who, in their respective studies in mandibles, found significant variations in bone density within the mandible, which would underline the importance of identifying specific locations prior to implant placement.
We also found that micro-CT proved to be a very useful diagnostic method in the measurement of peri-implant BD measured in HU. Panoramic radiography provides a two-dimensional view of the anatomical structures of the mandible; however, micro-CT provides much more specific data, such as height, width, or BD in the peri-implant area. This parameter is a key factor to take into account when predicting implant stability and survival. This survival is conditioned by bone quality, i.e., BD, as it has been shown that BD around implants is decisive for their osseointegration [69,70]. In our study, the highest BD was located at the P3 level in the Ch-coated implant group (+995 HU) in the crestal ROI and the lowest (−330 HU) in the apical ROI in M1, probably due to the proximity of the dental canal.
However, the results of our study were biased by a number of limitations that we describe below: first, when defining an ROI in a micro-CT image, one has to take into account that an artefact is always generated when there is a pronounced density gradient.
Due to the nature of the convolution kernels used in the filtered back-projection algorithms, the area adjacent to a high-density object (e.g., the implant) is shown with too low a HU number. This problem could be overcome, in part, if high-resolution kernels are used when reconstructing the images, but this will result in an extremely noisy image and will seriously impair the quantification of the BD in trabecular areas that are not affected by the artefact. In this study, we draw ROIs at a “safe” distance from the implant in cross-sections, but, despite this, an image may be distorted by metallic scatter, and certain studies have highlighted the difficulty in performing an accurate morphometric analysis of the bony areas surrounding an implant [71,72]. Secondly, Rebaudi et al. and Stoppie et al. [73,74] reported that these artefacts created in the areas close to the implant would lead to biases in the measurement of BD in these areas, as it is measured including this artefact. Song et al. [75], in a study with implants in beagle dogs, demonstrated that 45 to 63 μm was a reasonable distance to compensate for artefacts in bone morphometric analysis of an implant containing the tissue sample assessed by micro-CT, and the acquisition distance in our study far exceeded this figure. Thirdly, the micro-CT techniques used to quantify peri-implant BD do not provide specific histological information on the nature of the bone formed around the surfaces tested, despite the color coding of the HU provided by the AMIDE software. Fourth and lastly, regarding clinical applicability, we are aware that with the dog, despite having a similar bone structure to humans, both corticoradicular configuration and mandibular bone remodeling follow different patterns [76].

5. Conclusions

The surface coatings tested/coated with Ch or Mt showed no difference in peri-implant BD compared to the control group with a conventional etched surface, but they did for implant locations and for position. On the other hand, despite the aforementioned limitations, micro-CT, with appropriate complementary software, proved to be a very useful method for the measurement of BD, providing quantitative data of the trabecular bone around the implants.

Author Contributions

Conceptualization, N.L.-V. and A.L.-V.; methodology, N.L.-V.; formal analysis, A.L.-V.; investigation, N.L.-V. and F.M.-M.; writing—original draft preparation A.L.-V.; data curation, J.M.A. and M.C.G.-E.; supervision, J.M.R. and A.L.-V. All authors have read and agreed to the published version of the manuscript.

Funding

This research received no external funding.

Institutional Review Board Statement

This study was approved by the Ethics Committee of the Catholic University of Murcia (Spain). Study protocol, date 24 July 2020, code CE072004.

Informed Consent Statement

Not applicable.

Data Availability Statement

Not applicable.

Acknowledgments

To BIONER, Sistemas Implantológicos, Barcelona, Spain, for their collaboration in this study.

Conflicts of Interest

The authors declare no conflict of interest.

Abbreviations

BDBone Density
ChChitosan
CTComputed Tomography
FOVField of View
HUHounsfield Unity
MtMelatonin
ROIRegion of Interest
SLA Sandblasted Large grit Acid etched
TiO2Titanium Oxide

References

  1. Rautray, T.R.; Narayanan, R.; Kwon, T.-Y.; Kim, K.-H. Surface modification of titanium and titanium alloys by ion implantation. J. Biomed. Mater. Res. Part B Appl. Biomater. 2010, 93, 581–591. [Google Scholar] [CrossRef]
  2. Shah, F.A.; Trobos, M.; Thomsen, P.; Palmquist, A. Commercially pure titanium (cp-Ti) versus titanium alloy (Ti6Al4V) materials as bone anchored implants—Is one truly better than the other? Mater. Sci. Eng. C 2016, 62, 960–966. [Google Scholar] [CrossRef]
  3. López-Valverde, N.; Flores-Fraile, J.; Ramírez, J.M.; De Sousa, B.M.; Herrero-Hernández, S.; López-Valverde, A. Bioactive Surfaces vs. Conventional Surfaces in Titanium Dental Implants: A Comparative Systematic Review. J. Clin. Med. 2020, 9, 2047. [Google Scholar] [CrossRef]
  4. Zhang, Y.; Zheng, Y.; Li, Y.; Wang, L.; Bai, Y.; Zhao, Q.; Xiong, X.; Cheng, Y.; Tang, Z.; Deng, Y.; et al. Tantalum Nitride-Decorated Titanium with Enhanced Resistance to Microbiologically Induced Corrosion and Mechanical Property for Dental Application. PLoS ONE 2015, 10, e0130774. [Google Scholar] [CrossRef] [PubMed] [Green Version]
  5. Elieh-Ali-Komi, D.; Hamblin, M.R. Chitin and Chitosan: Production and Application of Versatile Biomedical Nanomaterials. Int. J. Adv. Res. 2016, 4, 411–427. [Google Scholar]
  6. Qian, J.; Pan, C.; Liang, C. Antimicrobial activity of Fe-loaded chitosan nanoparticles. Eng. Life Sci. 2017, 17, 629–634. [Google Scholar] [CrossRef] [PubMed] [Green Version]
  7. Lu, B.; Ye, H.; Shang, S.; Xiong, Q.; Yu, K.; Li, Q.; Xiao, Y.; Dai, F.; Lan, G.; Dai, F. Novel wound dressing with chitosan gold nanoparticles capped with a small molecule for effective treatment of multiantibiotic-resistant bacterial infections. Nanotechnology 2018, 29, 425603. [Google Scholar] [CrossRef]
  8. Covarrubias, C.; Trepiana, D.; Corral, C. Synthesis of hybrid copper-chitosan nanoparticles with antibacterial activity against cariogenic Streptococcus mutans. Dent. Mater. J. 2018, 37, 379–384. [Google Scholar] [CrossRef] [PubMed] [Green Version]
  9. Gomes, L.P.; Andrade, C.T.; Del Aguila, E.M.; Alexander, C.; Paschoalin, V.M. Assessing the antimicrobial activity of chitosan nanoparticles by fluorescence-labeling. Int. J. Biotechnol. Bioeng. 2018, 12, 111–117. [Google Scholar]
  10. Bojar, W.; Kucharska, M.; Ciach, T.; Koperski, Ł.; Jastrzebski, Z.; Szałwiński, M. Bone regeneration potential of the new chitosan-based alloplastic biomaterial. J. Biomater. Appl. 2014, 28, 1060–1068. [Google Scholar] [CrossRef]
  11. Aguilar, A.; Zein, N.; Harmouch, E.; Hafdi, B.; Bornert, F.; Offner, D.; Clauss, F.; Fioretti, F.; Huck, O.; Benkirane-Jessel, N.; et al. Application of Chitosan in Bone and Dental Engineering. Molecules 2019, 24, 3009. [Google Scholar] [CrossRef] [Green Version]
  12. Park, J.-S.; Choi, S.-H.; Moon, I.-S.; Cho, K.S.; Chai, J.-K.; Kim, C.-K. Eight-week histological analysis on the effect of chitosan on surgically created one-wall intrabony defects in beagle dogs. J. Clin. Periodontol. 2003, 30, 443–453. [Google Scholar] [CrossRef]
  13. Abinaya, B.; Prasith, T.P.; Ashwin, B.; Chandran, S.V.; Selvamurugan, N. Chitosan in Surface Modification for Bone Tissue Engineering Applications. Biotechnol. J. 2019, 14, e1900171. [Google Scholar] [CrossRef] [PubMed]
  14. Soundarya, S.P.; Menon, A.H.; Chandran, S.V.; Selvamurugan, N. Bone tissue engineering: Scaffold preparation using chitosan and other biomaterials with different design and fabrication techniques. Int. J. Biol. Macromol. 2018, 119, 1228–1239. [Google Scholar] [CrossRef]
  15. He, L.-H.; Yao, L.; Xue, R.; Sun, J.; Song, R. In-situ mineralization of chitosan/calcium phosphate composite and the effect of solvent on the structure. Front. Mater. Sci. 2011, 5, 282–292. [Google Scholar] [CrossRef]
  16. Leonor, I.; Baran, E.; Kawashita, M.; Reis, R.L.; Kokubo, T.; Nakamura, T. Growth of a bonelike apatite on chitosan microparticles after a calcium silicate treatment. Acta Biomater. 2008, 4, 1349–1359. [Google Scholar] [CrossRef] [PubMed] [Green Version]
  17. Lu, H.-T.; Lu, T.-W.; Chen, C.-H.; Lu, K.-Y.; Mi, F.-L. Development of nanocomposite scaffolds based on biomineralization of N,O-carboxymethyl chitosan/fucoidan conjugates for bone tissue engineering. Int. J. Biol. Macromol. 2018, 120, 2335–2345. [Google Scholar] [CrossRef]
  18. Xie, C.-M.; Lu, X.; Wang, K.-F.; Meng, F.-Z.; Jiang, O.; Zhang, H.-P.; Zhi, W.; Fang, L. Silver Nanoparticles and Growth Factors Incorporated Hydroxyapatite Coatings on Metallic Implant Surfaces for Enhancement of Osteoinductivity and Antibacterial Properties. ACS Appl. Mater. Interfaces 2014, 6, 8580–8589. [Google Scholar] [CrossRef]
  19. Ishihara, M.; Nakanishi, K.; Ono, K.; Sato, M.; Kikuchi, M.; Saito, Y.; Yura, H.; Matsui, T.; Hattori, H.; Uenoyama, M.; et al. Photocrosslinkable chitosan as a dressing for wound occlusion and accelerator in healing process. Biomaterials 2002, 23, 833–840. [Google Scholar] [CrossRef]
  20. Tan, D.X.; Xu, B.; Zhou, X.; Reiter, R.J. Pineal Calcification, Melatonin Production, Aging, Associated Health Consequences and Rejuvenation of the Pineal Gland. Molecules 2018, 23, 301. [Google Scholar] [CrossRef] [Green Version]
  21. Maria, S.; Samsonraj, R.; Munmun, F.; Glas, J.; Silvestros, M.; Kotlarczyk, M.; Rylands, R.; Dudakovic, A.; Van Wijnen, A.J.; Enderby, L.T.; et al. Biological effects of melatonin on osteoblast/osteoclast cocultures, bone, and quality of life: Implications of a role for MT2 melatonin receptors, MEK1/2, and MEK5 in melatonin-mediated osteoblastogenesis. J. Pineal Res. 2018, 64, e12465. [Google Scholar] [CrossRef]
  22. Manchester, L.C.; Coto-Montes, A.; Boga, J.A.; Andersen, L.P.H.; Zhou, Z.; Galano, A.; Vriend, J.; Tan, D.-X.; Reiter, R.J. Melatonin: An ancient molecule that makes oxygen metabolically tolerable. J. Pineal Res. 2015, 59, 403–419. [Google Scholar] [CrossRef] [PubMed]
  23. Calvo-Guirado, J.L.; Salvatierra, A.A.; Gargallo-Albiol, J.; Delgado-Ruiz, R.A.; Sanchez, J.E.M.; Satorres-Nieto, M. Zirconia with laser-modified microgrooved surface vs. titanium implants covered with melatonin stimulates bone formation. Experimental study in tibia rabbits. Clin. Oral Implant. Res. 2014, 26, 1421–1429. [Google Scholar] [CrossRef] [PubMed]
  24. Guardia, J.; Gómez-Moreno, G.; Ferrera, M.J.; Cutando, A.; Dds, G.G. Evaluation of Effects of Topic Melatonin on Implant Surface at 5 and 8 Weeks in Beagle Dogs. Clin. Implant. Dent. Relat. Res. 2009, 13, 262–268. [Google Scholar] [CrossRef]
  25. Calvo-Guirado, J.L.; Gómez-Moreno, G.; López-Marí, L.; Guardia, J.; Marínez-González, J.M.; Barone, A.; Tresguerres, I.F.; Paredes, S.D.; Fuentes-Breto, L. Retracted: Actions of melatonin mixed with collagenized porcine bone versus porcine bone only on osteointegration of dental implants. J. Pineal Res. 2010, 48, 194–203. [Google Scholar] [CrossRef]
  26. Hounsfield, G.N. Computerized transverse axial scanning (tomography): Description of system. Br. J. Radiol. 1973, 46, 1016–1022. [Google Scholar] [CrossRef] [PubMed]
  27. Bouxsein, M.L.; Boyd, S.K.; Christiansen, B.A.; Guldberg, R.E.; Jepsen, K.J.; Muller, R. Guidelines for assessment of bone microstructure in rodents using micro-computed tomography. J. Bone Miner. Res. 2010, 25, 1468–1486. [Google Scholar] [CrossRef]
  28. Irie, M.S.; Rabelo, G.; Spin-Neto, R.; Dechichi, P.; Borges, J.S.; Soares, P.B.F. Use of Micro-Computed Tomography for Bone Evaluation in Dentistry. Braz. Dent. J. 2018, 29, 227–238. [Google Scholar] [CrossRef] [Green Version]
  29. Peyrin, F. Evaluation of bone scaffolds by micro-CT. Osteoporos. Int. 2011, 22, 2043–2048. [Google Scholar] [CrossRef] [PubMed]
  30. Shi, G.; Subramanian, S.; Cao, Q.; Demehri, S.; Siewerdsen, J.H.; Zbijewski, W. Application of a novel ultra-high resolution multi-detector CT in quantitative imaging of trabecular microstructure. Proc. SPIE Int. Soc. Opt. Eng. 2020, 11317, 113171E. [Google Scholar]
  31. Young, S.; Kretlow, J.D.; Nguyen, C.; Bashoura, A.G.; Baggett, L.S.; Jansen, J.A.; Wong, M.; Mikos, A.G. Microcomputed tomography characterization of neovascularization in bone tissue engineering applications. Tissue Eng. Part B Rev. 2008, 14, 295–306. [Google Scholar] [CrossRef] [PubMed]
  32. Park, Y.-S.; Yi, K.-Y.; Lee, I.-S.; Jung, Y.-C. Correlation between microtomography and histomorphometry for assessment of implant osseointegration. Clin. Oral Implant. Res. 2005, 16, 156–160. [Google Scholar] [CrossRef] [PubMed]
  33. Swain, M.; Xue, J. State of the art of Micro-CT applications in dental research. Int. J. Oral Sci. 2009, 1, 177–188. [Google Scholar] [CrossRef]
  34. Salomó-Coll, O.; Maté-Sánchez de Val, J.E.; Ramírez-Fernández, M.P.; Satorres-Nieto, M.; Gargallo-Albiol, J.; Calvo-Guirado, J.L. Osseoinductive elements for promoting osseointegration around immediate implants: A pilot study in the foxhound dog. Clin. Oral Implant. Res. 2016, 27, e167–e175. [Google Scholar] [CrossRef]
  35. Zhang, C.; Wang, Z.; Li, Y.; Yang, Y.; Ju, X.; He, R. The preparation and physiochemical characterization of rapeseed protein hydrolysate-chitosan composite films. Food Chem. 2019, 272, 694–701. [Google Scholar] [CrossRef] [PubMed]
  36. Norton, M.R.; Gamble, C. Bone classification: An objective scale of bone density using the computerized tomography scan. Clin. Oral Implant. Res. 2001, 12, 79–84. [Google Scholar] [CrossRef] [PubMed]
  37. Misch, C.E. Density of bone: Effect on treatment planning, surgical approach, and healing. In Contemporary Implant Dentistry; Mosby: St. Louis, MO, USA, 1993; pp. 469–485. [Google Scholar]
  38. Bra-Nemark, P.-I.; Zarb, G.A.; Albrektsson, T.; Rosen, H.M. Tissue-Integrated Prostheses. Osseointegration in Clinical Dentistry. Plast. Reconstr. Surg. 1986, 77, 496–497. [Google Scholar] [CrossRef]
  39. Cohen, J. Statistical Power Analysis for the Behavioral Sciences, 2nd ed.; Lawrence Erlbaum: Hillsdale, MI, USA; Hove, UK, 1988. [Google Scholar]
  40. Sawilowsky, S. New effect size rules of thumb. J. Mod. App. Stat. Methods 2009, 8, 597–599. [Google Scholar] [CrossRef]
  41. Balbinot, G.S.; Leitune, V.C.B.; Ponzoni, D.; Collares, F.M. Bone healing with niobium-containing bioactive glass composition in rat femur model: A micro-CT study. Dent Mater. 2019, 35, 1490–1497. [Google Scholar] [CrossRef]
  42. Jiang, Y.; Zhao, J.; Liao, E.Y.; Dai, R.C.; Wu, X.P.; Genant, H.K. Application of micro-CT assessment of 3-D bone micro- structure in preclinical and clinical studies. J. Bone Miner. Metab. 2005, 23, 122–131. [Google Scholar] [CrossRef]
  43. Sennerby, L.; Wennerberg, A.; Pasop, F. A new microtomo-graphic technique for non-invasive evaluation of the bone structure around implants. Clin. Oral Implant. Res. 2001, 12, 91–94. [Google Scholar] [CrossRef]
  44. Van Dessel, J.; Nicolielo, L.F.; Huang, Y.; Coudyzer, W.; Salmon, B.; Lambrichts, I.; Jacobs, R. Accuracy and reliability of different cone beam computed tomography (CBCT) devices for structural analysis of alveolar bone in comparison with multislice CT and micro-CT. Eur. J. Oral Implantol. 2017, 10, 95–105. [Google Scholar]
  45. Rebaudi, A.; Trisi, P.; Cella, R.; Cecchini, G. Preoperative evaluation of bone quality and bone density using a novel CT/microCT-based hard-normal-soft classification system. Int. J. Oral Maxillofac. Implant. 2010, 25, 75–85. [Google Scholar]
  46. Fanuscu, M.I.; Chang, T.-L. Three-dimensional morphometric analysis of human cadaver bone: Microstructural data from maxilla and mandible. Clin. Oral Implant. Res. 2004, 15, 213–218. [Google Scholar] [CrossRef] [PubMed]
  47. Cano, J.; Campo, J.; Vaquero, J.J.; González, J.M.M.; Bascones, A. High resolution image in bone biology II. Review of the literature. Med. Oral Patol. Oral Cir. Bucal 2008, 13, E31–E35. [Google Scholar] [PubMed]
  48. Tjong, W.; Nirody, J.; Burghardt, A.J.; Carballido-Gamio, J.; Kazakia, G.J. Structural analysis of cortical porosity applied to HR-pQCT data. Med. Phys. 2014, 41, 013701. [Google Scholar] [CrossRef]
  49. Rabelo, G.D.; Coutinho-Camillo, C.; Kowalski, L.P.; Portero-Muzy, N.; Roux, J.-P.; Chavassieux, P.; Alves, F.A. Evaluation of cortical mandibular bone in patients with oral squamous cell carcinoma. Clin. Oral Investig. 2017, 22, 783–790. [Google Scholar] [CrossRef]
  50. Blok, Y.; Gravesteijn, F.; van Ruijven, L.; Koolstra, J. Micro-architecture and mineralization of the human alveolar bone obtained with microCT. Arch. Oral Biol. 2013, 58, 621–627. [Google Scholar] [CrossRef]
  51. Romão, M.; Marques, M.; Cortes, A.; Horliana, A.; Moreira, M.; Lascala, C. Micro-computed tomography and histomorphometric analysis of human alveolar bone repair induced by laser phototherapy: A pilot study. Int. J. Oral Maxillofac. Surg. 2015, 44, 1521–1528. [Google Scholar] [CrossRef]
  52. Chesnutt, B.M.; Yuan, Y.; Buddington, K.; Haggard, W.O.; Bumgardner, J.D. Composite Chitosan/Nano-Hydroxyapatite Scaffolds Induce Osteocalcin Production by Osteoblasts In Vitro and Support Bone Formation In Vivo. Tissue Eng. Part A 2009, 15, 2571–2579. [Google Scholar] [CrossRef]
  53. Cheung, R.C.F.; Ng, T.B.; Wong, J.H.; Chan, W.Y. Chitosan: An Update on Potential Biomedical and Pharmaceutical Applications. Mar. Drugs 2015, 13, 5156–5186. [Google Scholar] [CrossRef] [PubMed]
  54. Ezoddini-Ardakani, F.; Navabazam, A.; Fatehi, F.; Danesh-Ardekani, M.; Khadem, S.; Rouhi, G. Histologic evaluation of chitosan as an accelerator of bone regeneration in microdrilled rat tibias. Dent. Res. J. 2012, 9, 694–699. [Google Scholar]
  55. Khajuria, D.K.; Zahra, S.F.; Razdan, R. Effect of locally administered novel biodegradable chitosan based risedronate/zinc-hydroxyapatite intra-pocket dental film on alveolar bone density in rat model of periodontitis. J. Biomater. Sci. Polym. Ed. 2017, 29, 74–91. [Google Scholar] [CrossRef]
  56. López-Valverde, N.; López-Valverde, A.; Ramírez, J. Systematic Review of Effectiveness of Chitosan as a Biofunctionalizer of Titanium Implants. Biology 2021, 10, 102. [Google Scholar] [CrossRef]
  57. Koyama, H.; Nakade, O.; Takada, Y.; Kaku, T.; Lau, K.-H.W. Melatonin at Pharmacologic Doses Increases Bone Mass by Suppressing Resorption Through Down-Regulation of the RANKL-Mediated Osteoclast Formation and Activation. J. Bone Miner. Res. 2002, 17, 1219–1229. [Google Scholar] [CrossRef]
  58. Cutando, A.; Gómez-Moreno, G.; Arana, C.; Muñoz, F.; Lopez-Peña, M.; Stephenson, J.; Reiter, R.J. Melatoninstimulates osteointegration of dental implants. J. Pineal Res. 2008, 45, 174–179. [Google Scholar] [CrossRef]
  59. Tresguerres, I.F.; Clemente, C.; Blanco, L.; Khraisat, A.; Tamimi, F.; Tresguerres, J.A. Effects of Local Melatonin Application on Implant Osseointegration. Clin. Implant. Dent. Relat. Res. 2010, 14, 395–399. [Google Scholar] [CrossRef] [PubMed]
  60. López-Valverde, N.; Pardal-Peláez, B.; López-Valverde, A.; Ramírez, J. Role of Melatonin in Bone Remodeling around Titanium Dental Implants: Meta-Analysis. Coatings 2021, 11, 271. [Google Scholar] [CrossRef]
  61. Rupp, F.; Liang, L.; Geis-Gerstorfer, J.; Scheideler, L.; Hüttig, F. Surface characteristics of dental implants: A review. Dent. Mater. 2018, 34, 40–57. [Google Scholar] [CrossRef]
  62. Sultankulov, B.; Berillo, D.; Sultankulova, K.; Tokay, T.; Saparov, A. Progress in the development of chitosan-based biomaterials for tissue engineering and regenerative medicine. Biomolecules 2019, 9, 470. [Google Scholar] [CrossRef] [Green Version]
  63. Lu, X.; Yu, S.; Chen, G.; Zheng, W.; Peng, J.; Huang, X.; Chen, L. Insight into the roles of melatonin in bone tissue and bone-related diseases (Review). Int. J. Mol. Med. 2021, 47, 82. [Google Scholar] [CrossRef]
  64. Annunziata, M.; Guida, L. The Effect of Titanium Surface Modifications on Dental Implant Osseointegration. Craniofacial Sutures 2015, 17, 62–77. [Google Scholar] [CrossRef]
  65. Junker, R.; Dimakis, A.; Thoneick, M.; Jansen, J.A. Effects of implant surface coatings and composition on bone integration: A systematic review. Clin. Oral Implant. Res. 2009, 20, 185–206. [Google Scholar] [CrossRef] [PubMed]
  66. De Jonge, L.T.; Leeuwenburgh, S.; Wolke, J.G.C.; Jansen, J.A. Organic–Inorganic Surface Modifications for Titanium Implant Surfaces. Pharm. Res. 2008, 25, 2357–2369. [Google Scholar] [CrossRef] [Green Version]
  67. Shapurian, T.; Damoulis, P.D.; Reiser, G.M.; Griffin, T.J.; Rand, W.M. Quantitative evaluation of bone density using the Hounsfield index. Int. J. Oral Maxillofac. Implant. 2006, 21, 290–297. [Google Scholar]
  68. Di Stefano, D.A.; Arosio, P.; Pagnutti, S.; Vinci, R.; Gherlone, E. Distribution of Trabecular Bone Density in the Maxilla and Mandible. Implant Dent. 2019, 28, 340–348. [Google Scholar] [CrossRef]
  69. Molly, L. Bone density and primary stability in implant therapy. Clin. Oral Implant. Res. 2006, 17, 124–135. [Google Scholar] [CrossRef]
  70. Turkyilmaz, I.; Tozum, T.; Tumer, C. Bone density assessments of oral implant sites using computerized tomography. J. Oral Rehabil. 2007, 34, 267–272. [Google Scholar] [CrossRef]
  71. De Smet, E.; Jaecques, S.; Wevers, M.; Jansen, J.A.; Jacobs, R.; Sloten, J.V.; Naert, I.E. Effect of controlled early implant loading on bone healing and bone mass in guinea pigs, as assessed by micro-CT and histology. Eur. J. Oral Sci. 2006, 114, 232–242. [Google Scholar] [CrossRef]
  72. Barrett, J.F.; Keat, N. Artifacts in CT: Recognition and Avoidance. Radiographics 2004, 24, 1679–1691. [Google Scholar] [CrossRef]
  73. Rebaudi, A.; Koller, B.; Laib, A.; Trisi, P. Microcomputed tomographic analysis of the peri-implant bone. Int. J. Periodontics Restor. Dent. 2004, 24, 316–325. [Google Scholar]
  74. Stoppie, N.; Van Der Waerden, J.-P.; Jansen, J.A.; Duyck, J.; Wevers, M.; Naert, I.E. Validation of Microfocus Computed Tomography in the Evaluation of Bone Implant Specimens. Clin. Implant. Dent. Relat. Res. 2005, 7, 87–94. [Google Scholar] [CrossRef] [PubMed]
  75. Song, J.W.; Cha, J.Y.; Bechtold, T.E.; Park, Y.C. Influence of peri-implant artifacts on bone morphometric analysis with micro-computed tomography. Int. J. Oral Maxillofac. Implant. 2013, 28, 519–525. [Google Scholar] [CrossRef] [PubMed] [Green Version]
  76. Pearce, A.I.; Richards, R.; Milz, S.; Schneider, E.; Pearce, S.G. Animal models for implant biomaterial research in bone: A review. Eur. Cells Mater. 2007, 13, 1–10. [Google Scholar] [CrossRef] [PubMed]
Figure 1. (AD) Dental extractions and implant placement.
Coatings 11 00777 g001
Figure 2. Bone implant contact area (A) and regions of interest (ROIs, 1–7) (B).
Coatings 11 00777 g002
Figure 3. Example of coded BD values from the AMIDE program at 12 weeks after implant placement in transverse, sagittal, and coronal sections of P2, P3, P4, and M1: 250–400 HU (orange color); 400–500 HU (green color); 500–700 HU (pink color); 700–900 HU (yellow color); 900–1200 HU (red color). >850 HU, bone type 1; 500–850 HU, bone type 2/3; 0–500 HU, bone type 4 (according to Norton and Gamble [36]).
Coatings 11 00777 g003
Table 1. Description and comparison of BD measurements studied a in 336 sites b.
VariableChGMtGCGp-Global c
-Mean ± SDnMean ± SDnMean ± SD
All1120.35 ± 0.321120.33 ± 0.321120.37 ± 0.300.631
ROI’s (in levels)-------
Crestal [C]320.58 ± 0.20320.54 ± 0.13320.59 ± 0.140.438
Medial [M]640.38 ± 0.18640.35 ± 0.22640.38 ± 0.190.680
Apical [A]16−0.20 ± 0.3216−0.18 ± 0.3816−0.11 ± 0.330.723
p-global c-<0.001-<0.001-<0.001-
paired comparisons d-C ≠ M ≠ A-C ≠ M ≠ A-C ≠ M ≠ A-
Tooth type (position)-------
P2350.11 ± 0.34210.12 ± 0.35280.09 ± 0.31<0.001
P3280.11 ± 0.34350.08 ± 0.28210.12 ± 0.340.207
P4350.11 ± 0.33350.12 ± 0.34140.05 ± 0.220.963
M1140.05 ± 0.23210.07 ± 0.27490.08 ± 0.290.693
p-global c-0.003-0.004-0.582-
paired comparisons d-PM2 ≠ M1-PM2 ≠ PM3, M1---
a: The measuring device makes a sweep with multiple measurements. The median of all measurements is taken. b: Corresponding to 6 dogs × 8 teeth/dog × 7 sites/tooth (6 × 8 × 7 = 336). c: With procedure REGRESS in SUDAAN to account for clustering (multiple sites within teeth). d: With procedure DESCRIPT in SUDAAN, where “≠“ means p < 0.05.
Table 2. Multiple linear regression with BD as the dependent variable, in 336 sites a.
Variableβ ± se bp-Value c
Group-0.653
ChG0.00 ± 0.04
MtG−0.04 ± 0.04
CG0
ROIs (in levels)-<0.001
Crestal0.73 ± 0.04
Medial0.54 ± 0.04
Apical (reference)0
Tooth type (position)-0.032
P2−0.10 ± 0.04
P3−0.04 ± 0.05
P4−0.04 ± 0.05
M1 (reference)0
a: Corresponding to 6 dogs × 8 teeth/dog × 7 sites/tooth (6 × 8 × 7 = 336). b: se = standard error. c: With procedure REGRESS in SUDAAN to account for clustering (multiple sites within teeth).
Publisher’s Note: MDPI stays neutral with regard to jurisdictional claims in published maps and institutional affiliations.

