
Shape Characterizing of Aggregates Produced through Different Crushing Techniques


1
Department of Civil Engineering, The University of Lahore, Islamabad Campus, Islamabad 44000, Pakistan
2
Department of Civil and Environmental Engineering, University Technology PETRONAS, Bandar Seri Iskandar 32610, Perak, Malaysia
3
Department of Civil Engineering, University of Engineering and Technology Taxila, Rawalpindi 46000, Pakistan
*
Author to whom correspondence should be addressed.
Coatings 2021, 11(10), 1199; https://doi.org/10.3390/coatings11101199
Submission received: 23 July 2021
/
Revised: 29 August 2021
/
Accepted: 3 September 2021
/
Published: 30 September 2021
(This article belongs to the Collection Surface and Interface Science and Engineering for the Society of the Future)
Abstract
:The aggregate shape properties produced from the different crushing techniques influence the performance properties of the asphalt mixtures. The objective of this study was to classify the aggregates into spherical, flat, elongated and flat, and elongated shapes, collected from impact crusher and jaw crusher of two sources, and to calculate the shape parameters, such as aspect ratio, shape factor, form factor, sphericity, roundness, and angularity index. In addition, this study also investigated the effects of this classification on the Marshall stability and volumetric properties of asphalt mixtures prepared from the respective shape of aggregates. The results showed that the aggregate of different fractions (passing 37.5 mm and retained on 4.75 mm) produced from the jaw crusher of Margalla quarry showed better shape parameters. The spherical aggregates collected from all crushers showed 20–30% higher Marshall stability of the blends by improving the mechanical and volumetric properties of the asphalt mixtures.
1. Introduction
The pavement structures are designed and constructed to sustain the loading and provide adequate serviceability. The researchers focus on the different properties of asphalt and its modification to enhance the service life. The performance of the asphalt mixtures is focusing on the morphological properties of the aggregates. The quantification of aggregate shape parameters is quite important to achieve optimum performance by utilizing digital image processing techniques. The shape parameters control the flatness and elongation particles in the gradation of coarse aggregates. The particle index and angularity are essential indicators for the packing of aggregates [1]. The shape parameters indicate the fatigue behavior of the asphalt mixtures. The effect is increased as the thickness of the pavement structure is increased.
The thicker pavements showed the more reliable and long-life structure [2]. The flexural strength and Marshall stability of the asphalt mixture were increased through optimum angularity and sphericity. The pavements should be designed through the understanding of morphological properties of aggregates and digital image processing approach to achieve better performance [3]. The three-dimensional angularity can be utilized to characterize the angularity of aggregates, and it has a significant effect on the packing skeleton of the aggregate mixture [4]. The higher percentage of flat and elongated aggregate particles showed weak compaction during the lab testing. There is a need to indicate the special attention for these flatter particles in the gradations to achieve better performance [5].
The optimum mechanical properties of the aggregate particles can be achieved through shape parameters calculated by digital image processing [6]. Digital image processing is the latest technique to measure the shape parameter with the highest precision grain to grain aggregate particles. It is useful to calculate the morphological properties of the fine and coarse aggregates to design the optimal asphalt mixtures [7]. The cubical shape aggregates with angular and rough edges indicated higher mechanical properties of the asphalt mixture. The shape parameters calculated through the morphological properties are essential to link for practical application in the industry [8].
Aggregates are the primary materials utilized to construct the pavement structure. Therefore, the performance of the asphaltic pavement depends mainly on the properties of the aggregate materials. Careful selection of these materials following defined standards increases the probability of pavements performance during design life and decelerates early deterioration [9]. Mineral aggregates utilized in highway pavement construction resist the significant stresses developed in the pavement structure due to vehicle loading. The aggregates used in the structures withstand the wear and tear due to abrasion that may arise due to the combined effect of traffic and climatic changes. These properties of aggregates mainly rely on their source properties and the type of crushing techniques. Aggregates are subjected to mechanical, physical and chemical tests in the laboratory to adequately meet the specifications required in the field [10]. The global information system (GIS) procedure quantifies grain boundaries with a database, such as shape, orientation, and spatial distribution. It is integrated into a GIS model using ArcGIS ModelBuilder to conduct the complete analysis of images taken from the sandstone samples. The results indicated that it identifies greater than 70% of grains for analysis [11].
The results showed a significant effect of morphological characteristics on the resilient modulus of the asphalt mixture. The shape and texture had also indicated a strong correlation with the gradation’s sizes of aggregates [12]. The aggregate particle obtained through two-stage crushing indicated better results in the asphalt mixture [13]. It was identified that the aggregates produced from these crushing methods require review for basic characterization, design, and construction practices. In addition, a revised characterization may lead to reduce energy consumption for optimal crusher design and operational strategy. Crushing processes can put up a few alterations to match the petition for each gradation. A ‘Crusher’ is a machine that principally intends to reduce large fragments into reduced pieces through mechanical action. The raw material from mountain or aggregate sources is treated initially in primary crushers. The involvement of such crushers is comparatively extensive, and the yield products are coarser in size. The petrographic properties of sandstones using the geoinformation system software affect the energy storage and environmental applications in the concrete. The results indicated that concrete compressive strength increased from 25 to 32 MPa, decreasing the grain size. This sandstone presented suitable for the storage of CO2 through physio-mechanical properties to indicate the potential energy [14].
The typical examples are Jaw Crusher (JC), Gyratory Crusher (GC), and Impact Crushers (IC). The abrasive sort or JC is usually selected for breaking the hard strata quarries, where aggregates are broken under a compressive force. Furthermore, the crushing of aggregates can also produce cubical particles. An IC can be utilized as a secondary crusher for rigid rocks through impact forces with a fast-moving motor. In the production process, the provender rock fragments strike the gyrating static blow bars and then strike with breaking plates to result in better cubical aggregates. This crusher type provides a varied size of particles with higher material strength, but higher energy is mandatory from top to bottom through the crushing process [13]. Likewise, Ozturk [15] stated the mechanical outcomes of the concrete mix, such as strength and flow, are calculated by means of stones wrinkled by two kinds of crushers. A variety of mixes have been prepared through aggregates manufactured by vertically shafted (VS) and IC. Furthermore, the measurement of overall shape entails (the three dimensions of a particle) was also calculated. Guimaraes [16] described the extensive scrutiny and lab trials to discover the role of mineralogy and breaking process in making fines by crushing coarse particles along with inside material. The outcomes from this process describe the failure loading conditions of particles, overall shape, and the number of fine particles. Bessa [17] presented the analysis of aggregate shape properties on the performance of the asphalt mixtures. The aggregates particles from different sources may have similar shape properties. However, the aggregates’ shape properties are indicated to improve the mechanical strength of the asphalt mixtures. The different type of nano-silica and palm oil were utilized to enhance the performance of the asphalt mixture and reclaimed asphalt pavements [18,19]. Leon and Gay [20] compared the fine aggregates’ shape properties through conventional and digital image processing techniques. It was concluded that such methodology could be applied to detect the more accurate shape properties, and it is more suitable for the shape characterization of aggregate particles.
The shape characterization is accomplished after the production and sieve analysis of aggregates by measuring particles’ flakiness, elongation, and angularity. The techniques for their measurement have been elaborated in BS Standards [21] for the flakiness index, and elongation index. Roberts, Kandhal [22] stated that shape characteristics of aggregates influence the performance of each pavement layer. Mangulkar and Jamkar [23] presented the development of a digital image processing (DIP) scheme to quantify the sphericity, shape factor, elongation ratio, and flatness ratio of coarse aggregate particles. The system is standardized using ordinary objects such as marble and coins, and eventually utilized for different size of coarse aggregates having diverse characteristics. Masad and Sivakumar [24] explained the physical appearance of rock fragments that may be judged visually or by touching the particles. Visually, aggregates are categorized as equidimensional, flat, or elongated. Arason, Hasiloglu [25] defined the three different scales for relating the particle shape for recognition. First-order descriptors, such as sphericity and elongation, describe aggregate shape at the large particle scale. Second-order descriptors, roundness, and angularity are used at the intermediate particle scale. Finally, roughness and smoothness are used at the small particle scale. Polat, Yadollahi [26] used a simple setup with a 2-D image capturing technique. The images were captured with a digital camera from the top view and analyzed on software in this method. However, with advancements in digital technology, there have been simplifications in procedures to explore the aggregate morphological properties.
Different researchers used various shape indices to designate the shape characteristics and ultimately define the shape indices. Barksdale, Kemp [27] expressed flatness as the ratio of thickness to width and elongation as the ratio of width to length. Researchers have determined shape factors and sphericity with various explanations. Mitchell and Soga [28] and Arasan, Hasiloglu [29] recognized the three different scales for relating the particle shapes. Moreover, Bish, Blake [30] performed a comparative study to show the same shape description quantities defined by various researchers. The current work focuses on aspect ratio, shape factor, form factor, sphericity, roundness, and angularity index of the examined aggregates. The aspect ratio is among the indices measured for any regularly shaped object. It is calculated by taking the dimension of the largest axis to the middle axis of the object (aggregate particle). The average value varies from zero to unity depending upon the shape of the object, such as longest to equiaxed. The shape factor is the value that affects the object’s shape but is autonomous of its dimensions. It is principally compactness quantification of stone particles. The form factor equates the perimeter of a similar circle to the perimeter of the object; alike circle has a similar area as the object. Since angularity and texture affect the perimeter of an object, the form factor is influenced by particle form and reflects angularity as well as texture. The sphericity is amid the indices that have been anticipated for determining the form in relationships of the three dimensions. This shape index has a minimum value of 1 for a circle and larger values for shapes with a higher perimeter ratio (P) to the area (A), longer or thinner shapes, or objects having rough edges. The variation at corners of aggregate particles is an important parameter presented in terms of angularity index. The deviations at particle edges depend on the type of mineral rock along with the crushing technique. This parameter also provides significant worth in terms of load-bearing and packing of aggregates [31].
The interaction of tires and pavements produces noise that is a source of environmental pollution. The application of thin emulsion mat micro-surfacing through cold laydown technology on the asphaltic layers reduces the noise on the surface of the pavement [32]. The effect of water to detect the noise on porous and dense asphalt surfaces on flexible pavement was investigated. The heavy and light traffic incorporated on wet and dry surfaces to assess the noise through Statistical Pass-By Method. The results indicated that noise level increases with the presence of water by shifting it up to 4 dB(A) and has a null effect on porous asphalt for heavy traffic [33]. This study focuses on the application of polyolefin-aramid fibers and hydrated lime to enhance the mechanical performance of porous asphalt mixtures. The fiber, binder content, filler type, air voids in dry and wet conditions were assessed to determine the optimal solution level. In the second phase of the research, decision-making techniques such as inter-criteria correlation were used to transform the multiple responses into a single optimized response. In order to detect a preference among all mixture designs, a preference ranking model was developed. The significant levels were detected 0.05% and 5.0% for fiber and binder content, respectively, for optimum response [34]. The aggregate particles selected from the quarries depending upon the petrographic properties. The aggregate collected from the quarries is basic in nature, with dominant limestone compositions with less sandstone quantity. The percentage of minerals in the aggregate quarries and petrographic analysis was carried out [35]. The results indicated that waste plastics with aggregates from different quarries in the asphalt mixtures could be utilized to enhance the performance. Furthermore, a systematic study was also conducted to use oil shale ash as a cementitious material in the industry [36].
The researchers established different mathematical relations to demonstrate the physical geometry of aggregate particles based on data acquisition techniques such as two-dimensional static, video graders, three-dimensional static, and dynamic video methods. A method was established to investigate the morphological characteristics of coarse aggregate by a three-dimensional image analysis process [37]. It was found that the technique was capable of measuring flatness and elongation ratios of aggregates. Fletcher, Chandan [38] also employed the Aggregate Imaging System (AIMS) that operates based on two modules. Masad and Sivakumar [24] used a simple setup with a 2-D image capturing technique. It also concluded that the shape parameters affect the mechanical properties of the asphalt mixtures. With enormous technological growth worldwide, digital image analysis technology has become an effective tool to efficiently quantify the major aggregate shape, texture, and other parameters [39]. These parameters are either for the form or aggregate angularity. However, efficient identification of encountered errors can easily occur and develop a solution to this countered problem. The performance of concrete with reference to aggregate shape properties (i.e., calculated via image analysis), aggregate geology and design parameters was evaluated. It has been comprehensively studied that the devised correlations between the effective form parameters of aggregates.
Jaya, Hassan [40] adopted to detect the aggregate shape and texture on the strength of the concrete through image analysis. The aggregate particle with higher circularity and aspect ratio indicated the higher strength of concrete. Rajan and Singh [41] compared the fine aggregates’ shape properties through conventional and digital image processing techniques. It was concluded that this technique could be applied to detect the more accurate shape properties, and it is more suitable for the shape characterization of aggregate particles. Stempkowska, Gawenda [39] utilized computer tomography to detect the internal structure of the concrete mixes. It was concluded that the arrangement and shape of the aggregates have a significant impact on the performance of the hardened concrete. Li, Guo [42] presented that shape factor can be utilized to characterize the needle-flake shape and ellipsoid index to gauge the angularity of the aggregate particles. These parameters also indicate the overall roughness of the particles that provide the packing and adhesion of the mixture. However, the different sizes and effects of crushing technique were not considered.
This research study focused on utilizing the image processing technique for measuring shape parameters such as aspect ratio, shape factor, form factor, sphericity, roundness, and angularity index of aggregate particle sizes from 37.5 mm (Passing) to 4.75 mm (Retaining), along with the effect of crusher type on the shape parameters. In addition, this research article investigates the effect of aggregate shapes on the volumetric properties and Marshall stability to detect the performance of the asphalt mixtures.
2. Materials and Methods
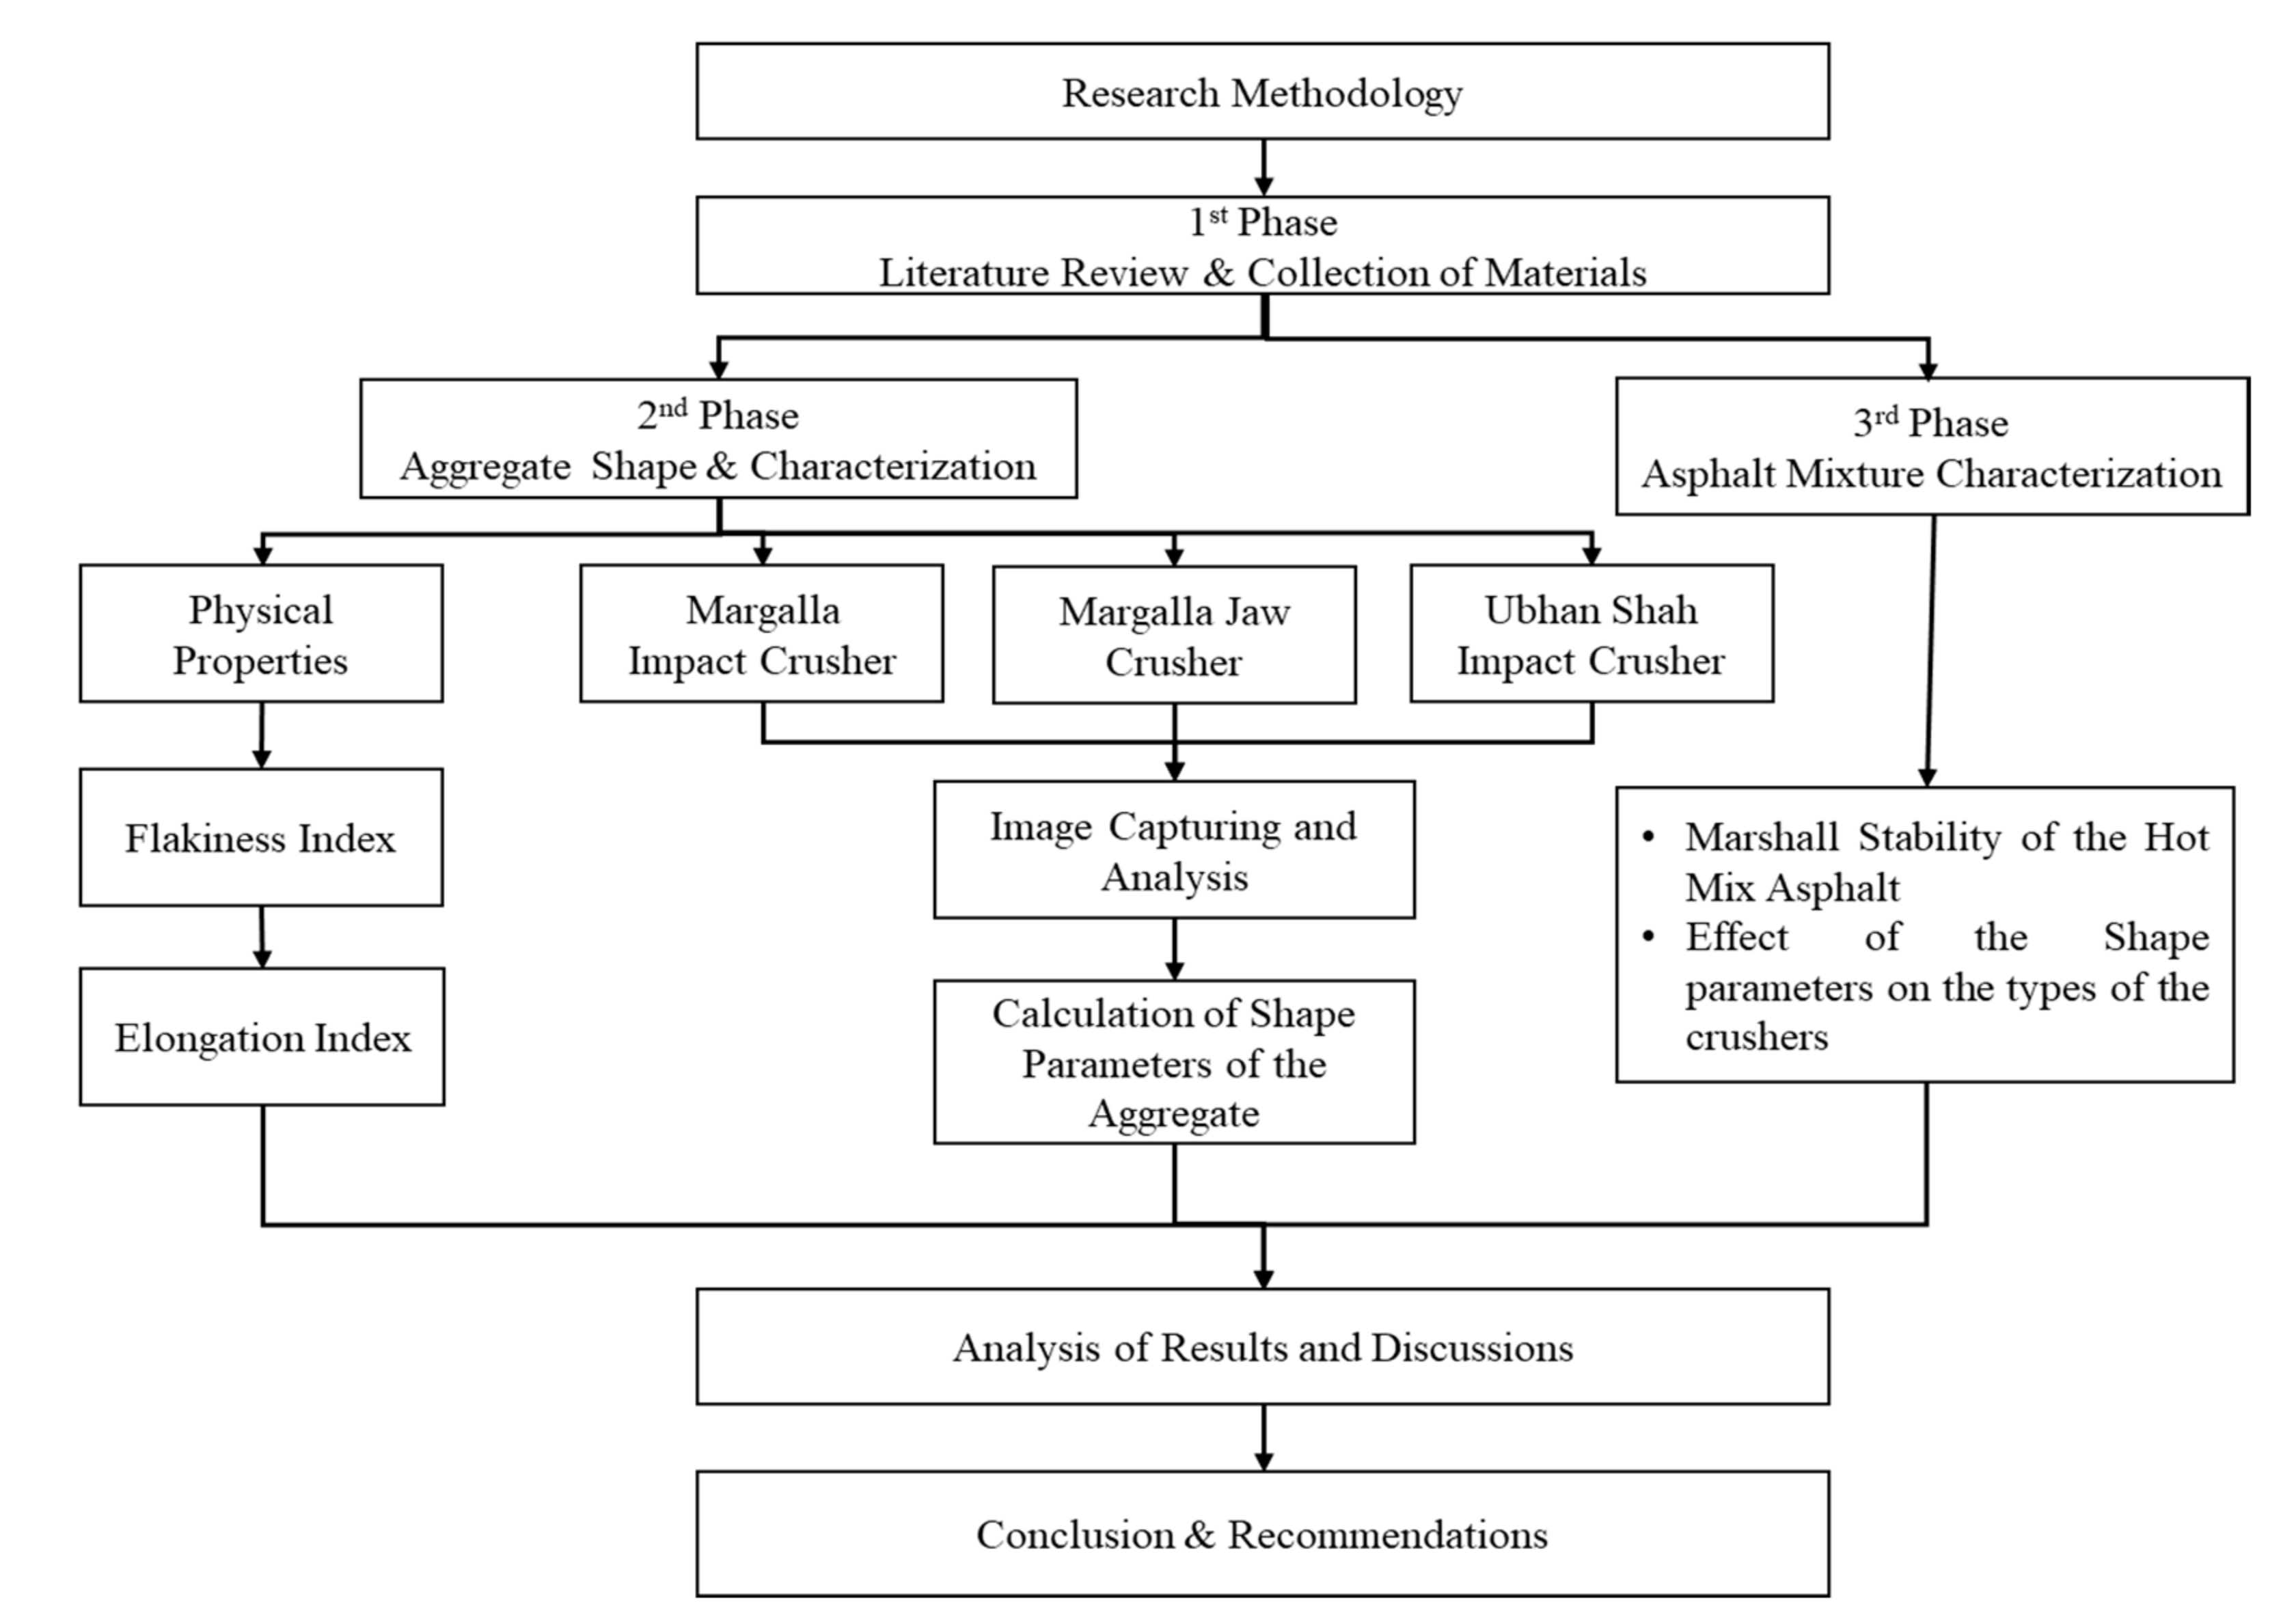
A three-phased study was conducted to ascertain the research objectives. In phase-I, the relevant literature was explored, and samples of aggregates were collected with a quantity of two bags from each crusher. The aggregate particles were collected from two quarries or sources, i.e., Margalla and Ubhan Shah. The Margalla quarry has two types of crushers, such as IC and JC, while Ubhan Shan has only IC. The three types of aggregate particles were collected and analyzed according to the crushing technique, and each crush quarry has a different rock type. The mass of each fraction taken from the respective crusher type is given in Table 1. Images were captured for all aggregate particles in a mass of each fraction. The proportion between the particles with different shapes such as spherical, flat, elongated and flat, and elongated from each sieve fraction were calculated and given in Table 2.
In phase-II, basic properties of aggregates like flakiness index, elongation index, specific gravity, water absorption, and Los Angeles Abrasion Tests were performed in the laboratory. The flakiness index and shape index of aggregate particles were measured according to BS EN 933-3:2012 and BS EN 933-4:2012. The aggregate particles of each crusher discarded that were passed from a 4 mm sieve and retained on a 100 mm sieve size. The recommended sizes were passing from 100 mm sieve and retained on the 4 mm sieve. All intermediate sieves were also utilized. Furthermore, the aggregate particles were classified into spherical, flat, elongated and flat and elongated, according to Seracettin [29]. The three dimensions such as longest, shortest, and intermediate values measured for each particle. The shortest to intermediate ratio is called the flatness ratio, and the intermediate to longest ratio is called the elongation ratio. As the flatness ratio is increased from 2/3 value on the x-axis, the aggregate particle is called elongated. When the elongation ratio increases from the 2/3 value on the y-axis, it is called a flat particle. It is called the spherical when the values are greater than 2/3 on both axis and flat and elongated when lesser than 2/3. This was followed by capturing the top and front view images and processing the digital images of aggregate particles. The digital image analysis was performed to obtain shape parameters for calculating elongation ratio, flatness ratio, aspect ratio, shape factor, form factor, sphericity, roundness, and angularity index of the aggregates. In phase III, an asphalt mixture was prepared to detect the Marshall stability and flow of different blends of the aggregates. The Marshall stability and flow test were conducted to measure the resistance of the plastic flow of cylindrical specimen of the asphalt mixtures of mix, spherical, flat, elongated and flat and elongated aggregates according to AASHTO T 245. Then, 1200 gm of aggregates for each shape were taken and heated at the specified temperature. The asphalt binder of 60/70 penetration grade with percentages of (3.5, 4.0, 4.5, 5.0, 5.5 and 6.0%) from Attock Oil Refinery was utilized for bituminous mixtures. The binder was heated to a temperature of 120 to 138 °C, and the required amount was added to heated aggregates and thoroughly mixed. Total 18 samples of size 101.6 mm diameter and 63.5 mm height for each mix were prepared (15 samples for stability and flow and 3 for maximum theoretical specific gravity of loose mixes). The gradation curve for the bituminous mixtures is described in Table 3. The stepwise flow chart of the research methodology has been shown in Figure 1.
2.1. Image Capturing System
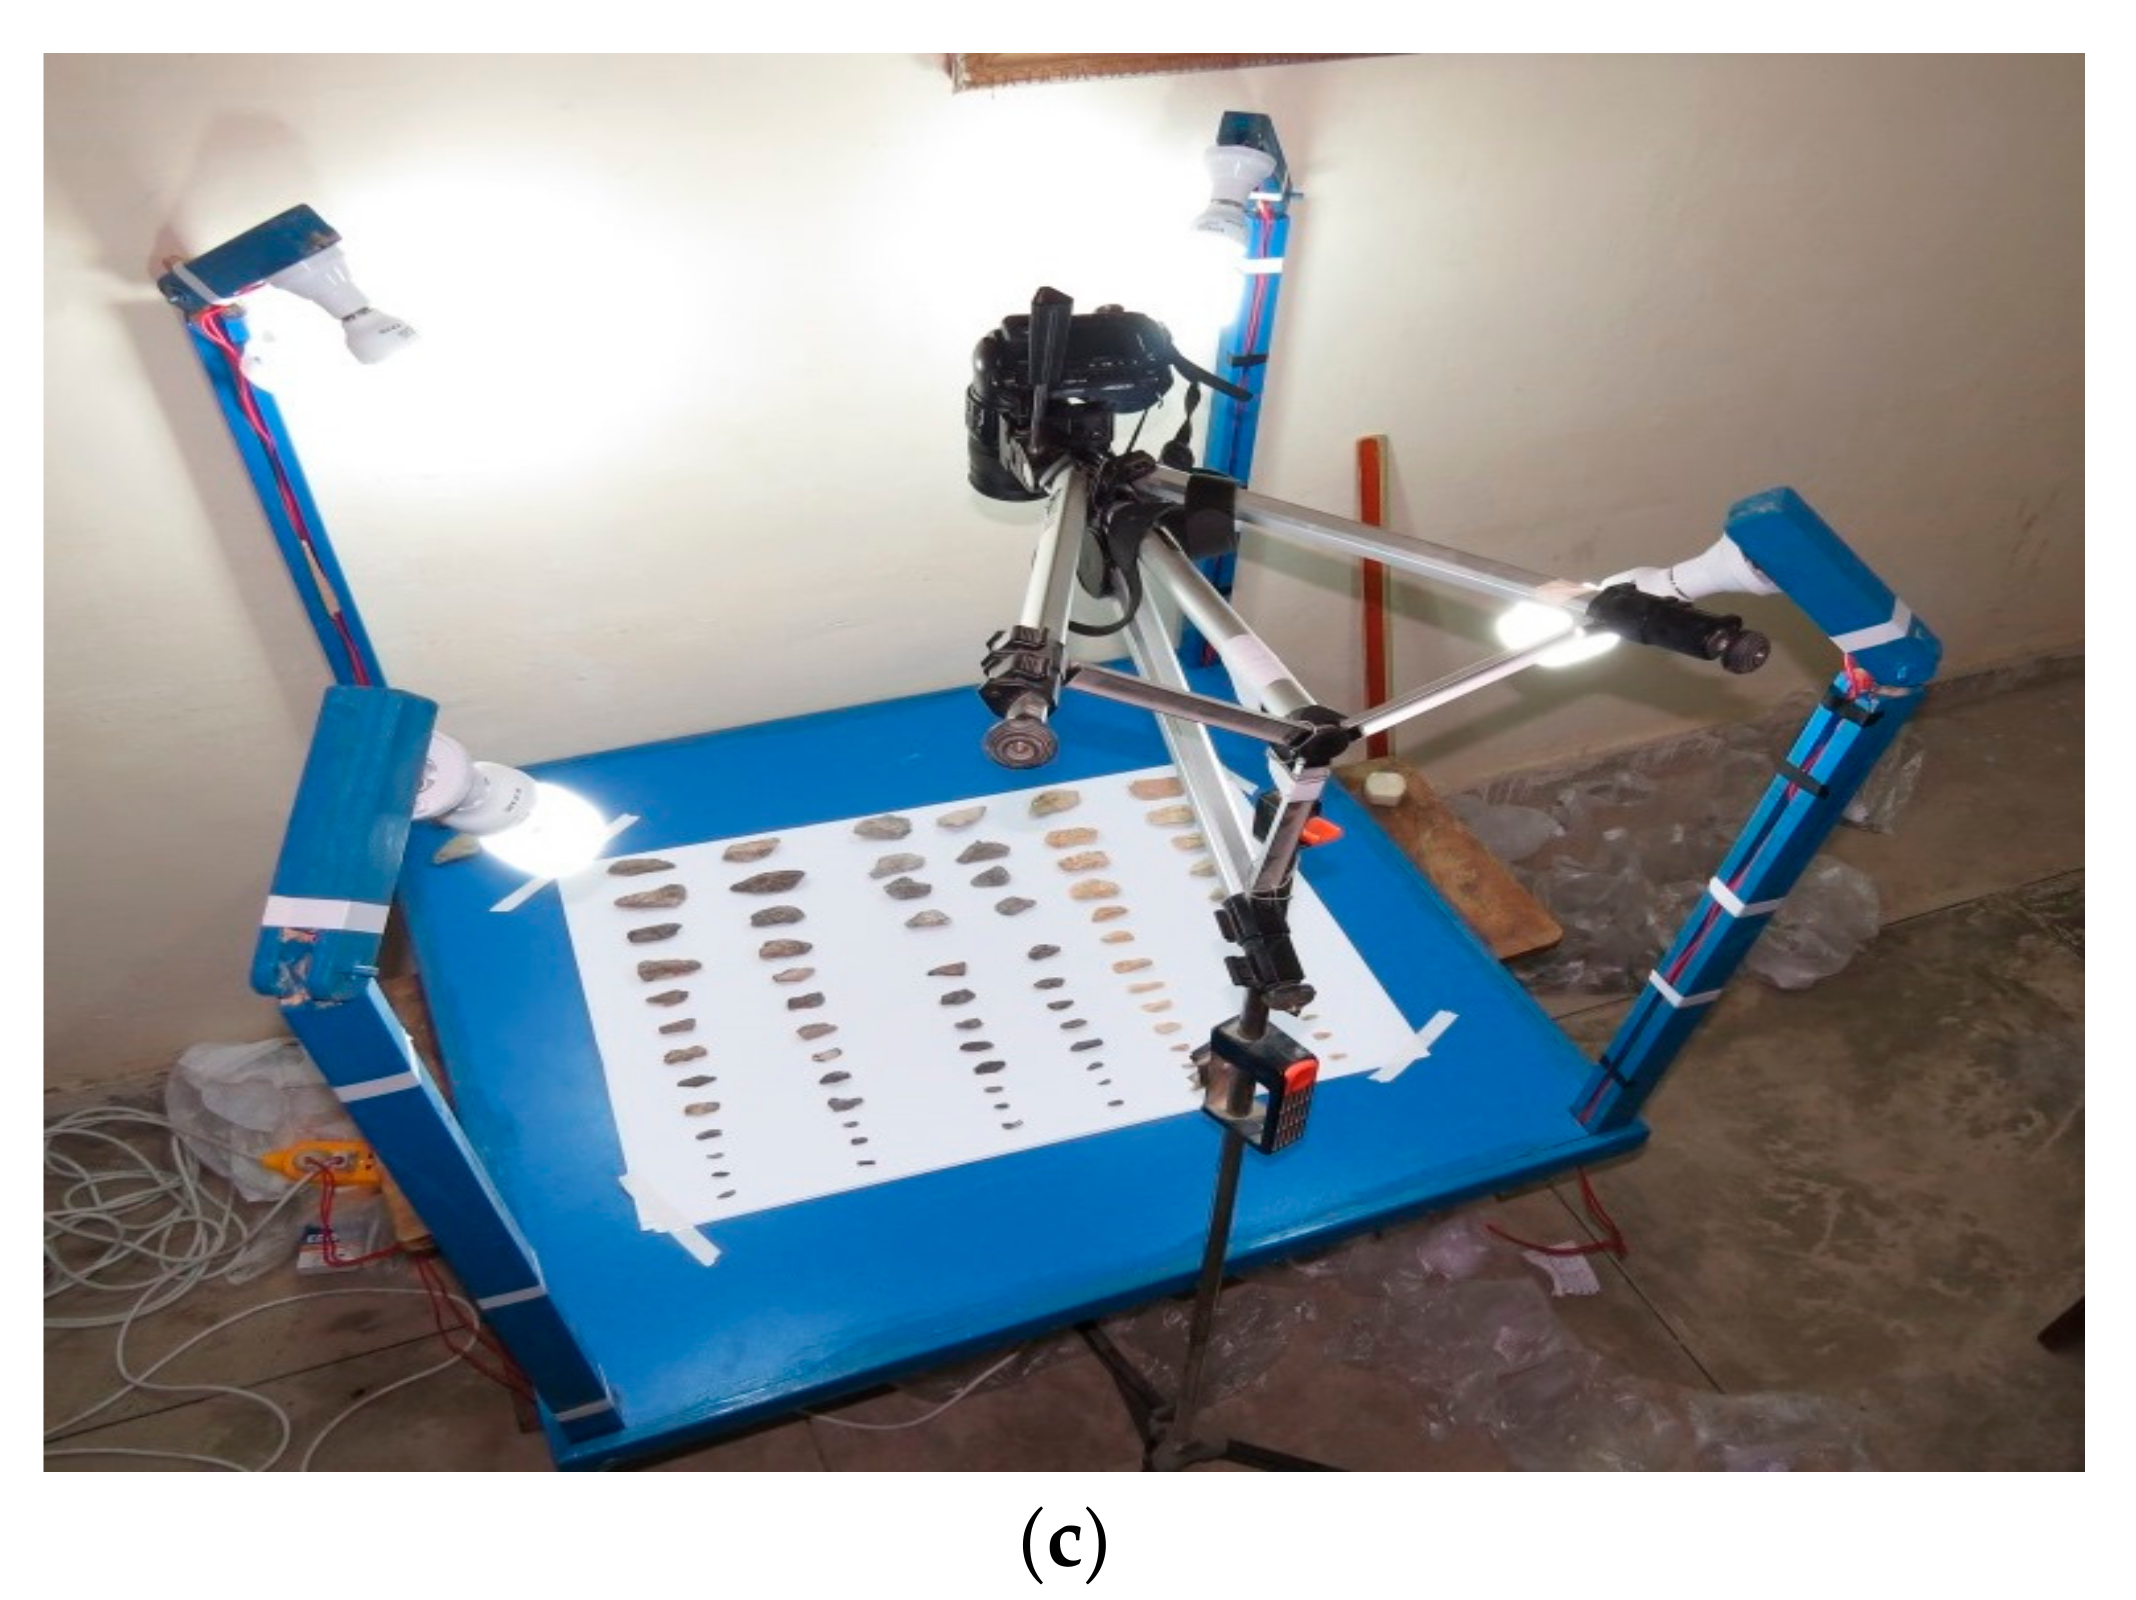
The digital image processing system utilized by the authors consists of a Canon SX50-HS camera (Tokyo, Japan) and schematic setup, as shown in Figure 2c. The images of the aggregate particles were captured by mounting a camera on a photographic stand by adjusting the height. Initially, images were captured from the top (top view images) of aggregate particles. After, the photographic camera was rotated 90° so that the aggregate particles were perpendicular to the initial orientation, and the next images were captured and measured (front view images). The distinct color sheets were used in background for shadowless image capturing. By comparing the results of several color sheets, it was concluded that the white drawing sheet showed better results. In this research, particles were arranged a wide apart from each other to take an individual image and reduce the processing work. Figure 2a,b show the 3-D views of a rectangular box of a solid shape indicating the front and top views utilized [29]. In this study, aggregates were arranged in a stable position, and two images from the top view (longest axis of the aggregates) and front view (shortest axis of aggregates) were captured to calculate the short, intermediate and long dimensions of each particle. The position of each particle was not changed during the capturing of images. The image capturing working is shown in Figure 2c.
The three dimensions or axis, such as longest, shortest, and intermediate axis values, are measured for each particle. The three axes of aggregate particles follow the 3-D dimensions of a rectangle as described in the literature [25]. There are three dimensions, i.e., as longest (length), intermediate (width) and shortest axis (thickness) of each particle. The aggregates were arranged in a stable position, and two images from the top view (for longest and intermediate axis) and front view (shortest axis) were captured to calculate these dimensions. Both images were imported in the Image-J software, and three dimensions were computed by processing them. The details of the image capturing system are presented in Figure 2 step by step in Section 2.1. The image processing and analysis is described in Section 2.2 and Figure 3.
2.2. Image Processing and Analysis
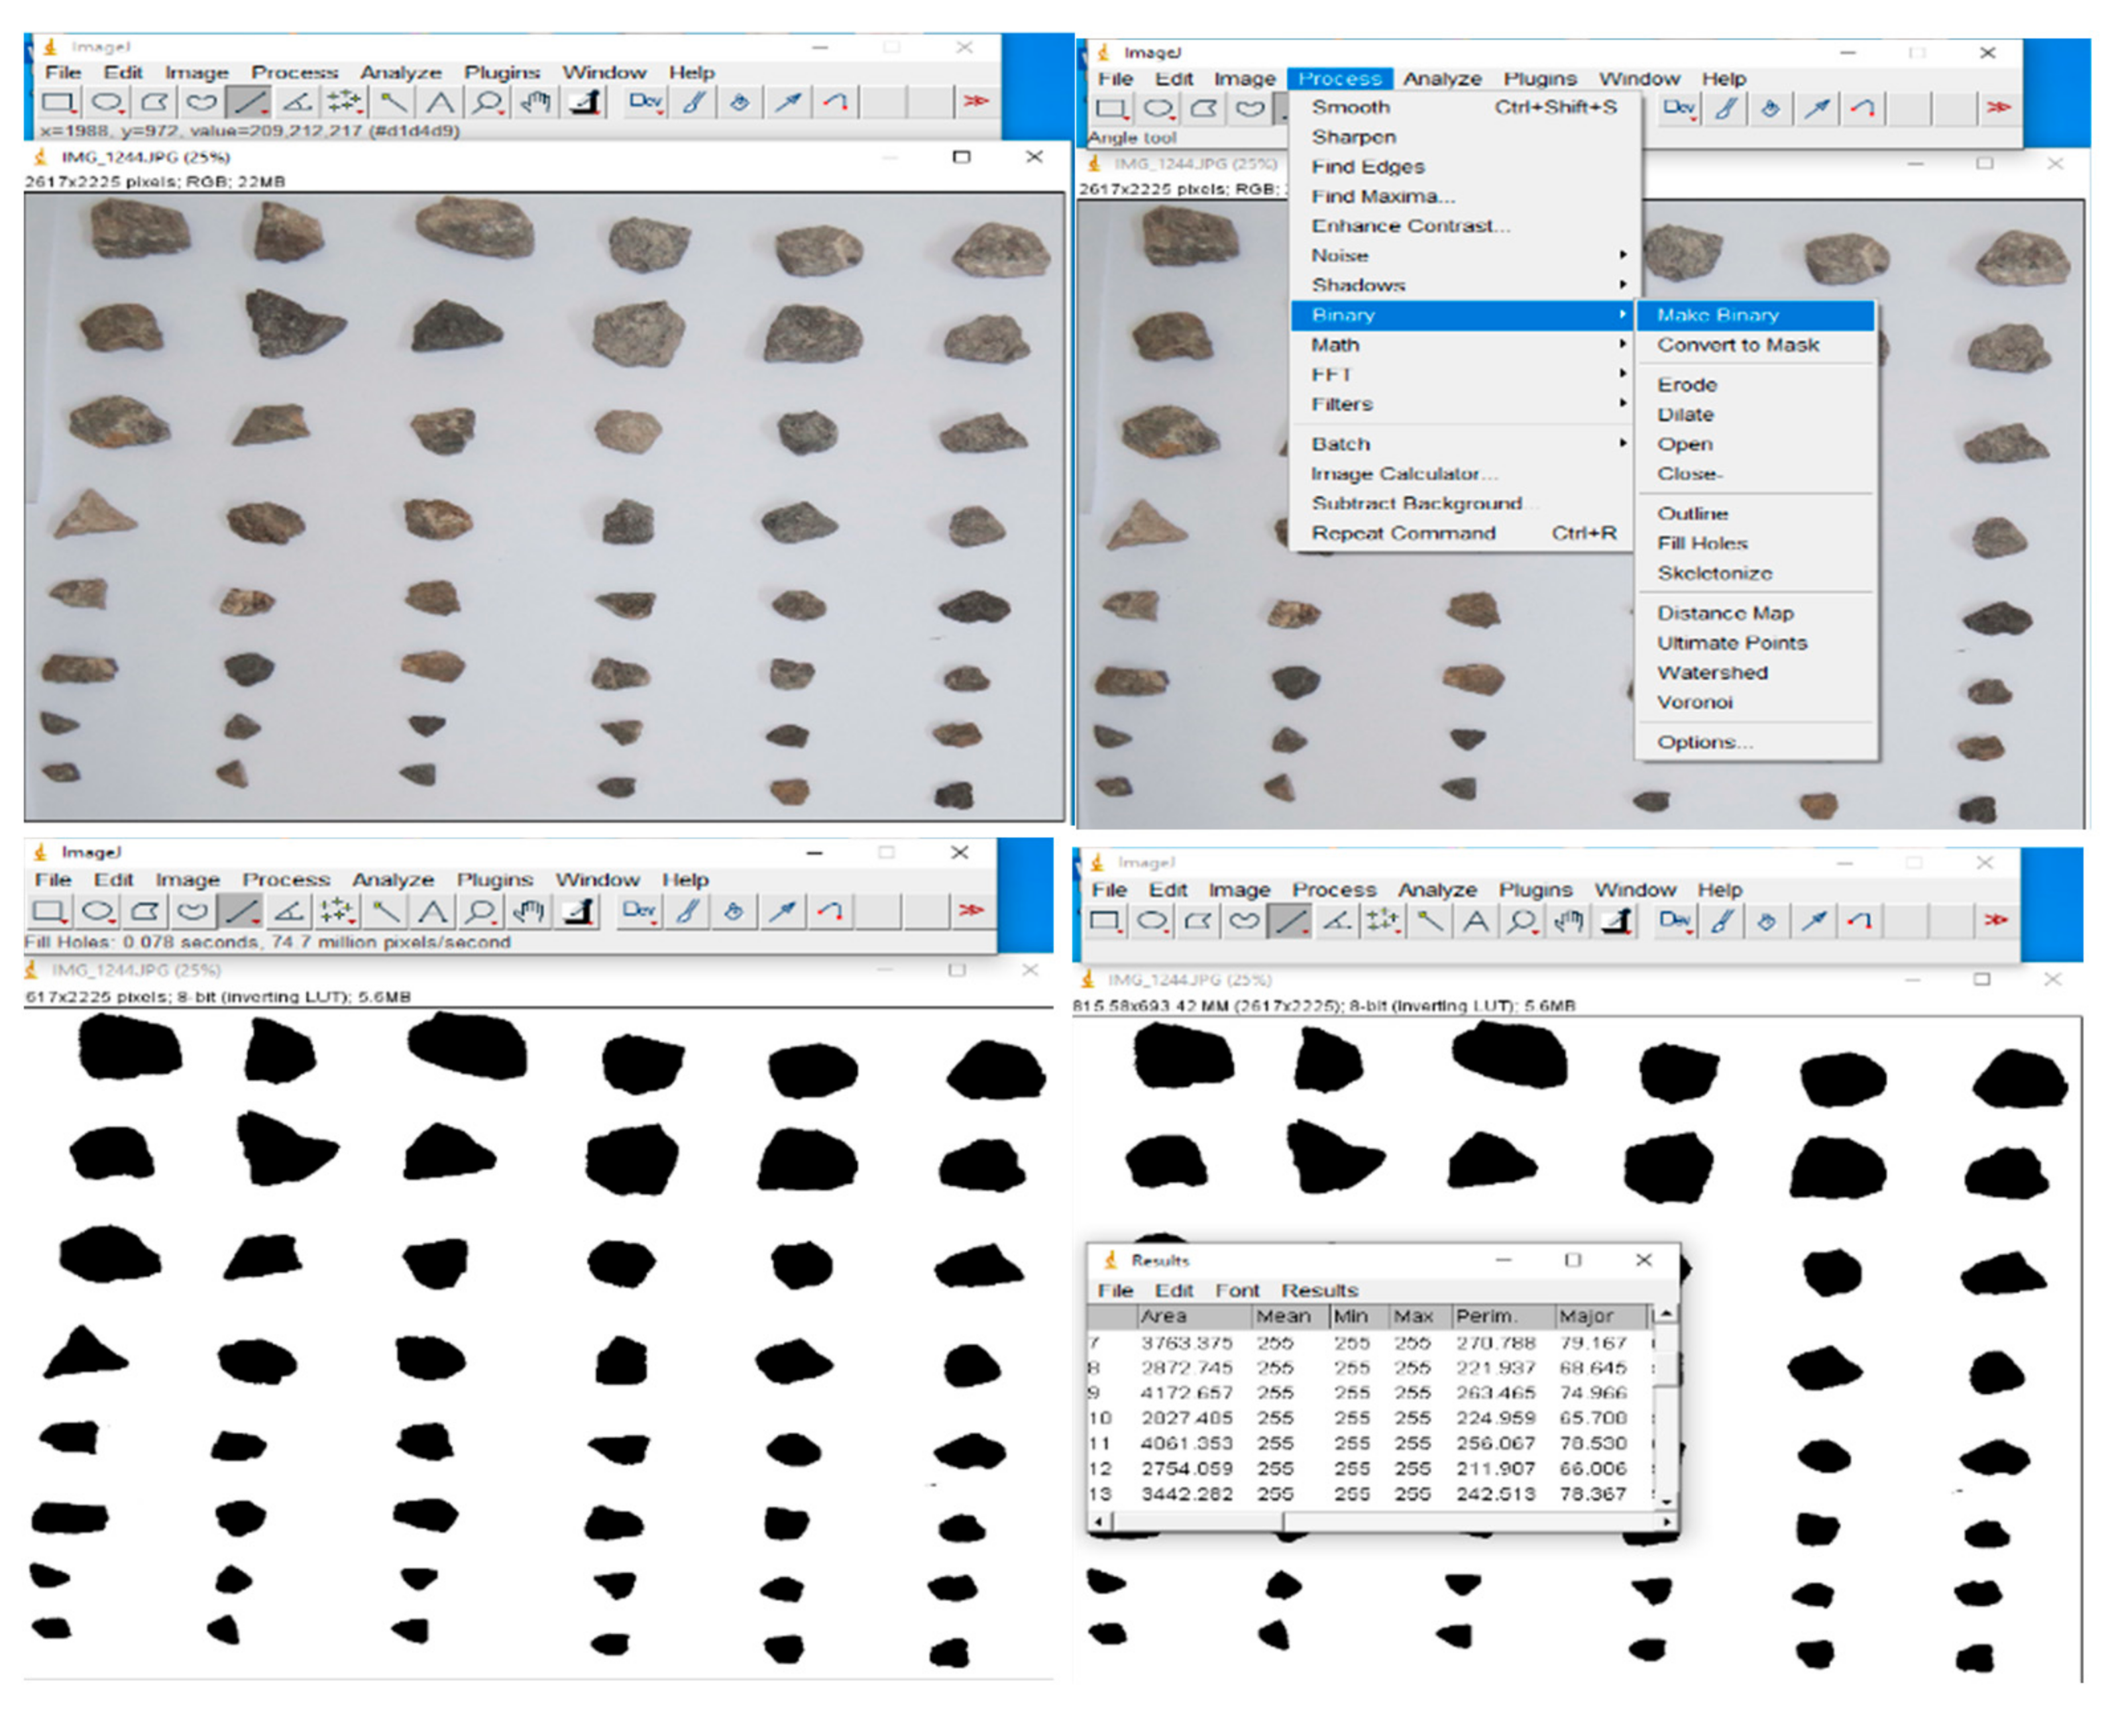
Various software are available for image processing and analysis, such as Image-J (version 1.8.0-172 ), Mat-Lab (version R2015b), Image-Pro (version 6.3), and Aggregate Image Analysis System (AIMS, version-2). Each software has its pros and cons due to data processing and costs limitations, such as AIMS being costly due to the acquisition of apparatus and necessary accessories. Other software has a lengthy process to extract the data. With the utilization of current technology, the outcomes, impassive from human partisanship, have the probability to be much more dependable. The chance of variation for result finding is minimized to a large extent. Due to the digital testing setup, a significant number of tests will be executed. With quicker practising and a low rate of incremental tests, it provides a better and more statistically effective description. During aggregate manufacturing, several steps such as crushing, screening, and separating the size fractions are quickly analyzed. The whole procedure depends on technology, so there are fewer burdens on the users. Few drawbacks such as, at initial the overall price for enquiring setup would be more significant. Intrinsic slight changes in dimensions outcomes can be probable because of the differences between imaging and physical analysis procedures. Industry along with monitoring conflict can be anticipated for any latest knowhow that does not contribute precisely to nearby outcomes “older” labor-intensive quantities, even if the “older” amounts are fewer correct. In the present research, the image analysis was carried out in Image-J software due to sharp data processing and numerical values extraction as well as being freely available for working. It can read many image formats, including TIFF, GIF, JPEG, BMP, DICOM and FITS. The JPEG image format was used by importing in the software. The analysis can calculate area, perimeter, all axis, and centroid along with pixel value statistics as per user-defined selections. The original images were converted into binary images that have black objects over the white background during analysis. These images are critical to making some processes like Erode, Dilate, Open, Close, Fill Holes, Watershed, etc. [43]. The step wise images are added for data processing in each step to calculate the shape parameters in Figure 3.
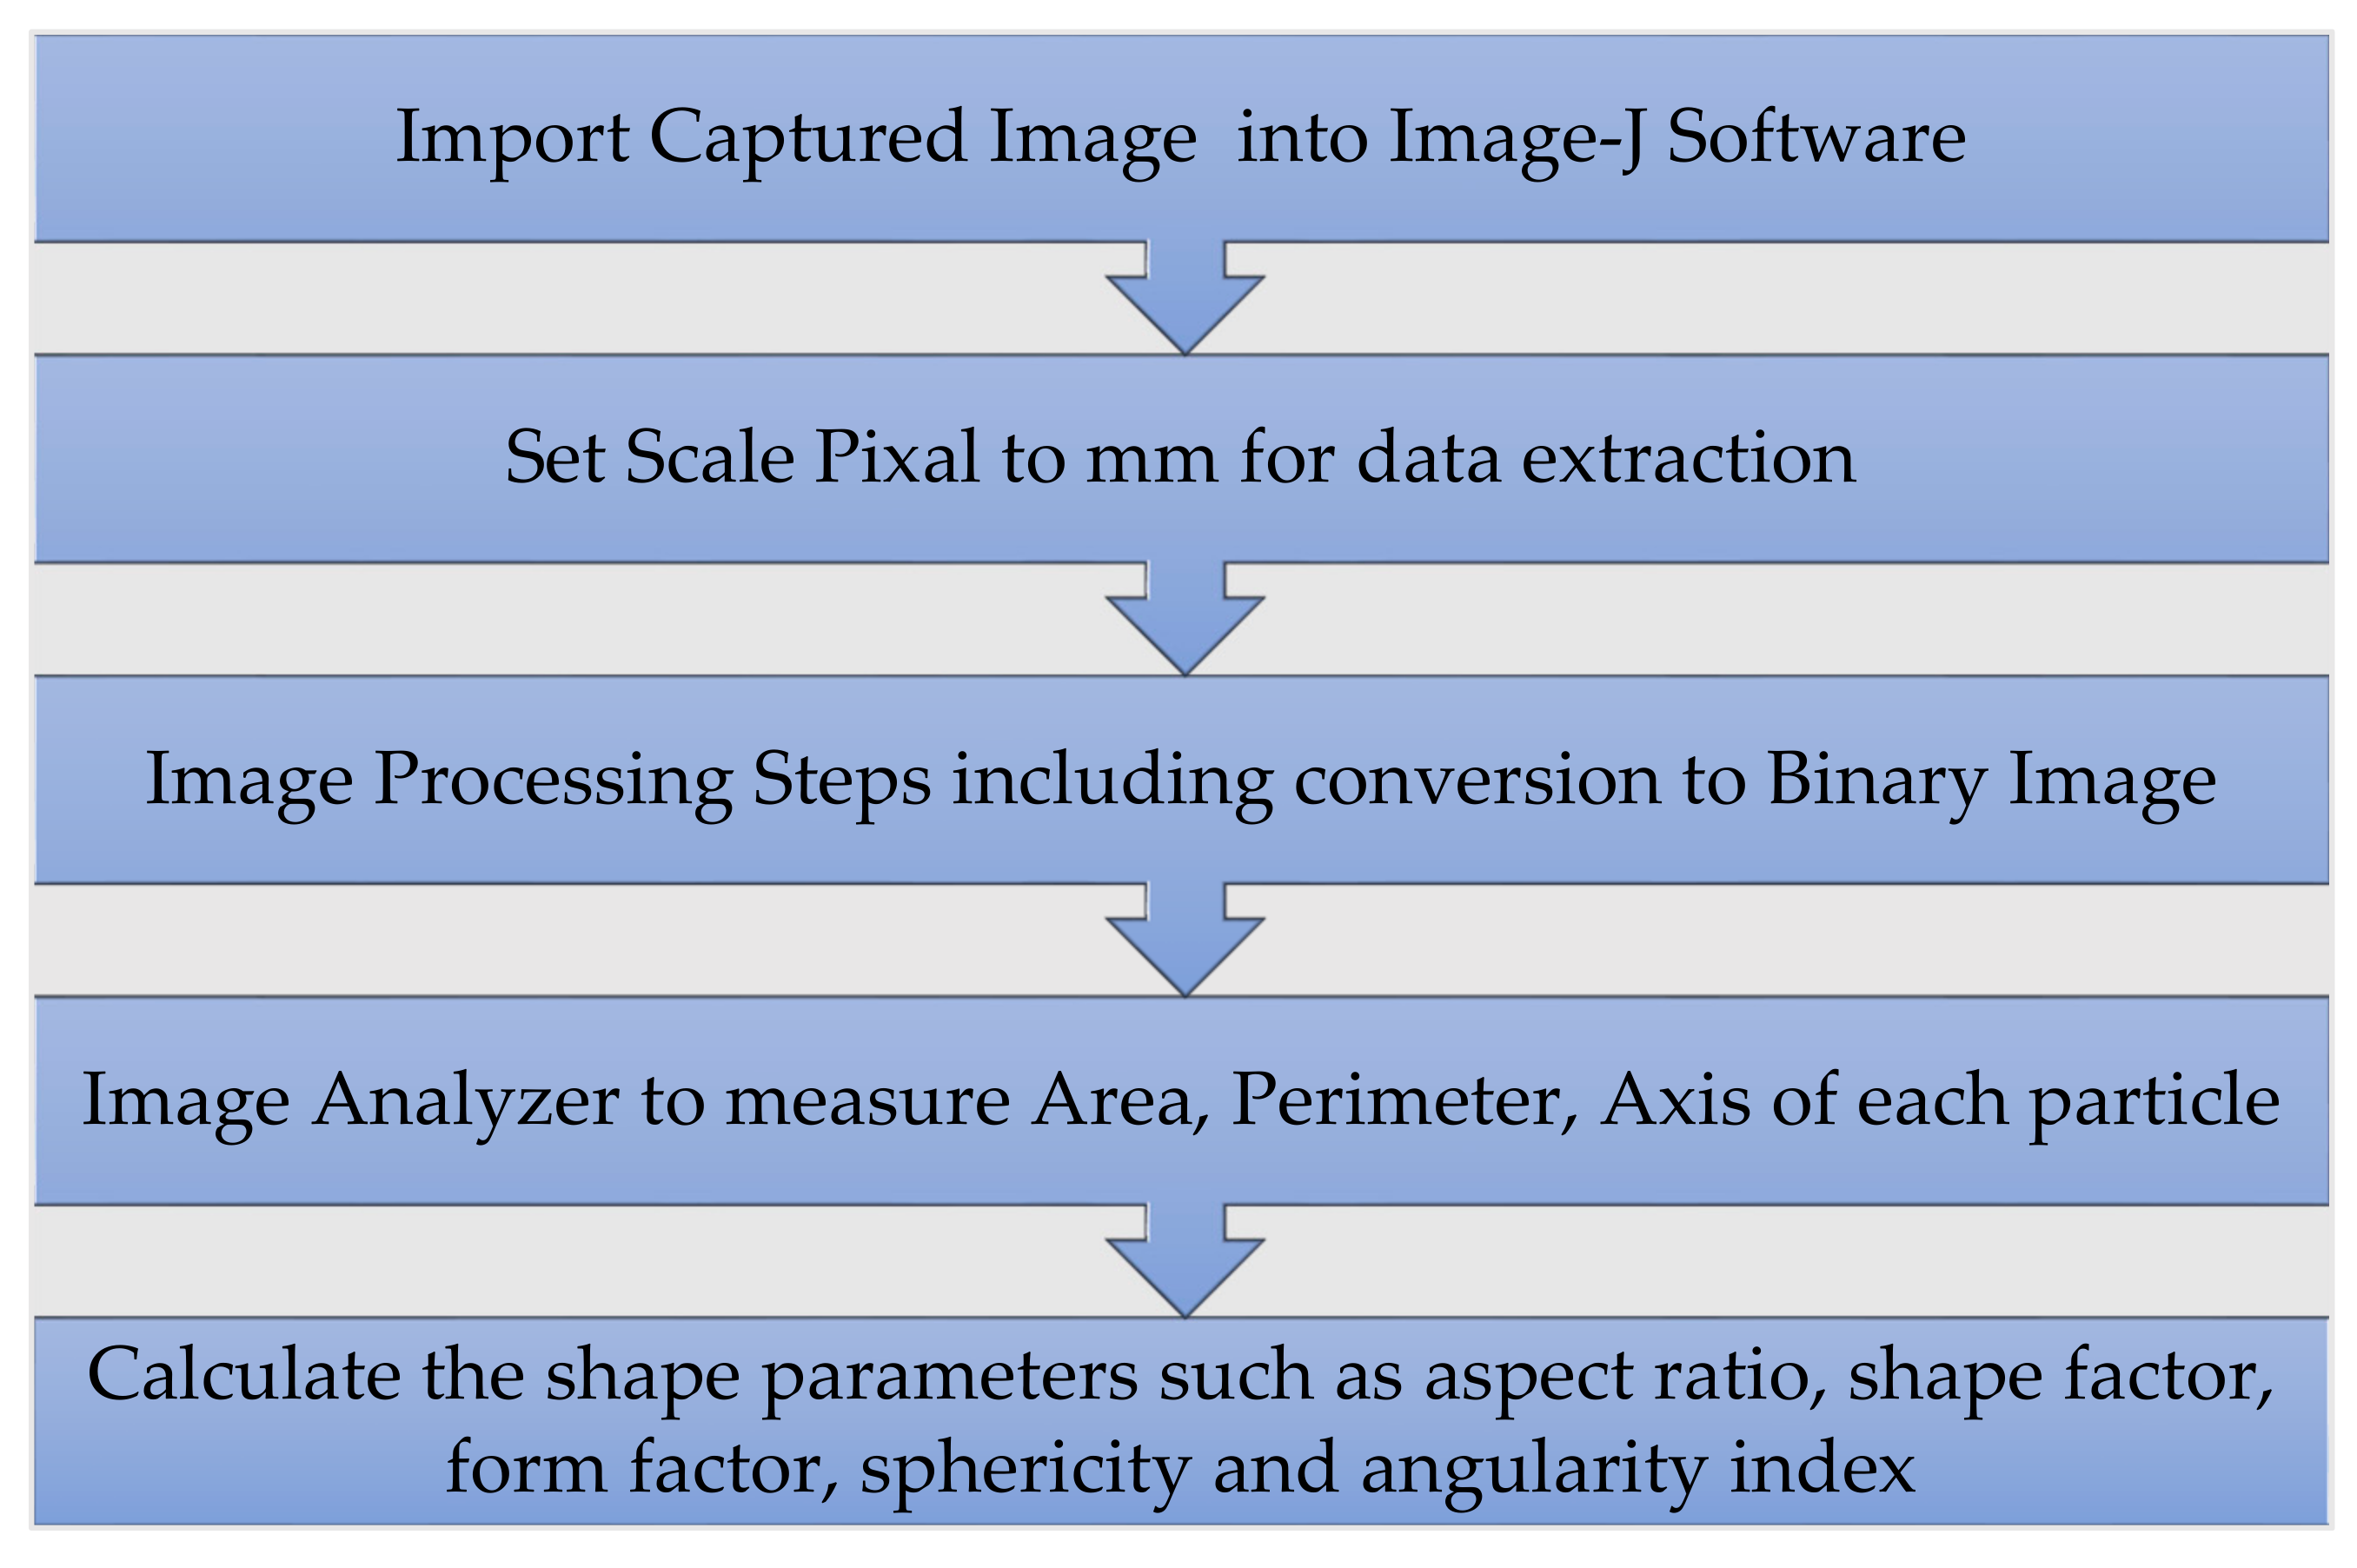
The image processing and analysis flowchart is presented in Figure 4.
The designation codes of all size fractions from various sources are Margalla Impact Crusher (MIC), Margalla Jaw Crusher (MJC), and Ubhan Shah Impact Crusher (USIC). The JPEG image format was imported in the software Image-J. The original images were converted into binary images with black objects over the white background during analysis. These images are essential to make some processes like Erode, Dilate, Open, Close, Fill Holes, Watershed. After that, the image analyzer was applied to calculate the numerical data to measure the shape factors of each aggregate particle. The detail designation codes of all size fractions and average values of shape properties for MIC, MJC and USIC have been reported in Table 4 and Table 5.
Table 5 presents the average values of different shape parameters of aggregates for different shapes and sizes collected from the IC and JC. The graphical presentation of these parameters is described in the Section 3.2 from Figures 5–10. The shape parameters for different fractions of aggregates taken from IC and JC showed the different aspects. However, the MJC showed better shape parameters.
3. Results and Discussion
3.1. Basic Engineering Properties of the Aggregates
The results of basic engineering properties of given aggregate sources and crusher type are summarized in Table 6.
Table 6 presents the types of rock for each quarry and the basic engineering properties of aggregates. The flakiness and shape index were found suitable, but MJC showed the lowest values. However, the shape properties of the aggregates of different fractions are calculated from the digital image processing approach to compare the shape parameters.
3.2. Shape Parameters of Aggregates from Impact and Jaw Crusher through Digital Image Processing Approach
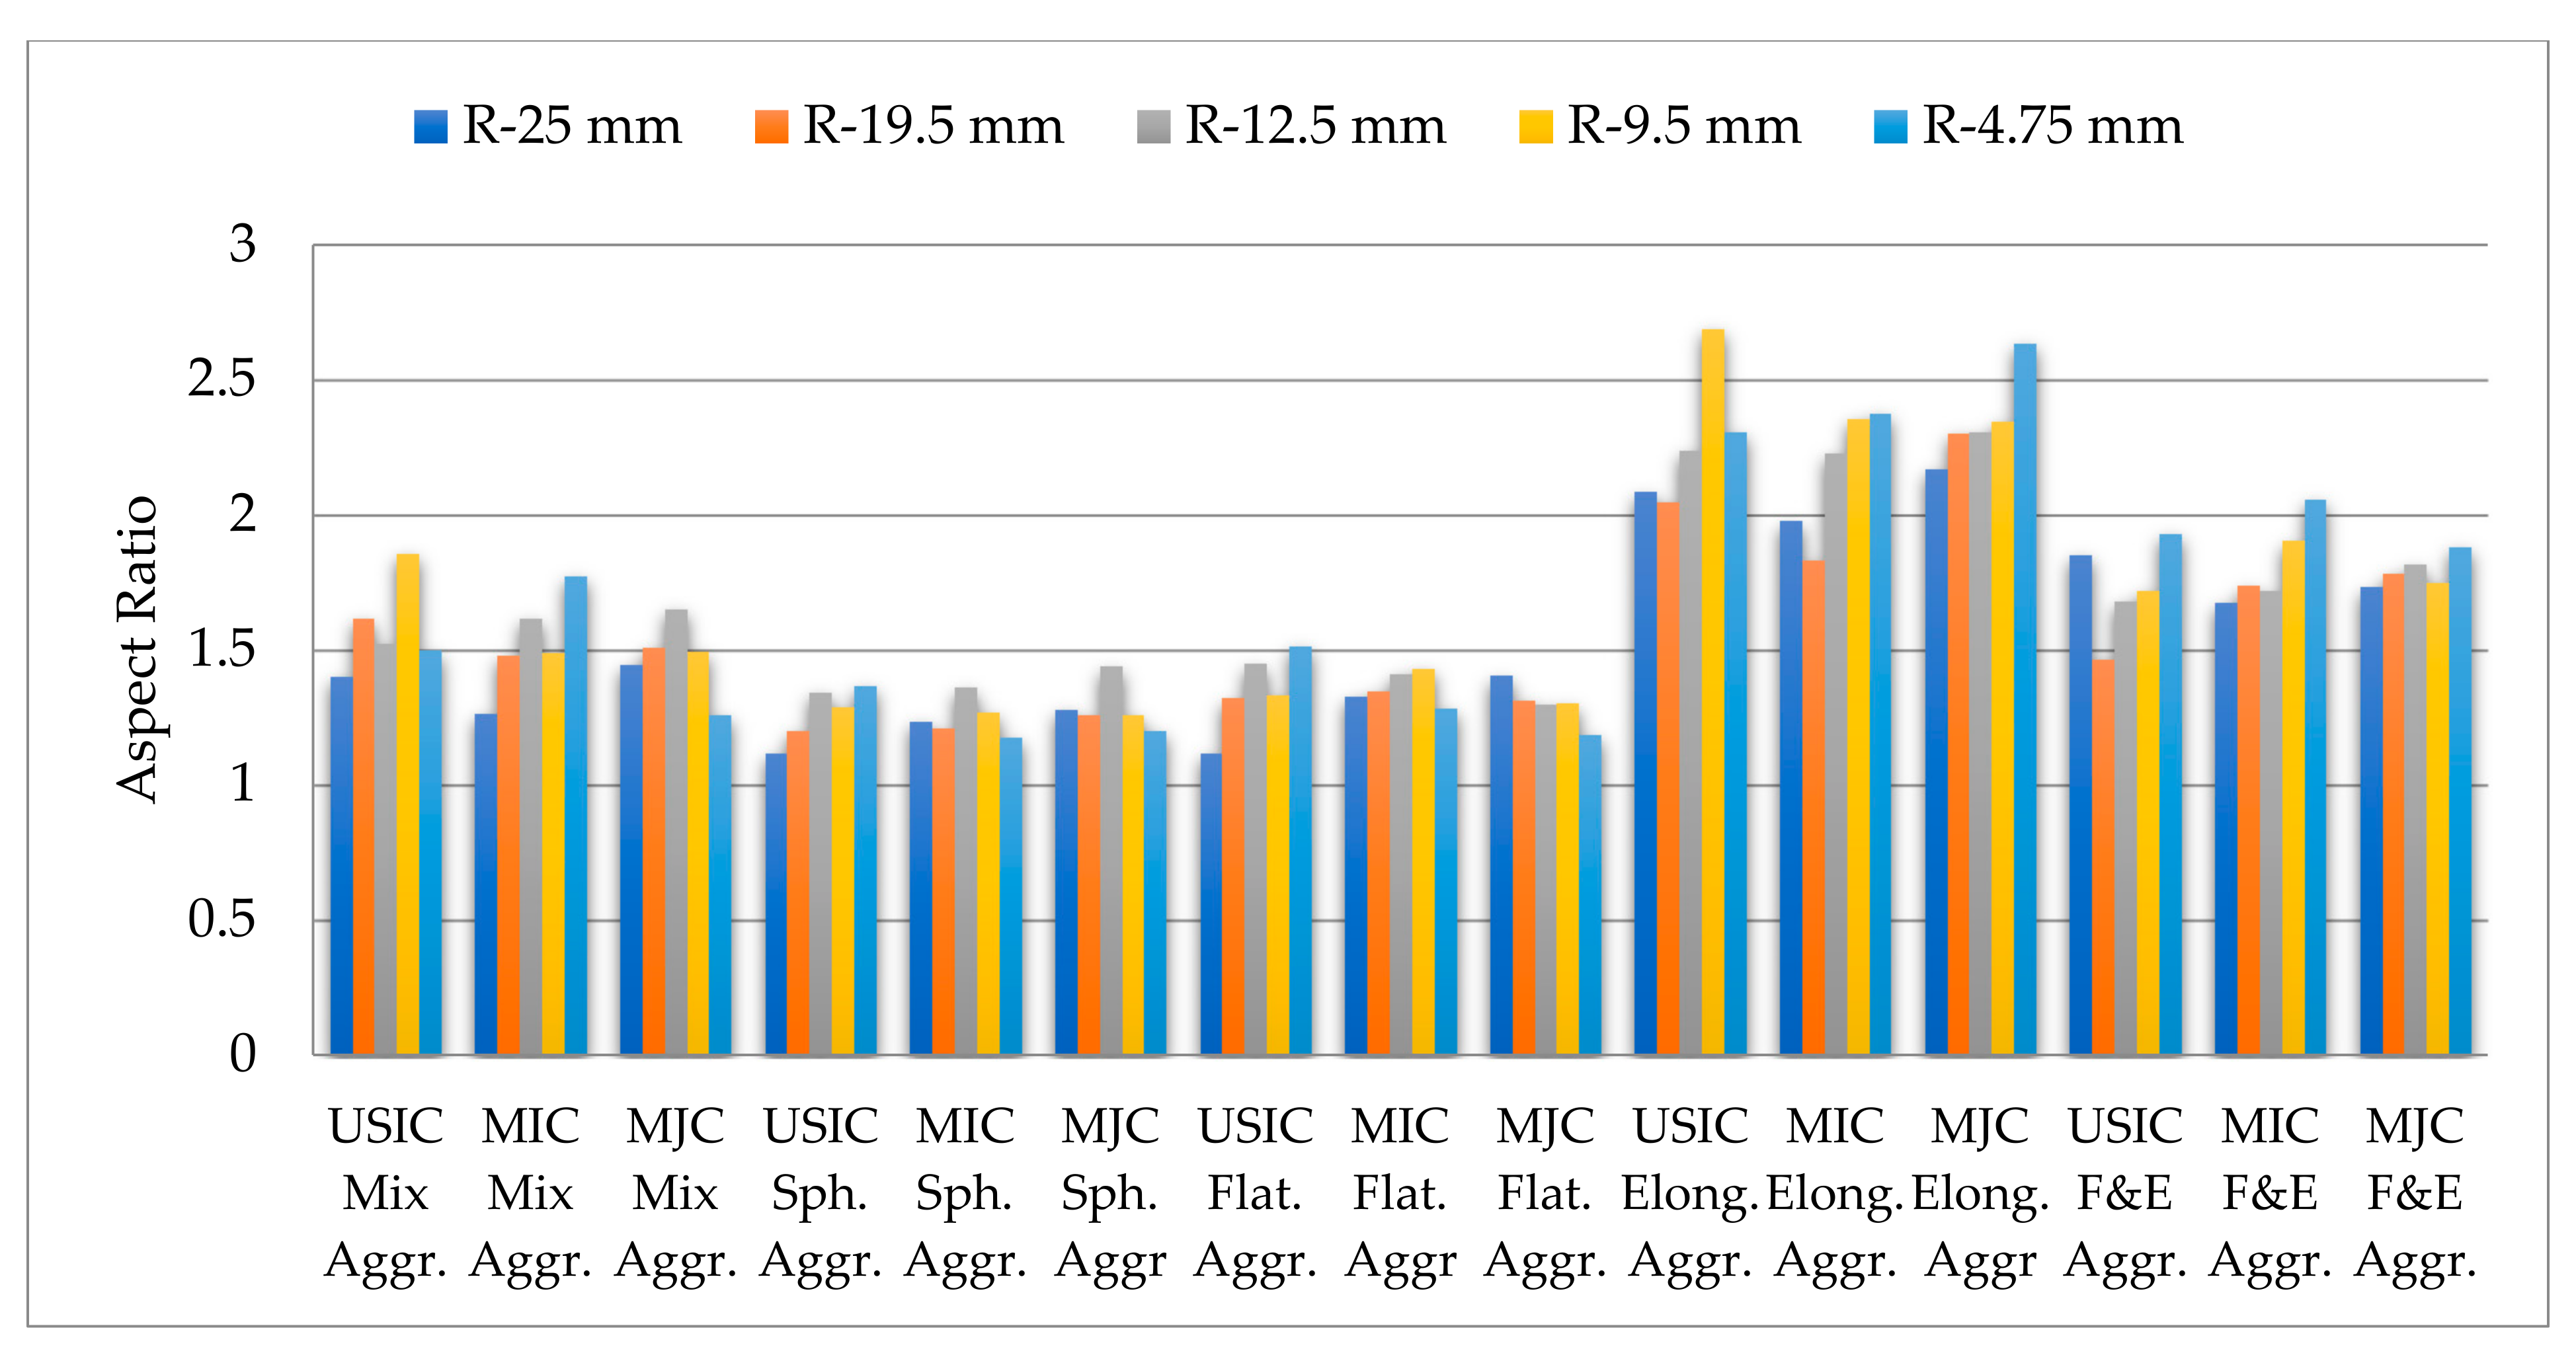
Shape parameters were determined based on mathematical steps of the image analysis. The relevant necessary data were extracted, and different shape parameters were calculated. Discussion on various shape parameters such as aspect ratio, shape factor, form factor, sphericity, roundness, and angularity indices of MJC and USIC is given below. The aspect ratio is described in bar charts in Figure 5 for mix, spherical, flat, elongated and flat and elongated aggregate particles of different sizes of impact and jaw crusher quarries.
It can be noted from Figure 5 that different aggregate particles indicated the different trend of aspect ratio for 37.5–4.75 mm aggregates collected from the IC and JC. The spherical shape aggregates indicated the highest values to show the most appropriate shape parameter.
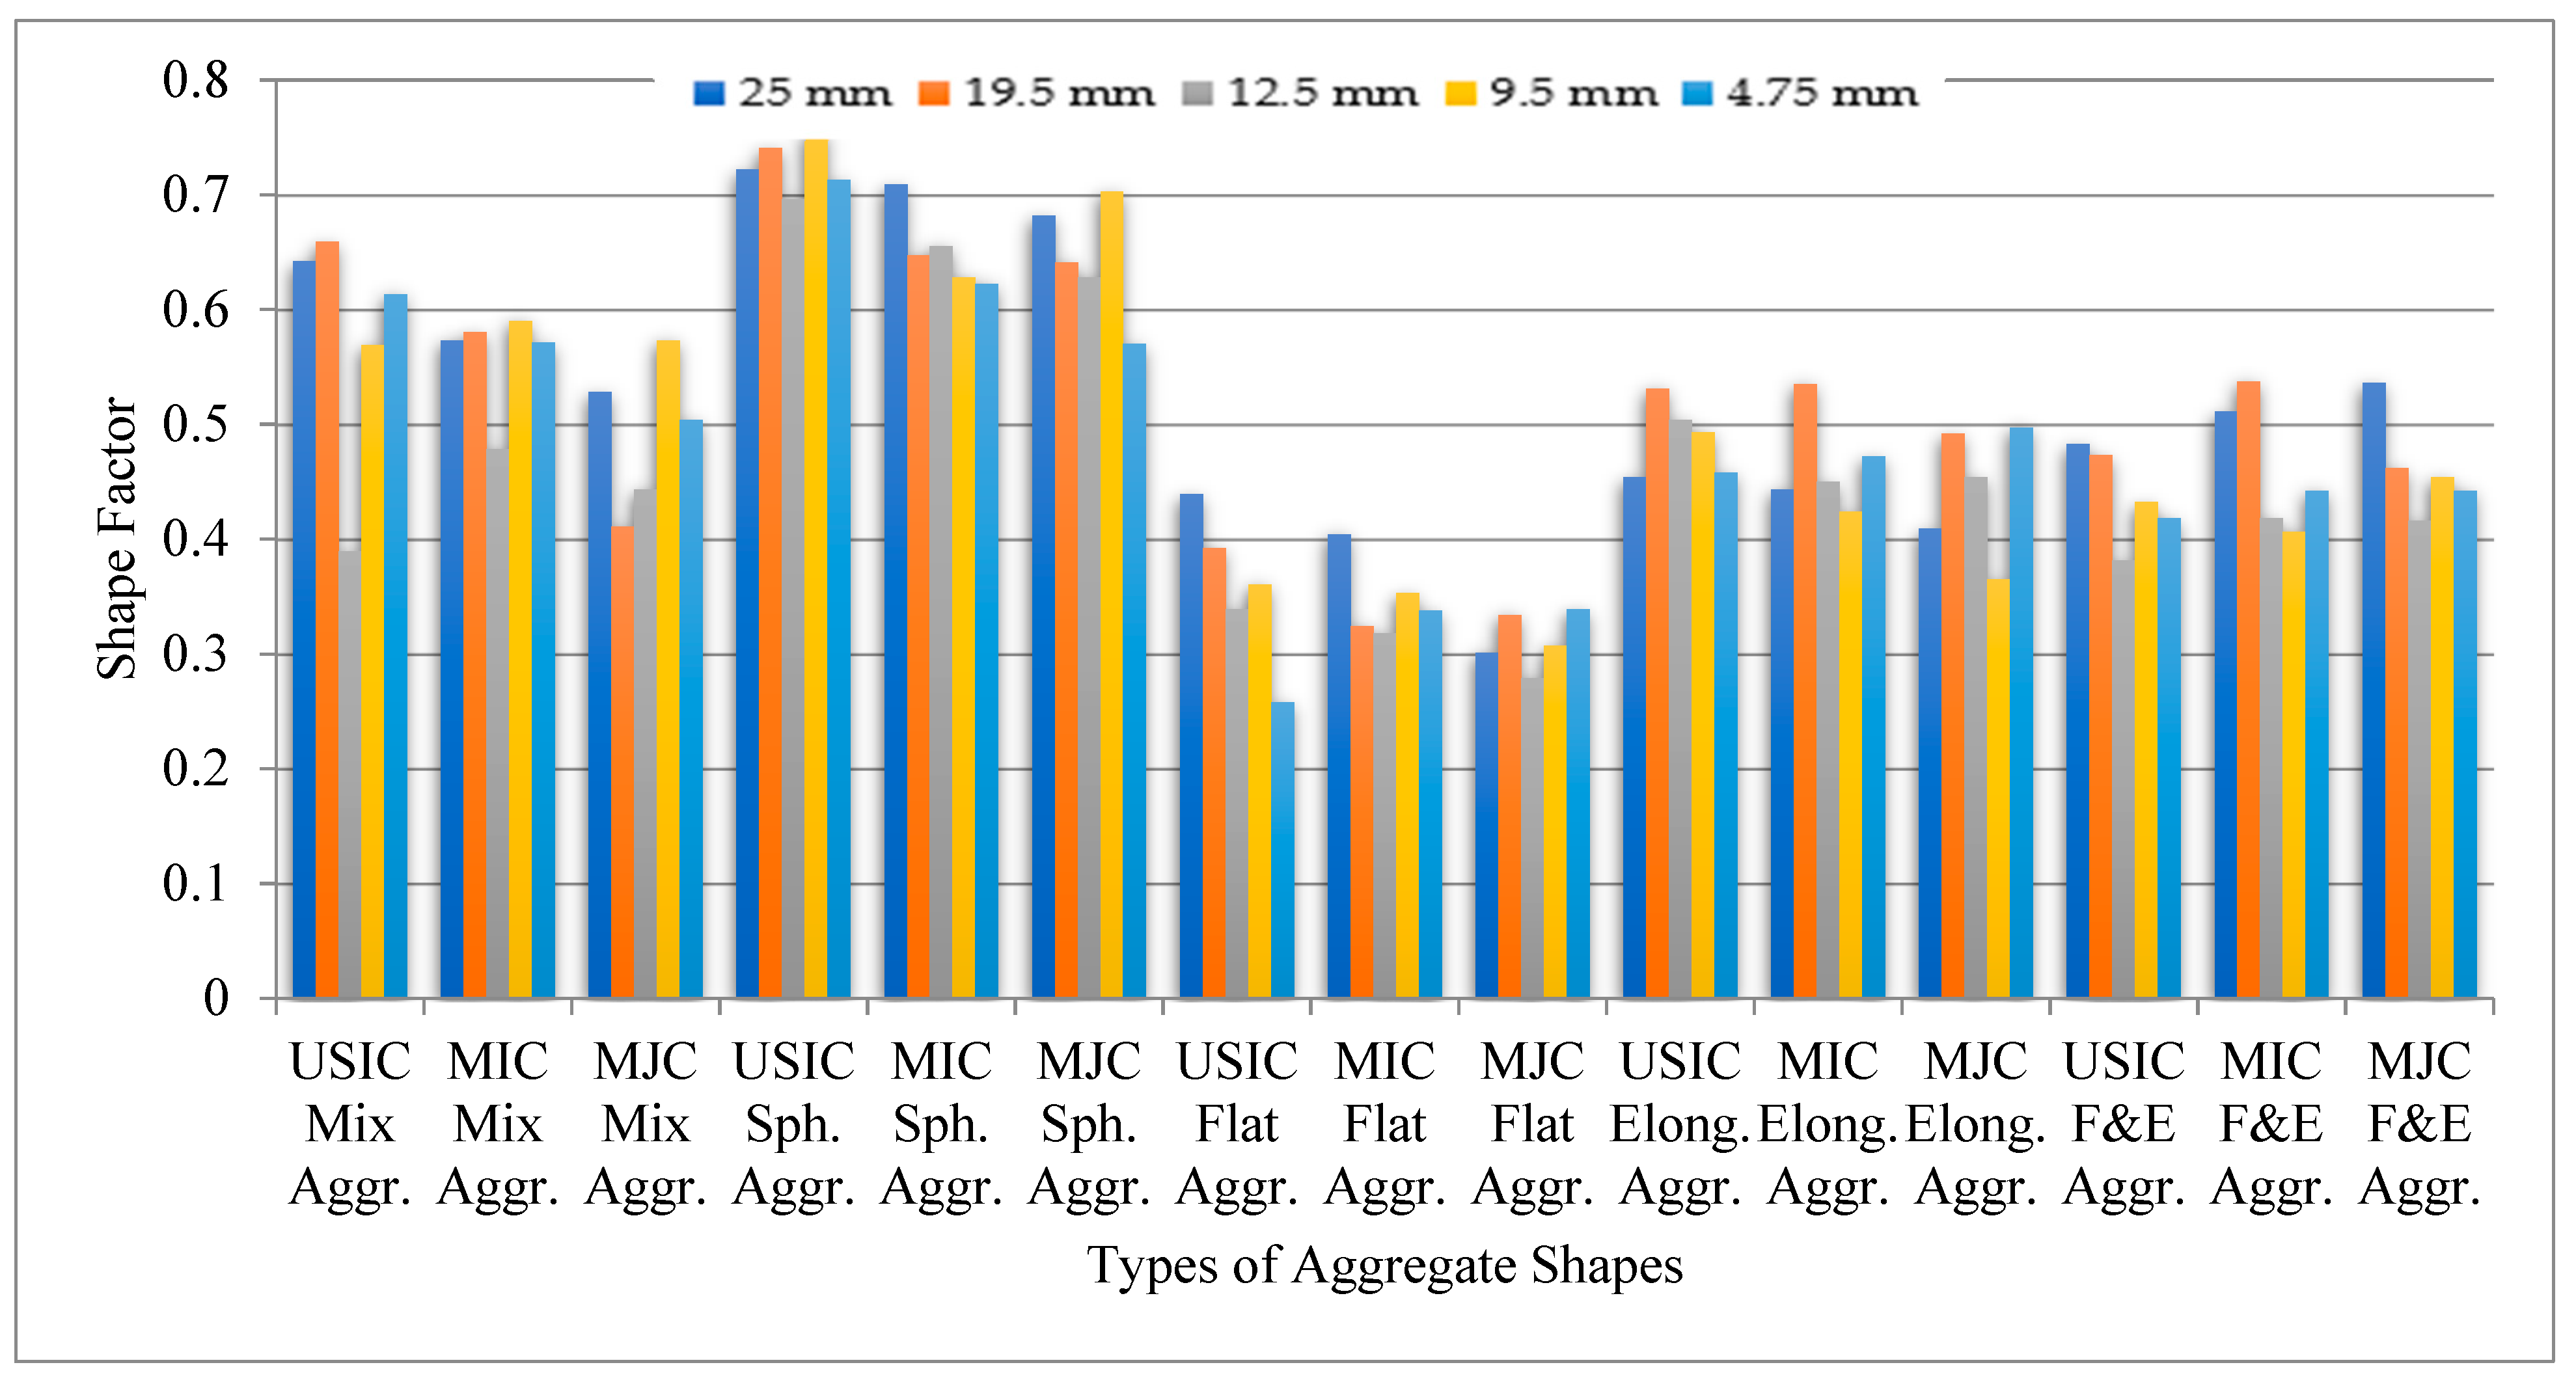
The shape factor is an important parameter that quantifies the form of aggregates by considering the three dimensions of the particles. Its value may be higher for aggregates used in pavement construction. As the value moves towards unity, the shape factor gets improved, and correspondingly the aggregates show good shape characteristics as well as better load-bearing capacities. Figure 6 describes the effect of shape factor calculated from the different fractions of aggregate particles (passing 37.5 mm and retained on 4.75 mm) of the mix, spherical, flat, elongated and flat and elongated aggregates taken from IC and JC.
It can be noted from Figure 6 that the shape factor is changing with aggregate shapes, sieve sizes, and different types of crushers. The spherical aggregates from all shapes and MJC contain a higher shape factor that would be most suitable for aggregates packing at unbound and bound layers of the pavement. Furthermore, the effect of sieve sizes is also essential that indicates its value is higher for larger and lower fractions and medium for intermediate aggregate sizes. A similar trend was also observed in the literature [41]. The variation at corners of aggregate particles is an important parameter presented in terms of angularity index. The deviations at the corner of particles depend on mineral rock and the crushing technique. This parameter also provides significant worth in terms of load bearing and packing of aggregates. Figure 7 shows the form factor of different aggregate shapes.
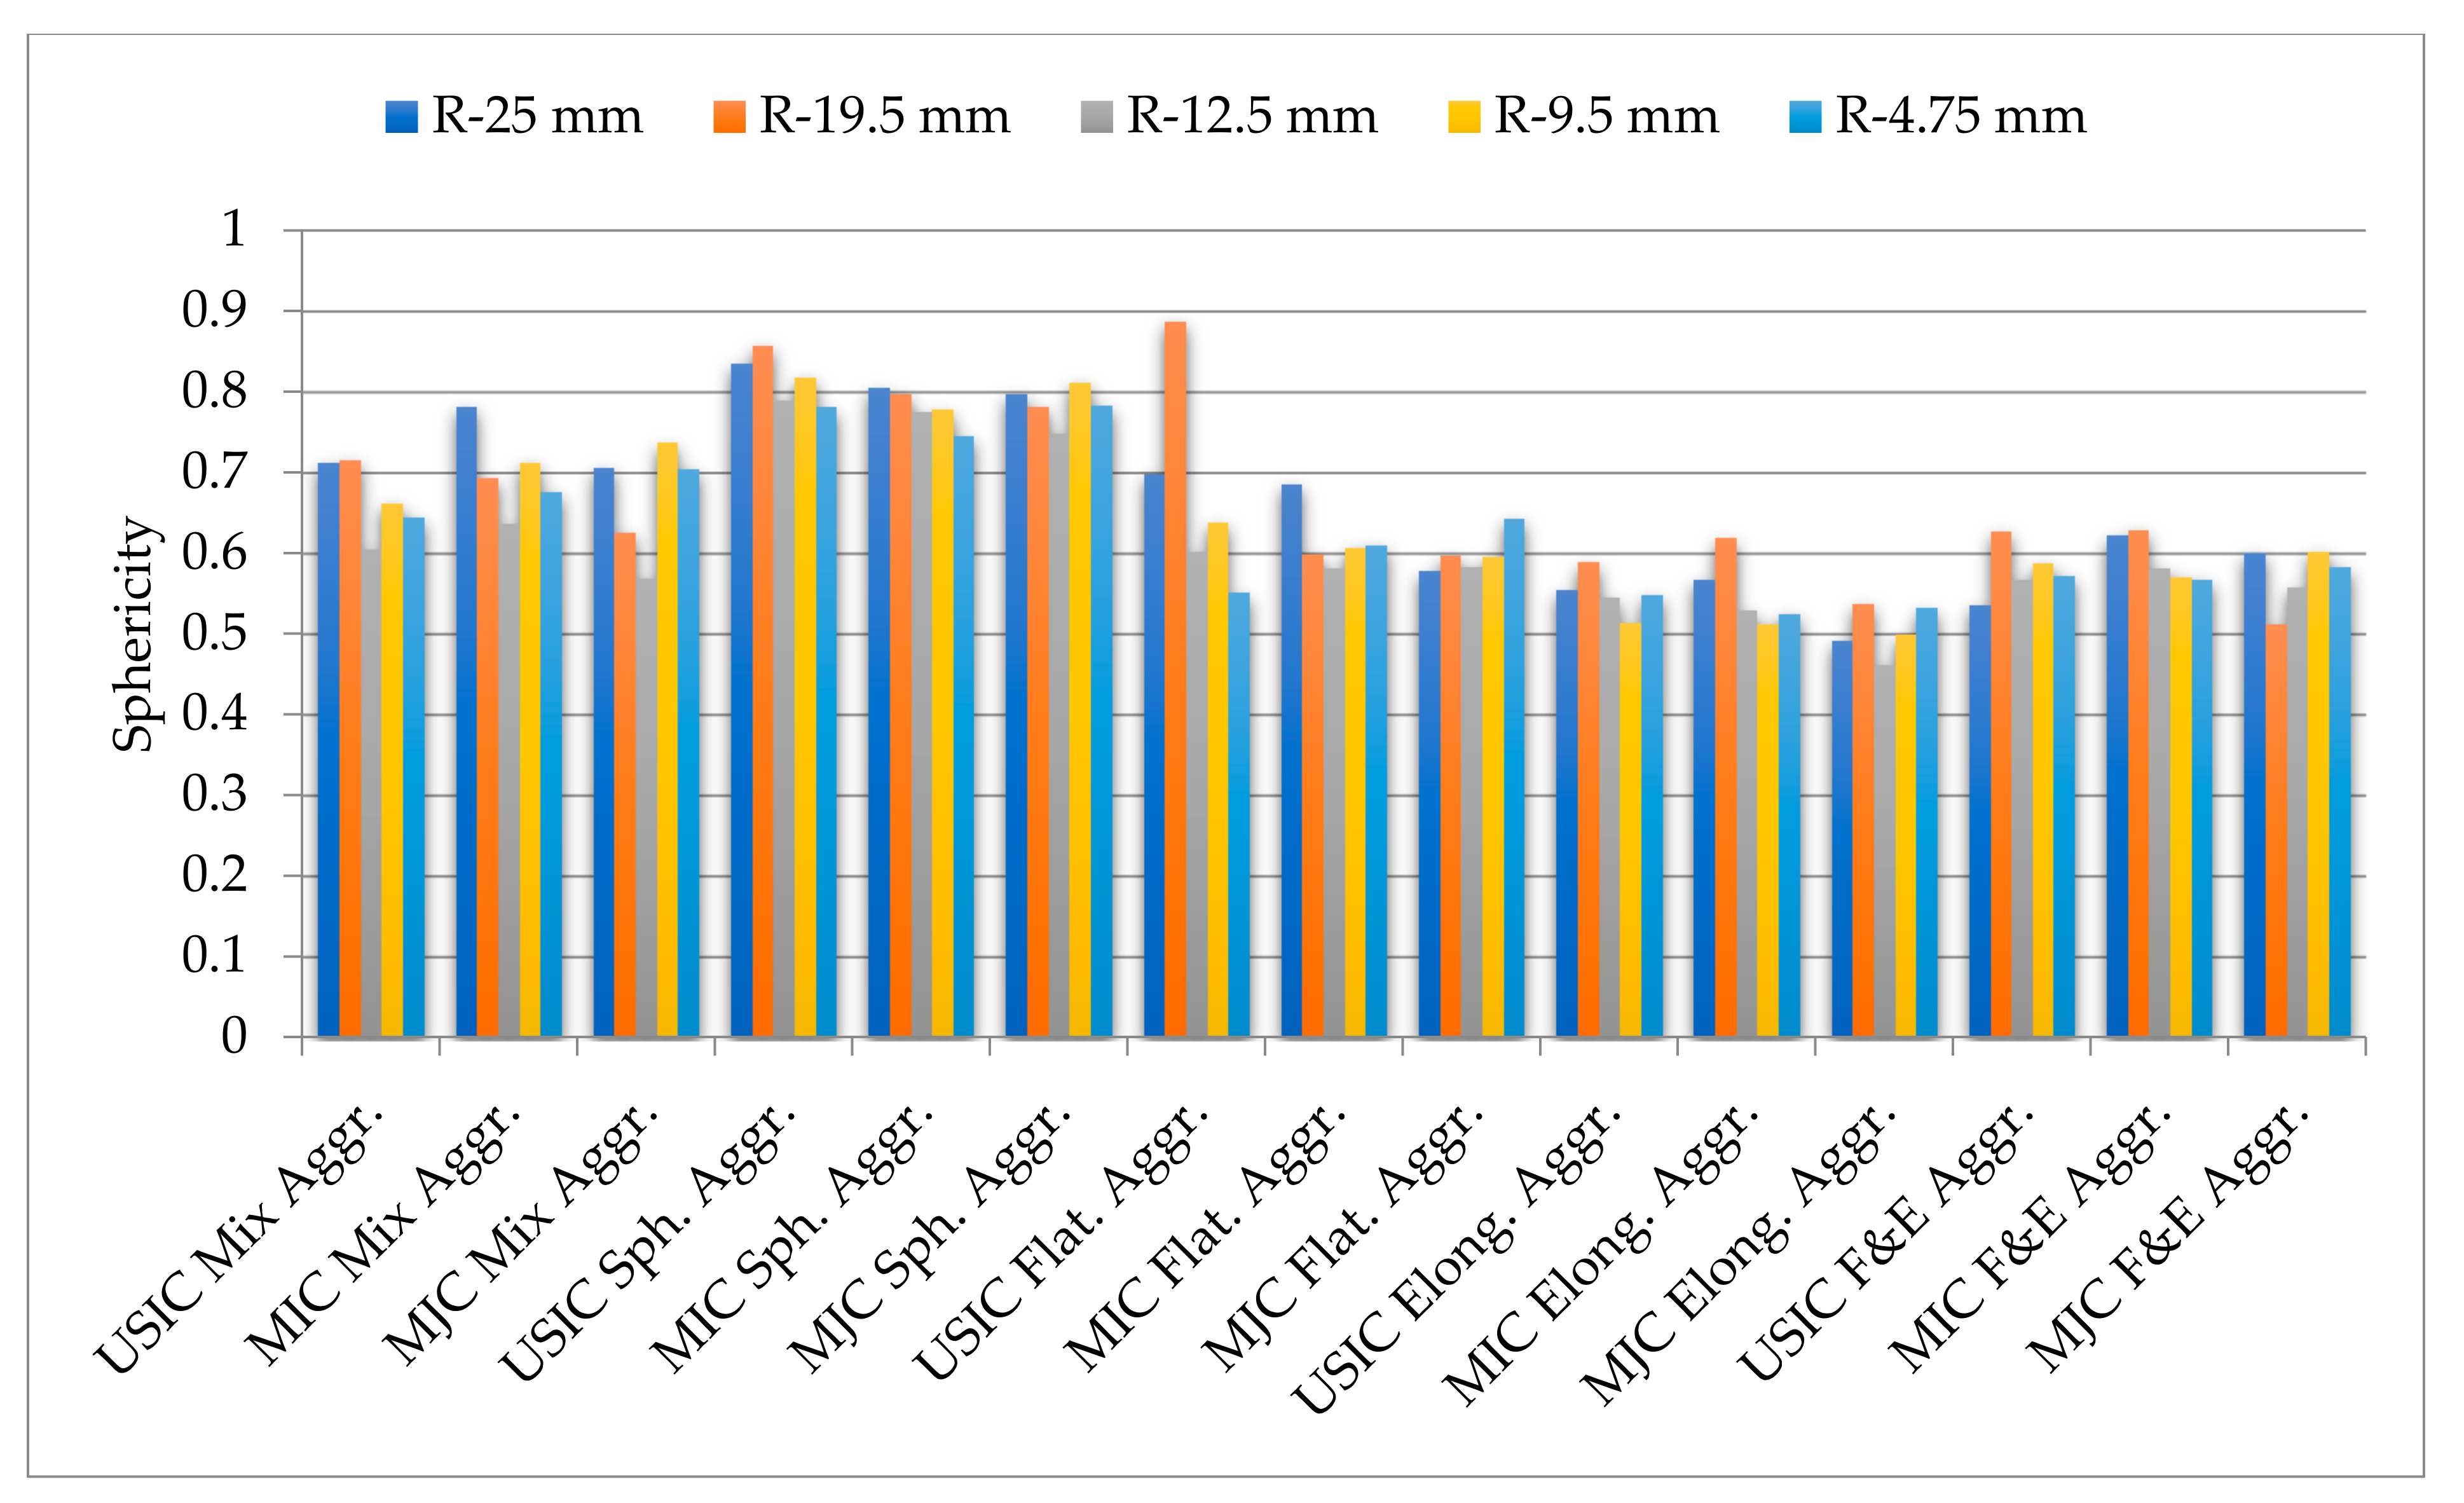
It can be noted from Figure 7 that all shapes of aggregates showed the reasonable form factor but elongated particles’ lowest values. This was due to weak shape characteristics at all corners and periphery of aggregate particles. The most appropriate values were observed for the spherical shape aggregates. The sphericity of different shapes of aggregates is presented in Figure 8.
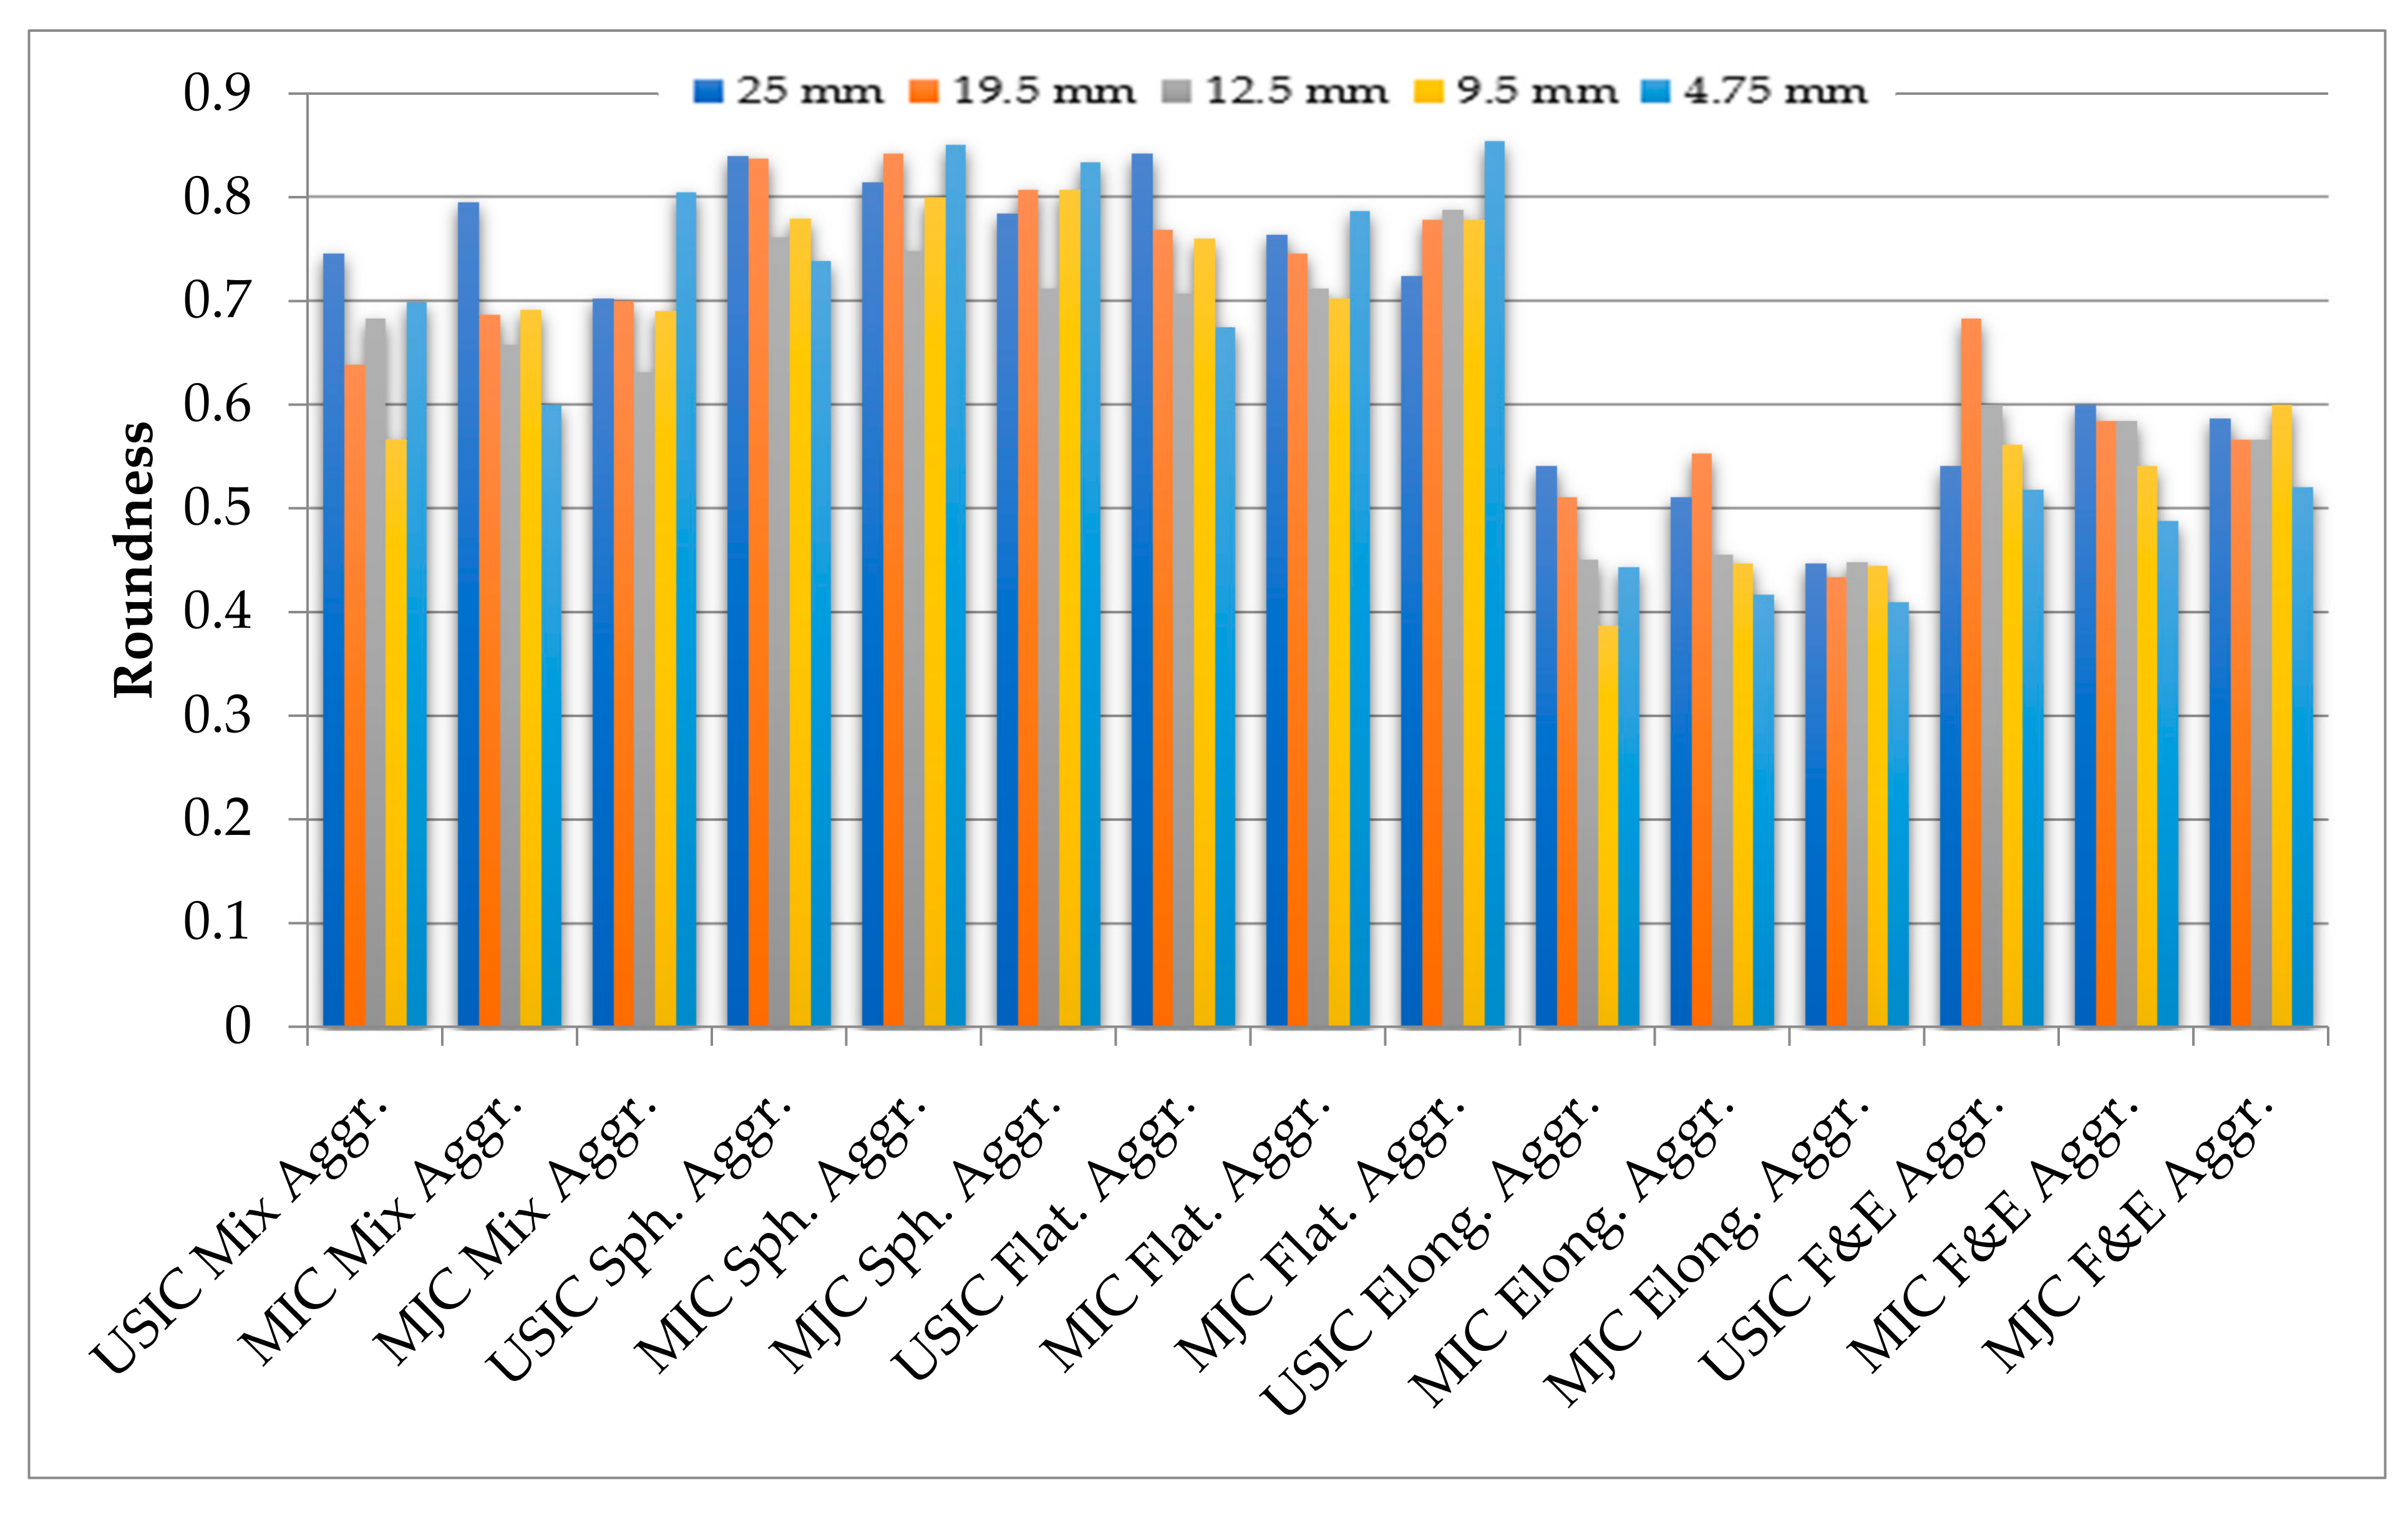
It may be noted from Figure 8 that the sphericity of different shapes of aggregates has been decreasing from spherical, mix aggregates to flat and elongated aggregates. It indicates that maximum values are associated with to circle. The particle had a shape near the circle having the highest value observed in the spherical aggregates. This type of aggregate shows the maximum packing during the asphalt mixture design and indicates the highest density. Figure 9 presents the roundness of different shapes of aggregates.
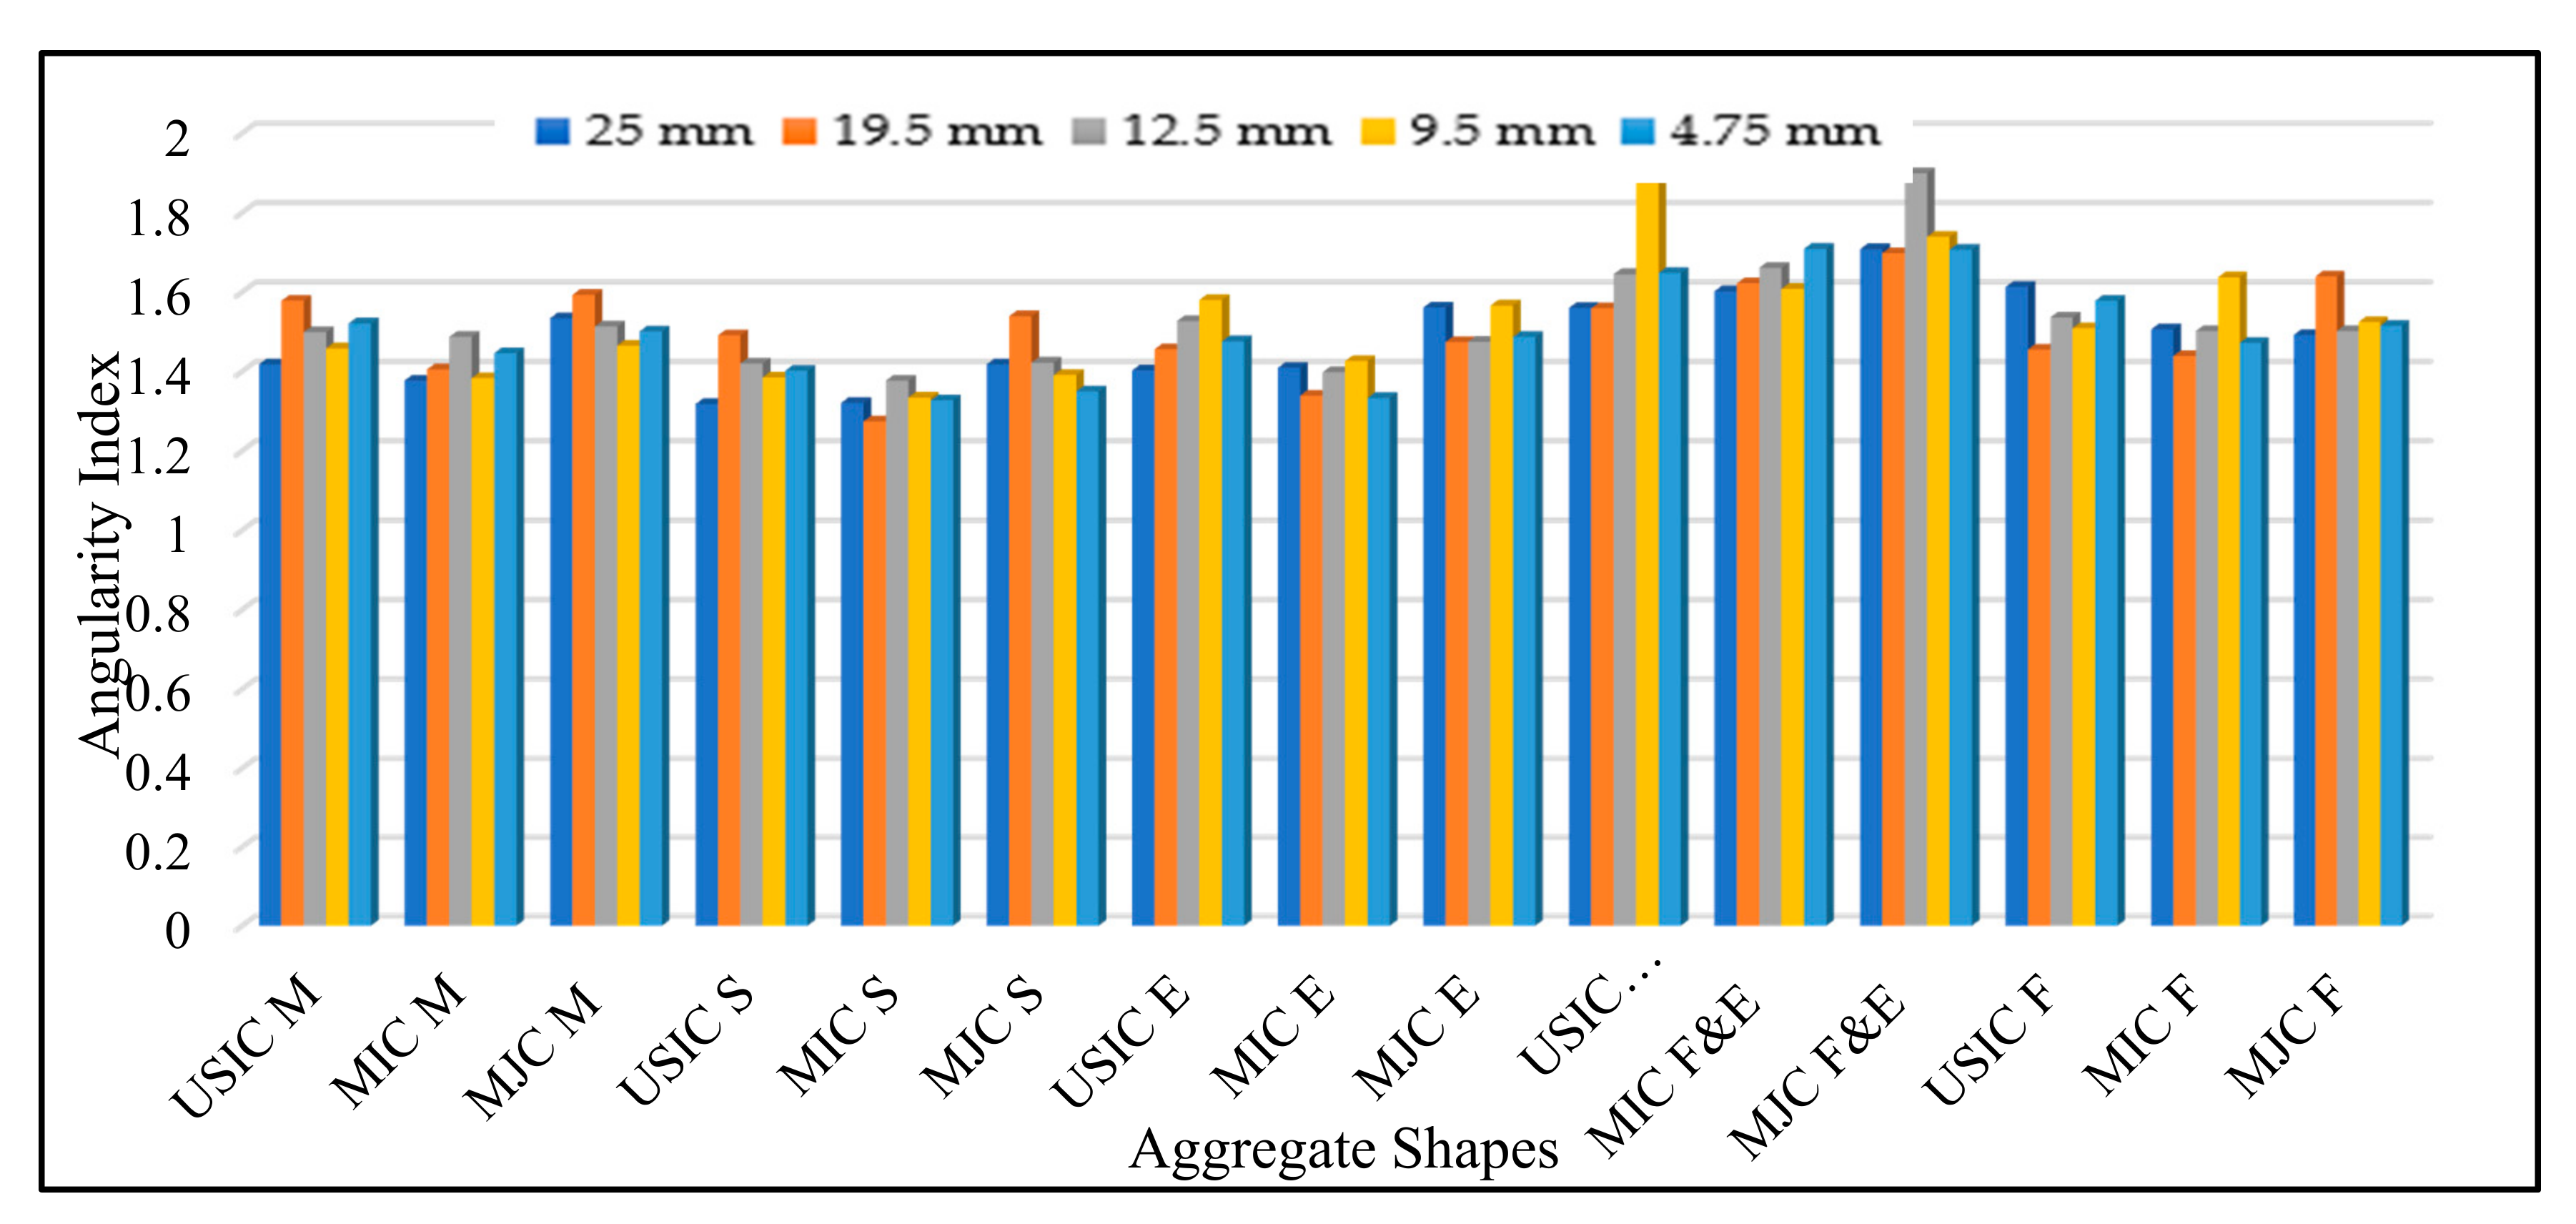
It may be noted from Figure 9 that 25 mm sieve fraction, the mix aggregates indicated high roundness in order of MIC, USIC and MJC. The spherical particles of all sources revealed higher values such as USIC, MIC and MJC, respectively. The flat aggregates of all sources had high values. All other types and sources of aggregates were showing medium values for roundness. At 19.5 mm sieve size, the mix aggregates showed high roundness such as MJC, MIC and USIC, respectively. All types of sources for spherical and flat aggregate particles showed high roundness. The types of aggregates indicated medium values for roundness. Figure 10 shows bar charts for the angularity index of different aggregate shapes and crushers.
It can be noted from Figure 10 that flat and elongated aggregates showed a higher angularity index, but the thickness of these particles is lower when compared to other shapes of aggregates. So, the medium value of the angularity index is more suitable for optimum packing and load bearing of aggregates. The MJC again comprises appropriate values for angularity that governs the highest stability and dense packing. The JC produced aggregates are indicating the suitable shape parameters. Aspect ratio is easy to visualize and measure in a regular-shaped particle, as indicated by Adiseshu, G. and G. Naidu [44]. It is the ratio of the major axis to the minor axis by measuring the dimensions in mm units. It is summarized that the aspect ratio of spherical, flat, elongated, and flat and elongated aggregates varied significantly concerning different sources, the type of crusher and sieve sizes being used as indicated by Rajan, B. and D. Singh [41]. The form factor describes the grain shape characteristics by contributing to the area and perimeter of aggregate particles. It is slightly changed for types of crusher, sieve sizes, and aggregate shapes. The spherical aggregates show the higher form factor and the elongated most negligible value. The MJC reflects better values as compared to other types of crushers.
The measurement of sphericity for aggregates is accomplished by considering three dimensions. It is an important parameter to describe the overall shape of aggregate particles. As the value shifts towards unity, the shape of particles presents spherical aggregates. Based on the analysis of experimental data, it was noted that spherical shape aggregates comprise the highest values that would be most suitable for optimum packing of aggregates. Its value significantly changed with crusher types as well as sieve sizes. The roundness is a shape property that describes the variation at corners of aggregates at a small scale. This property basically gives a clearer idea about the surface texture of aggregates. The comparison of grain texture for aggregates is an important parameter. It was concluded that all samples of aggregates contain appropriate roundness with the highest in spherical shapes aggregates. It is important to produce the asphalt mixture and note the effect of the shape parameters on the Marshall stability and develop the correlation.
3.3. Effect of Statistical Analysis on Shape Parameters, Types of Crusher and Marshall Stability of Hot Mix Asphalt
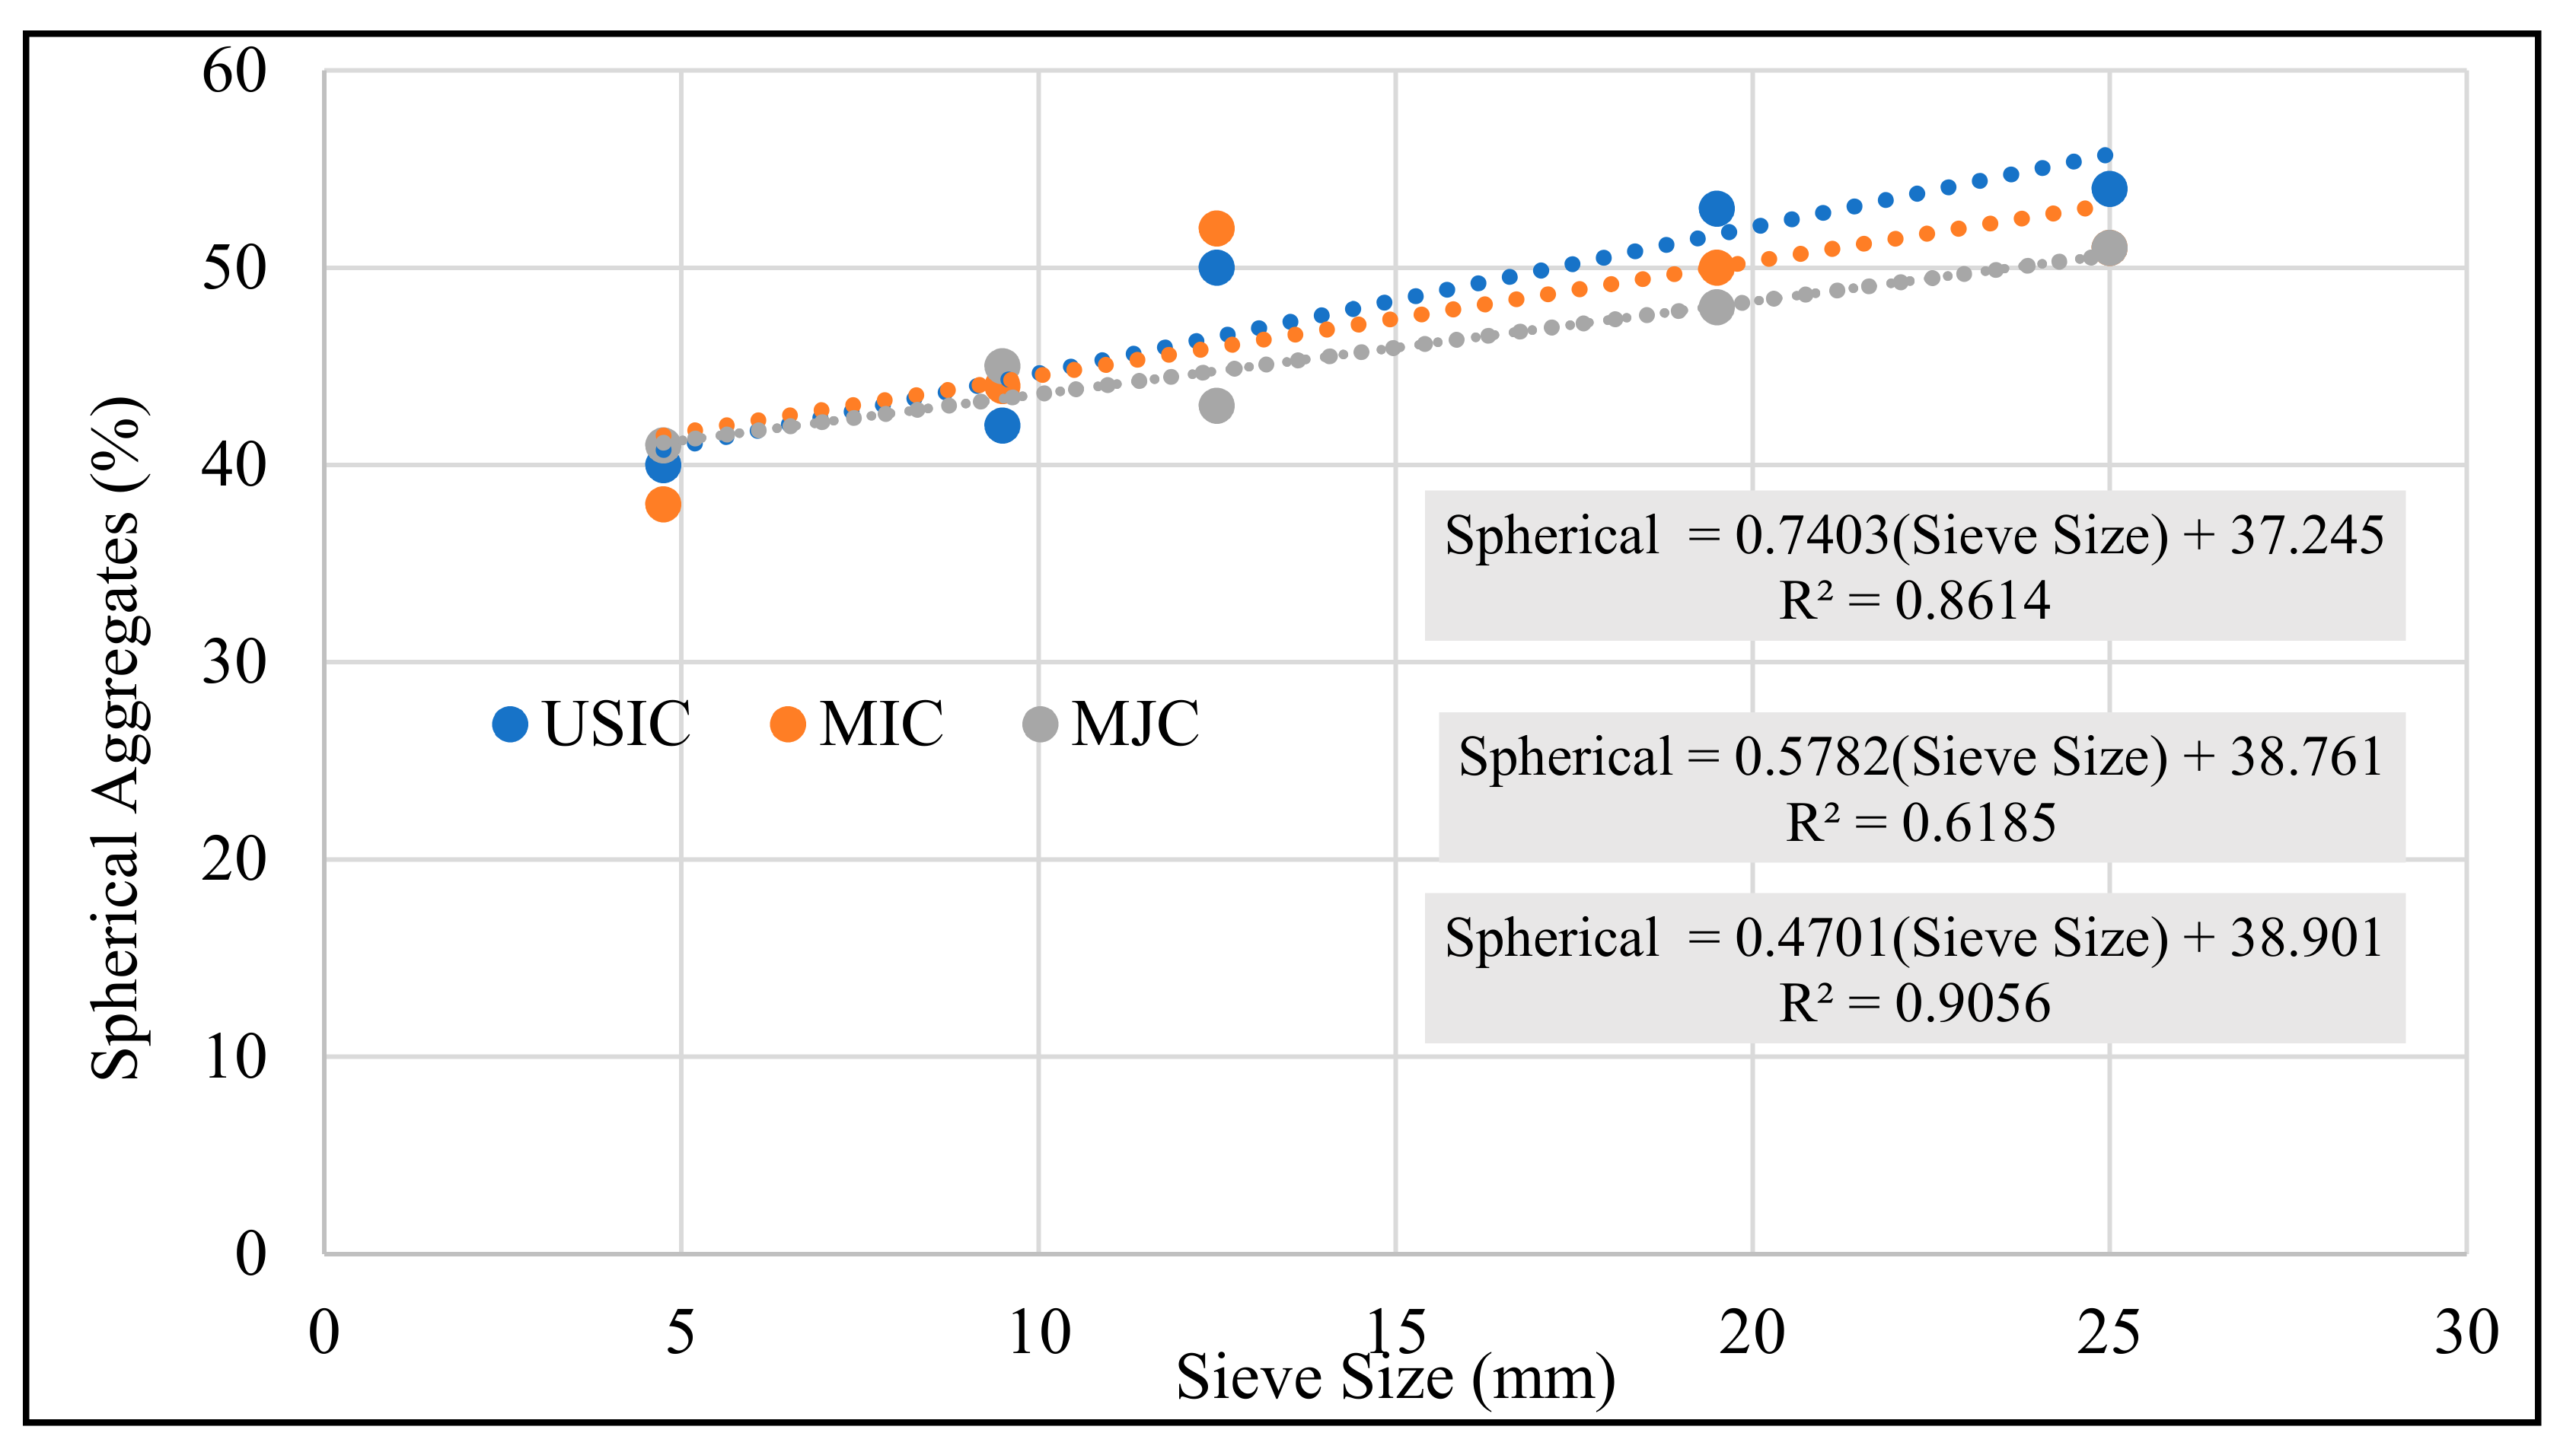
The effect and basic linear regression of spherical aggregates, shape factor, angularity and Marshall stability were also calculated. The determination of coefficient R2 is an important parameter in statistical analysis. It represents the quantity of variation for the independent variable “x” explained through a unit change of different independent variable “y”. Its value closer to unity depicts a stronger correlation develop between both variables. The analysis of variance (ANOVA) was utilized for regression equations, and subsequent significance values (Sig.) were established for each linear regression model. It was observed that the (Sig.) value of each model was less than 0.05, which indicated the statistical validity of correlations. Figure 11 indicates the effect of spherical aggregates on the type of crusher. The spherical aggregates were utilized with five fractions from 37.5–4.75 mm as indicated in the methodology. In this figure, five fractions are mentioned at the horizontal axis, and the type of crushers are indicated with different colors for understanding.
It can be noted in Figure 11 that linear correlation indicates the significant effect of the spherical shape of aggregates on the different sieve sizes, and similar trend was also stated in the study performed by Bessa, I.S., et al [17]. The correlations also indicate the effect of the shape parameter for MJC, USIC, and MIC, containing R2 values of 0.91, 0.86, and 0.62. The MJC correlation has shown the highest value of R2 and indicating the most suitable aggregate materials. The aggregate particles from 4.75 mm to 37.5 mm indicated different scenarios for different types of crushers. The MJC has indicated the most appropriate trend for the different sieve sizes.
The volumetric properties covering the Marshall stability, flow value, air voids, voids filled with bitumen (VFB), voids in mineral aggregates (VMA) and optimum binder content (OBC) for all mixtures calculated and presented in Table 7a–c.
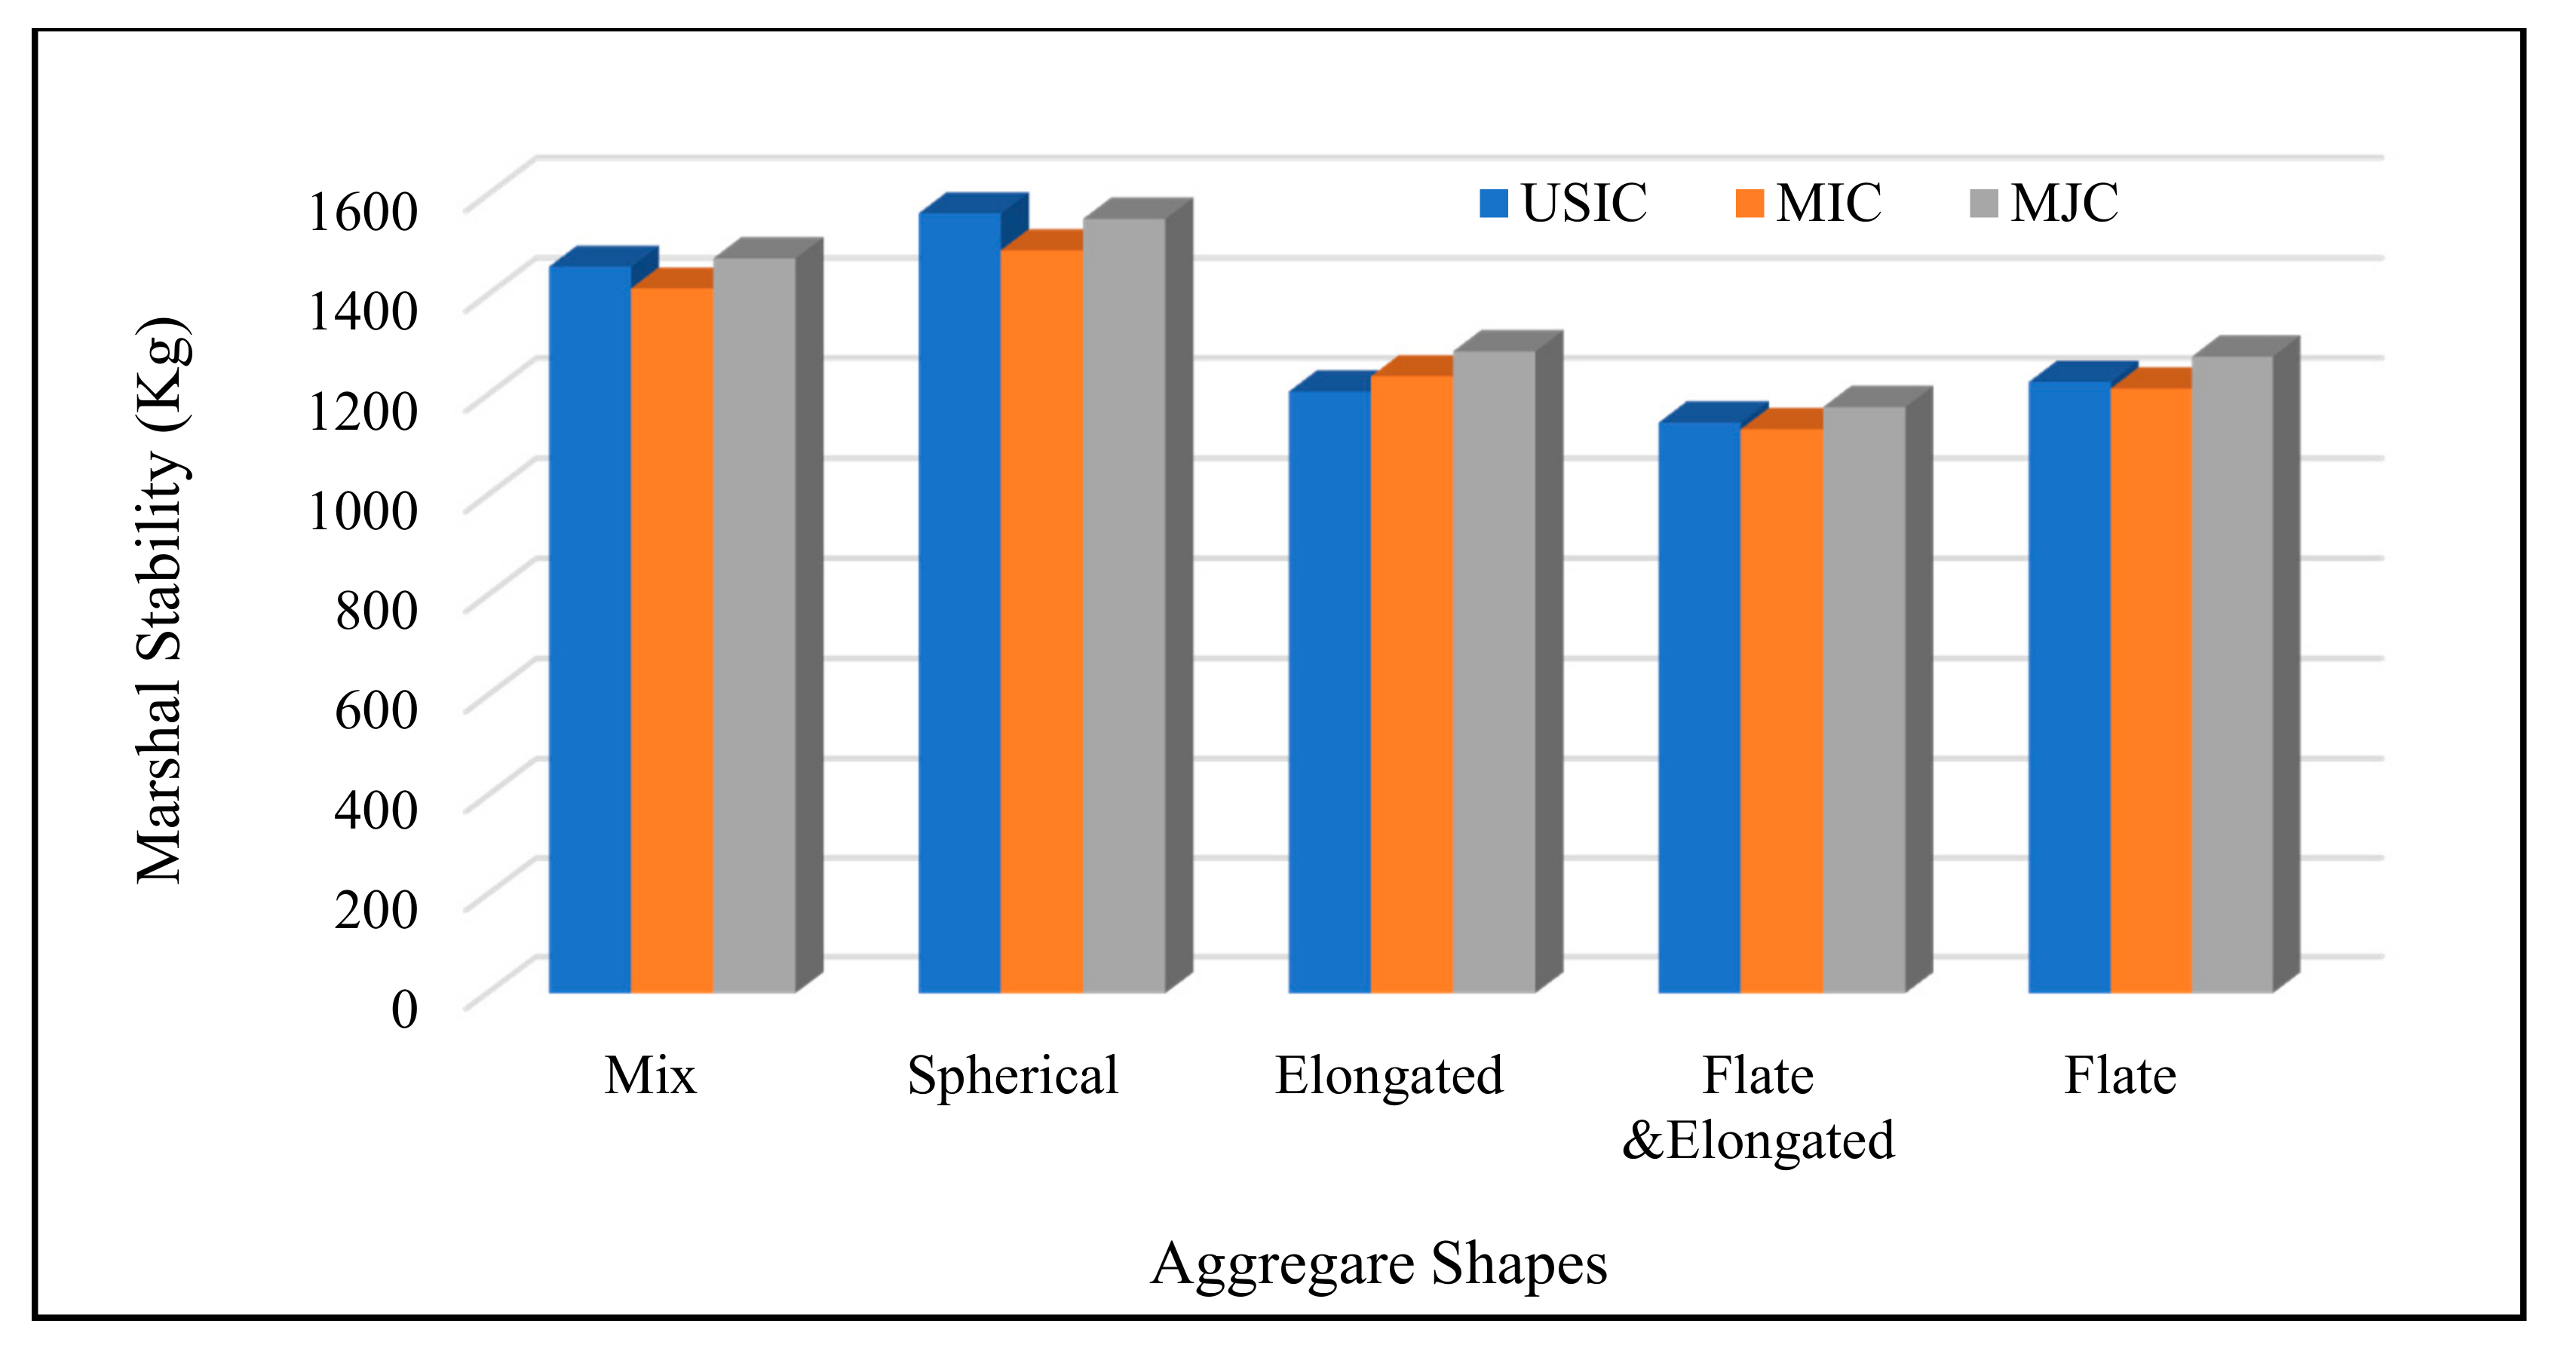
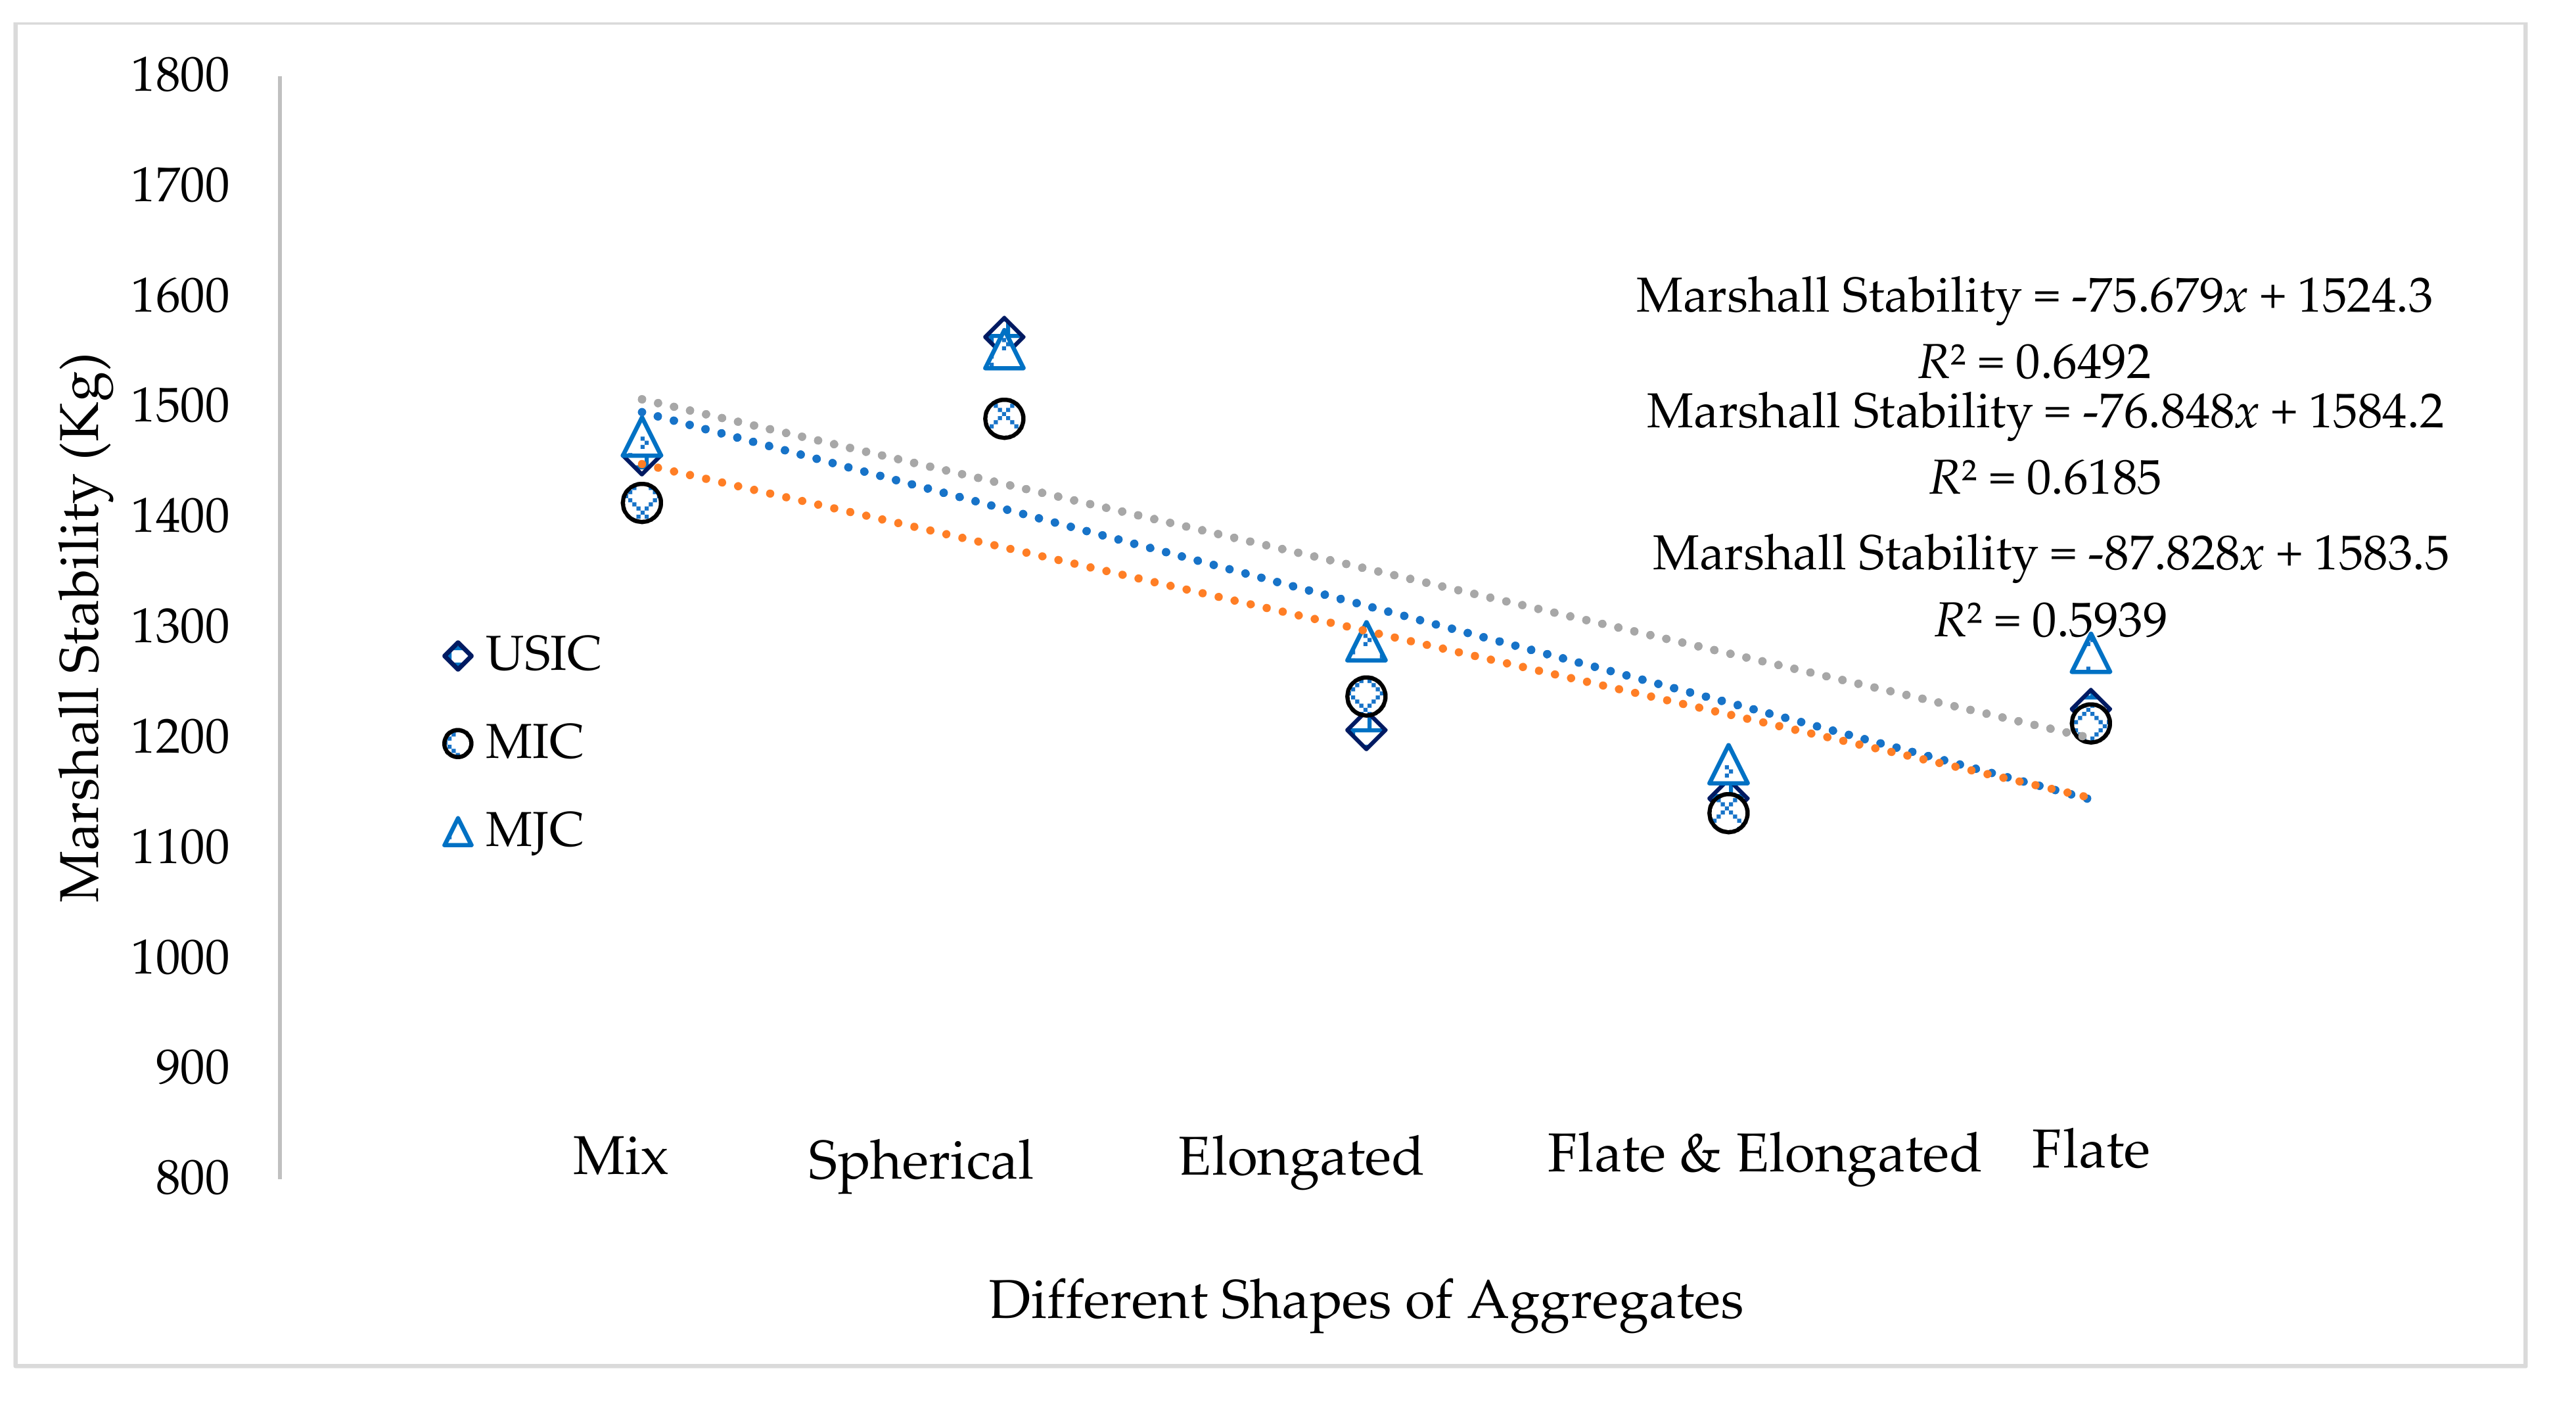
The volumetric properties of spherical aggregates showed better results from all shapes of aggregates. The flow value is measured as the deformation between no load and maximum load carried by the specimen during the test. Lower flow value was noted through the highest percentage of the spherical shape of aggregates. The lowest value was indicated in the mixture of flat and elongated shapes of aggregates. The highest air voids were noted in the elongated shape of the aggregate mixture sample indicating the least Marshall stability. The better shape of aggregates showed the optimum packing in the asphalt mixtures. The density of mixtures is also related to air voids of mixtures prepared from different shapes of aggregates. The maximum density was observed by the samples of spherical shape aggregate mixtures. The air voids present in the aggregates and the bitumen are expected to fill up, which increases with raising the surface area of aggregates. It was noted that the highest values were achieved for the spherical shape aggregates. However, the spherical-shaped aggregates attained the maximum percentage of voids in the mineral aggregates, and elongated particles indicated the lowest values. Furthermore, Figure 12 and Figure 13 indicate the effect of Marshall stability on the aggregate shapes and types of crushers and correlation, respectively.
It can be noted from Figure 12 that Marshall stability is significantly changing with aggregate shapes and types of crushers. Initially, it indicates the highest value for spherical aggregates from all crushers and queries, decreasing from a mix, elongated, flat and elongated, and flat shape. The spherical shape contains the highest values of Marshall stability due to optimum packing with the least air voids and the most appropriate shaper parameters. The spherical shape is indicating the aggregates particles ideal shape and texture. However, stability values have decreased as the particles are shifted from spherical to elongated, and a similar trend was indicated by Adiseshu, G. and G. Naidu [44]. In addition, it can be noted from Figure 13 that through developing a linear correlation for stability and type of crushers, MJC indicated the highest correlation. It can be noted that the MJC aggregate of different sieve sizes indicated the highest values of shape properties. The analysis of variance (ANOVA) was conducted for regression equations, and subsequent significance values (Sig.) were established for each linear regression model. It was observed that the (Sig.) value of each model were less than 0.05 that indicate the statistical validity of correlations. Therefore, it may be noted that Margalla quarry with the jaw crushing technique has indicated the most appropriate results to utilize in constructing different layers of the flexible pavements.
4. Conclusions
This research study compared shape parameters (shape factor, form factor, angularity, sphericity and roundness). conventional flakiness index, and elongation index of aggregates from different sources and types of crushers. In addition, the effect of Marshall stability on different types of crushers and their correlations were developed to validate the results. The following conclusions can be drawn based on the results and discussion presented in this paper.
- Digital Image Processing (DIP) is a valuable technique to determine the physical shape parameters of aggregates. Image processing results can effectively be used to classify aggregates into spherical, elongated, and flat particles along with quantification of shape, angularity, and surface texture of aggregates.
- Characterization of aggregate samples based on Image-J Software collected from various sources revealed that the influence of the type of crusher is significant with the most appropriate MJC, MIC, and USIC, respectively. The physical and mechanical properties of aggregates change significantly by varying the crushing technique.
- The Marshall stability is significantly changing with aggregate shapes and types of crushers. Initially, it indicates the highest value for spherical aggregates from all crushers and queries, decreasing from a mix, elongated, flat and elongated, and flat shape, respectively. The spherical shape contains the highest values due to optimum packing with the least air voids and comparably most appropriate shaper parameters.
- Investigating the effects of crushing techniques for developing linear correlation, it has been concluded that shape parameters are correlated with different sieve sizes and types of crushers, while MJC indicated the most appropriate results.
- This research will act as guidelines for the industry in the production of aggregates to improve the quality by implementing the proposed crushing technique (jaw crushing). The appropriate shape parameters values will help increase the flexible pavement load resistance by influencing the mechanical properties of aggregates.
5. Future Recommendation
This research study recommends that aggregate produced with appropriate shape parameters be applied during the construction of pavements. The research can be performed by simulating the results before and after applying this technique and how it increases the design life of the pavement by resisting the loads.
Author Contributions
Conceptualization, methodology, and original draft preparation, G.Y.; formal analysis, resources, review and editing, W.S.A.; supervision, I.H.; software, and editing, A.H.Q. All authors have read and agreed to the published version of the manuscript.
Funding
The research was supported by Shale Gas Extraction Technology using Electrotechnical Methods Research Grants-Cost Center: 0153AB-A33.
Institutional Review Board Statement
Not applicable.
Informed Consent Statement
Not applicable.
Data Availability Statement
Data is contained within the article.
Acknowledgments
Authors would like to thank the University of Engineering and Technology Taxila, Pakistan and the University of Lahore, Islamabad Campus, Pakistan, for providing labs and platforms for conducting this study.
Conflicts of Interest
The authors declare no conflict of interest.
References
- Li, B.; Zhang, C.; Xiao, P.; Wu, Z. Evaluation of coarse aggregate morphological characteristics affecting performance of heavy-duty asphalt pavements. Constr. Build. Mater. 2019, 225, 170–181. [Google Scholar] [CrossRef]
- Valdes-Vidal, G.; Calabi-Floody, A.; Sanchez-Alonso, E.; Miro, R. Effect of aggregate type on the fatigue durability of asphalt mixtures. Constr. Build. Mater. 2019, 224, 124–131. [Google Scholar] [CrossRef]
- Cui, P.; Xiao, Y.; Yan, B.; Li, M.; Wu, S. Morphological characteristics of aggregates and their influence on the performance of asphalt mixture. Constr. Build. Mater. 2018, 186, 303–312. [Google Scholar] [CrossRef]
- Gao, J.; Wang, H.; Bu, Y.; You, Z.; Hasan, M.R.M.; Irfan, M. Effects of coarse aggregate angularity on the microstructure of asphalt mixture. Constr. Build. Mater. 2018, 183, 472–484. [Google Scholar] [CrossRef]
- Gong, F.; Liu, Y.; Zhou, X.; You, Z. Lab assessment and discrete element modeling of asphalt mixture during compaction with elongated and flat coarse aggregates. Constr. Build. Mater. 2018, 182, 573–579. [Google Scholar] [CrossRef]
- Ding, X.; Ma, T.; Gao, W. Morphological characterization and mechanical analysis for coarse aggregate skeleton of asphalt mixture based on discrete-element modeling. Constr. Build. Mater. 2017, 154, 1048–1061. [Google Scholar] [CrossRef]
- Xie, X.; Lu, G.; Liu, P.; Wang, D.; Fan, Q.; Oeser, M. Evaluation of morphological characteristics of fine aggregate in asphalt pavement. Constr. Build. Mater. 2017, 139, 1–8. [Google Scholar] [CrossRef]
- Liu, Y.; Sun, W.; Nair, H.; Stephen Lane, D.; Wang, L. Quantification of aggregate morphologic characteristics as related to mechanical properties of asphalt concrete with improved FTI system. J. Mater. Civ. Eng. 2016, 28, 04016046. [Google Scholar] [CrossRef]
- Topal, A.; Sengoz, B. Determination of fine aggregate angularity in relation with the resistance to rutting of hot-mix asphalt. Constr. Build. Mater. 2005, 19, 155–163. [Google Scholar] [CrossRef]
- McNally, G.; Branagan, D. An overview of the engineering geology of the Botany Basin. In Environmental Geology of the Botany Basin; McNally, G.H., Jankowski, J., Eds.; Conference Publications: Sydney, Australia, 1998; pp. 1–23. [Google Scholar]
- Li, Y.; Onasch, C.M.; Guo, Y. GIS-based detection of grain boundaries. J. Struct. Geol. 2008, 30, 431–443. [Google Scholar] [CrossRef]
- Neham, S.; Ali, R.; Ashour, H. Evaluation of hot mix asphalt resilient modulus based on aggregate morphological properties. In IOP Conference Series: Materials Science and Engineering; IOP Publishing: Bristol, UK, 2018; p. 012002. [Google Scholar]
- Hafeez, I.; Juniad, F.; Kamal, M.; Hussain, J. Influence of single-and two-stage aggregate manufacturing mechanisms on asphalt mixture performance. J. Mater. Civ. Eng. 2016, 28, 04015180. [Google Scholar] [CrossRef]
- Petrounias, P.; Giannakopoulou, P.P.; Rogkala, A.; Kalpogiannaki, M.; Koutsovitis, P.; Damoulianou, M.-E.; Koukouzas, N. Petrographic characteristics of sandstones as a basis to evaluate their suitability in construction and energy storage applications. A case study from Klepa Nafpaktias (central western Greece). Energies 2020, 13, 1119. [Google Scholar] [CrossRef] [Green Version]
- Öztürk, A.U.; Erdem, R.T.; Kozanoglu, C. Investigation of crushing type of concrete aggregates on mechanical properties of concrete. Int. J. Mater. Eng. 2012, 2, 6–9. [Google Scholar] [CrossRef] [Green Version]
- Guimaraes, M.; Valdes, J.; Palomino, A.; Santamarina, J.C. Aggregate production: Fines generation during rock crushing. Int. J. Miner. Process. 2007, 81, 237–247. [Google Scholar] [CrossRef]
- Bessa, I.S.; Branco, V.T.C.; Soares, J.B.; Neto, J.A.N. Aggregate shape properties and their influence on the behavior of hot-mix asphalt. J. Mater. Civ. Eng. 2015, 27, 04014212. [Google Scholar] [CrossRef]
- Rafiq, W.; Napiah, M.; Habib, N.Z.; Sutanto, M.H.; Alaloul, W.S.; Khan, M.I.; Musarat, M.A.; Memon, A.M. Modeling and design optimization of reclaimed asphalt pavement containing crude palm oil using response surface methodology. Constr. Build. Mater. 2021, 291, 123288. [Google Scholar] [CrossRef]
- Al-Sabaeei, A.M.; Napiahet, M.; Sutanto, M.; Alaloul, W.; Yusoff, N.I.M.; Khan, M.I.; Saeed, S.M. Physicochemical, rheological and microstructural properties of Nano-Silica modified Bio-Asphalt. Constr. Build. Mater. 2021, 297, 123772. [Google Scholar] [CrossRef]
- Leon, L.P.; Gay, D. Gene expression programming for evaluation of aggregate angularity effects on permanent deformation of asphalt mixtures. Constr. Build. Mater. 2019, 211, 470–478. [Google Scholar] [CrossRef]
- BS 812-105. Methods for Determination of Particle Shape; BSI: London, UK, 1989; p. 10. [Google Scholar]
- Roberts, F.L. Hot Mix Asphalt Materials, Mixture Desgin, and Construction; NAPA Education Foundation: Napa, CA, USA, 1996. [Google Scholar]
- Mangulkar, M.N.; Jamkar, S.S. Digital image processing based system for the characterization of coarse aggregates. Jordan J. Civ. Eng. 2016, 10, 1. [Google Scholar] [CrossRef]
- Masad, E.; Sivakumar, K. Advances in the characterization and modeling of civil engineering materials using imaging techniques. J. Comput. Civ. Eng. 2004, 18, 1. [Google Scholar] [CrossRef]
- Arasan, S.; Hasiloglu, A.S.; Akbulut, S. Shape Properties of Natural and Crushed Aggregate Using Image Analysis. Int. J. Civ. Struct. Eng. 2010, 1, 221–233. [Google Scholar]
- Polat, R.; Yadollahi, M.M.; Sagsoz, A.E.; Arasan, S. The correlation between aggregate shape and compressive strength of concrete: Digital image processing approach. Int. J. Struct. Civ. Eng. Res. 2013, 2, 63–80. [Google Scholar]
- Barksdale, R.D.; Kemp, M.A.; Sheffield, W.J.; Hubbard, J.L. Measurement of aggregate shape, surface area, and roughness. Transp. Res. Rec. 1991, 1301, 107–116. [Google Scholar]
- Mitchell, J.K.; Soga, K. Fundamentals of Soil Behavior; John Wiley & Sons: New York, NY, USA, 2005; Volume 3. [Google Scholar]
- Arasan, S.; Yenera, E.; Hattatoglu, F.; Hinislioglua, S.; Akbuluta, S. Correlation between shape of aggregate and mechanical properties of asphalt concrete: Digital image processing approach. Road Mater. Pavement Des. 2011, 12, 239–262. [Google Scholar] [CrossRef]
- Bish, D.L.; Blake, D.; Vaniman, D.; Chipera, S.; Morris, R.; Ming, D.; Treiman, A.; Sarrazin, P.; Morrison, S.; Downs, R.T. X-ray diffraction results from Mars Science Laboratory: Mineralogy of Rocknest at Gale crater. Science 2013, 341, 1238932. [Google Scholar] [CrossRef] [PubMed] [Green Version]
- Kuo, C.-Y.; Freeman, R.B. Imaging indices for quantification of shape, angularity, and surface texture of aggregates. Transp. Res. Rec. 2000, 1721, 57–65. [Google Scholar] [CrossRef]
- Nowoświat, A.; Sorociak, W.; Żuchowski, R. The impact of the application of thin emulsion mat microsurfacing on the level of noise in the environment. Constr. Build. Mater. 2020, 263, 120626. [Google Scholar] [CrossRef]
- Freitas, E.; Pereira, P.; de Picado-Santos, L.; Santos, A. Traffic noise changes due to water on porous and dense asphalt surfaces. Road Mater. Pavement Des. 2009, 10, 587–607. [Google Scholar] [CrossRef]
- Slebi-Acevedo, C.J.; Lastra-González, P.; Calzada-Pérez, M.A.; Castro-Fresno, D. Effect of synthetic fibers and hydrated lime in porous asphalt mixture using multi-criteria decision-making techniques. Materials 2020, 13, 675. [Google Scholar] [CrossRef] [Green Version]
- Haider, S.; Hafeez, I.; Ullah, R. Sustainable use of waste plastic modifiers to strengthen the adhesion properties of asphalt mixtures. Constr. Build. Mater. 2020, 235, 117496. [Google Scholar] [CrossRef]
- Alaloul, W.S.; Salaheen, M.A.; Malkawi, A.B.; Alzubi, K.; Al-Sabaeei, A.M.; Musarat, M.A. Utilizing of oil shale ash as a construction material: A systematic review. Constr. Build. Mater. 2021, 299, 123844. [Google Scholar] [CrossRef]
- Kuo, C.-Y.; Frost, J.; Lai, J.; Wang, L. Three-dimensional image analysis of aggregate particles from orthogonal projections. Transp. Res. Rec. 1996, 1526, 98–103. [Google Scholar] [CrossRef]
- Fletcher, T.; Chandan, C.; Masad, E.; Sivakumar, K. Measurement of aggregate texture and its influence on hot mix asphalt (HMA) permanent deformation. J. Test. Eval. 2002, 30, 524–531. [Google Scholar]
- Stempkowska, A.; Gawenda, T.; Naziemiec, Z.; Adam Ostrowski, K.; Saramak, D.; Surowiak, A. Impact of the geometrical parameters of dolomite coarse aggregate on the thermal and mechanic properties of preplaced aggregate concrete. Materials 2020, 13, 4358. [Google Scholar] [CrossRef]
- Jaya, R.P.; Hassan, N.A.; Mahmud, M.Z.H.; Aziz, M.M.A.; Hamzah, M.O.; Wan, C.N.C. Effect of aggregate shape on the properties of asphaltic concrete AC14. J. Teknol. 2014, 71, 3. [Google Scholar]
- Rajan, B.; Singh, D. Comparison of shape parameters and laboratory performance of coarse aggregates produced from different types of crushing operations. J. Mater. Civ. Eng. 2017, 29, 04017044. [Google Scholar] [CrossRef]
- Li, L.; Guo, M.; Zeng, C. Influence of the Chemical Composition of asphalt and the 3D morphology of the aggregate on contact surface adhesion. Adv. Civ. Eng. 2021, 2021, 8870295. [Google Scholar]
- Ferreira, T.; Rasband, W. ImageJ user guide. ImageJ/Fiji 2012, 1, 155–161. [Google Scholar]
- Adiseshu, G.; Naidu, G. Influence of coarse aggregate shape factors on bituminous mixtures. Int. J. Eng. Res. Appl. (IJERA) 2011, 1, 2013–2014. [Google Scholar]
Figure 1.
Research methodology flow chart.

Figure 2.
(a) Front & top view, (b) 3 Dimensions, (c) Image capturing system.


Figure 3.
Step wise aggregates image processing.

Figure 4.
Image processing at the Image-J.

Figure 5.
Aspect ratio of different aggregate shapes and types of crushers.

Figure 6.
Shape factor of different aggregate shapes and type of crushers.

Figure 7.
Form factor of different shapes of aggregates and types of crushers.

Figure 8.
Sphericity of different shapes of aggregates and types of crushers.

Figure 9.
Roundness of different shapes of aggregates and types of crushers.

Figure 10.
Angularity index of different aggregate shapes and types of crushers.

Figure 11.
Effect of spherical shape aggregates on type of crusher.

Figure 12.
Effect of Marshall stability on aggregate shape and crusher type.

Figure 13.
Correlation of Marshall stability with aggregate shape and crusher type.


Table 1.
Mass of aggregates for different fractions.
| Type of Crushers | Mass of Aggregates for Each Sieve Size (Kg) | ||||
|---|---|---|---|---|---|
| 37.5–25 (mm) | 25–19.5 (mm) | 19.5–12.5 (mm) | 12.5–9.5 (mm) | 9.5–4.75 (mm) | |
| USIC | 15 | 5 | 2 | 1 | 0.5 |
| MIC | 15 | 5 | 2 | 1 | 0.5 |
| MJC | 15 | 5 | 2 | 1 | 0.5 |
Table 2.
Proportion of aggregates from different shape.
| Aggregate Source | Sieve Size (mm) | Spherical Aggregates (%) | Flat Aggregates (%) | Elongated Aggregates (%) | Flat and Elongated Aggregates (%) |
|---|---|---|---|---|---|
| USIC | 37.5–25 | 54 | 14 | 9 | 23 |
| MIC | 51 | 16 | 10 | 24 | |
| MJC | 48 | 17 | 11 | 26 | |
| USIC | 25–19.5 | 53 | 13 | 9 | 26 |
| MIC | 50 | 14 | 8 | 27 | |
| MJC | 48 | 12 | 13 | 27 | |
| USIC | 19.5–12.5 | 50 | 16.5 | 12.5 | 21 |
| MIC | 56 | 17 | 10 | 17 | |
| MJC | 48 | 14 | 14 | 24 | |
| USIC | 12.5–9.5 | 42 | 18 | 13 | 27 |
| MIC | 44 | 16 | 12 | 28 | |
| MJC | 39 | 17 | 14 | 30 | |
| USIC | 9.5–4.75 | 40 | 24 | 8 | 28 |
| MIC | 38 | 20 | 11 | 31 | |
| MJC | 43 | 17 | 7 | 33 |
Table 3.
Aggregate gradations for bituminous mixtures.
| Sieve Size (mm) | 19.0 | 12.5 | 9.5 | 4.75 | 2.0 | 0.475 | 0.177 | 0.075 |
|---|---|---|---|---|---|---|---|---|
| Passing (%) by Weight (Mix Aggregates) | 5 | 20 | 26 | 16 | 12 | 10 | 6 | 5 |
| Passing (%) by Weight (Spherical) | 4 | 21 | 24 | 14 | 11 | 11 | 8 | 7 |
| Passing (%) by Weight (Flate) | 3 | 23 | 22 | 16 | 11 | 13 | 7 | 5 |
| Passing (%) by Weight (Elongated) | 6 | 18 | 23 | 15 | 12 | 11 | 7 | 8 |
| Passing (%) by Weight (Flat and Elongated) | 5 | 20 | 22 | 16 | 13 | 10 | 8 | 6 |
Table 4.
Designation codes of aggregate fractions in MIC, MJC and USIC.
| Aggregate Source and Crusher Type | Sieve Sizes (mm) | Shape of Particles | Code |
|---|---|---|---|
| Ubhan Shah Impact Crusher (USIC) Rahim Yar Khan | 37.5–25.0 | Mix(M) | 1 |
| Spherical(S) | 2 | ||
| Flat(F) | 3 | ||
| Elongated(E) | 4 | ||
| Flat and Elongated(F&E) | 5 | ||
| 25.0–19.5 | Mix(M) | 6 | |
| Spherical(S) | 7 | ||
| Flat(F) | 8 | ||
| Elongated(E) | 9 | ||
| Flat and Elongated(F&E) | 10 | ||
| Margalla Impact Crusher (MIC) Islamabad | 19.5–12.5 | Mix(M) | 11 |
| Spherical(S) | 12 | ||
| Flat(F) | 13 | ||
| Elongated(E) | 14 | ||
| Flat and Elongated(F&E) | 15 | ||
| Margalla Jaw Crusher (MJC) Islamabad | 12.5–9.5 | Mix(M) | 16 |
| Spherical(S) | 17 | ||
| Flat(F) | 18 | ||
| Elongated(E) | 19 | ||
| Flat and Elongated(F&E) | 20 | ||
| 9.5–4.75 | Mix(M) | 21 | |
| Spherical(S) | 22 | ||
| Flat(F) | 23 | ||
| Elongated(E) | 24 | ||
| Flat and Elongated(F&E) | 25 |
Table 5.
The average values of aggregate shape properties for USIC, MIC & MJC.
| Code | Aspect Ratio | Shape Factor | Form Factor | Sphericity | Roundness | Angularity Index | ||||||||||||
|---|---|---|---|---|---|---|---|---|---|---|---|---|---|---|---|---|---|---|
| USIC | MIC | MJC | USIC | MIC | MJC | USIC | MIC | MJC | USIC | MIC | MJC | USIC | MIC | MJC | USIC | MIC | MJC | |
| 1 | 1.27 | 1.19 | 1.29 | 0.61 | 0.68 | 0.70 | 0.73 | 0.59 | 0.76 | 0.67 | 0.73 | 0.83 | 0.67 | 0.73 | 0.76 | 1.19 | 1.23 | 1.34 |
| 2 | 1.20 | 1.24 | 1.28 | 0.72 | 0.71 | 0.68 | 0.76 | 0.76 | 0.71 | 0.84 | 0.86 | 0.80 | 0.84 | 0.81 | 0.78 | 1.32 | 1.32 | 1.42 |
| 3 | 1.20 | 1.33 | 1.41 | 0.44 | 0.40 | 0.30 | 0.72 | 0.71 | 0.65 | 0.70 | 0.69 | 0.58 | 0.84 | 0.76 | 0.72 | 1.40 | 1.41 | 1.56 |
| 4 | 2.09 | 1.98 | 2.28 | 0.45 | 0.44 | 0.41 | 0.64 | 0.62 | 0.86 | 0.55 | 0.57 | 0.49 | 0.48 | 0.51 | 0.45 | 1.56 | 1.60 | 1.71 |
| 5 | 1.87 | 1.68 | 1.73 | 0.42 | 0.51 | 0.54 | 0.62 | 0.67 | 0.67 | 0.54 | 0.62 | 0.60 | 0.54 | 0.60 | 0.59 | 1.61 | 1.51 | 1.49 |
| 6 | 1.16 | 1.17 | 1.21 | 0.64 | 0.66 | 0.56 | 0.63 | 0.71 | 0.65 | 0.76 | 0.65 | 0.76 | 0.64 | 0.70 | 0.71 | 1.39 | 1.29 | 1.51 |
| 7 | 1.20 | 1.23 | 1.26 | 0.74 | 0.76 | 0.46 | 0.68 | 0.78 | 0.67 | 0.86 | 0.85 | 0.78 | 0.84 | 0.80 | 0.81 | 1.49 | 1.32 | 1.54 |
| 8 | 1.32 | 1.35 | 1.31 | 0.39 | 0.32 | 0.33 | 0.69 | 0.76 | 0.69 | 0.89 | 0.60 | 0.60 | 0.77 | 0.75 | 0.78 | 1.46 | 1.34 | 1.47 |
| 9 | 1.97 | 1.93 | 2.34 | 0.53 | 0.54 | 0.49 | 0.64 | 0.62 | 0.86 | 0.59 | 0.62 | 0.54 | 0.51 | 0.55 | 0.43 | 1.56 | 1.66 | 1.70 |
| 10 | 1.47 | 1.74 | 1.78 | 0.47 | 0.54 | 0.46 | 0.69 | 0.70 | 0.63 | 0.63 | 0.63 | 0.51 | 0.68 | 0.58 | 0.57 | 1.46 | 1.44 | 1.64 |
| 11 | 1.31 | 1.32 | 1.42 | 0.67 | 0.64 | 0.67 | 0.69 | 0.71 | 0.65 | 0.76 | 0.76 | 0.74 | 0.71 | 0.73 | 0.72 | 1.37 | 1.39 | 1.43 |
| 12 | 1.34 | 1.36 | 1.44 | 0.70 | 0.66 | 0.63 | 0.71 | 0.73 | 0.67 | 0.79 | 0.78 | 0.75 | 0.76 | 0.75 | 0.71 | 1.42 | 1.38 | 1.42 |
| 13 | 1.45 | 1.41 | 1.30 | 0.34 | 0.32 | 0.28 | 0.66 | 0.72 | 0.71 | 0.60 | 0.58 | 0.58 | 0.71 | 0.71 | 0.79 | 1.53 | 1.40 | 1.41 |
| 14 | 2.24 | 2.23 | 1.25 | 0.50 | 0.45 | 0.50 | 0.61 | 0.61 | 0.50 | 0.55 | 0.53 | 0.46 | 0.45 | 0.46 | 0.45 | 1.65 | 1.66 | 1.90 |
| 15 | 1.68 | 1.72 | 1.82 | 0.38 | 0.42 | 0.67 | 0.66 | 0.67 | 0.67 | 0.57 | 0.58 | 0.56 | 0.60 | 0.58 | 0.57 | 1.54 | 1.50 | 1.50 |
| 16 | 1.21 | 1.25 | 1.27 | 0.71 | 0.61 | 0.72 | 0.71 | 0.73 | 0.71 | 0.79 | 0.73 | 0.71 | 0.73 | 0.72 | 0.75 | 1.35 | 1.31 | 1.33 |
| 17 | 1.29 | 1.27 | 1.26 | 0.76 | 0.63 | 0.70 | 0.73 | 0.75 | 0.75 | 0.82 | 0.78 | 0.81 | 0.78 | 0.80 | 0.81 | 1.39 | 1.33 | 1.43 |
| 18 | 1.33 | 1.43 | 1.30 | 0.36 | 0.35 | 0.31 | 0.64 | 0.70 | 0.73 | 0.64 | 0.61 | 0.60 | 0.76 | 0.70 | 0.78 | 1.58 | 1.43 | 1.34 |
| 19 | 2.67 | 2.27 | 2.20 | 0.49 | 0.43 | 0.37 | 0.54 | 0.62 | 0.58 | 0.51 | 0.51 | 0.50 | 0.39 | 0.45 | 0.44 | 1.88 | 1.61 | 1.74 |
| 20 | 1.79 | 1.86 | 1.69 | 0.43 | 0.41 | 0.45 | 0.67 | 0.62 | 0.66 | 0.59 | 0.57 | 0.60 | 0.56 | 0.54 | 0.60 | 1.51 | 1.64 | 1.52 |
| 21 | 1.33 | 1.15 | 1.24 | 0.73 | 0.61 | 0.59 | 0.71 | 0.73 | 0.74 | 0.76 | 0.76 | 0.7 | 0.742 | 0.8 | 0.81 | 1.41 | 1.34 | 1.39 |
| 22 | 1.37 | 1.18 | 1.20 | 0.71 | 0.62 | 0.57 | 0.72 | 0.75 | 0.77 | 0.78 | 0.75 | 0.78 | 0.74 | 0.85 | 0.83 | 1.40 | 1.33 | 1.30 |
| 23 | 1.52 | 1.29 | 1.19 | 0.26 | 0.32 | 0.34 | 0.68 | 0.75 | 0.75 | 0.55 | 0.61 | 0.64 | 0.67 | 0.79 | 0.85 | 1.48 | 1.33 | 1.34 |
| 24 | 2.32 | 2.40 | 2.48 | 0.46 | 0.47 | 0.50 | 0.61 | 0.59 | 0.59 | 0.55 | 0.53 | 0.53 | 0.44 | 0.42 | 0.41 | 1.65 | 1.71 | 1.71 |
| 25 | 1.94 | 2.07 | 1.73 | 0.42 | 0.44 | 0.44 | 0.64 | 0.68 | 0.66 | 0.57 | 0.57 | 0.58 | 0.52 | 0.49 | 0.52 | 1.58 | 1.47 | 1.52 |
Table 6.
Engineering properties of MIC, MJC and USIC.
| Test Title | MIC | MJC | USIC |
|---|---|---|---|
| Type of rock | Calcium carbonate | Calcium carbonate | Granite |
| Flakiness Index (%) | 9.8 | 9.2 | 10.8 |
| Shape Index (%) | 13.65 | 12.64 | 15.7 |
| Fractured Particles (%) | 100 | 100 | 100 |
| Sand Equivalent Value (%) | 73 | 71 | 74 |
| Log Angles Abrasion (%) | 20.23 | 19.1 | 21.43 |
| Water Absorption (%) | 0.97 | 0.94 | 1.02 |
Table 7.
(a) Volumetric properties of asphalt mixture for aggregates of Ubhan Shah Impact Crusher. (b) Volumetric properties of asphalt mixture for aggregates of Margalla Impact Crusher. (c) Volumetric properties of asphalt mixture for aggregates of Margalla Jaw Crusher.
Table 7.
(a) Volumetric properties of asphalt mixture for aggregates of Ubhan Shah Impact Crusher. (b) Volumetric properties of asphalt mixture for aggregates of Margalla Impact Crusher. (c) Volumetric properties of asphalt mixture for aggregates of Margalla Jaw Crusher.
| (a) | |||||
|---|---|---|---|---|---|
| Test Title | Mix | Spherical | Flat | Elongated | Flat and Elongated |
| Marshall Stability (kg) | 1456.67 | 1563.67 | 1226.56 | 1207.34 | 1145.59 |
| Flow value (0.25 mm) | 2.41 | 2.70 | 2.17 | 2.18 | 2.05 |
| Air voids (%) | 3.48 | 3.41 | 3.49 | 4.11 | 3.56 |
| Density (g/cm3) | 2.467 | 2.479 | 2.455 | 2.457 | 2.466 |
| VFA (%) | 76.53 | 77.63 | 75.94 | 74.56 | 75.36 |
| VMA (%) | 14.85 | 14.41 | 14.31 | 14.71 | 14.16 |
| OBC (%) | 4.12 | 3.98 | 4.23 | 4.34 | 4.51 |
| (b) | |||||
| Test Title | Mix | Spherical | Flat | Elongated | Flat and Elongated |
| Marshall Stability (kg) | 1424.13 | 1489.56 | 1213.97 | 1237.34 | 1132.59 |
| Flow value (0.25 mm) | 2.41 | 2.69 | 2.17 | 2.11 | 2.01 |
| Air voids (%) | 3.39 | 3.42 | 3.28 | 4.13 | 3.16 |
| Density (g/cm3) | 2.469 | 2.479 | 2.461 | 2.457 | 2.459 |
| VFA (%) | 76.23 | 78.13 | 75.94 | 73.56 | 77.36 |
| VMA (%) | 14.25 | 14.57 | 14.11 | 14.31 | 14.17 |
| OBC (%) | 4.17 | 3.96 | 4.53 | 4.59 | 4.61 |
| (c) | |||||
| Test Title | Mix | Spherical | Flat | Elongated | Flat and Elongated |
| Marshall Stability (kg) | 1473.17 | 1552.37 | 1277.16 | 1287.14 | 1176.57 |
| Flow value (0.25 mm) | 2.35 | 2.67 | 2.19 | 2.16 | 1.98 |
| Air voids (%) | 3.45 | 3.38 | 3.42 | 4.03 | 3.36 |
| Density (g/cm3) | 2.467 | 2.475 | 2.465 | 2.451 | 2.456 |
| VFA (%) | 75.53 | 77.23 | 75.34 | 72.56 | 76.36 |
| VMA (%) | 14.35 | 14.47 | 14.31 | 14.81 | 14.10 |
| OBC (%) | 4.07 | 3.95 | 4.34 | 4.41 | 4.49 |
Publisher’s Note: MDPI stays neutral with regard to jurisdictional claims in published maps and institutional affiliations. |
© 2021 by the authors. Licensee MDPI, Basel, Switzerland. This article is an open access article distributed under the terms and conditions of the Creative Commons Attribution (CC BY) license (https://creativecommons.org/licenses/by/4.0/).
Share and Cite
MDPI and ACS Style
Yaseen, G.; Alaloul, W.S.; Hafeez, I.; Qureshi, A.H. Shape Characterizing of Aggregates Produced through Different Crushing Techniques. Coatings 2021, 11, 1199. https://doi.org/10.3390/coatings11101199
AMA Style
Yaseen G, Alaloul WS, Hafeez I, Qureshi AH. Shape Characterizing of Aggregates Produced through Different Crushing Techniques. Coatings. 2021; 11(10):1199. https://doi.org/10.3390/coatings11101199
Chicago/Turabian StyleYaseen, Ghulam, Wesam Salah Alaloul, Imran Hafeez, and Abdul Hannan Qureshi. 2021. "Shape Characterizing of Aggregates Produced through Different Crushing Techniques" Coatings 11, no. 10: 1199. https://doi.org/10.3390/coatings11101199
Note that from the first issue of 2016, this journal uses article numbers instead of page numbers. See further details here.