Article

A Tale of Two Tiles: Characterization of Floor Tiles from the Nineteenth-Century Akko Tower Shipwreck (Israel)

1
School of Electrical Engineering, Tel Aviv University, Ramat Aviv 6997801, Israel
2
School of Mechanical Engineering, Tel Aviv University, Ramat Aviv 6997801, Israel
3
Department of Chemical Research Support, Weizmann Institute of Science, Rehovot 7610001, Israel
4
Institute of Earth Sciences, The Hebrew University of Jerusalem, Jerusalem 9190401, Israel
5
Leon Recanati Institute for Maritime Studies, University of Haifa, Haifa 3498838, Israel
*
Author to whom correspondence should be addressed.
Coatings 2020, 10(11), 1091; https://doi.org/10.3390/coatings10111091
Submission received: 21 October 2020 / Revised: 8 November 2020 / Accepted: 11 November 2020 / Published: 14 November 2020

Abstract

:
Fragments of decorated floor tiles were retrieved from the Akko Tower shipwreck, Israel. Most tiles were made of bright brown fired clay with a white glaze decorated with colored stenciled motifs (Type A); and others consisted of a red-brown fired clay body, coated with a brown pigment covered with transparent brown glaze (Type B). This study aimed to characterize the two tile types; to reveal information concerning the manufacturing process; and to determine the origin of their raw material. A multidisciplinary approach was used, including light microscopy, SEM-EDS, electron probe microanalysis with wavelength-dispersive X-ray spectroscopy (EPMA-WDS), XRD, Raman spectroscopy, and time-of-flight secondary ion mass spectrometry (TOF-SIMS) analyses. The characterization of both tile types demonstrated the use of different raw materials. The Type A tiles were covered with tin-opacified majolica glaze and colored with various mixtures of pigments. The blue color was due to pigment rich in cobalt; the yellow color was due to Naples yellow and lead-tin yellow I minerals; and the green, orange, and brown colors were all prepared by mixing the Naples yellow pigment with different minerals. These majolica glaze tiles were probably manufactured in Sicily. The brown coating of the Type B tiles was due to pigment rich in lead and iron minerals. These tiles were produced with different manufacturing processes, and apparently made in France.

1. Introduction

A shipwreck designated as the Akko Tower Wreck was discovered at the entrance to Akko harbor in 1966, next to the Tower of Flies, after which it was named. The ship was built under the influence of the French shipbuilding tradition during the first half of the nineteenth century in a well-established shipyard [1]. The shipwreck was the object of four underwater excavation seasons by the Leon Recanati Institute for Maritime Studies of the University of Haifa (2012, 2013, 2015, and 2016). During the excavations, various artifacts were discovered, comprising rigging elements, wooden and bone objects, stones, and ceramic floor tiles [1].
The decorated floor tiles are the subject of the present research, as part of an ongoing series of studies of the shipwreck and its artifacts [1,2,3,4,5,6,7,8]. Two types of tiles were found. Type A were about 20 cm square and 16–19 mm thick. They had a white glaze, and most were decorated with blue, yellow/orange, green, and brown colored stenciled motifs, such as arabesques, stars, flowers, and tripods (Type A, Figure 1a–d, Figure 2a–d, Figure 3a–f, and Figure 4a,b).
Plain tiles were also found. These, designated Type B, were about 14 cm square and 10 mm thick, and had a red-brown clay body coated with uniform brown pigment covered with transparent glaze material (Type B, Figure 1e,f, Figure 2e and Figure 3g,h). This type of tile is typologically dated to the nineteenth century, and could have originated from the Provence area of France (L. Vallauri, personal communication, 2014) [1], which was the largest exporter of roof and floor tiles, mainly from factories in and around Marseilles, during this period [9]. However, the absence of a stamp on the back makes it difficult to determine their exact manufacturer. Similar French floor tiles were found underwater, in the late nineteenth century Dor C shipwreck [10], and on land [11].
Surface analytical techniques are often used to study ancient materials because they provide a wide range of information with a minimal degree of damage [12]. Surface treatment techniques, such as prefiring smoothing and burnishing, were often applied to ceramic objects in order to create a more attractive appearance and to improve the surface quality. Observation and evaluation of the quality of such surface treatment provides additional information concerning the material culture, and artisans’ skills. Therefore, when the surface of ancient ceramics is characterized, the first recommended step is to examine the surface with the naked eye, and then to observe it with a stereoscopic microscope. Next, various methods can be applied in order to study the surface treatment and its quality, including petrographic examination of polished thin section samples by polarized light microscopy (LM) and/or electron microprobe analysis (EMPA) [13,14]. It should be kept in mind that finishing procedures influence the morphology and composition of the surface, and may also affect the thin layer beneath the surface [13].
A ceramic glaze is a smooth thin film that is fused to the ceramic body by firing. Characterization of glaze coatings provides details about their style of decoration (stylistic classification by typology), microstructure, chemical composition, and raw materials, and information concerning their manufacturing technology, including firing temperature. The glaze coating is heterogeneous, depending on the interface interaction between the ceramic body and the glaze during firing (interdiffusion of elements between the two layers). The colors of the glazes are obtained by the presence of transition metal ions (colorants) and/or by the presence of crystalline pigment compounds. X-ray diffraction (XRD), which can be carried out directly on the glaze surface when it is smooth enough, is the commonest method for the identification of crystalline compounds [15].
A previous study of the white glaze and the blue and yellow pigments showed that the Type A ceramic tiles were covered with a lead-based glaze decorated with cobalt blue and antimony yellow pigments. Typological examination, and the use of commercial pigments of cobalt blue and antimony yellow, indicated that the tiles were manufactured in Southern Italy, most probably produced in Sicily after 1802, and before 1850 [2,16]. The current multidisciplinary work focuses on artifacts, glaze, and green, olive, orange, and brown pigments, which had not been previously studied. Its aim is to examine the surface composition and structure of the clay bodies of the two tile types, and the glaze and pigments, in order to provide additional information concerning the tiles and the shipwreck, by combining typological examination, materials characterization, and literature data.

2. Materials and Methods

A multidisciplinary approach was adopted in order to study the composition, crystalline structure, microstructure, and manufacturing process of Type A and B tiles, and to determine the origin of their raw material. For this purpose, the body, glaze, and pigments were characterized by various methods:
(a)
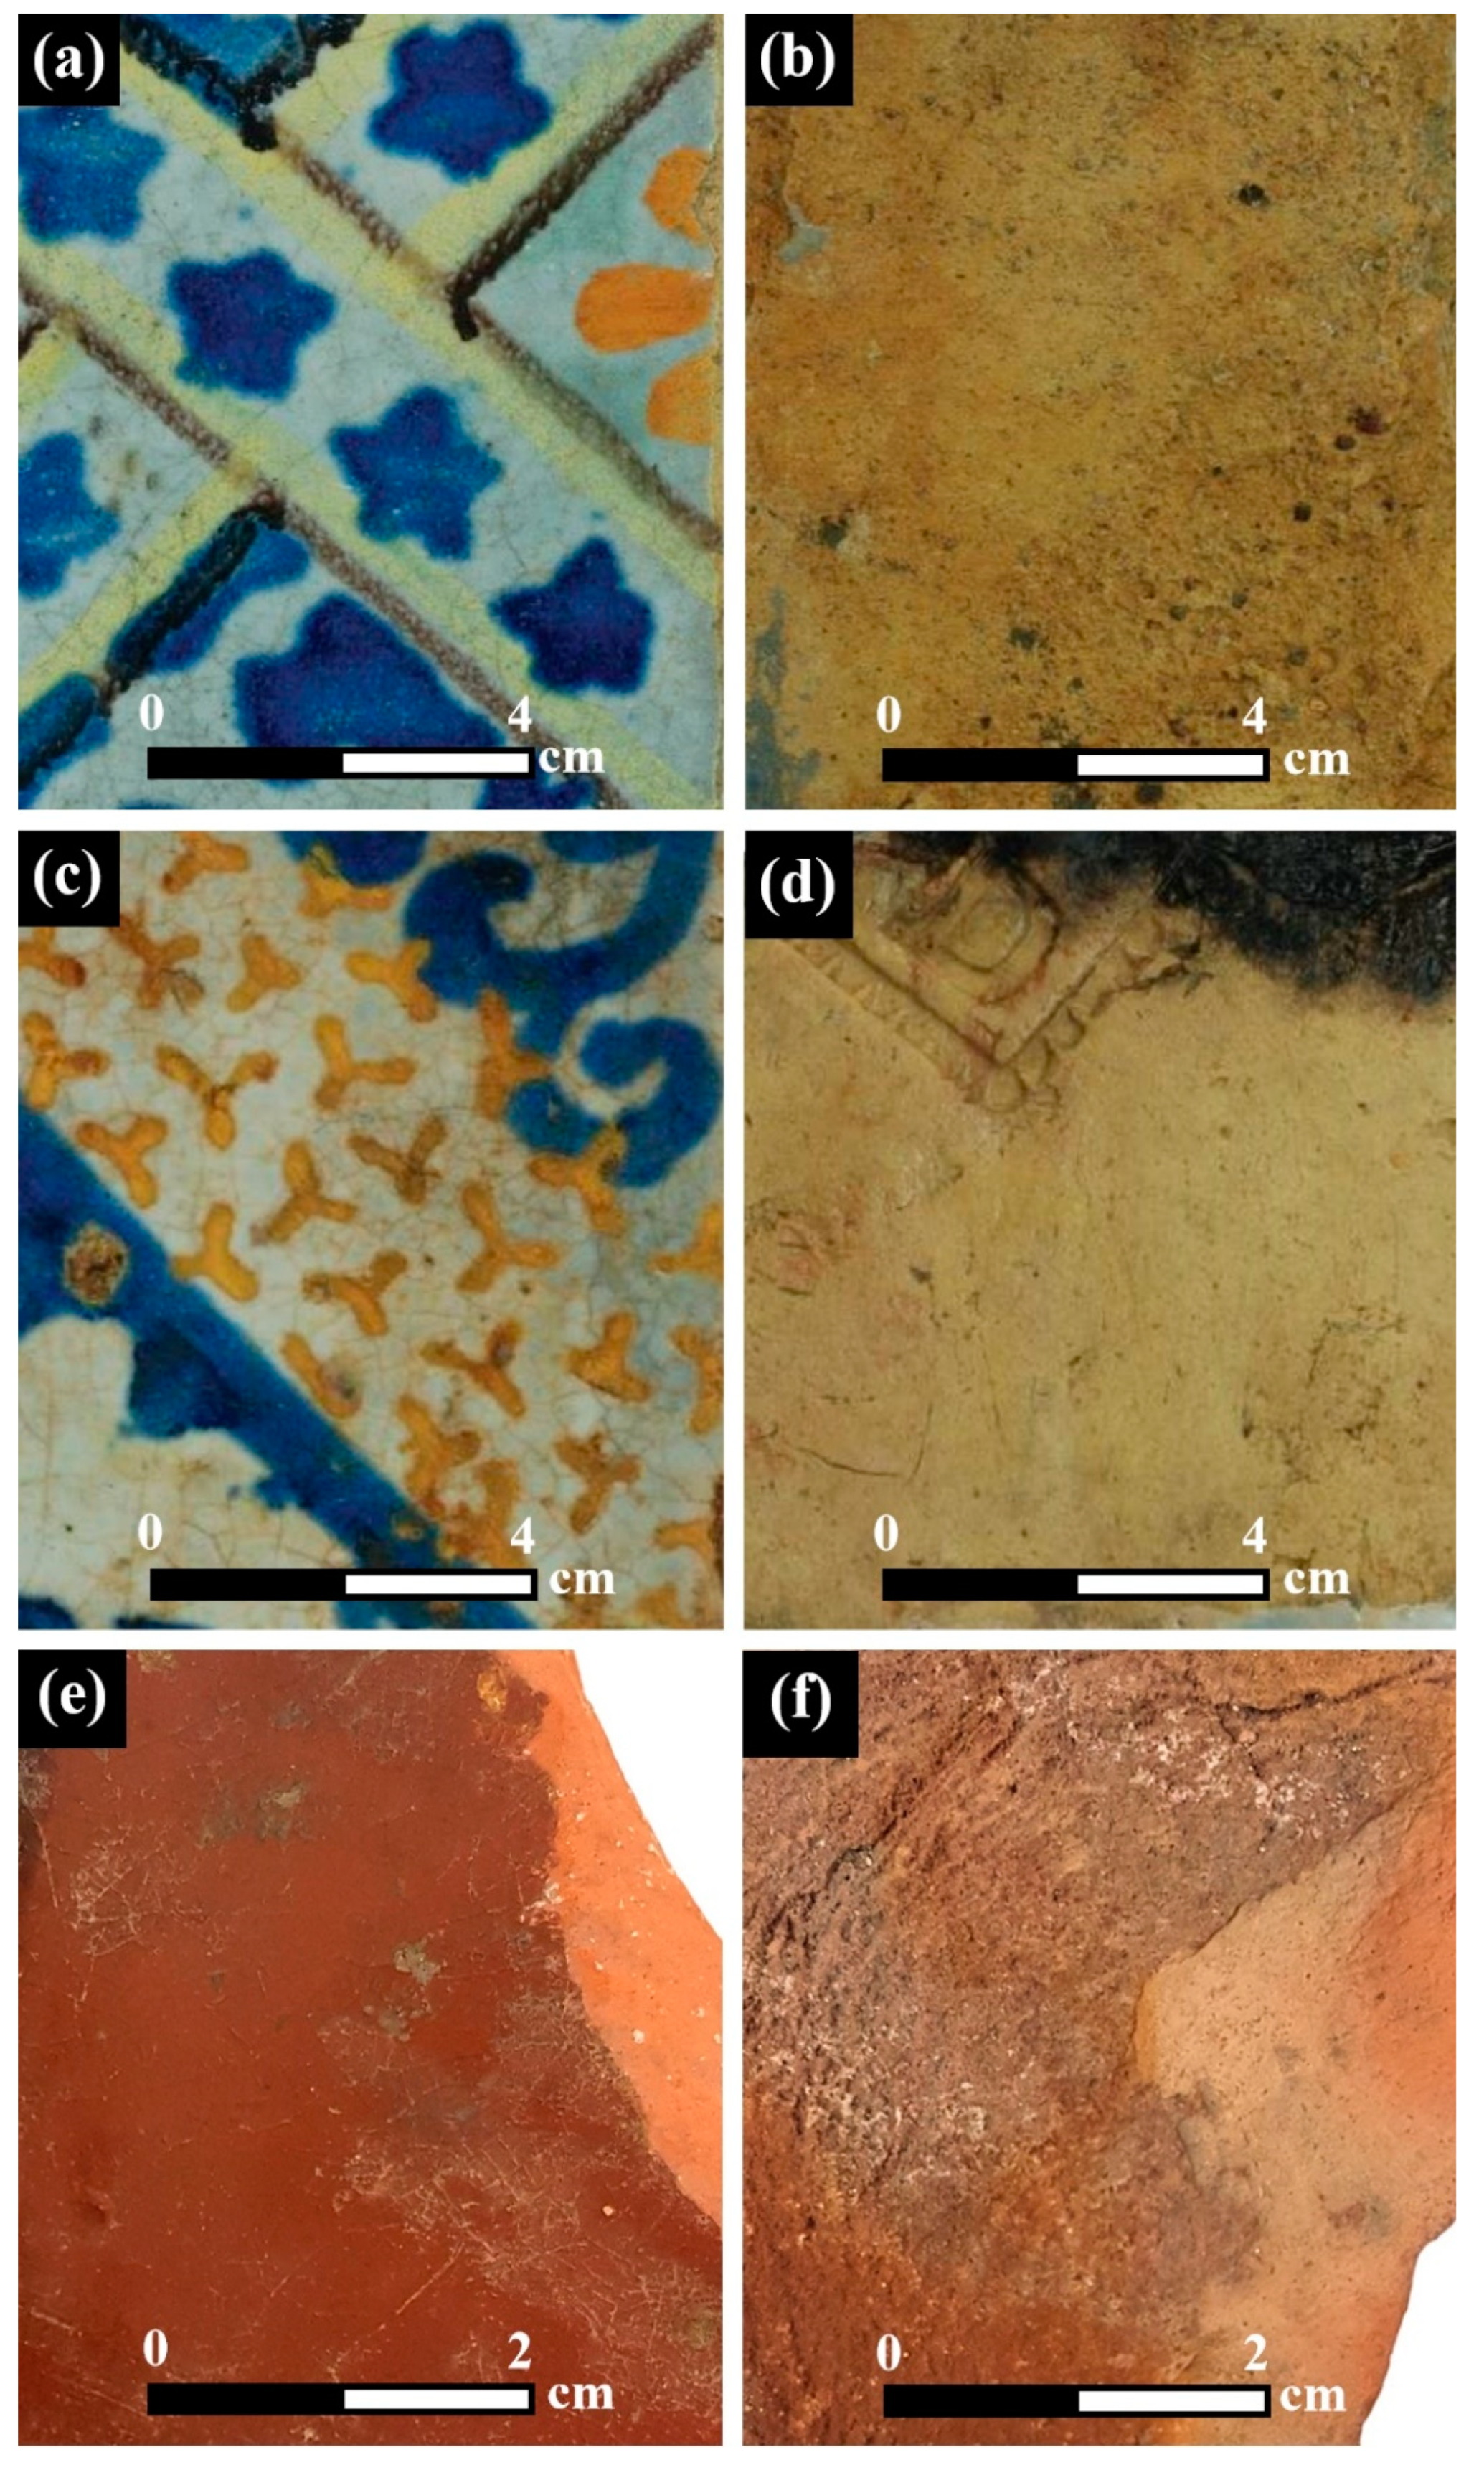
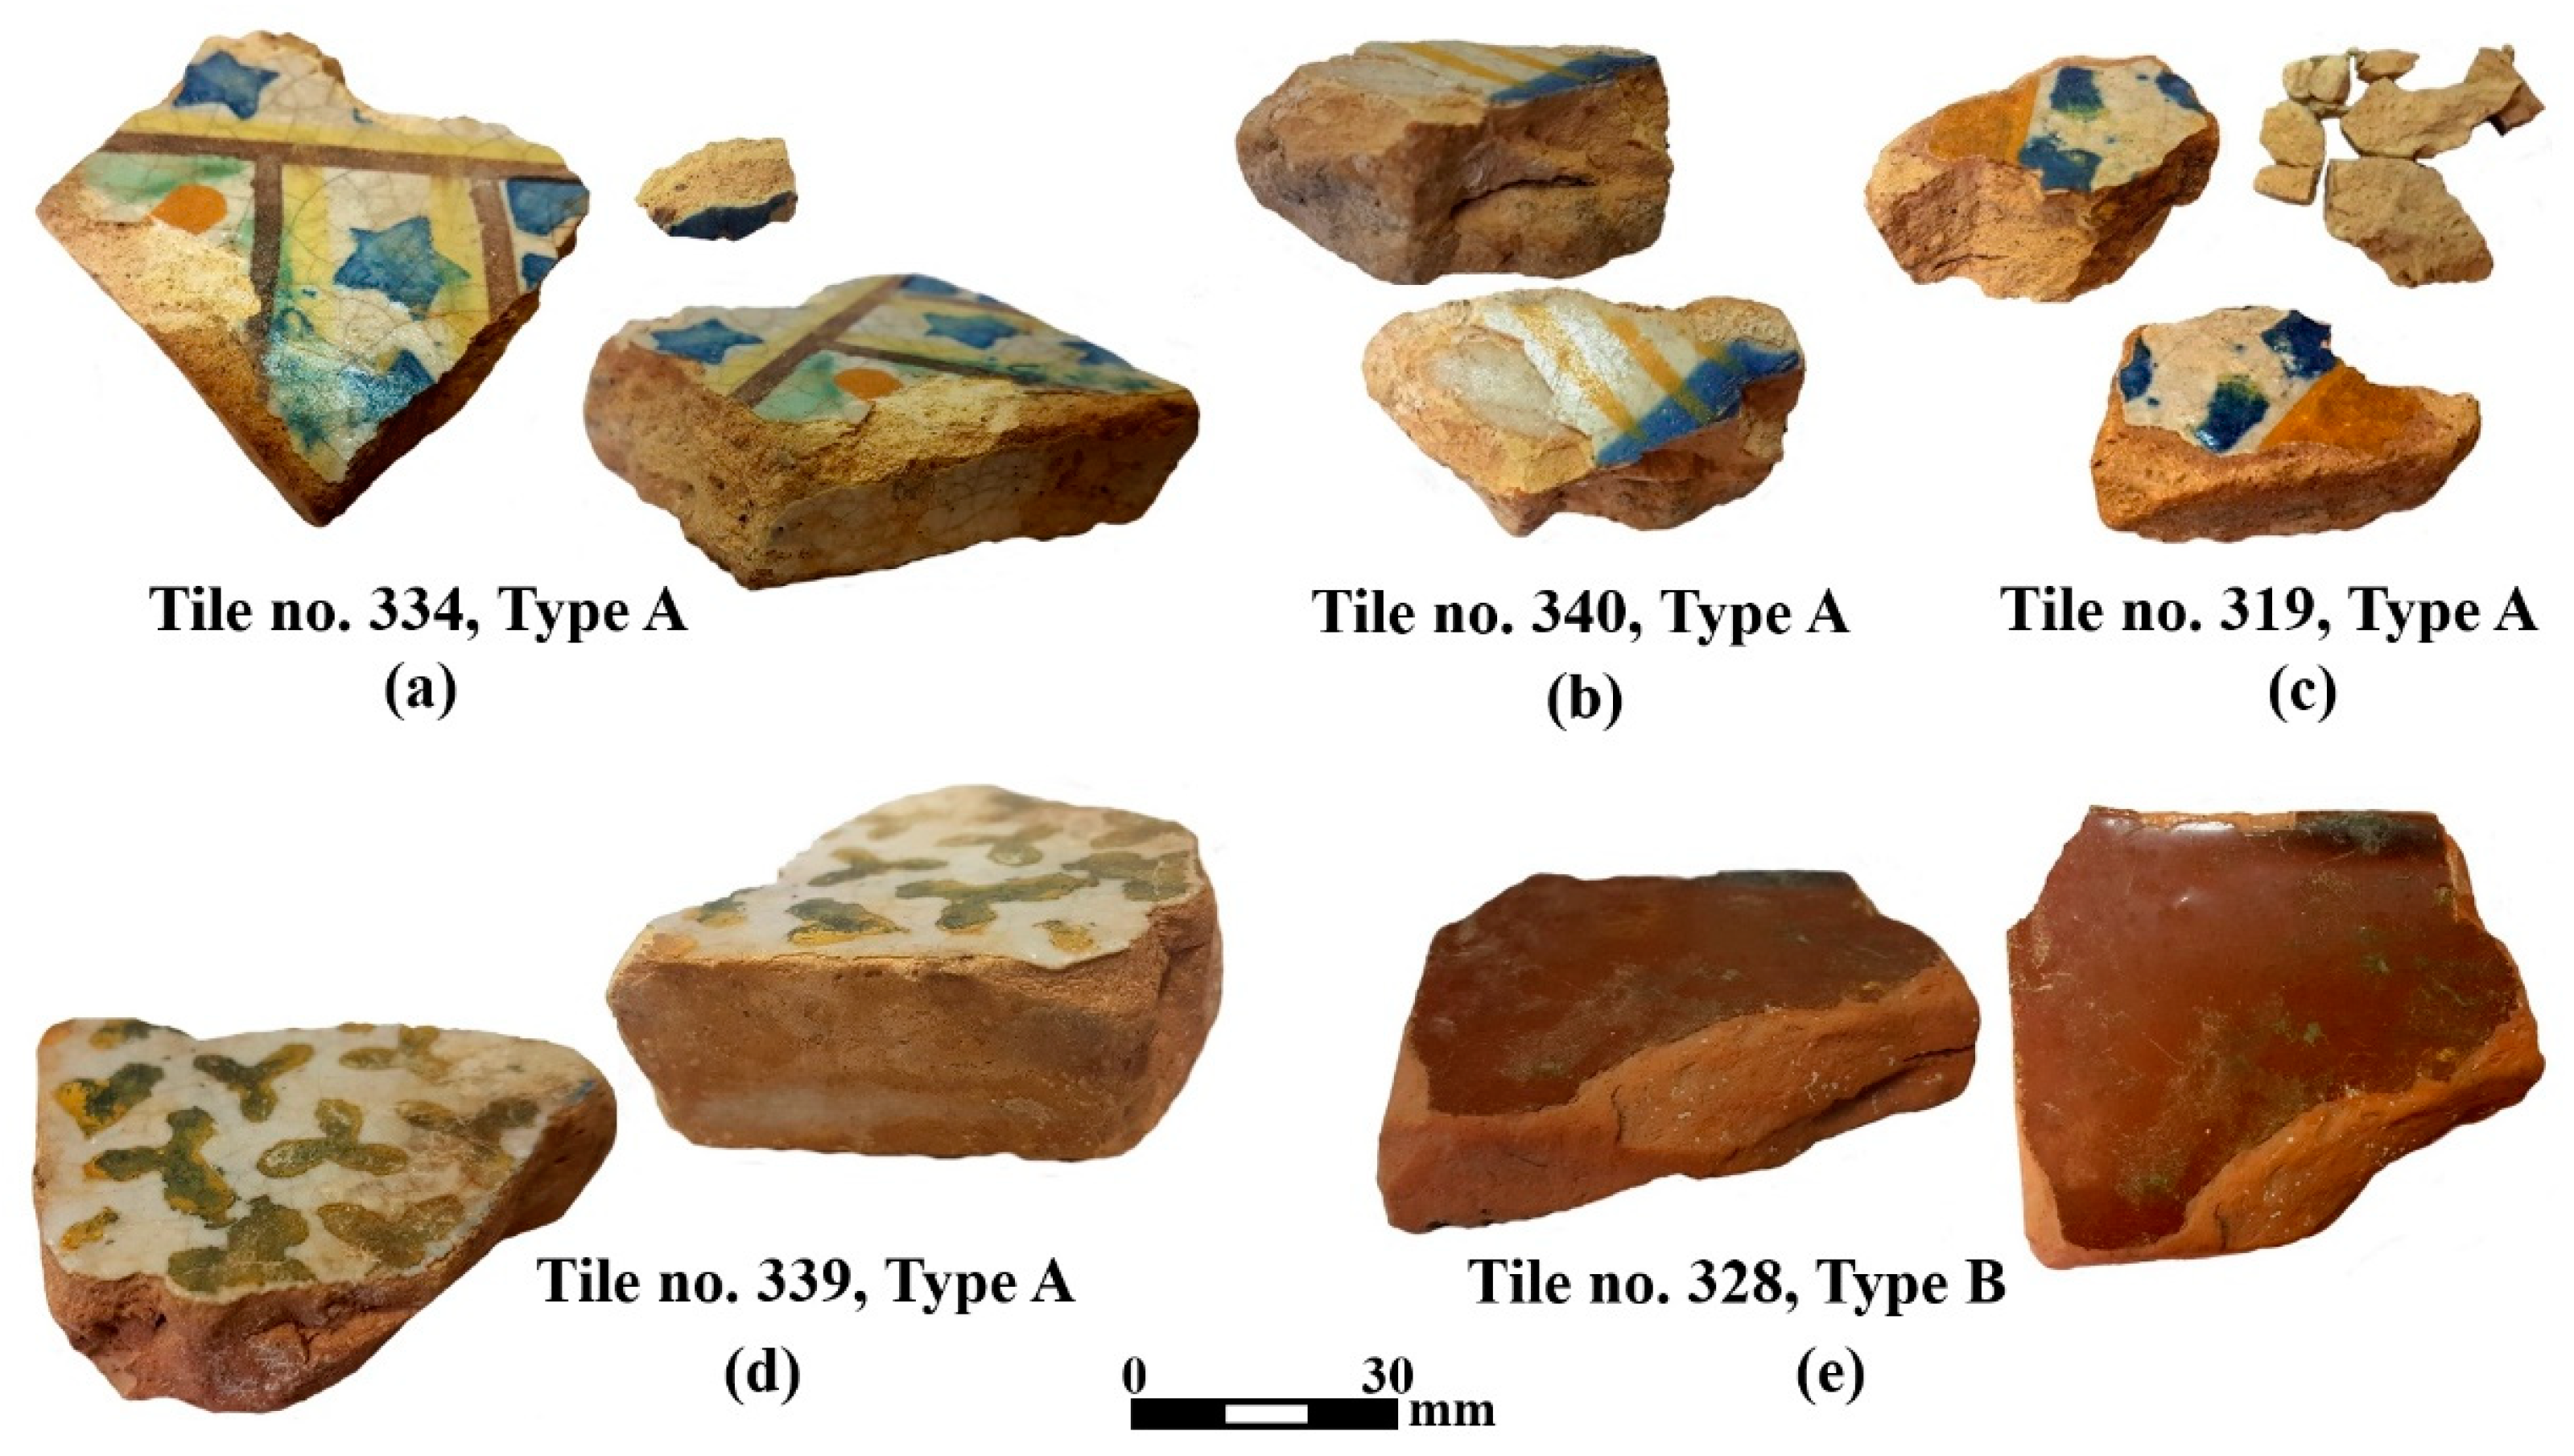
Visual testing (VT) is a non-destructive testing (NDT) method that enables immediate determination of the general condition of the object and the detection of visible macroscopic details [13,17]. VT surface observation of the tiles detects visible details, including defects that may hint at their manufacturing process.
(b)
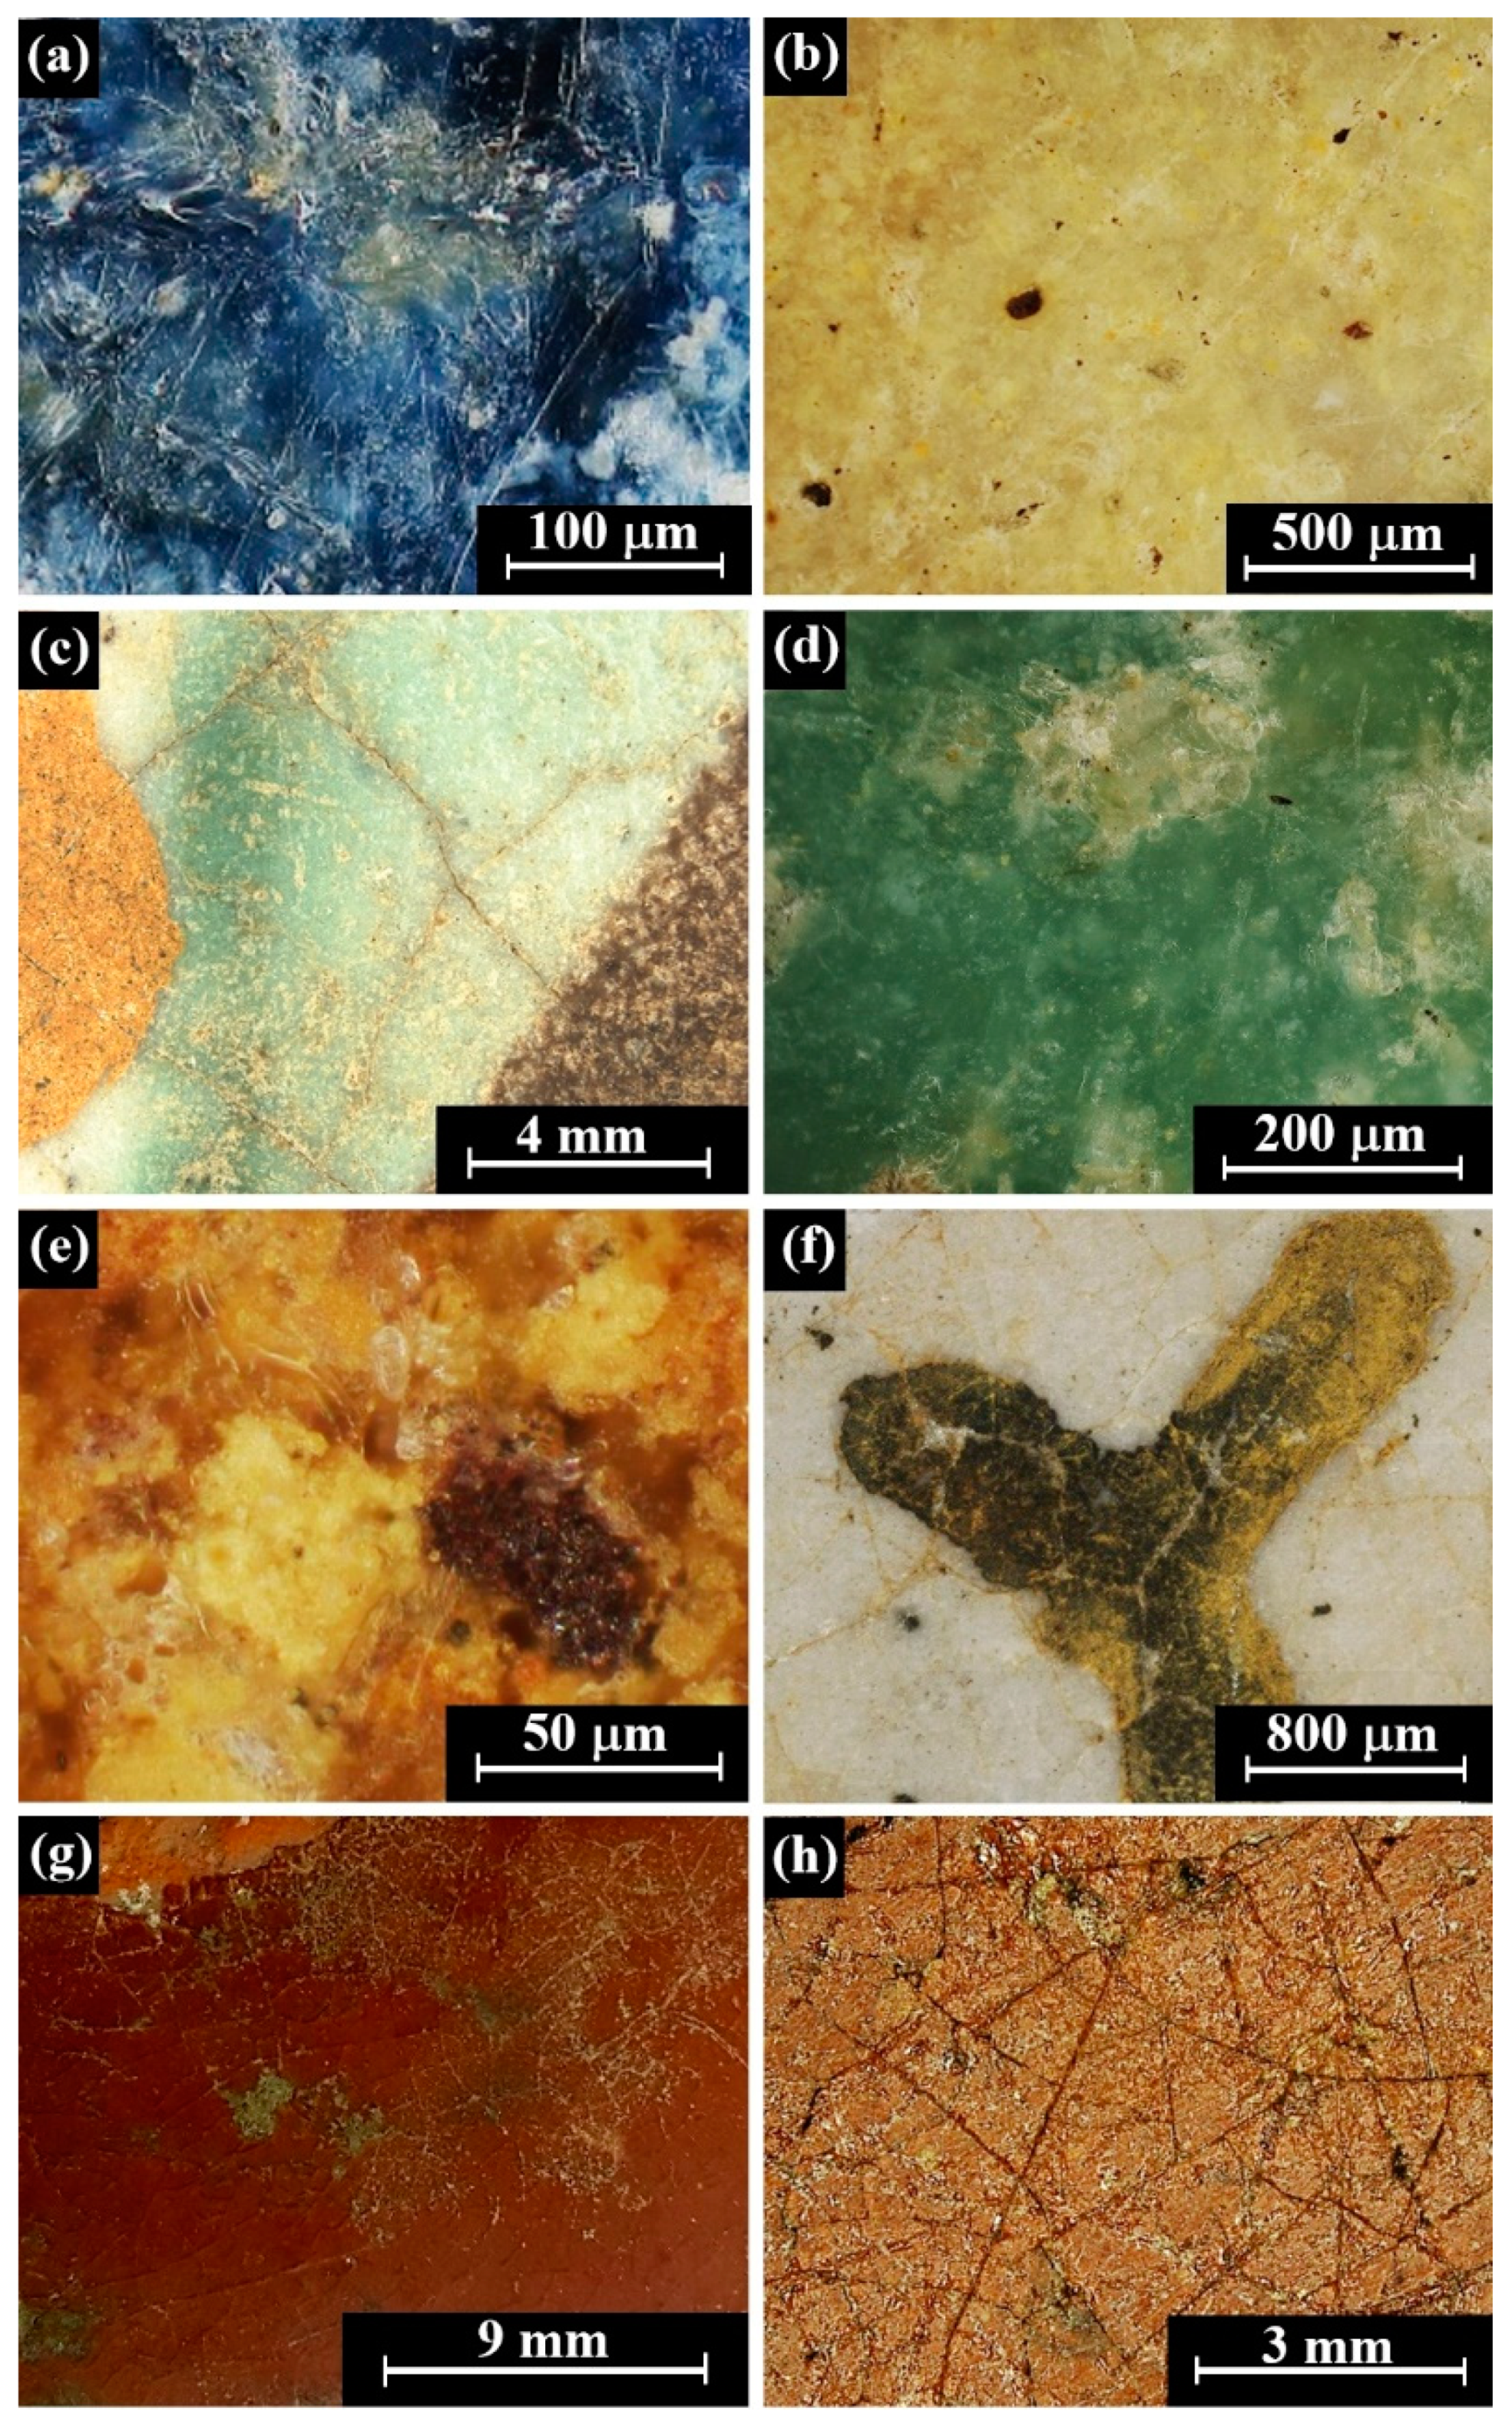
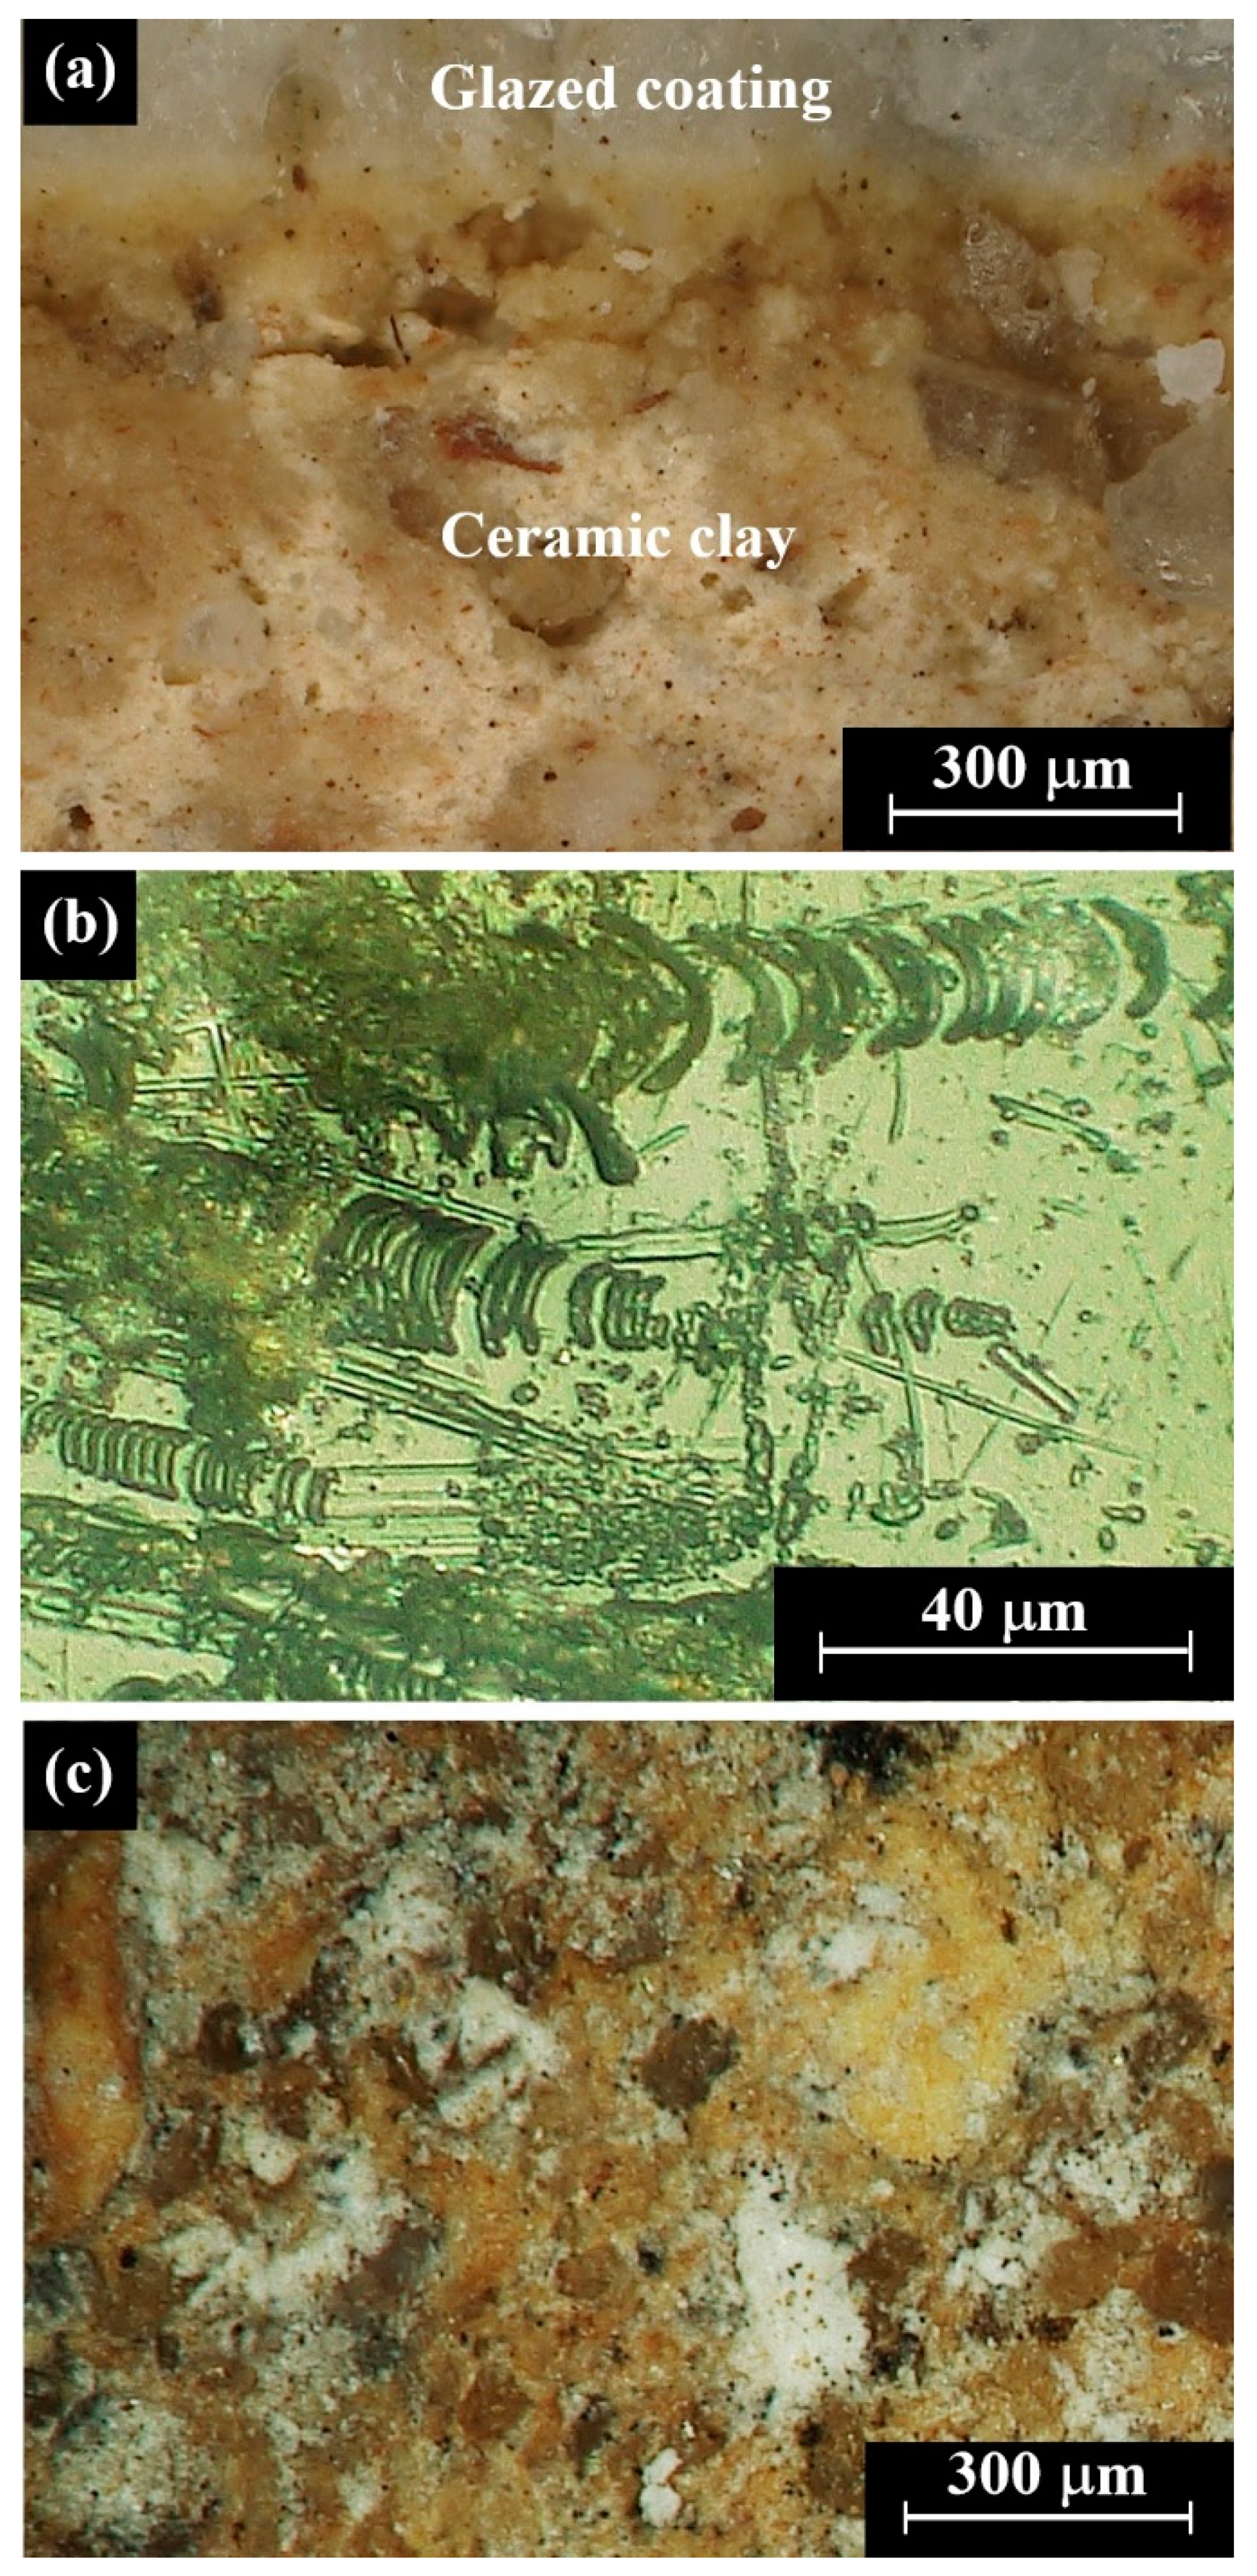
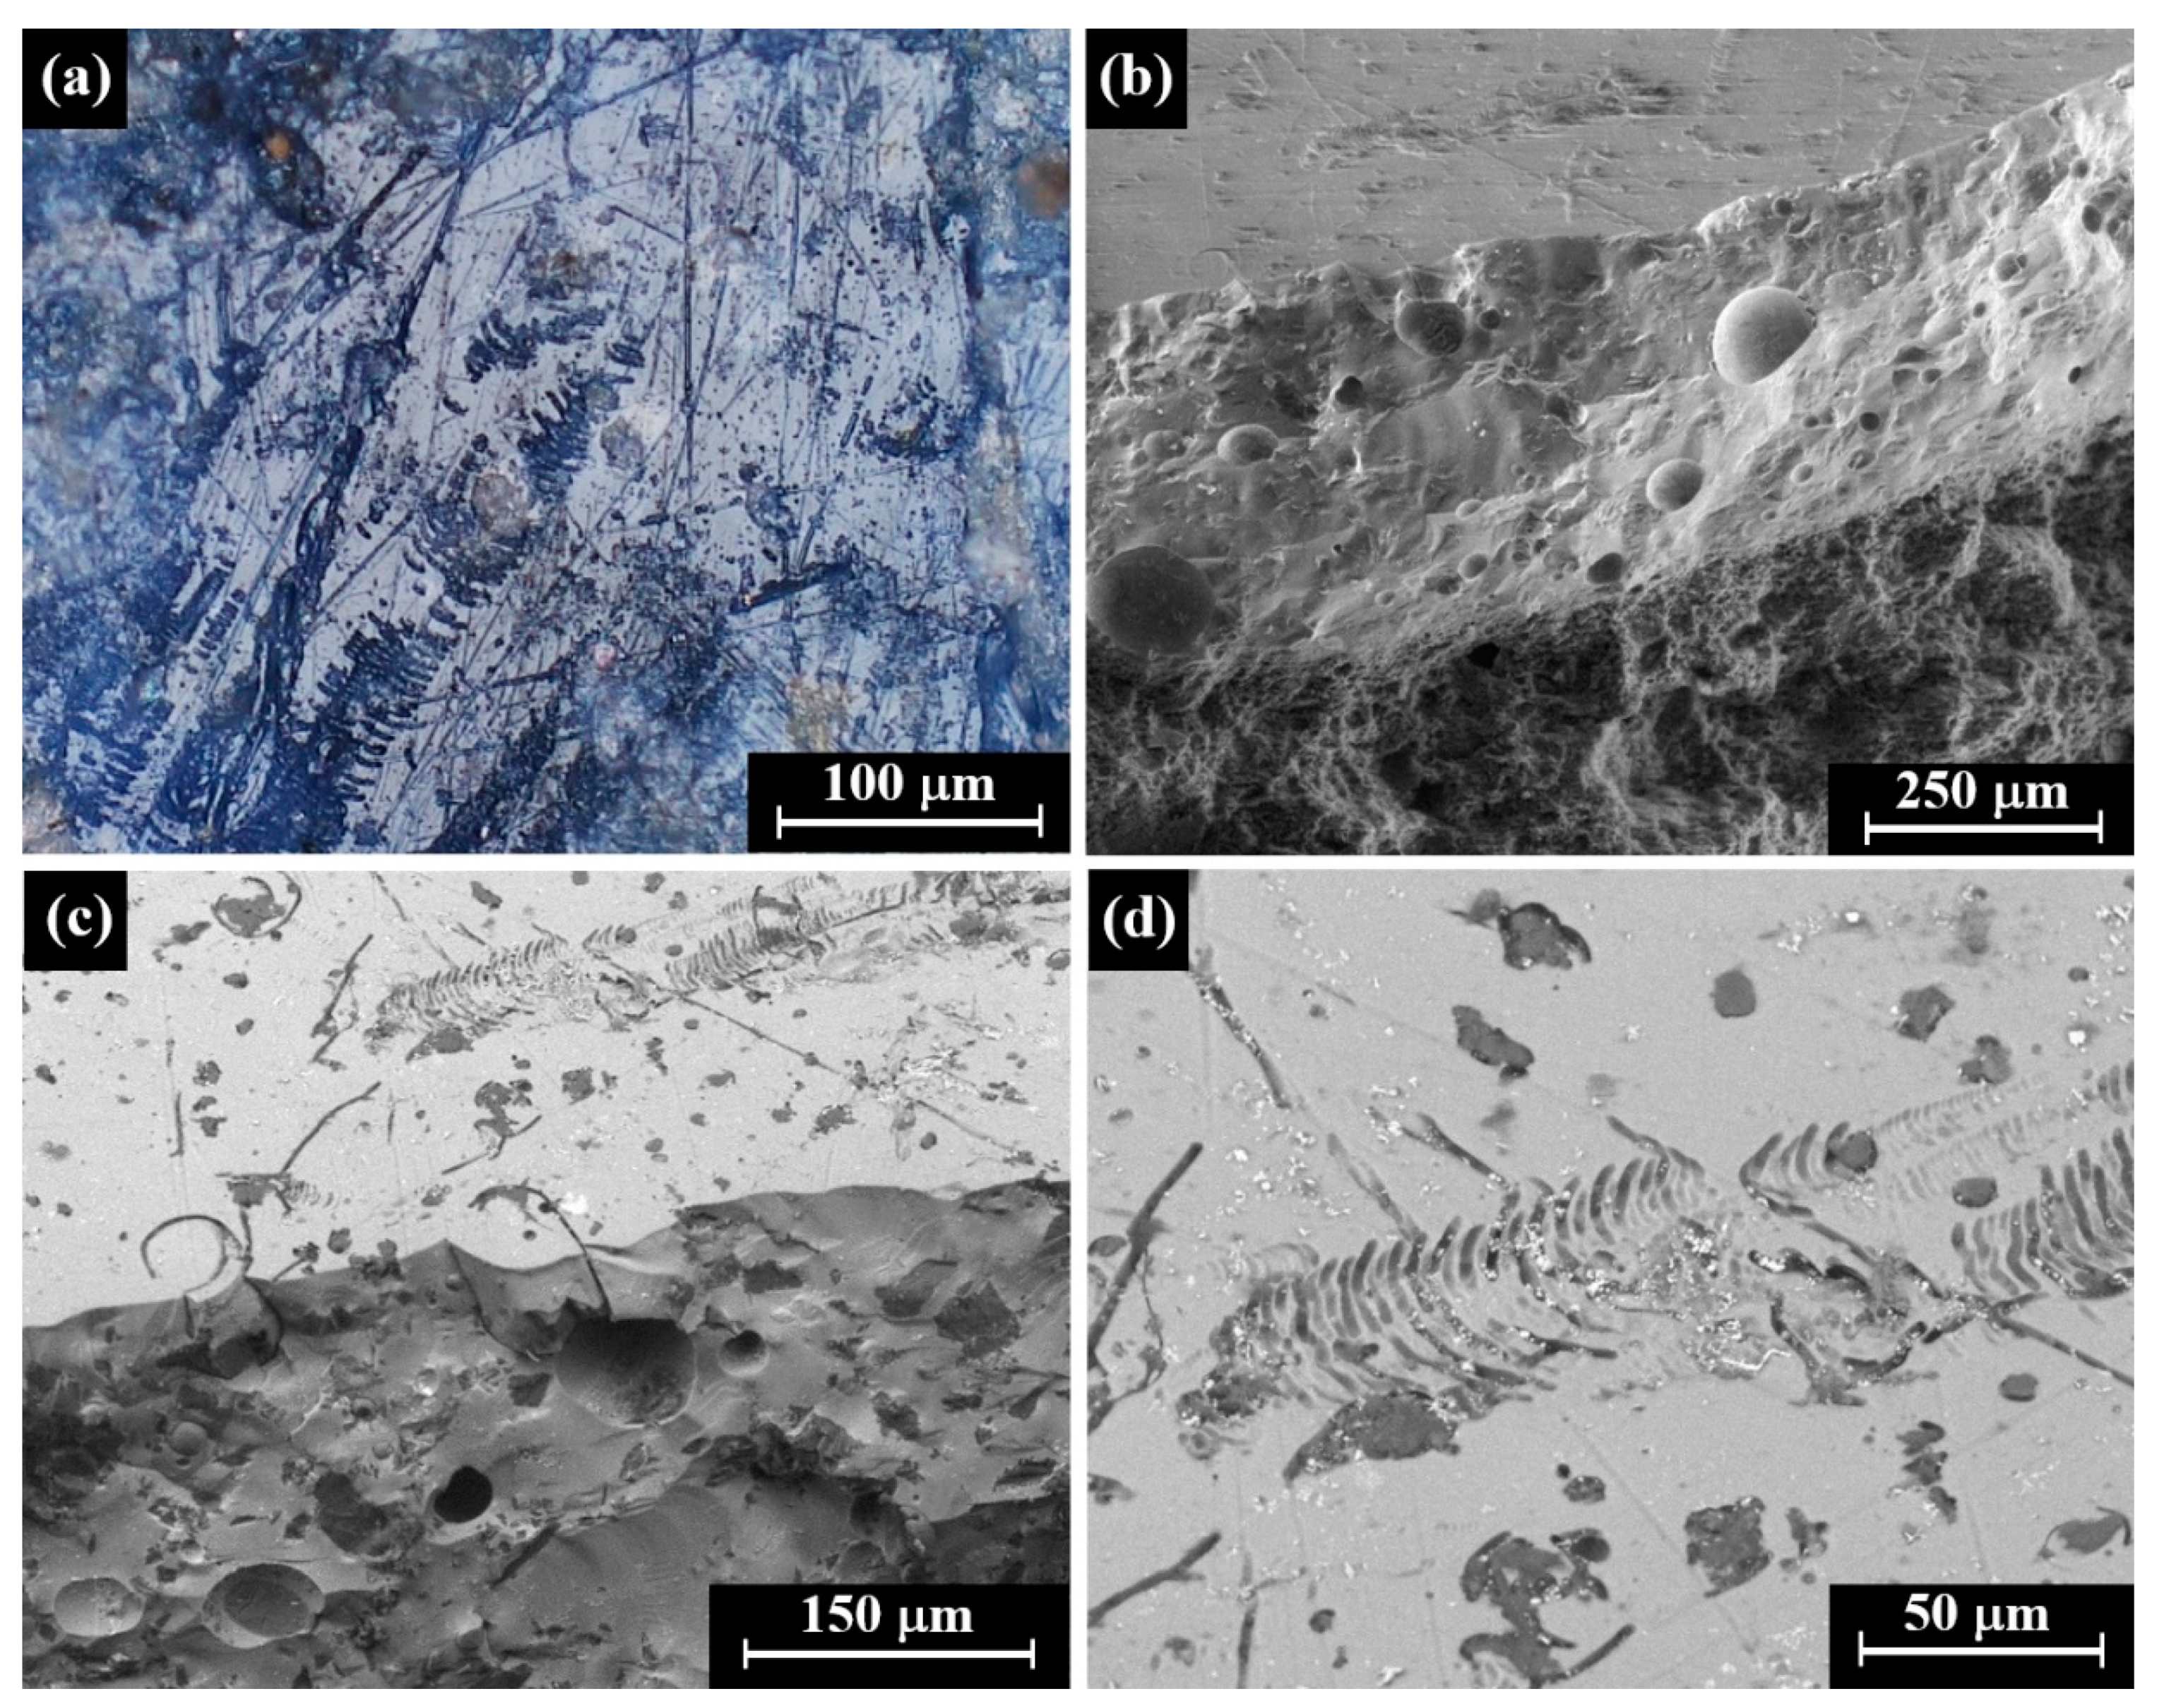
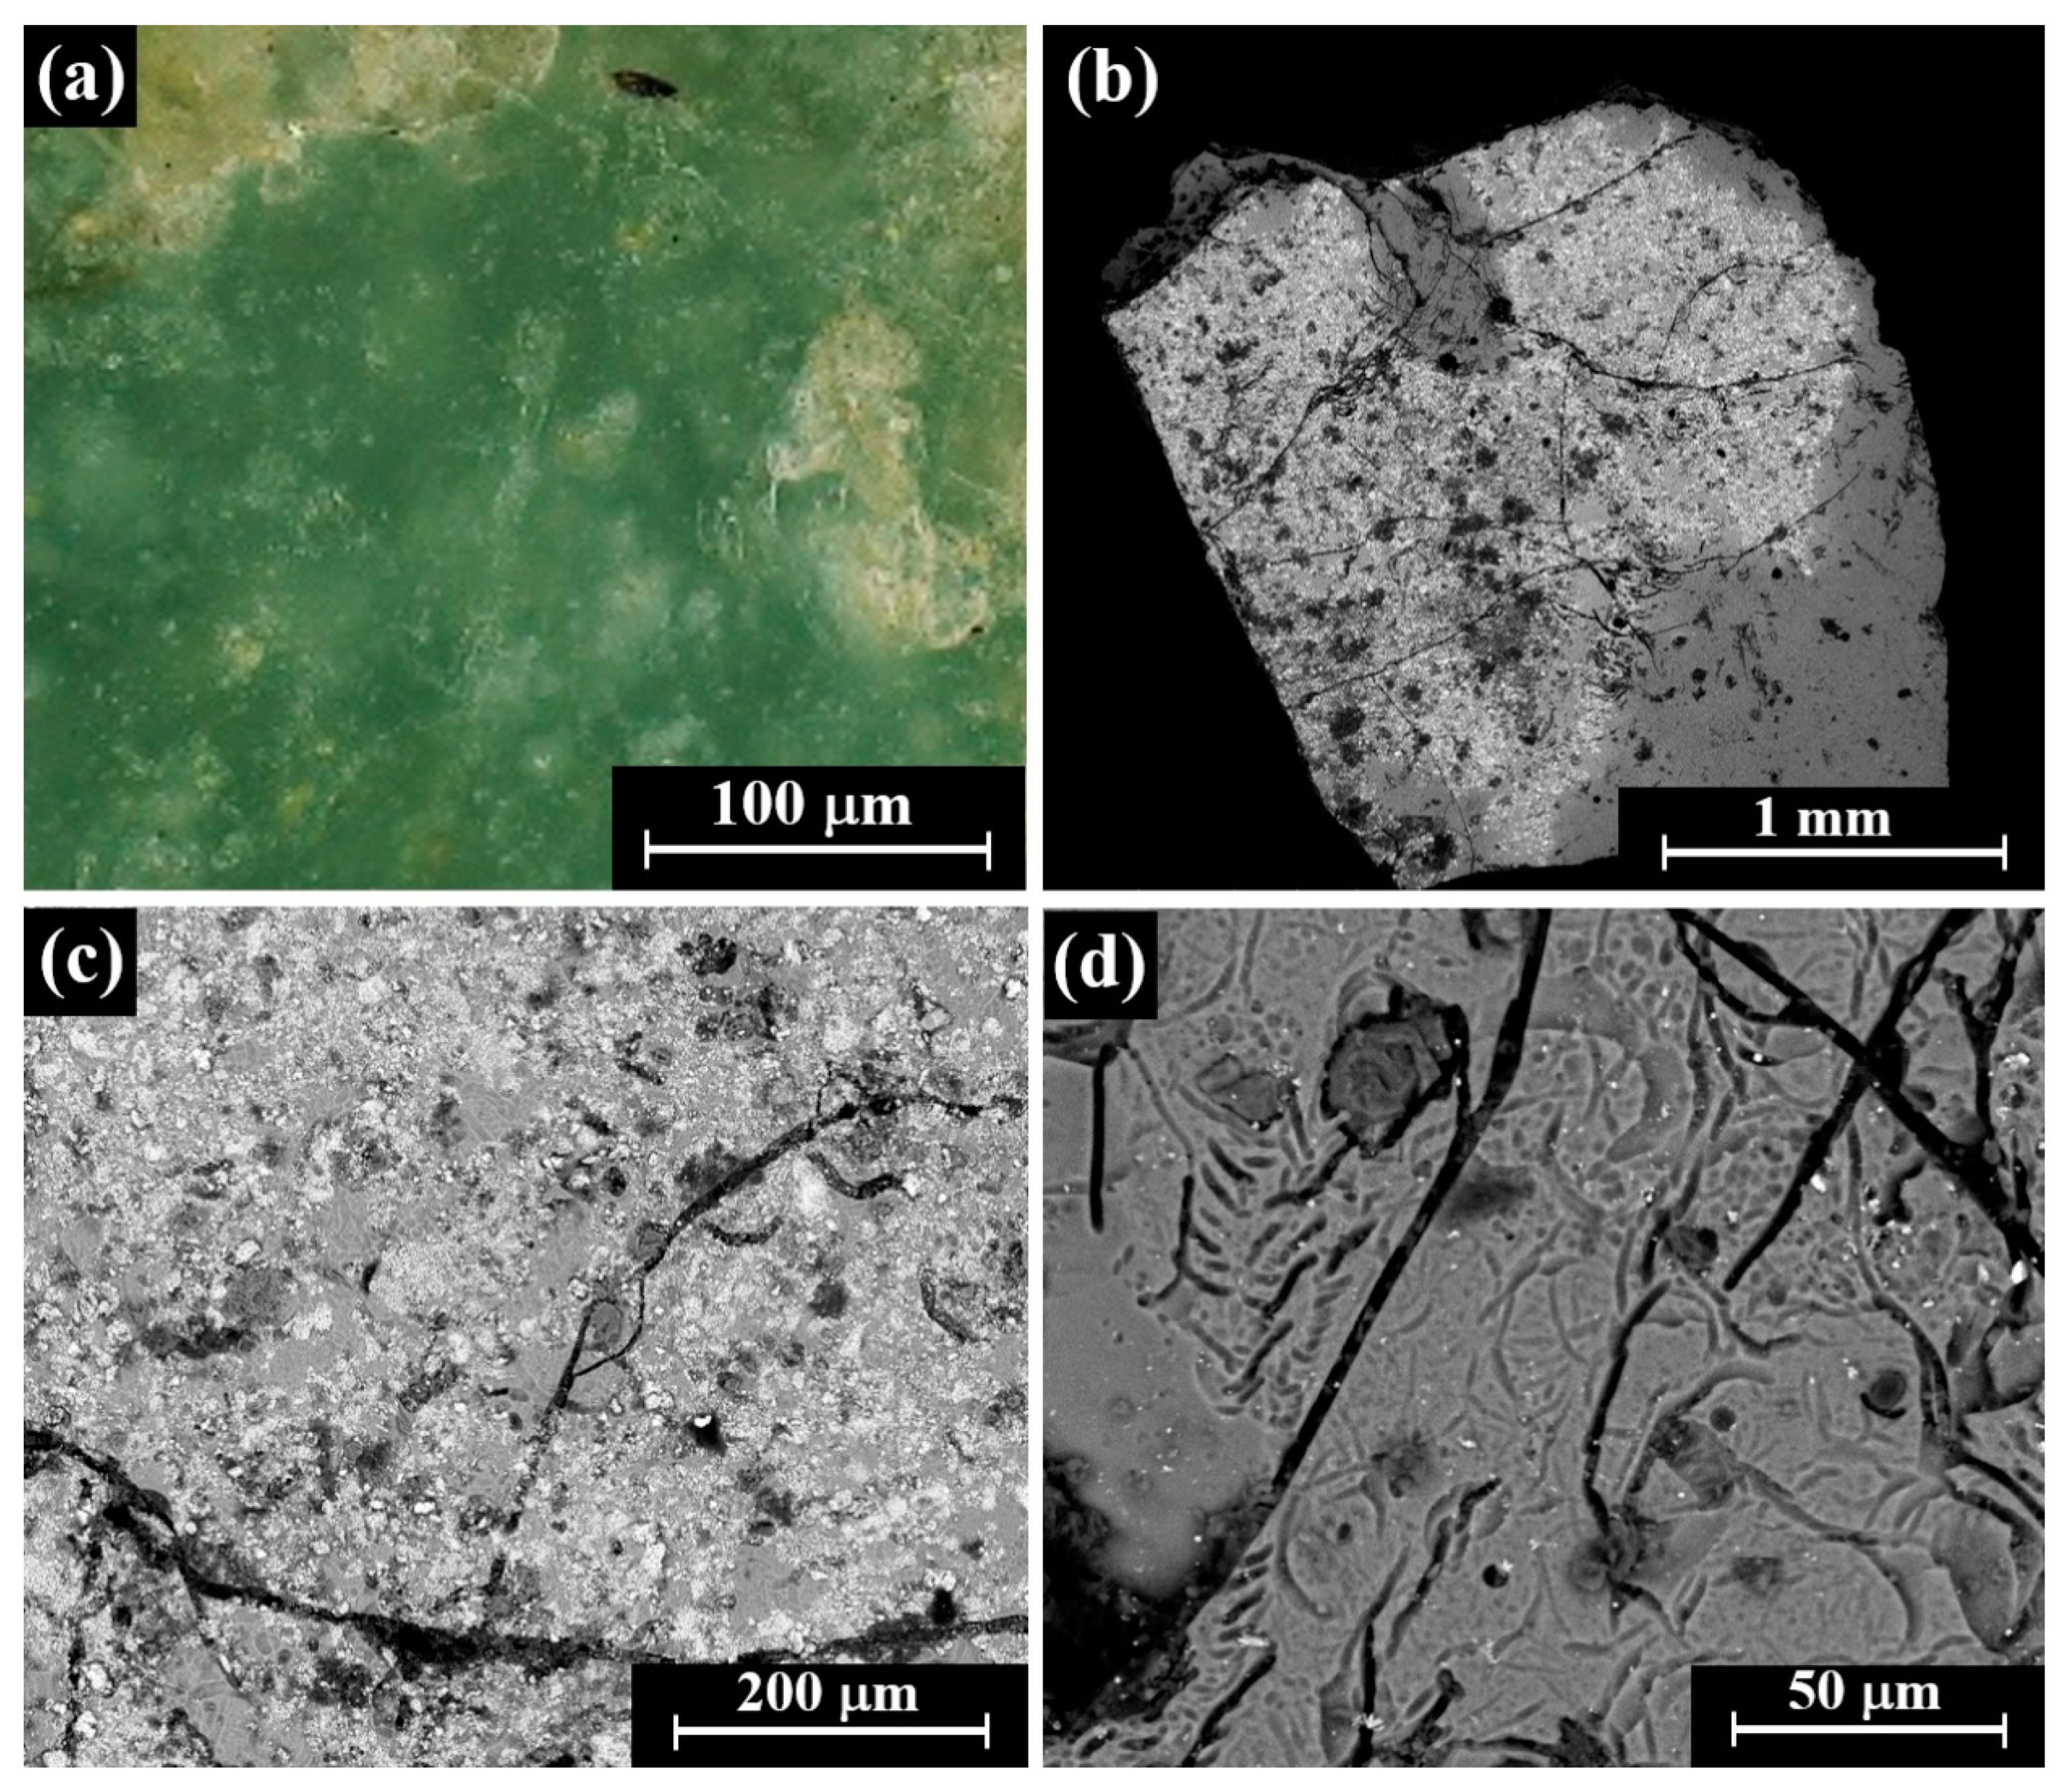
The multifocal LM NDT observation was carried out with a 3D digital HIROX RH-2000 microscope (Hirox, Tokyo, Japan), with high intensity LED lighting and advanced light sensitivity sensor and high resolution high-definition, equipped with autofocus and multifocus systems, combined with various levels of light intensity. This microscope allows real-time tracking of surface topographies, colors, and microstructures. Although it facilitates the observation of the morphology and colors of numerous oxides, minerals, and corrosion products in the microscopic level, it is not an analytical tool [17]. The system has various modular lenses: The MXB-2016Z lens has a magnification of 6–320×, with a field of view of 15.4–2.0 mm (by using several adapters), the MXB-2500REZ lens includes a triple objective turret, and has a magnification of 35–250× for a field of view of 8.71–1.22 mm, and a magnification of 350–2500× for a field of view of 0.87–0.12 mm, and the MXB-10C includes several exchangeable objective lenses with a magnification range of 35–7000× for a field of view of 9.83–0.03 mm [17].
(c)
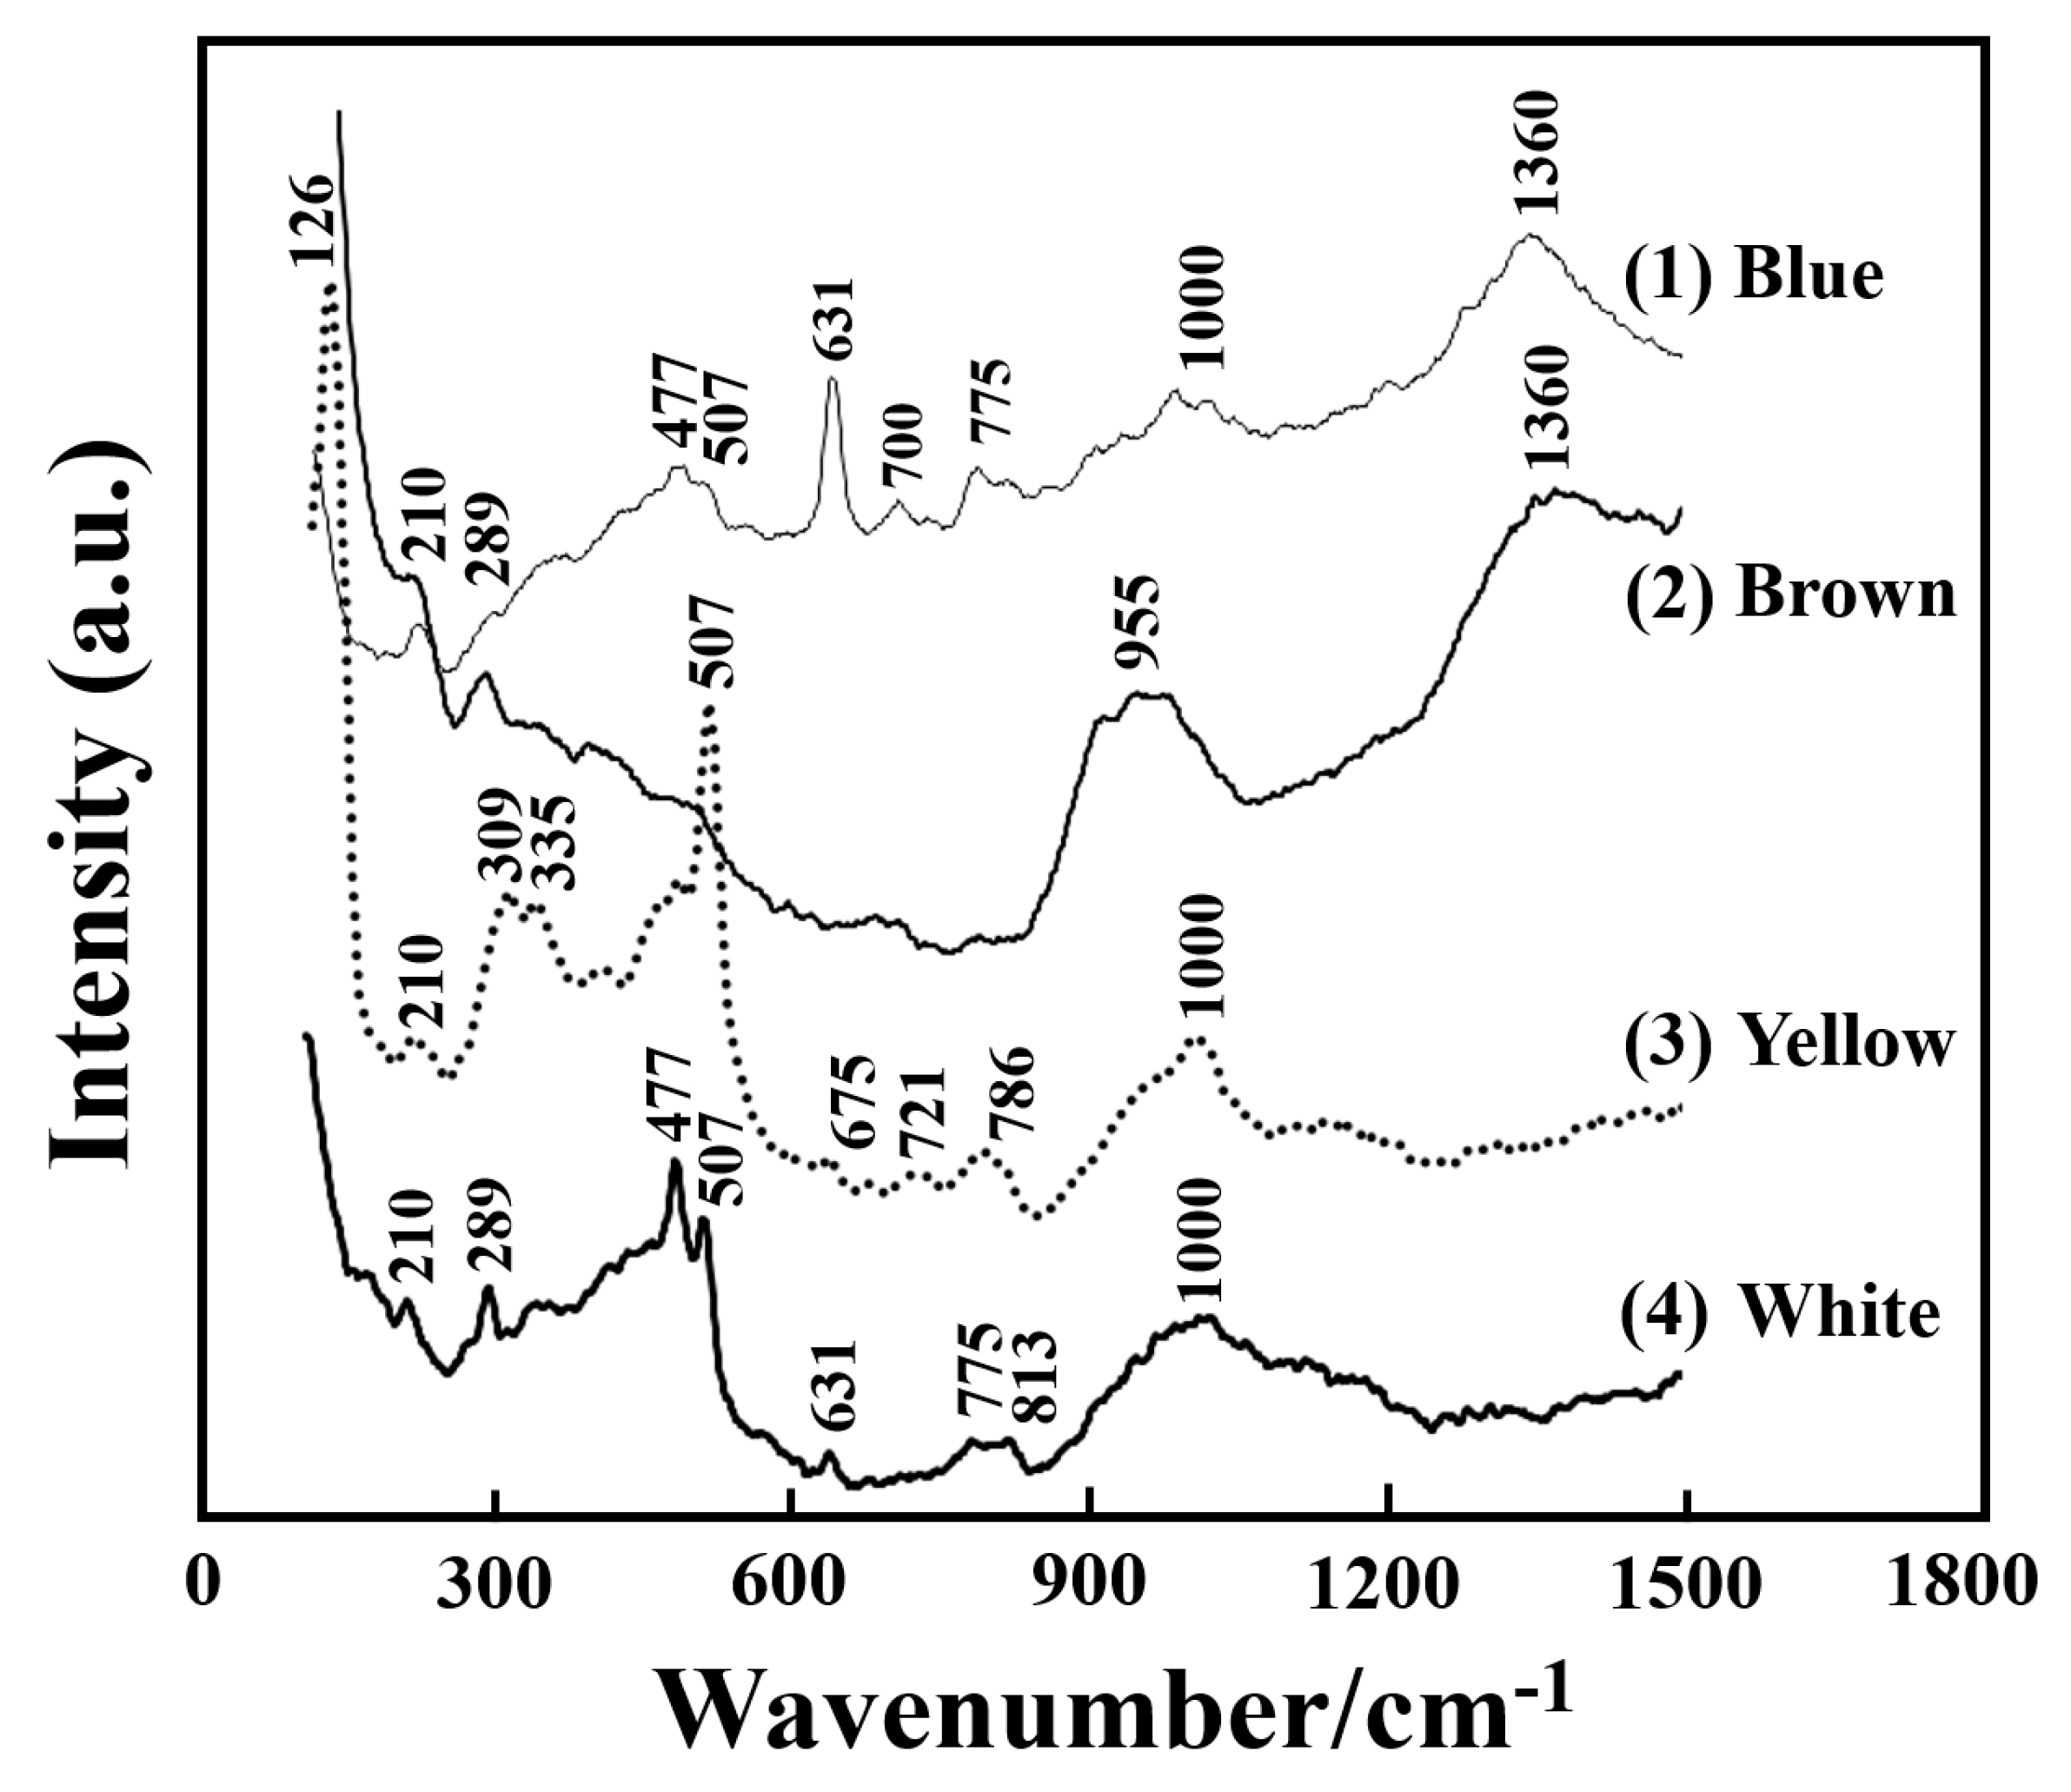
Raman spectroscopy is a NDT analytical method with a small spot size and high spectral resolution. However, the small laser beam spot size may also be a disadvantage in the case of heterogeneous ceramic materials [17,18,19]. Raman spectroscopy was carried out with a Horiba Jobin Yvon LabRAM high-resolution Raman spectrometer (Horiba, Kyoto, Japan) integrated with a Confocal Laser Scanning Microscope LEXT OLS3100 (Olympus Corporation, Tokyo, Japan). The system was equipped with LabSpec 5 software (OLS version 5.0.9). The measurements were made using a 532 nm laser excitation line, with a 50× objective lens, long working distance of 5.1 mm, and numerical aperture of 0.55. The grating type was 600 grooves/mm. Since the grating can be rotated, the system is capable of measuring wavenumbers between 100 and 4000 cm−1. There is no specific value of resolution for the grating itself. The spectral resolution depends on the focal length of the spectrophotometer, the grating (grooves/mm), and the charged-coupled device (CCD) camera. Spectral resolution is also a weak function of the wavelength (or the wavenumber) being resolved. The detector was a Horiba Synapse with Paltier cooling cooled to −70 °C. The size of the spot was 3–4 µm, depending on scattering of the surface. For each sample 3–5 points were measured from different areas.
(d)
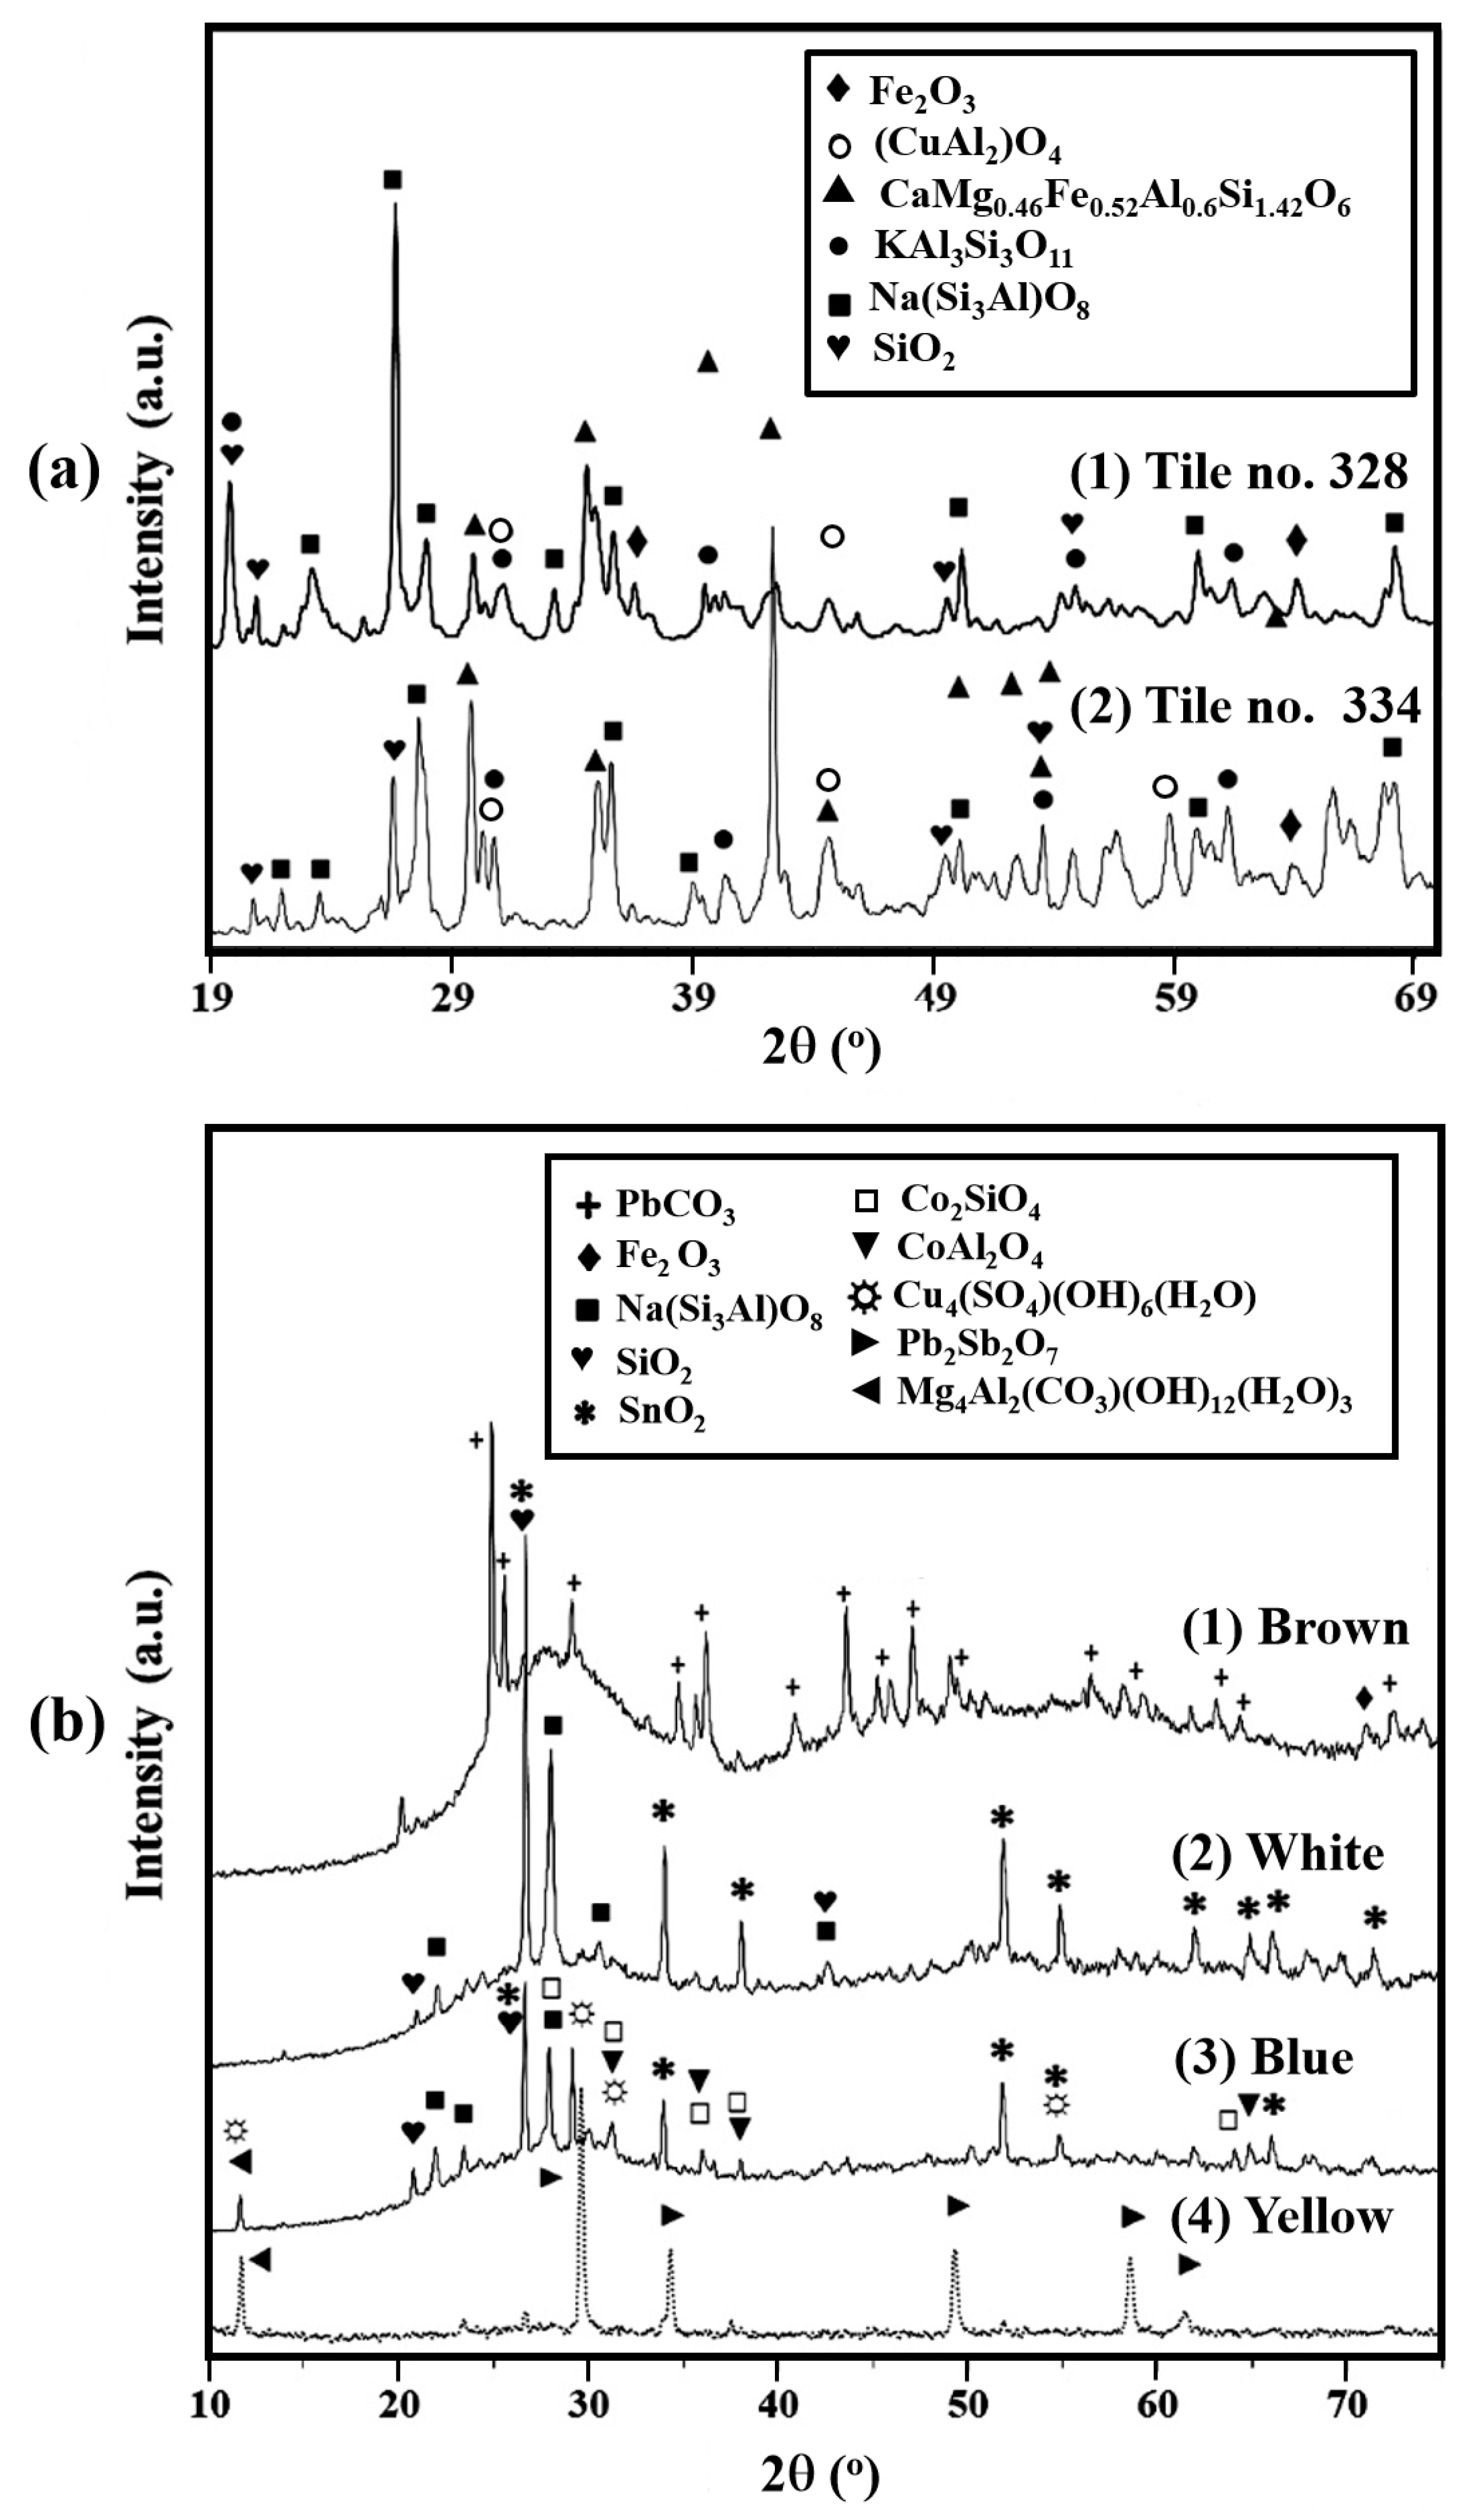
X-ray diffraction (XRD) is a powerful method applied for the identification of crystalline structures and phases [20]. A large database is available and data interpretation is rather straightforward. However, peak overlap may occur [17]. X-ray diffraction (XRD) analysis for phase identification of the clay body, glaze coating, and pigments, was carried out on a TTRAX III θ–θ diffractometer (Rigaku Corporation, Tokyo, Japan) equipped with a rotating Cu anode operating at 50 kV and 200 mA. The whole samples were measured as is by XRD. A bent graphite monochromator and a scintillation detector were aligned in the diffracted beam. Two reflection modes were applied: (1) θ/2θ scans were performed under specular conditions in the Bragg–Brentano mode with variable slits; and (2) asymmetric 2θ scans with fixed incident angles (2° and 3°) were performed with parallel beam optics formed by a multilayered mirror. The smaller incident angle produces higher diffraction intensity from the top layers than from the body. Comparison of the patterns exposes surface contamination of the sheet. Phase analysis was made using the PDF-4 + 2015 database (ICDD) (Materials Data Inc., CA, USA) and Jade 9.5 software (Jade Software Corporation, Christchurch, New Zealand).
(e)
Time-of-flight secondary ion mass spectrometry (TOF-SIMS) PHI Model 2100 TRIFT II (ULVAC-PHI, Incorporated, Kanagawa, Japan) is a surface analysis technique with trace element sensitivity, capable of measuring all chemical elements. This (semi)-destructive analytical method (due to ion beam interaction), uses a pulsed ion beam to remove molecules from the surface of the examined sample in order to characterize the chemical composition, mapping of the surface distribution and depth profiling of the sample. It was applied to characterize the colored glazes of Type A and B tiles, including their pigments. TOF-SIMS offers submicron (from a few monolayers to several nm) chemical mapping. However, it is a semiquantitative technique, which usually does not produce accurate quantitative results. In addition, this method is very sensitive to sample preparation, and interpretation of the results is sometimes difficult due to too much data, since TOF-SIMS spectra frequently contain hundreds, and in some cases thousands, of peaks [21].
(f)
Scanning electron microscopy (SEM) with energy dispersive spectroscopy (EDS) is a powerful magnification tool for surface analysis, which enables topographical and morphological observation together with compositional information [17,22,23]. This NDT technique was used in order to determine both the composition and topography of the surface [16]. Before SEM observation the samples were cleaned with ethanol and dried. SEM-EDS analysis of the pigments was carried out with an environmental scanning electron microscope (ESEM) to determine both the composition and topography of the surface [16]. Fragments of tiles were characterized by a FEI Quanta 200 FEG ESEM (Thermo Fisher Scientific, Waltham, MA, USA), equipped with an Everhart–Thornley secondary electron (SE) detector. The local elemental analysis was performed with EDS using an Si(Li) liquid-cooled Oxford X-ray detector. The EDS was calibrated with standard samples, and provided measurements with a first approximation error of about 1%.
(g)
Electron probe microanalysis (EPMA) with wavelength-dispersive X-ray spectroscopy (WDS) is a NDT method commonly used for surface analysis, resulting in minimal sample damage. This technique provides more accurate chemical analysis detection abilities than the SEM-EDS method [2], and it has high capability for trace element detection. However, elements lighter than boron cannot be detected with this technique [2,24]. EPMA-WDS chemical analysis was performed with a high resolution EPMA, using a JEOL 8230 SuperProbe electron probe microanalyzer (JEOL, Ltd., Tokyo, Japan) with four wavelength-dispersive spectrometers for microanalysis, and beam conditions set to 15 keV and 15 nA. All phases were analyzed with silicate and oxide standards (SPI 53 minerals), and the data was processed with a Phi-Rho-Z (PRZ) correction procedure.

3. Results and Discussion

3.1. Clay Body of Types A and B

3.1.1. Light Brown Clay Substrate (Type A)

The composite body of Type A tiles was made of bright brown clay matrix with embedded particles (Figure 4a). VT and multifocal LM surface observation of the light brown clay exposed a rough surface (Figure 4a).
Raman measurements on the body of tiles nos. 334 and 340 revealed that the main phases present in all analyzed samples were: quartz (SiO2, 472 cm−1), hematite (Fe2O3, 225, 300, and 412 cm−1), diopside (CaMgSi2O6, 337, 669, and 1010 cm−1), calcite (CaCO3, 300, 710, and 1110 cm−1), and feldspar—K-feldspar (KAlSi3O8, 472, 514, and 1089 cm−1; Table 1). This composition agrees well with previous results, and is typical of potassium bentonite (K-bentonite) clay originating in the western Mediterranean region [2].
The quartz observed by Raman spectroscopy could have been formed during the heating process, due to decomposition of clay silicates; or it may have been included as impurity or added as a tempering material. The presence of hematite indicates an oxidizing atmosphere during firing. The high firing temperature of 900–1000 °C would cause the decomposition of clay into alkali feldspar, and the formation of diopside if enough Mg was present in the raw material [25]. Raman analysis of feldspar minerals cannot detect the presence of two of its phases, as their intergrowth is at a scale below the spatial resolution. The wavenumber of the most intense feldspar Raman peak (at 513 cm−1 in K-feldspars and at 507 cm−1 in albite) depends on the real alkali content, and in K-rich albite shifts to a wavenumber typical of K-feldspars [26,27,28].
Mineralogical analysis of the clay bodies was carried out using the XRD technique. The phase compositions of tile no. 334 clay body were typical of potassium bentonite (K-bentonite) clay (Figure 5a). This agreed well with the Raman spectroscopy results. However, Raman spectroscopy could not accurately determine the crystalline structure of the materials.
The great difference in Raman cross-section of different phases makes it very difficult to use this method for averaged quantitative analysis. The main phases detected in the tile bodies according to the XRD analysis were: hedenbergite (CaMg0.46Fe0.52Al0.6Si1.42O6; pyroxene group), potassium aluminum silicate (KAl3Si3O11), which corresponds with the K-feldspar, and albite (NaSi3AlO8); plagioclase). Hematite (Fe2O3), quartz, SiO2; and spinel (CuAl2O4) were also detected (Figure 5a).
Based on the TOF-SIMS analysis of the Type A tile body, Al, Si, Ca, Mg, Fe, Mn, Cu, and other elements were detected on the surface. Most of these originated from the clay material, but some may also have been partly absorbed from seawater during their long period of immersion.

3.1.2. Red-Brown Clay B Bodies (Type B)

The composite body of Type B tiles was made of the red-brown clay matrix with embedded particles (Figure 4c). VT and multifocal LM surface observation of the red-brown clays exposed a rough surface (Figure 4c).
Raman measurements on the body of tile no. 328 (Type B) revealed that the main phases present in all analyzed samples were quartz (472 cm−1), hematite (225, 300, 412 cm−1), diopside (337, 669, 1010 cm−1), calcite (300, 710, 1110 cm−1), and feldspar (472, 514, 1089 cm−1), as also detected in Type A tiles. However, only the presence of the mineral forsterite, Mg2SiO4 (doublet 850 and 860 cm−1), in tile no. 328 (Table 1), and its absence in Type A supports the use of different raw materials for the tiles, which was also confirmed by VT and LM observation of the tiles (Figure 4a,c).
Of all the detected minerals, hematite is responsible for the color of the bodies (usually red). However, in spite of the similar compositions of Types A and B bodies, the color of Type B body is browner than the clay of Type A tiles, perhaps due to a higher lead content, and probably due to dissimilar firing [29]. The presence of forsterite mineral (based on the Raman results), which is often yellow and occasionally orange, may also affect the color of the red clay. In addition, the manufacturing process temperature also affects the color of the body. This emphasizes the typological dissimilarities between Types A and B tiles.
The XRD analysis results of the tile no. 328 clay body revealed phase compositions similar to those of Type A clay body, with the presence of hedenbergite (pyroxene group), potassium aluminum silicate, albite, plagioclase, aluminum phosphate, hematite, quartz, and spinel (Figure 5a), typical of potassium bentonite (K-bentonite) clay. According to the XRD analysis, the content of the iron compound in the tile no. 328 body was larger than that in tile no. 334 clay (Figure 5a), resulting in its brownish color. Large peaks of iron-containing materials (e.g., hematite) appeared in the spectrum of tile no. 328, while in tile no. 334 these peaks were almost absent (Figure 5a). This difference was especially visible at the main peak (104) of hematite at an angle of ca 33°.
The ceramic phase composition is determined not only by the nature of the clay, but also depends on the firing process and occasionally on the added temper [30,31,32,33,34,35,36,37,38,39]. Therefore, in future it is recommended to prepare thin petrographic samples for analysis by polarized LM and/or EMPA in order to determine the distribution of tempering materials [13].
In calcareous clay, a slow-fired sample demonstrates a larger amount of newly formed phases (plagioclase, pyroxene) than in a fast-fired one, both at 1000 °C and 1100 °C [31,36]. Moreover, at higher temperature, more abundant formation of plagioclase and pyroxene minerals occurs. In contrast, the calcium-poor clay contains only quartz, feldspars, and hematite minerals after firing at the same temperatures [31,32,37]. The appearance of hedenbergite, potassium aluminum silicate, quartz, albite, and spinel in the XRD patterns, and the absence of natural clay phases for both types of bodies (A and B), demonstrated that these clays were fired at temperatures above 900 °C [30,34].

3.2. Glaze Matrix of Type A and B Tiles

3.2.1. White Glaze Matrix (Type A)

LM observation of the thin white glazed coating of Type A tiles, revealed a rather uniform layer thickness, with the presence of many notches and cracks (Figure 2a and Figure 3c). The cracked surface of the glazed layer probably resulted from differing thermal expansion coefficients between the clay body and the glaze layer [40,41]. The white glaze film on top of the clay (Figure 4a,b), which was fused to the ceramic body surface by firing [15], usually had a uniform thickness of about 400 µm. This glaze material was interacted with the ceramic body (Figure 4a), resulting in the interdiffusion of elements between the two layers [15]. This glaze layer was applied to protect the tile from erosion, and for aesthetic considerations [15,23]. Creep deformation and chatter mark trails were observed in the white glaze layer (Figure 4b). The thickness of the pigment film was 100–150 µm, and the cracks travelled through the pigment film into the glazed layer.
According to the XRD analysis, the white glaze consisted mostly of albite (ca. 45 wt %), quartz (ca. 13 wt %), amorphous components (ca. 37 wt %), and cassiterite, (SnO2; ca. 5 wt %); however, no evidence of crystalline lead or titanium oxides was found. This fact, together with the existence of cassiterite (SnO2) and albite (with typically pure white color), suggests that the white glaze was perhaps a tin-glaze prepared by mixing white clay (kaolinite clay) and sand or quartz.
According to previous SEM-EDS analysis [2], the white glaze of tiles no. 334 and 340 was mostly composed of PbO and SiO2, as expected from Italian majolica glazes [42,43,44,45]; however, other oxides, including Al2O3, Fe2O3, CaO, K2O, MgO, MnO, and Na2O, were also detected. Magnesium oxide (MgO) was often added to the glaze material because it reduced the thermal expansion of the glaze coating, and potassium oxide (K2O) was often added to increase the brilliancy and hardness of the glaze. Sodium oxide (Na2O) is one of the most common fluxes used in low-fire glaze; and calcium oxide (CaO) was frequently added to decrease the coefficient of thermal expansion of the glaze coating and to increase its abrasion resistance [40,42,46].
Based on the Raman spectra of the white glaze (Figure 6, graph 4), cassiterite (peak at 631 and 775 cm−1) was most probably used as an opacifier. The cassiterite is a white pigment, widely used in the past [47]. Moreover, its quantity in the tiles is similar to that found in artifacts from Aragon (Spain), and is enough to produce opacity [35]. In addition to the bands characteristic of cassiterite, albite (at 507 cm−1), and diopside (about 1000 cm−1), the band at 477 cm−1 was detected. This mode is specific for structures composed of connected SiO4 tetrahedral (glazes of alumosilicate networks promoted by the use of feldspar as fluxing material) [48]. The Raman result is in agreement with the XRD data, and explains the unexpectedly high concentration of albite measured by the XRD analysis. Such a white glaze, widely used in majolica technology in antiquity, consists of a single opaque glaze layer containing fine tin oxide particles, present either as individual particles or in clumps, together with varying amounts of angular quartz and potassium feldspar particles [45]. The use of K-feldspar as a flux to reduce the temperature in the glaze production was common in the Middle Ages [49,50]. The addition of large quantities of flux materials may result in a severe reduction of material properties, including degradation of the chemical stability [15]. No evidence of a lead oxide glaze signature (bands at 500 and 950 cm−1) was found. This fact, together with the presence of cassiterite suggests that the white pigment was most probably the widely used SnO2 [51,52,53].
Based on the TOF-SIMS analysis, a significant content of Sn was detected in the white surfaces of Type A tiles (Figure 7 and Figure 8). The most probable reason is that cassiterite was also used as an opacifier in these cases. To check the unevenness of the pigment ion distribution on the analyzed glaze surface, a TOF-SIMS imaging analysis was performed over an area of 200 × 200 µm2. The imaging of Sb in the glaze matrix was not possible due to the very low SIMS signal intensity (Figure 8). The elements Pb, Fe, Ti, and Sn displayed in Figure 8 showed an uneven spatial distribution, and were located in small areas of a few microns each. This phenomenon may be related to a very fine pigment structure, incomplete mixing, and an uneven temperature distribution during the glaze production, and the presence of inclusions. The presence of Ti in the white glaze matrix suggests that the TiO2 was perhaps added as a white pigment. However, TiO2 was not detected in the white glaze by other methods, probably because it is present in an amorphous form. Ti is a very common element in sand, and therefore was most probably not intentionally added as a white pigment or as an opacifier [54].
The variability of the chemical analyses between the different methods probably results from the heterogeneity of the glaze matrix, and the examination of different regions of the samples’ surface with dissimilar scanned areas, and the specific sensitivity of each technique. Therefore, it is suggested that the white glaze is a typical tin-opacified majolica glaze [42,44,45,47].
According to the XRD analysis (Figure 5b), the glaze consisted mostly of amorphous silica (ca. 95 wt %) and cerussite (PbCO3; ca. 5 wt %), while a minor quantity of substituted hematite, was also detected after a long diffraction analysis. Cerussite, a well-known white pigment in antiquity [55], was used as a lead flux to control the synthesis of purple color [56]. However, cerussite would have been burnt during the firing of the glaze. Moreover, cerussite can be formed due to a chemical reaction between carbonated water and lead sulphide. Therefore, the presence of cerussite in the analysis can be also explained as cerussite contamination resulting from the long burial period in the underwater environment.
According to the Raman spectra of the glaze matrix (Figure 6, graph 4), the occurrence of hematite (at 289 cm−1 peak) is probably due to an incomplete transformation process of Fe3O4 to Fe2O3 in the oxidizing atmosphere during firing, and uncontrolled fugacity of oxygen [28,49]. The presence of amorphous carbon (peaks at 1360 and 1595 cm−1: the latter is not shown in Figure 6 (graphs 2 and 3) [57] can be explained as firing in a partially reducing atmosphere due to the introduction of organic smoke materials into the furnace [27]. However, since the glaze coating is porous, the presence of carbon most probably results from absorption of underwater organic contamination during the long burial period in the marine environment.

3.2.2. Transparent Glaze Matrix and Brown Pigment (Type B) Brown (Tile no. 328, Type B)

The transparent glazed coating was rather uniform; however, its surface showed many notches and cracks through the glazed layer into the brown pigment film (Figure 3g,h and Figure 4c). The final application of a transparent overlayer with a lower viscosity than the underlying opaque glaze was popular with the majolica technique [45]. Such a glazed coating was most probably applied to protect the tile from erosion, make it waterproof, and improve the quality of the final product for aesthetic considerations by creating a shiny surface [15,23].
According to the XRD analysis (Figure 5b), the high amorphization of the Type B glaze compared to Type A indicates that it was prepared under a different temperature regime. Therefore, it is suggested that tile no. 328 (Type B) was produced using a different technology and in a different workshop from tiles no. 334 and no. 340 (Type A).
Raman spectra of the glaze matrix of tile no. 328 with the presence of brown pigment are shown in Figure 6 (graph 2). In the Type B glaze matrix, the carbon peak at 1360 cm−1, and its absence in the white glaze, indicates the use of different raw materials from Type A (Figure 6, graph 4). The brown color suggests a predominant oxidizing atmosphere during firing.
Based on the TOF-SIMS analysis (Figure 7), significantly higher contents of Fe and Pb and lower concentrations of Sn and Co were found in the brown pigment glaze matrix of Type B (tile no. 328) than in Type A white glaze (tiles nos. 334, 340). This further supports the finding that different materials were used for the production of the Type B brown coating (Figure 7). The presence of Fe components was detected in the brown pigment glaze, similar to the components detected in the clay body of tile no. 328 (Type B), indicating that the transparent overlayer with brown pigment was prepared by mixing red-brown clay with glaze material [58]. This result agrees well with the Raman data. The imaging of Sn presence in the brown glaze was not possible due to the very low SIMS signal intensity (Figure 8). It should be noted that the element distribution in the brown glaze of Type B tiles is more even than that observed for Type A glazes. This indicates that different technologies were used for the preparation of the tile glazing.

3.3. Pigments of Type A Tiles

The white-glazed tiles (Type A) were decorated with various pigments (Figure 1a,c, Figure 2a–d, and Figure 3a–f). Based on their composition (as measured by EDS and EPMA-WDS chemical analyses), the olive-green, green, orange, and brown colors were all made of a white glaze material (leaded glaze) mixed with Sb pigment, and other elements. Mineralogical analysis of the white, yellow, blue, and brown pigments surrounded by a glaze matrix was made using the XRD technique, and the various phases are presented in Figure 5b.

3.3.1. Blue, Green, and Olive-Green Pigment Matrixes

LM and SEM observation of the blue pigment of tile no. 334 revealed blue and white areas. Creep deformation and chatter mark trails were observed, probably located inside the white glaze (Figure 9). Gas bubbles were observed in the white glaze (Figure 9b), most probably according to organic matter that was burned in the glaze liquid [15,20]. An earlier study demonstrated that the blue color was made of a white glaze material mixed with cobalt blue pigment (CoAl2O4) [2]. Although cobalt was isolated in 1735, an artificial cobalt blue pigment was developed only in 1802 [59]. The blue color is related to the high concentration of Co-content compounds [60]. Blue color is usually obtained by the dissolution of Co2+ ions into the amorphous silicate network [48]. When the ion concentration exceeds a few wt %, olivine silicate (Co2SiO4) or cobalt aluminate spinel (CoAl2O4)–cobalt blue precipitates out in the glass [50,60,61,62,63].
Cobalt compounds were well-known coloring agents for blue decoration of paints and ceramics [35]. The XRD pattern of the blue glaze material is similar to that of the white glaze (Figure 5b). Albite, quartz and cassiterite were also detected. In addition, cobalt silicate (Co2SiO4), cobalt aluminum oxide (CoAl2O4), and quintinite–2(Mg4Al2(CO3)(OH)12(H2O)3) were also detected. Phase composition of the blue glaze clearly demonstrated that the color was produced by mixing a white glaze matrix with cobalt blue (CoAl2O4), and cobalt olivine (Co2SiO4) pigments [60,64]. The olivine Raman signature has a band at about 850 cm−1, supporting the XRD results. Raman measurements performed on the blue glaze (Figure 6) showed a very weak peak in this wavenumber area. The difficulties in Raman observation of blue glazes are well known, and occur due to the use of a very fine dispersion of the colored ions in the amorphous glaze matrix [27].
Based on the TOF-SIMS analysis (Figure 7), a similar ratio of Fe–Sn–Pb–Ti composition was detected in the white and blue glazes, indicating that the white-glaze matrix was applied in order to obtain the blue color decorations by adding the proper pigments. The elements Pb, Fe, Ti, Sn, and Co exhibited an uneven spatial distribution, and were located in small areas of a few microns each (Figure 8). This phenomenon may be correlated to a very fine pigment structure, an incomplete mixing process, the presence of inclusions, and uneven temperature distribution during the glaze production. Due to the very low SIMS signal intensity, the image of Co was obtained only for the blue glaze (Figure 8).
VT and LM observation of the olive-green pigment of tile no. 339 (Figure 2d and Figure 3f) showed that it was a combination of dark green and yellow areas. A green pigment was observed on top of the glazed layer of tile no. 334 (Figure 3c,d). LM and SEM observation of the green and olive-green pigments from tiles no. 334 (Figure 10) and no. 339 (Figure 10a,c,d) demonstrated a glazed matrix with bright pigment particles. Based on the EDS analysis, the olive-green pigment of tile no. 339 contained oxides of Pb, Si, O, Al, Fe, Na, Ca, Co, Sb, Mg, and Na (Table 2). EPMA-WDS chemical analysis of the green pigment matrix indicated that it mainly contained PbO, SiO2, and Sb2O5. Other oxides were also detected, including Al2O3, Fe2O3, CaO, CoO, MgO, and Na2O (Table 3).

3.3.2. Yellow, Orange, and Brown Pigment Matrixes

SEM observation of the yellow color from tile no. 340 revealed a cracked glaze matrix with yellow pigment particles (Figure 11a). The crystalline structure of the yellow pigment mineral, with an average crystal size of 0.2 μm, was observed at high SEM magnifications (Figure 11b–d). Based on the composition, the yellow decorations of the white glaze tiles were made by adding antimony yellow pigment, Pb(SbO3)2/Pb3(SbO4)2 [2,50,65]. Since lead antimonate is rare in nature, the pigment was most probably artificial [66]. The antimony yellow color varies between reddish-yellow and green-yellow, depending on the pigment concentration and composition. Antimony yellow was frequently used in Europe between 1500 and 1850. During the eighteenth century, antimony yellow pigment generally replaced lead-tin yellow, and during the eighteenth–nineteenth centuries various recipes of antimony yellow were available [67,68].
The XRD pattern of the yellow glazes (Figure 5b, graph 4) was different from that of the white (Figure 5b, graph 2) and blue glazes (Figure 5b, graph 2): analysis of the yellow pigment showed the absence of albite and quartz, which are present in white and blue glazes. The presence of light brown quintinite–2H (Mg4Al2(CO3)(OH)12(H2O)3) in the yellow pigment glaze, which was not detected in the other glazes, may indicate that a different glazed matrix was used for the preparation of the yellow pigment, rich in Al and Mg, or perhaps the firing temperature was different. Bindheimite (Pb2Sb2O7) and a small content (less than 5 wt %) of lead-tin oxide (Pb2SnO4) were also observed. These pigments are known as Naples yellow, which was commonly used in majolica technology [29,60,65,69,70,71], and lead tin yellow type I [61,69,72,73], respectively, and were used to produce a yellow glaze.
Raman characterization of the yellow pigment matrix of tile no. 334 is presented in Figure 6 (graph 3). In addition to the main bands characteristic of the white glaze matrix, several additional peaks of different intensities are clearly observed in the spectrum of the yellow glaze at 126, 309, 335, and 457 cm−1 (Figure 6, graph 3). The bands at 335 and 457 cm−1 may be assigned to bindheimite (Pb2Sb2O7) Naples yellow pigment, which was also detected by XRD analysis, while other peaks are attributed to Pb2SnO4, known as lead tin yellow, type I pigment, which was also detected by XRD [59,61,74,75,76]. Raman spectra of the white (Figure 6, graph 4) and yellow (Figure 6, graph 3) glazes of tile no. 340 were absolutely identical to those of tile no. 334 presented in Figure 6 (graphs 1, 3 and 4). Nevertheless, peaks assigned to yellow pigments in the spectrum of tile no. 334 were more intense than those observed in tile no. 340. The highest signal was consistent with the use of a higher amount of pigment.
Based on the TOF-SIMS analysis (Figure 7), a similar ratio of Fe–Sn–Pb–Ti composition was detected in the white and yellow glazes, indicating that the white-glaze matrix was applied to obtain the yellow decorations by adding the proper pigments. The yellow color is due to coexistence of high concentration of Pb-, Sn-, and Sb-content minerals, which are the main components of the yellow pigment matrix [60]. The elements Pb, Fe, Ti, and Sn showed an uneven spatial distribution (Figure 8), and were located in an area of a few microns. This may be related to different factors, such as a very fine pigment structure, incomplete mixing, presence of inclusions, and an uneven temperature distribution during the glaze production.
EPMA-WDS chemical analysis of the orange pigment surrounded by glaze matrix indicated that it was mostly composed of PbO, SiO2, and Sb2O5 (17.03 wt % Sb2O5). Other oxides were also detected, including Al2O3, Fe2O3, SnO2, and MgO (Table 3).
Observation of the brown pigment from tile no. 334 (Type A) showed mixed areas of brown and white colors (LM, Figure 12a,b). SEM analysis of tile no. 319 (Type A) brown pigment revealed a glazed matrix with many cracks and notches, and bright pigment particles (Figure 12c,d). EDS analysis of this pigment showed that it contained oxides of Pb, Si, O, Al, Fe, Na, Ca, Sb, K, and Mg (Table 2). EPMA-WDS chemical analysis of the brown pigment in the surrounding matrix indicated that it was mostly composed of PbO, SiO2, and Sb2O (8.53–8.82 wt %). Other oxides were also detected, including Al2O3, Fe2O3, CaO, K2O, MgO, and Na2O (Table 3).

4. Conclusions

The study of mineral occurrence helps to determine the technological attributes of ancient artifacts. As an example, this study examined the various clays, glazes, and pigments found in the decorated floor tiles from the nineteenth-century Akko Tower shipwreck. Its results demonstrated the use of different raw materials in the two tile types. The white glaze on Type A tiles was a typical tin-opacified majolica glaze. The blue color of Type A tile decorations was due to cobalt blue and cobalt olivine pigments. The yellow pigments were Naples yellow and lead-tin yellow I, and other pigments were prepared by mixing the Naples yellow with different compounds, such as cobalt (for the green), iron (for the orange), and manganese (for the brown). However, the brown glaze coating of Type B tile was due to a pigment rich in lead and iron minerals. The glaze overlayer of both Type A and Type B tiles was applied to protect the surface from erosion, waterproof the tiles, and to improve its aesthetic appearance. The analyses emphasized the typological differences between the two types of tiles: the colorful Type A tiles, covered with majolica glaze, probably manufactured in Sicily; and the brownish Type B tiles, manufactured from a different clay produced at a different temperature, and coated with a higher iron content glaze, perhaps manufactured in a French workshop. This information suggests that the ship was fitted out in a western Mediterranean port.

Author Contributions

Conceptualization, A.I. and D.C.; methodology, A.I. and D.A.; validation, A.I. and D.A.; formal analysis, A.I., Y.F., and O.D.; investigation, A.I., D.A., and D.C.; resources, A.I. and D.C.; data curation, A.I.; writing—original draft preparation, A.I., D.A., and D.C.; writing—review and editing, A.I., D.A., and D.C., visualization, D.A.; supervision, A.I. and D.C.; project administration, D.A.; All authors have read and agreed to publish this version of the manuscript.

Funding

The underwater excavations (IAA permits G-23/2012, G-78/2013, G-16/2015 and G-25/2016) and research of the Akko Tower shipwreck were supported by the Israel Science Foundation (Grant No. 447/12), the Honor Frost Foundation, the Rector and Research Authority of the University of Haifa, and anonymous donors, to whom the authors are grateful.

Acknowledgments

Thanks are due to L.V., Laboratoire d’Archéologie Médiévale et Moderne en Méditerranée, Université d’Aix-Marseille, CNRS, for her valuable advice on the tiles; Z.B. and T.C. from the Wolfson Applied Materials Research Centre, Tel Aviv University, for their SEM technical assistance; H.K., Microtech LTD (Israel) and L.A., University of Haifa, for their assistance; and J.B.T. for the English editing.

Conflicts of Interest

The authors declare no conflict of interest.

References

  1. Cvikel, D. The 19th-Century Akko Tower Wreck, Israel: A summary of the first two excavation seasons. Int. J. Naut. Archaeol. 2016, 45, 406–422. [Google Scholar]
  2. Ashkenazi, D.; Dvir, O.; Kravits, H.; Klein, S.; Cvikel, D. Decorated floor tiles from the 19th-century Akko Tower shipwreck (Israel): Analysis of pigments and glaze. Dyes Pigments 2017, 147, 160–174. [Google Scholar]
  3. Ashkenazi, D.; Inberg, A.; Cvikel, D. Analysis of naturally etched surface of brass sheathing from a nineteenth-century shipwreck. J. Min. Metall. B 2018, 54, 101–110. [Google Scholar]
  4. Ashkenazi, D.; Misgav, I.; Issachar, R.; Klein, S.; Cvikel, D. New insights into brass nails from the 19th-century Akko Tower Wreck (Israel): Metallurgical characterization. J. Alloys Compd. 2019, 771, 614–628. [Google Scholar]
  5. Cohen, M.; Ashkenazi, D.; Kahanov, Y.; Stern, A.; Klein, S.; Cvikel, D. The brass nails of the Akko Tower Wreck (Israel): Archaeometallurgical analyses. Metallogr. Microstruct. Anal. 2015, 4, 188–206. [Google Scholar]
  6. Cohen, M.; Ashkenazi, D.; Stern, A.; Kahanov, Y.; Cvikel, D. Iron artefacts from the Akko Tower Wreck, Israel, and their contribution to the ship’s characterization. Archaeol. Anthropol. Sci. 2017, 9, 1243–1257. [Google Scholar]
  7. Cvikel, D.; Cohen, M.; Inberg, A.; Klein, S.; Iddan, N.; Ashkenazi, D. Metallurgical characterization of brass sheet from the 19th-century Akko Tower Wreck (Israel). Mater. Charact. 2017, 131, 175–187. [Google Scholar]
  8. Voiculescu, I.; Geantă, V.; Stern, A.; Ashkenazi, D.; Cohen, M.; Cvikel, D. Iron-bound deadeyes from the nineteenth-century Akko Tower Wreck, Israel: Metallurgical investigation of the manufacturing technology. Metallogr. Microstruct. Anal. 2017, 6, 106–125. [Google Scholar]
  9. Vidal, F. L’industrie de la terre cuite dans l’économie de la Provence. Rev. Chamb. Commer. Marseille 1952, 625, 531–554. [Google Scholar]
  10. Kahanov, Y.; Cvikel, D.; Wielinski, A. Dor C shipwreck, Dor lagoon, Israel, Evidence for maritime connections between France and the Holy Land at the end of the 19th century: Building materials and ceramics from Marseilles, Vallauris and the vicinity. Cah. d’Archéologie Subaquat. 2012, 19, 173–212. [Google Scholar]
  11. de Vincenz, A. Pot and Pans—Communities and Commercial Patterns in Ottoman Palestine. In&Around. Ceramiche e Comunità. Secondo Convegno Tematico dell’AIECM3 (Faenza, Museo Internazionale delle Ceramiche, 17–19 Aprile 2015; All’Insegna del Giglio: Firenze, Italy, 2016; pp. 112–118. [Google Scholar]
  12. Tognazzi, A.; Lapucci, R.; Martini, S.; Leone, G.; Magnani, A.; Rossi, C. TOF-SIMS characterization of pigments and binders in ‘the Martyrdom of St. Catherine’, in Zejtun (Malta). Surf. Interface Anal. 2011, 43, 1152–1159. [Google Scholar] [CrossRef]
  13. Ionescu, C.; Hoeck, V. Ceramic technology. How to investigate surface finishing. Archaeol. Anthropol. Sci. 2020, 12, 204. [Google Scholar] [CrossRef]
  14. Ricca, M.; Paladini, G.; Rovella, N.; Ruffolo, S.A.; Randazzo, L.; Crupi, V.; Fazio, B.; Majolino, D.; Venuti, V.; Galli, G.; et al. Archaeometric characterisation of decorated pottery from the archaeological site of Villa dei Quintili (Rome, Italy): Preliminary study. Geoscience 2019, 9, 172. [Google Scholar] [CrossRef] [Green Version]
  15. Pradell, T.; Molera, J. Ceramic technology. How to characterise ceramic glazes. Archaeol. Anthropol. Sci. 2020, 12, 189. [Google Scholar] [CrossRef]
  16. Ciardo, M. Il gusto per i pavimenti in maiolica e la loro produzione, mostra di mattonelle maiolicate (secc. XVIII–XIX). Museo Della Ceram. Cutrofiano 2001, 6, 35–98. [Google Scholar]
  17. Ashkenazi, D.; Cvikel, D. A journey into the microstructure: Using a multifocal 3D digital light microscope to study archaeological artefacts retrieved from shipwrecks. Digit. Appl. Archaeol. Cult. Herit. 2020, 16, e00129. [Google Scholar] [CrossRef]
  18. Coupry, C. Application of Raman microspectrometry to arts objects. Analusis 2000, 28, 39–45. [Google Scholar] [CrossRef] [Green Version]
  19. Smith, G.D.; Clark, R.J. Raman microscopy in archaeological science. J. Archaeol. Sci. 2004, 31, 1137–1160. [Google Scholar] [CrossRef]
  20. Sadek, H. Multi-Analytical approach for the study of glazed pottery from Al-Fustat, Egypt. Mediterran. Archaeol. Archaeom. 2016, 16, 65–71. [Google Scholar]
  21. Cushman, C.V.; Zakel, J.; Sturgell, B.S.; Major, G.I.; Lunt, B.M.; Brüner, P.; Grehl, T.; Smith, N.J.; Linford, M.R. Time-of-flight secondary ion mass spectrometry of wet and dry chemically treated display glass surfaces. J. Am. Ceram. Soc. 2017, 100, 4770–4784. [Google Scholar] [CrossRef]
  22. Bonneau, A.; Moreau, J.F.; Hancock, R.G.; Karklins, K. Archaeometrical analysis of glass beads: Potential, limitations, and results. Beads 2014, 26, 35–46. [Google Scholar]
  23. Di Febo, R.; Casas, L.; Rius, J.; Tagliapietra, R.; Melgarejo, J.C. Breaking preconceptions: Thin section petrography for ceramic glaze microstructures. Minerals 2019, 9, 113. [Google Scholar] [CrossRef] [Green Version]
  24. Sato, A.; Mori, N.; Takakura, M.; Notoya, S. Examination of analytical conditions for trace elements based on the detection limit of EPMA (WDS). JEOL News 2007, 42E, 46–52. [Google Scholar]
  25. Torrisi, L.; Venuti, V.; Crupi, V.; Silipigni, L.; Cutroneo, M.; Paladini, G.; Torrisi, A.; Havránek, V.; Macková, A.; La Russa, M.F.; et al. RBS, PIXE, Ion-Microbeam and SR-FTIR analyses of pottery fragments from Azerbaijan. Heritage 2019, 2, 113. [Google Scholar] [CrossRef] [Green Version]
  26. Bersani, D.; Lottici, P.P.; Virgenti, S.; Sodo, A.; Malvestuto, G.; Botti, A.; Salvioli-Mariani, E.; Tribaudino, M.; Ospitali, F.; Catarsi, M. Multi-technique investigation of archaeological pottery from Parma (Italy). J. Raman Spectrosc. 2010, 41, 1556–1561. [Google Scholar] [CrossRef]
  27. Medeghini, L.; Lottici, P.P.; De Vito, C.; Mignardi, S.; Bersani, D. Micro-Raman spectroscopy and ancient ceramics: Application and problems. J. Raman Spectrosc. 2014, 45, 1244–1250. [Google Scholar] [CrossRef]
  28. Oancea, A.V.; Bodi, G.; Nica, V.; Ursu, L.E.; Drobota, M.; Cotofana, C.; Vasiliu, A.L.; Simionescu, B.C.; Olaru, M. Multi-analytical characterization of Cucuteni pottery. J. Eur. Ceram. Sci. 2017, 37, 5079–5098. [Google Scholar] [CrossRef]
  29. Gajić-Kvaščev, M.; Bikić, V.; Wright, V.J.; Evans, I.R.; Damjanović-Vasilić, L. Archaeometric study of 17th/18th century painted pottery from the Belgrade Fortress. J. Cult. Herit. 2018, 32, 9–21. [Google Scholar] [CrossRef] [Green Version]
  30. Carretero, M.I.; Dondi, M.; Fabbri, B.; Raimondo, M. The influence of shaping and firing technology on ceramic properties of calcareous and non-calcareous illitic–chloritic clays. Appl. Clay Sci. 2002, 20, 301–306. [Google Scholar] [CrossRef]
  31. Jordán, M.M.; Boix, A.; Sanfeliu, T.; de la Fuente, C. Firing transformations of cretaceous clays used in the manufacturing of ceramic tiles. Appl. Clay Sci. 1999, 14, 225–234. [Google Scholar] [CrossRef]
  32. Lalla, E.A.; Lopez-Reyes, G.; Sansano, A.; Sanz-Arranz, A.; Martínez-Frías, J.; Medina, J.; Rull-Pérez, F. Raman-IR vibrational and XRD characterization of ancient and modern mineralogy from volcanic eruption in Tenerife Island: Implication for Mars. Geosci. Front. 2016, 7, 673–681. [Google Scholar] [CrossRef] [Green Version]
  33. Merkevičius, A.; Bezdicka, P.; Juškėnas, R.; Senvaitienė, J.; Pakutinskienė, I.; Kareiva, A. XRD and SEM characterization of archaeological findings excavated in Lithuania. Chemija 2007, 18, 36–39. [Google Scholar]
  34. Palanivel, R.; Rajesh Kumar, U. The mineralogical and fabric analysis of ancient pottery artifacts. Cerâmica 2011, 57, 56–62. [Google Scholar] [CrossRef] [Green Version]
  35. Pérez-Arantegui, J.; Montull, B.; Resano, M.; Ortega, J.M. Materials and technological evolution of ancient cobalt-blue-decorated ceramics: Pigments and work patterns in tin-glazed objects from Aragon (Spain) from the 15th to the 18th century AD. J. Eur. Ceram. Soc. 2009, 29, 2499–2509. [Google Scholar] [CrossRef]
  36. Ramos, S.S.; Reig, F.B.; Adelantado, J.G.; Marco, D.Y.; Carbó, A.D. Application of XRF, XRD, thermal analysis, and voltammetric techniques to the study of ancient ceramics. Anal. Bioanal. Chem. 2002, 373, 893–900. [Google Scholar]
  37. Seetha, D.; Velraj, G. Characterization and chemometric analysis of ancient pot shards trenched from Arpakkam, Tamil Nadu, India. J. Appl. Res. Technol. 2016, 14, 345–353. [Google Scholar] [CrossRef] [Green Version]
  38. Vecstaudža, J.; Jakovļevs, D.; Bērziņa-Cimdiņa, L.; Stikāne, V. XRD and SEM studies of archaeological stove tile ceramics of Turaida Castle. Mater. Sci. Appl. Chem. 2013, 29, 40–45. [Google Scholar]
  39. Yanik, G.; Bozer, R.; Ceken, M.; Esenli, F.; Gocmez, H. The characterization of medieval ceramics excavated from the Egirdir Caravanserai (Turkey). Ceram. Silik. 2012, 56, 261–268. [Google Scholar]
  40. Nelson, G.C. Ceramics: A Potter’s Handbook; Holt, Rinehart and Winston Publisher: New York, NY, USA, 1966. [Google Scholar]
  41. Lahlil, S.; Xu, J.; Li, W. Influence of manufacturing parameters on the crackling process of ancient Chinese glazed ceramics. J. Cult. Herit. 2015, 16, 401–412. [Google Scholar] [CrossRef]
  42. Colombo, M.; Legrand, S.; Van der Snickt, G.; Janssens, K. Improving data exploration methods from macro imaging techniques: In situ scanning macro-XRF investigation on a Majolica tile tableau. Estudos Conserv. Restauro 2018, 1, 7–25. [Google Scholar]
  43. Coutinho, M.L.; Miller, A.Z.; Phillip, A.; Mirão, J.; Dias, L.; Rogerio-Candelera, M.A.; Sáiz-Jiménez, C.; Martin-Sanchez, P.M.; Cerqueira-Alves, L.; Macedo, M.F. Biodeterioration of majolica glazed tiles by the fungus Devriesia imbrexigena. Construc. Build. Mater. 2019, 212, 49–56. [Google Scholar] [CrossRef] [Green Version]
  44. Kelloway, S.J.; Van Valkenburgh, P.; Iñañez, J.G.; Dussubieux, L.; Quilter, J.; Glascock, M.D. Identifying New World majolica from 16th–18th Century sites on Peru’s north coast. J. Archaeol. Sci. Rep. 2018, 17, 311–324. [Google Scholar] [CrossRef]
  45. Tite, M.S. The production technology of Italian maiolica: A reassessment. J. Archaeol. Sci. 2009, 36, 2065–2080. [Google Scholar] [CrossRef]
  46. Simsek, G.; Arli, B.D.; Kaya, S.; Colomban, P. On-site pXRF analysis of body, glaze and colouring agents of the tiles at the excavation site of Iznik kilns. J. Eur. Ceram. Soc. 2019, 39, 2199–2209. [Google Scholar] [CrossRef]
  47. Meucci, C.; Carratoni, L. Identification of the majolica polychromatic decoration by IRFC methodology. J. Archaeol. Sci. Rep. 2016, 8, 224–234. [Google Scholar] [CrossRef]
  48. Colomban, P.; Treppoz, F. Identification and differentiation of ancient and modern European porcelains by Raman macro-and micro-spectroscopy. J. Raman Spectrosc. 2001, 32, 93–102. [Google Scholar] [CrossRef]
  49. Ospitali, F.; Sabetta, T.; Tullini, F.; Nannetti, M.C.; Di Lonardo, G. The role of Raman microscopy in the study of black gloss coating on Roman pottery. J. Raman Spectrosc. 2005, 36, 18–23. [Google Scholar] [CrossRef]
  50. Tülek, F.; Çelik, G.A.; Atapek, Ş.H.; Polat, Ş. Characterization of medieval glazed ceramics of the East Plain Cilicia survey. J. Archaeol. Sci. Rep. 2020, 29, 102136. [Google Scholar] [CrossRef]
  51. Colomban, P.; Sagon, G.; Faurel, X. Differentiation of antique ceramics from the Raman spectra of their coloured glazes and pigments. J. Raman Spectrosc. 2001, 32, 351–360. [Google Scholar] [CrossRef]
  52. Coentro, S.; Alves, L.C.; Relvas, C.; Ferreira, T.; Mirão, J.; Molera, J.; Pradell, T.; Trindade, R.A.A.; Da Silva, R.C.; Muralha, V.S.F. The glaze technology of Hispano-Moresque ceramic tiles: A comparison between Portuguese and Spanish collections. Archaeometry 2017, 59, 667–684. [Google Scholar] [CrossRef] [Green Version]
  53. Mastrotheodoros, G.P.; Beltsios, K.G.; Bassiakos, Y.; Papadopoulou, V. Two unique Byzantine immured lead-glazed relief ceramic icons and related tiles from the church of St Basil in Arta, Greece: Investigation and interpretation of materials and techniques. Archaeol. Anthropol. Sci. 2018, 10, 2059–2074. [Google Scholar] [CrossRef]
  54. Roisine, G.; Capobianco, N.; Caurant, D.; Wallez, G.; Bouquillon, A.; Majérus, O.; Cormier, L.; Gilette, S.; Gerbier, A. The art of Bernard Palissy (1510–1590): Influence of firing conditions on the microstructure of iron-coloured high-lead glazes. Appl. Phys. A 2017, 123, 501. [Google Scholar] [CrossRef]
  55. Colomban, P. The destructive/non-destructive identification of enameled pottery, glass artifacts and associated pigmentsA brief overview. Arts 2013, 2, 77–110. [Google Scholar] [CrossRef] [Green Version]
  56. Siddall, R. Mineral pigments in archaeology: Their analysis and the range of available materials. Minerals 2018, 8, 201. [Google Scholar] [CrossRef] [Green Version]
  57. Colomban, P.; Zhang, Y.; Zhao, Z. Non-invasive Raman analyses of Chinese huafalang and related porcelain wares. Searching for evidence for innovative pigment technology. Ceram. Int. 2017, 43, 12079–12088. [Google Scholar] [CrossRef] [Green Version]
  58. Di Febo, R.; Casas, L.; Capelli, C.; Cabella, R.; Vallcorba, O. Catalan imitations of the Ligurian taches noires ware in Barcelona (18th–19th century): An example of technical knowledge transfer. Minerals 2018, 8, 183. [Google Scholar] [CrossRef] [Green Version]
  59. Barnett, J.R.; Miller, S.; Pearce, E. Colour and art: A brief history of pigments. Opt. Laser Technol. 2006, 38, 445–453. [Google Scholar] [CrossRef]
  60. Sakellariou, K.; Miliani, C.; Morresi, A.; Ombelli, M. Spectroscopic investigation of yellow majolica glazes. J. Raman Spectrosc. 2004, 35, 61–67. [Google Scholar] [CrossRef]
  61. Bell, I.M.; Clark, R.J.; Gibbs, P.J. Raman spectroscopic library of natural and synthetic pigments (pre-≈1850 AD). Spectrochim. Acta A 1997, 53, 2159–2179. [Google Scholar] [CrossRef]
  62. Coentro, S.; Mimoso, J.M.; Lima, A.M.; Silva, A.S.; Pais, A.N.; Muralha, V.S. Multi-analytical identification of pigments and pigment mixtures used in 17th century Portuguese azulejos. J. Eur. Ceram. Soc. 2012, 32, 37–48. [Google Scholar] [CrossRef] [Green Version]
  63. El Hadri, M.; Ahamdane, H.; Raghni, M.E.I. Effect of sol–gel method on colour properties of the classical cobalt olivine (Co2SiO4) ceramic pigment. Bull. Mater. Sci. 2017, 40, 375–382. [Google Scholar] [CrossRef] [Green Version]
  64. Coutinho, M.L.; Veiga, J.P.; Alves, L.C.; Mirão, J.; Dias, L.; Lima, A.M.; Muralha, V.S.; Macedo, M.F. Characterization of the glaze and in-glaze pigments of the nineteenth-century relief tiles from the Pena National Palace, Sintra, Portugal. Appl. Phys. A 2016, 122, 696. [Google Scholar] [CrossRef]
  65. Catapano, I.; Affinito, A.; Guerriero, L.; Bisceglia, B.; Soldovieri, F. Majolica imaging with THz waves: Preliminary results. Appl. Phys. A 2016, 122, 533. [Google Scholar] [CrossRef]
  66. Bersani, D.; Lottici, P.P.; Antonioli, G.; Campani, E.; Casoli, A.; Violante, C. Pigments and binders in the wall paintings of Santa Maria della Steccata in Parma (Italy): The ultimate technique of Parmigianino. J. Raman Spectrosc. 2004, 35, 694–703. [Google Scholar] [CrossRef]
  67. Shortland, A.J. The use and origin of antimonate colorants in early Egyptian glass. Archaeometry 2002, 44, 517–530. [Google Scholar] [CrossRef]
  68. Dik, J.; Hermens, E.; Peschar, R.; Schenk, H. Early production recipes for lead or lead antimonate yellow in Italian art. Archaeometry 2005, 47, 593–607. [Google Scholar] [CrossRef]
  69. Viti, C.; Borgia, I.; Brunetti, B.; Sgamellotti, A.; Mellini, M. Microtexture and microchemistry of glaze and pigments in Italian Renaissance pottery from Gubbio and Deruta. J. Cult. Herit. 2003, 4, 199–210. [Google Scholar] [CrossRef]
  70. Calparsoro, E.; Sanchez-Garmendia, U.; Arana, G.; Maguregui, M.; Iñañez, J.G. An archaeometric approach to the majolica pottery from alcazar of Nájera archaeological site. Herit. Sci. 2019, 7, 33. [Google Scholar] [CrossRef]
  71. Colomban, P.; Kırmızı, B.; Gougeon, C.; Gironda, M.; Cardinal, C. Pigments and glassy matrix of the 17th–18th century enamelled French watches: A non-invasive on-site Raman and pXRF study. J. Cult. Herit. 2020. [Google Scholar] [CrossRef]
  72. Gulzar, S.; Wörle, M.; Burg, J.P.; Chaudhry, M.N.; Joseph, E.; Reusser, E. Characterization of 17th century Mughal tile glazes from Shahdara complex, Lahore-Pakistan. J. Cult. Herit. 2013, 14, 174–179. [Google Scholar] [CrossRef]
  73. Montanari, R.; Murakami, N.; Colomban, P.; Alberghina, M.F.; Pelosi, C.; Schiavone, S. European ceramic technology in the Far East: Enamels and pigments in Japanese art from the 16th to the 20th century and their reverse influence on China. Herit. Sci. 2020, 8, 1–17. [Google Scholar] [CrossRef]
  74. Agresti, G.; Baraldi, P.; Pelosi, C.; Santamaria, U. Yellow pigments based on lead, tin, and antimony: Ancient recipes, synthesis, characterization, and hue choice in artworks. Color Res. Appl. 2016, 41, 226–231. [Google Scholar] [CrossRef]
  75. Hradil, D.; Grygar, T.; Hradilová, J.; Bezdička, P.; Grűnwaldová, V.; Fogaš, I.; Miliani, C. Microanalytical identification of Pb-Sb-Sn yellow pigment in historical European paintings and its differentiation from lead tin and Naples yellows. J. Cult. Herit. 2007, 8, 377–386. [Google Scholar] [CrossRef]
  76. Pelosi, C.; Agresti, G.; Santamaria, U.; Mattei, E. Artificial yellow pigments: Production and characterization through spectroscopic methods of analysis. e-PS 2010, 7, 108–115. [Google Scholar]
Figure 1. Decorated floor tiles: (a) front of tile no. 337 (Type A); (b) back of tile no. 337; (c) front of tile no. 323 (Type A); (d) back of tile no. 323; (e) front of tile no. 328 (Type B); and (f) back of tile no. 328 (photos: J. J. Gottlieb and D. Ashkenazi).
Coatings 10 01091 g001
Figure 2. Tile fragments. Type A: (a) tile no. 334; (b) tile no. 340; (c) tile no. 319; (d) tile no. 339; and Type B: (e) tile no. 328 (photos: D. Ashkenazi).
Coatings 10 01091 g002
Figure 3. Images of tiles. Tile no. 334, Type A: (a) area of blue pigment; (b) area of yellow pigment; (c) orange, green, and brown decoration on top of white glaze matrix; (d) green decoration on top of white glaze matrix; (e) area of orange pigment; tile no. 339, Type A: (f) olive-green decoration on top of white glaze matrix; tile no. 328, Type B: (g) general view; and tile no. 328, and Type B: (h) area of brown pigment matrix covered with transparent brown glaze (photos: H. Kravits and M. Cohen).
Coatings 10 01091 g003
Figure 4. Multifocal light microscopy (LM) images of tiles. (a) Tile no. 334 (Type A): clay body and white glaze layer on top; (b) creep deformation and chatter mark trails in white glaze layer; and (c) tile no. 328, Type B: clay body (back of tile, area of brown clay body).
Coatings 10 01091 g004
Figure 5. XRD analysis results: (a) clay body of tiles 328 (Type B, graph 1) and 334 (Type A, graph 2); and (b) the white (graph 2), yellow (graph 4), and blue (graph 3) pigments of Tiles 334 and 340 (Type A), and the brown pigment of tile no. 328 (Type B, graph 1).
Coatings 10 01091 g005
Figure 6. Raman spectroscopy of glaze coating and pigments: blue pigment on top of white matrix (tile no. 334, Type A, graph 1); glaze matrix with brown pigment of tile no. 328 (Type B, graph 2); yellow pigment on top of white matrix (tile no. 334, Type A, graph 3); and white glaze matrix of tile no. 334 (Type A, graph 4).
Coatings 10 01091 g006
Figure 7. TOF-SIMS analysis results of Type A and B tiles, showing the element content of the different pigments, surrounded by glaze matrix.
Coatings 10 01091 g007
Figure 8. TOF-SIMS analysis results of the pigments’ glaze surface, showing secondary ion images of: (a) Pb (blue, tile no. 334, Type A); (b) Pb (yellow, tile no. 340, type A); (c) Pb (white, tile no. 334); (d) Pb (brown, tile no. 328, Type B); (e) Fe (blue, no. 334); (f) Fe (yellow, no. 340); (g) Fe (white, no. 334); (h) Fe (brown, no. 328); (i) Ti (blue, no. 334); (j) Ti (yellow, no. 340); (k) Ti (white, no. 334); (l) Ti (brown, no. 328); (m) Sn (blue, no. 334); (n) Sn (yellow, no. 340); (o) Sn (white, no. 334); and (p) Co (blue, no. 334).
Coatings 10 01091 g008
Figure 9. Tile no. 334 (Type A): (a) creep deformation and chatter mark trails (multifocal LM); (b) the clay base covered with white glaze which includes gas bubbles (SEM, SE); (c) creep deformation and chatter mark trails in the white glaze coating [back-scattered electrons (BSE) mode]; and (d) higher magnification of Figure 9c.
Coatings 10 01091 g009
Figure 10. Microscopic images of the green pigment (tile no. 334, Type A): (a) view of green pigment surface (multifocal LM); (b) general SEM image of the pigment (bright dots at the upper part of sample, BSE mode); (c) the pigment particles (bright dots, BSE mode); and (d) area of the cracked white glaze matrix with a few bright pigment particles (BSE mode).
Coatings 10 01091 g010
Figure 11. SEM images of yellow pigment (tile no. 340, Type A): (a) cracked white glaze matrix with yellow pigment particles (bright particles) and (bd) higher magnification of yellow pigment particles.
Coatings 10 01091 g011
Figure 12. Microscopic images of brown pigment. Tile no. 334, Type A: (a) boundary between yellow and brown areas (multifocal LM); (b) large magnification of brown pigment area (multifocal LM); tile no. 319, Type A: (c) light brown pigment area (SEM, BSE mode); and (d) dark brown pigment area (BSE mode).
Coatings 10 01091 g012
Table 1. Raman chemical analysis results, showing the presence of components of the clay bodies of Tiles 334, 340 (light brown clay, Type A), and 328 (red-brown clay, Type B), where “+” means “present” and “–” means absent.
Tile No.QuartzHematiteDiopsideCalciteFeldsparForsterite
334, Type A+++++
340, Type A+++++
328, Type B++++++
Table 2. SEM-EDS chemical analysis of the Type A tile pigment matrix.
PigmentItemComposition Weight Percentage (wt %)
PbOSiO2Al2O3Fe2O3CaOCoOSb2O5K2OMgONa2O
GreenTile no. 334, area 1 (Figure 10)40.418.03.911.34.42.614.71.43.3
Tile no. 334, area 242.115.53.110.84.62.018.01.12.8
BrownTile no. 319 (Figure 12c)45.322.35.46.44.89.02.81.22.8
Tile no. 319 (Figure 12d)43.926.14.95.14.28.83.00.73.3
Table 3. Electron probe microanalysis with wavelength-dispersive X-ray spectroscopy (EPMA-WDS) chemical analysis of the Type A tile pigment matrix.
PigmentItemComposition Weight Percentage (wt %)
PbOSiO2Al2O3Fe2O3CaOCoOSb2O5SnO2K2OMgONa2OSO4
GreenTile no. 334, area 141.317.63.711.14.72.914.61.43.4
Tile no. 334, area 242.015.83.410.65.12.417.41.22.8
OrangeTile no. 31940.416.62.514.417.06.31. 91.1
Tile no. 334, area 145.117.32.414.112.56.91.8
Tile no. 334, area 245.118.33.210.912.69.01.8
BrownTile no. 31945.122.85.25.85.18.82.81.12.7
Tile no. 31942.826.45.15.44.58.52.70.92.8
Publisher’s Note: MDPI stays neutral with regard to jurisdictional claims in published maps and institutional affiliations.

