Article

Fomitopsis officinalis: Spatial (Pileus and Hymenophore) Metabolomic Variations Affect Functional Components and Biological Activities

1
Department of Chemistry, Biology and Biotechnology, University of Perugia, 06122 Perugia, Italy
2
Department of Pharmaceutical Sciences, University of Perugia, 06126 Perugia, Italy
3
Center for Perinatal and Reproductive Medicine, Santa Maria della Misericordia University Hospital, University of Perugia, 06132 Perugia, Italy
4
Physiology and Biochemistry Research Laboratory, Department of Biology, Science Faculty, Selcuk University, 42130 Konya, Turkey
5
Botanic Garden “Giardino dei Semplici”, Department of Pharmacy, “Gabriele d’Annunzio” University, 66100 Chieti, Italy
*
Authors to whom correspondence should be addressed.
These authors contributed equally to this work.
Antibiotics 2023, 12(4), 766; https://doi.org/10.3390/antibiotics12040766
Submission received: 13 March 2023 / Revised: 11 April 2023 / Accepted: 12 April 2023 / Published: 16 April 2023

Abstract

:
Fomitopsis officinalis is a holartic polyporous mushroom that forms large fruiting bodies on old standing trees, fallen logs, or stumps. F. officinalis is a medicinal mushroom species that is most commonly used in traditional European medicine. In this study, we explore the spatial metabolic differences in F. officinalis’ mushroom parts, i.e., the cap (median and apical parts) and the hymenium. Additionally, chromatographic analysis was conducted in order to unravel the composition of specialized metabolites in the hydroalcoholic mushroom extracts. The potential antifungal and bacterial effects of extracts were tested against pathogen strains of Gram+ and Gram– bacteria, and yeast, dermatophytic, and fungal-pool species. Extracts from the apical part were the richest in terms of phenolic compounds; consistent with this finding, the extracts were also the most effective antiradical and antimicrobial agents with MIC values < 100 µg/mL for most of the tested bacterial and dermatophytic species. According to these findings, F. officinalis extracts are valuable sources of primary and secondary metabolites, thus suggesting potential applications in the formulation of food supplements with biological properties in terms of antioxidant and antimicrobial activities.

1. Introduction

Fomitopsis officinalis (Vill.) Bondartsev and Singer (syn. Laricifomes officinalis (Vill.) Kotl. and Pouzar) is a holartic polyporous mushroom belonging to the Fomitopsidaceae family (Polyporales order) that forms large fruiting bodies on old standing trees, fallen logs, or stumps. It is a slow-growing necrotrophic parasite causing intensive brown rot in wood. Basidiomata are perennial and sometimes reach a considerable size [1,2]. F. officinalis is easily distinguished from other Fomitopsis species due to its chalky texture, and distinctive smell and taste [1,2].
The existence of this species was reported in Europe, Asia, North Africa, and North America. Western Europe (the Alps), North Asia (Siberia from the Ural Mountains to the Russian Far East), and North America are the three major distribution areas of F. officinalis [3,4]. This species was reported on several hosts in North America, such as Abies Mill., Larix Mill., Picea A. Dietr., Pinus L., Pseudotsuga Carrière, and Tsuga Carrière [5]. In Eurasia, it can be found mostly on Larix spp. and sometimes on Pinus spp. In Europe, it has been frequently recorded on Larix decidua Mill. [4]. F. officinalis is a medicinal mushroom species that was most commonly used in traditional European medicine [6]. This species contains molecules such as agaricinic acid and chlorinated coumarins with antibacterial activity against Gram bacteria, Mycobacterium tuberculosis, the Herpes simplex virus, Poxviridae, Orthopoxvirus, and the Type A influenza virus in birds (H5N1) and humans (H3N2) [3].
Chlorinated coumarins from mycelia and lanostane triterpenoids from basidiomes are directly responsible for antiviral or antibacterial and trypanocidal activity, respectively [3]. Among the bioactive compounds of F. officinalis, lanostane-type triterpenoids constitute the main group [6]. Other biological activities of F. officinalis extracts are anticancer [7] and anti-inflammatory [8]. Recently, one of these compounds (dehydrosulfurenic acid), specifically found in F. officinalis, was patented as a potential pharmaceutical treatment for ischemic stroke [9].
Metabolomics provides a quantitative and/or qualitative estimation of all low metabolites (small molecules with a molecular weight of less than 1800 Da) present in biological systems, for instance, fungi, plants, animals, and prokaryotes [10,11]. In recent years, metabolomics has emerged as an important methodology to determine the temporal and spatial correlations between metabolic cues and associated phenotypes in mushroom species [12]. A large number of studies elucidated the gamut of important metabolites in F. officinalis for their organoleptic properties, flavor, and nutritional and functional aspects, particularly anticancer potential [13,14]. Although the majority of studies characterized the lanostane-type triterpenoids class of secondary metabolites from F. officinalis [15,16,17,18], the spatial distribution of primary and secondary metabolomes in different mushroom parts is largely unknown with respect to the associated phenotypes.
In this study, we designed a nontargeted mass spectrometry (MS)-based metabolomic framework to explore the spatial metabolic differences in F. officinalis mushroom parts, i.e., the cap (median and apical parts) and the hymenium. Further, we established the correlation between the discriminant metabolite classes, and the specific mushroom parts (phenotypes) and bioactivities. Additionally, chromatographic analysis was conducted in order to unravel the composition of specialized metabolites in the mushroom extracts prepared with a hydroalcoholic solution. Considering the potential antifungal and antibacterial effects of extracts from edible mushrooms [11,19], the above-mentioned extracts were tested for potential growth-inhibitory effects against the pathogen strains of Gram+ and Gram- bacteria, and yeast, dermatophytic, and fungal-pool species.

2. Results and Discussion

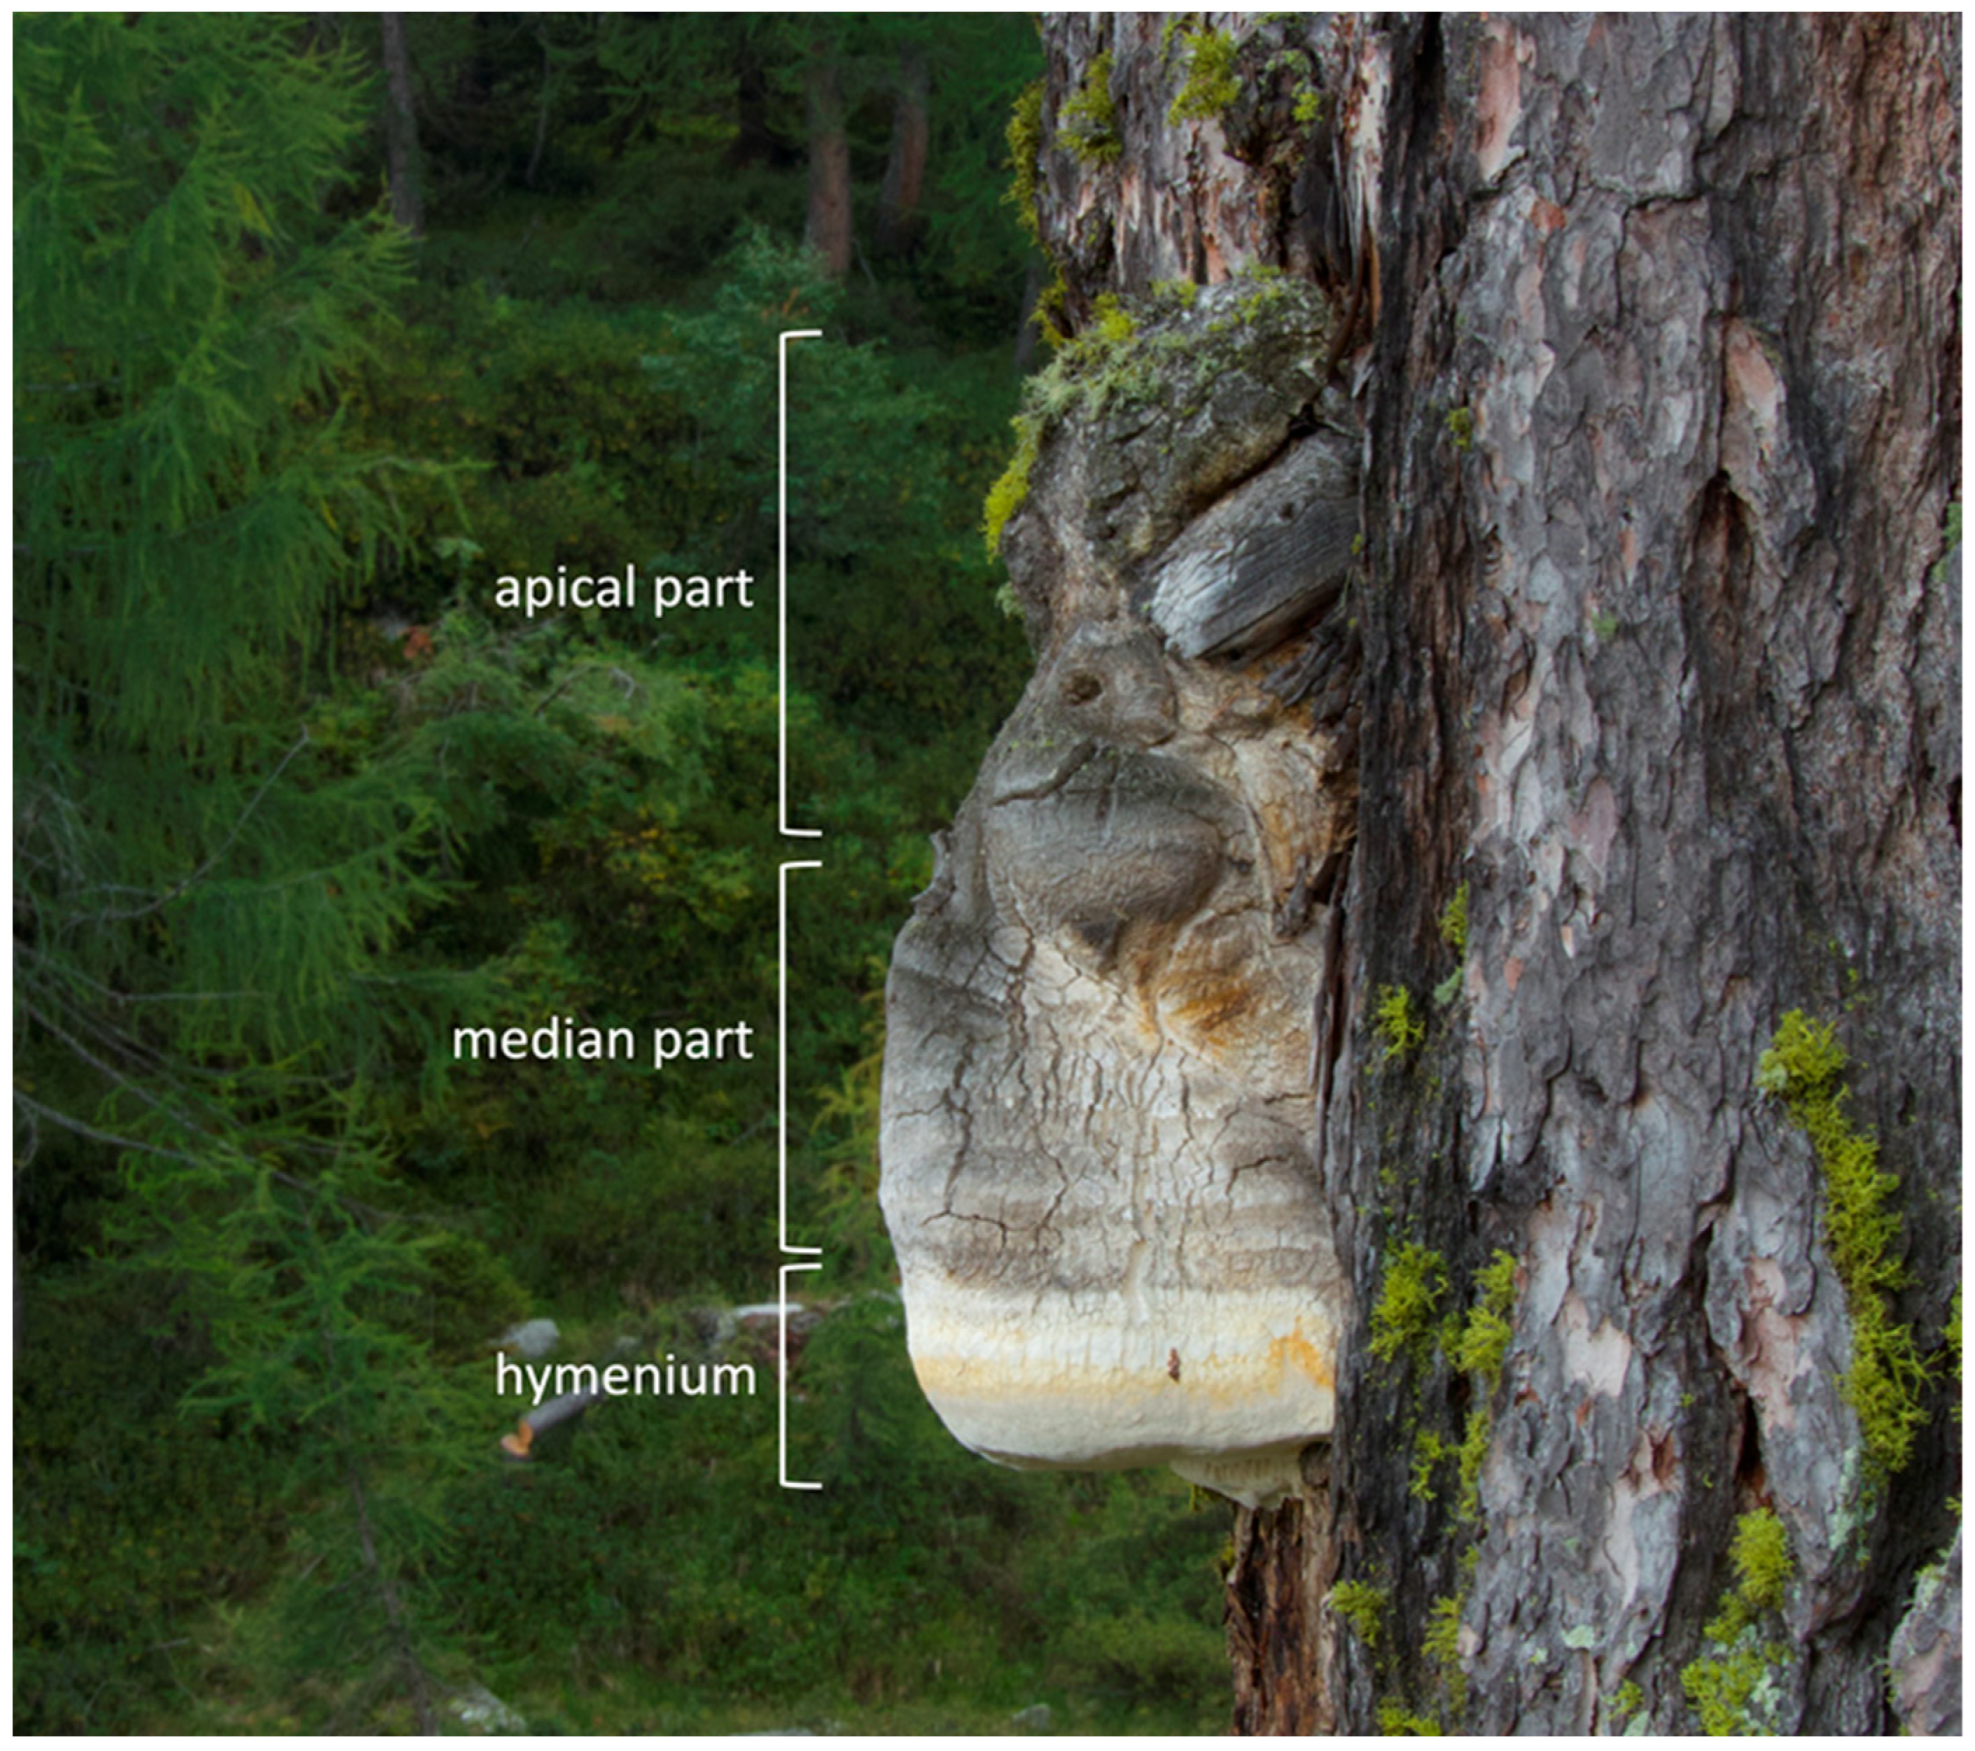
2.1. Mushroom Identification

The exact characterization and identification of medicinal mushrooms is fundamental for exploiting their full potential in the food and pharmaceutical industries [20]. The morphological characteristics of the fruiting body of F. officinalis (PeruMyc 3897) correspond to those reported by Bernicchia and Gorjón [21]. The taxonomic affiliation of the mushroom strains was performed via targeting the ITS region of the ribosomal DNA. Additionally, a BLAST search confirmed that our sample belonged to F. officinalis, as it showed a close match with the deposited sequences of these species (Table 1).

2.2. Untargeted LC–MS/MS-Based Metabolomics

In this study, the metabolomic profile of F. officinalis was evaluated through the mass spectrometry–ultraperformance liquid chromatography (UHPLC)–QTOF method. The raw data were processed with MS-DIAL in two separate sessions, one for the Pos and one for the Neg files. The obtained data were merged into a single data matrix that reports the mass and retention time of 8335 features, and their area in the respective 9 samples (from L1 to L9).

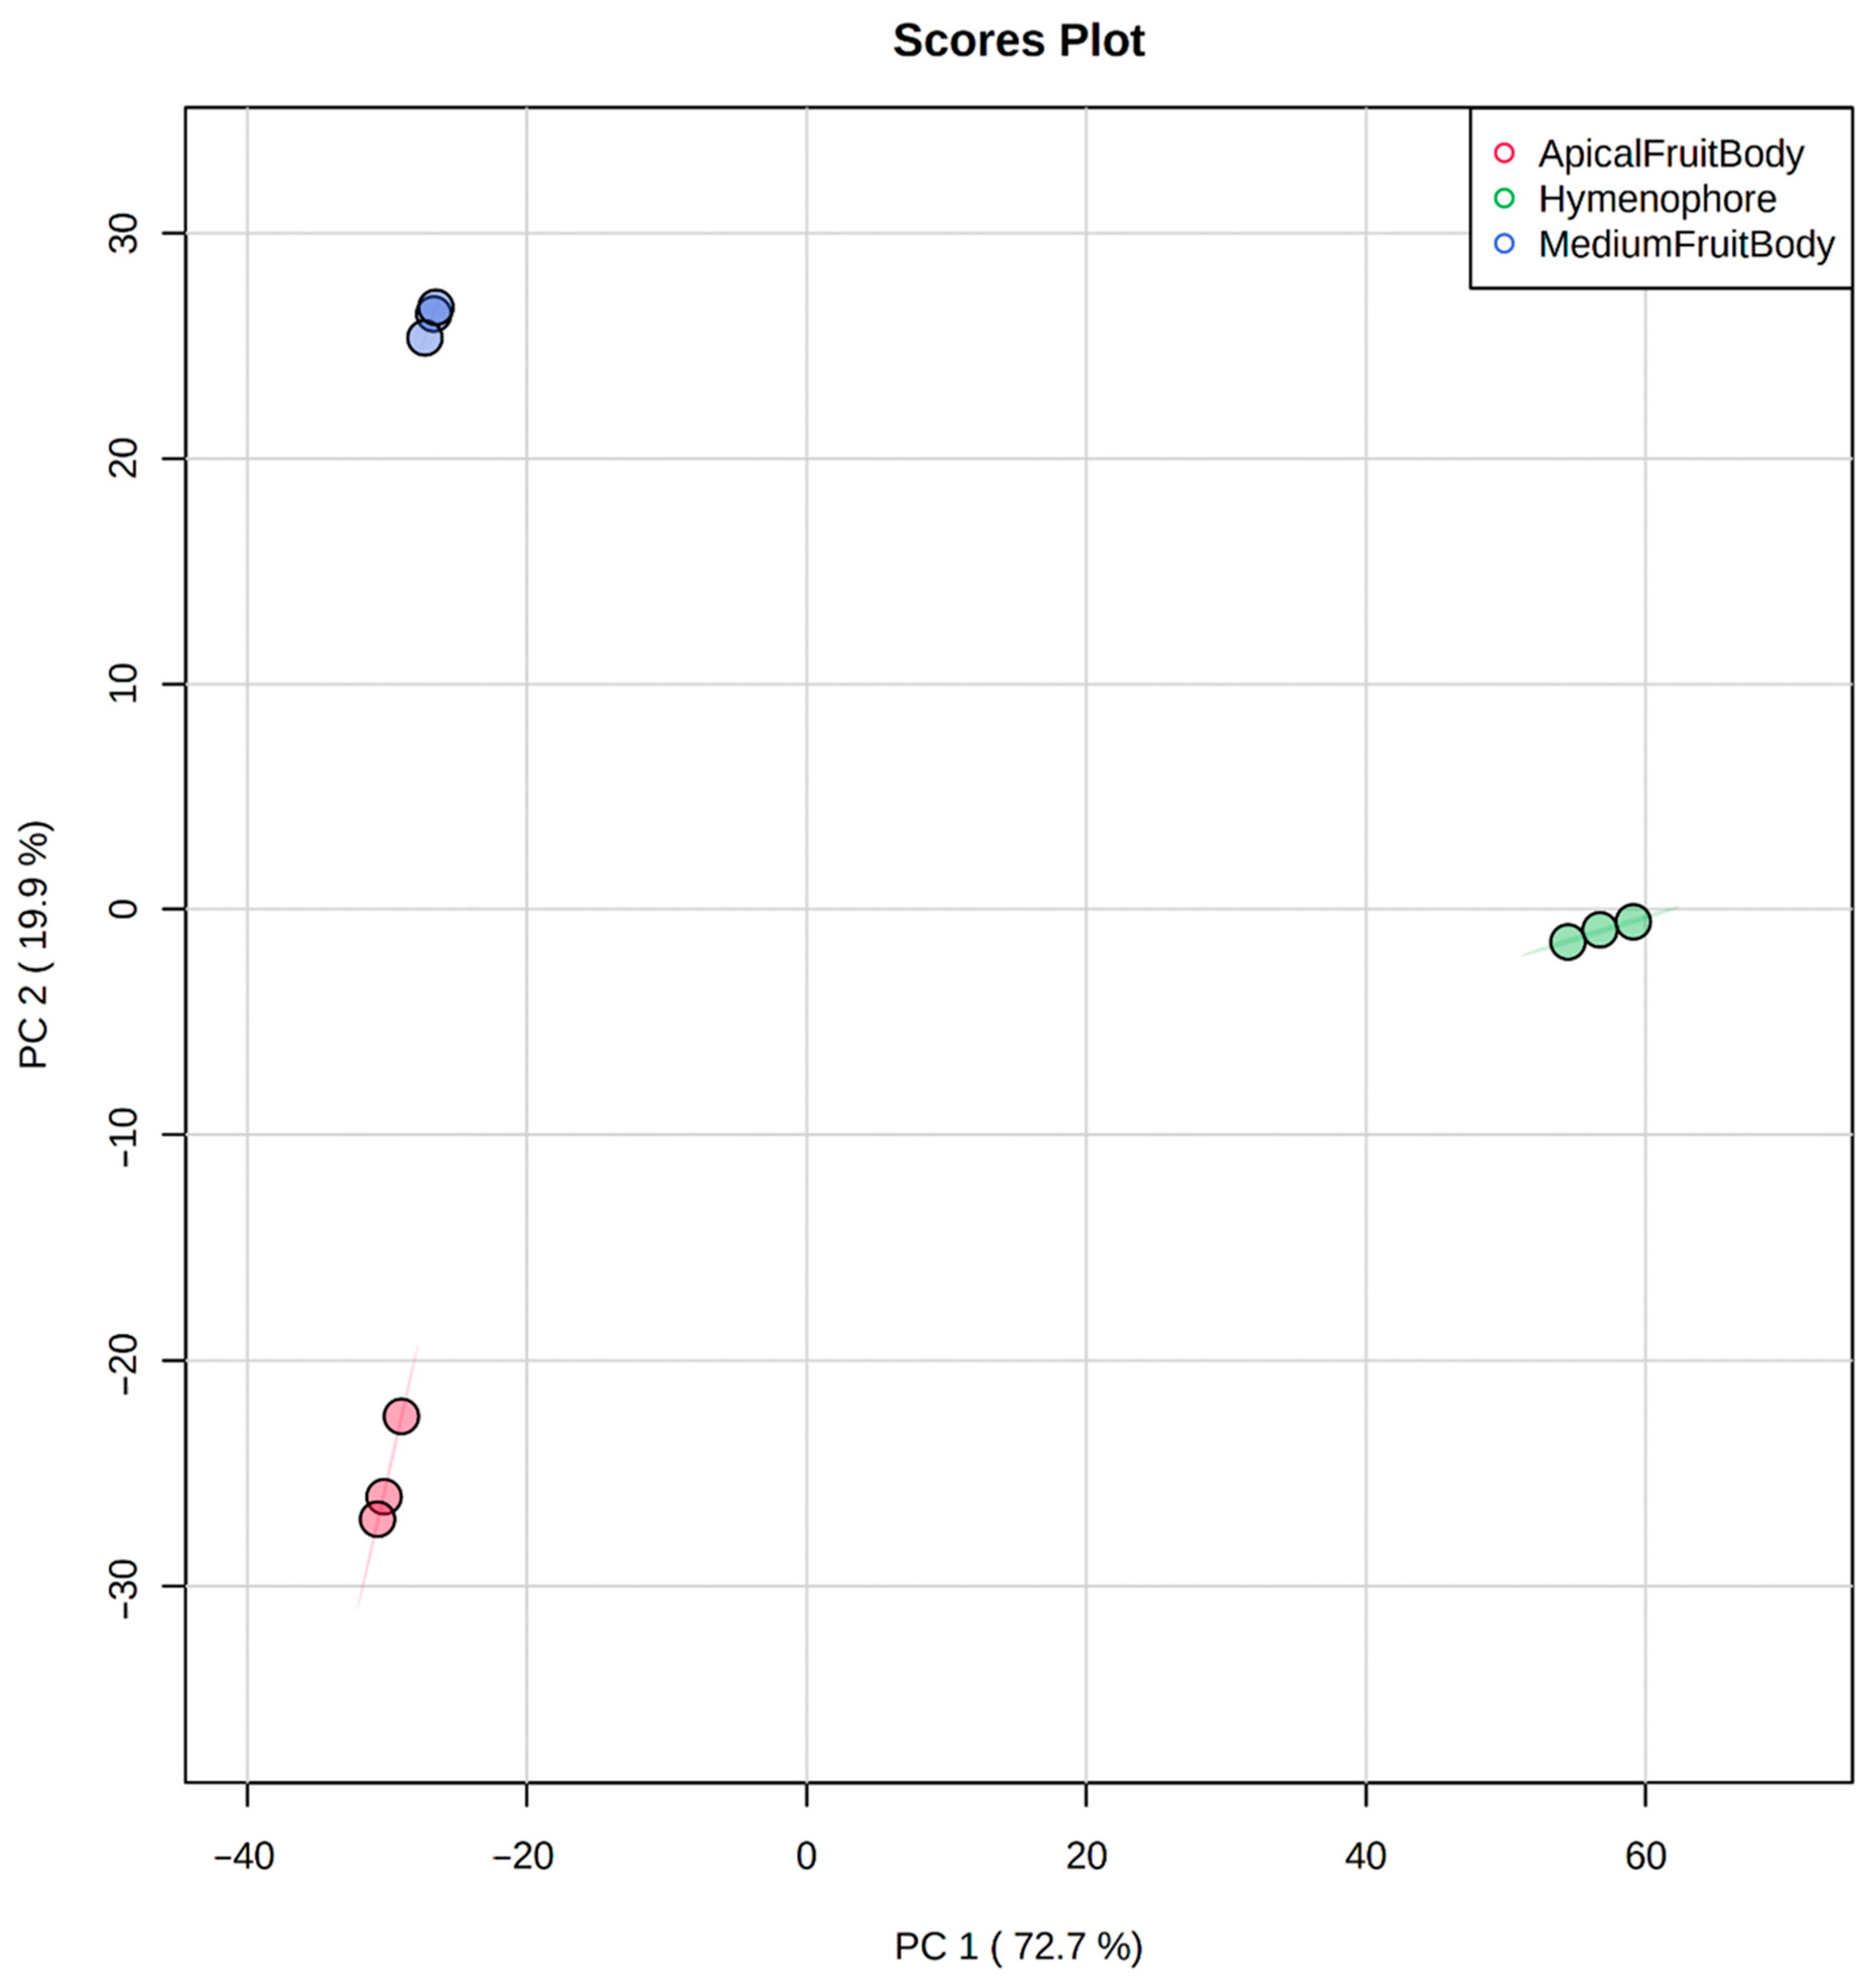
2.3. Statistical Data Analysis

RawData_Mz__RT_MetaboAnalyst.xlsx was uploaded to the MetaboAnalyst web platform to perform PCA, and heat-map, pathway, and functional analyses (Figure 1, Figure 2 and Figure 3). To perform PCA, the data matrix was treated with autoscaling and normalized with the median.

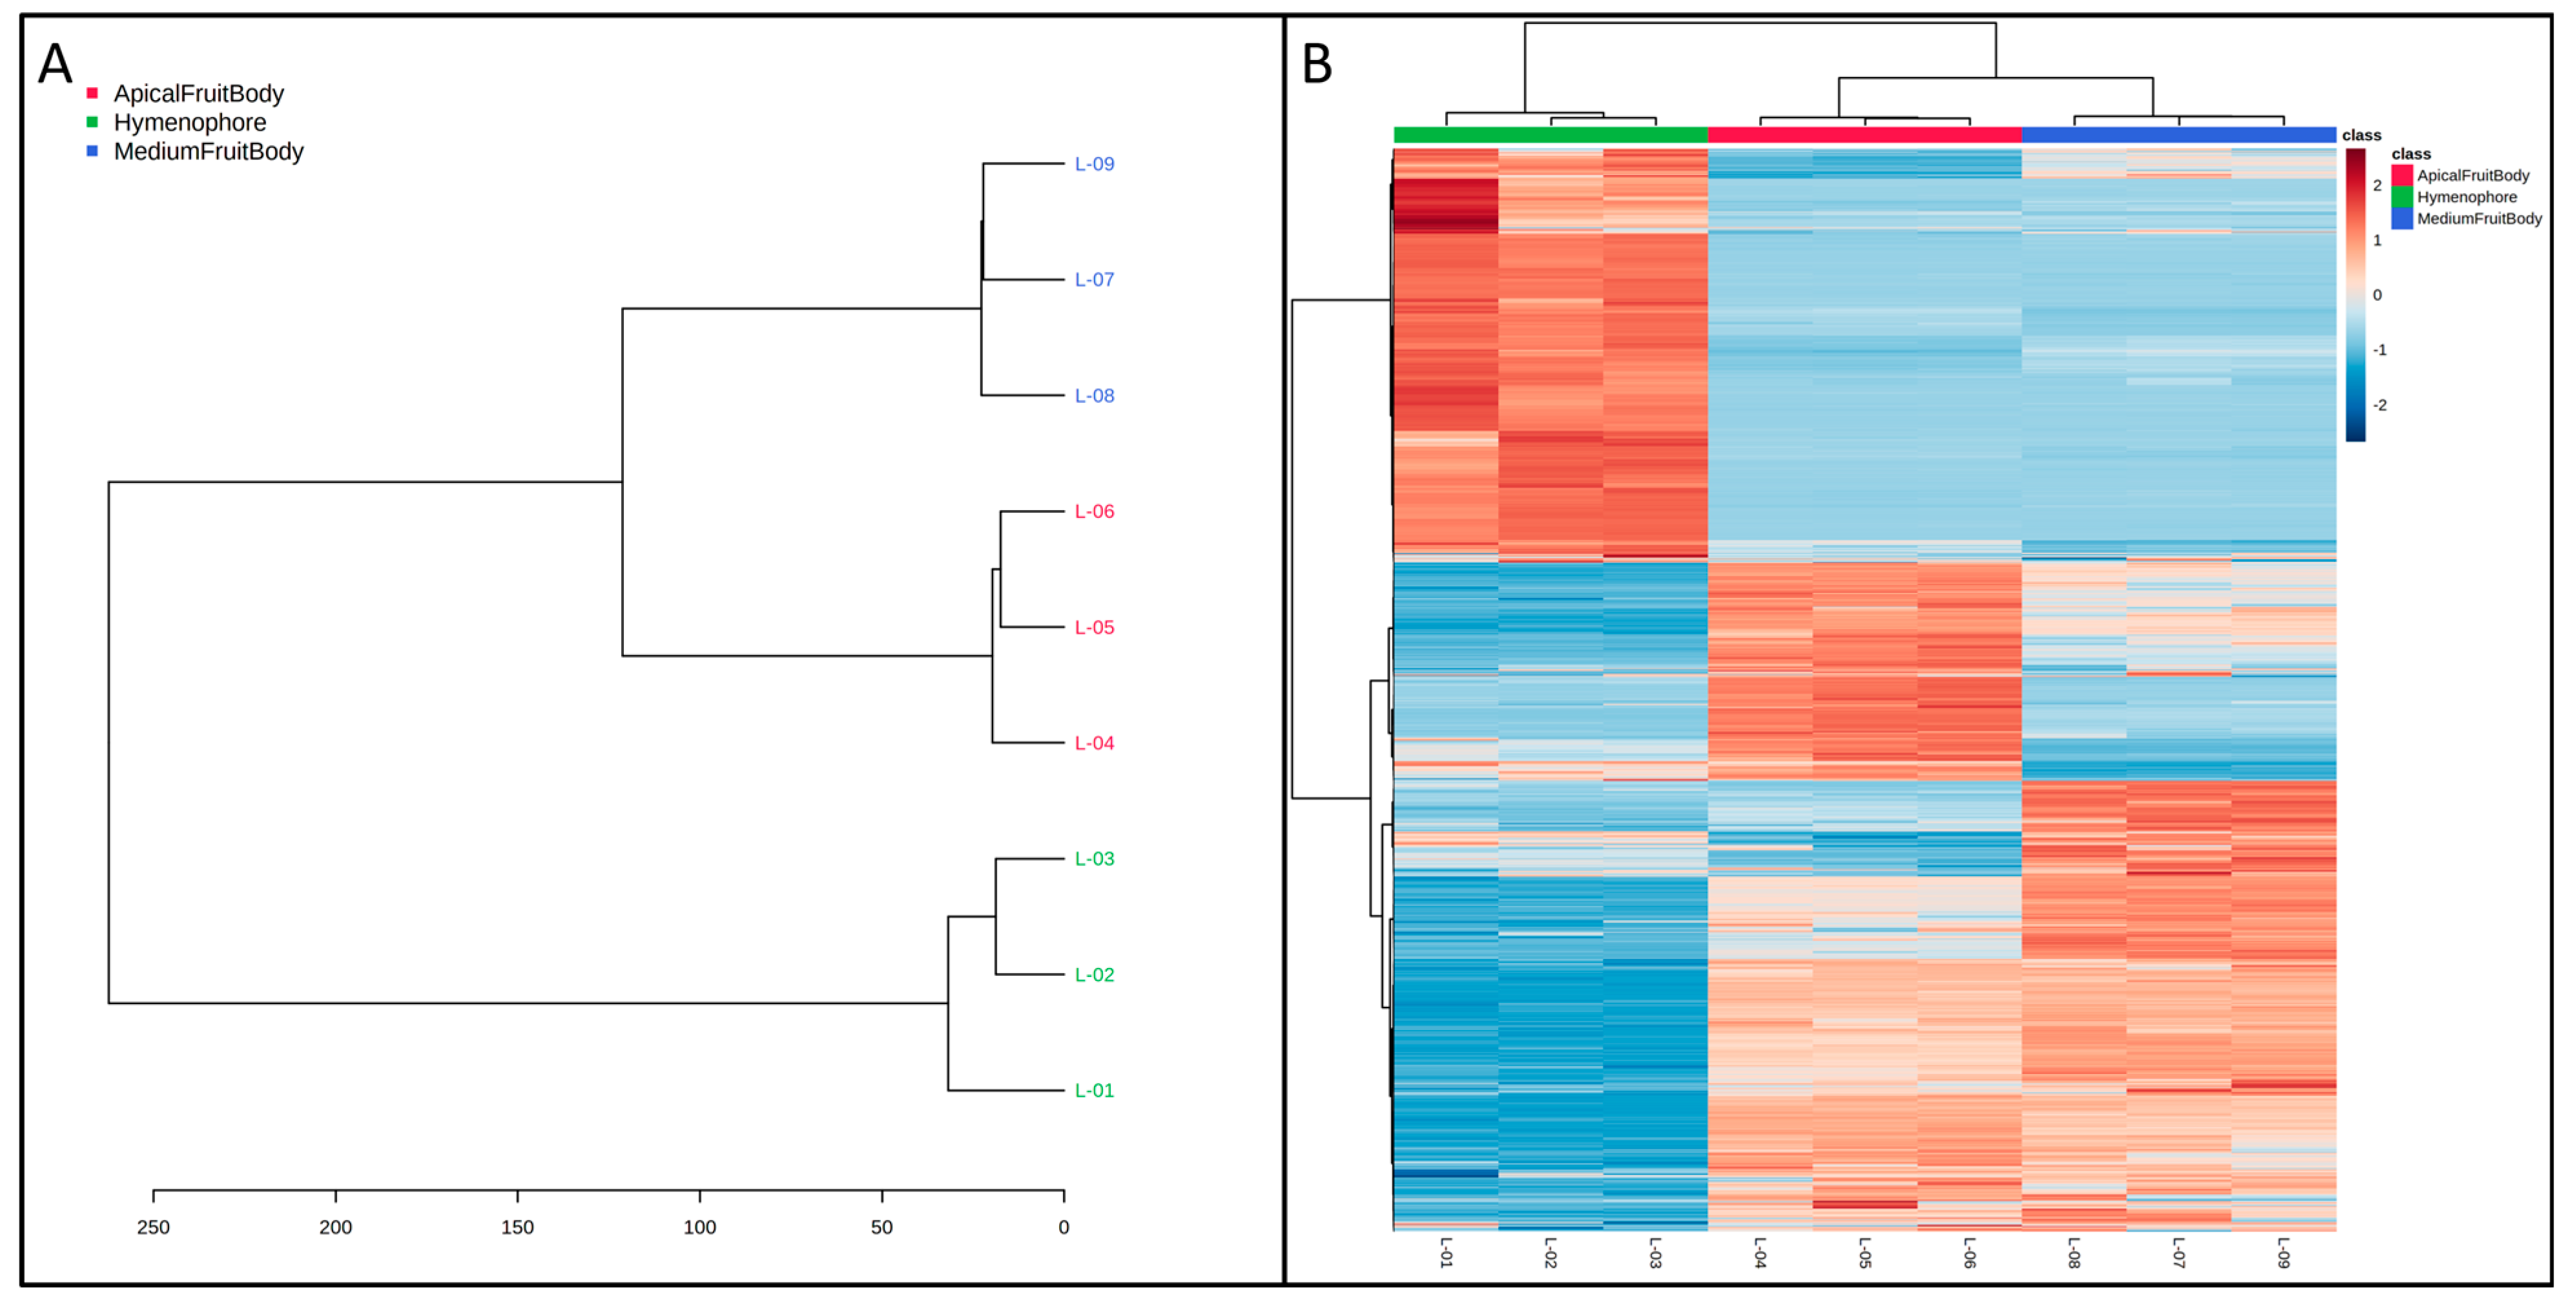
2.4. Cluster Analysis

The data, treated as previously described, were used to create the dendrogram (Figure 2A) and the heat maps (Figure 2B). The distance between the features was calculated with the Euclidean algorithm.

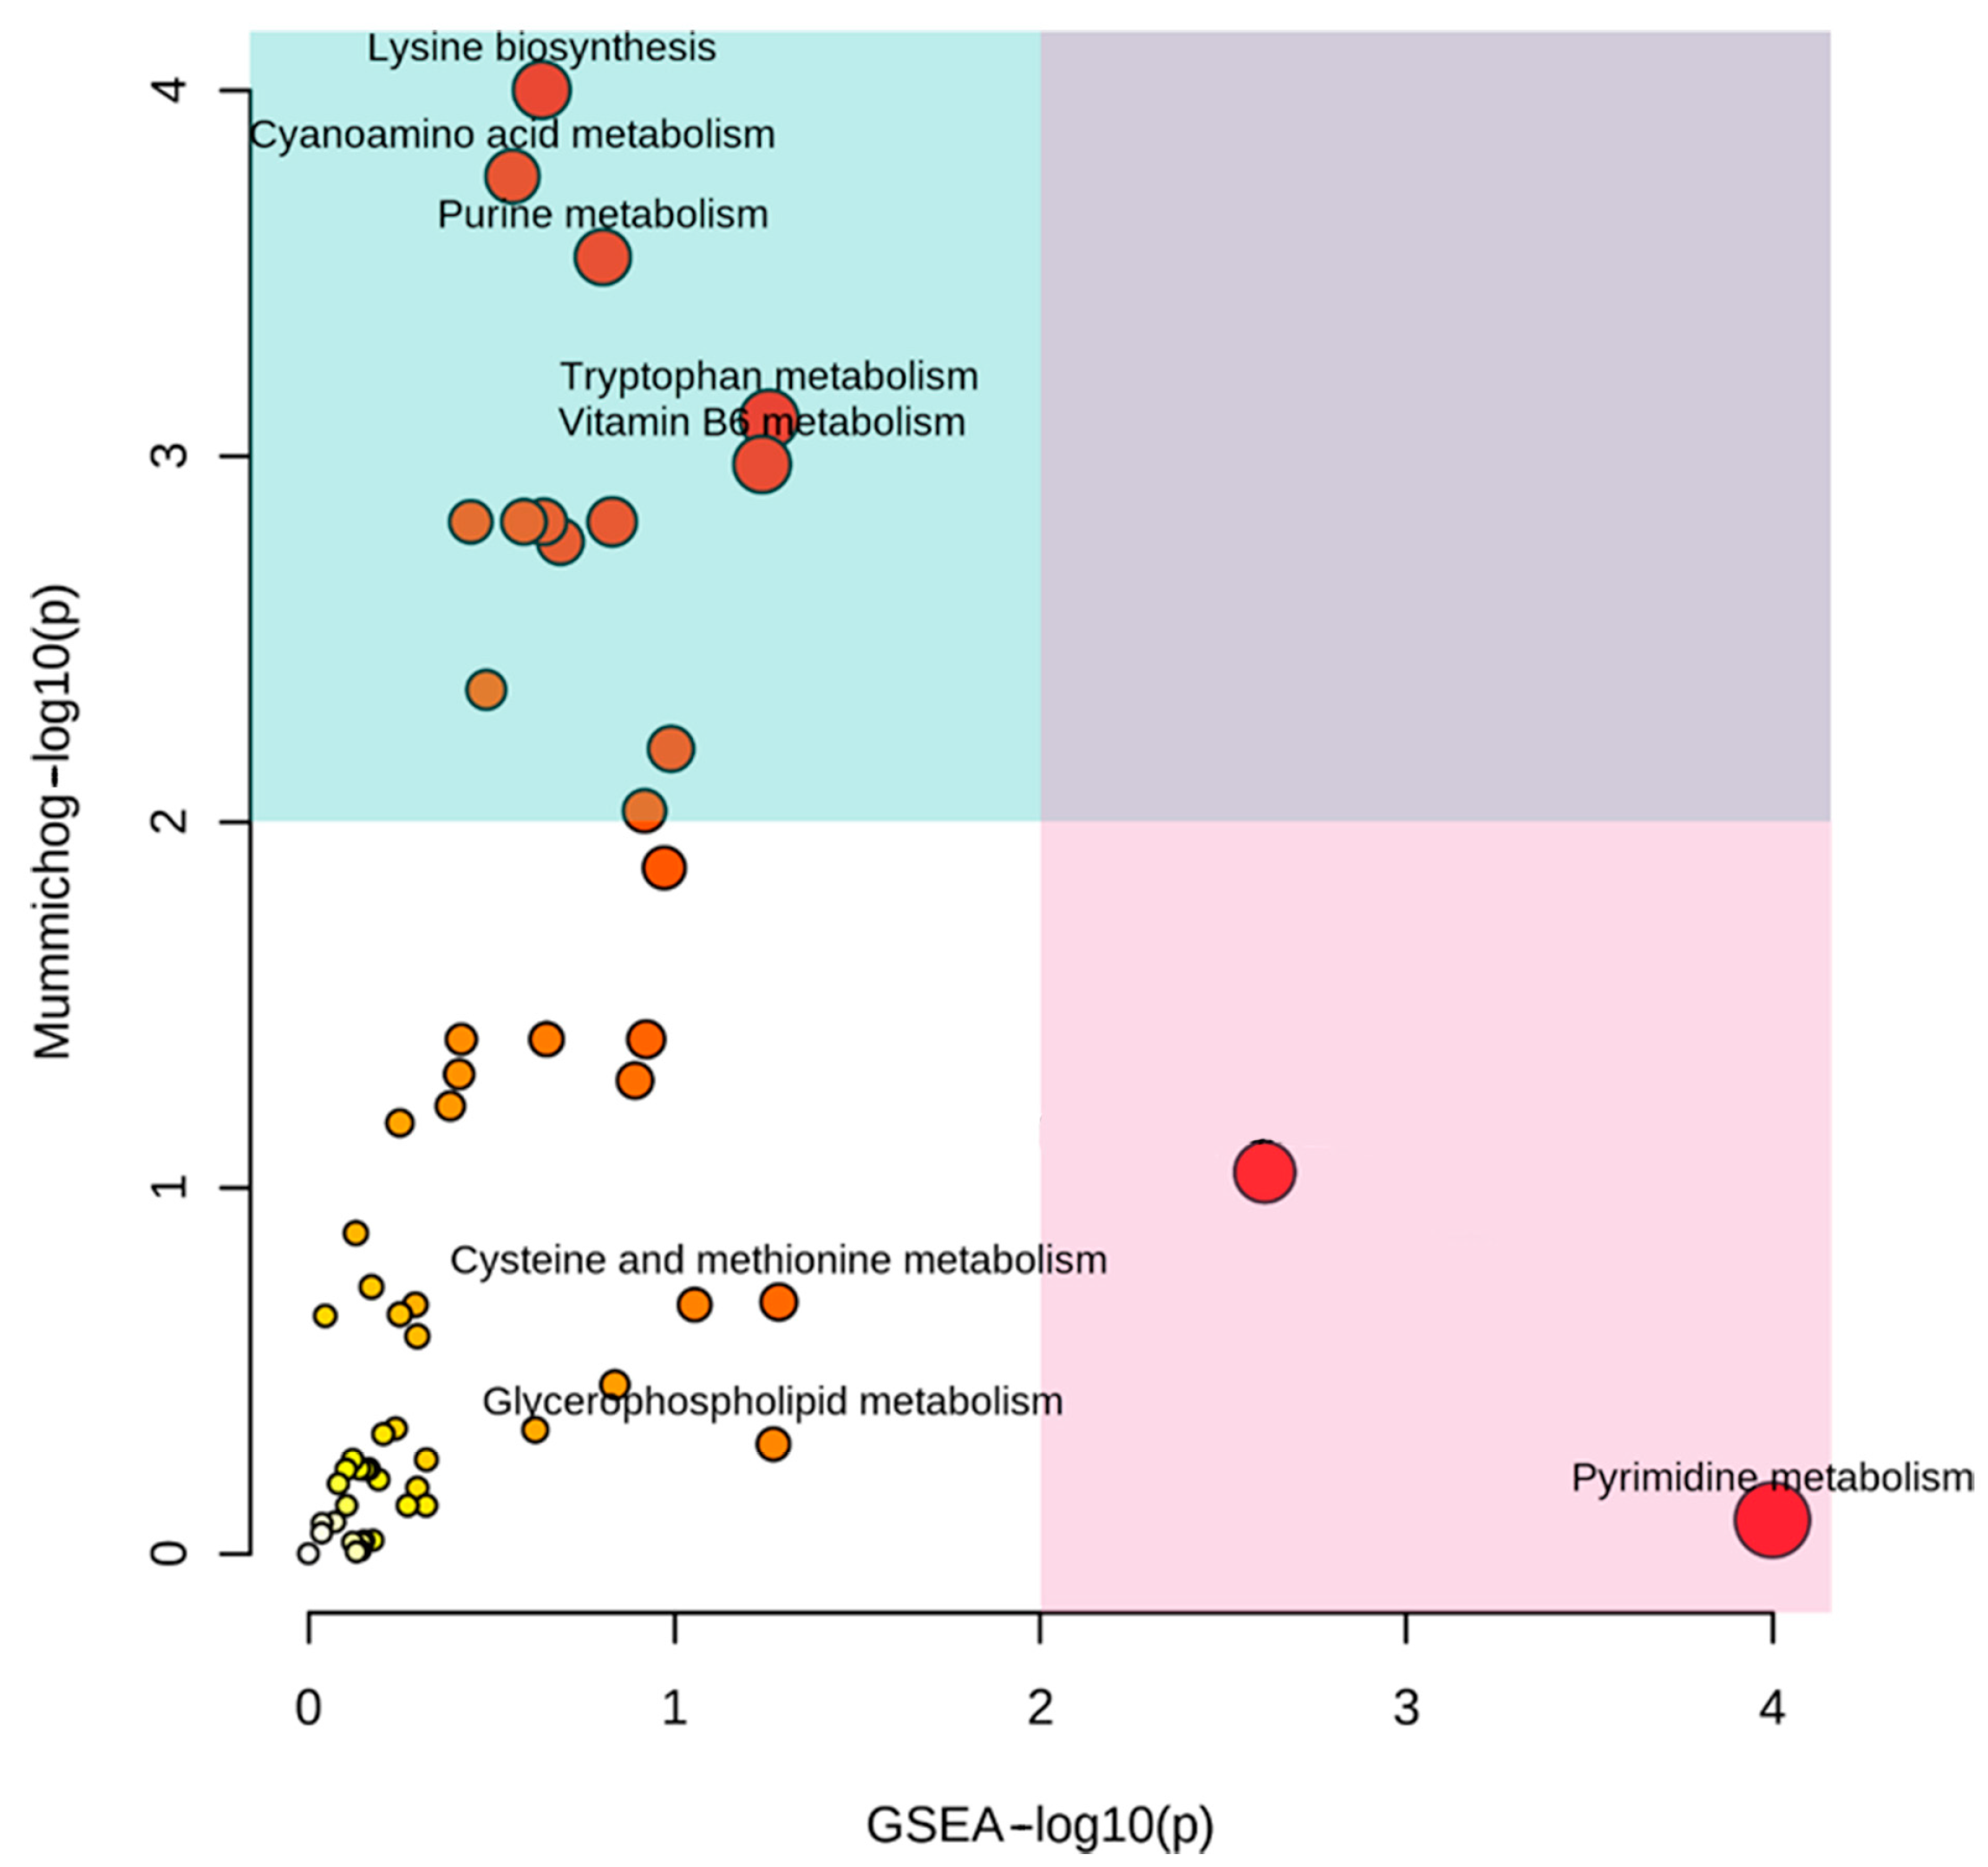
2.5. Functional Analysis

Both PCA and cluster analysis showed a clear separation between the hymenium and the fruiting body. Therefore, the data were subjected to functional analysis to search for significantly altered metabolic pathways between these two groups.
The data were loaded into the MetaboAnalyst functional analysis module, which performs a putative annotation of the features on the basis of m/z and RT values obtained from spectrometric analysis. A putative list of 505 annotated metabolites (AnnotatiMetaboAnalyst.csv) was used to determine the active metabolic pathways using the Mummichog and GSEA algorithms. The result sof this analysis are shown in Figure 3, where the abscissa and ordinate show the −log10 of the p-value calculated with the GSEA and Mummichog algorithms, respectively. The size of the circles represents the enrichment factor of each pathway; the color fades from yellow into red in proportion to the −log10 of the probability that a given pathway was active. The pathways that were statistically significantly active in the hymenium with respect to the fruiting body fell into the upper and right quadrants of the figure. A total of 60 metabolic pathways were identified; the complete data are in the table “Results_mummichog_integ_pathway_enrichment”.
Table 2 shows the most significant pathways (combined p value < 0.2).

2.6. Pathway Analysis of the Apical Part with Respect to the Middle Part of the Fruiting Body

The matrix showing the metabolites found with functional analysis was used to determine the metabolic differences between the apical and middle parts of the fruiting body, and statistical analyses show that they differed markedly from each other. The metabolic pathways that were overexpressed in the apical part compared to the middle part are listed in Table 3.

2.7. Extract Phenolic Composition and Antioxidant Activity

Phenolic compounds are important phytochemicals whose content in plant extracts is generally determined with the Folin-Ciocalteu spectrophotometric and HPLC methods. Table 4 shows the values of the total phenol content (TPC) and antioxidant activity of the extracts of the three parts of F. officinalis (hymenium, apical, and median parts). The values for total phenoliv content ranged from 89.61 mg GAE/100 g in the median part to 116.12 mg GAE/100 g in the apical part of the mushroom.
The apical part (L4–L6) was richer in total phenols, which was confirmed with chromatographic analysis (Supplementary Material Tables S1 and S2, Figures S1–S4). Among the identified compounds, quercetin was the main phenolic compound.
The recent interest in phenolic compounds characterizing edible mushrooms has been due to their health-promoting properties, such as their antioxidant potential. In order to evaluate the antioxidant activity of extracts, three complementary spectrophotometric in vitro assays were carried out. ABTS and DPPH assays measure the ability of antioxidants to scavenge chromogen ABTS or chromogen DPPH free radicals, respectively, while the FRAP assay allows for evaluating the reducing capacity of the extracts. All these assays were compared with the Trolox standard, a water-soluble vitamin E analog.
In this paper, the highest values of ABTS (170.00 mg TE/g DW), DPPH (104.06 mg TE/g DW), and FRAP (198.00 mg TE/g DW) were found in apical part of F. officinalis. These results agree with the phenolic content; in fact, the lowest values of all spectrophotometric assays were found for the hymenium. A wide range of values of TPC and antioxidant activity was reported in a previous paper [22] that studied the optimization of the extraction of bioactives from Pleurotus ostreatus. TPC values ranged from 38.5 to 423.7 mg GAE/100 g and were all lower than those reported in this paper. Concerning antioxidant properties, Ianni et al. [22] reported a wide range for FRAP (6.0–70.0 mg TE/100 g value) and DPPH (8.7 to 172.0 mg TE/100 g) values, which are all lower than those obtained for F. officinalis, while ABTS values (110.7–1112.7 mg TE/100 g) were similar or lower, a comparison of the antioxidant assay results with those in the literature was sometimes not possible because the data of these assays were reported as EC50 or radical scavenging activity (%) [11,19,23,24,25]. A correlation study was also conducted considering all the extracts and all spectrophotometric parameters (Table 5). Good correlations were always obtained (R2 higher than 0.6874), and the best correlation values were found for TPC vs. FRAP (R2 = 0.9886) and DPPH vs. ABTS (R2 = 0.9755).

2.8. Antimicrobial Activity

In the present study, the results of the antimicrobial effect of F. officinalis were evaluated. The antimicrobial activity of F. officinalis Extracts L1, L4, and L7 against the tested bacterial, yeast, and dermatophytic strains is shown in Table 6, Table 7 and Table 8. All F. officinalis extracts showed antimicrobial activity in the concentration range of 1.95–200 µg/mL, but with a wide variability in terms of potency and selectivity (Table 6 and Table 7). The growth inhibition of the yeast strains (Table 7) showed no sensitivity to the L1, L4, and L7 F. officinalis extracts. Regarding the growth inhibition of dermatophytic isolates (Table 8), T. tonsurans (CCF 4834), T. erinacei (CCF 5930), A. gypseum (CCF 6261), A. currei (CCF 5207) and A. insingulare (CCF 5417) were resistant to F. officinalis Extract L1; the strongest inhibition was observed for F. officinalis Extract L4 against T. tonsurans with an MIC value of 19.57 µg/mL; T. interdigitale was sensitive to all tested extracts with an MIC range between 31.49 and 125.99 µg/mL.
With reference to bacteria (Table 6), the highest antimicrobial activity of F. officinalis extracts was observed in Extract L1 (MIC 1.53–<1.53) against Bacillus subtilis (PeruMycA 6), and Extracts L4 and L7 (MIC 3.86 and 7.71 µg/mL) against Escherichia coli (ATCC 10,536) with an MIC range of 3.86–79.37 μg/mL; S. typhi (PeruMycA 7) was the most resistant strain to F. officinalis extracts with an MIC range of 158.74–>200. There were only two cases in which there was the least sensibility for L1 against Pseudomonas aeruginosa (ATCC 15442) and Staphylococcus aureus (ATCC 6538). In this case, the extracts also showed a wide range of sensibility (MIC 7.71 (6.12–12.25)–158.74 (100–200) µg/mL). MIC values under 100 µg/mL were considered an indication of high antimicrobial activity [26]. The highest antimicrobial activity of L1 was observed against B. subtilis (MIC 1.53 µg/mL), L4 had a major affect towards E. coli (MIC 3.86 µg/mL), and the highest inhibition of L7 was again observed for B. subtilis (MIC 3.86 µg/mL). Collectively, Gram-negative bacterial strains (ATCC 10536 and 15442, PeruMycA 2, 3, and 6) were less sensitive to mushroom extracts than Gram-positive strains were.
Comparing antimicrobial activity results is not easy, as the used methodology to produce fungal extracts may vary widely, and susceptibility is not only species-specific, but even strain-specific [27].
Nevertheless, the reported MIC values in the present study could be compared to those reported for other Basidiomycota [27]. In a different study involving Pleurotus ostreatus [22], this was also true for the tested bacteria strains. P. ostreatus extracts showed major antibacterial activity towards Gram+ bacteria, and the highest MIC value (9.92 µg/mL) was observed against B. subtilis (PeruMyca 6), which was the same as F. officinalis, but the highest MIC concentration (<6.25 µg/mL) was towards E. coli (ATCC 10536).
In the same yeast strain, P. ostreatus had higher antimicrobial activity than that of F. officinalis, particularly against C. albicans (MIC 7.87 µg/mL; DBVPG 6379) [22]. The lowest sensitivity was observed for C. tropicalis (DBVPG 6184).
The MIC values of griseofulvin and fluconazole for strains C. parapsilosis (ATCC 22019) and C. krusei (ATCC 6258) were within the established ranges according to the CLSI M38 (CLSI 2018) and M38-Ed3 (CLSI 2017) protocols.
Overall, regarding the growth-inhibitory effects exerted by the F. officinalis extracts towards the selected pathogen microbial strains, consistent with the intrinsic biological activity of the extract, namely, antiradical properties, Extracts L4–L6 from the apical part were antimicrobially the most effective. This could partly be related to the phenolic compound content [28]. Although the MIC values were higher than those of the reference antimicrobial drugs, apical extracts were effective at <200 µg/mL concentrations, which are generally well-tolerated by human and murine cells [29]. Furthermore, MIC values < 100 μg/mL were considered an indication of high antimicrobial activity [26].

3. Materials and Methods

3.1. Chemical and Reagents

Folin–Ciocalteu’s reagent, 2,2′-azino-bis-(3-ethylbenzothiazoline-6-sulphonate) diammonium salt (ABTS), 6-hydroxy-2,5,7,8-tetramethyl-2-carboxylic acid (Trolox), 2, 2-diphenyl-1-picrylhydrazyl (DPPH), ferric chloride (FeCl3), sodium carbonate (Na2CO3), gallic acid (GA), and ethanol were purchased from Sigma-Aldrich (Milan, Italy). Mueller–Hinton broth (MHB), Rose Bengal Chloramphenicol Agar (RBCA), Malt Extract Agar (MEA), Tryptic Soy Agar (TSA), Sabouraud Dextrose Agar (SDA), RPMI (Roswell Park Memorial Institute) 1640 medium, and purity-grade organic solvents (Ethanol, and Dimethyl Sulfoxide) were purchased from Sigma (Sigma-Aldrich, Milan, Italy).

3.2. Mushroom Strain

The fruiting bodies of the F. officinalis strain (PeruMyc 3897) were collected from Larix decidua Mill. in Malga Campo (38080 Caderzone TN; 1970 m a.s.l.) in September 2021. The Vaucher specimen (height: 35 cm; length: 15 cm; thickness: 15 cm) was identified on the basis of macro–microscopic features and was deposited in the herbarium of the University of Perugia (Department of Chemistry, Biology and Biotechnology (DCBB), Perugia, Italy).
Figure 4 shows an F. officinalis mushroom with the three investigated parts.

3.3. Molecular Identification

Total genomic DNA was extracted from the fruiting body according to Angelini et al. [19]. The internal transcribed spacer (ITS) region was amplified using primer combination ITS1F/ITS4 according to Angelini et al. [19]. The thermocycler was programmed as follows: 1 cycle of denaturation at 95 °C for 2.5 min; 35 cycles of denaturation at 95 °C for 20 s, annealing at 55 °C for 20 s and extension at 72 °C for 45 s; 1 final extension cycle at 72 °C for 7 min. The electrophoresis of the polymerase chain reaction (PCR) amplicons was performed on 1.2% agarose gel. PCR products were purified using the ExoSap-IT PCR Cleanup reagent (Affymetrix UK Ltd., High Wycombe, UK) and then submitted for sequencing to Macrogen Europe (Amsterdam, The Netherlands). The resulting chromatogram was proofread, and the generated sequence was deposited in GenBank with access number OQ809067 (F. officinalis PeruMyc 3897).

3.4. Mushroom Extract Preparation

The mushroom materials were separated into 3 samples: the hymenium, median, and apical parts of the F. officinalis fruiting body. Afterwards, they were dried in a ventilated stove at 40 °C. The dried mushroom materials separated into hymenium, median, and apical parts of the fruiting body were finely ground and extracted in 50 mL of EtOH:water 7:3 (v/v) for 30 min under ultrasonic agitation. Each extract was prepared in triplicate (Samples L1–L9).
The resulting extracts were then filtered through Whatman GF/C filters (Sigma, Germany), and the solvent was evaporated under reduced pressure (40 °C, 218 mbar) using a rotary vacuum evaporator (Rotavapor R-100, Büchi, Switzerland). The residue was kept at −20 °C until further use (Table 9).

3.5. Spectrophotometric Assays

3.5.1. Determination of Total Phenolic Content

The F. officinalis extract was mixed with 20% Na2CO3 solution and the Folin–Ciocalteu’s reagent, and the mixture was kept in the dark for 30 min before measuring the absorbance at 750 nm. The results, expressed as mg of gallic acid equivalents (GAE) per 100 g of dry weight (mg GAE/100g dw), were derived from the calibration curve of the gallic acid standard [22]. Table S3 shows the regression equation, linearity, and range of concentration of gallic acid.

3.5.2. Determination of Antioxidant Activity

For the ABTS assay, radical cation ABTS+∙was prepared via the reaction of ABTS with potassium persulfate solutions after being kept in the dark at room temperature for 12 h. The obtained reagent was diluted with ethanol until 0.70 (±0.02) absorbance had been obtained at 734 nm. An aliquot of an ABTS+/ethanol solution was added to the extract, and the mixture was left in the dark for 6 min [22].
For the DPPH assay, the DPPH reagent (0.06 mM in ethanol) was added to the extract, and the mixture had been kept in the dark for 30 min before the absorbance was measured at 517 nm [22].
For the FRAP assay, the reagent, prepared by mixing a TPTZ solution with a FeCl3 solution and acetate buffer, was added to the sample extracts. The reaction mixture had been kept in the dark for 4 min before absorbance was measured at 593 nm [22].
The results of the antioxidant assays are expressed as mg Trolox equivalents (TE) per 100 g of dry weight (mg TE/100g dw) and were derived from a calibration curve of the Trolox standard (Table S3).

3.6. Untargeted LC–MS/MS-Based Metabolomics and Statistical Analysis

Untargeted LC/MS QTOF analysis was performed using a 1260 Infinity II LC System coupled with an Agilent 6530 Q-TOF spectrometer (Agilent Technologies, Santa Clara, CA USA). The LC consisted of a quaternary pump, a thermostatted column compartment, and an autosampler. Separation was conducted on an Agilent InfinityLab Poroshell 120 HILIC-Z, 2.1 × 150 mm, 2.7 µm at 25 °C, and 0.25 mL/min flow. The mobile phase consisted of a mixture of water (A) and water/ACN 15:85 (B)m with both containing a concentration of 10 mM ammonium acetate. The gradient was time 0–3 min, isocratic at A 2%, B 98%; time from 3 to 11 min: linear gradient to A 30%, B 70; time 11–12 min: linear gradient to A 60%, B 40%; time from 12 to 16 min: linear-gradient to A 95%, B 5%; time 16–18 min: isocratic at A 95%, B 5%; time 18 min: stop run.
Spectrometric data were acquired in the 40–1700 m/z range in both negative and positive polarity. The Agilent JetStream source was operated as follows: gas temperature (N2) 200 °C, drying gas 10 L/min, nebulizer 50 psi, sheath-gas temp: 300 °C at 12 L/min.
Raw data were processed using the MS-DIAL software (4.48) [30] to perform peak-picking, alignment, and peak integration. The MS signal threshold was set at 1000 counts. A data matrix was obtained that accurately reported the mass and area of each revealed peak in each analyzed sample.
Metabolites were putatively annotated and metabolic pathways were predicted using the mummichog algorithm [31] implemented in the ‘MS Peaks to Pathways’ module of Metaboanalyst 5.0 [32]. This considers any possible adducts and different ionic polarities, and classifies annotated peaks on the basis of the t-test. In this case, the list of putative compounds was mapped onto the KEGG library of Saccaromices cerevisiae. ANOVA and functional meta-analysis were also performed with MetaboAnalyst. For the statistical analysis, samples were normalized via the median, followed by Pareto scaling.

3.7. HPLC Determination of Phenolic Compounds

The extracts were analyzed for quantitative phenolic determination using a re-versed-phase HPLC-DAD in gradient elution mode [33]. The separation was conducted within 60 min of the chromatographic run, starting with the following separation conditions: 97% water with 0.1% formic acid, 3% methanol with 0.1% formic acid (Supplementary Table S1). The separation was performed on an Infinity lab Poroshell 120-SB reverse-phase column (C18, 150 × 4.6 mm i.d., 2.7 μm; Agilent, Santa Clara, CA, USA). Column temperature was set at 30 °C. The quantitative determination of phenolic compounds was performed via a DAD detector. The selected wavelengths are reported in Supplementary Table S2. The quantification was conducted through 7-point calibration curves with linearity coefficients (R2) > 0.999 in the concentration range of 2–140 μg/mL. All standards were purchased from Merck Life Science (Milan, Italy), and had ≥95% purity. The limits of detection were lower than 1 μg/mL for all assayed analytes. The area under the curve from the HPLC chromatograms was used to quantify the analyte concentrations in the extract [33].

3.8. Antimicrobial Test

Bacterial and Fungal Strains

The in vitro antimicrobial activity of the F. officinalis extracts (Samples L1–L9) was assessed against the following Gram– and Gram+ bacterial strains: Escherichia coli (ATCC 10536), E. coli (PeruMycA 2), E. coli (PeruMycA 3), Bacillus cereus (ATCC 12826), Pseudomonas aeruginosa (ATCC 15442), B. subtilis (PeruMyc 6), Salmonella typhi (PeruMyc 7), and Staphylococcus aureus (ATCC 6538). Furthermore, we performed antifungal assays on the same extracts against different yeast, dermatophytic, and fungal-pool species: Candida albicans (YEPGA 6183), C. tropicalis (YEPGA 6184), C. albicans (YEPGA 6379), C. parapsilopsis (YEPGA 6551), Arthroderma curreyi (CCF 5207), A. gypseum (CCF 6261), A. insingulare (CCF 5417), A. quadrifidum (CCF 5792), Trichophyton mentagrophytes (CCF 4823), T. mentagrophytes (CCF 5930), T. rubrum (CCF 4933), and T. tonsurans (CCF 4834).
The Candida parapsilosis (ATCC 22019) and Candida krusei (ATCC 6258) strains were used as quality controls in the broth dilution antifungal test [34].

3.9. Antibacterial Activity

The MICs of the F. officinalis samples were determined in sterile 96-well microplates using the broth microdilution method of the Clinical and Laboratory Standards Institute, M07-A10 [34]. MICs were determined using extract concentrations in the range of 1.562–200 µg/mL, derived from serial twofold dilutions in Mueller–Hinton Broth (MHB).
Ciprofloxacin (Sigma, Germany) was used in the range of 0.12–125−1 µg/mL as a control antibacterial agent [11].
For the preparation of the bacterial suspensions (inocula), three to five colonies of the bacterial strains used for the test were chosen from 24 h cultures on tryptic soy agar plates (TSA) and pregrown overnight in Mueller–Hinton broth (MHB) to reach a cell density of approximately 1–2 × 10⁸ CFU/mL in each tube.
This was confirmed with the plating of serial dilutions of the inoculum suspensions on Mueller–Hinton Agar (MHA). The setup included bacterial growth controls in wells containing 10 μL of the test inoculum and negative controls without a bacterial inoculum. MIC end points were determined after 18–20 h incubation in ambient air at 35 °C.

3.10. Antifungal Activity

Susceptibility testing against the yeasts and filamentous fungi was performed according to the CLSI M38 (CLSI 2018) and M38-Ed3 (CLSI 2017) protocols [34,35]. A Roswell Park Memorial Institute (RPMI) 1640 medium (Sigma) with L-glutamine, without sodium bicarbonate, and supplemented with 2% glucose (w/v), buffered with 0.165 mol/L morpholinepropanesulphonic acid (MOPS), pH 7.0, was used throughout the study.
The inoculum suspensions were prepared from 7-day-old cultures grown on Sabouraud Dextrose Agar (SDA; Difco) at 25 °C, and adjusted spectrophotometrically to optical densities that ranged from 0.09 to 0.11 (MacFarland standard).
Filamentous fungi (microconidia) and yeast inoculum suspensions were diluted to a ratio of 1:50 in RPMI 1640 to obtain twice the inoculum size, ranging from 0.2 to 0.4 × 10⁴−5 CFU/mL. This was further confirmed by plating the serial dilutions of the inoculum suspensions on SDA.
F. officinalis extracts had an MIC range of 1.56–200 µg/mL−1, fluconazole (Novartis, Basel, Switzerland) had an MIC range of 0.03–16 µg/mL−1, and griseofulvin (Sigma) had an MIC range of 0.03–8 µg/mL−1 [11].
MIC end points (μg/mL) were determined after 24 h (for yeasts) and 72 h (for dermatophytes) of incubation in ambient air at 30 °C (CLSI 2017, CLSI 2018). For the Fomitopsis extracts, ç MIC end points were defined as the lowest concentration that showed total growth inhibition.
ç MIC end points for fluconazole and griseofulvin were defined as the lowest concentration that inhibited 50% of the growth when compared with the growth control (CLSI 2017). Geometric means and MIC ranges were determined from the three biological replicates to allow for comparisons between the activities of the F. officinalis samples.

3.11. Statistical Analysis

The results of spectrophotometric assays (TPC, ABTS, DPPH, FRAP) are reported as the mean ± standard deviation (SD) of three replicates. Microsoft Excel 2016 (Microsoft Corporation, Redmond, WA, USA) was used for data analysis. Correlation analysis was performed with a linear regression model.

4. Conclusions

Due to technological developments, mass spectrometry matched with liquid chromatography could be largely employed in metabolomic studies with a broad perceived range, and advanced specificity and sensitivity. In the current study, this method was used to analyze the metabolic profiling of F. officinalis extracts (Samples L1, L4, and L7), showing satisfactory data quality. The present findings support more indepth investigations aimed at evaluating the influence of growth substrates on the antimicrobial and antioxidant properties of F. officinalis. Extracts from distinct parts of the fruiting body of F. officinalis revealed different concentrations of secondary metabolites, thus suggesting potential applications in the formulation of food supplements with biological properties, especially in terms of antioxidant and antimicrobial activities.

Supplementary Materials

The following supporting information about quantitative determination of phenolic compounds and antioxidant activity can be downloaded at: https://www.mdpi.com/article/10.3390/antibiotics12040766/s1; Table S1: Gradient elution condition of the HPLC–-DAD–-MS analyses; Table S2: Content in specialized metabolites; Table S3: Regression equation, linearity, range of concentration of standards (gallic acid for TPC, Trolox for ABTS, DPPH, and FRAP) used for the spectrophotometric assays; Chromatograms: Figures S1–S4.

Author Contributions

Conceptualization, P.A., L.M., L.C., and C.F.; methodology, P.A., L.M., L.C., and C.F.; software, P.A., L.M., and C.F.; validation, R.M.P., A.A., and G.A.F.; formal analysis, P.A., L.M., C.F., N., A.A., M.L.L., G.C., F.I., F.B., C.E., and S.C.D.S.; resources, P.A., L.M., and C.F.; data curation, P.A., L.M. and C.F.; writing—original draft preparation, P.A. and G.A.F.; writing—review and editing, P.A., L.M., C.F., G.Z. and G.O.; visualization, R.V., G.O. and G.Z.; supervision, R.V.; project administration, P.A., L.M., L.C. and C.F.; funding acquisition, P.A., L.M., L.C. and C.F. All authors have read and agreed to the published version of the manuscript.

Funding

This research received no external funding.

Institutional Review Board Statement

Not applicable.

Informed Consent Statement

Not applicable.

Data Availability Statement

The original data are available from the corresponding author.

Acknowledgments

This work is also part of the third mission activity of botanical garden Giardino dei Semplici, G. d’Annunzio, University Chieti-Pescara. This study is also part of the PhD project of Giancarlo Angeles Flores: “Development of sustainable technologies for the cultivation of edible and medicinal mushrooms and enhancement of botanical supply chains also through the activities of the botanic garden Giardino dei Semplici“. His tutors are Paola Angelini and Claudio Ferrante.

Conflicts of Interest

The authors declare no conflict of interest.

References

  1. Bernicchia, A. Polyporaceae sl.; Candusso: Alassio Savona, Italy, 2005; pp. 222–224. [Google Scholar]
  2. Ryvarden, L.; Melo, I. Poroid Fungi of Europe; Fungiflora: Oslo, Norway, 2014. [Google Scholar]
  3. Girometta, C. Antimicrobial properties of Fomitopsis officinalis in the light of its bioactive metabolites: A review. Mycology 2018, 10, 32–39. [Google Scholar] [CrossRef] [PubMed]
  4. Hayova, V.P.; Heluta, V.P.; Shevchenko, M.V. Fomitopsis officinalis (Polyporales): Are there any records of the fungus known from Ukraine? Ukr. Bot. J. 2020, 77, 40–43. [Google Scholar] [CrossRef]
  5. Gilbertson, R.L.; Ryvarden, L. North American Polypores. Volume 1: Abortiporus—Lindtneria. 433 S., 209 Abb. Oslo 1986. Fungiflora A/S. J. Basic Microbiol. 1987, 27, 282. [Google Scholar] [CrossRef]
  6. Grienke, U.; Zöll, M.; Peintner, U.; Rollinger, J.M. European medicinal polypores—A modern view on traditional uses. J. Ethnopharmacol. 2014, 154, 564–583. [Google Scholar] [CrossRef] [PubMed]
  7. Wu, X.; Yang, J.-S.; Yan, M. Four New Triterpenes from Fungus of Fomes officinalis. Chem. Pharm. Bull. 2009, 57, 195–197. [Google Scholar] [CrossRef] [PubMed]
  8. Han, J.; Li, L.; Zhong, J.; Tohtaton, Z.; Ren, Q.; Han, L.; Huang, X.; Yuan, T. Officimalonic acids A−H, lanostane triterpenes from the fruiting bodies of Fomes officinalis. Phytochemistry 2016, 130, 193–200. [Google Scholar] [CrossRef] [PubMed]
  9. Simi, M.; Prisco, G. Patent Application Publication. U.S. Patent 2018/0250085A1, 2018. [Google Scholar]
  10. Angelini, P.; Pellegrino, R.M.; Tirillini, B.; Flores, G.A.; Alabed, H.B.; Ianni, F.; Blasi, F.; Cossignani, L.; Venanzoni, R.; Orlando, G. Metabolomic profiling and biological activities of Pleurotus columbinus Quél. cultivated on different agri-food byproducts. Antibiotics 2021, 10, 1245. [Google Scholar] [CrossRef]
  11. Flores, G.A.; Girometta, C.E.; Cusumano, G.; Angelini, P.; Tirillini, B.; Ianni, F.; Blasi, F.; Cossignani, L.; Pellegrino, R.M.; Emiliani, C. Untargeted Metabolomics Used to Describe the Chemical Composition, Antioxidant and Antimicrobial Effects of Extracts from Pleurotus spp. Mycelium Grown in Different Culture Media. Antibiotics 2022, 11, 1468. [Google Scholar] [CrossRef]
  12. Pellegrino, R.M.; Blasi, F.; Angelini, P.; Ianni, F.; Alabed, H.B.R.; Emiliani, C.; Venanzoni, R.; Cossignani, L. LC/MS Q-TOF Metabolomic Investigation of Amino Acids and Dipeptides in Pleurotus ostreatus Grown on Different Substrates. J. Agric. Food Chem. 2022, 70, 10371–10382. [Google Scholar] [CrossRef]
  13. Elkhateeb, W.A.; Daba, G.M.; Elnahas, M.O.; Thomas, P.W. Fomitopsis officinalis mushroom: Ancient gold mine of functional components and biological activities for modern medicine. Egypt. Pharm. J. 2019, 18, 285. [Google Scholar] [CrossRef]
  14. Muszyńska, B.; Fijałkowska, A.; Sułkowska-Ziaja, K.; Włodarczyk, A.; Kaczmarczyk, P.; Nogaj, E.; Piętka, J. Fomitopsis officinalis: A Species of Arboreal Mushroom with Promising Biological and Medicinal Properties. Chem. Biodivers. 2020, 17, e2000213. [Google Scholar] [CrossRef]
  15. Hassan, K.; Kemkuignou, B.M.; Kirchenwitz, M.; Wittstein, K.; Rascher-Albaghdadi, M.; Chepkirui, C.; Matasyoh, J.C.; Decock, C.; Köster, R.W.; Stradal, T.E.B.; et al. Neurotrophic and Immunomodulatory Lanostane Triterpenoids from Wood-Inhabiting Basidiomycota. Int. J. Mol. Sci. 2022, 23, 13593. [Google Scholar] [CrossRef] [PubMed]
  16. Naranmandakh, S.; Murata, T.; Odonbayar, B.; Suganuma, K.; Batkhuu, J.; Sasaki, K. Lanostane triterpenoids from Fomitopsis officinalis and their trypanocidal activity. J. Nat. Med. 2018, 72, 523–529. [Google Scholar] [CrossRef] [PubMed]
  17. Wu, X.; Yang, J.; Dong, Y. Chemical constituents of Fomes officinalis (I). Chin. Tradit. Herb. Drugs 2005, 36, 811–814. [Google Scholar]
  18. Wu, X.; Yang, J.; Zhou, L.; Dong, Y. New Lanostane-Type Triterpenes from Fomes officinalis. Chem. Pharm. Bull. 2004, 52, 1375–1377. [Google Scholar] [CrossRef] [PubMed]
  19. Angelini, P.; Girometta, C.; Tirillini, B.; Moretti, S.; Covino, S.; Cipriani, M.; D’Ellena, E.; Angeles, G.; Federici, E.; Savino, E.; et al. A comparative study of the antimicrobial and antioxidant activities of Inonotus hispidus fruit and their mycelia extracts. Int. J. Food Prop. 2019, 22, 768–783. [Google Scholar] [CrossRef]
  20. Ritota, M.; Manzi, P. Pleurotus spp. Cultivation on Different Agri-Food by-Products: Example of Biotechnological Application. Sustainability 2019, 11, 5049. [Google Scholar] [CrossRef]
  21. Bernicchia, A.; Gorjón, S.P.; Arras, L.; Facchini, M.; Porcu, G.; Trichies, G. Polypores of the Mediterranean Region; Romar SRL: Castellammare di Stabia, Italy, 2020. [Google Scholar]
  22. Ianni, F.; Blasi, F.; Angelini, P.; Simone, S.; Flores, G.A.; Cossignani, L.; Venanzoni, R. Extraction Optimization by Experimental Design of Bioactives from Pleurotus ostreatus and Evaluation of Antioxidant and Antimicrobial Activities. Processes 2021, 9, 743. [Google Scholar] [CrossRef]
  23. Adebayo, E.A.; Martínez-Carrera, D.; Morales, P.; Sobal, M.; Escudero, H.; Meneses, M.E.; Avila-Nava, A.; Castillo, I.; Bonilla, M. Comparative study of antioxidant and antibacterial properties of the edible mushrooms Pleurotus levis, P. ostreatus, P. pulmonarius and P. tuber-regium. Int. J. Food Sci. Technol. 2018, 53, 1316–1330. [Google Scholar] [CrossRef]
  24. Sánchez, C. Reactive oxygen species and antioxidant properties from mushrooms. Synth. Syst. Biotechnol. 2017, 2, 13–22. [Google Scholar] [CrossRef]
  25. López-Vázquez, E.; Prieto-García, F.; Gayosso-Canales, M.; Sánchez, E.O.; Ibarra, J.V. Phenolics acids, flavonoids, ascorbic acid, β-glucans and antioxidant activity in mexican wild edible mushrooms. Ital. J. Food Sci. 2017, 29, 766–774. [Google Scholar]
  26. Doğan, H.H.; Duman, R.; Özkalp, B.; Aydin, S. Antimicrobial activities of some mushrooms in Turkey. Pharm. Biol. 2013, 51, 707–711. [Google Scholar] [CrossRef]
  27. Alves, M.J.; Ferreira, I.C.F.R.; Dias, J.; Teixeira, V.; Martins, A.; Pintado, M. A Review on Antimicrobial Activity of Mushroom (Basidiomycetes) Extracts and Isolated Compounds. Planta Med. 2012, 78, 1707–1718. [Google Scholar] [CrossRef] [PubMed]
  28. Ferrante, C.; Recinella, L.; Ronci, M.; Menghini, L.; Brunetti, L.; Chiavaroli, A.; Leone, S.; Di Iorio, L.; Carradori, S.; Tirillini, B.; et al. Multiple pharmacognostic characterization on hemp commercial cultivars: Focus on inflorescence water extract activity. Food Chem. Toxicol. 2019, 125, 452–461. [Google Scholar] [CrossRef] [PubMed]
  29. Politi, M.; Ferrante, C.; Menghini, L.; Angelini, P.; Flores, G.A.; Muscatello, B.; Braca, A.; De Leo, M. Hydrosols from Rosmarinus officinalis, Salvia officinalis, and Cupressus sempervirens: Phytochemical analysis and bioactivity evaluation. Plants 2022, 11, 349. [Google Scholar] [CrossRef] [PubMed]
  30. Tsugawa, H.; Nakabayashi, R.; Mori, T.; Yamada, Y.; Takahashi, M.; Rai, A.; Sugiyama, R.; Yamamoto, H.; Nakaya, T.; Yamazaki, M.; et al. A cheminformatics approach to characterize metabolomes in stable-isotope-labeled organisms. Nat. Methods 2019, 16, 295–298, Erratum in Nat. Methods 2019, 16, 446. [Google Scholar] [CrossRef]
  31. Li, S.; Park, Y.; Duraisingham, S.; Strobel, F.H.; Khan, N.; Soltow, Q.A.; Jones, D.P.; Pulendran, B. Predicting Network Activity from High Throughput Metabolomics. PLoS Comput. Biol. 2013, 9, e1003123. [Google Scholar] [CrossRef]
  32. Pang, Z.; Chong, J.; Zhou, G.; de Lima Morais, D.A.; Chang, L.; Barrette, M.; Gauthier, C.; Jacques, P.-É.; Li, S.; Xia, J. MetaboAnalyst 5.0: Narrowing the gap between raw spectra and functional insights. Nucleic Acids Res. 2021, 49, W388–W396. [Google Scholar] [CrossRef]
  33. Chiavaroli, A.; Libero, M.L.; Di Simone, S.C.; Acquaviva, A.; Nilofar; Recinella, L.; Leone, S.; Brunetti, L.; Cicia, D.; Izzo, A.A.; et al. Adding New Scientific Evidences on the Pharmaceutical Properties of Pelargonium quercetorum Agnew Extracts by Using In Vitro and In Silico Approaches. Plants 2023, 12, 1132. [Google Scholar] [CrossRef]
  34. Clinical and Laboratory Standards Institute. Reference Method for Broth Dilution Antifungal Susceptibility Testing of Yeasts. Approved Standard, 4th ed.; CLSI Document M27-A4; Clinical and Laboratory Standards Institute: Wayne, PA, USA, 2017. [Google Scholar]
  35. Clinical and Laboratory Standards Institute. Performance Standards for Antifungal Susceptibility Testing of Yeasts; CLSI Supplement M60; Clinical and Laboratory Standards Institute: Wayne, PA, USA, 2017. [Google Scholar]
Figure 1. Almost 73% of the variance is explained by the first component of the PCA, where a clear separation of the hymenium from the fruiting body was observed. A 20% of the residual variance is explained by the second main component. In this case, an excellent separation of the fruiting body was observed in the apical and middle parts.
Antibiotics 12 00766 g001
Figure 2. (A) Dendrogram and (B) heat map confirming that the samples were mainly divided into two clusters: hymenium and fruiting body. The latter was divided into the medium and apical clusters. Heat-map analysis shows that some characteristics were overexpressed only in the hymenophore, others only in the apical part of the fruiting body, and others only in the middle part of the fruiting body.
Antibiotics 12 00766 g002
Figure 3. Statistically significant pathways active in the hymenophore.
Antibiotics 12 00766 g003
Figure 4. F. officinalis mushroom with the three investigated parts.
Antibiotics 12 00766 g004
Table 1. GenBank sequences and identity percentages with Fomitopsis officinalis strain (PeruMyc 3897) studied in this work.
SpeciesSample IDCountryBase PairCorrespondence with Genbank Seq.Identity PercentageAccession No.
F. officinalisMicUNIPV Italy597F. officinalis100OL672134
F. officinalisJFo3619 Poland599F. officinalis100MN534335
F. officinalisLE-BIN 3560 Russia605F. officinalis99.81MG735354
F. officinalis270279 Russia553F. officinalis99.80MF952886
F. officinalisStamets F04 USA672F. officinalis99.62EU854437
Table 2. Most significant pathways.
Pathway NameTotal_SizeHitsSig_HitsMummichog_PvalsGSEA_PvalsCombined_Pvals
Pyrimidine metabolism171740.9370.010.05313
One carbon pool by folate4420.48490.049380.1133
Sphingolipid metabolism4420.48490.049380.1133
Tryptophan metabolism121270.11630.23470.1256
Lysine biosynthesis151590.062310.480.1349
Vitamin B6 metabolism101060.12670.240.1366
Purine metabolism2727140.085550.3960.1485
Cyano amino acid metabolism7750.073410.52630.1643
Table 3. Pathways overexpressed in the apical part compared to the middle part.
Pathway NameMatch Statusp Value−LOG(p)Holm pFDRImpact
Pyrimidine metabolism17/341.13 × 10−65.9467.47 × 10−57.47 × 10−50.56111
Tryptophan metabolism12/302.78 × 10−65.55611.81 × 10−49.13 × 10−50.42636
Methane metabolism13/236.43 × 10−65.19184.12 × 10−49.13 × 10−50.42562
Starch and sucrose metabolism2/157.90 × 10−65.10234.98 × 10−49.13 × 10−50.4374
Folate biosynthesis12/238.51 × 10−65.07035.27 × 10−49.13 × 10−50.53932
Galactose metabolism6/179.64 × 10−65.01595.88 × 10−49.13 × 10−50.20513
Pantothenate and CoA biosynthesis11/209.69 × 10−65.01385.88 × 10−49.13 × 10−50.48294
Phenylalanine, tyrosine, and tryptophan biosynthesis15/211.98 × 10−54.70360.0011671.63 × 10−40.62752
Valine, leucine, and isoleucine biosynthesis14/202.76 × 10−54.55850.0016031.96 × 10−40.61768
Glutathione metabolism11/262.97 × 10−54.52730.0016931.96 × 10−40.28415
Tyrosine metabolism10/153.39 × 10−54.46970.0018992.03 × 10−40
Glycerophospholipid metabolism4/325.24 × 10−54.28080.0028812.88 × 10−40.05355
Citrate (TCA) cycle10/206.61 × 054.17960.0035713.32 × 10−40.46979
Purine metabolism29/628.47 × 10−54.07190.0044913.32 × 10−40.44416
Pyruvate metabolism11/238.48 × 10−54.07140.0044913.32 × 10−40.52672
Cysteine and methionine metabolism18/418.56 × 10−54.06730.0044913.32 × 10−40.60695
Histidine metabolism8/188.64 × 10−54.06360.0044913.32 × 10−40.46939
beta-Alanine metabolism4/119.04 × 10−54.04360.0044913.32 × 10−40.5
Butanoate metabolism9/141.02 × 10−43.9930.0048783.53 × 10−40.6
Sulfur metabolism7/131.16 × 10−43.93640.0054413.71 × 10−40.25975
Glycine, serine and threonine metabolism16/321.18 × 10−43.92780.0054413.71 × 10−40.56013
Biotin metabolism3/131.39 × 10−43.85710.0062534.17 × 10−40.21277
Lysine biosynthesis8/161.48 × 10−43.8310.0064934.23 × 10−40.52557
Aminoacyl-tRNA biosynthesis16/461.55 × 10−43.81060.0066514.25 × 10−40.16667
Amino sugar and nucleotide sugar metabolism4/241.86 × 10−43.73150.0077934.90 × 10−40.07092
Glyoxylate and dicarboxylate metabolism14/262.03 × 10−43.69260.008325.15 × 10−40.76807
Glycolysis/gluconeogenesis6/242.17 × 10−43.66450.0086615.29 × 10−40.24445
Pentose phosphate pathway7/182.67 × 10−43.57370.0104096.29 × 10−40.18245
Alanine, aspartate and glutamate metabolism14/223.15 × 10−43.50120.0119847.18 × 10−40.91008
Pentose and glucuronate interconversions4/124.20 × 10−43.37630.0155559.25 × 10−40.27273
Ubiquinone and other terpenoid-quinone biosynthesis2/24.78 × 10−43.32090.0171950.0010170
Biosynthesis of unsaturated fatty acids11/235.03 × 10−43.29880.0175880.0010370
Arginine biosynthesis13/185.53 × 10−43.25760.0187880.0011050.69546
Sphingolipid metabolism6/136.11 × 10−43.21430.0201490.0011850.76666
C5-Branched dibasic acid metabolism3/47.42 × 10−43.12930.0237580.0013970
Arginine and proline metabolism13/257.62 × 10−43.11810.0237580.0013970.59627
Vitamin B6 metabolism4/117.89 × 10−43.10320.0237580.0014070.30769
Porphyrin and chlorophyll metabolism12/238.48 × 10−43.07170.0245880.0014460.67455
Nicotinate and nicotinamide metabolism8/128.73 × 10−43.05910.0245880.0014460.68086
Atrazine degradation2/48.76 × 10−43.05740.0245880.0014460.5
One carbon pool by folate5/80.0010392.98350.0270050.0016720.63939
Fatty acid degradation5/300.0012342.90850.0308610.001940.14049
Selenocompound metabolism1/120.0018292.73780.0438940.0028070.14286
Propanoate metabolism2/190.0018982.72180.0438940.0028460
Terpenoid backbone biosynthesis7/160.0020582.68650.0452830.0030190.41189
N-Glycan biosynthesis3/310.0024232.61560.0508840.0034770.07877
Steroid biosynthesis7/300.0025042.60140.0508840.0035160.41379
Valine, leucine and isoleucine degradation6/180.0027442.56170.0521280.0037720
Nitrogen metabolism3/50.0029132.53560.0524370.0039240
Fructose and mannose metabolism2/140.0031262.5050.0531390.0041260
Lysine degradation4/150.0034092.46740.0545430.0044120.2
Fatty acid elongation3/220.0035172.45390.0545430.0044640
Thiamine metabolism6/180.0044752.34920.062650.0055730.38119
Riboflavin metabolism6/110.00612.21470.0793010.0074560.84849
Monobactam biosynthesis2/40.0073542.13350.0882430.0088240
Fatty acid biosynthesis1/430.0127531.89440.140280.015030
Phosphatidylinositol signaling system2/260.0141431.84940.141430.0160940.08621
Inositol phosphate metabolism2/220.0141431.84940.141430.0160940
Glycerolipid metabolism1/140.0179111.74690.143290.0199430.07059
Taurine and hypotaurine metabolism2/70.018131.74160.143290.0199430
Sesquiterpenoid and triterpenoid biosynthesis1/40.0187081.7280.143290.0202410
Cyanoamino acid metabolism5/80.0354021.4510.177010.0376860
Carbapenem biosynthesis1/30.109260.961530.437050.114470
Lipoic acid metabolism1/60.158430.800170.475280.163380
Arachidonic acid metabolism2/80.404650.392920.80930.410880
Synthesis and degradation of ketone bodies1/30.550210.259470.80930.550210
Table 4. Values of total phenolic content and antioxidant activity (ABTS, DPPH, and FRAP) of the extracts (mean values ± SD, n = 3).
TPC
mg GAE/100 g
ABTS
mg TE/100 g
DPPH
mg TE/100 g
FRAP
mg TE/100 g
L1–L3 hymenium89.61 ± 8.70144.39 ± 4.9518.44 ± 0.28119.97 ± 2.65
L4–L6 apical part116.12 ± 3.45170.00 ± 41.70104.06 ± 5.44198.00 ± 1.48
L7–L8 median part92.02 ± 2.07157.08 ± 12.6072.60 ± 4.42135.52 ± 1.79
TPC, total phenolic content; GAE, gallic acid equivalents; ABTS, 2,2′-azino-bis(3-ethylbenzothiazolin-6-sulfonic acid) diammonium salt; DPPH, 2,2-diphenyl-1-picrylhydrazyl; FRAP, ferric reducing antioxidant power; TE, Trolox equivalents.
Table 5. Correlation analysis (coefficient of determination, R2) among spectrophotometric parameters (TPC, DPPH, ABTS, and FRAP).
TPCABTSDPPHFRAP
TPC-0.82160.68740.9886
ABTS0.8216-0.97550.8956
DPPH0.68740.9755-0.7817
FRAP0.98860.89560.7817-
Table 6. Minimal inhibitory concentrations (MICs) of F. officinalis samples against bacterial isolates.
MIC (µg/mL) *
Escherichia coliEscherichia coliEscherichia coliBacillus cereusPseudomonas aeruginosaBacillus subtilisSalmonella typhiStaphylococcus aureus
Bacteria(ATCC 10536)(PeruMycA 2)(PeruMycA 3)(ATCC 12826)(ATCC 15442)(PeruMycA 6)(PeruMycA 7)(ATCC 6538)
Samples
L1–L379.37 (50–100)158.74 (100–200)125.99 (100–200)158.74 (100–200)>2001.53–<1.53>200>200
L4–L63.86 (3.06–6.12)15.53 (12.25-25)79.37 (50–100)19.71 (12.25–25)7.71 (6.12–12.25)79.37 (50–100)158.74 (100–200)31.49 (25–50)
L7–L97.71 (6.12–12.25)62.99 (50–100)158.74 (100–200)19.71 (12.25-25)125.99 (100–200)2.42 (1.53–3.06)>20039.68 (25–50)
Ciprofloxacin (µg/mL)31.49 (25–50)9.92 (6.25–12.5)79.37 (50–100)125.99 (100–200)125.99 (100–200)125.99 (100–200)79.37 (50–100)200–>200
* MIC values are reported as the geometric means of three independent replicates (n = 3). MIC range concentrations are reported within the brackets.
Table 7. Minimal inhibitory concentrations (MICs) of F. officinalis samples against yeast isolates.
MIC (µg/mL) *
Candida tropicalisCandida albicansCandida parapsilosisCandida albicans
Yeast Strain(YEPGA 6184)(YEPGA 6379)(YEPGA 6551)(YEPGA 6183)
Samples
L1–L3200–>200200–>200>200>200
L4–L6>200>200200–>200>200
L7–L9>200>200>200>200
Fluconazole (µg/mL)2142
* MIC values are reported as the geometric means of three independent replicates (n = 3). MIC range concentrations are reported within the brackets.
Table 8. Minimal inhibitory concentrations (MICs) of F. officinalis samples against dermatophyticx isolates.
MIC (µg/mL) *
Trichophyton interdigitalisTrichophyton tonsuransTrichophyton rubrumArthroderma quadrifidumTrichophyton erinaceiArthroderma gypseumArthroderma curreiArthroderma insingulare
Dermatophyte(CCF 4823)(CCF 4834)(CCF 4933)(CCF 5792)(CCF 5930)(CCF 6261)(CCF 5207)(CCF 5417)
Samples
L1–L3125.99 (100–200)200–>200158.74 (100–200)125.99 (100–200)200–>200200–>200200–>200200–>200
L4–L631.49 (25–50)19.57 (12.25–50)125.99 (100–200)79.37 (50–100)79.37 (50–100)31.49 (25–50)31.49 (25–50)62.99 (50–100)
L7–L931.49 (25–50)31.49 (25–50)158.74 (100–200)125.99 (100–200)158.74 (100–200)158.74 (100–200)39.68 (25–50)158.74 (100–200)
Griseofulvin (µg/mL)2.52 (2–4) 0.198 (0.125–0.25) 1.26 (1–2)>83.174 (2–4) 1.587 (1–2)>8>8
* MIC values are reported as the geometric means of three independent replicates (n = 3). MIC range concentrations are reported within the brackets.
Table 9. Preparation of F. officinalis samples.
Sample IDMushroom SampleDried Mushroom Weight (mg)Added EtOH: H2O (mL)Final Concentration (mg/mL)
L1Hymenium47005094
L2Hymenium47005094
L3Hymenium47005094
L4Apical part47005094
L5Apical part47005094
L6Apical part47005094
L7Median part47005094
L8Median part47005094
L9Median part47005094
Disclaimer/Publisher’s Note: The statements, opinions and data contained in all publications are solely those of the individual author(s) and contributor(s) and not of MDPI and/or the editor(s). MDPI and/or the editor(s) disclaim responsibility for any injury to people or property resulting from any ideas, methods, instructions or products referred to in the content.

