
Predicting the Area under the Plasma Concentration-Time Curve (AUC) for First Dose Vancomycin Using First-Order Pharmacokinetic Equations
 , , , and
Abstract
:1. Introduction
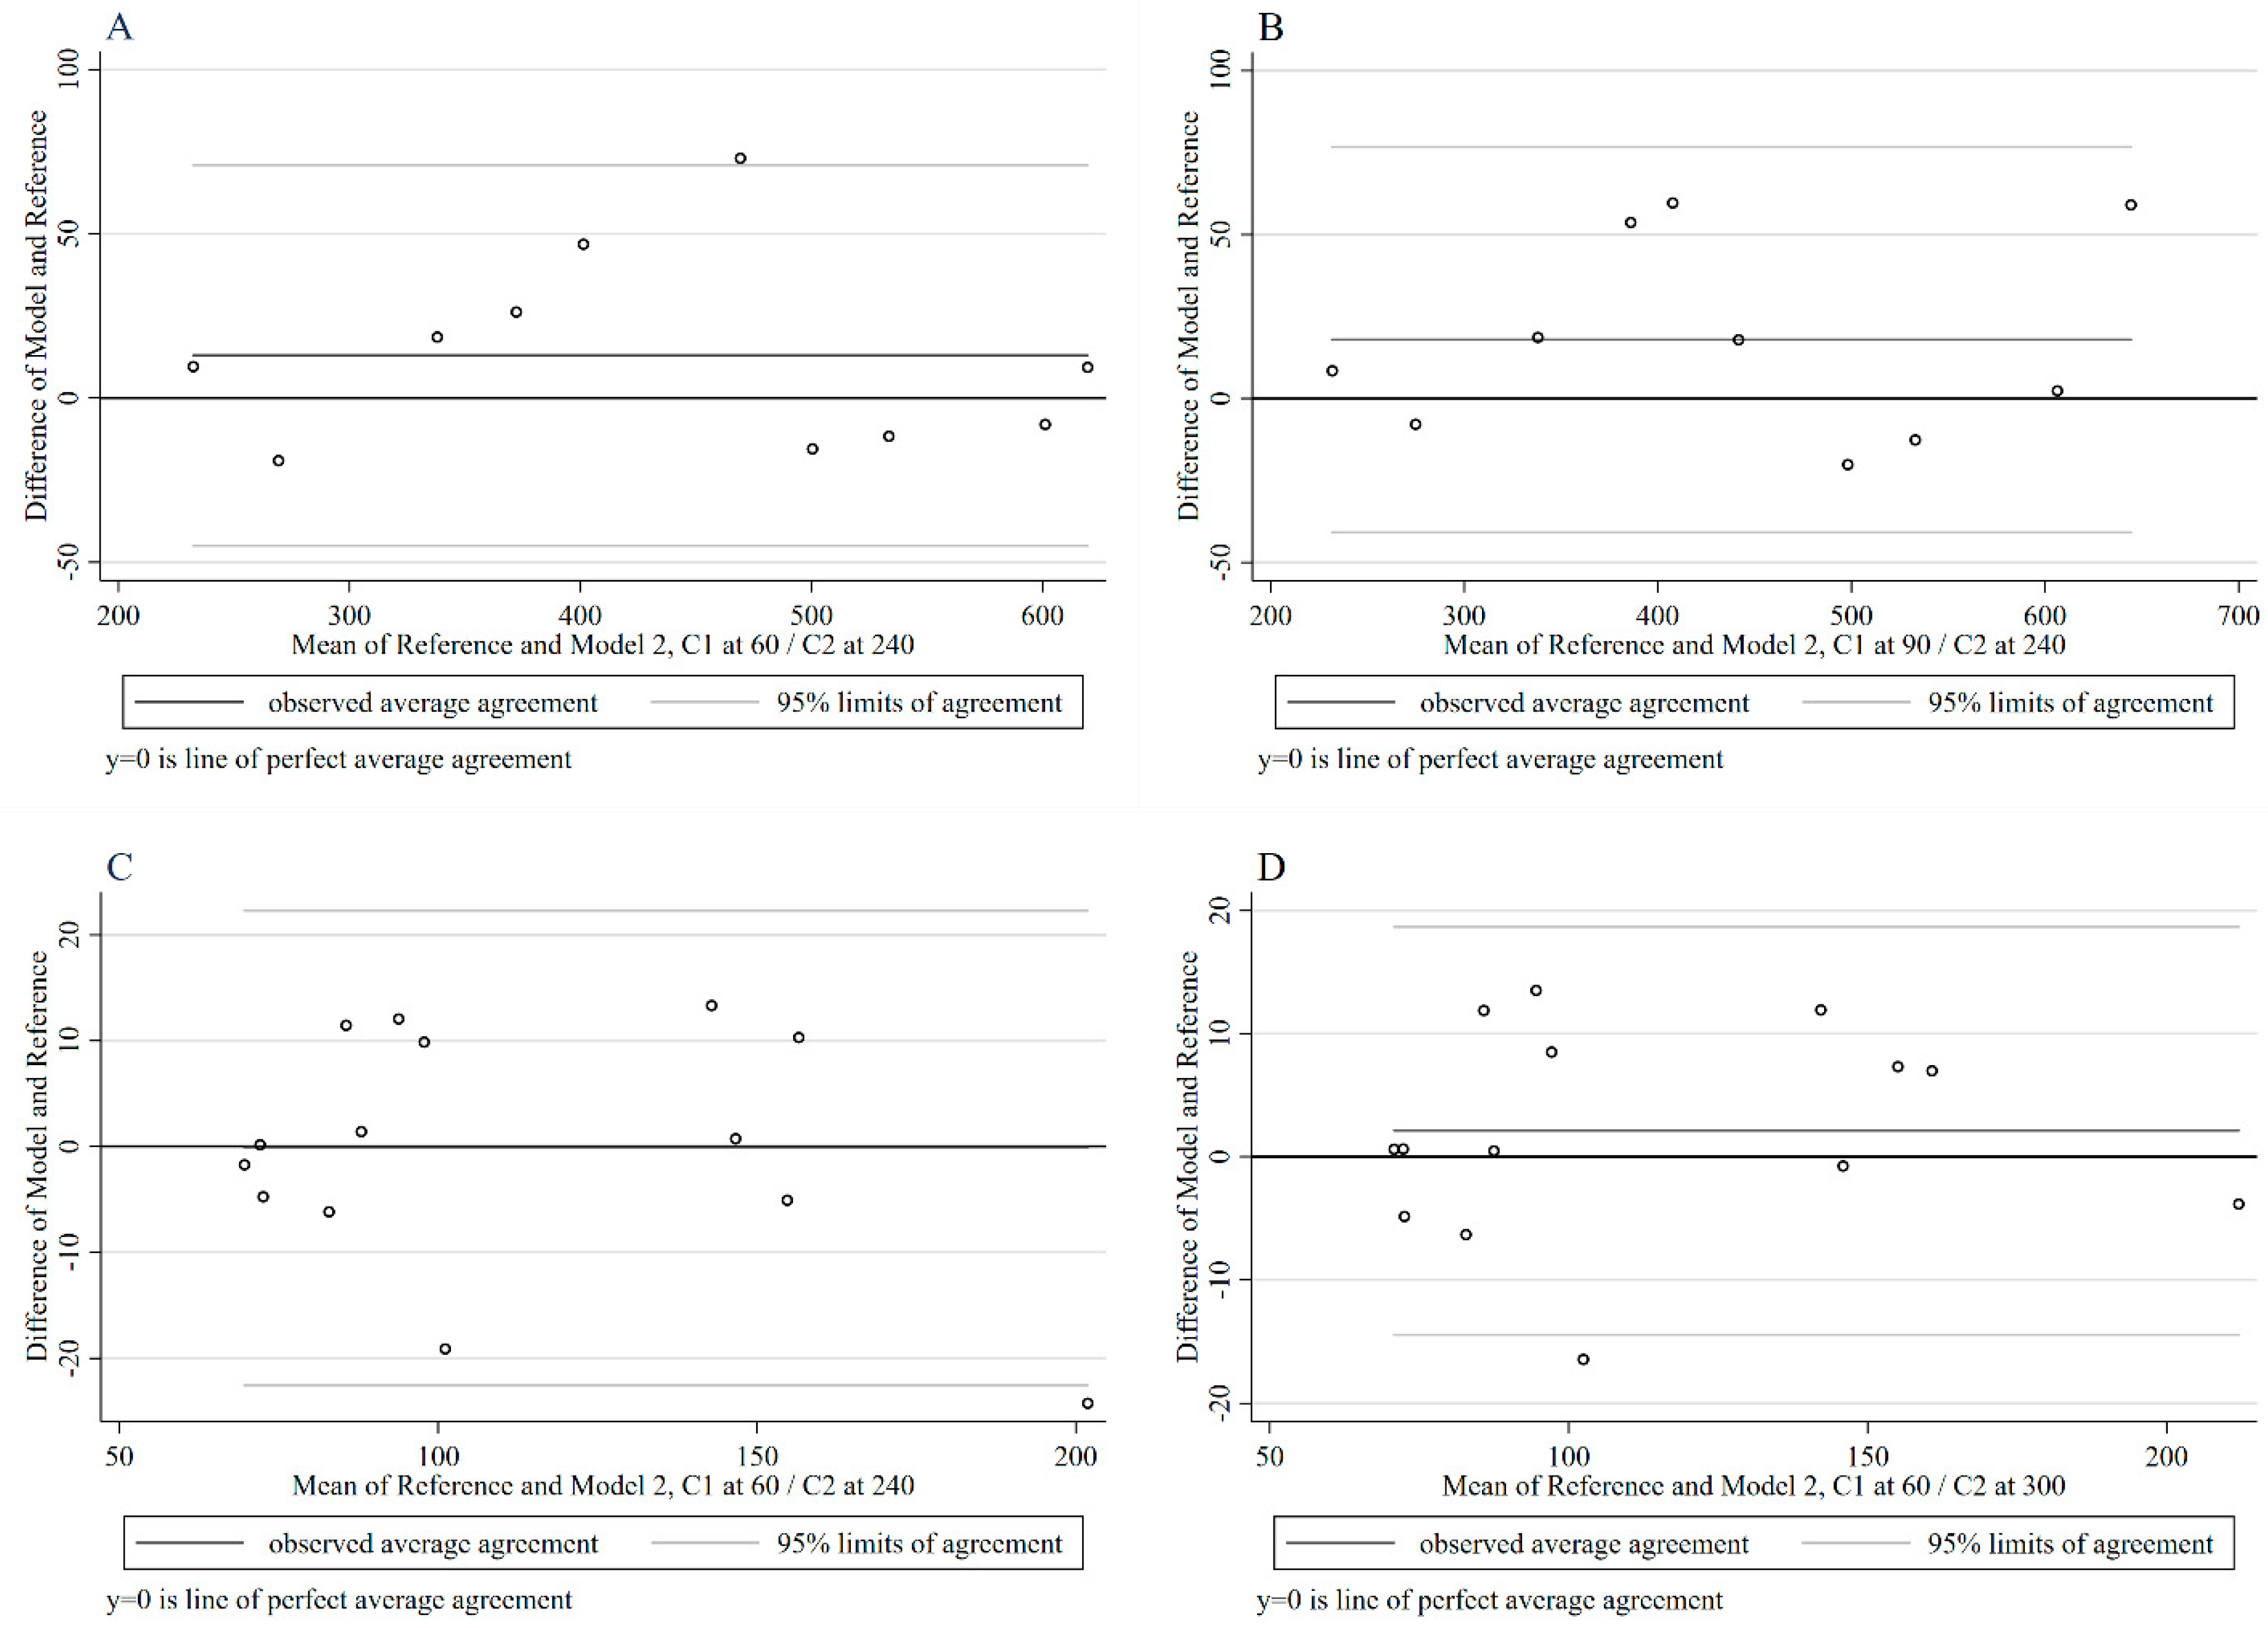
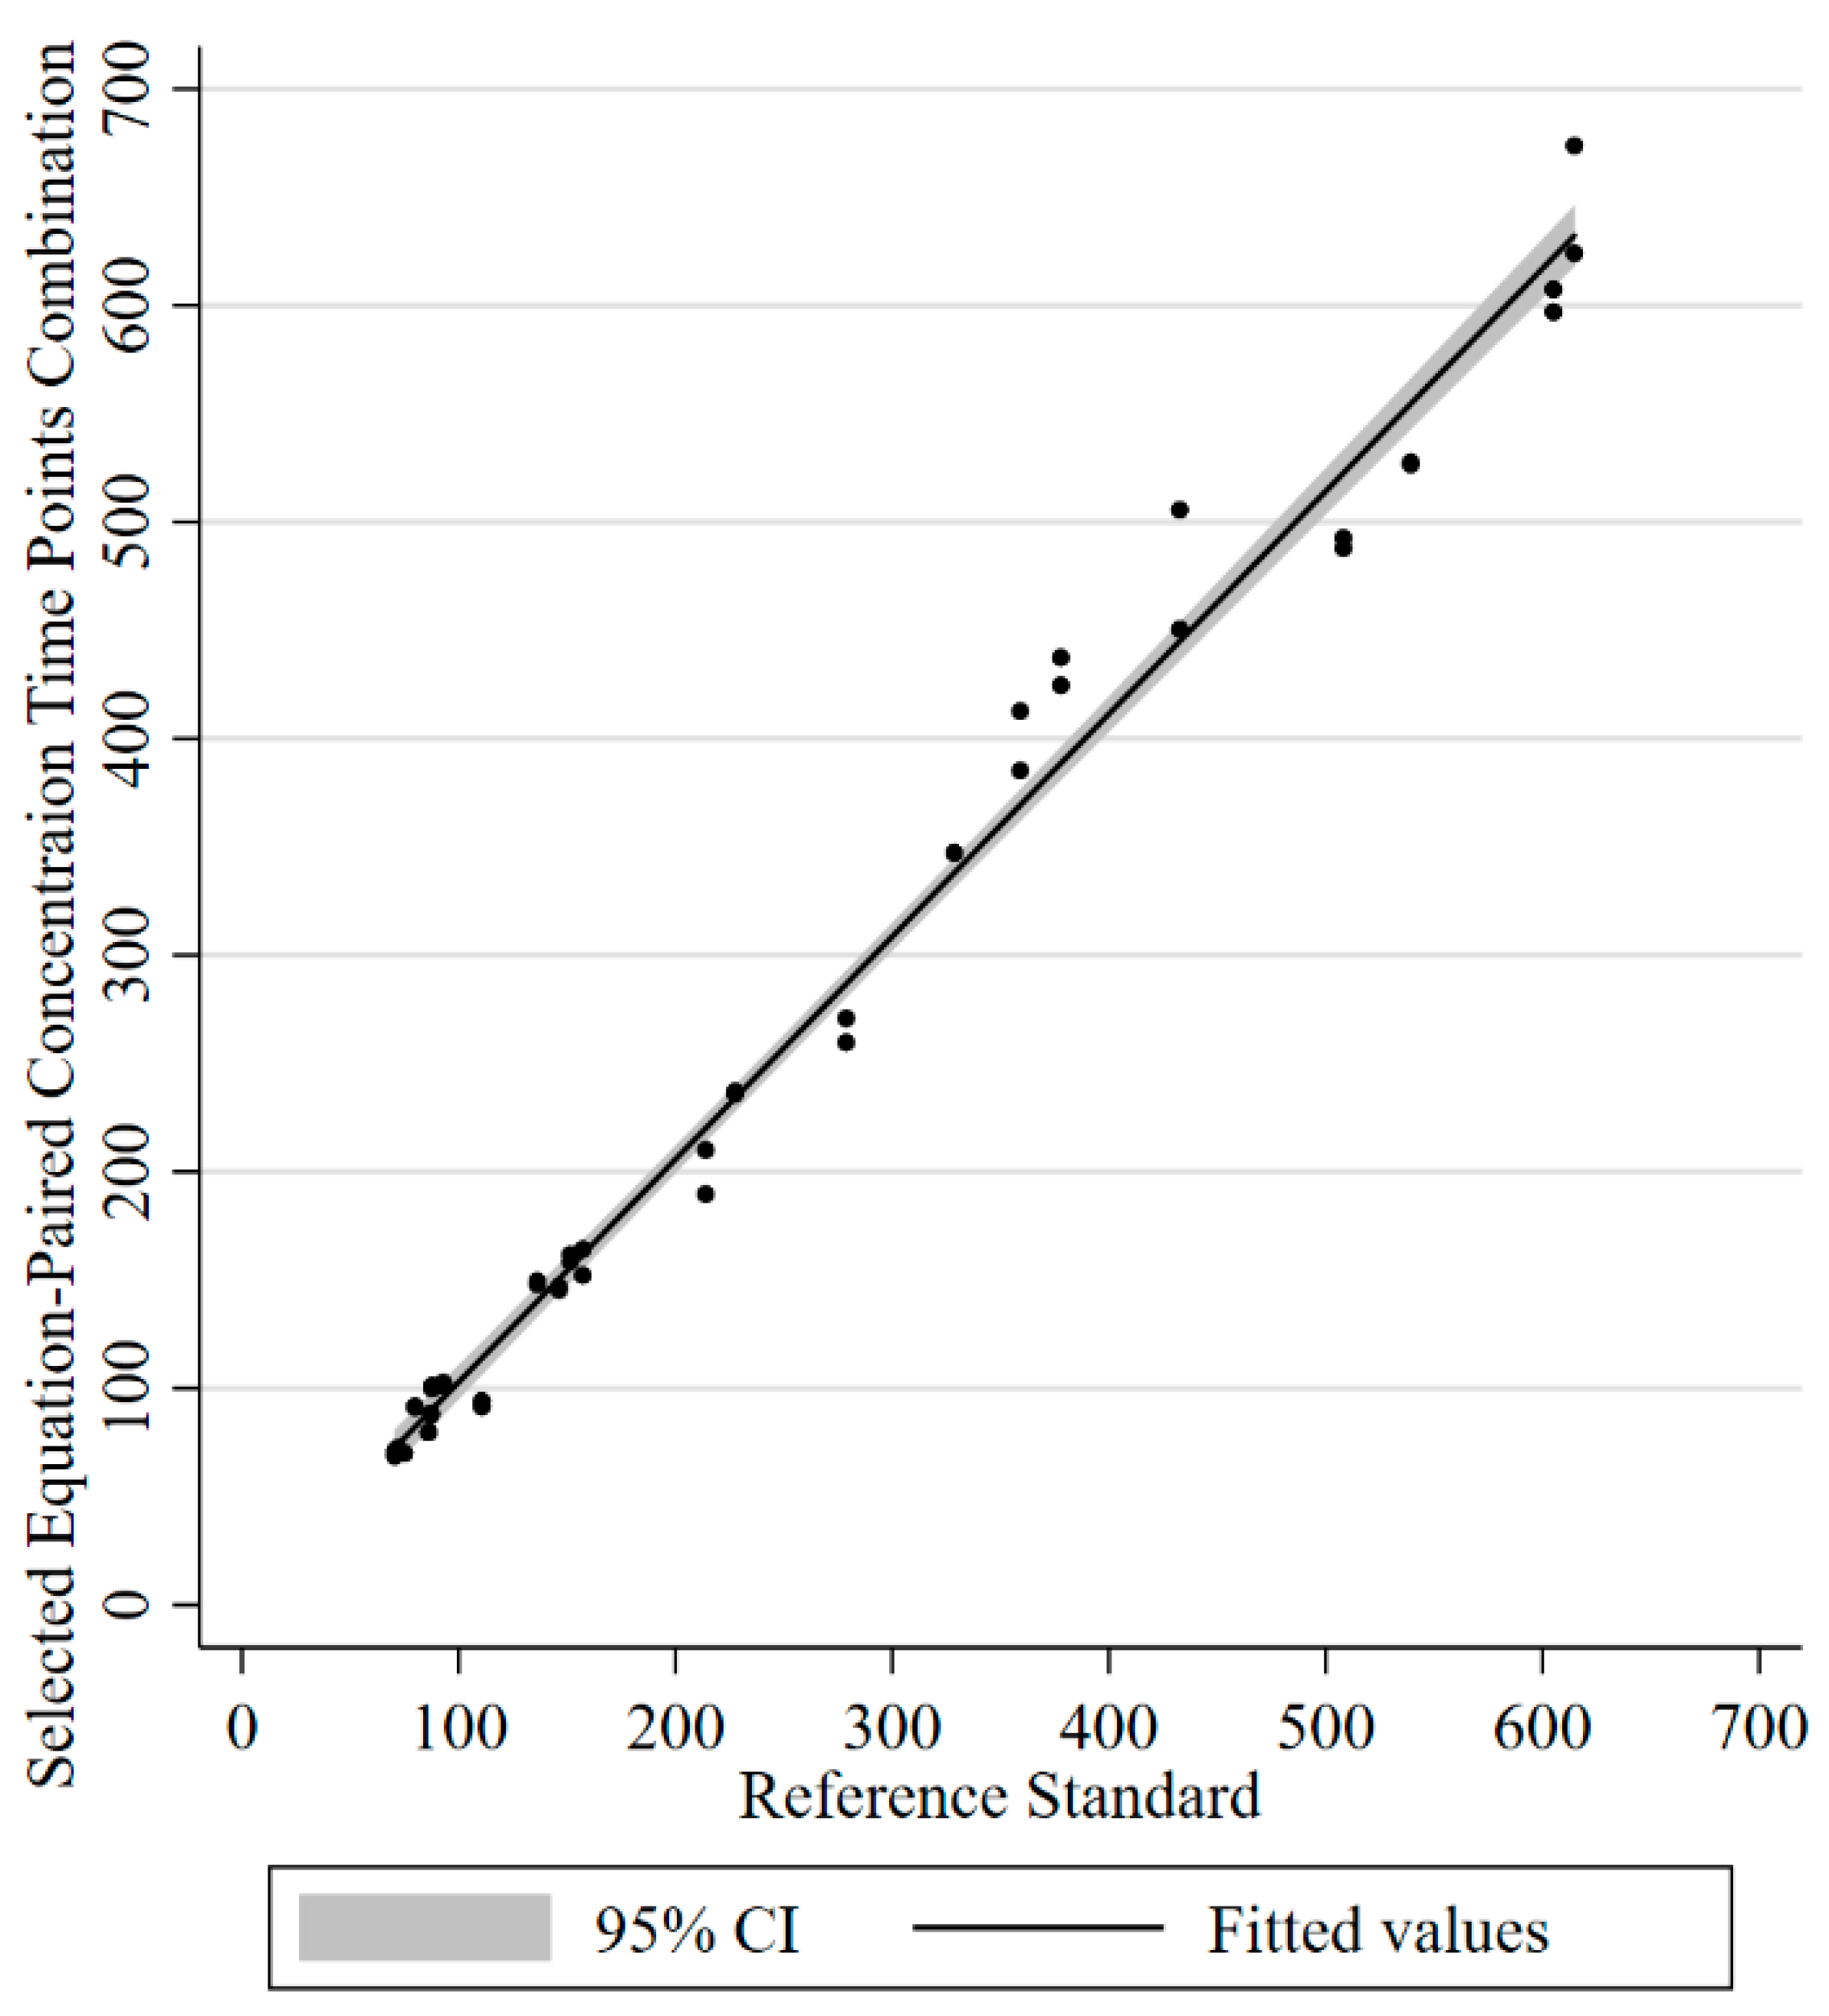
2. Results
3. Discussion
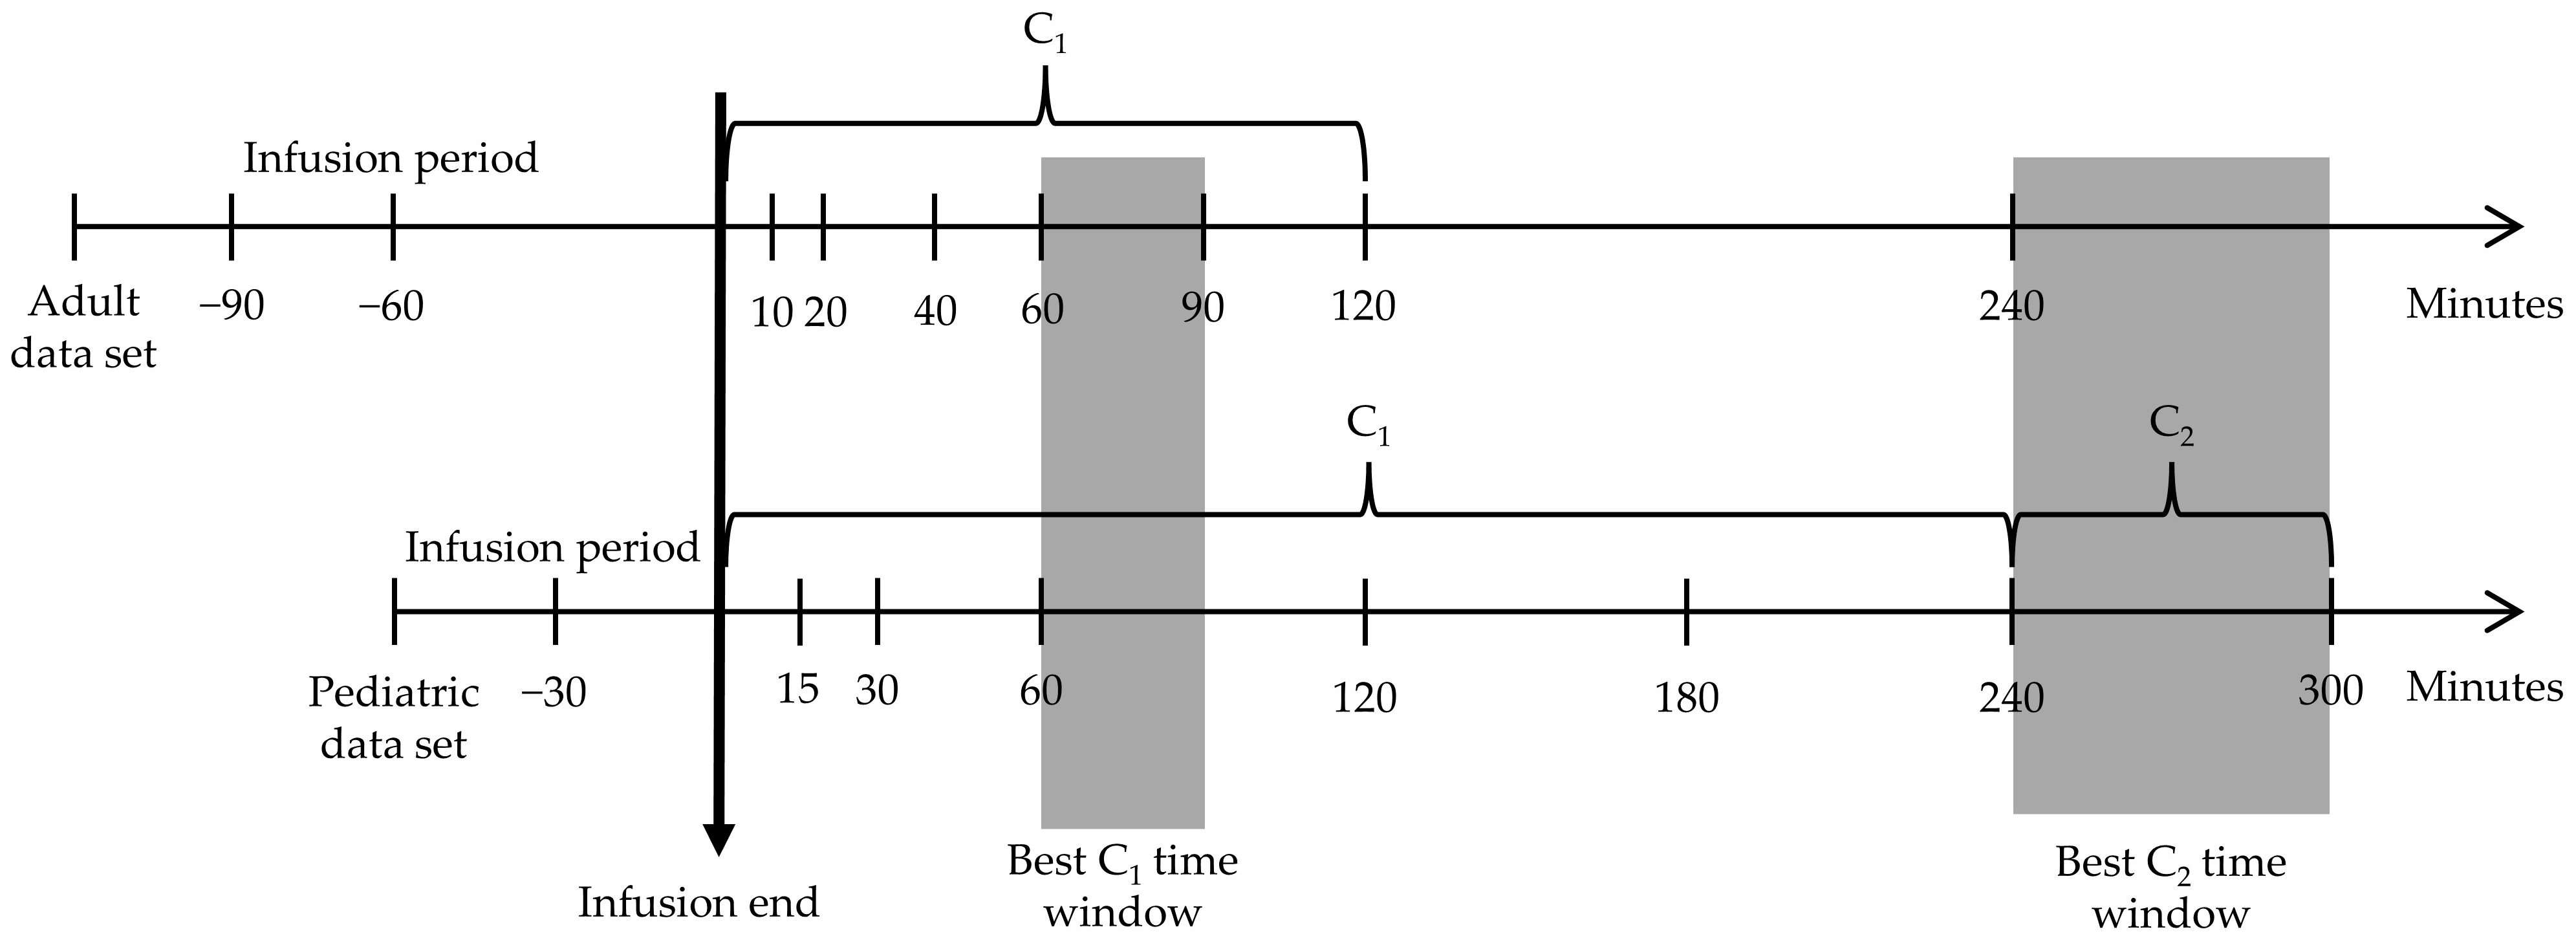
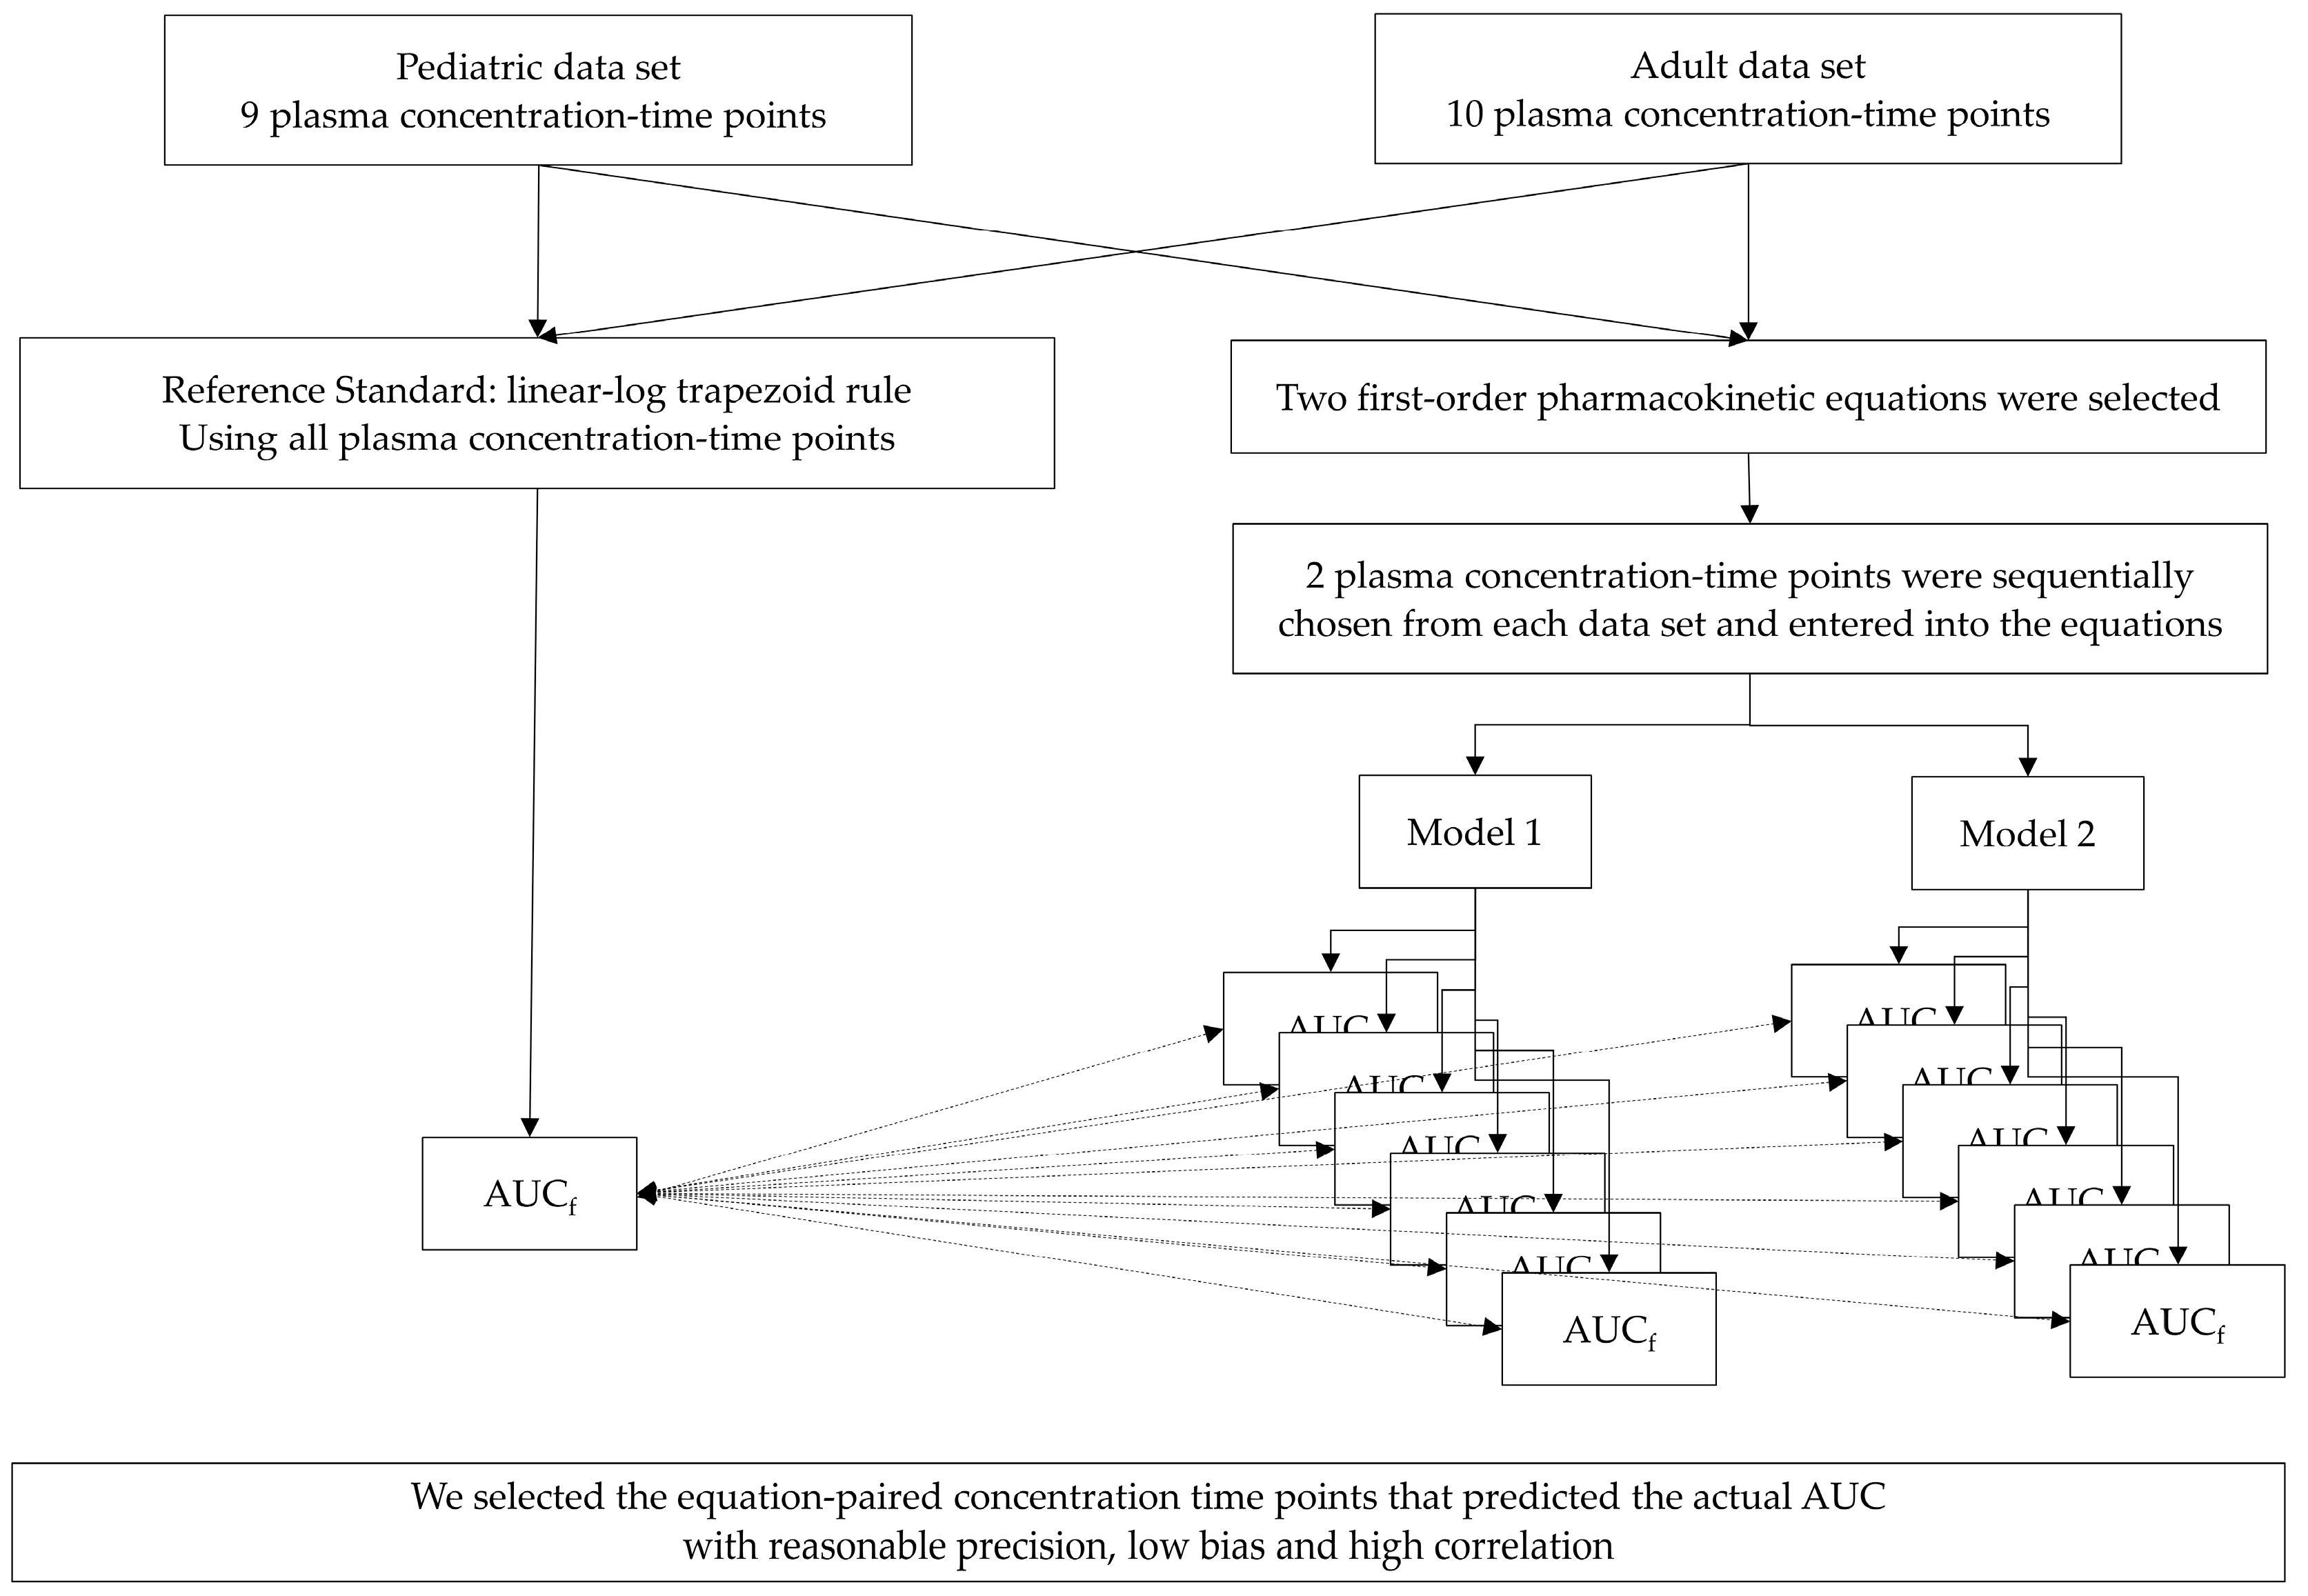
4. Materials and Methods
4.1. Pharmacokinetic Model Building
4.1.1. The Reference Standard
4.1.2. The First-Order Pharmacokinetic Equations [9]
- Model 1 (Figure S1)
- Model 2 (Figure S2)
4.2. Statistical Analysis
5. Conclusions
Supplementary Materials
Author Contributions
Funding
Institutional Review Board Statement
Informed Consent Statement
Data Availability Statement
Acknowledgments
Conflicts of Interest
References
- Weiss, S.L.; Peters, M.J.; Alhazzani, W.; Agus, M.S.D.; Flori, H.R.; Inwald, D.P.; Nadel, S.; Schlapbach, L.J.; Tasker, R.C.; Argent, A.C.; et al. Surviving Sepsis Campaign International Guidelines for the Management of Septic Shock and Sepsis-Associated Organ Dysfunction in Children. Pediatr. Crit. Care Med. 2020, 21, e52–e106. [Google Scholar] [CrossRef] [PubMed]
- Rybak, M.J.; Le, J.; Lodise, T.P.; Levine, D.P.; Bradley, J.S.; Liu, C.; Mueller, B.A.; Pai, M.P.; Wong-Beringer, A.; Rotschafer, J.C.; et al. Therapeutic monitoring of vancomycin for serious methicillin-resistant Staphylococcus aureus infections: A revised consensus guideline and review by the American Society of Health-System Pharmacists, the Infectious Diseases Society of America, the Pediatric Infectious Diseases Society, and the Society of Infectious Diseases Pharmacists. Am. J. Health Syst. Pharm. 2020, 77, 835–864. [Google Scholar] [PubMed] [Green Version]
- Weiss, S.L.; Balamuth, F.; Hensley, J.; Fitzgerald, J.C.; Bush, J.; Nadkarni, V.M.; Thomas, N.J.; Hall, M.; Muszynski, J. The Epidemiology of Hospital Death Following Pediatric Severe Sepsis: When, Why, and How Children with Sepsis Die. Pediatr. Crit. Care Med. 2017, 18, 823–830. [Google Scholar] [CrossRef] [PubMed]
- Cvetkovic, M.; Lutman, D.; Ramnarayan, P.; Pathan, N.; Inwald, D.P.; Peters, M.J. Timing of death in children referred for intensive care with severe sepsis: Implications for interventional studies. Pediatr. Crit. Care Med. 2015, 16, 410–417. [Google Scholar] [CrossRef] [PubMed]
- Law, A.C.; Stevens, J.P.; Walkey, A.J. National Trends in Timing of Death among Patients with Septic Shock, 1994–2014. Crit. Care Med. 2019, 47, 1493–1496. [Google Scholar] [CrossRef]
- Colin, P.J.; Allegaert, K.; Thomson, A.H.; Touw, D.J.; Dolton, M.; de Hoog, M.; Roberts, J.A.; Adane, E.D.; Yamamoto, M.; Santos-Buelga, D.; et al. Vancomycin Pharmacokinetics Throughout Life: Results from a Pooled Population Analysis and Evaluation of Current Dosing Recommendations. Clin. Pharm. 2019, 58, 767–780. [Google Scholar] [CrossRef] [Green Version]
- National Center for Biotechnology Information. PubChem Compound Summary for CID 14969, Vancomycin. Available online: https://pubchem.ncbi.nlm.nih.gov/compound/Vancomycin (accessed on 17 May 2020).
- Buxton, I.L.O. Pharmacokinetics: The Dynamics of Drug Absorption, Distribution, Metabolism, and Elimination. In Goodman & Gilman’s: The Pharmacological Basis of Therapeutics, 13e; Brunton, L.L., Hilal-Dandan, R., Knollmann, B.C., Eds.; McGraw-Hill Education: New York, NY, USA, 2017. [Google Scholar]
- Pai, M.P.; Neely, M.; Rodvold, K.A.; Lodise, T.P. Innovative approaches to optimizing the delivery of vancomycin in individual patients. Adv. Drug Deliv. Rev. 2014, 77, 50–57. [Google Scholar] [CrossRef] [Green Version]
- Suchartlikitwong, P.; Anugulruengkitt, S.; Wacharachaisurapol, N.; Jantarabenjakul, W.; Sophonphan, J.; Theerawit, T.; Chatsuwan, T.; Wattanavijitkul, T.; Puthanakit, T. Optimizing Vancomycin Use Through 2-Point AUC-Based Therapeutic Drug Monitoring in Pediatric Patients. J. Clin. Pharm. 2019, 59, 1597–1605. [Google Scholar] [CrossRef]
- Katip, W.; Jaruratanasirikul, S.; Pattharachayakul, S.; Wongpoowarak, W.; Jitsurong, A.; Lucksiri, A. The pharmacokinetics of vancomycin during the initial loading dose in patients with septic shock. Infect. Drug Resist. 2016, 9, 253–260. [Google Scholar] [CrossRef] [Green Version]
- Issaranggoon Na Ayuthaya, S.; Katip, W.; Oberdorfer, P.; Lucksiri, A. Correlation of the vancomycin 24-h area under the concentration-time curve (AUC24) and trough serum concentration in children with severe infection: A clinical pharmacokinetic study. Int. J. Infect. Dis. 2020, 92, 151–159. [Google Scholar] [CrossRef] [Green Version]
- Zelenitsky, S.; Rubinstein, E.; Ariano, R.; Iacovides, H.; Dodek, P.; Mirzanejad, Y.; Kumar, A.; Cooperative Antimicrobial Therapy of Septic Shock-CATSS Database Research Group. Vancomycin pharmacodynamics and survival in patients with methicillin-resistant Staphylococcus aureus-associated septic shock. Int. J. Antimicrob. Agents 2013, 41, 255–260. [Google Scholar] [CrossRef]
- Pai, M.P.; Rodvold, K.A. Aminoglycoside dosing in patients by kidney function and area under the curve: The Sawchuk-Zaske dosing method revisited in the era of obesity. Diagn. Microbiol. Infect. Dis. 2014, 78, 178–187. [Google Scholar] [CrossRef]
- Pai, M.P.; Russo, A.; Novelli, A.; Venditti, M.; Falcone, M. Simplified equations using two concentrations to calculate area under the curve for antimicrobials with concentration-dependent pharmacodynamics: Daptomycin as a motivating example. Antimicrob. Agents Chemother. 2014, 58, 3162–3167. [Google Scholar] [CrossRef] [Green Version]
- Deryke, C.A.; Alexander, D.P. Optimizing Vancomycin Dosing through Pharmacodynamic Assessment Targeting Area under the Concentration-Time Curve/Minimum Inhibitory Concentration. Hosp. Pharm. 2009, 44, 751–765. [Google Scholar] [CrossRef]
- Sawchuk, R.J.; Zaske, D.E.; Cipolle, R.J.; Wargin, W.A.; Strate, R.G. Kinetic model for gentamicin dosing with the use of individual patient parameters. Clin. Pharm. 1977, 21, 362–369. [Google Scholar] [CrossRef]
- Shahrami, B.; Najmeddin, F.; Mousavi, S.; Ahmadi, A.; Rouini, M.R.; Sadeghi, K.; Mojtahedzadeh, M. Achievement of Vancomycin Therapeutic Goals in Critically Ill Patients: Early Individualization May Be Beneficial. Crit. Care Res. Pract. 2016, 2016, 1245815. [Google Scholar] [CrossRef] [Green Version]
- Truong, J.; Smith, S.R.; Veillette, J.J.; Forland, S.C. Individualized Pharmacokinetic Dosing of Vancomycin Reduces Time to Therapeutic Trough Concentrations in Critically Ill Patients. J. Clin. Pharm. 2018, 58, 1123–1130. [Google Scholar] [CrossRef]
- Crumby, T.; Rinehart, E.; Carby, M.C.; Kuhl, D.; Talati, A.J. Pharmacokinetic comparison of nomogram-based and individualized vancomycin regimens in neonates. Am. J. Health Syst. Pharm. 2009, 66, 149–153. [Google Scholar] [CrossRef]
- Zhang, Y.; Huo, M.; Zhou, J.; Xie, S. PKSolver: An add-in program for pharmacokinetic and pharmacodynamic data analysis in Microsoft Excel. Comput. Methods Programs Biomed. 2010, 99, 306–314. [Google Scholar] [CrossRef]
- Sawchuk, R.J.; Zaske, D.E. Pharmacokinetics of dosing regimens which utilize multiple intravenous infusions: Gentamicin in burn patients. J. Pharm. Biopharm. 1976, 4, 183–195. [Google Scholar] [CrossRef]
- Giavarina, D. Understanding Bland Altman analysis. Biochem. Med. 2015, 25, 141–151. [Google Scholar] [CrossRef] [PubMed] [Green Version]


| Data Set | Time Points | Bland–Altman Analysis | Correlation | Lin’s Coefficients | ||||||
|---|---|---|---|---|---|---|---|---|---|---|
| C1 | C2 | Mean | Difference | 95% Limits of Agreement | Pearson’s r | p-Value | Rho_c | p-Value | ||
| Mean (%) | SD | |||||||||
| Model 1 | ||||||||||
| Pediatric | 0 | 240 | 111.9 | −3.0 (−2.7) | 13.4 | (−29.1, 23.2) | 0.974 | <0.001 | 0.940 | <0.001 |
| 0 | 300 | 115.3 | 3.9 (3.4) | 10.2 | (−16.2, 24.0) | 0.977 | <0.001 | 0.965 | <0.001 | |
| 15 | 300 | 109.3 | −5.3 (−4.8) | 9.9 | (−24.7, 14.2) | 0.98 | <0.001 | 0.960 | <0.001 | |
| Model 2 | ||||||||||
| Adult | 0 | 240 | 417.5 | −19.3 (−4.6) | 60.2 | (−137.3, 98.8) | 0.899 | <0.001 | 0.869 | <0.001 |
| 40 | 240 | 422.2 | −9.9 (−2.3) | 50.0 | (−107.9, 88.0) | 0.929 | <0.001 | 0.923 | <0.001 | |
| 60 | 240 | 433.6 | 13.0 (3.0) | 30.0 | (−45.0, 70.9) | 0.976 | <0.001 | 0.971 | <0.001 | |
| 90 | 240 | 436.1 | 18.0 (4.1) | 30.0 | (−40.8, 76.7) | 0.976 | <0.001 | 0.967 | <0.001 | |
| Pediatric | 30 | 240 | 114.1 | 4.3 (3.8) | 11.3 | (−17.8, 26.4) | 0.969 | <0.001 | 0.955 | <0.001 |
| 60 | 240 | 111.8 | −0.1 (−0.1) | 11.4 | (−22.6, 22.3) | 0.964 | <0.001 | 0.962 | <0.001 | |
| 120 | 240 | 109.6 | −4.6 (−4.2) | 11.6 | (−27.4, 18.2) | 0.963 | <0.001 | 0.957 | <0.001 | |
| 180 | 240 | 113.3 | 2.8 (2.5) | 20.5 | (−37.4, 43.0) | 0.883 | <0.001 | 0.881 | <0.001 | |
| 60 | 300 | 113.0 | 2.1 (1.9) | 8.4 | (−14.4, 18.7) | 0.981 | <0.001 | 0.979 | <0.001 | |
| 120 | 300 | 109.7 | −4.4 (−4.01) | 10.6 | (−25.1, 16.2) | 0.974 | <0.001 | 0.966 | <0.001 | |
| 180 | 300 | 113.5 | 3.2 (2.8) | 16.2 | (−28.5, 34.9) | 0.939 | <0.001 | 0.933 | <0.001 | |
| Adult Data Set | Reference Standard | Model 2 | |
|---|---|---|---|
| C1 at 60 and C2 at 240 min after the Completed Infusion | C1 at 90 and C2 at 240 min after the Completed Infusion | ||
| AUC, mean ± SD (mg/L × h) | 427.14 ± 135.26 | 440.11 ± 132.85 | 445.09 ± 138.21 |
| Vancomycin Cl, mean ± SD (L/h) | 4.62 ± 1.45 | 4.47 ± 1.38 | 4.43 ± 1.40 |
| Vd, mean ± SD (L) | 39.35 ± 8.95 | 39.88 ± 8.92 | 41.33 ± 7.76 |
| Half-life ± SD (h) | 6.28 ± 1.97 | 6.56 ± 2.02 | 6.83 ± 1.69 |
| Pediatric Data Set | Reference Standard | Model 2 | |
|---|---|---|---|
| C1 at 60 and C2 at 240 min after the Completed Infusion | C1 at 60 and C2 at 300 min after the Completed Infusion | ||
| AUC, mean ± SD (mg/L × h) | 111.91 ± 42.73 | 111.78 ± 39.83 | 114.03 ± 43.39 |
| Vancomycin Cl, mean ± SD (L/kg/h) | 0.16 ± 0.04 | 0.16 ± 0.04 | 0.15 ± 0.04 |
| Vd, mean ± SD (L/kg) | 0.55 ± 0.10 | 0.51 ± 0.06 | 0.52 ± 0.07 |
| Half-life ± SD (h) | 2.58 ± 0.91 | 2.38 ± 0.69 | 2.47 ± 0.84 |
Disclaimer/Publisher’s Note: The statements, opinions and data contained in all publications are solely those of the individual author(s) and contributor(s) and not of MDPI and/or the editor(s). MDPI and/or the editor(s) disclaim responsibility for any injury to people or property resulting from any ideas, methods, instructions or products referred to in the content. |
© 2023 by the authors. Licensee MDPI, Basel, Switzerland. This article is an open access article distributed under the terms and conditions of the Creative Commons Attribution (CC BY) license (https://creativecommons.org/licenses/by/4.0/).
Share and Cite
Sujjavorakul, K.; Katip, W.; Kerr, S.J.; Wacharachaisurapol, N.; Puthanakit, T. Predicting the Area under the Plasma Concentration-Time Curve (AUC) for First Dose Vancomycin Using First-Order Pharmacokinetic Equations. Antibiotics 2023, 12, 630. https://doi.org/10.3390/antibiotics12040630
Sujjavorakul K, Katip W, Kerr SJ, Wacharachaisurapol N, Puthanakit T. Predicting the Area under the Plasma Concentration-Time Curve (AUC) for First Dose Vancomycin Using First-Order Pharmacokinetic Equations. Antibiotics. 2023; 12(4):630. https://doi.org/10.3390/antibiotics12040630
Chicago/Turabian StyleSujjavorakul, Kritsaporn, Wasan Katip, Stephen J. Kerr, Noppadol Wacharachaisurapol, and Thanyawee Puthanakit. 2023. "Predicting the Area under the Plasma Concentration-Time Curve (AUC) for First Dose Vancomycin Using First-Order Pharmacokinetic Equations" Antibiotics 12, no. 4: 630. https://doi.org/10.3390/antibiotics12040630