
Inhibition of Erythromycin and Erythromycin-Induced Resistance among Staphylococcus aureus Clinical Isolates


1
Department of Microbiology and Immunology, Faculty of Pharmacy, Mansoura University, Mansoura 35516, Egypt
2
Department of Microbiology and Immunology, Faculty of Pharmacy, Horus University-Egypt, New Damietta 34518, Egypt
3
Department of Pharmaceutical Organic Chemistry, Faculty of Pharmacy, Mansoura University, Mansoura 35516, Egypt
*
Author to whom correspondence should be addressed.
Antibiotics 2023, 12(3), 503; https://doi.org/10.3390/antibiotics12030503
Submission received: 22 January 2023
/
Revised: 6 February 2023
/
Accepted: 22 February 2023
/
Published: 2 March 2023
(This article belongs to the Special Issue Antibacterial Resistance and Novel Therapeutic Strategies)
Abstract
:The increasing incidence of erythromycin and erythromycin-induced resistance to clindamycin among Staphylococcus aureus (S. aureus) is a serious problem. Patients infected with inducible resistance phenotypes may fail to respond to clindamycin. This study aimed to identify the prevalence of erythromycin and erythromycin-induced resistance and assess for potential inhibitors. A total of 99 isolates were purified from various clinical sources. Phenotypic detection of macrolide-lincosamide-streptogramin B (MLSB)-resistance phenotypes was performed by D-test. MLSB-resistance genes were identified using PCR. Different compounds were tested for their effects on erythromycin and inducible clindamycin resistance by broth microdilution and checkerboard microdilution methods. The obtained data were evaluated using docking analysis. Ninety-one isolates were S. aureus. The prevalence of constitutive MLSB, inducible MLSB, and macrolide-streptogramin (MS) phenotypes was 39.6%, 14.3%, and 2.2%, respectively. Genes including ermC, ermA, ermB, msrA, msrB, lnuA, and mphC were found in 82.6%, 5.8%, 7.7%, 3.8%, 3.8%, 13.5%, and 3.8% of isolates, respectively. Erythromycin resistance was significantly reduced by doxorubicin, neomycin, and omeprazole. Quinine, ketoprofen, and fosfomycin combated and reversed erythromycin/clindamycin-induced resistance. This study highlighted the significance of managing antibiotic resistance and overcoming clindamycin treatment failure. Doxorubicin, neomycin, omeprazole, quinine, ketoprofen, and fosfomycin could be potential inhibitors of erythromycin and inducible clindamycin resistance.
1. Introduction
Staphylococcus aureus (S. aureus) has been regarded as the most pathogenic bacterium of the Gram-positive Staphylococcus genus [1]. S. aureus is considered a commensal and opportunistic bacterium that colonizes the majority of the human population. It turns opportunistic when it invades populations with low immunity, such as immunocompromised people, diabetics, the elderly, and children, or when it enters the body through wounds [1,2]. S. aureus infections have been linked to high rates of morbidity and mortality. S. aureus is responsible for a wide range of diseases, from minor to moderate skin infections to more severe and even fatal infections, such as toxic shock syndrome, food poisoning, osteomyelitis, and endocarditis [3,4]. The multiple pathogenic implications of S. aureus are controlled by its potential virulence factors and the remarkable diversity of antibiotic resistance mechanisms [5]. Methicillin-resistant S. aureus (MRSA) isolates have been responsible for major outbreaks of nosocomial infections for many years and are now increasingly isolated from the community, where they can cause fatal infections [6].
Erythromycin, the first macrolide discovered in 1952, has been reported to be effective against a wide range of bacterial infections, including S. aureus [7,8]. Excessive use of erythromycin has led to the emergence of mechanisms responsible for its resistance. Several mechanisms have been involved in S. aureus resistance to erythromycin. The most common mechanism of resistance is the modification of the ribosomal binding site, which reduces erythromycin’s ability to bind to ribosomes. The synthesis of ribosomal methylase, which is encoded by erm genes, mediates this modification [9]. The active elimination of erythromycin by efflux systems, which are encoded by the msr and mef genes, is the second mechanism [10,11]. The third known cause of resistance in S. aureus is the production of macrolide-inactivating enzymes such as macrolide phosphorylases that are encoded by mph genes [12].
Macrolides, such as erythromycin, lincosamides, such as clindamycin, and streptogramin B (quinupristin) are antibiotics that belong to a group collectively called the macrolides-lincosamides-streptogramin B (MLSB) group [13]. They are chemically and structurally different, but their mechanism of action is similar as they prevent bacterial protein synthesis by binding to 23s rRNA in the 50S ribosomal subunit [13,14]. MLSB group is used to treat staphylococcal infections [13]. Three major mechanisms underlie S. aureus resistance to MLSB (Figure 1): methylation of rRNA (target-site modification), active efflux, and enzymatic inactivation. In rRNA methylation, the methylase enzyme attaches one or two methyl groups to the adenine residue in the 23S rRNA moiety, lowering the affinity of the ribosomal subunit to MLS antibiotics [15]. The second reported mechanism is antibiotic efflux, which is mediated by msr genes, resulting in resistance to macrolide and streptogramin B antibiotics (MS) [16]. The third known mechanism is the enzymatic inactivation of antibiotics, which confers resistance to structurally related antibiotics only. For instance, specific resistance to macrolides is conferred by esterases and phosphotransferases, which are encoded by ere and mphC genes, respectively [17,18]. The lnu genes, which mediate resistance to only lincosamides, encode nucleotidyltransferases [19,20]. Furthermore, the vgb genes encode enzymes that hydrolyze streptogramin B, whereas the vga and vat genes confer resistance to streptogramin A [21].
MLSB-resistance phenotypes can be constitutive (cMLSB), in which rRNA methylase is usually produced. Inducible MLSB-resistance (iMLSB) phenotypes are elicited when rRNA methylase is produced in the presence of an inducing agent, such as erythromycin [14,22].
Infections caused by iMLSB S. aureus isolates fail to respond to clindamycin therapy because the rRNA methylase enzyme secretion is active in the presence of erythromycin as an inducer, resulting in clindamycin inactivation and increasing antibiotic resistance. This prompts some researchers to warn against the use of clindamycin for S. aureus isolates with the iMLSB-resistance phenotypes [14,23,24].
The golden age of antibiotic therapy may be coming to an end due to the increasing incidence of antibiotic resistance worldwide. Resistance has an impact on all aspects of medicine and makes effective empirical therapy more challenging to achieve [25]. As a result, various inhibitor development strategies have been proposed and implemented. The enzymatic activity was exploited to search for compounds with potential inhibitory activity [26].
Previous studies on erythromycin combinations with pellitorine, sesamin, piperic acid and tetrahydropiperine [27], hydroxyamines [28], totarol [29], oleic and linoleic acids [30] showed significant decreases in minimum inhibitory concentration (MIC) of erythromycin against MS S. aureus isolates by inhibiting MsrA protein. Previous studies on CCCP [31], caffeine [32], piperine [33], omeprazole [34], vitamin D3 [35], vitamin K [36], verapamil [37], and digoxin [38] showed inhibitory activity on S. aureus efflux proteins. Neomycin also potentiated anti-staphylococcal activity of mupirocin [39]. Both meloxicam and ketoprofen were selected for their approved antimicrobial activity [40,41]. In addition, ketoprofen was reported to inhibit the methyltransferase enzyme responsible for the inactivation of thiopurine drugs [42]. Concerning quinine, a significant decrease was noted after combining quinine with other phytochemicals, such as reserpine [43]. Furthermore, a study reported in Australia demonstrated an additive effect between quinine and ampicillin [44]. Doxorubicin, 5-fluorouracil, and cisplatin have antimicrobial activity [45,46,47]. Additionally, doxorubicin was reported to inhibit DNA methyltransferase as a chemotherapeutic agent [48]. There are no previous studies approved the effect of potential inhibitors on the suppression of erythromycin resistance against iMLSB S. aureus isolates. On the other hand, no previous studies were conducted to detect potential inhibitors of inducible clindamycin resistance.
The present study aims to determine the prevalence of resistance to different classes of antimicrobial agents, mainly the MLSB group, among S. aureus isolated from different clinical sources. Moreover, the underlying mechanisms of MLSB-resistance phenotypes were explored. Furthermore, twenty-one compounds were selected to assess their inhibitory effects on erythromycin resistance and inducible clindamycin resistance. Potential inhibitors of resistance to erythromycin and inducible clindamycin were identified in order to overcome antibiotic resistance and achieve the desired therapeutic outcomes.
2. Results
2.1. Isolation and Identification of Isolates
Out of 99 staphylococcal isolates, 91 isolates were identified as S. aureus based on microscopical examination and biochemical reactions (D-mannitol fermentation and catalase and coagulase production). The isolates were collected from different hospitals near Mansoura University, Egypt. They were gathered from various clinical sources, including wounds (n = 36), blood (n = 30), nasal swabs (n = 24), and broncho-alveolar lavage (n = 1).
2.2. Antimicrobial Susceptibility Testing
The susceptibility of the tested S. aureus clinical isolates (n = 91) to different classes of antimicrobial agents was detected. The isolates exhibited diverse resistance to tested antimicrobial agents, including ceftazidime (96.7%), cefoxitin (94.5%), amoxicillin-clavulanic acid (80.2%), oxacillin (69.2%), cefotaxime (64.8%), gentamicin (64.8%), cefepime (60.4%), ciprofloxacin (46.4%), levofloxacin (37.4%), clarithromycin (56%), azithromycin, erythromycin, quinapristin/dalfopristin (57.1%), clindamycin, amikacin (38.5%), and imipenem (28.6%). All isolates were sensitive to linezolid (Figure 2a, Table S1). Eighty-six isolates were identified as MRSA, where they showed resistance to cefoxitin and oxacillin (Table S1). The MIC of vancomycin among all isolates was less than 2 µg/mL. Therefore, no vancomycin-resistant S. aureus (VRSA) isolates were detected.
2.3. Phenotypic Detection of MLSB Phenotypes
Different MLSB phenotypes were observed among 91 S. aureus clinical isolates (Figure 2b). A total of 37 isolates exhibited cMLSB resistance, in which 36 isolates showed the R phenotype; however, only one isolate showed the HD (hazy D zone) phenotype. The iMLSB was detected in 13 isolates, where 3 isolates showed the D phenotype and 10 isolates showed the D+ phenotype. The MS phenotype was detected in two isolates. The remaining 39 isolates were sensitive to both erythromycin and clindamycin (S phenotype) (Figure 3).
2.4. Prevalence of MLSB-Resistance Genes
A total of 52 isolates with different MLSB-resistance phenotypes were screened for various resistant genes. PCR detection of erm genes (ermA, ermB, and ermC) revealed that the ermC gene was the most frequently detected gene; it was detected in 43 (82.6%) MLSB-resistant S. aureus isolates. The ermA and ermB genes were detected in three (5.8%) and four (7.7%) MLSB-resistant isolates, respectively. Additionally, PCR analysis revealed that msrA and msrB genes, which mediate the active efflux of macrolides and streptogramin B out of the cell, were found in two isolates, nos. 36 and 38 (3.8%) (Figure 2c, Table 1).
2.5. Screening for the Effect of Different Compounds on Erythromycin Resistance
2.5.1. Screening for the Effect of Different Compounds on Erythromycin Resistance against iMLSB S. aureus Isolates
The effect of tested compounds on erythromycin resistance against isolate no. 10 (D phenotype) showed that quinine, fosfomycin, and meloxicam decreased the MIC of erythromycin by 4-fold. Doxorubicin and ketoprofen reduced the MIC of erythromycin by 8-fold. Moreover, neomycin decreased the MIC of erythromycin by 16-fold. The remaining tested compounds showed only a 2-fold reduction in the MIC of erythromycin, while CCCP did not exhibit any effect on erythromycin (Table S2). Thus, quinine, fosfomycin, doxorubicin, neomycin, meloxicam, and ketoprofen were selected as potential inhibitors of erythromycin resistance against S. aureus isolate no. 10 and were similarly evaluated against other iMLSB S. aureus isolates no. 14 and 27 (D phenotype) and no. 13 and 28 (D+ phenotype) (Figure 4, Table 2).
Quinine and meloxicam lowered the MIC of erythromycin by 4–8-fold against tested isolates. Upon the addition of fosfomycin, the MIC of erythromycin decreased by 2–4-fold against tested isolates. Doxorubicin decreased the MIC of erythromycin by 32-fold against tested isolates except isolates no. 14 and 13 (8–16-fold decrease). Moreover, neomycin achieved a reduction of 8-fold against all tested isolates except isolate no. 14 (128-fold decrease). Concerning ketoprofen, it showed an 8-fold decrease in erythromycin resistance against all isolates except isolate no. 14 (16-fold decrease) (Table 2).
2.5.2. Screening for the Effect of Different Compounds on Erythromycin Resistance against MS S. aureus Isolates
The effect of different compounds on erythromycin resistance against isolate no. 36 indicated that neomycin exhibited a 128-fold decrease in the MIC of erythromycin. Meloxicam, ketoprofen, and omeprazole reduced the MIC of erythromycin by 8-fold, while CCCP and caffeine reduced the MIC of erythromycin by 4-fold. Compounds (quinidine, emetine, fosfomycin, ciprofloxacin, doxorubicin, and verapamil) showed only a 2-fold decrease in the MIC of erythromycin. On the other hand, other tested compounds showed no effect on erythromycin resistance (Table S3).
Therefore, CCCP, caffeine, neomycin, meloxicam, ketoprofen, and omeprazole were chosen as potential inhibitors of erythromycin resistance against S. aureus isolate no. 36 and were similarly assessed against other MS S. aureus isolate no. 38. Neomycin decreased the MIC of erythromycin by 32-fold. Ketoprofen showed an 8-fold reduction in the MIC of erythromycin. Furthermore, meloxicam, CCCP, caffeine, and omeprazole resulted in a 4-fold reduction in the MIC of erythromycin (Figure 4, Table 2).
2.6. Screening for the Effect of Different Compounds on Inducible Clindamycin Resistance against iMLSB S. aureus Isolates
The MIC of clindamycin and tested compounds were determined against selected isolate no. 10 (D phenotype) (Table S4). Induction of clindamycin resistance using erythromycin (8 μg/mL) showed a 16-fold increase in the MIC of clindamycin (Table S4). The inhibitory activity of each tested compound on inducible clindamycin resistance was detected (Table S4). Quinine, fosfomycin, and ketoprofen showed a 4-fold decrease in the MIC of clindamycin and were selected to assess their effects against other iMLSB S. aureus isolates no. 14 and 27 (D phenotype) and no. 13 and 28 (D+ phenotype) (Table S4).
Similarly, induction of clindamycin resistance by erythromycin (8 μg/mL) against S. aureus isolates no. 14 and 27 revealed a 16-fold increase in the MIC of clindamycin. Additionally, induction of clindamycin resistance using erythromycin against S. aureus isolates no. 13 and 28 showed a 256-fold increase in the MIC of clindamycin (Table 3).
Quinine showed a 4-fold decrease in the MIC of clindamycin against all tested isolates except isolate no. 13 (8-fold decrease). Additionally, the MIC of clindamycin was decreased by 4-fold after the addition of fosfomycin except isolate no. 27 (2-fold decrease). Moreover, a 4-fold reduction in the MIC of clindamycin was observed upon the addition of ketoprofen against all tested isolates, and more pronounced activity was observed with isolates no. 13 and 28 (32-fold decrease) (Table 3).
2.7. Checkerboard Microdilution Assay
Erythromycin/doxorubicin and erythromycin/neomycin combinations resulted in synergistic effects (fractional inhibitory concentration index (FICI) = 0.5) against isolate no. 10. Erythromycin with meloxicam, quinine, fosfomycin, and ketoprofen showed additive effects (Table 4). Synergistic effects were observed in erythromycin/neomycin and erythromycin/omeprazole combinations against isolate no. 36 with FICI = 0.313 and 0.5, respectively. Erythromycin combinations with CCCP, caffeine, meloxicam, and ketoprofen resulted in additive effects (Table 4).
Furthermore, the clindamycin/erythromycin combination produced an antagonistic effect with FICI = 16.668 against isolate no. 10. Quinine combinations with clindamycin and clindamycin/erythromycin showed additive effects. Moreover, fosfomycin revealed a synergistic effect when combined with clindamycin (FICI = 0.375). The clindamycin/erythromycin/fosfomycin combination exhibited an additive effect. Regarding ketoprofen, synergism was also detected in the clindamycin/ketoprofen combination (FICI = 0.5). The clindamycin/erythromycin/ketoprofen combination produced an additive effect (Table 5).
2.8. Molecular Docking Study for Potential Inhibitors of Erythromycin Resistance
2.8.1. Molecular Docking Study of Doxorubicin at S-Adenosyl-L-Methionine (SAM)-Binding Site of ErmC’ Protein
The docking of doxorubicin at ErmC’ showed a docking energy score = −7.59 kcal/mol, and it was capable of binding similarly to the binding mode of the co-crystallized ligand (sinefungin) (−9.75 kcal/mol), which included six hydrogen bonding interactions, one H-π interaction with Phe12, and ten hydrophobic interactions (Figure S1). Two hydrogen bonds with Glu38 and Glu59 and all hydrophobic interactions, except those with Ile85, Asp61, and Ser9, were common in doxorubicin and sinefungin (Figure 5, Table S5).
2.8.2. Molecular Docking Study of Neomycin and Omeprazole at Binding Site of MsrA Protein
From the docking study, neomycin showed a binding affinity of −7.21 kcal/mol compared to erythromycin, which showed a docking score of −5.91 kcal/mol. Neomycin formed six hydrogen bonds, an H-Pi interaction with Tyr280, an ionic bonding interaction with Glu193, and eight hydrophobic interactions (Figure S1). Neomycin and erythromycin showed similar interactions at the same binding site of MsrA protein, forming H-bonding with Glu449 and Met450 and hydrophobic interactions with Glu446, Met450, Tyr280, Gln189, Tyr192, Ile442, and Glu193 residues (Figure 5, Table S6).
Omeprazole, on the other hand, was capable of docking at the MsrA protein as well, where it formed an H-bond interaction with Glu446 and nine hydrophobic interactions (Figure S1). It showed a docking score of −6.93 kcal/mol. Additionally, omeprazole showed similar bonds with erythromycin at the binding site of MsrA protein, where both compounds bind by hydrogen bonding interaction with Glu446, in addition to hydrophobic interactions with Glu446, Tyr280, Tyr192, Ile442, and Glu193 (Figure 5, Table S6).
2.9. Molecular Docking Study of Quinine, Fosfomycin and Ketoprofen at SAM-Binding Site of ErmC’ Protein
Quinine showed a consistent binding mode (docking energy score (ΔG) = −6.87 kcal/mol) to the co-crystallized ligand (SAM) (docking energy score (ΔG) = −8.58 kcal/mol), including two hydrogen bonding interactions with Glu59 and Gly38 residues of ErmC’, one ionic bonding interaction of amino group in quinine with Glu59, and seven hydrophobic interactions (Figure S2). Moreover, quinine and SAM can fit the SAM-binding site of ErmC’. It showed similar hydrogen bond interactions (with Glu59 and Gly38) and hydrophobic interactions when compared to SAM (Figure 6, Table S7).
On the other hand, molecular modeling studies showed that ketoprofen had a binding mode (docking energy score (ΔG) = −6.52 kcal/mol) compared to SAM (docking energy score (ΔG) = −8.58 kcal/mol). Ketoprofen interacted with Ile60 and Ile85 residues by hydrogen bonds; it also interacted by Pro103 by an H-Pi interaction and demonstrated five hydrophobic interactions (Figure S2). Ketoprofen and SAM fit the same binding site and showed similar interactions with Ile85 (H-bond) and all hydrophobic interactions except those with Asn11 and Asn101 (Figure 6, Table S7).
3. Discussion
Staphylococcus aureus is an opportunistic Gram-positive pathogen that causes a variety of clinical infections [49]. It is commonly isolated from infections in surgical sites, chronic ulcers, purulent cellulitis, and wounds [50]. It can spread throughout the body and affect organs, such as the brain, kidneys, hearts, muscles, bones, eyes, joints, and lungs [51].
In this study, 91 S. aureus isolates were collected from different clinical sources. Wounds were the most common source of infection (39.6%), followed by blood (33%) and nasal swabs (26.4%). Broncho-alveolar lavage was the least common type of specimen (1.1%). This finding is similar to that reported by Razeghi et al. [52], where wounds were the major source (43.4%), followed by blood (18.1%), among 490 S. aureus clinical isolates.
The antimicrobial susceptibility test demonstrated a high level of resistance to β-lactam antibiotics, such as amoxicillin-clavulanic acid (80%), oxacillin (69.2%), cefoxitin (94.5%), ceftazidime (96.7%), cefotaxime (64.8%), and cefepime (60.4%). A moderate level of resistance was observed towards aminoglycoside antibiotics, such as gentamicin (64.8%) and amikacin (38.5%), fluoroquinolones, such as ciprofloxacin (46.2%) and levofloxacin (37.4%), macrolides, such as erythromycin and azithromycin (57.1%), and clarithromycin (56%). Concerning clindamycin and quinapristin/dalfopristin, the resistance rates were 38.5% and 57.1%, respectively. The most effective antibiotics were linezolid and vancomycin (100%) and imipenem (71.4%) for the management of infections caused by S. aureus (Figure 2a, Table S1).
In the current study, 94.5% of S. aureus isolates were MRSA (Table S1). Similarly, a high frequency of MRSA has also been reported in Egypt (89.4%) [53], Peru (80%) [54], and Colombia (90%) [55]. Among S. aureus isolates collected in this study, 63.7% were multidrug-resistant (MDR) (Table S1), which is similar to the rate reported in Egypt (63%) [56].
The prevalence of cMLSB, iMLSB and MS resistance phenotypes among S. aureus isolates was 39.6%, 14.3%, and 2.2%, respectively (Figure 2b and Figure 3). A comparable rate of cMLSB was found by Kishk and co-authors (38.6%) [57]. The iMLSB prevalence is comparable to that reported in Egypt (13.64%) [57], Nepal (11.48%) [58], India (22.0%) [59], and Malaysia (22.1%) [60]. The incidence of the MS phenotype among our isolates is in accordance with that previously reported in Egypt (2.27%) [57], Jordan (2.82%) [61], Greece (2.90%) [62], and Ethiopia (1.26%) [63].
In this study, the inducible MLSB mechanism was less frequent than the constitutive mechanism, but both were associated with the presence of the erm genes. Target-site modification is encoded by erm genes that cause the methylation of 23S rRNA, resulting in resistance to the MLSB group [64]. The predominant gene among iMLSB isolates was the ermC gene (n = 10/13; 76.9%), followed by ermA (n = 2/13; 15.4%) and ermB (n = 1/13, 7.7%) (Table 1). In accordance with our findings, other studies reported the prevalence of the ermC gene among iMLSB isolates [61,65,66,67].
Compared to erm genes, lower percentages of msr-carrying isolates were identified (3.8%). The msr genes mediate the active efflux of macrolides and streptogramin B and reduce their intracellular concentrations [14]. Isolates containing the msr genes encoded the MS resistance phenotype and harbored the mphC gene (Table 1), as Lüthje and Schwarz revealed that the mphC gene often occurs linked to the msrA gene in S. aureus isolates [68,69,70,71]. Both the mph and mef genes encode macrolide phosphotransferase and macrolide efflux, respectively, which mediate specific resistance to macrolides [72].
Regarding lnu genes, they inactivate lincosamides by different types of lincosamide nucleotidyltransferases [73]. Among lnuA-carrying isolates, 42.9% had an iMLSB phenotype, 42.9% had a cMLSB phenotype, and 14.3% had an MS phenotype (Table 1). The prevalence of lnuA (13.5%) is comparable to that detected in China (18.4%) [74]. The lnuB gene was not detected among the tested isolates, which is in accordance with a study reported in Spain [75].
Screening for the inhibitory effect of the different compounds on erythromycin resistance against tested iMLSB isolates indicated that doxorubicin and neomycin significantly decreased (p-value < 0.05) the MIC of erythromycin (Figure 4, Table 2 and Table S2). In addition, the checkerboard method revealed that doxorubicin and neomycin showed synergistic effects when combined with erythromycin (Table 4). Doxorubicin, a DNA-methyltransferase inhibitor [48], can compete with sinefungin, a SAM-competitive inhibitor and a methyltransferase inhibitor [76,77,78] at the SAM-binding site of the ErmC’ protein (Figure 5, Table S5, Figure S1). This inhibits the methylation of the macrolide binding site of 23S rRNA in the 50S subunit. As a result, erythromycin can attach to the ribosome and prevent protein synthesis [79]. Although doxorubicin can bind to the SAM-binding site of the ErmC’ protein, it showed a weak inhibitory activity on inducible clindamycin resistance. According to Svetlov and co-authors, erythromycin binding to ribosomes depends on its ability to form a hydrogen bond with the adenine nucleotide at position 2058 of the 23S rRNA, which is crucial for its activity [80]. Unlike erythromycin, clindamycin forms many hydrogen bonds with numerous amino acids, including A2058, A2059, G2505, and A2503, and van der Waal bonds with C2452 and U2506. This is why N-6-methylation of A2058 is not a key factor when it comes to clindamycin binding to the 23S rRNA of the ribosome [81]. Meanwhile, both erythromycin and neomycin act as protein synthesis inhibitors as neomycin attaches to the 30S ribosomal subunit [82,83]. In addition, neomycin is a positively charged antibiotic that interacts with negative charges in the RNA at multiple distant sites, enabling the stabilization and preventing the unfolding of RNA structures [84].
Additionally, neomycin and omeprazole significantly reduced the MIC of erythromycin against isolates no. 36 and 38 (MS phenotype) (Figure 4, Table 2 and Table S3). They also possessed synergistic effects with FICI ≤ 0.5 (Table 4). This may be due to the interactions between both compounds and the MsrA protein (Figure 5, Table S6, Figure S1). The latter is an ABC transporter protein, which removes macrolides and streptogramin B from the cell, preventing them from reaching their target site on the ribosome [85]. Docking analysis showed that neomycin and omeprazole were capable of binding to the MsrA protein, competing with erythromycin at the active site of MsrA protein, blocking the release of erythromycin out of S. aureus, and allowing erythromycin to exert its inhibitory effect on protein synthesis [86]. In addition, the lipophilic nature of omeprazole plays an important role in its solubility in bacterial membranes and its ability to bind to MsrA protein [87,88]. Furthermore, neomycin showed the highest binding affinity, suggesting that neomycin had the highest inhibitory effect on erythromycin resistance compared to omeprazole.
In addition, quinine showed a 4–8-fold decrease in the MIC of clindamycin against tested iMLSB isolates (Table 3 and Table S4). In addition, quinine decreased the FICI of the clindamycin/erythromycin combination from 16.668 (antagonistic) to 0.56 (additive) against isolate no. 10 (Table 5). This effect may be related to the ability of quinine to bind to the ErmC’ protein (Figure 6 and Figure S2).
Additionally, the MIC of clindamycin was significantly lowered upon adding ketoprofen against all selected isolates (Table 3 and Table S4). Ketoprofen decreased FICIDA/E from 16.668 to 0.75 against isolate no. 10 (Table 5). There may be two reasons for their inhibitory effect on inducible clindamycin resistance: (i) ketoprofen fit at the SAM-binding site of ErmC’, as detected by docking analysis (Figure 6 and Figure S2). Furthermore, ketoprofen is considered a thiopurine S-methyltransferase inhibitor via non-competitive inhibition [42]; (ii) as previously detected, ketoprofen inhibited the adherence of S. aureus [40,41], which could be the cause of its synergistic effect with clindamycin (Table 5).
Moreover, a 2–4-fold reduction in the MIC of clindamycin was observed after the addition of fosfomycin against all tested isolates (Table 3 and Table S4). On the other hand, an additive effect was observed when fosfomycin was combined with clindamycin and erythromycin, with FICIDA/E falling from 16.668 to 0.56, as shown in Table 5. The good binding affinity of fosfomycin to ErmC’ (Figure 6 and Figure S2) and the synergism observed between fosfomycin and clindamycin (Table 5) could represent an explanation for the inhibitory effect of fosfomycin on inducible clindamycin resistance. The synergistic effect of the fosfomycin/clindamycin combination may be due to the cell wall inhibiting activity of fosfomycin that facilitates the entry of clindamycin into the bacterial cell, which in turn prevents the synthesis of bacterial proteins by targeting the 23S rRNA of the bacterial ribosome [89].
Molecular modeling studies showed that quinine, ketoprofen, and fosfomycin formed H-bond and hydrophobic interactions with key amino acids at the SAM-binding site of the ErmC’ protein (Table S7). This binding inhibits N-6 methylation of A2058 at the macrolides-binding site of 23S rRNA in 50S ribosomal subunit, thus allowing clindamycin to bind to its binding site on the ribosome and decreasing inducible clindamycin resistance [90]. In brief, quinine achieved the highest binding affinity, indicating that quinine had the highest inhibitory activity on inducible clindamycin resistance. Conversely, fosfomycin had the lowest effect.
4. Materials and Methods
4.1. Isolation and Identification of S. aureus Clinical Isolates
A total of 99 staphylococcal isolates were collected from different clinical sources (blood, wounds, nasal swabs, and broncho-alveolar lavage) over a period of 7 months from July 2018 to January 2019 from different hospitals near Mansoura University, Egypt. The study was approved by the Research Ethics Committee, Faculty of Pharmacy, Mansoura University (code no.: 2022-194). Standard procedures were followed for the isolation and identification of S. aureus from clinical specimens [91]. The purified S. aureus specimens were deposited as glycerol stocks at collection number MRCC6423 at the Microbial Resistant Culture Collection, Mansoura University, Egypt.
4.2. Antimicrobial Susceptibility Testing
The antimicrobial susceptibility of S. aureus clinical isolates to different classes of antimicrobial agents, including amoxicillin/clavulanic acid (30 μg), oxacillin (1 μg), cefoxitin (30 μg), ceftazidime (30 μg), cefotaxime (30 μg), cefepime (30 μg), imipenem (10 μg), gentamicin (10 μg), amikacin (30 μg), ciprofloxacin (5 μg), levofloxacin (5 μg), erythromycin (15 μg), azithromycin (15 μg), clarithromycin (15 μg), clindamycin (2 μg), quinapristin/dalfopristin (15 μg), and linezolid (30 μg) was evaluated by the Kirby–Bauer disk diffusion method using Mueller–Hinton agar plates (Oxoid, Thermo Fisher, Basingstoke, UK), according to the criteria set by the Clinical and Laboratory Standards Institute (CLSI) [92]. Isolates with an inhibition zone diameter ≤ 21 mm with cefoxitin and an inhibition zone diameter ≤ 10 mm with oxacillin were identified as MRSA [92]. Moreover, the MIC of vancomycin was detected by the broth microdilution method using Mueller–Hinton broth microtitre plates (Oxoid, Thermo Fisher, Basingstoke, UK), according to CLSI [92].
According to the definitions proposed by Magiorakos et al. [93], isolates that showed resistance to at least one agent in three or more antimicrobial classes were considered MDR. Extensive drug resistance (XDR) was identified as resistance to at least one agent in all antimicrobial classes except two or fewer. Furthermore, pandrug resistance (PDR) was identified as resistance to all agents in all antimicrobial classes.
4.3. Phenotypic Detection of MLSB Phenotypes
The Mueller–Hinton agar plate was inoculated with an overnight culture of S. aureus isolates diluted to 0.5 McFarland. For detection of inducible clindamycin resistance, an erythromycin (15 μg) disk was placed at a distance of 15 mm (edge to edge) from the clindamycin (2 μg) disk. Then, these plates were incubated at 37 °C for 24 h.
Different MLSB-resistance phenotypes were detected among S. aureus isolates [94]: (i) cMLSB phenotypes, including the R phenotype, where isolates were resistant to both erythromycin and clindamycin, and the HD phenotype, in which there were two growth zones around the clindamycin disk, one zone with a light hazy growth up to the clindamycin disk and the other with heavy growth and showed “D”. (ii) iMLSB phenotypes, including the D phenotype, which showed a clear D zone around the clindamycin disk, and the D+ phenotype, in which tiny colonies were growing towards the clindamycin disk inside the D zone. (iii) The MS phenotype, in which isolates were sensitive to clindamycin but resistant to erythromycin without a D zone.
4.4. Detection of MLSB Determinants by PCR
The detection of 18 genes, including erm genes (ermA, ermB, and ermC), msr genes (msrA and msrB), lnu genes (lnuA and lnuB), and mph genes (mphC) was performed by PCR reaction among MLSB-resistant S. aureus isolates.
The PCR was carried out as indicated: 12.5 μL DreamTaq Green PCR Master Mix (2X) (Thermo Fisher Scientific, Waltham, MA, USA), 2 μL of bacterial DNA (10 pg–1 μg), 1 μL of each primer (Table S8), and 8.5 μL nuclease-free water (Thermo Fisher Scientific, Waltham, MA, USA), for a total of 25 μL per reaction. The PCR protocol began with an initial denaturation of DNA at 95 °C for 5 min. Thereafter, there were 35 cycles of denaturation at 95 °C for 30 s, annealing at temperatures indicated for each primer as listed in Table S1 for 30 s, and extension at 72 °C for 1 min. Finally, there was an extension step at 72 °C for 5 min. The negative control was the reaction without the DNA template. A gel documentation system (Model Gel Documentation 1.4, 1189, AccuLab, New York, USA) was used to visualize PCR products after electrophoresis using 2% w/v agarose gel stained with ethidium bromide and compared visually with 100 base plus DNA marker (Thermo Fisher Scientific, Waltham, MA, USA) [95].
4.5. Screening for the Effect of Different Compounds on Erythromycin Resistance
Twenty-one different compounds were tested, including efflux inhibitor (CCCP), natural compounds (caffeine, quinine, quinidine, emetine, and piperine), antimicrobial agents (fosfomycin, neomycin, ciprofloxacin, and cancidas), chemotherapeutic agents (doxorubicin, 5-fluorouracil, and cisplatin), NSAIDs (meloxicam and ketoprofen), a proton pump inhibitor (omeprazole), vitamins (vitamin D3 and vitamin K), antihypertensive drugs (verapamil and digoxin), and a sedative drug (diazepam) (Table S9). Erythromycin thiocyanate was kindly provided from ADWIA, Egypt. The other compounds were supplied by Sigma-Aldrich, St. Louis, MO, USA.
The MIC of erythromycin and the tested twenty-one compounds were determined by the broth microdilution method against selected S. aureus isolates no. 10 (D phenotype) and no. 36 (MS phenotype) [92]. Two-fold serial dilutions of erythromycin and tested compounds were prepared in a 96-well microtiter plate. The diluted overnight culture of 1.5 × 10⁵ CFU/well was added to each well. The MIC values of erythromycin alone and in the presence of sub-inhibitory concentrations of the tested compounds were detected. The plates were incubated for 24 h at 37 °C. Wells containing culture with and without each tested compound were considered positive controls, while wells containing only broth were considered negative controls.
The compounds that exhibited inhibitory activity on erythromycin resistance against isolate no. 10 were further evaluated against isolates no. 14 and 27 (D phenotype) and no. 13 and 28 (D+ phenotype). Moreover, the compounds that elicited an inhibitory effect on erythromycin resistance against isolate no. 36 were similarly assessed against isolate no. 38 (MS phenotype).
4.6. Screening for the Effect of Different Compounds on Inducible Clindamycin Resistance
Isolate no. 10 (D phenotype) was selected for the preliminary screening of the activity of different tested compounds as potential inhibitors of inducible clindamycin resistance.
4.6.1. Induction of Clindamycin Resistance by Erythromycin
Inducible clindamycin resistance was determined by the modified broth microdilution method according to CLSI [92]. The MIC of clindamycin was assessed alone and in the presence of a fixed concentration of erythromycin (8 μg/mL) against isolate no. 10. In brief, the two-fold serial dilutions of clindamycin alone or with erythromycin (8 μg/mL) were inoculated with a diluted culture of a final concentration of 1.5 × 10⁵ CFU/well. Thereafter, the plates were incubated for 24 h at 37 °C. Positive controls (inoculum with and without erythromycin) and negative controls (only media) were included in each plate.
4.6.2. The Effect of Tested Compounds on Erythromycin-Induced Resistance to Clindamycin
The inhibitory activity of the tested compounds on inducible clindamycin resistance was determined using the broth microdilution method [92,96]. Determination of the MIC of clindamycin (in the presence of erythromycin (8 μg/mL)) was then repeated with the addition of a sub-inhibitory concentration of each tested compound. The plates were inoculated with diluted overnight culture (1.5 × 10⁵ CFU/well) of isolate no. 10. After that, plates were incubated at 37 °C for 24 h, including both positive and negative controls.
The compounds that showed inhibitory activity on inducible clindamycin resistance against isolate no. 10 were selected, and their activities were similarly evaluated against isolates no. 14 and 27 (D phenotype) and no. 13 and 28 (D+ phenotype).
4.7. Checkerboard Microdilution Method
Double combinations of erythromycin with potential inhibitors were tested against S. aureus isolate no. 10 (D phenotype) using the checkerboard microdilution method. Moreover, erythromycin was also combined with potential inhibitors against S. aureus isolate no. 36 (MS phenotype) in order to test the activity of these potential inhibitors on erythromycin resistance.
At the same time, three groups of combinations were performed, including (i) clindamycin with erythromycin, (ii) clindamycin with potential inhibitors, and (iii) clindamycin/erythromycin (8 μg/mL) with potential inhibitors against S. aureus isolate no. 10 (D phenotype) to evaluate the activity of these potential inhibitors on inducible clindamycin resistance.
Briefly, two-fold serial dilutions of antimicrobial agent (AMA) and potential inhibitor (PI) were prepared in sterile tubes. The concentrations used for each compound ranged from 1/8- to 4-fold the estimated MIC. Then, 50 μL of AMA was mixed with 50 μL of PI in a 96-well microtiter plate. Positive and negative controls were prepared for each combination. Finally, the plates were inoculated with a diluted culture of 1.5 × 10⁵ CFU/well and incubated for 24 h at 37 °C [97,98].
To evaluate the effect of the combinations, the MIC and FIC were calculated after overnight incubation. The combined effects were then determined based on FICI. For the combination of AMA and PI, FICI is calculated according to the following equation: FICI = FICAMA + FICPI, where FICAMA = MICAMA (in the presence of PI)/MICAMA(alone), and FICPI = MICPI (in the presence of AMA)/MICPI(alone). AMA was either clindamycin or clindamycin/erythromycin (8 μg/mL).
According to the European Committee on Antimicrobial Susceptibility Testing (EUCAST) [99], the data were assessed as follows: a synergistic effect is observed when FICI ≤ 0.5; an additive effect is observed when 0.5< FICI ≤ 1; an indifferent effect is observed when FICI is between 1 and 2; and an antagonistic effect is present when FICI ≥ 2.
4.8. Docking Studies
The molecular docking calculations were performed as in the literature [100] using the Molecular Operating Environment (MOE) version 2019.01 Chemical Computing Group Inc. software [101]. The crystallographic structure of erythromycin-resistance methyltransferase (ErmC’) was obtained from the RCSB Protein Data Bank (PDB) (entry 1QAQ) and (entry 1QAO) [79]. The gene encoding macrolide-streptogramin resistance protein (MsrA) was obtained and downloaded as predicted Alpha fold UniProtKB (entry Q9ZNK9) [102]. Both MsrA and ErmC’ were prepared for molecular docking by the 3D-protonation and energy minimization using the MOE software 2009. Additionally, the energy-minimized structure served as a docking receptor. The site finder algorithm in MOE was utilized to identify SAM-binding site. ChemBioOffice was used to create the two-dimensional structures of the synthesized compounds, which were built using fragment libraries in MOE 2019, and energy was minimized using the MMFF94x force field until a root-mean-square (RMS) gradient of 0.01 kcal/mol was achieved. Redocking of co-crystallized ligands at binding sites was utilized to validate the docking setup and to show that it was appropriate for the intended docking study, which is supported by the small root-mean-square deviation (RMSD) of 1.43 Å (<2 Å) between the docked poses and the co-crystallized ligands. In order to identify and assess the interactions between ligands and the SAM-binding site of ErmC’, docking was carried out with specific parameters (rescoring function 1 and rescoring function 2: London dG, placement: triangle matcher, retain: 2, and refinement: force field). Based on the S-score of sinefungin and RMSD values, the most effective hits were chosen. The retrieved compounds that have lower RMSD and higher S-values were recorded.
4.9. Statistical Analysis
GraphPad Prism 5 (GraphPad Software Incorporation, San Diego, CA, USA) was adopted for all statistical analyses. The two-tailed paired t-test was used to compare two groups when one group represents the effect before adding a potential inhibitor and the other group indicates the effect after its addition. Probability values (p-values) <0.05 were considered statistically significant.
5. Conclusions
Our results revealed a high prevalence of erythromycin resistance (57.1%). In addition, isolates with inducible resistance phenotypes were also detected among tested isolates (14.3%). This confirms the importance of identifying potential inhibitors of erythromycin and inducible clindamycin resistance. Doxorubicin, neomycin, and omeprazole decreased the MIC of erythromycin significantly. Moreover, they showed synergistic effects when combined with erythromycin. On the other hand, quinine, ketoprofen, and fosfomycin caused a noticeable decrease in the MIC of clindamycin. Furthermore, quinine and fosfomycin decreased FICIDA/E from 16.668 to 0.56, while ketoprofen reduced FICI DA/E from 16.668 to 0.75. All data were confirmed by docking analysis. Therefore, doxorubicin, neomycin, and omeprazole could be potential inhibitors of erythromycin resistance, while quinine, ketoprofen, and fosfomycin could be potential inhibitors of inducible clindamycin resistance. Further experiments are required to confirm the data by in vivo studies.
Supplementary Materials
The following supporting information can be downloaded at: https://www.mdpi.com/article/10.3390/antibiotics12030503/s1, Figure S1: The 2D interactions of sinefungin and doxorubicin at S-adenosyl-L-methionine (SAM) binding site of ErmC’ protein, and erythromycin, neomycin, and omeprazole at MsrA protein; Figure S2: The 2D interactions of SAM, quinine, ketoprofen, and fosfomycin at SAM-binding site of ErmC’ protein; Table S1: Antimicrobial susceptibility of tested S. aureus clinical isolates to different classes of antimicrobial agents; Table S2: Effect of different tested compounds on erythromycin resistance against S. aureus isolate no. 10 (D phenotype); Table S3: Effect of different tested compounds on erythromycin resistance against S. aureus isolate no. 36 (MS phenotype); Table S4: Effect of different tested compounds on inducible clindamycin resistance against S. aureus isolate no. 10 (D phenotype); Table S5: Docking results for sinefungin and doxorubicin binding at ErmC’ protein (PDB ID: 1QAQ); Table S6: Docking results for erythromycin, neomycin and omeprazole binding at MsrA protein (UniProtKB ID: Q9ZNK9); Table S7: Docking results for S-adenosyl-L-methionine (SAM), quinine, ketoprofen, and fosfomycin binding at ErmC’ protein (PDB ID: 1QAO). Table S8: Primers used for detection of macrolide-lincosamide-streptogramin B (MLSB)-resistance determinants; Table S9: Different compounds screened for their activity on erythromycin resistance and inducible clindamycin resistance. References [103,104,105,106,107,108,109,110,111] are cited in the supplementary materials.
Author Contributions
A.A.M. performed all the experimental work, M.I.S. suggested the topic and designed the experiments. M.I.S. and H.S.S. conceived, revised the manuscript, and provided useful suggestions. S.M.E. revised the docking part and analyzed the data. All authors have read and agreed to the published version of the manuscript.
Funding
This research received no external funding.
Institutional Review Board Statement
The study was approved by the Research Ethics Committee, Faculty of Pharmacy, Mansoura University (code no.: 2022-194).
Informed Consent Statement
Informed consent was obtained from all subjects involved in the study.
Data Availability Statement
All data generated or analyzed during this study are included in this published article and its supplementary information files. Other datasets generated during and/or analyzed during the current study are available from the corresponding author upon reasonable request.
Acknowledgments
All appreciation and gratitude are extended to Fathalla Belal, Analytical Chemistry, Faculty of Pharmacy, Mansoura University, for providing us with clindamycin. Great appreciation is extended to Fatma Abdel Bar, Pharmacognosy, Faculty of Pharmacy, Mansoura University, for providing us with quinine, caffeine, and quinidine. Thanks are extended to Mohamed Abu Habib, Pharmacognosy, Faculty of Pharmacy, Horus University in Egypt (HUE), for providing us with quinine and caffeine.
Conflicts of Interest
The authors declare no conflict of interest.
References
- Bitrus, A.; Peter, O.; Abbas, M.; Goni, M. Staphylococcus aureus: A review of antimicrobial resistance mechanisms. Vet. Sci. Res. J. 2018, 4, 43–54. [Google Scholar] [CrossRef]
- Tong, S.Y.; Davis, J.S.; Eichenberger, E.; Holland, T.L.; Fowler, V.G., Jr. Staphylococcus aureus infections: Epidemiology, pathophysiology, clinical manifestations, and management. Clin. Microbiol. Rev. 2015, 28, 603–661. [Google Scholar] [CrossRef] [PubMed] [Green Version]
- Becker, K. Pathogenesis of Staphylococcus aureus. In Staphylococcus Aureus, 1st ed.; Fetsch, A., Ed.; Elsevier: Berlin, Germany, 2018; pp. 13–38. [Google Scholar]
- Che Hamzah, A.M.; Yeo, C.C.; Puah, S.M.; Chua, K.H.; Chew, C.H. Staphylococcus aureus infections in Malaysia: A review of antimicrobial resistance and characteristics of the clinical isolates, 1990–2017. Antibiotics 2019, 8, 128. [Google Scholar] [CrossRef] [PubMed] [Green Version]
- Connolly, J.; Boldock, E.; Prince, L.R.; Renshaw, S.A.; Whyte, M.K.; Foster, S.J. Identification of Staphylococcus aureus factors required for pathogenicity and growth in human blood. Infect. Immun. 2017, 85, e00337-17. [Google Scholar] [CrossRef] [PubMed] [Green Version]
- David, M.Z.; Daum, R.S. Community-associated methicillin-resistant Staphylococcus aureus: Epidemiology and clinical consequences of an emerging epidemic. Clin. Microbiol. Rev. 2010, 23, 616–687. [Google Scholar] [CrossRef] [Green Version]
- Schönfeld, W.; Kirst, H.A. Macrolide Antibiotics; Springer Science & Business Media: Cham, Switzerland, 2002. [Google Scholar]
- Roberts, M.C.; Sutcliffe, J.; Courvalin, P.; Jensen, L.B.; Rood, J.; Seppala, H. Nomenclature for macrolide and macrolide-lincosamide-streptogramin B resistance determinants. Antimicrob. Agents Chemother. 1999, 43, 2823–2830. [Google Scholar] [CrossRef] [Green Version]
- Aktas, Z.; Aridogan, A.; Kayacan, C.B.; Aydin, D. Resistance to macrolide, lincosamide and streptogramin antibiotics in staphylococci isolated in Istanbul, Turkey. J. Microbiol. 2007, 45, 286–290. [Google Scholar]
- Reynolds, E.; Ross, J.I.; Cove, J.H. Msr (A) and related macrolide/streptogramin resistance determinants: Incomplete transporters? Int. J. Antimicrob. Agents 2003, 22, 228–236. [Google Scholar] [CrossRef]
- Luna, V.A.; Coates, P.; Eady, E.A.; Cove, J.H.; Nguyen, T.T.; Roberts, M.C. A variety of gram-positive bacteria carry mobile mef genes. J. Antimicrob. Chemother. 1999, 44, 19–25. [Google Scholar] [CrossRef]
- Matsuoka, M.; Inoue, M.; Endo, Y.; Nakajima, Y. Characteristic expression of three genes, msr (A), mph (C) and erm (Y), that confer resistance to macrolide antibiotics on Staphylococcus aureus. FEMS Microbiol. Lett. 2003, 220, 287–293. [Google Scholar] [CrossRef] [Green Version]
- Zelazny, A.M.; Ferraro, M.J.; Glennen, A.; Hindler, J.F.; Mann, L.M.; Munro, S.; Murray, P.R.; Reller, L.B.; Tenover, F.C.; Jorgensen, J.H. Selection of strains for quality assessment of the disk induction method for detection of inducible clindamycin resistance in staphylococci: A CLSI collaborative study. J. Clin. Microbiol. 2005, 43, 2613–2615. [Google Scholar] [CrossRef] [Green Version]
- Leclercq, R. Mechanisms of resistance to macrolides and lincosamides: Nature of the resistance elements and their clinical implications. Clin. Infect. Dis. 2002, 34, 482–492. [Google Scholar] [CrossRef] [PubMed] [Green Version]
- Saribas, Z.; Tunckanat, F.; Pinar, A. Prevalence of erm genes encoding macrolide-lincosamide-streptogramin (MLS) resistance among clinical isolates of Staphylococcus aureus in a Turkish university hospital. Clin. Microbiol. Infect. 2006, 12, 797–799. [Google Scholar] [CrossRef] [Green Version]
- Lina, G.; Quaglia, A.; Reverdy, M.-E.; Leclercq, R.; Vandenesch, F.; Etienne, J. Distribution of genes encoding resistance to macrolides, lincosamides, and streptogramins among staphylococci. Antimicrob. Agents Chemother. 1999, 43, 1062–1066. [Google Scholar] [CrossRef] [PubMed] [Green Version]
- Ounissi, H.; Courvalin, P. Nucleotide sequence of the gene ereA encoding the erythromycin esterase in Escherichia coli. Gene 1985, 35, 271–278. [Google Scholar] [CrossRef]
- Chesneau, O.; Tsvetkova, K.; Courvalin, P. Resistance phenotypes conferred by macrolide phosphotransferases. FEMS Microbiol. Lett. 2007, 269, 317–322. [Google Scholar] [CrossRef]
- Petinaki, E.; Papagiannitsis, C. Resistance of Staphylococci to Macrolides-Lincosamides-Streptogramins B (MLS): Epidemiology and Mechanisms of Resistance. In Staphylococcus Aureus; InTech Open: Rijeka, Croatia, 2019; Volume 117. [Google Scholar] [CrossRef] [Green Version]
- Brisson-Noël, A.; Delrieu, P.; Samain, D.; Courvalin, P. Inactivation of lincosaminide antibiotics in Staphylococcus. Identification of lincosaminide O-nucleotidyltransferases and comparison of the corresponding resistance genes. J. Biol. Chem. 1988, 263, 15880–15887. [Google Scholar] [CrossRef]
- Allignet, J.; El Solh, N. Comparative analysis of staphylococcal plasmids carrying three streptogramin-resistance genes: vat–vgb–vga. Plasmid 1999, 42, 134–138. [Google Scholar] [CrossRef] [PubMed]
- Daurel, C.; Huet, C.; Dhalluin, A.; Bes, M.; Etienne, J.; Leclercq, R. Differences in potential for selection of clindamycin-resistant mutants between inducible erm (A) and erm (C) Staphylococcus aureus genes. J. Clin. Microbiol. 2008, 46, 546–550. [Google Scholar] [CrossRef] [Green Version]
- Drinkovic, D.; Fuller, E.R.; Shore, K.P.; Holland, D.J.; Ellis-Pegler, R. Clindamycin treatment of Staphylococcus aureus expressing inducible clindamycin resistance. J. Antimicrob. Chemother. 2001, 48, 315–316. [Google Scholar] [CrossRef] [Green Version]
- Siberry, G.K.; Tekle, T.; Carroll, K.; Dick, J. Failure of clindamycin treatment of methicillin-resistant Staphylococcus aureus expressing inducible clindamycin resistance in vitro. Clin. Infect. Dis. 2003, 37, 1257–1260. [Google Scholar] [CrossRef]
- Gould, I. Antibiotic resistance: The perfect storm. Int. J. Antimicrob. Agents 2009, 34, S2–S5. [Google Scholar] [CrossRef]
- Clancy, J.; Schmieder, B.J.; Petitpas, J.W.; Manousos, M.; Williams, J.A.; Faiella, J.A.; Girard, A.E.; Mcguirk, P.R. Assays to detect and characterize synthetic agents that inhibit the ErmC methyltransferase. J. Antibiot. 1995, 48, 1273–1279. [Google Scholar] [CrossRef] [PubMed] [Green Version]
- Ahirrao, P.; Tambat, R.; Chandal, N.; Mahey, N.; Kamboj, A.; Jain, U.K.; Singh, I.P.; Jachak, S.M.; Nandanwar, H.S. MsrA efflux pump inhibitory activity of Piper cubeba lf and its phytoconstituents against Staphylococcus aureus RN4220. Chem. Biodivers. 2020, 17, e2000144. [Google Scholar] [CrossRef] [PubMed]
- Figueredo, F.G.; Parente, R.E.L.; Cavalcante-Figueredo, M.R.; Figueiredo, J.G.; da Silva, R.L.P.; Ferreira Matias, E.F.; Silva, T.M.S.; Camara, C.A.; de Morais Oliveira-Tintino, C.D.; Tintino, S.R. Inhibition of Staphylococcus aureus TetK and MsrA efflux pumps by hydroxyamines derived from lapachol and norlachol. J. Bioenerg. Biomembr. 2021, 53, 149–156. [Google Scholar] [CrossRef]
- Smith, E.C.; Kaatz, G.W.; Seo, S.M.; Wareham, N.; Williamson, E.M.; Gibbons, S. The phenolic diterpene totarol inhibits multidrug efflux pump activity in Staphylococcus aureus. Antimicrob. Agents Chemother. 2007, 51, 4480–4483. [Google Scholar] [CrossRef] [Green Version]
- Fung, K.; Han, Q.; Ip, M.; Yang, X.; Lau, C.B.; Chan, B.C. Synergists from Portulaca oleracea with macrolides against methicillin-resistant Staphylococcus aureus and related mechanism. Hong Kong Med. J. 2017, 23, 38–42. [Google Scholar] [PubMed]
- Kaatz, G.W.; Seo, S.M.; Ruble, C.A. Efflux-mediated fluoroquinolone resistance in Staphylococcus aureus. Antimicrob. Agents Chemother. 1993, 37, 1086–1094. [Google Scholar] [CrossRef] [Green Version]
- Saber, N.; Kandala, N.J. The inhibitory effect of fluphenazinedecanoate and caffeine on Staphylococcus aureus efflux pumps. Curr. Res. Microbiol. Biotechnol. 2018, 6, 1530–1535. [Google Scholar]
- Kumar, A.; Khan, I.A.; Koul, S.; Koul, J.L.; Taneja, S.C.; Ali, I.; Ali, F.; Sharma, S.; Mirza, Z.M.; Kumar, M. Novel structural analogues of piperine as inhibitors of the NorA efflux pump of Staphylococcus aureus. J. Antimicrob. Chemother. 2008, 61, 1270–1276. [Google Scholar] [CrossRef] [Green Version]
- Vidaillac, C.; Guillon, J.; Arpin, C.; Forfar-Bares, I.; Ba, B.B.; Grellet, J.; Moreau, S.; Caignard, D.-H.; Jarry, C.; Quentin, C. Synthesis of omeprazole analogues and evaluation of these as potential inhibitors of the multidrug efflux pump NorA of Staphylococcus aureus. Antimicrob. Agents Chemother. 2007, 51, 831–838. [Google Scholar] [CrossRef] [PubMed] [Green Version]
- Tintino, S.R.; Morais-Tintino, C.D.; Campina, F.F.; Pereira, R.L.; Costa, M.d.S.; Braga, M.F.; Limaverde, P.W.; Andrade, J.C.; Siqueira-Junior, J.P.; Coutinho, H.D.M. Action of cholecalciferol and alpha-tocopherol on Staphylococcus aureus efflux pumps. EXCLI J. 2016, 15, 315–322. [Google Scholar] [PubMed]
- Tintino, S.R.; Oliveira-Tintino, C.D.; Campina, F.F.; Weslley Limaverde, P.; Pereira, P.S.; Siqueira-Junior, J.P.; Coutinho, H.D.; Quintans-Júnior, L.J.; da Silva, T.G.; Leal-Balbino, T.C. Vitamin K enhances the effect of antibiotics inhibiting the efflux pumps of Staphylococcus aureus strains. Med. Chem. Res. 2018, 27, 261–267. [Google Scholar] [CrossRef]
- Aeschlimann, J.R.; Dresser, L.D.; Kaatz, G.W.; Rybak, M.J. Effects of NorA inhibitors on in vitro antibacterial activities and postantibiotic effects of levofloxacin, ciprofloxacin, and norfloxacin in genetically related strains of Staphylococcus aureus. Antimicrob. Agents Chemother. 1999, 43, 335–340. [Google Scholar] [CrossRef] [PubMed] [Green Version]
- Bharate, J.B.; Singh, S.; Wani, A.; Sharma, S.; Joshi, P.; Khan, I.A.; Kumar, A.; Vishwakarma, R.A.; Bharate, S.B. Discovery of 4-acetyl-3-(4-fluorophenyl)-1-(p-tolyl)-5-methylpyrrole as a dual inhibitor of human P-glycoprotein and Staphylococcus aureus Nor A efflux pump. Org. Biomol. Chem. 2015, 13, 5424–5431. [Google Scholar] [CrossRef] [PubMed]
- Blanchard, C.; Brooks, L.; Beckley, A.; Colquhoun, J.; Dewhurst, S.; Dunman, P.M. Neomycin sulfate improves the antimicrobial activity of mupirocin-based antibacterial ointments. Antimicrob. Agents Chemother. 2016, 60, 862–872. [Google Scholar] [CrossRef] [Green Version]
- Rumynska, T.; Hural, A.; Konechnyi, Y.; Vynnytska, R.; Lozynskyi, A.; Salyha, Y.; Korniychuk, O.; Lesyk, R. Microbial biofilms and some aspects of anti-inflammatory drug use. Biopolym. Cell 2021, 37, 247–258. [Google Scholar] [CrossRef]
- Khalaf, A.; Kamal, M.; Mokhtar, S.; Mohamed, H.; Salah, I.; Abbas, R.; Ali, S.; Abd El-Baky, R.M. Antibacterial, anti-biofilm activity of some non-steroidal anti-inflammatory drugs and N-acetyl cysteine against some biofilm producing uropathogens. Am. J. Epidemiol. 2015, 3, 1–9. [Google Scholar] [CrossRef] [Green Version]
- Oselin, K.; Anier, K. Inhibition of human thiopurine S-methyltransferase by various nonsteroidal anti-inflammatory drugs in vitro: A mechanism for possible drug interactions. Drug Metab. Dispos. 2007, 35, 1452–1454. [Google Scholar] [CrossRef] [Green Version]
- Abreu, A.C.; Saavedra, M.J.; Simões, L.C.; Simões, M. Combinatorial approaches with selected phytochemicals to increase antibiotic efficacy against Staphylococcus aureus biofilms. Biofouling 2016, 32, 1103–1114. [Google Scholar] [CrossRef] [Green Version]
- Olateju, O.A.; Babalola, C.P.; Olubiyi, O.O.; Kotila, O.A.; Kwasi, D.A.; Oaikhena, A.O.; Okeke, I.N.J. Quinoline antimalarials increase the antibacterial activity of ampicillin. Front. Microbiol. 2021, 12, 556550. [Google Scholar] [CrossRef] [PubMed]
- Bodet, C., 3rd; Jorgensen, J.; Drutz, D. Antibacterial activities of antineoplastic agents. Antimicrob. Agents Chemother. 1985, 28, 437–439. [Google Scholar] [CrossRef] [PubMed] [Green Version]
- Peiris, V.; Oppenheim, B. Antimicrobial activity of cytotoxic drugs may influence isolation of bacteria and fungi from blood cultures. J. Clin. Pathol. 1993, 46, 1124–1125. [Google Scholar] [CrossRef] [PubMed] [Green Version]
- Gieringer, J.H.; Wenz, A.F.; Just, H.-M.; Daschner, F.D. Effect of 5-fluorouracil, mitoxantrone, methotrexate, and vincristine on the antibacterial activity of ceftriaxone, ceftazidime, cefotiam, piperacillin, and netilmicin. Chemotherapy 1986, 32, 418–424. [Google Scholar] [CrossRef]
- Yokochi, T.; Robertson, K.D. Doxorubicin inhibits DNMT1, resulting in conditional apoptosis. Mol. Pharmacol. 2004, 66, 1415–1420. [Google Scholar] [CrossRef]
- Chuang-Smith, O.N.; Schlievert, P.M. Staphylococcal Enterotoxin C Subtypes Are Differentially Associated with Human Infections and Immunobiological Activities. mSphere 2021, 6, e01153-20. [Google Scholar] [CrossRef]
- Mehraj, J.; Witte, W.; Akmatov, M.K.; Layer, F.; Werner, G.; Krause, G. Epidemiology of Staphylococcus aureus nasal carriage patterns in the community. Curr. Top. Microbiol. Immunol. 2016, 398, 55–87. [Google Scholar] [CrossRef]
- Kuehl, R.; Morata, L.; Meylan, S.; Mensa, J.; Soriano, A. When antibiotics fail: A clinical and microbiological perspective on antibiotic tolerance and persistence of Staphylococcus aureus. J. Antimicrob. Chemother. 2020, 75, 1071–1086. [Google Scholar] [CrossRef]
- Razeghi, M.; Saffarian, P.; Goudarzi, M. Incidence of inducible clindamycin resistance and antibacterial resistance genes variability in clinical Staphylococcus aureus strains: A two-year multicenter study in Tehran, Iran. Gene Rep. 2019, 16, 100411. [Google Scholar] [CrossRef]
- Ahmed, S.; Ahmed, S.; Mohamed, W.; Feky, M.; Daef, E.; Badary, M.; Hetta, H. Nosocomial vancomycin and methicillin resistant staphylococcal infections in intensive care units in Assiut University Hospitals. Egypt. J. Med. Microbiol. 2011, 20, 127–140. [Google Scholar]
- Guzmán-Blanco, M.; Mejía, C.; Isturiz, R.; Alvarez, C.; Bavestrello, L.; Gotuzzo, E.; Labarca, J.; Luna, C.M.; Rodríguez-Noriega, E.; Salles, M.J. Epidemiology of meticillin-resistant Staphylococcus aureus (MRSA) in Latin America. Int. J. Antimicrob. Agents 2009, 34, 304–308. [Google Scholar] [CrossRef]
- Jiménez Quiceno, J.N.; Ocampo Ríos, A.M.; Vanegas Múnera, J.M.; Rodríguez Tamayo, E.A.; Mediavilla, J.; Chen, L.; Muskus, C.; Vélez, L.; Rojas, C.; Restrepo Gouzy, A. CC8 MRSA strains harboring SCCmec Type IVc are predominant in Colombian hospitals. PLoS ONE 2012, 7, e38576. [Google Scholar] [CrossRef]
- Youssef, C.R.; Kadry, A.A.; Shaker, G.H.; El-Ganiny, A.M. The alarming association between antibiotic resistance and reduced susceptibility to biocides in nosocomial MRSA isolates from two regional hospitals in Egypt. Arch. Microbiol. 2021, 203, 3295–3303. [Google Scholar] [CrossRef] [PubMed]
- Kishk, R.M.; Anani, M.M.; Nemr, N.A.; Soliman, N.M.; Fouad, M.M. Inducible clindamycin resistance in clinical isolates of staphylococcus aureus in Suez Canal University Hospital, Ismailia, Egypt. J. Infect. Dev. Ctries. 2020, 14, 1281–1287. [Google Scholar] [CrossRef]
- Adhikari, R.; Shrestha, S.; Barakoti, A.; Amatya, R. Inducible clindamycin and methicillin resistant Staphylococcus aureus in a tertiary care hospital, Kathmandu, Nepal. BMC Infect. Dis. 2017, 17, 483. [Google Scholar] [CrossRef] [PubMed]
- Majhi, S.; Dash, M.; Mohapatra, D.; Mohapatra, A.; Chayani, N. Detection of inducible and constitutive clindamycin resistance among Staphylococcus aureus isolates in a tertiary care hospital, Eastern India. Avicenna J. Med. 2016, 6, 75–80. [Google Scholar] [CrossRef] [PubMed]
- Hamzah, A.M.C.; Yeo, C.C.; Puah, S.M.; Chua, K.H.; Rahman, N.I.A.; Abdullah, F.H.; Othman, N.; Chew, C.H. Tigecycline and inducible clindamycin resistance in clinical isolates of methicillin-resistant Staphylococcus aureus from Terengganu, Malaysia. J. Med. Microbiol. 2019, 68, 1299–1305. [Google Scholar] [CrossRef] [PubMed]
- Jarajreh, D.A.; Aqel, A.; Alzoubi, H.; Al-Zereini, W. Prevalence of inducible clindamycin resistance in methicillin-resistant Staphylococcus aureus: The first study in Jordan. J. Infect. Dev. Ctries. 2017, 11, 350–354. [Google Scholar] [CrossRef] [Green Version]
- Sarrou, S.; Malli, E.; Tsilipounidaki, K.; Florou, Z.; Medvecky, M.; Skoulakis, A.; Hrabak, J.; Papagiannitsis, C.C.; Petinaki, E. MLSB-resistant Staphylococcus aureus in central Greece: Rate of resistance and molecular characterization. Microb. Drug Resist. 2019, 25, 543–550. [Google Scholar] [CrossRef]
- Mama, M.; Aklilu, A.; Misgna, K.; Tadesse, M.; Alemayehu, E. Methicillin-and inducible clindamycin-resistant Staphylococcus aureus among patients with wound infection attending Arba Minch Hospital, South Ethiopia. Int. J. Microbiol. 2019, 2019, 2965490. [Google Scholar] [CrossRef] [PubMed] [Green Version]
- Maravic, G. Macrolide resistance based on the Erm-mediated rRNA methylation. Curr. Drug Targets Infect. Disord. 2004, 4, 193–202. [Google Scholar] [CrossRef]
- Elkammoshi, A.M.; Ghasemzadeh-Moghaddam, H.; Nordin, S.A.; Taib, N.M.; Subbiah, S.K.; Neela, V.; Hamat, R.A. A low prevalence of inducible macrolide, lincosamide, and streptogramin b resistance phenotype among methicillin-susceptible Staphylococcus aureus isolated from malaysian patients and healthy individuals. Jundishapur J. Microbiol. 2016, 9, e37148. [Google Scholar] [CrossRef] [Green Version]
- Pereira, J.N.d.P.; Rabelo, M.A.; Lima, J.L.d.C.; Neto, A.M.B.; Lopes, A.C.d.S.; Maciel, M.A.V. Phenotypic and molecular characterization of resistance to macrolides, lincosamides and type B streptogramin of clinical isolates of Staphylococcus spp. of a university hospital in Recife, Pernambuco, Brazil. Braz. J. Infect. Dis. 2016, 20, 276–281. [Google Scholar] [CrossRef] [PubMed] [Green Version]
- Cabrera, R.; Fernández-Barat, L.; Motos, A.; López-Aladid, R.; Vázquez, N.; Panigada, M.; Álvarez-Lerma, F.; López, Y.; Muñoz, L.; Castro, P. Molecular characterization of methicillin-resistant Staphylococcus aureus clinical strains from the endotracheal tubes of patients with nosocomial pneumonia. Antimicrob. Resist. Infect. Control 2020, 9, 43. [Google Scholar] [CrossRef] [PubMed]
- Lüthje, P.; Schwarz, S. Antimicrobial resistance of coagulase-negative staphylococci from bovine subclinical mastitis with particular reference to macrolide–lincosamide resistance phenotypes and genotypes. J. Antimicrob. Chemother. 2006, 57, 966–969. [Google Scholar] [CrossRef] [PubMed] [Green Version]
- Phaku, P.; Lebughe, M.; Strauß, L.; Peters, G.; Herrmann, M.; Mumba, D.; Mellmann, A.; Muyembe-Tamfum, J.-J.; Schaumburg, F. Unveiling the molecular basis of antimicrobial resistance in Staphylococcus aureus from the Democratic Republic of the Congo using whole genome sequencing. Clin. Microbiol. Infect. 2016, 22, 644.e1–644.e5. [Google Scholar] [CrossRef] [PubMed] [Green Version]
- Akpaka, P.E.; Roberts, R.; Monecke, S. Molecular characterization of antimicrobial resistance genes against Staphylococcus aureus isolates from Trinidad and Tobago. J. Infect. Public Health 2017, 10, 316–323. [Google Scholar] [CrossRef] [PubMed] [Green Version]
- Osman, M.; Al Nasbeh, A.; Rafei, R.; Mallat, H.; Achkar, M.; Dabboussi, F.; Hamze, M. Characterization of resistance genes to macrolides, lincosamides and streptogramins (MLS) among clinical isolates of Staphylococcus aureus in North Lebanon. Int. Arab. J. Antimicrob. Agents 2015, 5, 3. [Google Scholar] [CrossRef] [Green Version]
- Lüthje, P.; Schwarz, S. Molecular basis of resistance to macrolides and lincosamides among staphylococci and streptococci from various animal sources collected in the resistance monitoring program BfT-GermVet. Int. J. Antimicrob. Agents 2007, 29, 528–535. [Google Scholar] [CrossRef]
- Schwarz, S.; Shen, J.; Kadlec, K.; Wang, Y.; Michael, G.B.; Feßler, A.T.; Vester, B. Lincosamides, streptogramins, phenicols, and pleuromutilins: Mode of action and mechanisms of resistance. Cold Spring Harb. Perspect. Med. 2016, 6, a027037. [Google Scholar] [CrossRef] [PubMed] [Green Version]
- Liang, Y.; Tu, C.; Tan, C.; El-Sayed, M.A.E.-G.; Dai, M.; Xia, Y.; Liu, Y.; Zhong, L.-L.; Shen, C.; Chen, G. Antimicrobial resistance, virulence genes profiling and molecular relatedness of methicillin-resistant Staphylococcus aureus strains isolated from hospitalized patients in Guangdong Province, China. Infect. Drug Resist. 2019, 12, 447. [Google Scholar] [CrossRef] [PubMed] [Green Version]
- Ceballos, S.; Lozano, C.; Aspiroz, C.; Ruiz-Ripa, L.; Eguizábal, P.; Campaña-Burguet, A.; Cercenado, E.; López-Calleja, A.I.; Castillo, J.; Azcona-Gutiérrez, J.M. Beyond CC398: Characterisation of Other Tetracycline and Methicillin-Resistant Staphylococcus aureus Genetic Lineages Circulating in Spanish Hospitals. Pathogens 2022, 11, 307. [Google Scholar] [CrossRef] [PubMed]
- Yebra, M.J.; Sanchez, J.; Martin, C.G.; Hardisson, C.; Barbes, C. The effect of sinefungin and synthetic analogues on RNA and DNA methyltransferases from Streptomyces. J. Antibiot. 1991, 44, 1141–1147. [Google Scholar] [CrossRef] [PubMed] [Green Version]
- Miranda, T.B.; Cortez, C.C.; Yoo, C.B.; Liang, G.; Abe, M.; Kelly, T.K.; Marquez, V.E.; Jones, P.A. DZNep is a global histone methylation inhibitor that reactivates developmental genes not silenced by DNA methylation. Mol. Cancer Ther. 2009, 8, 1579–1588. [Google Scholar] [CrossRef] [Green Version]
- Barbes, C.; Sanchez, J.; Yebra, M.; Robert-Gero, M.; Hardisson, C. Effects of sinefungin and S-adenosylhomocysteine on DNA and protein methyltransferases from Streptomyces and other bacteria. FEMS Microbiol. Lett. 1990, 69, 239–243. [Google Scholar] [CrossRef]
- Schluckebier, G.; Zhong, P.; Stewart, K.D.; Kavanaugh, T.J.; Abad-Zapatero, C. The 2.2 Å structure of the rRNA methyltransferase ErmC′ and its complexes with cofactor and cofactor analogs: Implications for the reaction mechanism. J. Mol. Biol. 1999, 289, 277–291. [Google Scholar] [CrossRef]
- Svetlov, M.S.; Syroegin, E.A.; Aleksandrova, E.V.; Atkinson, G.C.; Gregory, S.T.; Mankin, A.S.; Polikanov, Y.S. Structure of Erm-modified 70S ribosome reveals the mechanism of macrolide resistance. Nat. Chem. Biol. 2021, 17, 412–420. [Google Scholar] [CrossRef]
- Dunkle, J.A.; Xiong, L.; Mankin, A.S.; Cate, J.H. Structures of the Escherichia coli ribosome with antibiotics bound near the peptidyl transferase center explain spectra of drug action. Proc. Natl. Acad. Sci. USA 2010, 107, 17152–17157. [Google Scholar] [CrossRef] [Green Version]
- Lando, D.; Cousin, M.A.; Ojasoo, T.; Raynaud, J.P. Paromomycin and dihydrostreptomycin binding to Escherichia coli ribosomes. Eur. J. Biochem. 1976, 66, 597–606. [Google Scholar] [CrossRef]
- Vázquez, D. Protein synthesis and translation inhibitors. In Inhibitors of Protein Biosynthesis, 30th ed.; Kleinzeller, A., Springer, G.F., Wittmann, H.G., Eds.; Springer: New York, NY, USA, 1979; pp. 1–14. [Google Scholar]
- Dahlberg, A.E.; Horodyski, F.; Keller, P. Interaction of neomycin with ribosomes and ribosomal ribonucleic acid. Antimicrob. Agents Chemother. 1978, 13, 331–339. [Google Scholar] [CrossRef] [Green Version]
- Sharkey, L.K.; Edwards, T.A.; O’Neill, A.J. ABC-F proteins mediate antibiotic resistance through ribosomal protection. MBio 2016, 7, e01975–e15. [Google Scholar] [CrossRef] [PubMed] [Green Version]
- Gibbons, S.; Oluwatuyi, M.; Kaatz, G.W. A novel inhibitor of multidrug efflux pumps in Staphylococcus aureus. J. Antimicrob. Chemother. 2003, 51, 13–17. [Google Scholar] [CrossRef] [Green Version]
- Gibbons, S. Anti-staphylococcal plant natural products. Nat. Prod. Rep. 2004, 21, 263–277. [Google Scholar] [CrossRef] [PubMed]
- Maton, P.N. Omeprazole. N. Engl. J. Med. 1991, 324, 965–975. [Google Scholar] [CrossRef] [PubMed]
- Spížek, J.; Řezanka, T. Lincomycin, clindamycin and their applications. Appl. Microbiol. Biotechnol. 2004, 64, 455–464. [Google Scholar] [CrossRef]
- Lee, H.J.; Jhang, S.T.; Jin, H.J. Potential Target Site for Inhibitors in MLSB Antibiotic Resistance. Antibiotics 2021, 10, 264. [Google Scholar] [CrossRef] [PubMed]
- Vandepitte, J.; Verhaegen, J.; Engbaek, K.; Piot, P.; Heuck, C.C.; Rohner, P.; Heuck, C. Basic Laboratory Procedures in Clinical Bacteriology; World Health Organization: Geneva, Switzerland, 2003.
- CLSI. Performance Standards for Antimicrobial Susceptibility Testing; Clinical and Laboratory Standards Institute: Wayne, PA, USA, 2021. [Google Scholar]
- Magiorakos, A.-P.; Srinivasan, A.; Carey, R.B.; Carmeli, Y.; Falagas, M.; Giske, C.; Harbarth, S.; Hindler, J.; Kahlmeter, G.; Olsson-Liljequist, B. Multidrug-resistant, extensively drug-resistant and pandrug-resistant bacteria: An international expert proposal for interim standard definitions for acquired resistance. Clin. Microbiol. Infect. 2012, 18, 268–281. [Google Scholar] [CrossRef] [Green Version]
- Steward, C.D.; Raney, P.M.; Morrell, A.K.; Williams, P.P.; McDougal, L.K.; Jevitt, L.; McGowan Jr, J.E.; Tenover, F.C. Testing for induction of clindamycin resistance in erythromycin-resistant isolates of Staphylococcus aureus. J. Clin. Microbiol. 2005, 43, 1716–1721. [Google Scholar] [CrossRef] [Green Version]
- Williams, J.G.; Kubelik, A.R.; Livak, K.J.; Rafalski, J.A.; Tingey, S.V. DNA polymorphisms amplified by arbitrary primers are useful as genetic markers. Nucleic Acids Res. 1990, 18, 6531–6535. [Google Scholar] [CrossRef] [Green Version]
- Tintino, S.R.; Morais-Tintino, C.D.; Campina, F.F.; Costa, M.d.S.; Menezes, I.R.; de Matos, Y.M.L.; Calixto-Júnior, J.T.; Pereira, P.S.; Siqueira-Junior, J.P.; Leal-Balbino, T.C. Tannic acid affects the phenotype of Staphylococcus aureus resistant to tetracycline and erythromycin by inhibition of efflux pumps. Bioorg. Chem. 2017, 74, 197–200. [Google Scholar] [CrossRef]
- Cetin, E.S.; Tekeli, A.; Ozseven, A.G.; Us, E.; Aridogan, B.C. Determination of in vitro activities of polymyxin B and rifampin in combination with ampicillin/sulbactam or cefoperazone/sulbactam against multidrug-resistant Acinetobacter baumannii by the E-test and checkerboard methods. Jpn. J. Infect. Dis. 2013, 66, 463–468. [Google Scholar] [CrossRef] [Green Version]
- Hsieh, M.H.; Chen, M.Y.; Victor, L.Y.; Chow, J.W. Synergy assessed by checkerboard a critical analysis. Diagn. Microbiol. Infect. Dis. 1993, 16, 343–349. [Google Scholar] [CrossRef] [PubMed]
- EUCAST. Terminology relating to methods for the determination of susceptibility of bacteria to antimicrobial agents. Clin. Microbiol. Infect. 2000, 6, 503–508. [Google Scholar] [CrossRef] [Green Version]
- Vilar, S.; Cozza, G.; Moro, S. Medicinal chemistry and the molecular operating environment (MOE): Application of QSAR and molecular docking to drug discovery. Curr. Top. Med. Chem. 2008, 8, 1555–1572. [Google Scholar] [CrossRef] [PubMed]
- Molecular Operating Environment (MOE), 2019.01, Chemical Computing Group ULC, 1010 Sherbrooke St. West, Suite#910, Montreal, QC, Canada, H3A 2R7. 2019. Available online: https://www.chemcomp.com/Products.htm (accessed on 20 January 2023).
- Matsuoka, M.; Endou, K.; Kobayashi, H.; Inoue, M.; Nakajima, Y. A plasmid that encodes three genes for resistance to macrolide antibiotics in Staphylococcus aureus. FEMS Microbiol. Lett. 1998, 167, 221–227. [Google Scholar] [CrossRef] [PubMed]
- Strommenger, B.; Kettlitz, C.; Werner, G.; Witte, W. Multiplex PCR assay for simultaneous detection of nine clinically relevant antibiotic resistance genes in Staphylococcus aureus. J. Clin. Microbiol. 2003, 41, 4089–4094. [Google Scholar] [CrossRef] [Green Version]
- Leclercq, R.; Bauduret, F.; Soussy, C. Selection of constitutive mutants of gram-positive cocci inducible resistant to macrolides, lincosamides and streptogramins (MLS): Comparison of the selective effects of the MLS. Pathol. Biol. 1989, 37, 568–572. [Google Scholar]
- Ross, J.; Eady, E.; Cove, J.; Cunliffe, W.; Baumberg, S.; Wootton, J. Inducible erythromycin resistance in staphlyococci is encoded by a member of the ATP-binding transport super-gene family. Mol. Microbiol. 1990, 4, 1207–1214. [Google Scholar] [CrossRef]
- Bozdogan, B.L.; Berrezouga, L.; Kuo, M.-S.; Yurek, D.A.; Farley, K.A.; Stockman, B.J.; Leclercq, R. A new resistance gene, linB, conferring resistance to lincosamides by nucleotidylation in Enterococcus faecium HM1025. Antimicrob. Agents Chemother. 1999, 43, 925–929. [Google Scholar] [CrossRef] [Green Version]
- Sutcliffe, J.; Grebe, T.; Tait-Kamradt, A.; Wondrack, L. Detection of erythromycin-resistant determinants by PCR. Antimicrob. Agents Chemother. 1996, 40, 2562–2566. [Google Scholar] [CrossRef] [Green Version]
- Allignet, J.; Loncle, V.; El Solh, N. Sequence of a staphylococcal plasmid gene, vga, encoding a putative ATP-binding protein involved in resistance to virginiamycin A-like antibiotics. Gene 1992, 117, 45–51. [Google Scholar] [CrossRef] [PubMed]
- Loncle, V.; Casetta, A.; Buu-Hoi, A.; El Solh, N. Analysis of pristinamycin-resistant Staphylococcus epidermidis isolates responsible for an outbreak in a Parisian hospital. Antimicrob. Agents Chemother. 1993, 37, 2159–2165. [Google Scholar] [CrossRef] [PubMed] [Green Version]
- Hammerum, A.M.; Jensen, L.B.; Aarestrup, F.M.l. Detection of the satA gene and transferability of virginiamycin resistance in Enterococcus faecium from food-animals. FEMS Microbiol. Lett. 1998, 168, 145–151. [Google Scholar] [CrossRef]
- Allignet, J.; Liassine, N.; El Solh, N. Characterization of a staphylococcal plasmid related to pUB110 and carrying two novel genes, vatC and vgbB, encoding resistance to streptogramins A and B and similar antibiotics. Antimicrob. Agents Chemother. 1998, 42, 1794–1798. [Google Scholar] [CrossRef] [PubMed] [Green Version]
Figure 1.
Mechanisms of S. aureus resistance to MLSB antibiotics. MLSB: macrolides-lincosamides-streptogramin B.
Figure 1.
Mechanisms of S. aureus resistance to MLSB antibiotics. MLSB: macrolides-lincosamides-streptogramin B.

Figure 2.
Antimicrobial resistance, phenotypic and genotypic detection of MLSB determinants. (a) Prevalence of antimicrobial resistance among the tested S. aureus clinical isolates. AMC: amoxicillin-clavulanic acid, OX: oxacillin, FOX: cefoxitin, CAZ: ceftazidime, CTX: cefotaxime, FEP: cefepime, IPM: imipenem, CN: gentamicin, AK: amikacin, CIP: ciprofloxacin, LEV: levofloxacin, CLR: clarithromycin, AZM: azithromycin, E: erythromycin, DA: clindamycin, RP: quinapristin/dalfopristin, LZD: linezolid, MLSB: macrolide-lincosamide-streptogramin B. (b) Distribution of different MLSB phenotypes among the tested S. aureus isolates. R: resistant to both erythromycin and clindamycin, HD: hazy D (HD) zone, two zones of growth around clindamycin disk, one zone with a light hazy growth up to clindamycin disk, and the second zone with heavy growth, showing D zone with two zones of growth around clindamycin disk, D: D zone positive with clear zone of D around clindamycin disk, D+: D zone positive with small colonies grew towards the clindamycin disk inside the D zone, MS: macrolide-streptogramin (MS) phenotype, resistant to erythromycin and sensitive to clindamycin without D zone. (c) Prevalence of MLSB-resistance genes among MLSB-resistant S. aureus isolates.

Figure 3.
MLSB phenotypes. (a) Isolate no. 47; R phenotype of constitutive MLSB (cMLSB) in tested S. aureus isolates, resistant to both clindamycin and erythromycin. (b) Isolate no. 12; HD phenotype of cMLSB in tested S. aureus, with two zones of growth around clindamycin disk, one zone with a light hazy growth up to clindamycin disk, and the second zone with heavy growth, showing D zone. (c) Isolate no. 10; D phenotype of inducible MLSB (iMLSB), with a clear D zone around clindamycin disk. (d) Isolate no. 15; D+ phenotype of iMLSB, which revealed a D-shaped zone with small colonies growing towards the clindamycin disk inside the D zone. (e) Isolate no. 36; MS phenotype in tested S. aureus isolates that showed resistance to erythromycin and susceptibility to clindamycin without any D zone. (f) Isolate no. 27; S phenotype, sensitive to both clindamycin and erythromycin.

Figure 4.
The effect of potential inhibitors on MIC of erythromycin among different MLSB phenotypes of S. aureus isolates. (a) The effect of potential inhibitors (quinine, fosfomycin, doxorubicin, neomycin, meloxicam, and ketoprofen) on erythromycin resistance against D phenotype isolates no. 10, 14, and 27. (b) The effect of potential inhibitors (quinine, fosfomycin, doxorubicin, neomycin, meloxicam, and ketoprofen) on erythromycin resistance against D+ phenotype isolates no. 13 and 28. (c) The effect of potential inhibitors (CCCP, caffeine, neomycin, meloxicam, ketoprofen, and omeprazole) on erythromycin resistance against MS phenotype isolates no. 36 and 38. MICs: minimum inhibitory concentrations, E: erythromycin, CCCP: carbonyl cyanide m-chlorophenylhydrazine, *: probability-value (p-value) is <0.05, which is considered statistically significant.

Figure 5.
The molecular docking results of sinefungin (SFG) and doxorubicin at S-adenosyl-L-methionine (SAM) binding site of ErmC’ protein, and erythromycin, neomycin, and omeprazole at MsrA protein. (a) 3D interaction of SFG (violet) at SAM-binding site of ErmC’. (b) 3D diagram of overlay view of doxorubicin (dark yellow) and SFG (violet) at SAM-binding site of ErmC’. (c) 3D representation of erythromycin (yellow) at active site of MsrA protein. (d) 3D representation of overlay view of neomycin (dark pink), erythromycin (yellow) at active site of MsrA protein. (e) 3D representation of overlay view of omeprazole (red) and erythromycin (yellow) at active site of MsrA protein. For clarity, non-interacting residues were deleted. Hydrogen bonds are shown in black, and arene hydrogen bonds are shown in dark blue (UniProtKB ID: Q9ZNK9).

Figure 6.
The molecular docking results of SAM, quinine, ketoprofen, and fosfomycin at the SAM-binding site of ErmC’ protein. (a) 3D diagram of SAM (red) at SAM-binding site of ErmC’. (b) 3D diagram of overlay view of quinine (green) and SAM (red) at SAM-binding site of ErmC’. (c) 3D diagram of overlay view of ketoprofen (magenta) and SAM (red) at SAM-binding site of ErmC’. (d) 3D diagram of overlay view of fosfomycin (cyan) and SAM (red) at SAM-binding site of ErmC’. For clarity, non-interacting residues were deleted. Hydrogen bonds are shown in black, and arene hydrogen bonds are shown in dark blue (PDB ID: 1QAO).


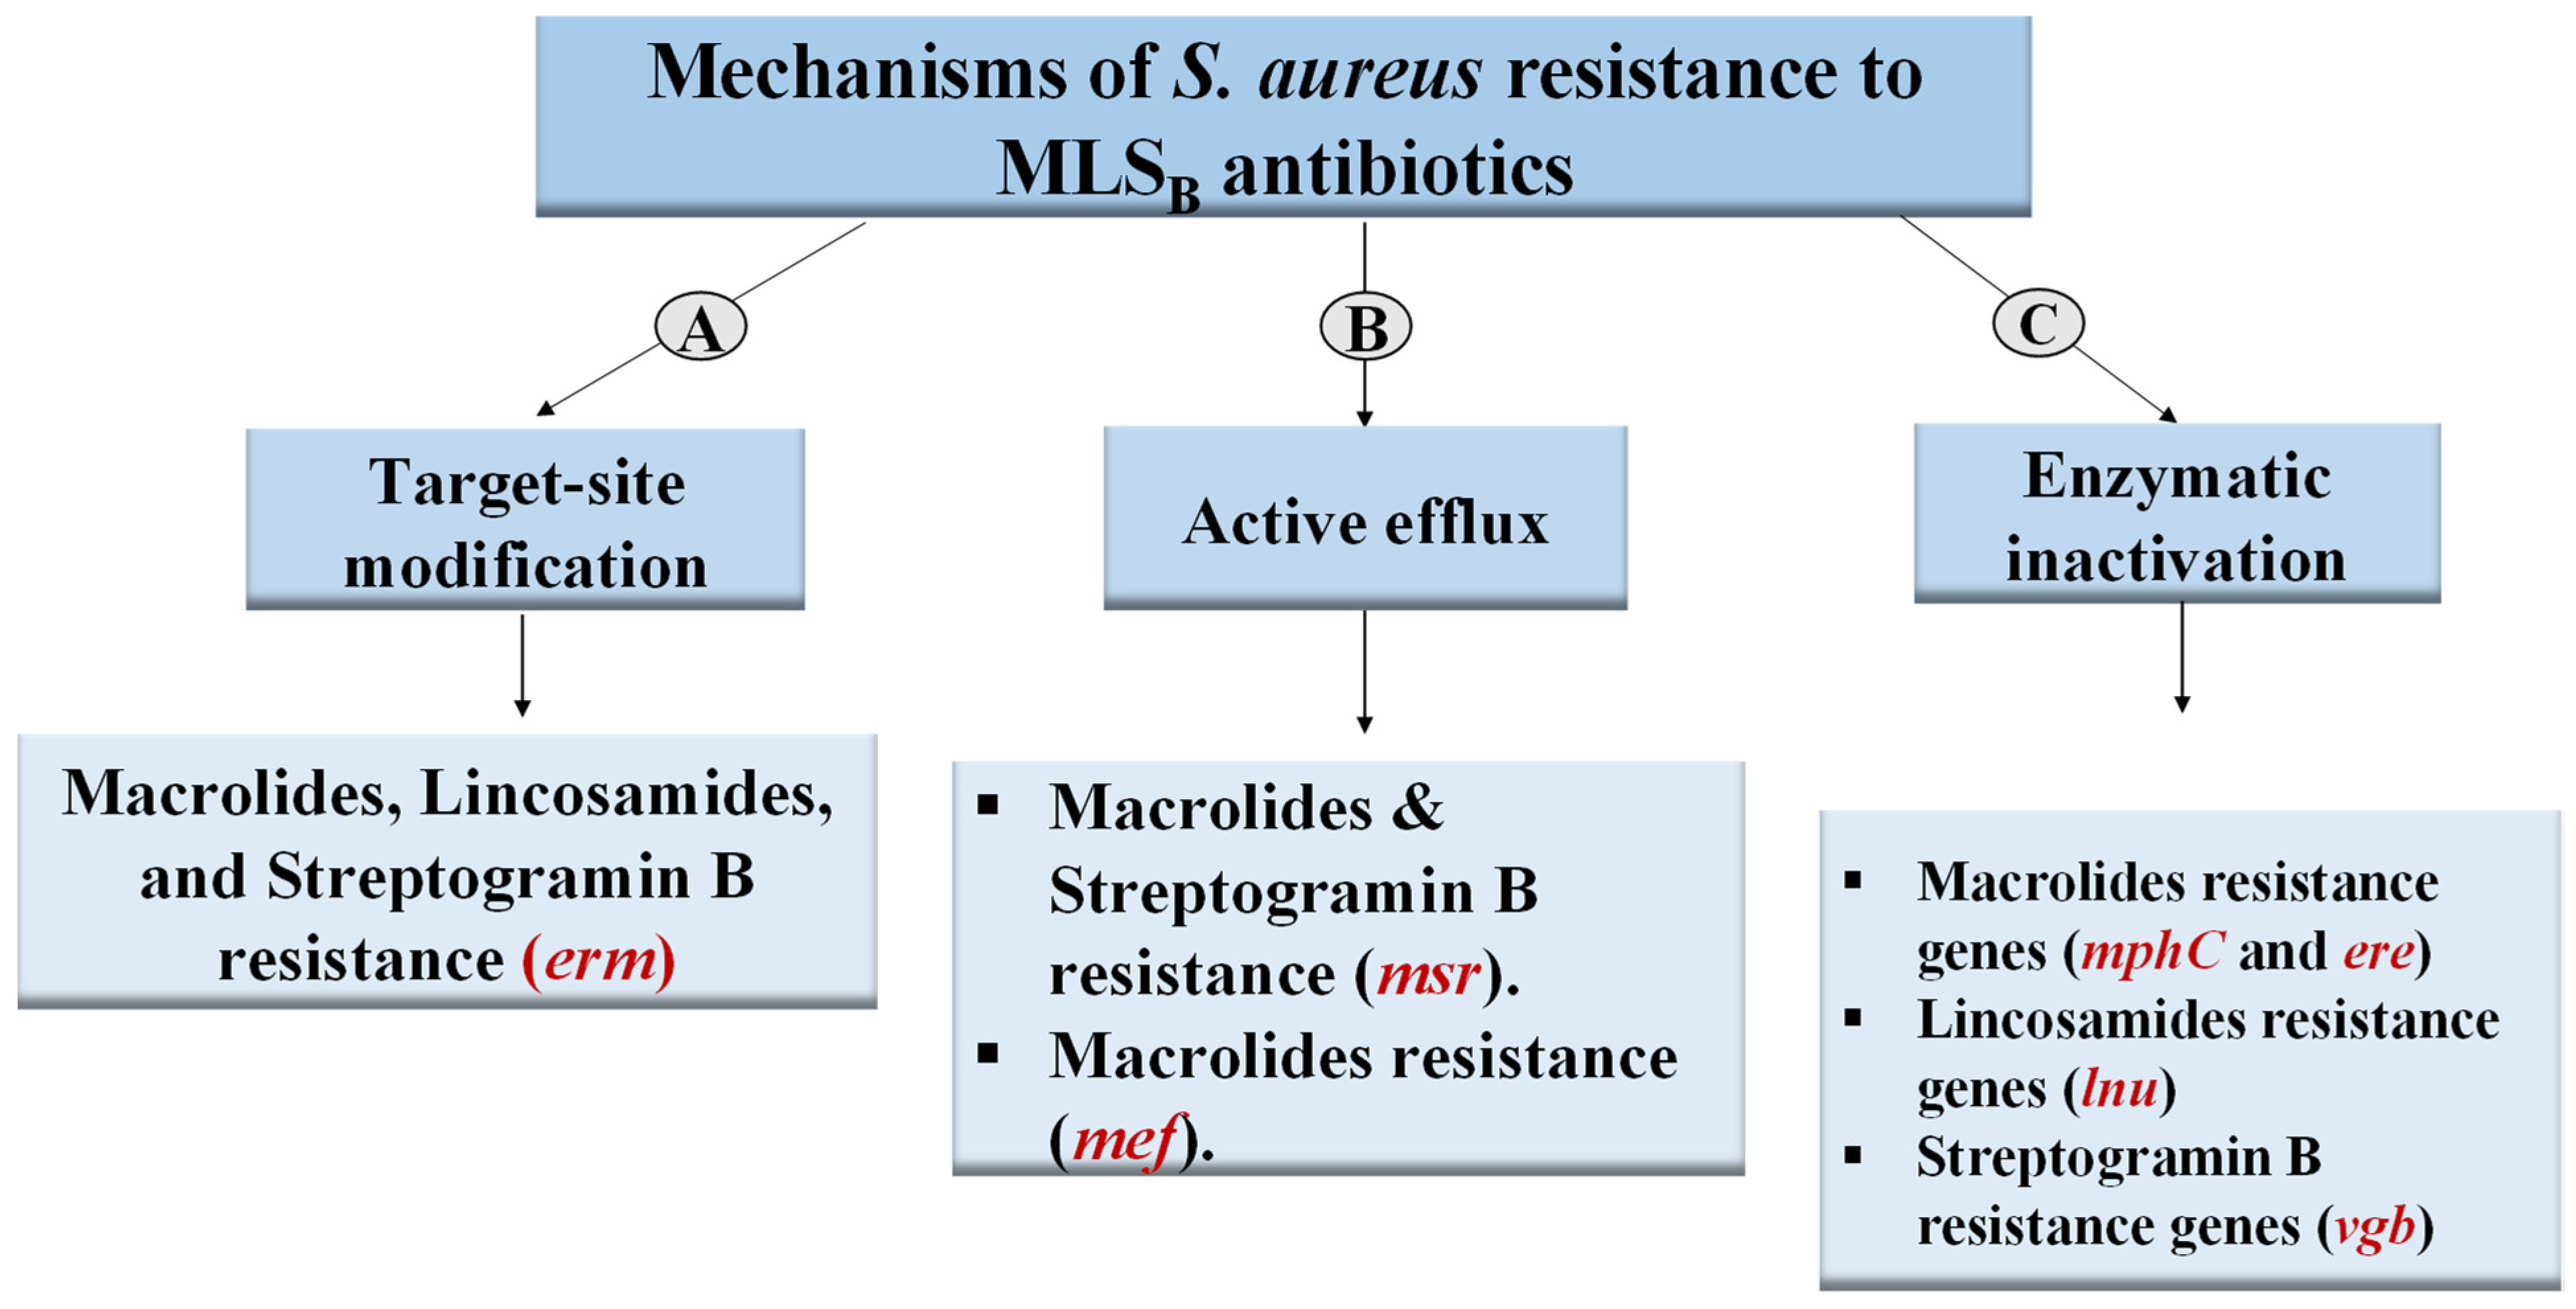
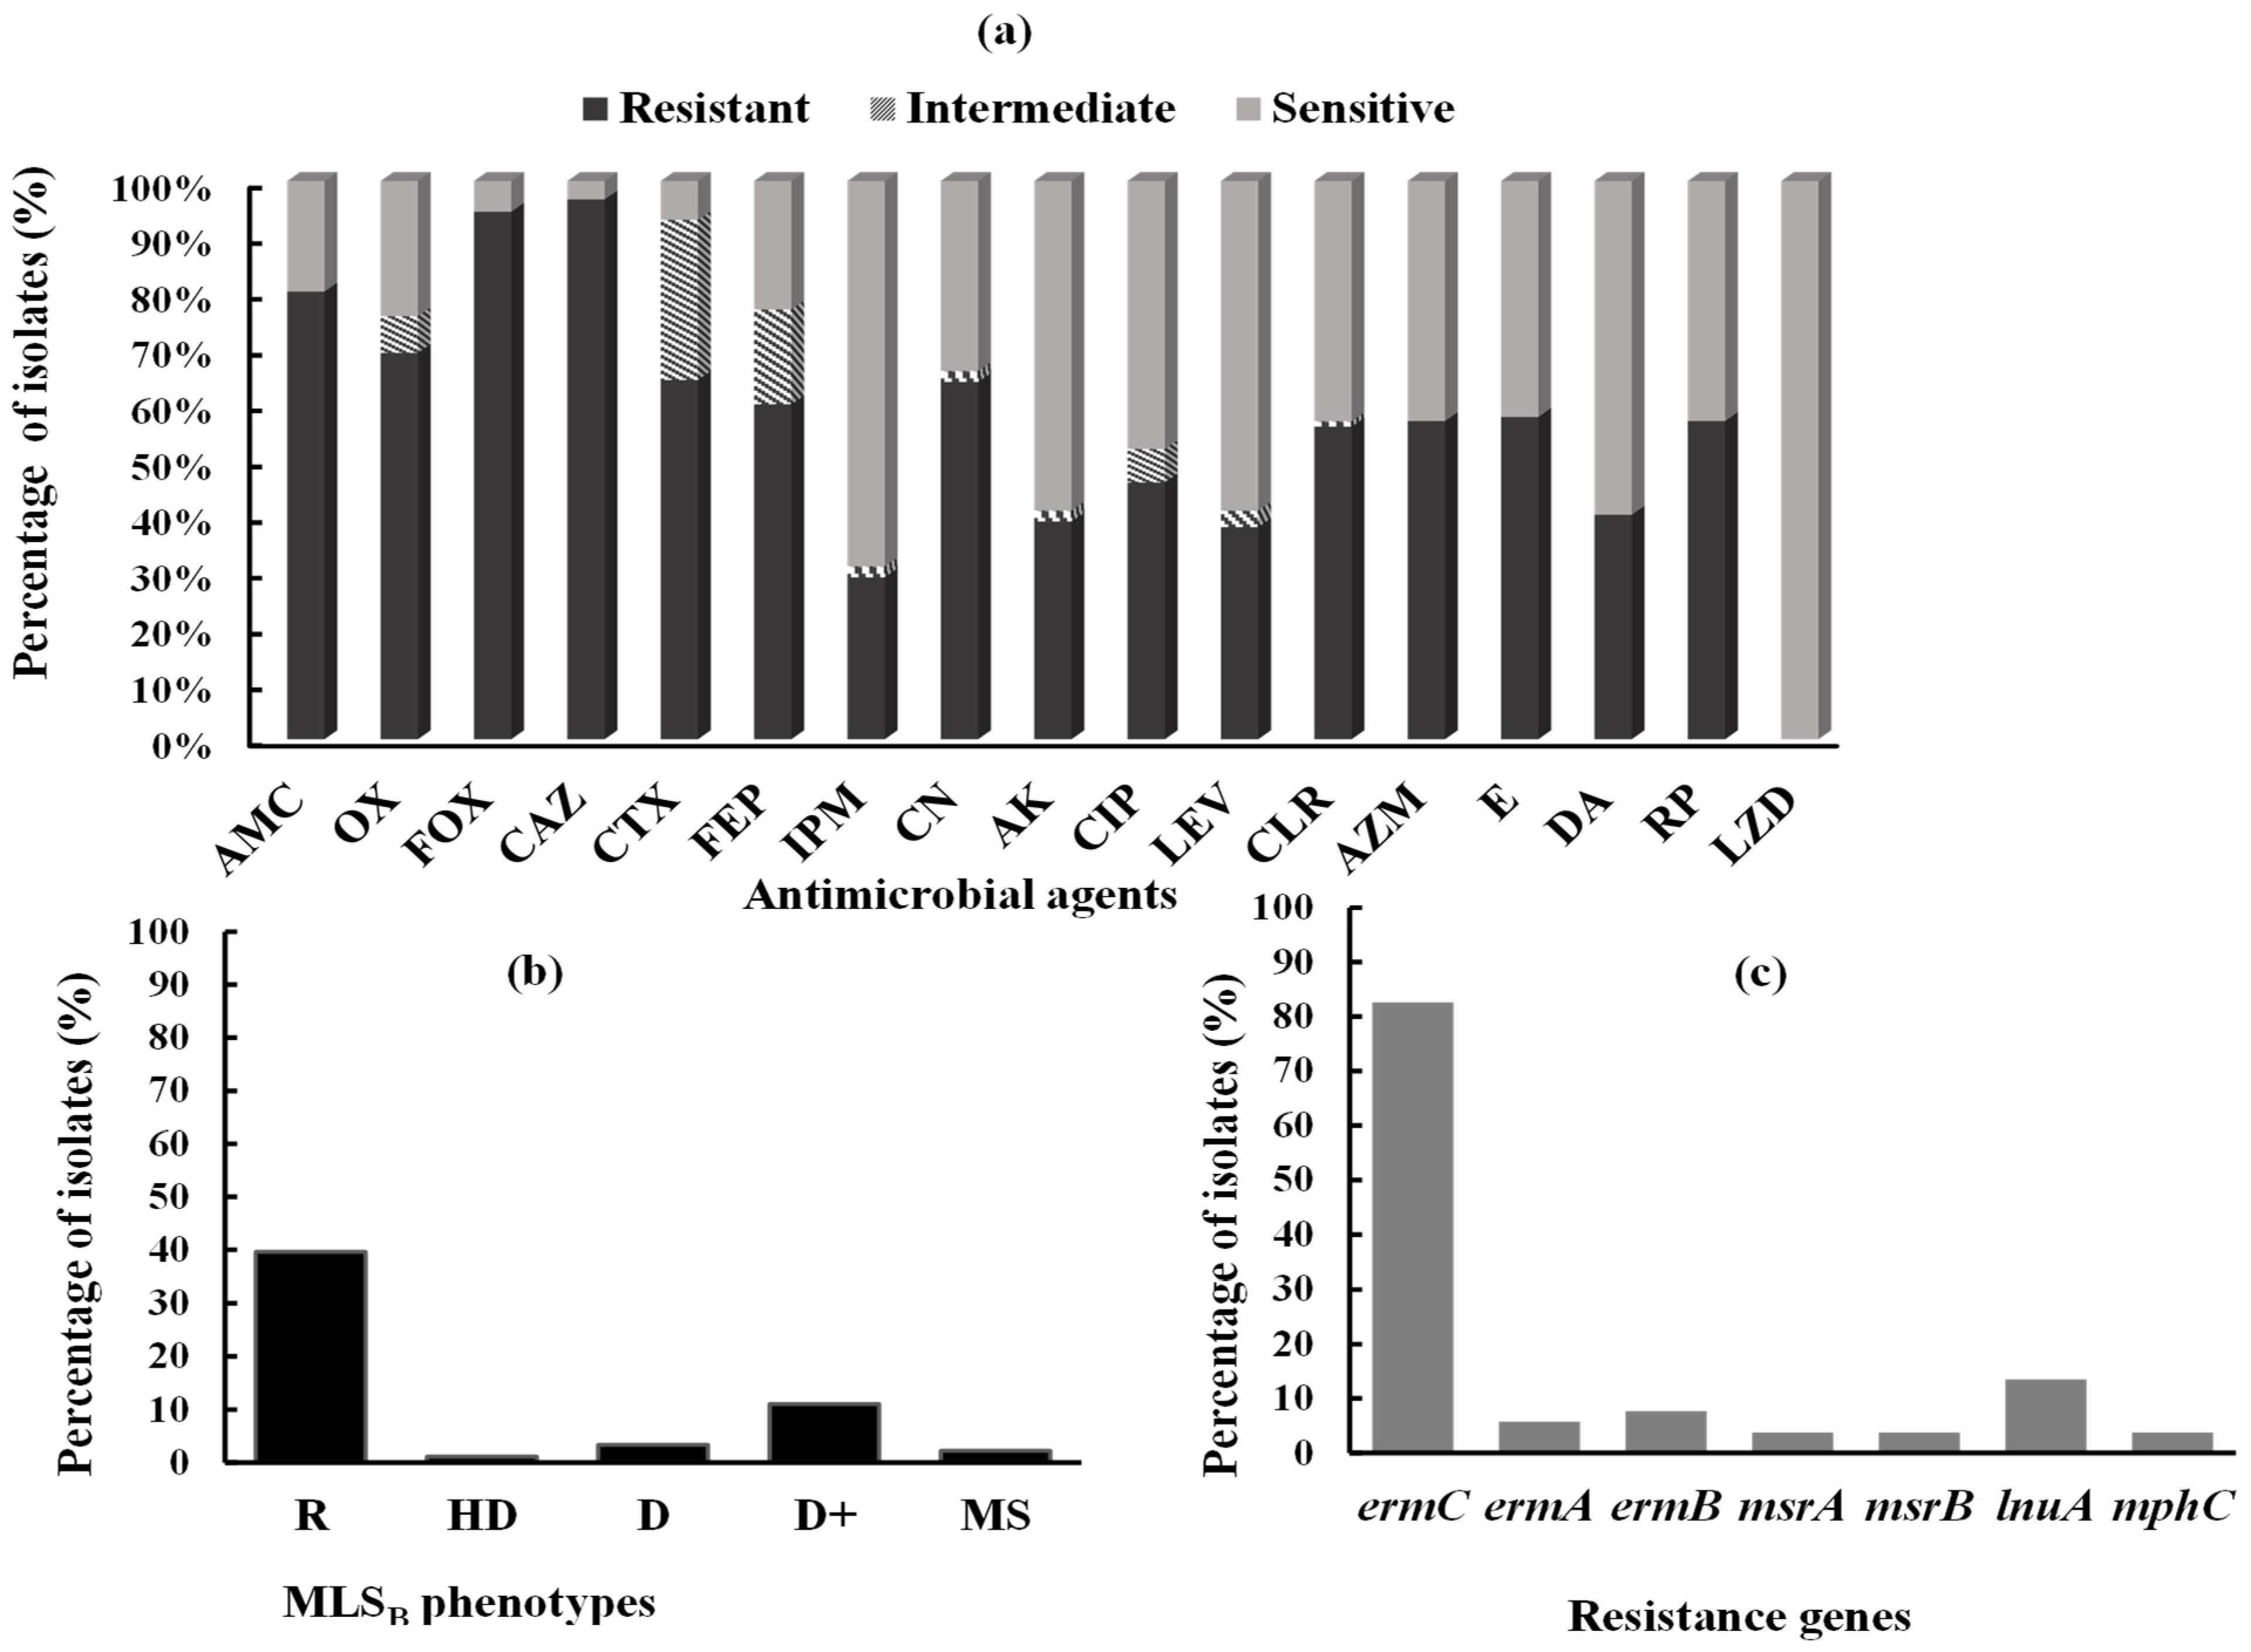
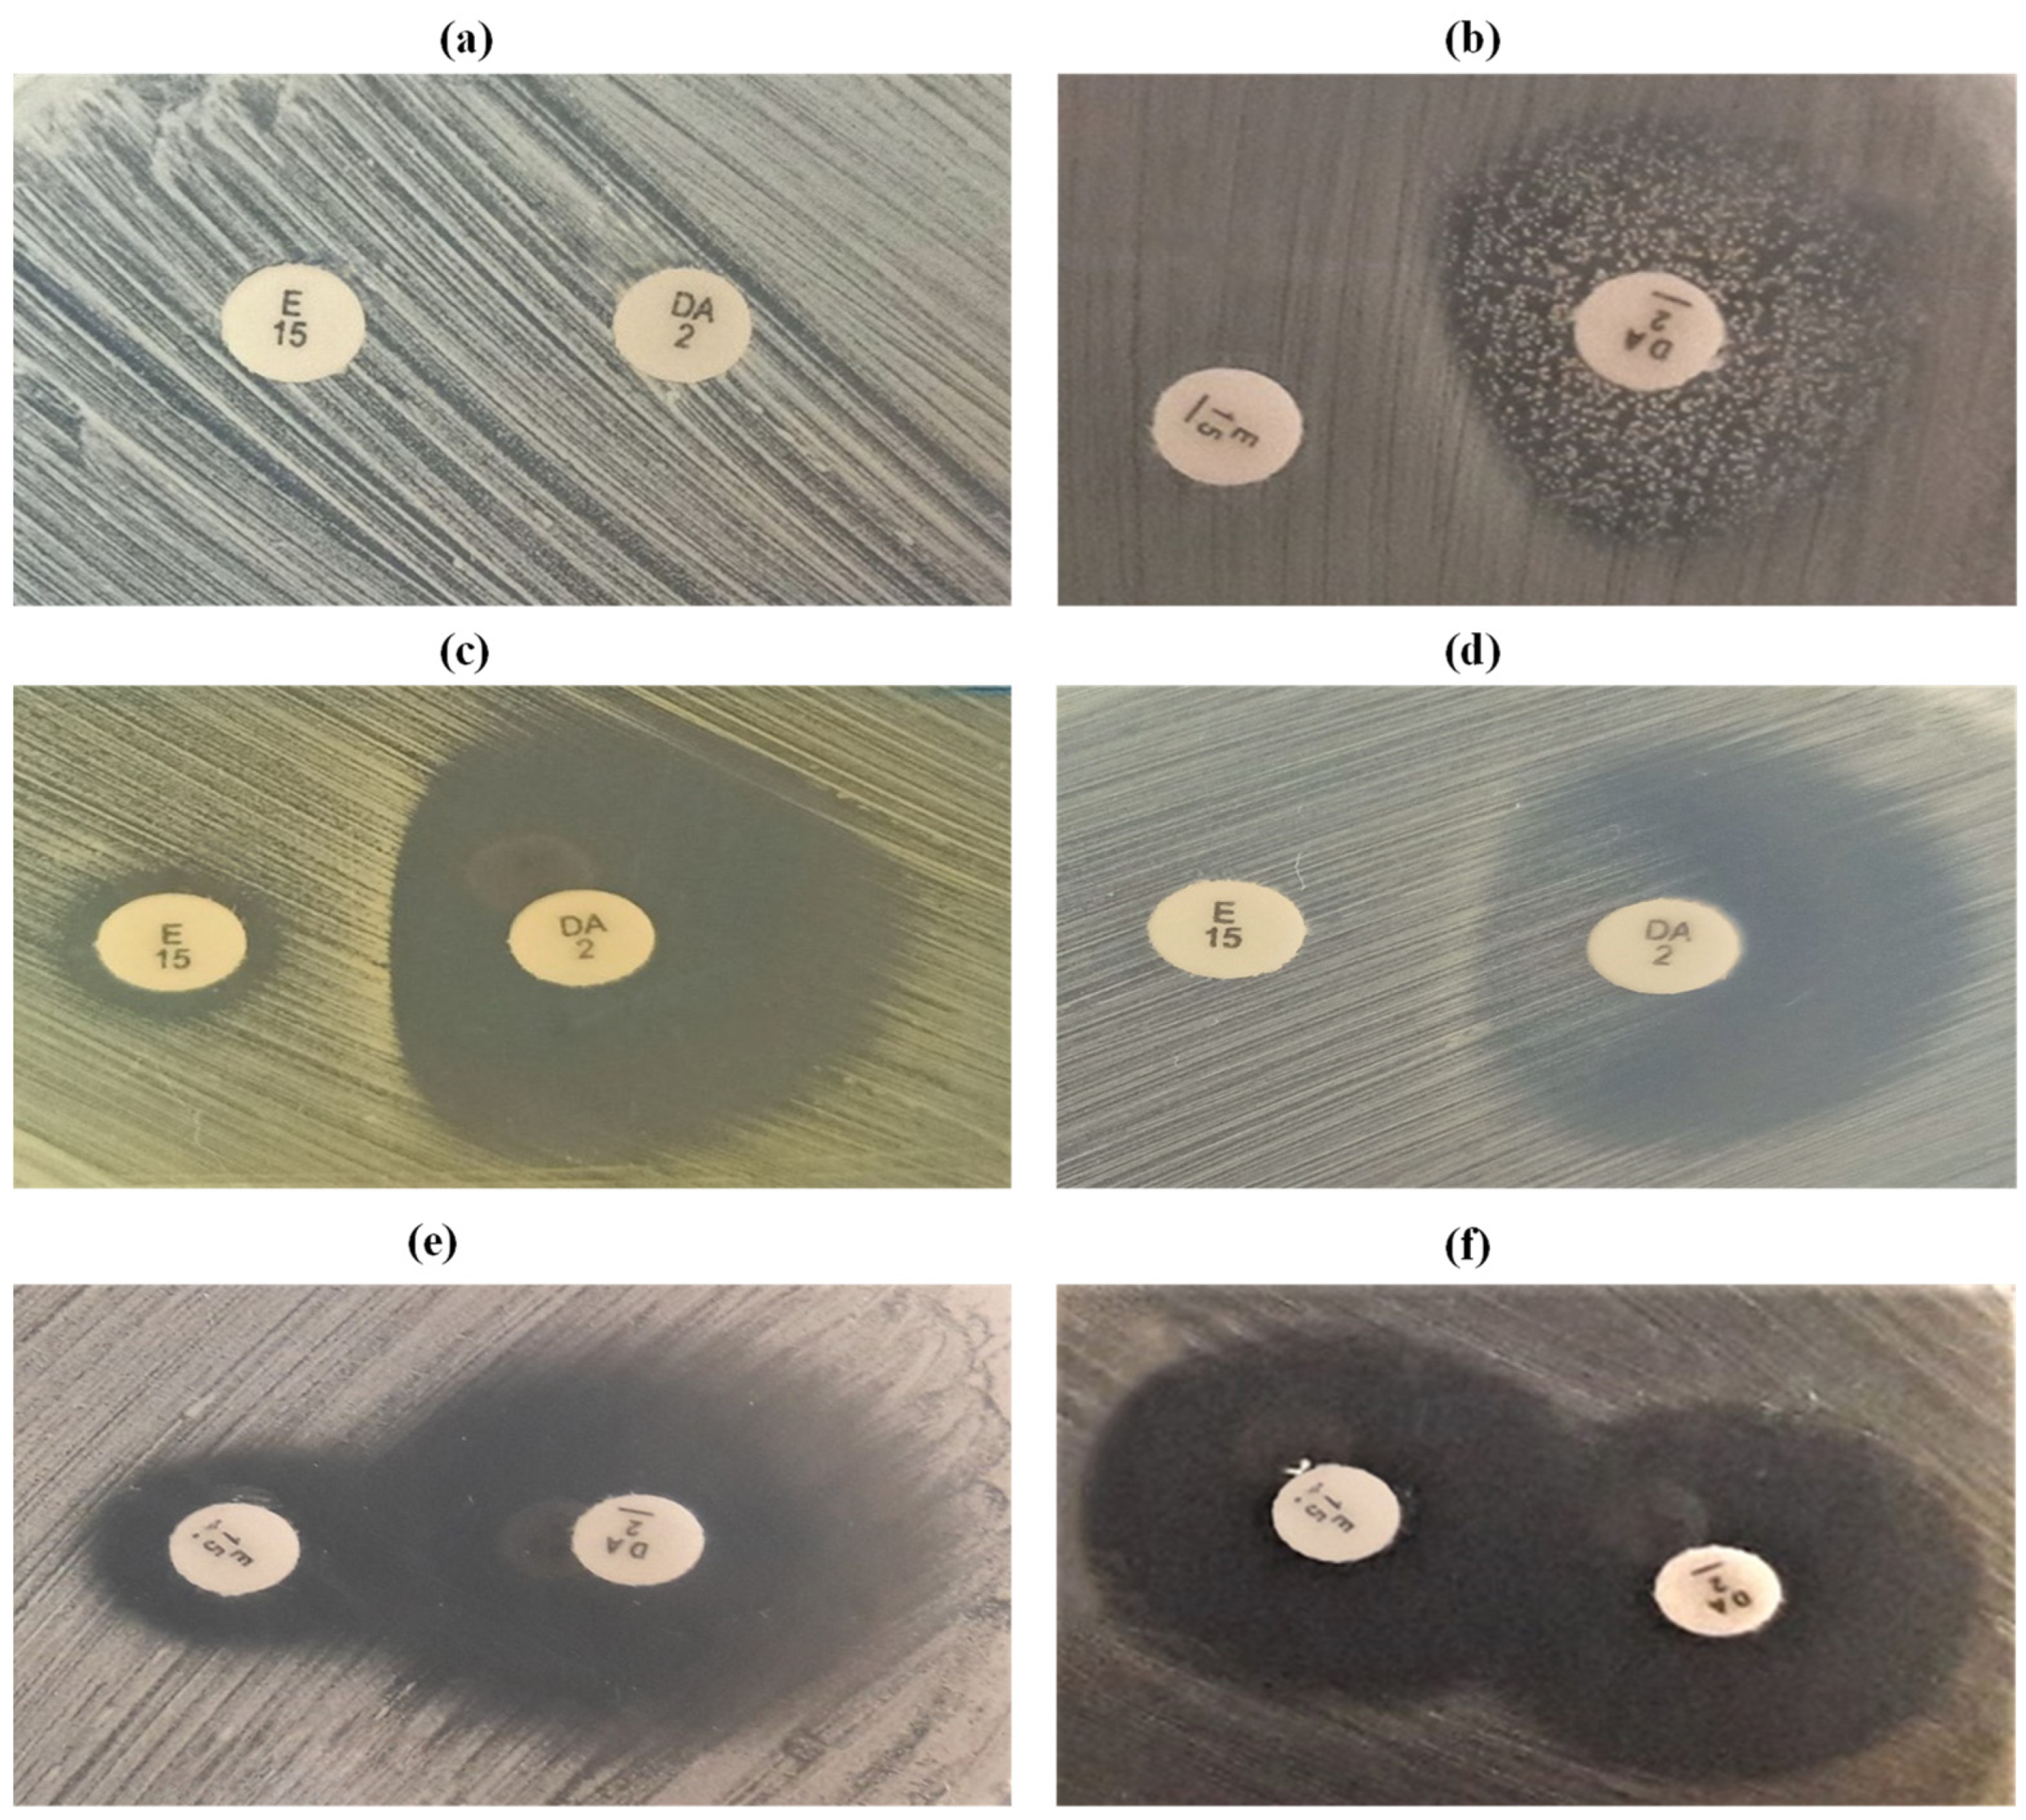
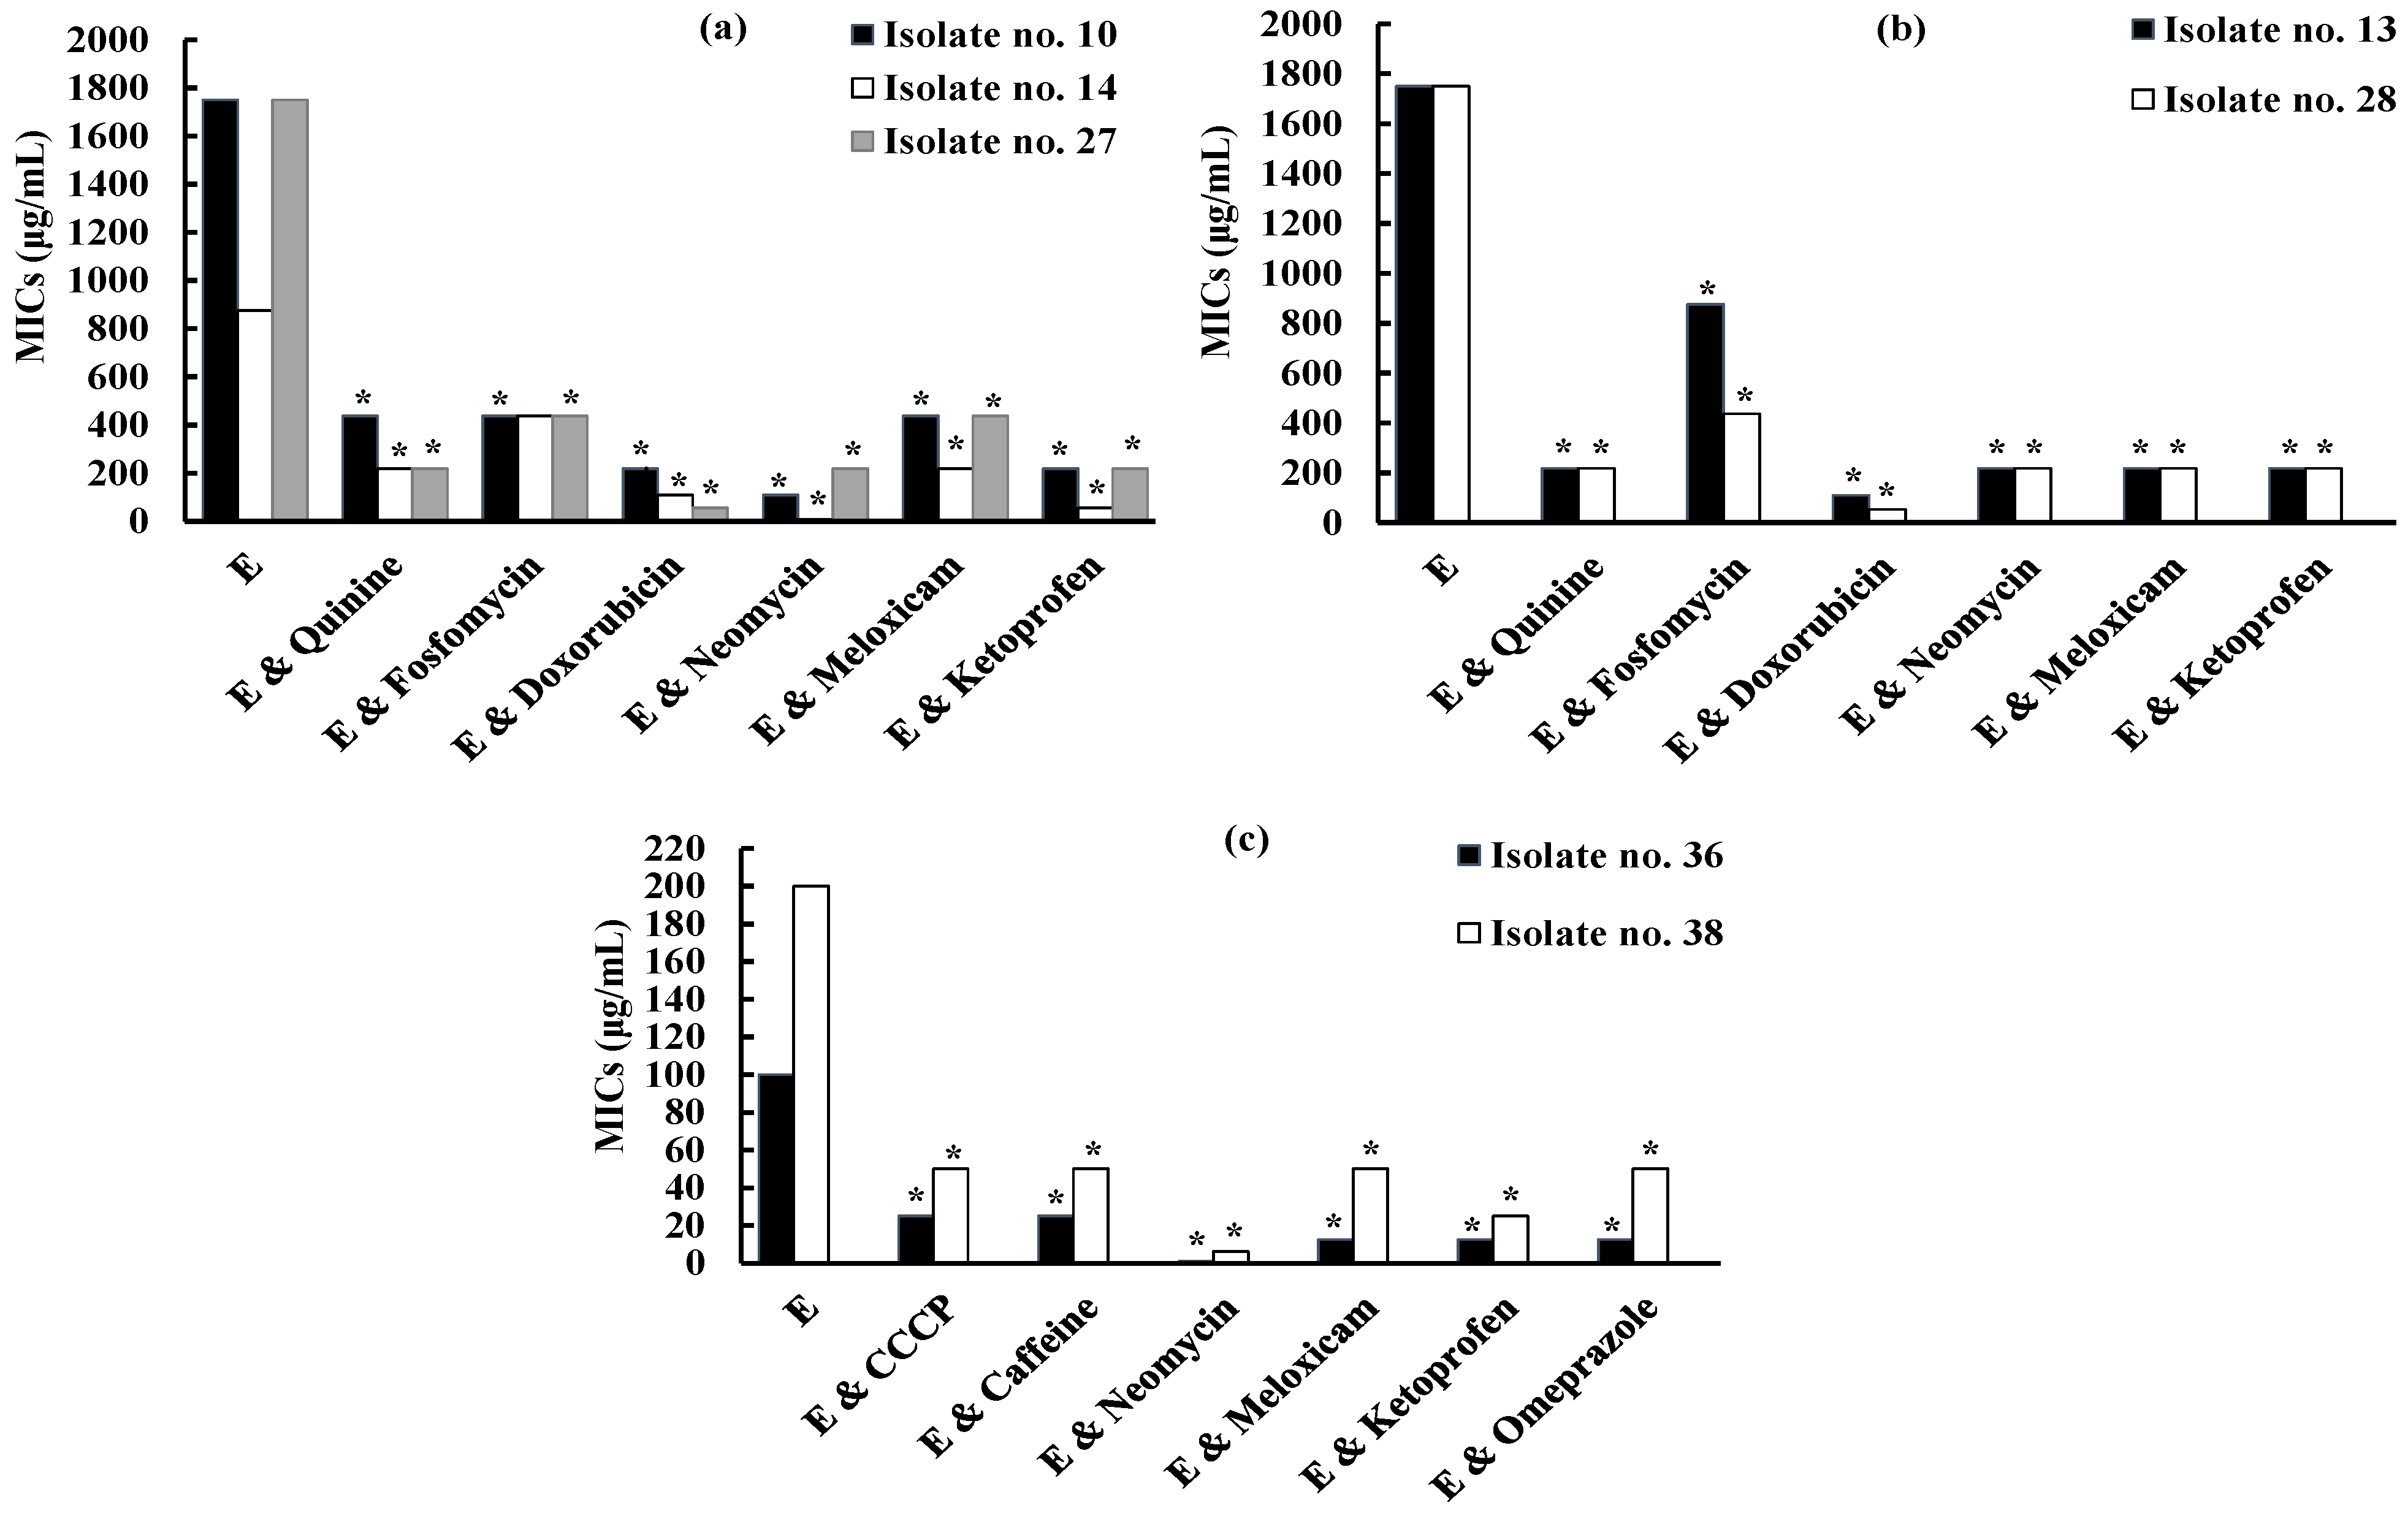
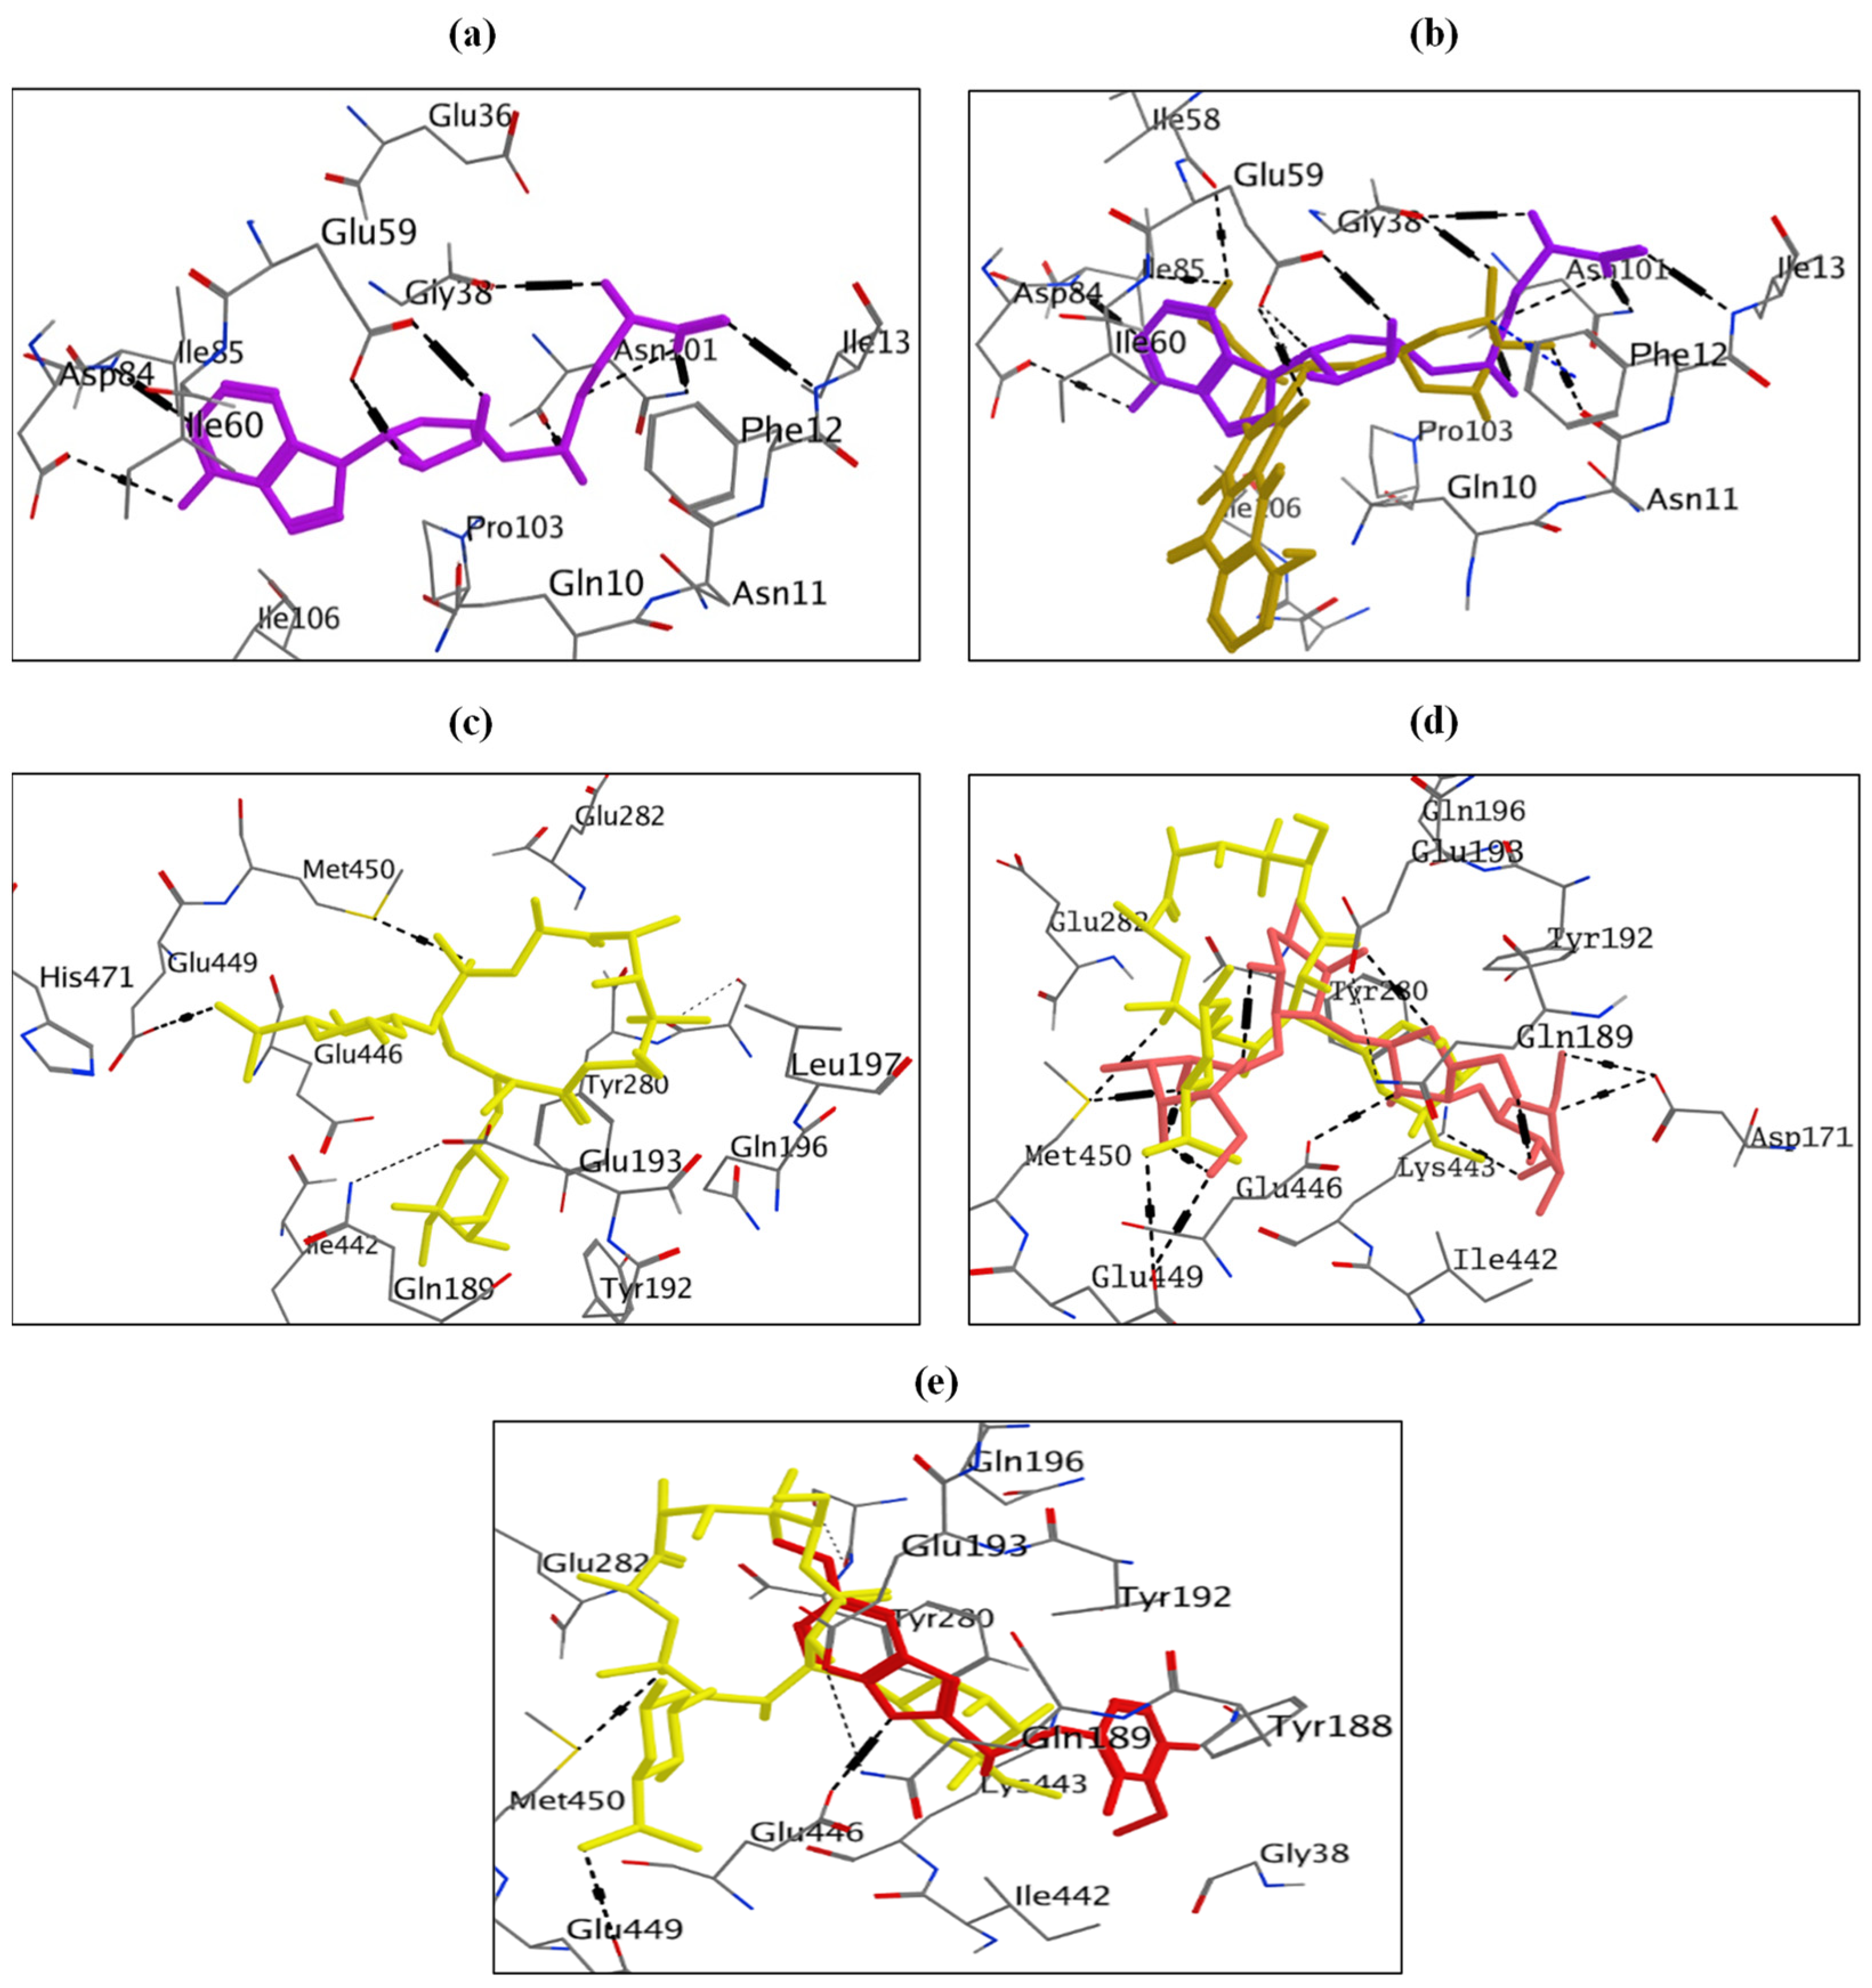
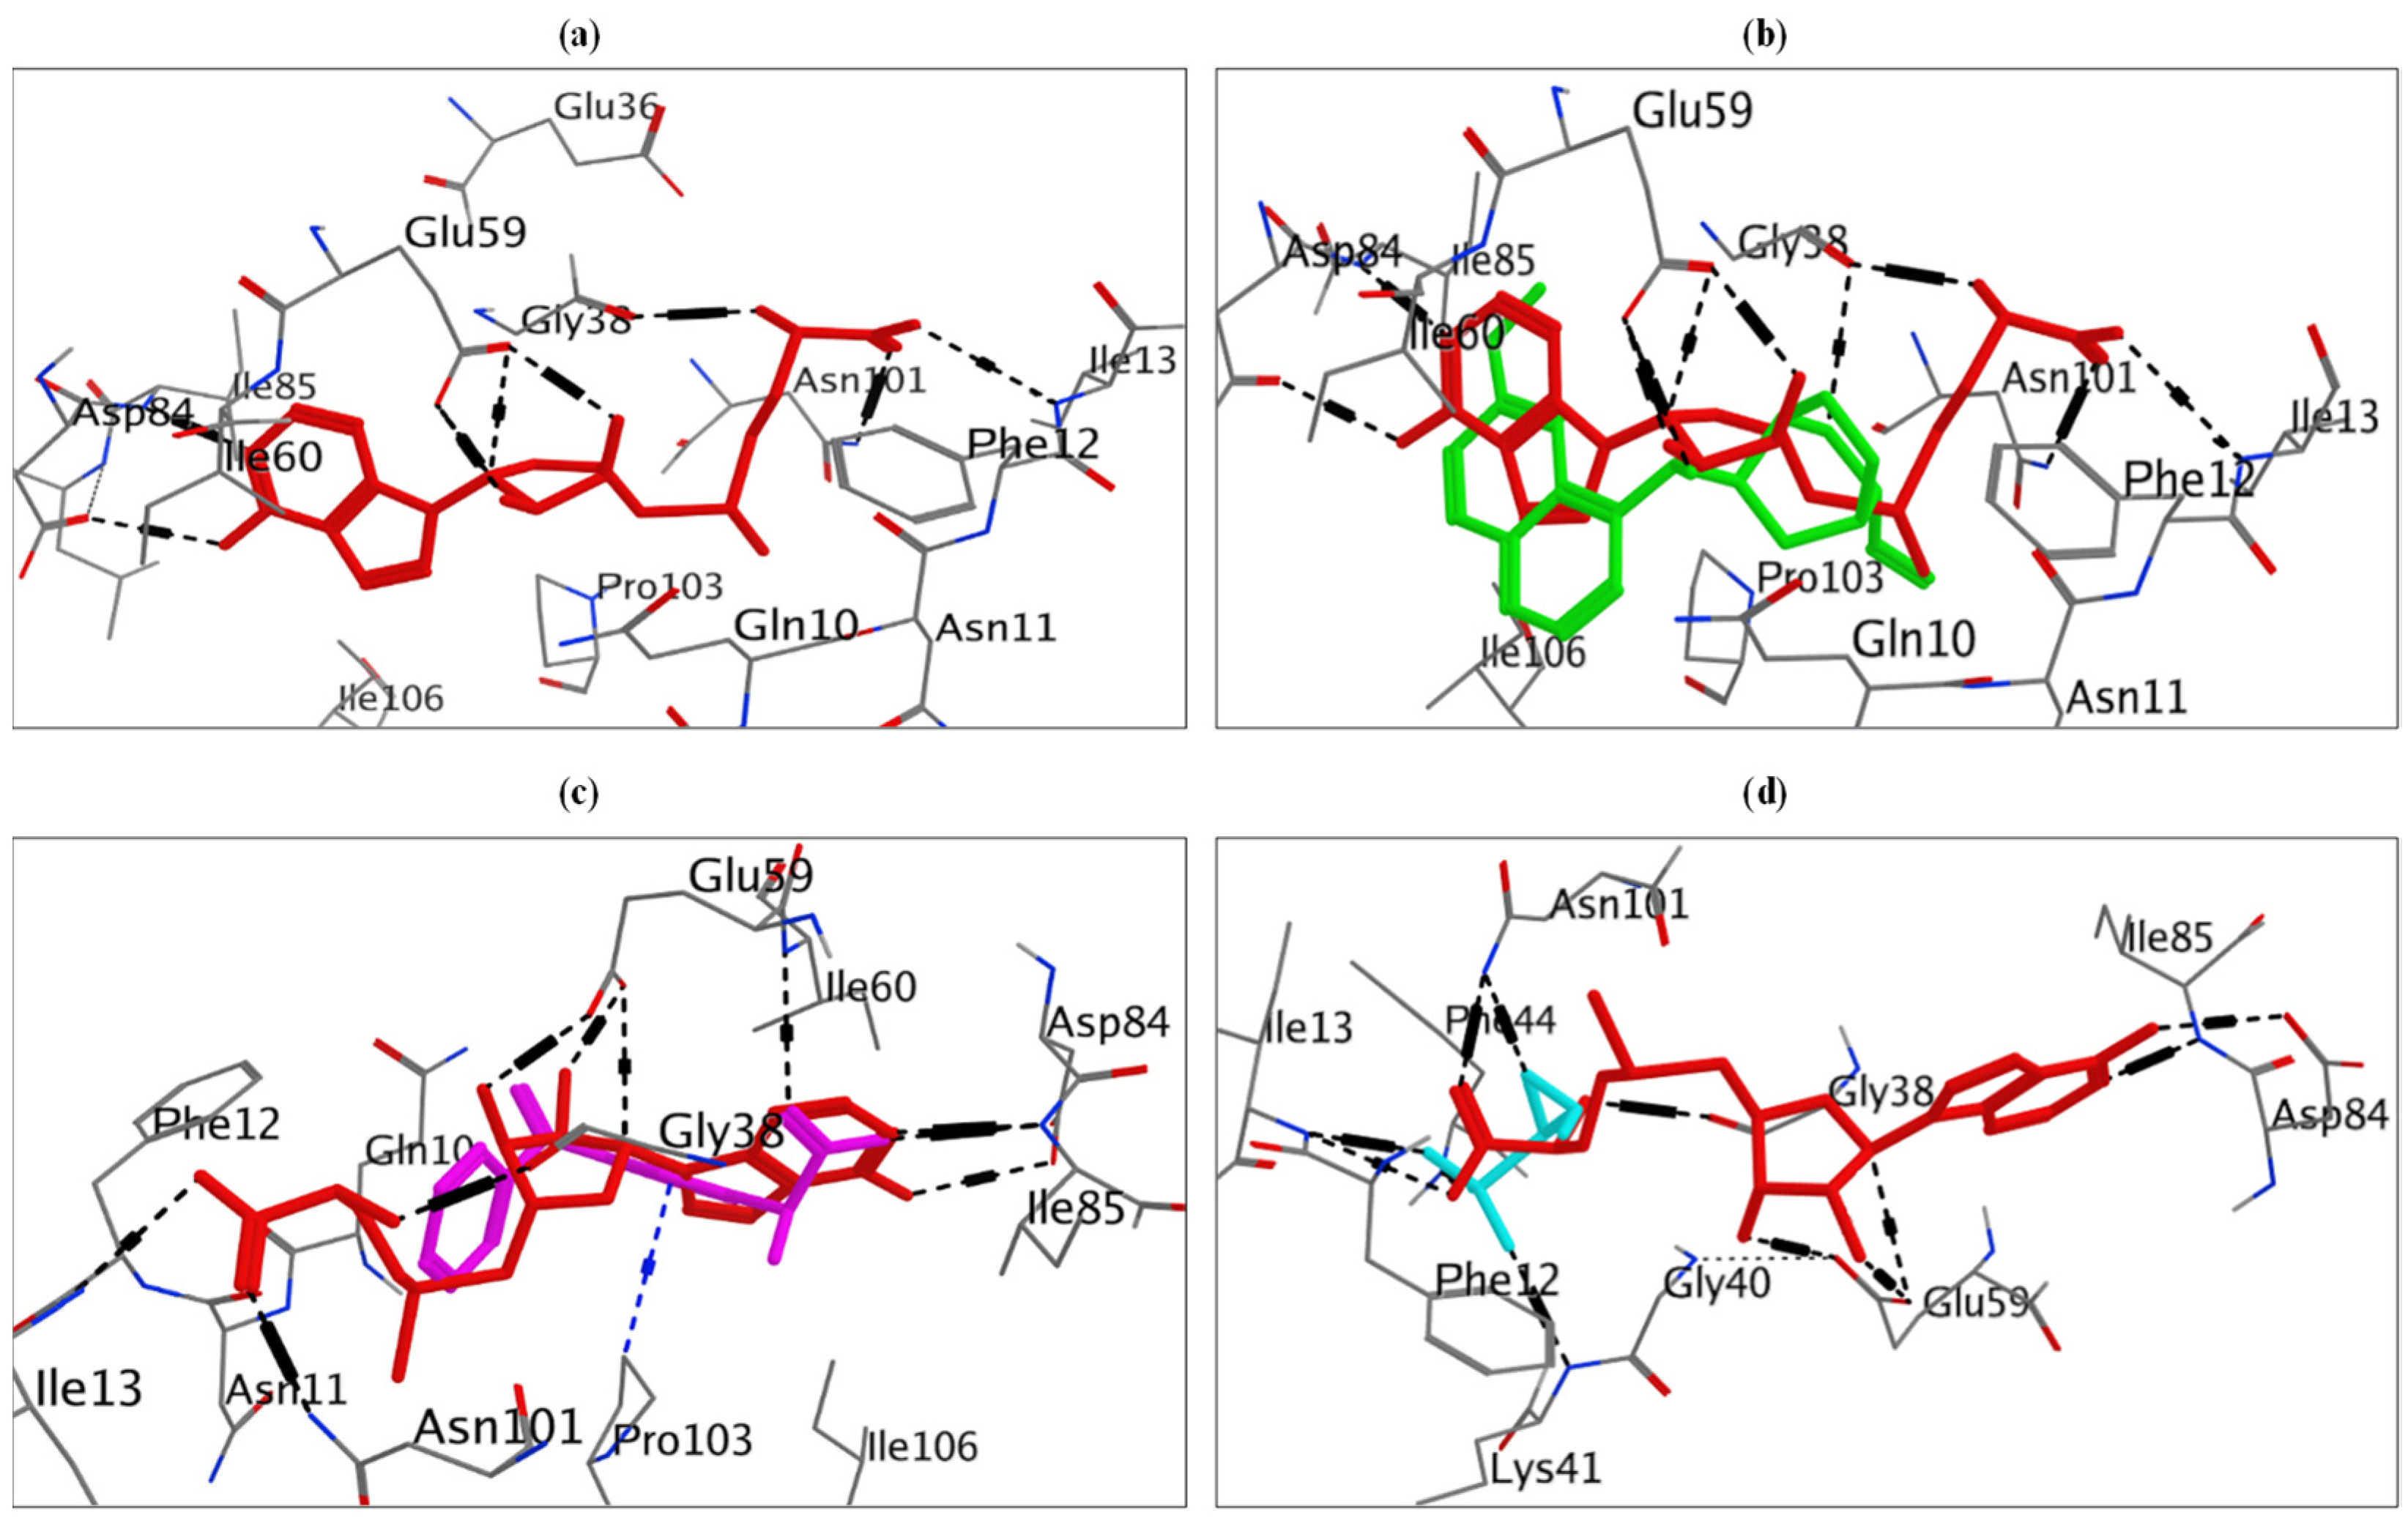
Table 1.
Genotypes of macrolide-lincosamide-streptogramin B (MLSB)-resistant S. aureus clinical isolates.
Table 1.
Genotypes of macrolide-lincosamide-streptogramin B (MLSB)-resistant S. aureus clinical isolates.
| Isolate Number | Genes Present | Result of D Test |
|---|---|---|
| 1, 3, 4, 5, 6, 7, 8, 9, 21, 22, 23, 24, 25, 26, 29, 30, 31, 33, 34, 35, 39, 40, 41, 42, 43, 44, 45, 46, 48, 50. | ermC | R |
| 2, 37, 49 | ermB | R |
| 10 | ermA | D |
| 11, 15 | ermC, lnuA | D+ |
| 12 | ermC, lnuA | HD |
| 13, 18, 28, 52, 16, 17, 19 | ermC | D+ |
| 14 | ermC | D |
| 20, 32 | ermC, lnuA | R |
| 27 | ermA, lnuA | D |
| 36 | msrA, msrB, mphC, lnuA | MS |
| 38 | msrA, msrB, mphC | MS |
| 47 | ermA | R |
| 51 | ermB | D+ |
Table 2.
Effect of potential inhibitors on erythromycin resistance against S. aureus isolates no. 10, 14, and 27 (D phenotype), isolates no. 13 and 28 (D+ phenotype), and isolates no. 36 and 38 (MS phenotype).
Table 2.
Effect of potential inhibitors on erythromycin resistance against S. aureus isolates no. 10, 14, and 27 (D phenotype), isolates no. 13 and 28 (D+ phenotype), and isolates no. 36 and 38 (MS phenotype).
| Isolate No. | MIC of E (μg/mL) | The Effect of Potential Inhibitors on Erythromycin Resistance | |||||
|---|---|---|---|---|---|---|---|
| Potential Inhibitor | MICs (μg/mL) | Conc. Of the Inhibitor (μg/mL) | MICs of E in Combination with Inhibitor (μg/mL) | Fold Change | p-Value | ||
| 10 (D) | 1750 | Quinine | 1250 | 625 | 437.5 | 4-fold (-) | 0.003 * |
| 14 (D) | 875 | 1250 | 625 | 218.75 | 4-fold (-) | 0.02 * | |
| 27 (D) | 1750 | 1250 | 625 | 218.75 | 8-fold (-) | 0.003 * | |
| 13 (D+) | 1750 | 1250 | 625 | 218.75 | 8-fold (-) | 0.003 * | |
| 28 (D+) | 1750 | 1250 | 625 | 218.75 | 8-fold (-) | 0.003 * | |
| 10 (D) | 1750 | Fosfomycin | 2 | 1 | 437.5 | 4-fold (-) | 0.02 * |
| 14 (D) | 875 | 2 | 1 | 437.5 | 2-fold (-) | 0.2 | |
| 27 (D) | 1750 | 2 | 1 | 437.5 | 4-fold (-) | 0.02 * | |
| 13 (D+) | 1750 | 2 | 1 | 875 | 2-fold (-) | 0.02 * | |
| 28 (D+) | 1750 | 1 | 0.5 | 437.5 | 4-fold (-) | 0.02 * | |
| 10 (D) | 1750 | Doxorubicin | 8 | 4 | 218.75 | 8-fold (-) | 0.0005 * |
| 14 (D) | 875 | 8 | 4 | 109.375 | 8-fold (-) | 0.0005 * | |
| 27 (D) | 1750 | 8 | 4 | 54.688 | 32-fold (-) | 0.0001 * | |
| 13 (D+) | 1750 | 8 | 4 | 109.375 | 16-fold (-) | 0.0001 * | |
| 28 (D+) | 1750 | 8 | 4 | 54.688 | 32-fold (-) | 0.0001 * | |
| 10 (D) | 1750 | Neomycin | 1 | 0.5 | 109.375 | 16-fold (-) | 0.0005 * |
| 14 (D) | 875 | 2 | 1 | 6.836 | 128-fold (-) | <0.0001 * | |
| 27 (D) | 1750 | 1 | 0.5 | 218.75 | 8-fold (-) | 0.003 * | |
| 13 (D+) | 1750 | 16 | 8 | 218.75 | 8-fold (-) | 0.02 * | |
| 28 (D+) | 1750 | 2 | 1 | 218.75 | 8-fold (-) | 0.004 * | |
| 36 (MS) | 100 | 64 | 32 | 0.781 | 128-fold (-) | <0.0001 * | |
| 38 (MS) | 200 | 0.0625 | 0.3125 | 6.25 | 32-fold (-) | 0.0001 * | |
| 10 (D) | 1750 | Meloxicam | 2048 | 1024 | 437.5 | 4-fold (-) | 0.003 * |
| 14 (D) | 875 | 1024 | 512 | 218.75 | 4-fold (-) | 0.02 * | |
| 27 (D) | 1750 | 2048 | 1024 | 437.5 | 4-fold (-) | 0.003 * | |
| 13 (D+) | 1750 | 2048 | 1024 | 218.75 | 8-fold (-) | 0.003 * | |
| 28 (D+) | 1750 | 2048 | 1024 | 218.75 | 8-fold (-) | 0.003 * | |
| 36 (MS) | 100 | 1024 | 512 | 12.5 | 8-fold (-) | 0.003 * | |
| 38 (MS) | 200 | 128 | 64 | 50 | 4-fold (-) | 0.003 * | |
| 10 (D) | 1750 | Ketoprofen | 3125 | 1562.5 | 218.75 | 8-fold (-) | 0.003 * |
| 14 (D) | 875 | 3125 | 1562.5 | 54.688 | 16-fold (-) | 0.0005 * | |
| 27 (D) | 1750 | 3125 | 1562.5 | 218.75 | 8-fold (-) | 0.003 * | |
| 13 (D+) | 1750 | 3125 | 1562.5 | 218.75 | 8-fold (-) | 0.003 * | |
| 28 (D+) | 1750 | 3125 | 1562.5 | 218.75 | 8-fold (-) | 0.003 * | |
| 36 (MS) | 100 | 3125 | 1562.5 | 12.5 | 8-fold (-) | 0.003 * | |
| 38 (MS) | 200 | 1562.5 | 781.25 | 25 | 8-fold (-) | 0.003 * | |
| 36 (MS) | 100 | CCCP | 2 | 1 | 25 | 4-fold (-) | 0.02 * |
| 38 (MS) | 200 | 2 | 1 | 50 | 4-fold (-) | 0.02 * | |
| 36 (MS) | 100 | Caffeine | 22,000 | 2750 | 25 | 4-fold (-) | 0.02 * |
| 38 (MS) | 200 | 5500 | 2750 | 50 | 4-fold (-) | 0.02 * | |
| 36 (MS) | 100 | Omeprazole | 5000 | 2500 | 12.5 | 8-fold (-) | 0.0005 * |
| 38 (MS) | 200 | 625 | 312.5 | 50 | 4-fold (-) | 0.003 * | |
Isolate no.: number of isolates, MICs: minimum inhibitory concentrations, E: erythromycin, conc.: concentration, p-value: probability-value, (-): decrease, *: probability-value is <0.05, which is considered statistically significant.
Table 3.
Effect of potential inhibitors on inducible clindamycin resistance against S. aureus isolates no. 10, 14 and 27 (D phenotype) and isolates no. 13 and 28 (D+ phenotype).
Table 3.
Effect of potential inhibitors on inducible clindamycin resistance against S. aureus isolates no. 10, 14 and 27 (D phenotype) and isolates no. 13 and 28 (D+ phenotype).
| Isolate No. | ICR | Fold Change | Inhibition of ICR | ||||||
|---|---|---|---|---|---|---|---|---|---|
| DA (μg/mL) | DA/E (μg/mL) | Potential Inhibitor | MICs (μg/mL) | Conc. of Inhibitor (μg/mL) | MICs of DA/E in Combination with Inhibitor (μg/mL) | Fold Change | p-Value | ||
| 10 (D) | 0.0625 | 1 | 16-fold (+) | Quinine | 1250 | 625 | 0.25 | 4-fold (-) | 0.02 * |
| 14 (D) | 0.0625 | 1 | 1250 | 625 | 0.25 | 4-fold (-) | 0.02 * | ||
| 27 (D) | 0.0625 | 1 | 1250 | 625 | 0.25 | 4-fold (-) | 0.02 * | ||
| 13 (D+) | 0.0625 | 16 | 256-fold (+) | 1250 | 625 | 2 | 8-fold (-) | 0.003 * | |
| 28 (D+) | 0.0625 | 16 | 1250 | 625 | 4 | 4-fold (-) | 0.003 * | ||
| 10 (D) | 0.0625 | 1 | 16-fold (+) | Fosfomycin | 2 | 1 | 0.25 | 4-fold (-) | 0.02 * |
| 14 (D) | 0.0625 | 1 | 2 | 1 | 0.25 | 4-fold (-) | 0.02 * | ||
| 27 (D) | 0.0625 | 1 | 2 | 1 | 0.5 | 2-fold (-) | 0.02 * | ||
| 13 (D+) | 0.0625 | 16 | 256-fold (+) | 2 | 1 | 4 | 4-fold (-) | 0.003 * | |
| 28 (D+) | 0.0625 | 16 | 1 | 0.5 | 4 | 4-fold (-) | 0.003 * | ||
| 10 (D) | 0.0625 | 1 | 16-fold (+) | Ketoprofen | 3125 | 1562.5 | 0.25 | 4-fold (-) | 0.02 * |
| 14 (D) | 0.0625 | 1 | 3125 | 1562.5 | 0.25 | 4-fold (-) | 0.02 * | ||
| 27 (D) | 0.0625 | 1 | 3125 | 1562.5 | 0.25 | 4-fold (-) | 0.02 * | ||
| 13 (D+) | 0.0625 | 16 | 256-fold (+) | 3125 | 1562.5 | 0.5 | 32-fold (-) | 0.0001 * | |
| 28 (D+) | 0.0625 | 16 | 3125 | 1562.5 | 0.5 | 32-fold (-) | 0.0001 * | ||
Isolate no.: number of isolate, ICR: inducible clindamycin resistance, MICs: minimum inhibitory concentrations, E: erythromycin, DA: clindamycin, (+): increase, conc.: concentration, (-): decrease, p-value: probability-value, *: probability-value is <0.05 which is considered statistically significant.
Table 4.
Combined effect of erythromycin/potential inhibitors on S. aureus isolates no. 10 (D phenotype) and no. 36 (MS phenotype) using checkerboard assay.
Table 4.
Combined effect of erythromycin/potential inhibitors on S. aureus isolates no. 10 (D phenotype) and no. 36 (MS phenotype) using checkerboard assay.
| Isolate No. | Potential Inhibitor | FICI | Combined Effect | |
|---|---|---|---|---|
| 10 (D) | Quinine | E/Q | 0.625 | Additive |
| Fosfomycin | E/F | 0.75 | Additive | |
| Doxorubicin | E/D | 0.5 | Synergism | |
| Neomycin | E/N | 0.5 | Synergism | |
| Meloxicam | E/M | 0.75 | Additive | |
| Ketoprofen | E/K | 0.625 | Additive | |
| 36 (MS) | CCCP | E/CCCP | 0.625 | Additive |
| Caffeine | E/C | 0.531 | Additive | |
| Omeprazole | E/O | 0.5 | Synergism | |
| Neomycin | E/N | 0.313 | Synergism | |
| Meloxicam | E/M | 0.625 | Additive | |
| Ketoprofen | E/K | 0.625 | Additive | |
Isolate no.: number of isolate, FICI: fractional inhibitory concentration index, E: erythromycin, D: doxorubicin, N: neomycin, M: meloxicam, CCCP: carbonyl cyanide m-chlorophenylhydrazine, C: caffeine, O: omeprazole, K: ketoprofen.
Table 5.
Combined effect of clindamycin/erythromycin/potential inhibitors on S. aureus isolate no. 10 (D phenotype) using checkerboard assay.
Table 5.
Combined effect of clindamycin/erythromycin/potential inhibitors on S. aureus isolate no. 10 (D phenotype) using checkerboard assay.
| Isolate No. | FICI and Combined Effect of DA/E | Potential Inhibitor | FICI | Combined Effect | |
|---|---|---|---|---|---|
| Isolate no. 10 | 16.668 (antagonism) | Quinine | DA/Q | 1 | Additive |
| DA&E/Q | 0.56 | Additive | |||
| Fosfomycin | DA/F | 0.375 | Synergism | ||
| DA&E/F | 0.56 | Additive | |||
| Ketoprofen | DA/K | 0.5 | Synergism | ||
| DA&E/K | 0.75 | Additive | |||
Isolate no.: number of isolate, FICI: fractional inhibitory concentration index, DA: clindamycin, E: erythromycin, Q: quinine, F: fosfomycin, K: ketoprofen.
Disclaimer/Publisher’s Note: The statements, opinions and data contained in all publications are solely those of the individual author(s) and contributor(s) and not of MDPI and/or the editor(s). MDPI and/or the editor(s) disclaim responsibility for any injury to people or property resulting from any ideas, methods, instructions or products referred to in the content. |
© 2023 by the authors. Licensee MDPI, Basel, Switzerland. This article is an open access article distributed under the terms and conditions of the Creative Commons Attribution (CC BY) license (https://creativecommons.org/licenses/by/4.0/).
Share and Cite
MDPI and ACS Style
Mahfouz, A.A.; Said, H.S.; Elfeky, S.M.; Shaaban, M.I. Inhibition of Erythromycin and Erythromycin-Induced Resistance among Staphylococcus aureus Clinical Isolates. Antibiotics 2023, 12, 503. https://doi.org/10.3390/antibiotics12030503
AMA Style
Mahfouz AA, Said HS, Elfeky SM, Shaaban MI. Inhibition of Erythromycin and Erythromycin-Induced Resistance among Staphylococcus aureus Clinical Isolates. Antibiotics. 2023; 12(3):503. https://doi.org/10.3390/antibiotics12030503
Chicago/Turabian StyleMahfouz, Aya A., Heba S. Said, Sherin M. Elfeky, and Mona I. Shaaban. 2023. "Inhibition of Erythromycin and Erythromycin-Induced Resistance among Staphylococcus aureus Clinical Isolates" Antibiotics 12, no. 3: 503. https://doi.org/10.3390/antibiotics12030503
Note that from the first issue of 2016, this journal uses article numbers instead of page numbers. See further details here.