1. Introduction
Dental caries is a chronic and multifactorial condition that results from the formation of a polymicrobial biofilm and dynamic interactions between microorganisms present in this biofilm, salivary constituents, and dietary carbohydrates (e.g., sucrose) [
1,
2]. Despite attempts to raise awareness, this oral condition is a worrying public health problem and impairs the quality of life of millions of people [
1].
Streptococcus mutans is the bacterium associated with dental caries etiology (although other microorganisms may be associated) [
2,
3].
S. mutans is acidogenic, aciduric, and the leading producer of extracellular matrix in biofilms, known as dental plaque [
4]. This trait occurs because
S. mutans encodes multiple exoenzymes (e.g., glycosyltransferases or Gtfs), and in the presence of sucrose (and starch), they produce copious amounts of exopolysaccharides (i.e., mainly glucans but also fructans) [
4,
5].
The extracellular matrix provides a cohesive and acidic environment of limited diffusion [
6], restricting access to buffering saliva and antimicrobial agents [
6,
7]. In cariogenic biofilms, exopolysaccharides are primordial components in the organization of the extracellular matrix [
4,
5] and are determinants of virulence [
6]. In addition to exopolysaccharides, extracellular DNA (eDNA) and lipoteichoic acids (LTA) are found in large amounts in cariogenic biofilms [
8] and contribute to the matrix structural organization and properties [
9,
10]. These virulence factors modulate the pathogenesis of dental caries and, thus, are selective therapeutic targets for preventing this disease.
Fluoride, in its various modalities of administration, is the basis for caries prevention; however, its current delivery forms are insufficient to overcome the cariogenic challenges in many individuals; therefore, additional approaches are needed to increase its effectiveness [
11]. Chemical agents (such as chlorhexidine?CHX) are widely used to control cariogenic biofilms [
12]. Although CHX can suppress mutans group streptococci levels, its efficacy is reduced against mature biofilms, mainly because the exopolysaccharides of the matrix have a negative charge and affect the penetration of CHX (a cationic substance) into the biofilm, compromising its antimicrobial activity in these biofilms [
6,
12]. In addition, CHX eliminates oral bacteria that convert nitrate to nitrite, which can raise systolic blood pressure [
13]. Therefore, CHX cannot be used for a continuous and prolonged period [
13]. Natural products are a vast source of structurally diverse molecules with various biological properties. Therefore, natural antibacterial substances are useful for developing alternative or adjunctive anticaries therapies. For example, plant extracts have recently been incorporated into these products to improve their antimicrobial properties [
14].
Casearia sylvestris Sw. (Salicaceae) is one of the most promising species from the genus
Casearia due to its biological properties and uses in folk medicine.
C. sylvestris has a high adaptive capacity and is widely disseminated in Central and South America, and in Brazil, it occurs in practically all biomes [
15]. Chemically, extracts from leaves of
C. sylvestris var.
sylvestris (Atlantic Forest) are rich in diterpenes (taxonomic markers for the genus) [
16], while phenolic compounds (flavonoids) predominate in var.
lingua (Cerrado) [
17]. The range of variations around a basic skeleton found in the diterpenes and flavonoids of
C. sylvestris provides very interesting models for studies on the relationship between chemical structure and biological activity of these compounds, which have already demonstrated potential activity in the control of cariogenic biofilms [
18].
Studies about different
C. sylvestris varieties and their chemical constituents have pointed out a plethora of biological activities such as cytotoxic, anti-inflammatory, and anti-tumor effects, among others [
18,
19,
20,
21]. However, few studies have been carried out at a deep level regarding its antimicrobial potential [
22,
23], and little is clarified about its biological activity against pathogenic microorganisms found in the oral cavity [
24]. Thus, prospective studies of plant extracts and/or isolated molecules with antimicrobial and antibiofilm properties are relevant for dentistry and other areas. Therefore, this in vitro study evaluated the effect of extracts, fractions, and isolated molecules of
C. sylvestris (Atlantic and Cerrado Biomes;
sylvestris,
lingua, and intermediate varieties) to control the cariogenic biofilm of
S. mutans.
3. Discussion
C. sylvestris has a phytochemical composition marked by clerodane-types diterpenes and glycosylated flavonoids [
17,
18,
20,
28,
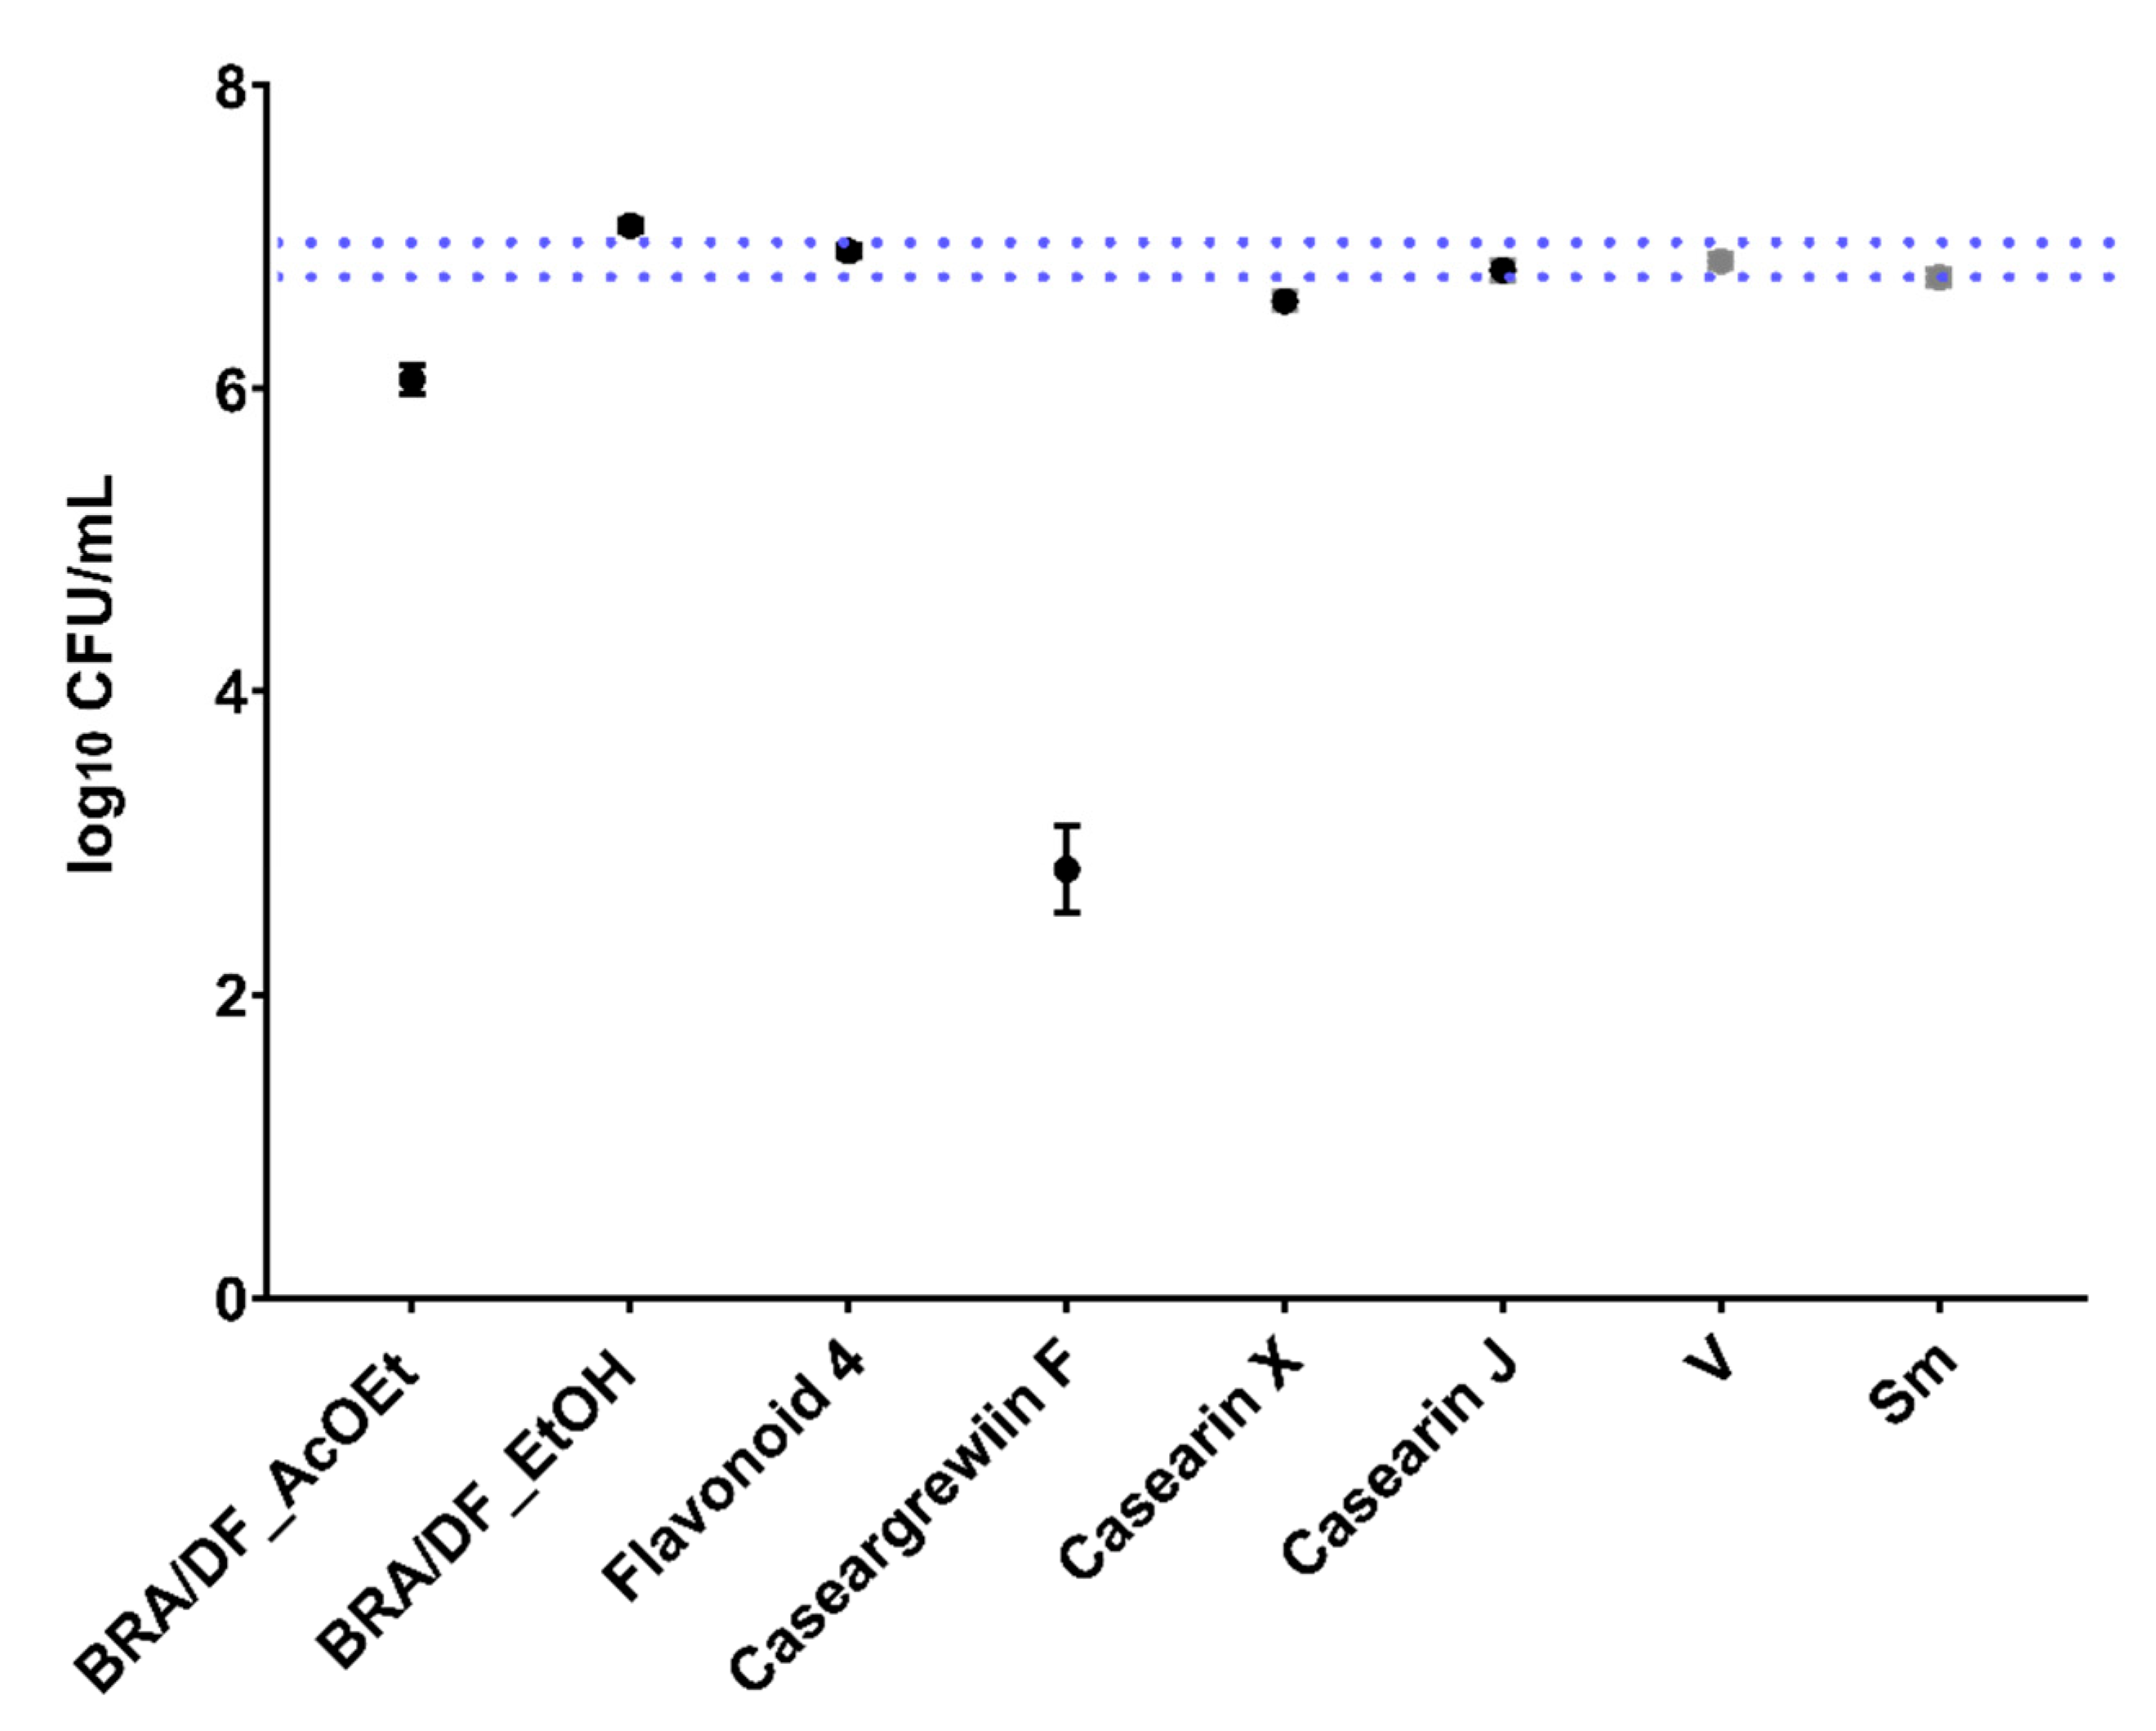
29]. Prospection studies of this plant have shown activity against cariogenic biofilms. Therefore, it is of interest to the community that its biological properties be explored. Our results indicate that Caseargrewiin F (CsF) and the AcOEt fraction obtained from the leaves of sample BRA/DF (corresponding to variety
lingua from the Cerrado biome) are effective in inhibiting
S. mutans through irreversible damage to its structure and changes in the expression of specific virulence genes. However, the topical application does not exert any activity on
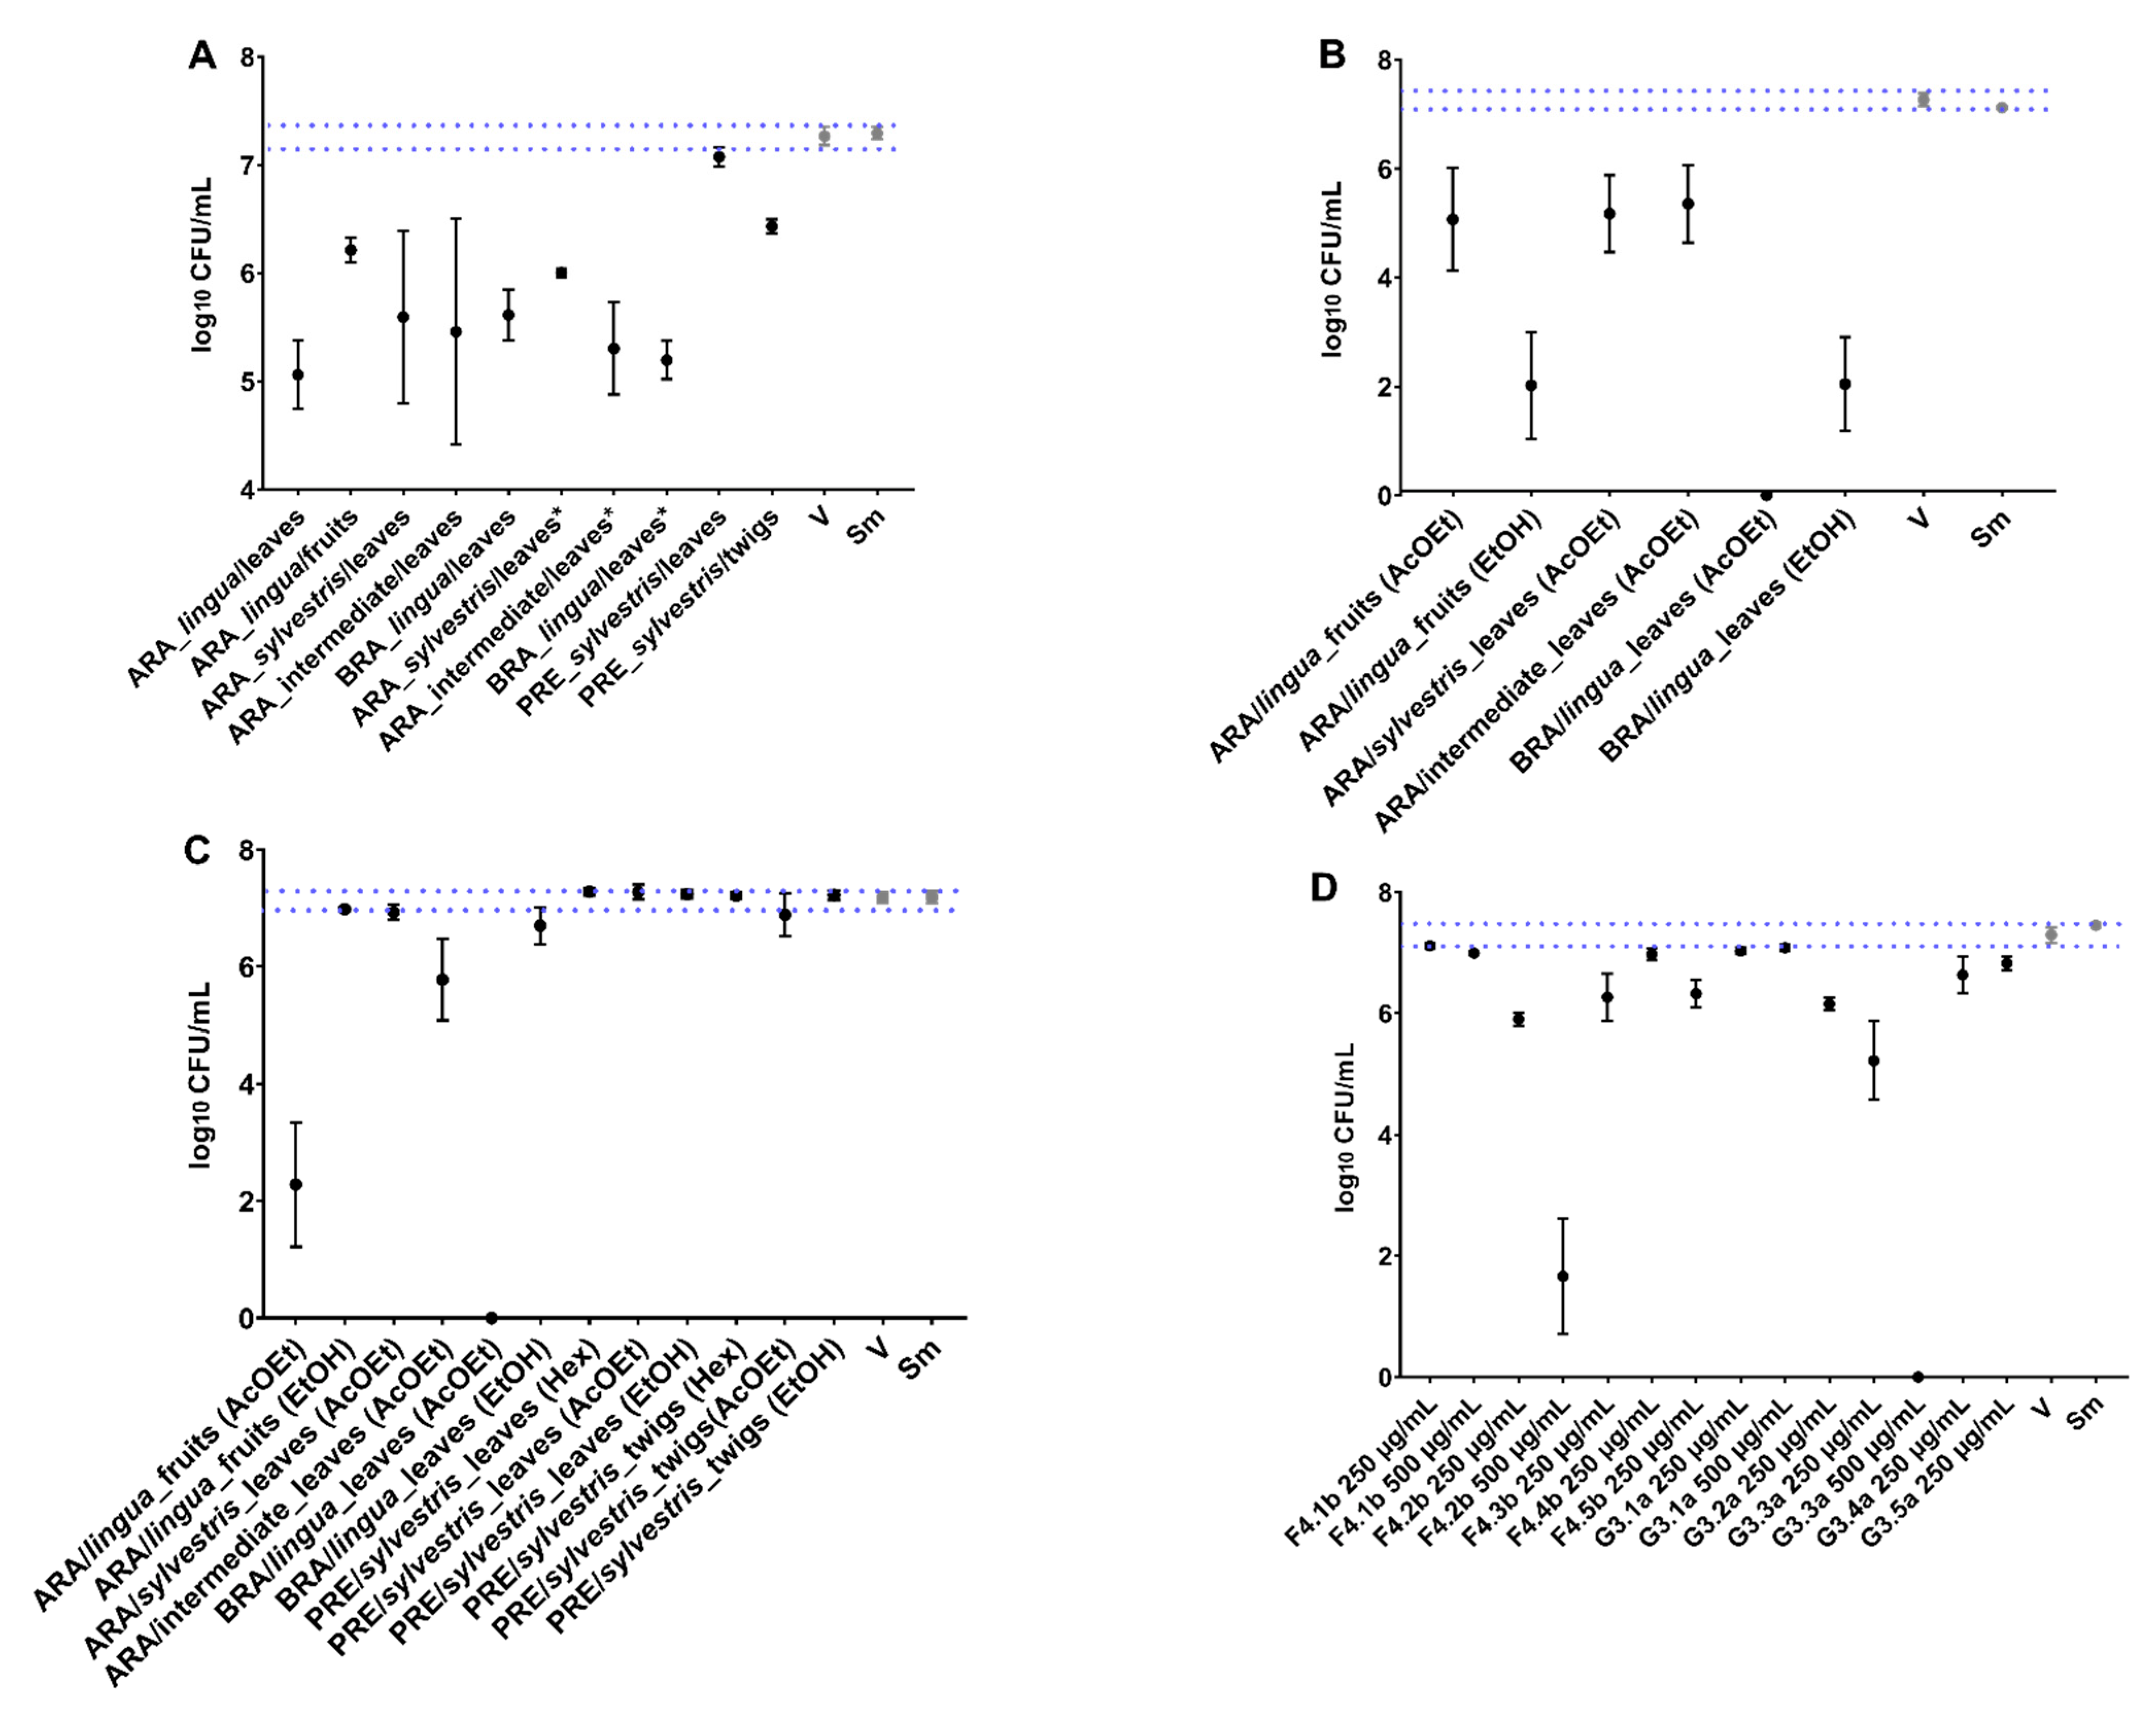
S. mutans biofilm components (viable population, biomass, extracellular matrix components, and structural organization). These findings indicate that the antibiofilm effect in the polystyrene plate-bottom models may have been mainly due to prolonged exposure (24 h) during (the initial biofilm) or after biofilm formation (on pre-formed biofilms). Moreover, the activity of these treatments was primarily due to antibacterial action, verified in the growth inhibition assay. In contrast to previous findings [
18], here, no crude extract of
C. sylvestris showed activity against the long-exposure (24 h) models (
Figure 2), which demonstrates that the chemical composition of secondary metabolites is closely related to geographic location, seasonal effects, and biological diversity and drastically influences the biological activity of samples [
18,
30].
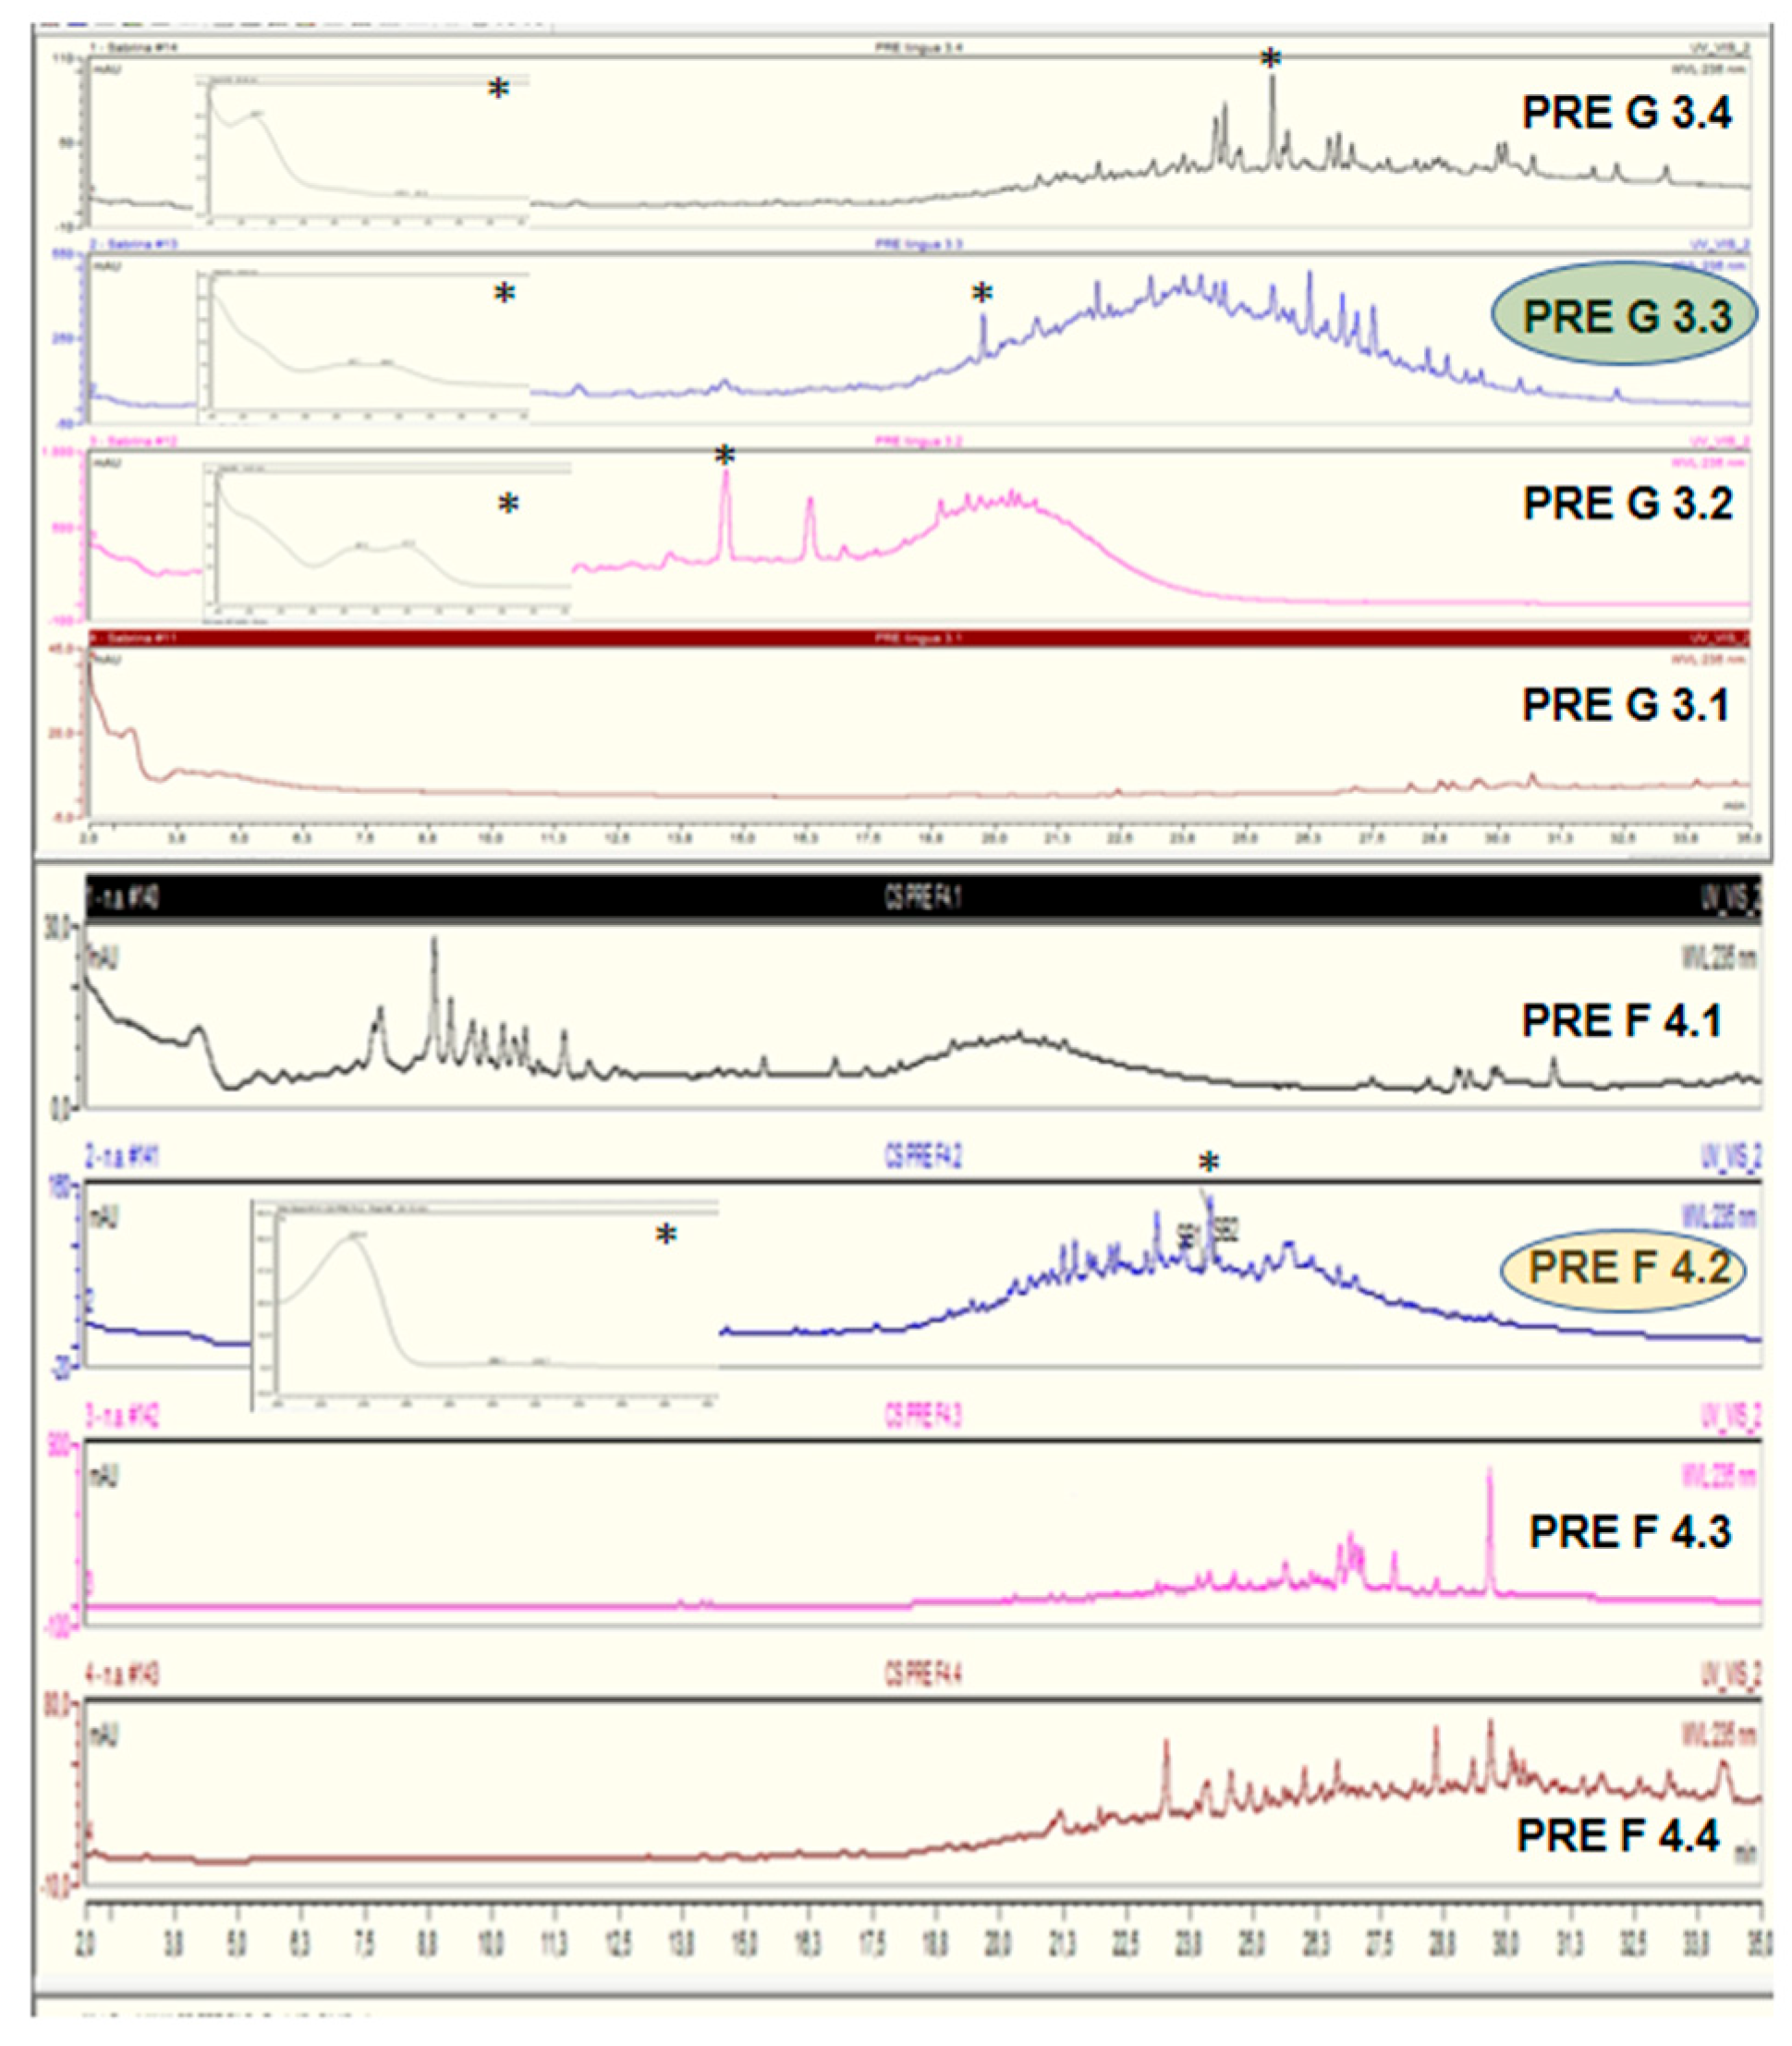
In this long-exposure model, the AcOEt_BRA/DF and SPE-C18 fractions of PRE/SP (Water/EtOH 60:40-F4.2b and Water/EtOH 40:60-G3.3a) reduced the population of the initial biofilms. Additionally, of the isolated molecules evaluated, only CsF showed activity against pre-formed biofilms. CsF is a clerodane-type diterpene with the molecular formula C
28H
40O
8, which was previously isolated from the ethanolic extract of
C. sylvestris leaf [
20]. The chemical structure of CsF seems relevant for its biological activity against
S. mutans. The presence of OAc at the R2 and R3 terminals of CsF could influence its activity since the exchange for OBu (Casearin X-C
32H
46O
9) and OMe (Casearin J-C
31H
44O
9) in R1 and OBu in R2 (Casearin X and J) seems to significantly inhibit casearin activity. No effect was observed for Casearin X and Casearin J, consistent with the hypothesis of radical terminal placement and molecule configuration for CsF exerting its impact on the bacterium cell. Nonetheless, when tested for topical effects (brief exposure) on
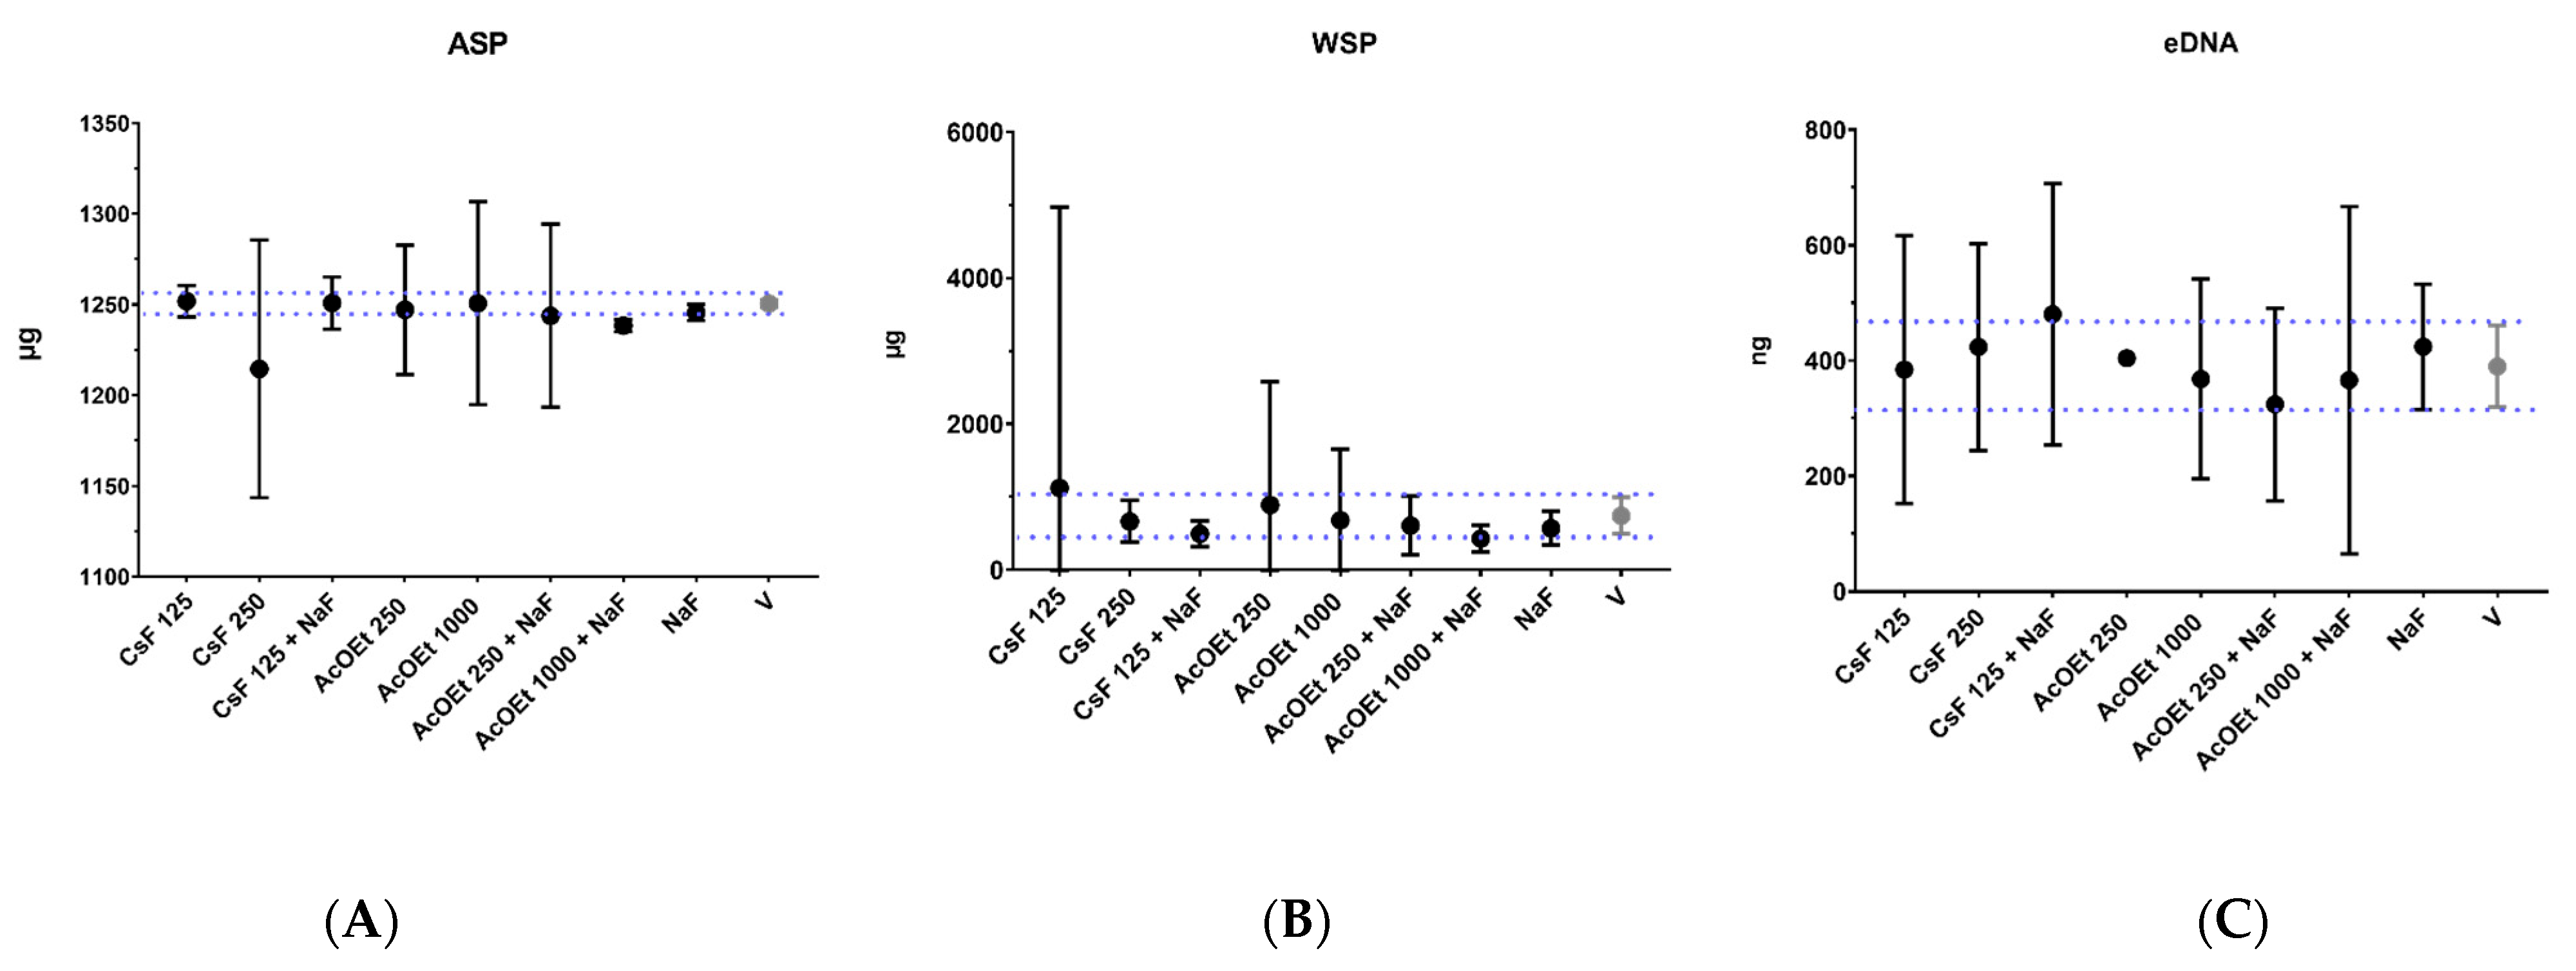
S. mutans biofilms, these treatments (SPE-C18, AcOEt_BRA/DF, and CsF) did not inhibit biofilm components (
Figure 5,
Figure 6 and
Figure 7). Thus, for such agents to exert their effect, it would be necessary to prepare formulations capable of retaining their active principle in the oral cavity for the time required for their action. Therefore, in the future, these treatments could be used for loading in drug delivery systems (suitable for the oral cavity) to prolong the exposure time at an adequate concentration [
31,
32].
In addition to the need for a prolonged exposure time for potential activity (see
Figure 2,
Figure 3 and
Figure 8A), some substances/molecules with antimicrobial activity may not be an antibiofilm agent, and a compound with antibiofilm activity (e.g., effect on inhibiting microbial adhesion and/or extracellular matrix build-up) may not be an antimicrobial per se [
33]. Here, this behavior was observed for AcOEt_BRA/DF and CsF. Although brief exposure to these treatments had no activity, when evaluated through the
S. mutans growth inhibition curve, CsF interfered with the viability of
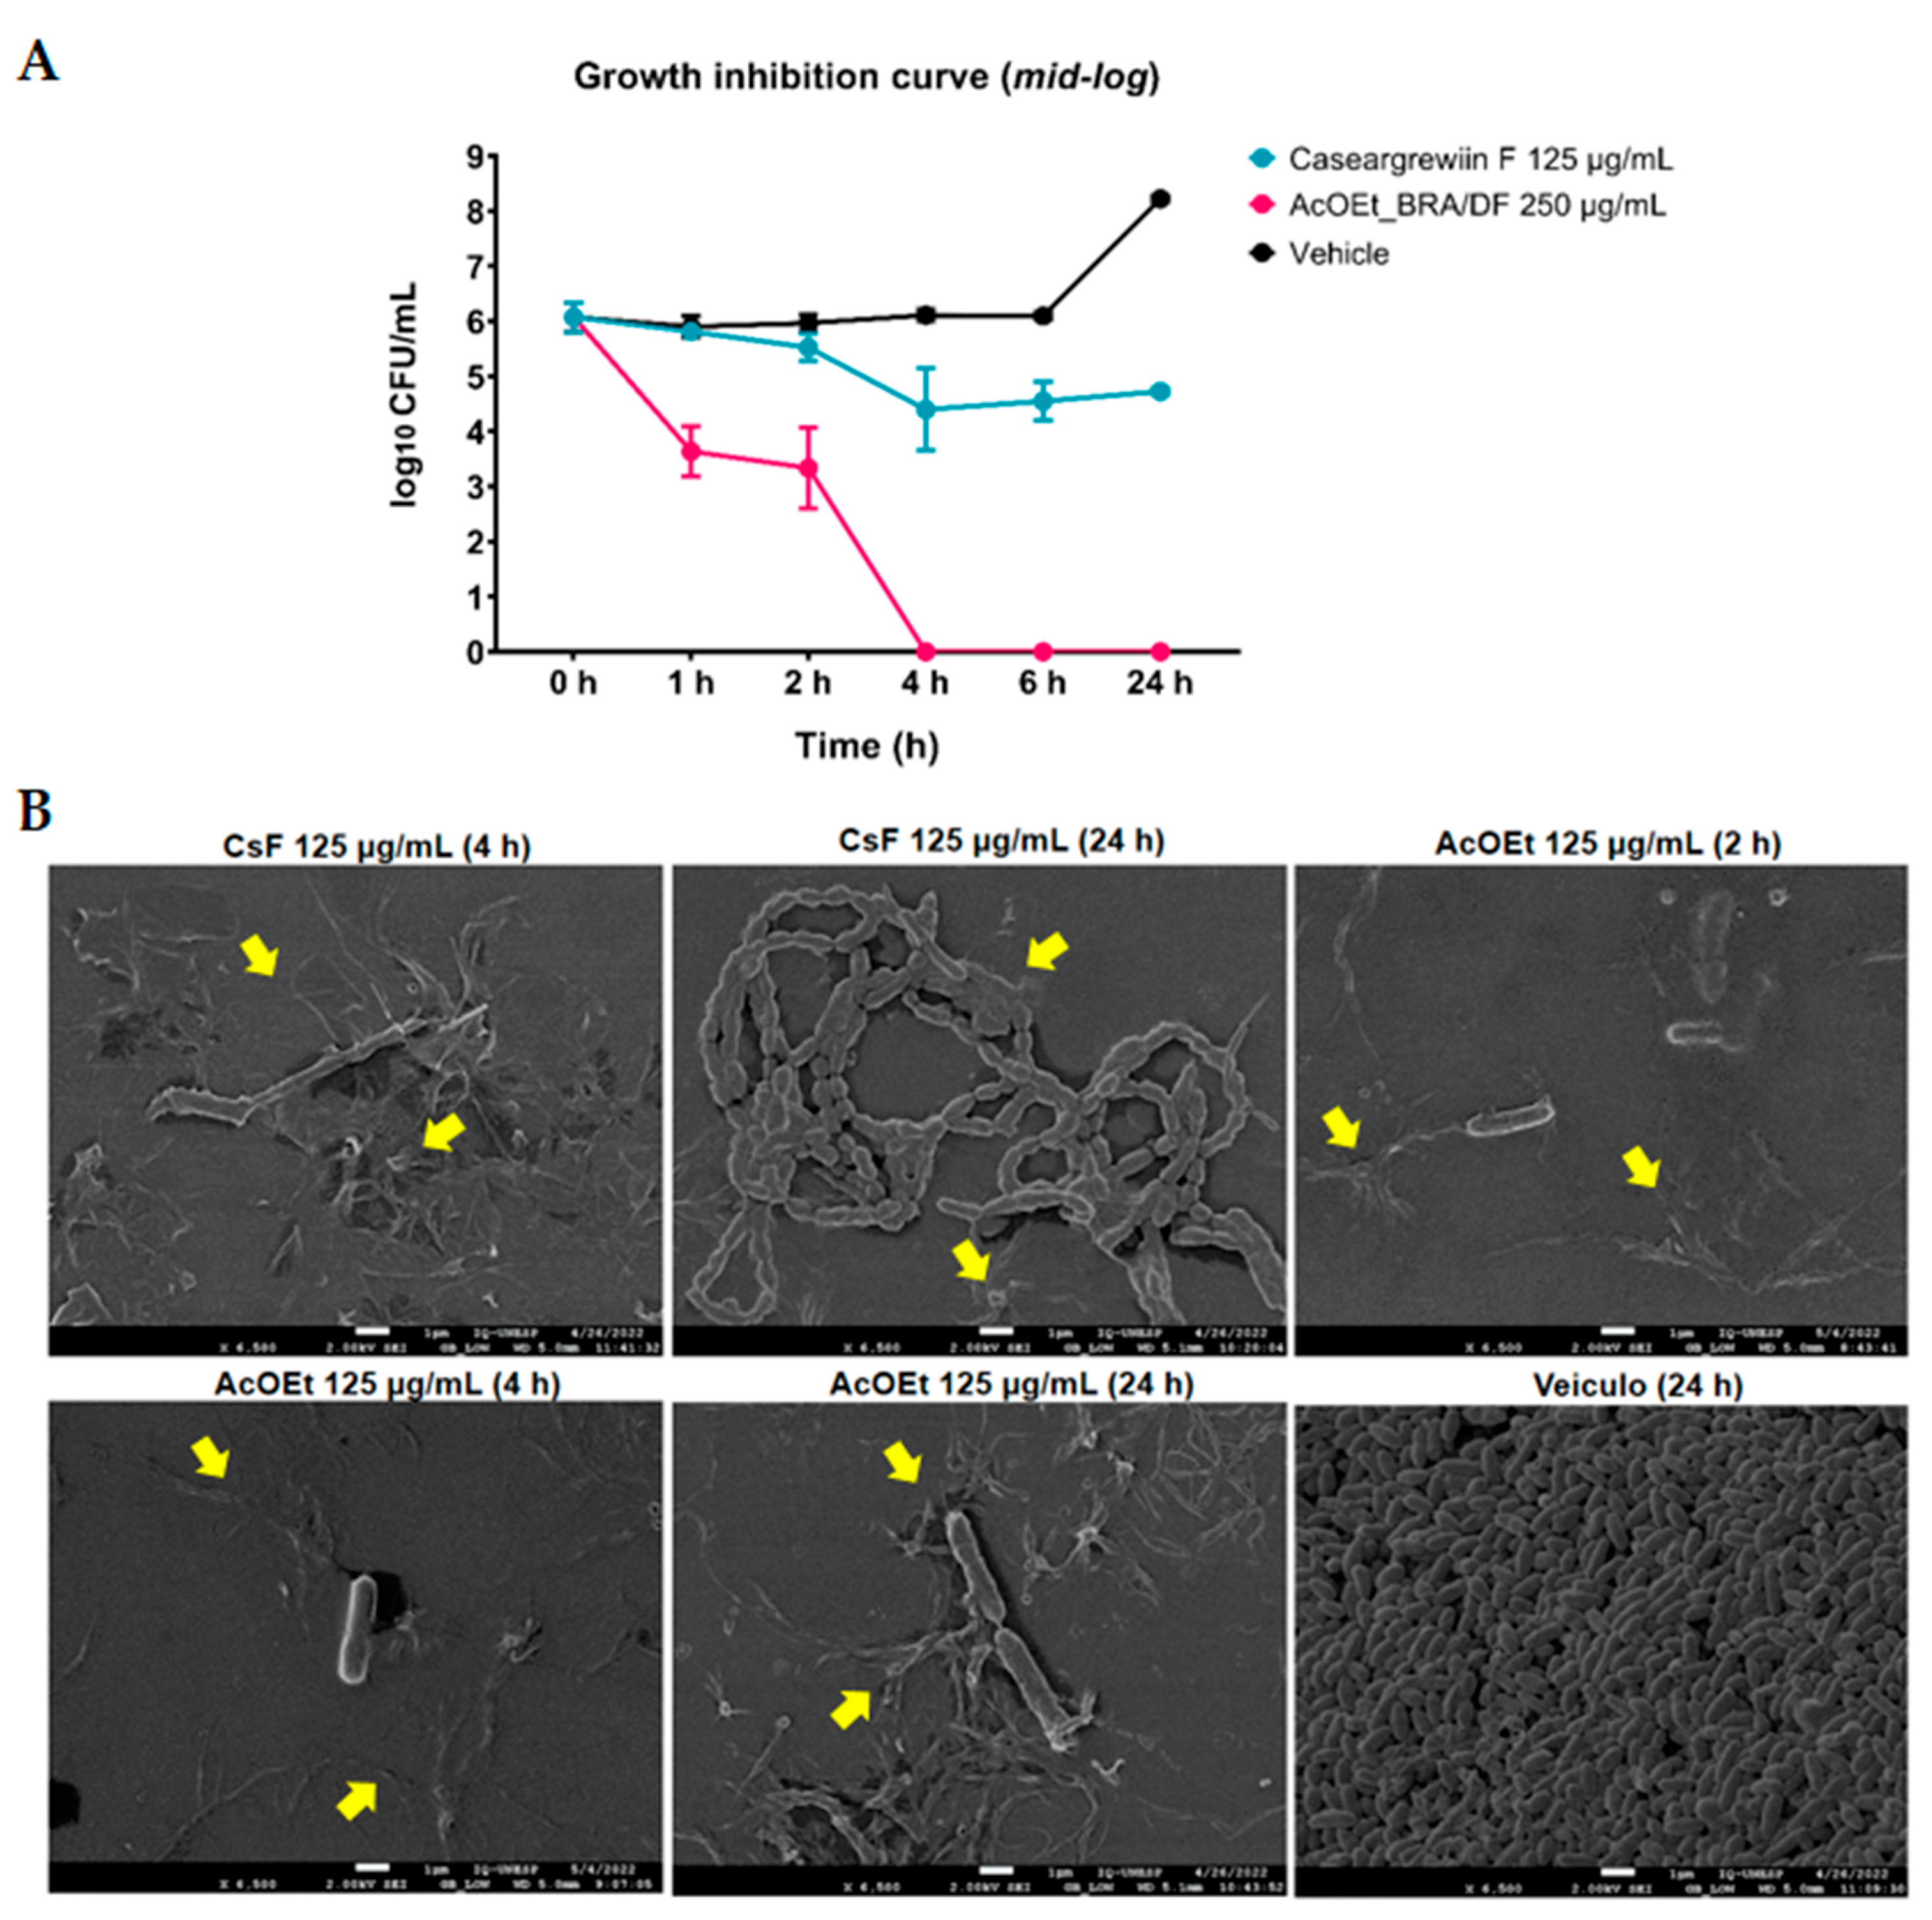
S. mutans after 1 h of contact, and the mean recovery of surviving cells was constant until the 24 h test, which demonstrates a bacteriostatic effect. However, the bacterial survival profile obtained for AcOEt_BRA/DF showed cell death after 1 h of exposure, with a bactericidal effect (
Figure 8A). Therefore, the isolated molecule would be expected to be more effective in eradicating the microorganisms than the fraction. However, isolated molecules are often not as effective as active fractions because the biological activity of the whole natural product results from the synergistic or additive interactions of different compounds in the mixture and not of a single active molecule [
30]. SEM analysis demonstrates that these treatments disrupt
S. mutans cells (in planktonic culture;
Figure 8B), which indicates that the antimicrobial mechanism is mainly related to irreversible damage to the microbial cytoplasmic membrane.
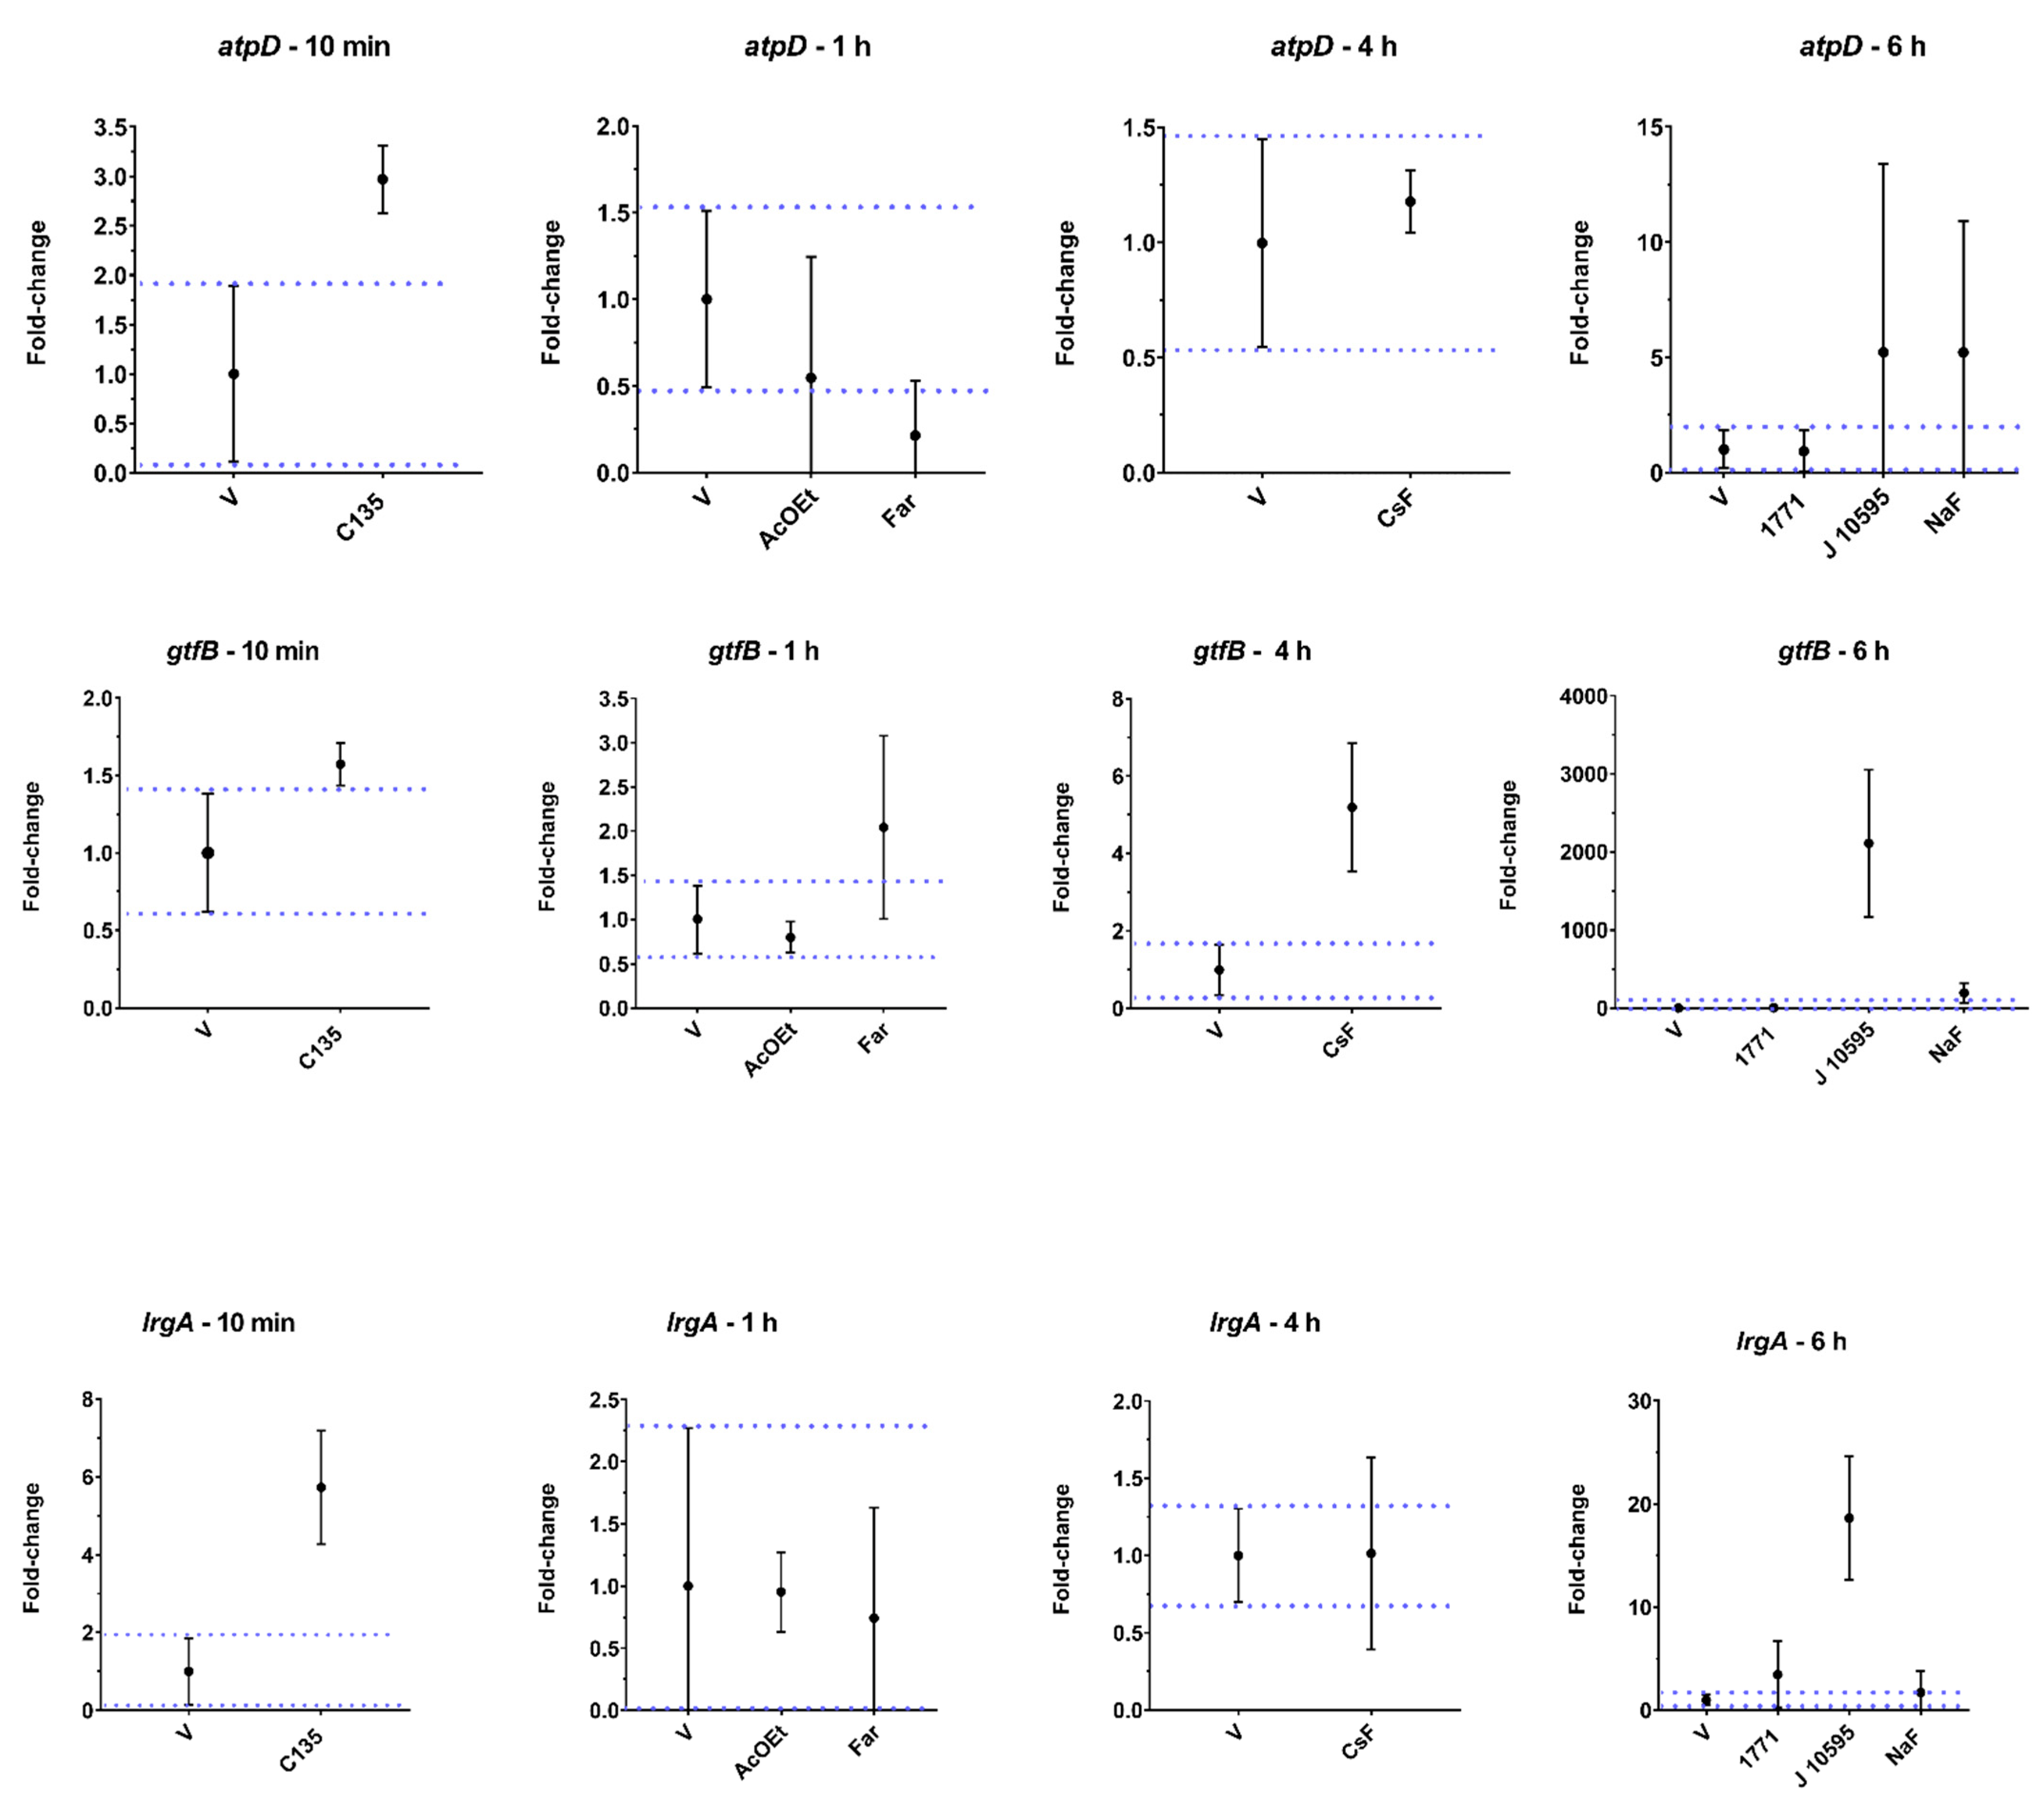
Thus, planktonic cells of
S. mutans were also treated with different agents with recognized targets (compound 1771, C135, myricetin,
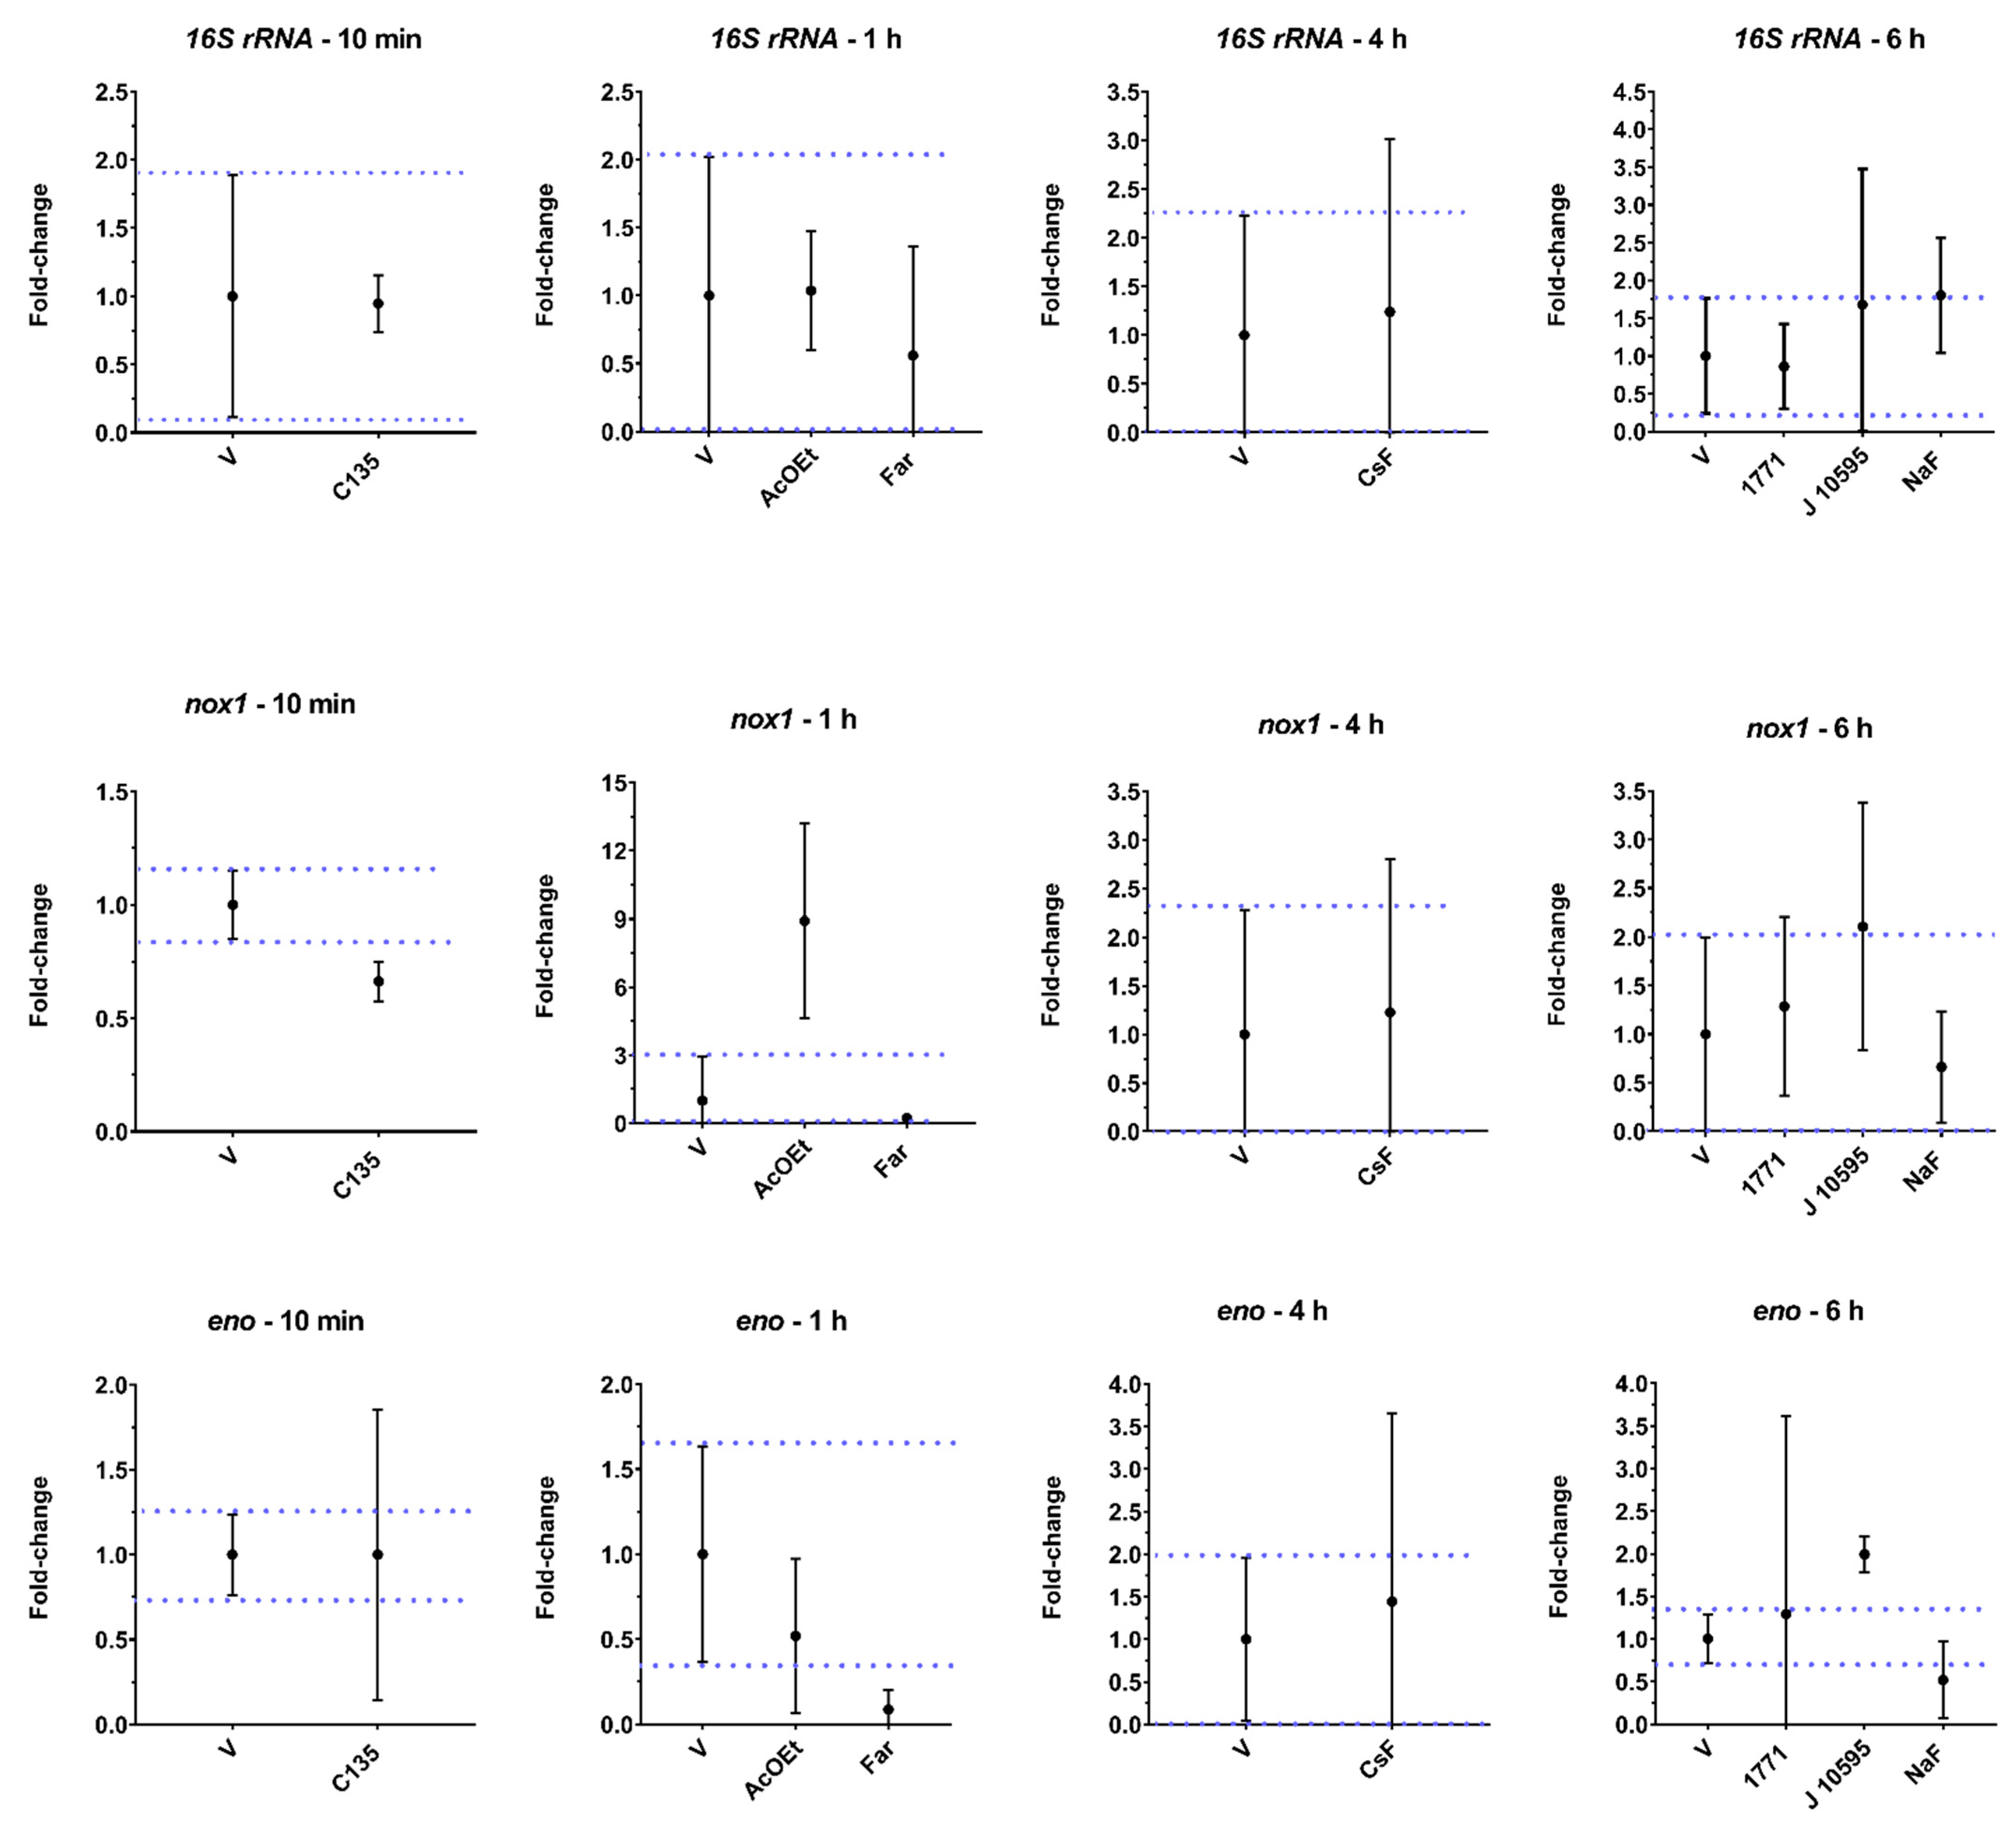
tt-farnesol, and NaF) and, after, evaluated for the expression of virulence genes via the gene expression profile to understand the possible mechanisms of action involved in the biological activity observed for CsF and AcOEt_BRA/DF. Exposure to the flavanoid myricetin (J10595) induced
eno and
atpD gene expression. This induction may have occurred because
S. mutans has developed adaptive acid tolerance responses through the induction of multiple cellular pathways to tolerate the acidification of the acidic environment it produces during glucose consumption [
34]. One of these defense pathways against environmental challenges, such as acid shock, is the bacterial cytoplasmatic membrane itself [
34]. The
atpD gene encodes a functional subunit of the F
0F
1-ATPase system that is membrane-bound and important for the survival of
S. mutans under acidic stress. Therefore, induction of
atpD expression demonstrates that cells reacted to intracellular (cytoplasmic) acidification caused by increased glycolytic activity (increased eno expression), and this induced
atpD expression [
35].
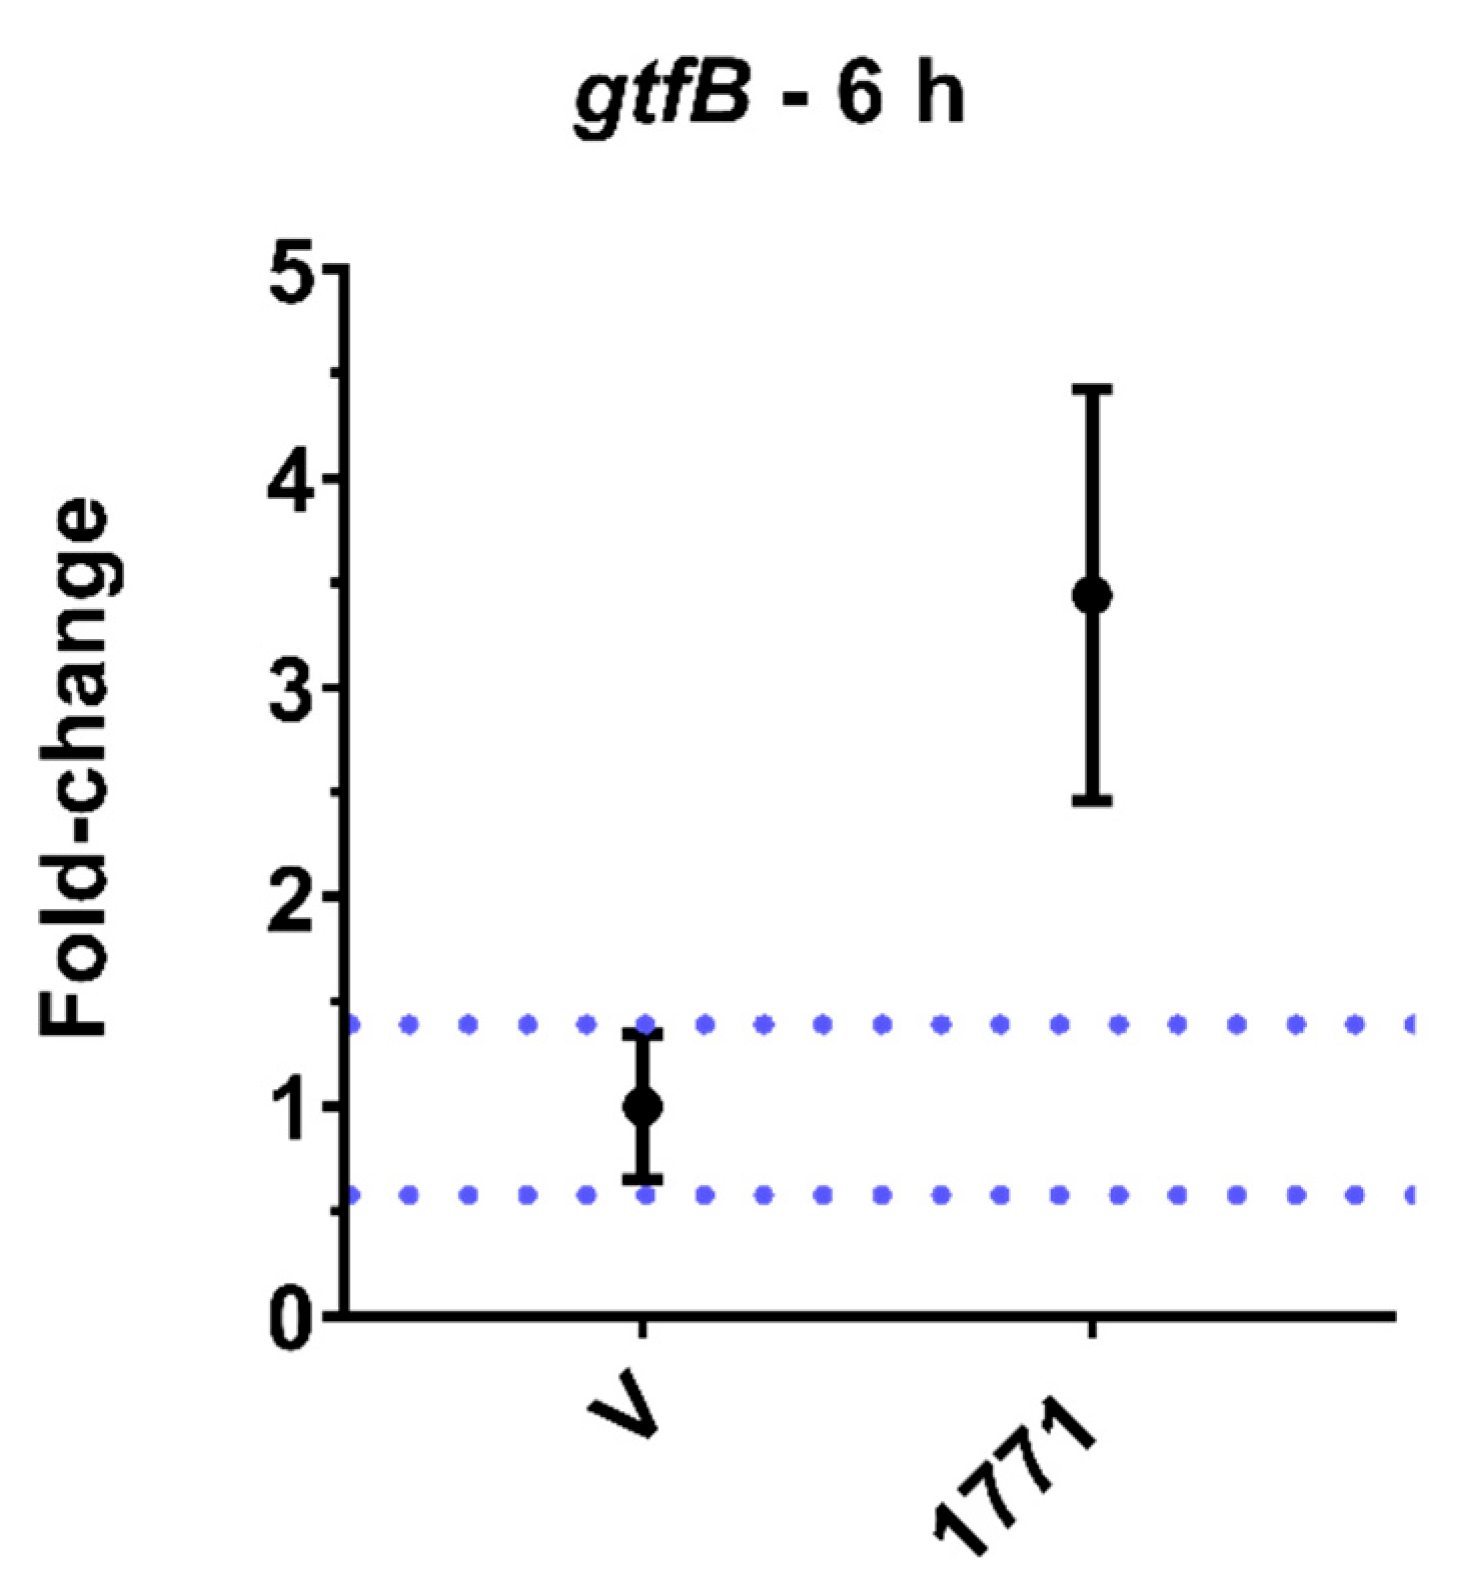
The gene
gtfB encodes the GtfB enzyme, which metabolizes sucrose into water-insoluble glucans [
36]. Here, we observed that CsF,
tt-farnesol, and myricetin (J10595) induced the expression of this gene. This result was unexpected because the medium contained glucose and the substrate of the GtfB enzyme is sucrose to synthesize glucans, demonstrating that the microorganism was expressing a crucial gene for its survival in a cariogenic biofilm. It may be that the agents promote stress to bacterial cells in their free form (planktonic), and in response to this condition, the microorganism responds with an increase in the gene expression of
gtfB as an attempt to produce glucans on the cell surface or to adhere to a surface to protect the cell from the stressor. However, myricetin (J10595) is an effective inhibitor of
gtfB expression in solution, whereas
tt-farnesol targets the cytoplasmatic membrane, decreasing acid tolerance and the Gtfs enzymes of
S. mutans [
37,
38]. Thus, it appears that cells in biofilm and cells in their free form are affected differently by agents. Therefore, the
gtfB expression profile here (
Figure 9) differs from previous ones, where the agents were tested on biofilms through brief exposure [
37,
38]. Furthermore, inhibition/induction of gene expression and enzyme activity are not always correlated because several post-transcriptional regulatory processes can occur after mRNA is produced (as reviewed before [
39].
For
lrgA, there was an increase in gene expression after treatment with hydroxychalcone C135, compound 1771 (LTA metabolism inhibitor that affects the composition of the Gram-positive cell wall), and myricetin (J10595). The induction of
lrgA expression and in the expression of genes related to membrane alterations (e.g., induction of
atpD expression, observed for C135) demonstrate that these agents compromise the ability of
S. mutans since LrgA (product of
lrgA) is a membrane-associated protein and controls autolysis and cell death by modulating bacterial cell wall permeability [
40,
41]. Furthermore, changes in fatty acid profiles affect F-ATPase function and overall membrane permeability, altering the ability of
S. mutans to maintain intracellular ΔpH, greatly impairing acid tolerance; this induces
atpD expression, as observed for C135 and myricetin (J10595).
Changes in
nox1 gene expression alter the fatty acid composition of the microbial membrane and interfere with the activity of its product (Nox) [
42]. This finding demonstrates that the Nox product can be directly or indirectly affected by C135, AcOEt_BRA/DF, and myricetin (J10595) through changes in membrane physiology, normal function of enzymes involved in glycolysis (enolase), and exopolysaccharides (GtfB) production because these agents downregulated
eno expression. Alterations in the expression of this gene have a potentially lethal effect on S.
mutans [
43], as observed by the structural damage caused by AcOEt_BRA/DF (SEM images). Repression of
eno by
tt-farnesol (a terpenoid) and NaF was already expected since
tt-farnesol reduces the glycolytic activity of
S. mutans [
30,
37], and it is well established that enolase is a target of fluoride [
44]. The
atpD gene was downregulated after treatment with
tt-farnesol, and there seems to be a reduction for AcOEt, although the magnitude was not relevant at this exposure time. This finding would reinforce that the treatments cause cytoplasmic acidification, which in turn impairs the normal function of the enzymes involved in glycolysis (enolase), as already demonstrated for
tt-farnesol [
30,
37]. This outcome would explain the bactericidal effect of AcOEt and the structural damage, mainly in the cell wall of
S. mutans, observed by SEM analysis.
CsF is a clerodane-type diterpene, and AcOEt fractions are rich sources of this secondary metabolite (also called casearins) [
18]. Therefore, we propose that the findings of this study are closely correlated with this class of secondary metabolites. Studies regarding the chemistry of different diterpenes and the relationship of their molecular geometry versus their effectiveness in inhibiting the growth of
S. mutans demonstrate that the structural characteristics are fundamental for the antimicrobial activity observed for these metabolites [
45]. The antimicrobial properties of diterpenes are associated with their potential to promote bacterial lysis and rupture of the cytoplasmic membrane. This activity occurs through the structural characteristics of diterpenes, which include a lipophilic structure capable of insertion into the cell membrane and a hydrophilic fragment having a hydrogen-bonding donor group, which interacts with phosphorylated groups in the membrane [
23]. Therefore, we hypothesize that the biological effect obtained for CsF and AcOEt_BRA/DF is associated with bacteriostatic and/or bactericidal capacity due to alterations in the membrane of
S. mutans by the terpenoids present in these formulations. Furthermore, agent–membrane interactions may occur during cell division or cell wall remodeling, as these events facilitate the entry and/or interaction of the molecule with the cytoplasmic membrane. Unlike CsF which has bacteriostatic activity, the reason that AcOEt works as a bactericidal agent seems to be related to the presence of a new casearin not yet identified in the literature. Therefore, we are working on additional analyses to identify this metabolite.
The ability to effectively disrupt biofilm-specific and lifestyle-essential pathways of bacterial pathogens, all without affecting the viability of normal flora, is an attractive approach to the prevention and/or reduction of biofilm-related diseases, especially those that occur in complex microenvironments, such as the human mouth [
30]. Considering the findings of this study, CsF and AcOEt_BRA/DF bring new and significant perspectives for developing selective antibiofilm/antimicrobial agents for potential applications in the prevention of cavities. Although the details of the cytotoxicity of these agents have not been investigated here, our previous study demonstrated low/moderate toxicity at higher concentrations of crude extracts of
C. sylvestris in long-term exposure models [
18]. In the future, these treatments will be evaluated for their cytotoxic activity through three-dimensional culture models.
Interpretation of in vitro results requires caution to avoid overestimation of observed effects. The rapid screening model on polystyrene plates was used here to select agents with potential antimicrobial and/or antibiofilm activity; however, they do not reflect the complex polymicrobial, ecological, and environmental influences found in the oral cavity. Thus, to verify the properties shown in our conditions, future in vitro tests will be carried out for drug delivery systems to prolong the exposure time at an adequate concentration using a polymicrobial (microcosmos) model. Additionally, recognizing the common ability to interact with the cell membrane of
S. mutans, we propose as future investigations the simulation of the insertion of these agents in a phospholipid membrane model to validate our conclusions about the structure–activity relationships of this class of compounds [
23].
4. Materials and Methods
4.1. Plant Material
Samples of
C. sylvetris were collected from four trees from three Brazilian regions belonging to the biomes: Cerrado and Atlantic Forest between September/October 2019 and December 2020 (
Table 1;
Figure S1). All samples were sent to Instituto Agronômico de Campinas (State of São Paulo, Brazil) for identity confirmation and variety assignment by Profa. Dr. Roseli B. Torres. The plant is registered in the National System for the Management of Genetic Resources and Associated Traditional Knowledge (SisGen; Registration nº A00892A), and the collections were authorized by the Brazilian Institute for the Environment and Renewable Natural Resources (IBAMA) through the Authorization and Biodiversity Information (SISBIO; registration n
o 33429-1).
4.2. Sample Preparation
The plant materials (fruits, leaves, and/or twigs) were dehydrated (40 °C in a circulating air oven) and then stored protected from light and at room temperature until use. Then, the samples were individually crushed, and 20 g of each sample was used to prepare the crude extracts, as described before [
18]. First, the extracts were combined and lyophilized, producing seven lyophilized crude extracts. Then, these extracts were solubilized with 84.15% ethanol (EtOH; Sigma-Aldrich Co. St. Louis, MO, USA) and 15% dimethyl sulfoxide (DMSO; Sigma-Aldrich Co. St. Louis, MO, USA) and stored at −80 °C until biological assays.
The same plant material was used for a different approach to prepare crude extracts (combined and subjected to Speed Vac model SPD-Thermo Scientific to remove the extracting solvent) to optimize fraction yields. Then, two methodologies were adopted for fractionation (SPE-Si/C fractions). In the first method, fractionation was carried out from the lyophilized crude extracts, and then the resulting fractions were dried with a Speed Vac (methodology 1). In the second method, fractionation was performed from the crude extracts dried under a Speed Vac, and then the fractions were dried in a fume hood (methodology 2). The fractionation of crude extracts was conducted as described previously [
18]. Briefly, a mixture of 40–63 μm, 60 Å silica gel (Merck, Darmstadt, Germany), and activated carbon (Labsynth, Diadema, Brazil) (1:1) was added to solid phase extraction (SPE) cartridges. Columns were preconditioned with 95:5 ethyl acetate (both from J.T. Baker, HPLC grade), and then 150 mg of samples were applied. First, fractions were eluted with 10 mL of 95:5 (%
v/
v) hexane/ethyl acetate (Hex fraction), 100% ethyl acetate (AcOEt fraction), and 100% ethanol (EtOH fraction), respectively. Then, the solvents were evaporated with a Speed Vac or under the fume hood, resulting in their respective dry fractions. Next, the fractions were solubilized with 84.15% EtOH and 15% DMSO and stored at −80 °C until the biological assays.
For the PRE/SP crude extracts, solid phase fractionation was performed using reversed-phase silica (Si-C18) (SPE-C18 fractions). The stationary phase consisted of 30 g of C18 silica, dry packed in a polypropylene tube with an internal diameter of 3.7 cm (Polygoprep
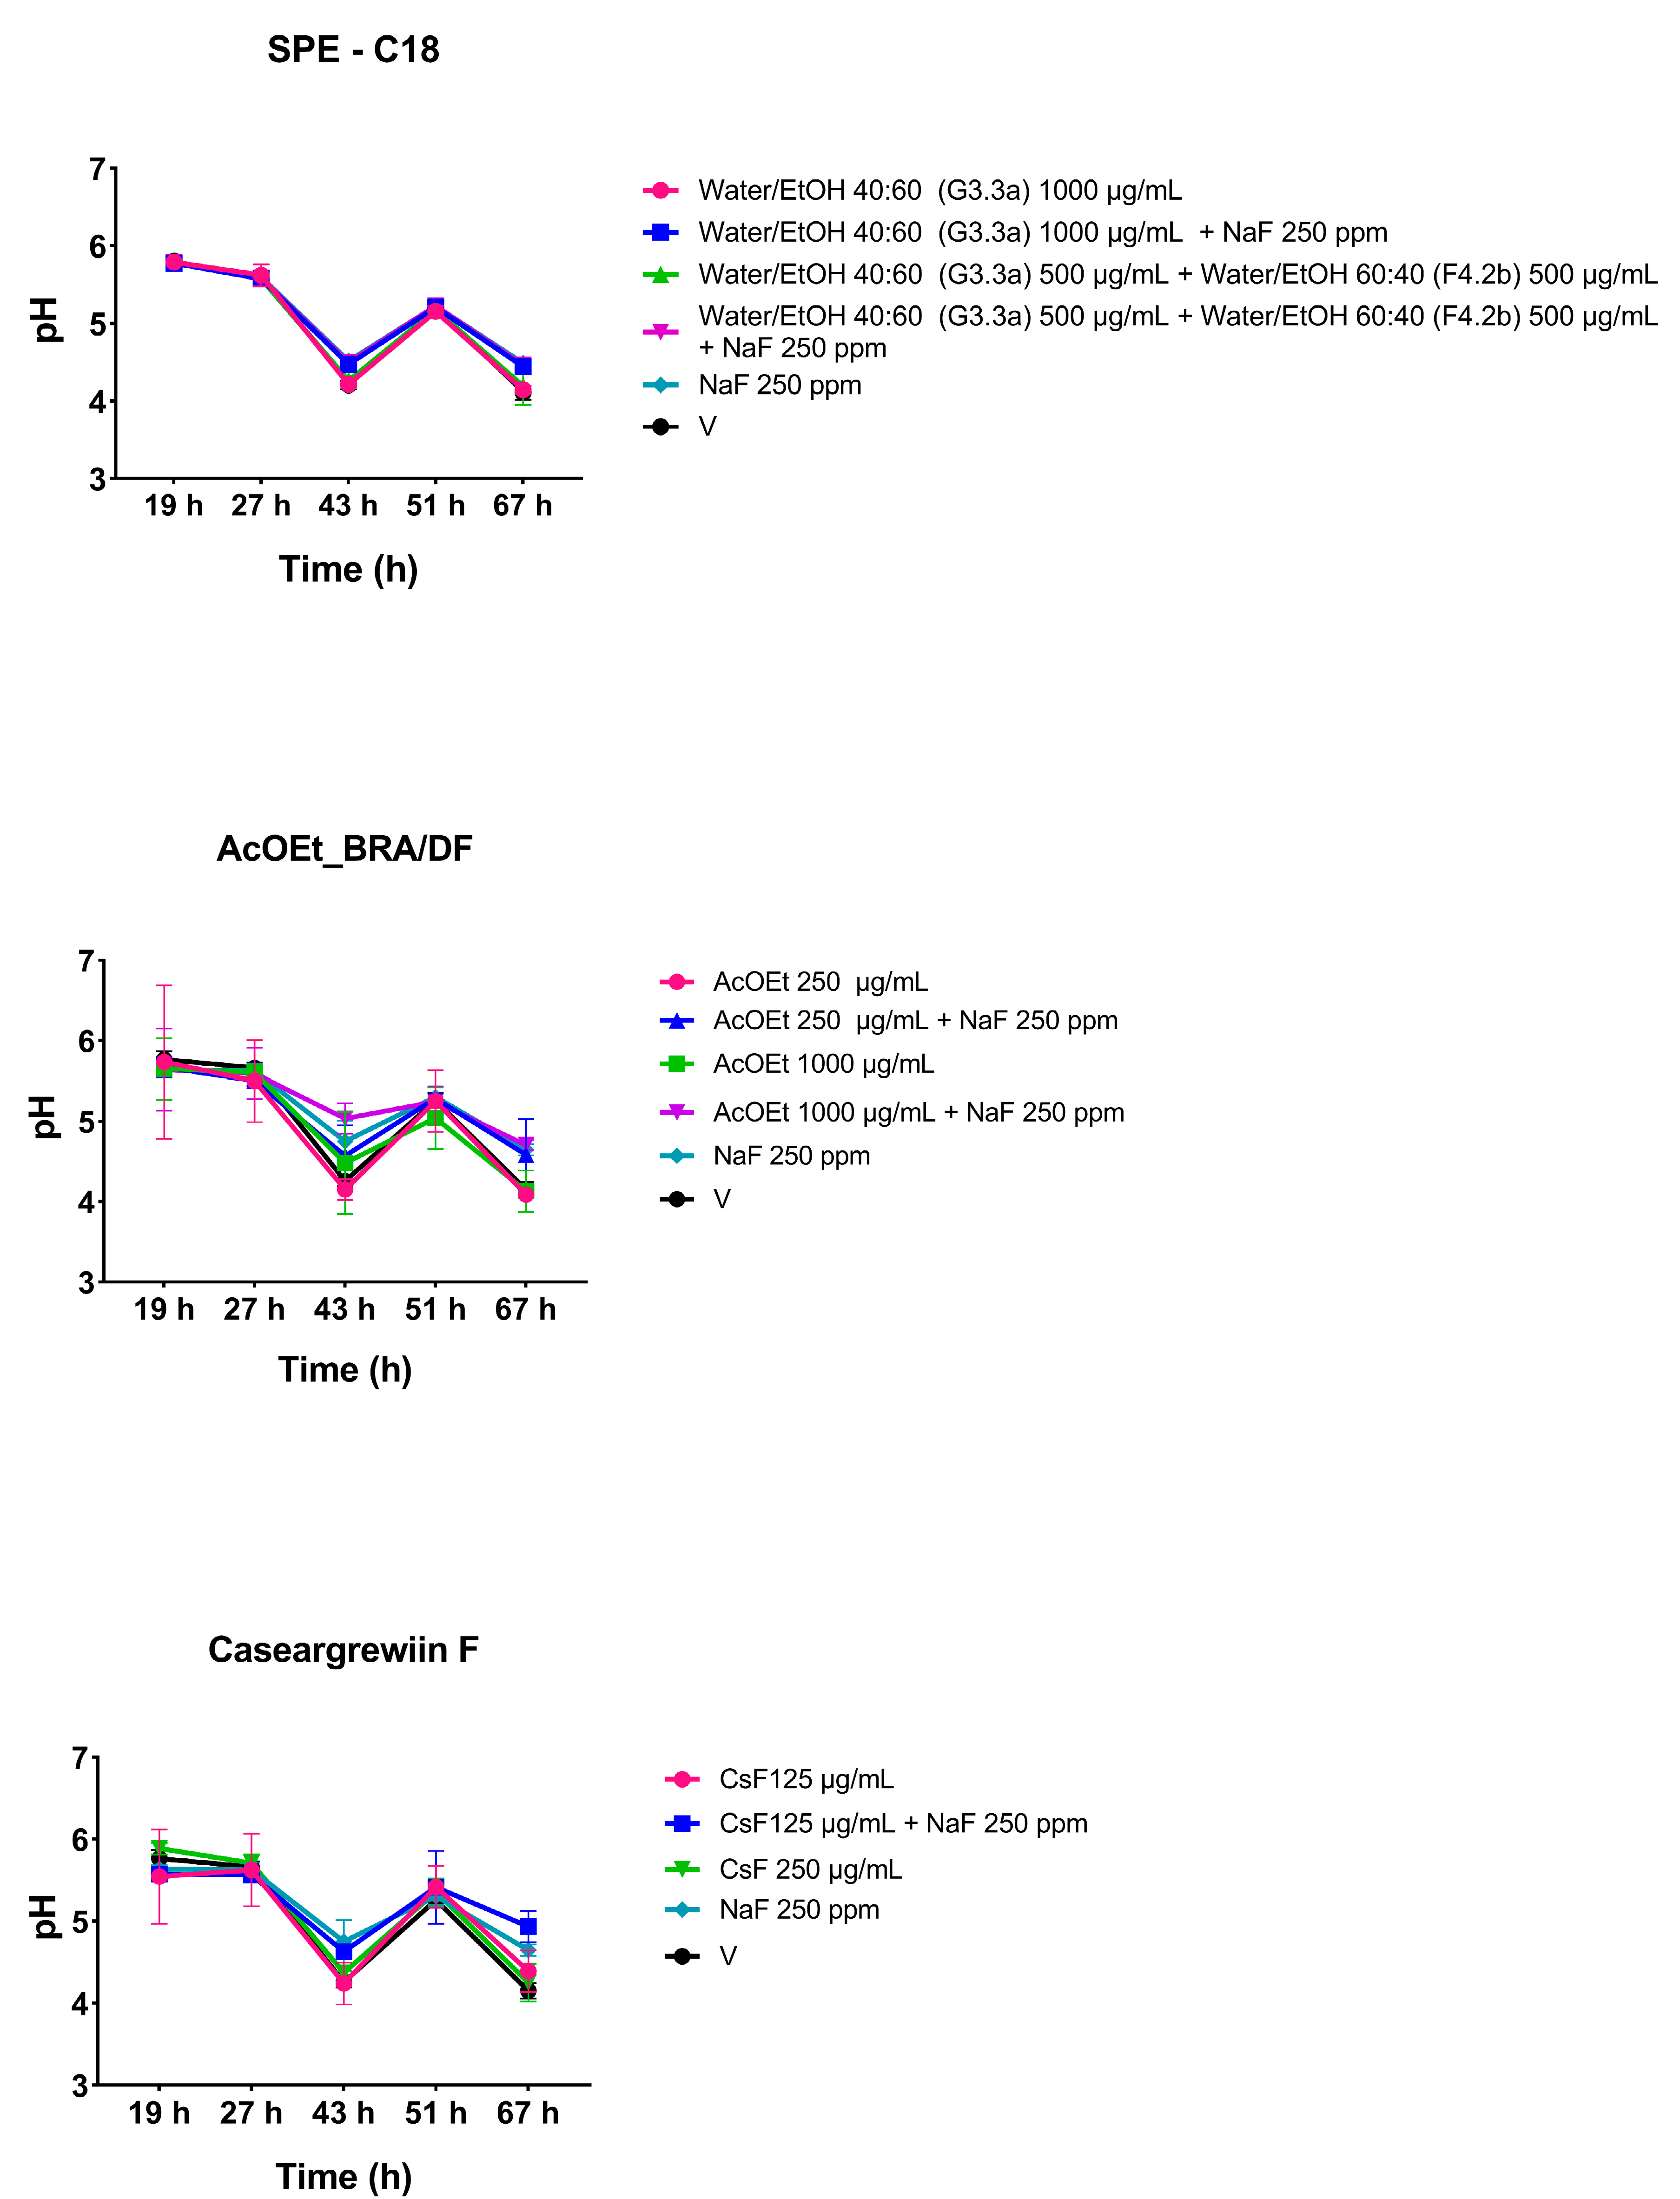
® Silica 60–50 C18, 50 µm; Macherey-Nagel). For sample application and elution, the dry crude extract was dispersed in C18 and deposited on the adsorbent. First, the elution was carried out with Water/EtOH in the proportions 95:05, 60:40, 40:60, and 20:80 and then with pure EtOH, with the aid of a vacuum, using about 150 mL of each eluent. Next, the solvents were evaporated with a Speed Vac, and then, fractions were solubilized with 84.15% EtOH and 15% DMSO and stored at −80 °C until biological assays. After the elution of each crude extract and fraction, the working solution of each one was evaluated for their pH value to ensure that all treatments and vehicle control showed no difference concerning this parameter (
Table S3 in the
Supplementary Materials).
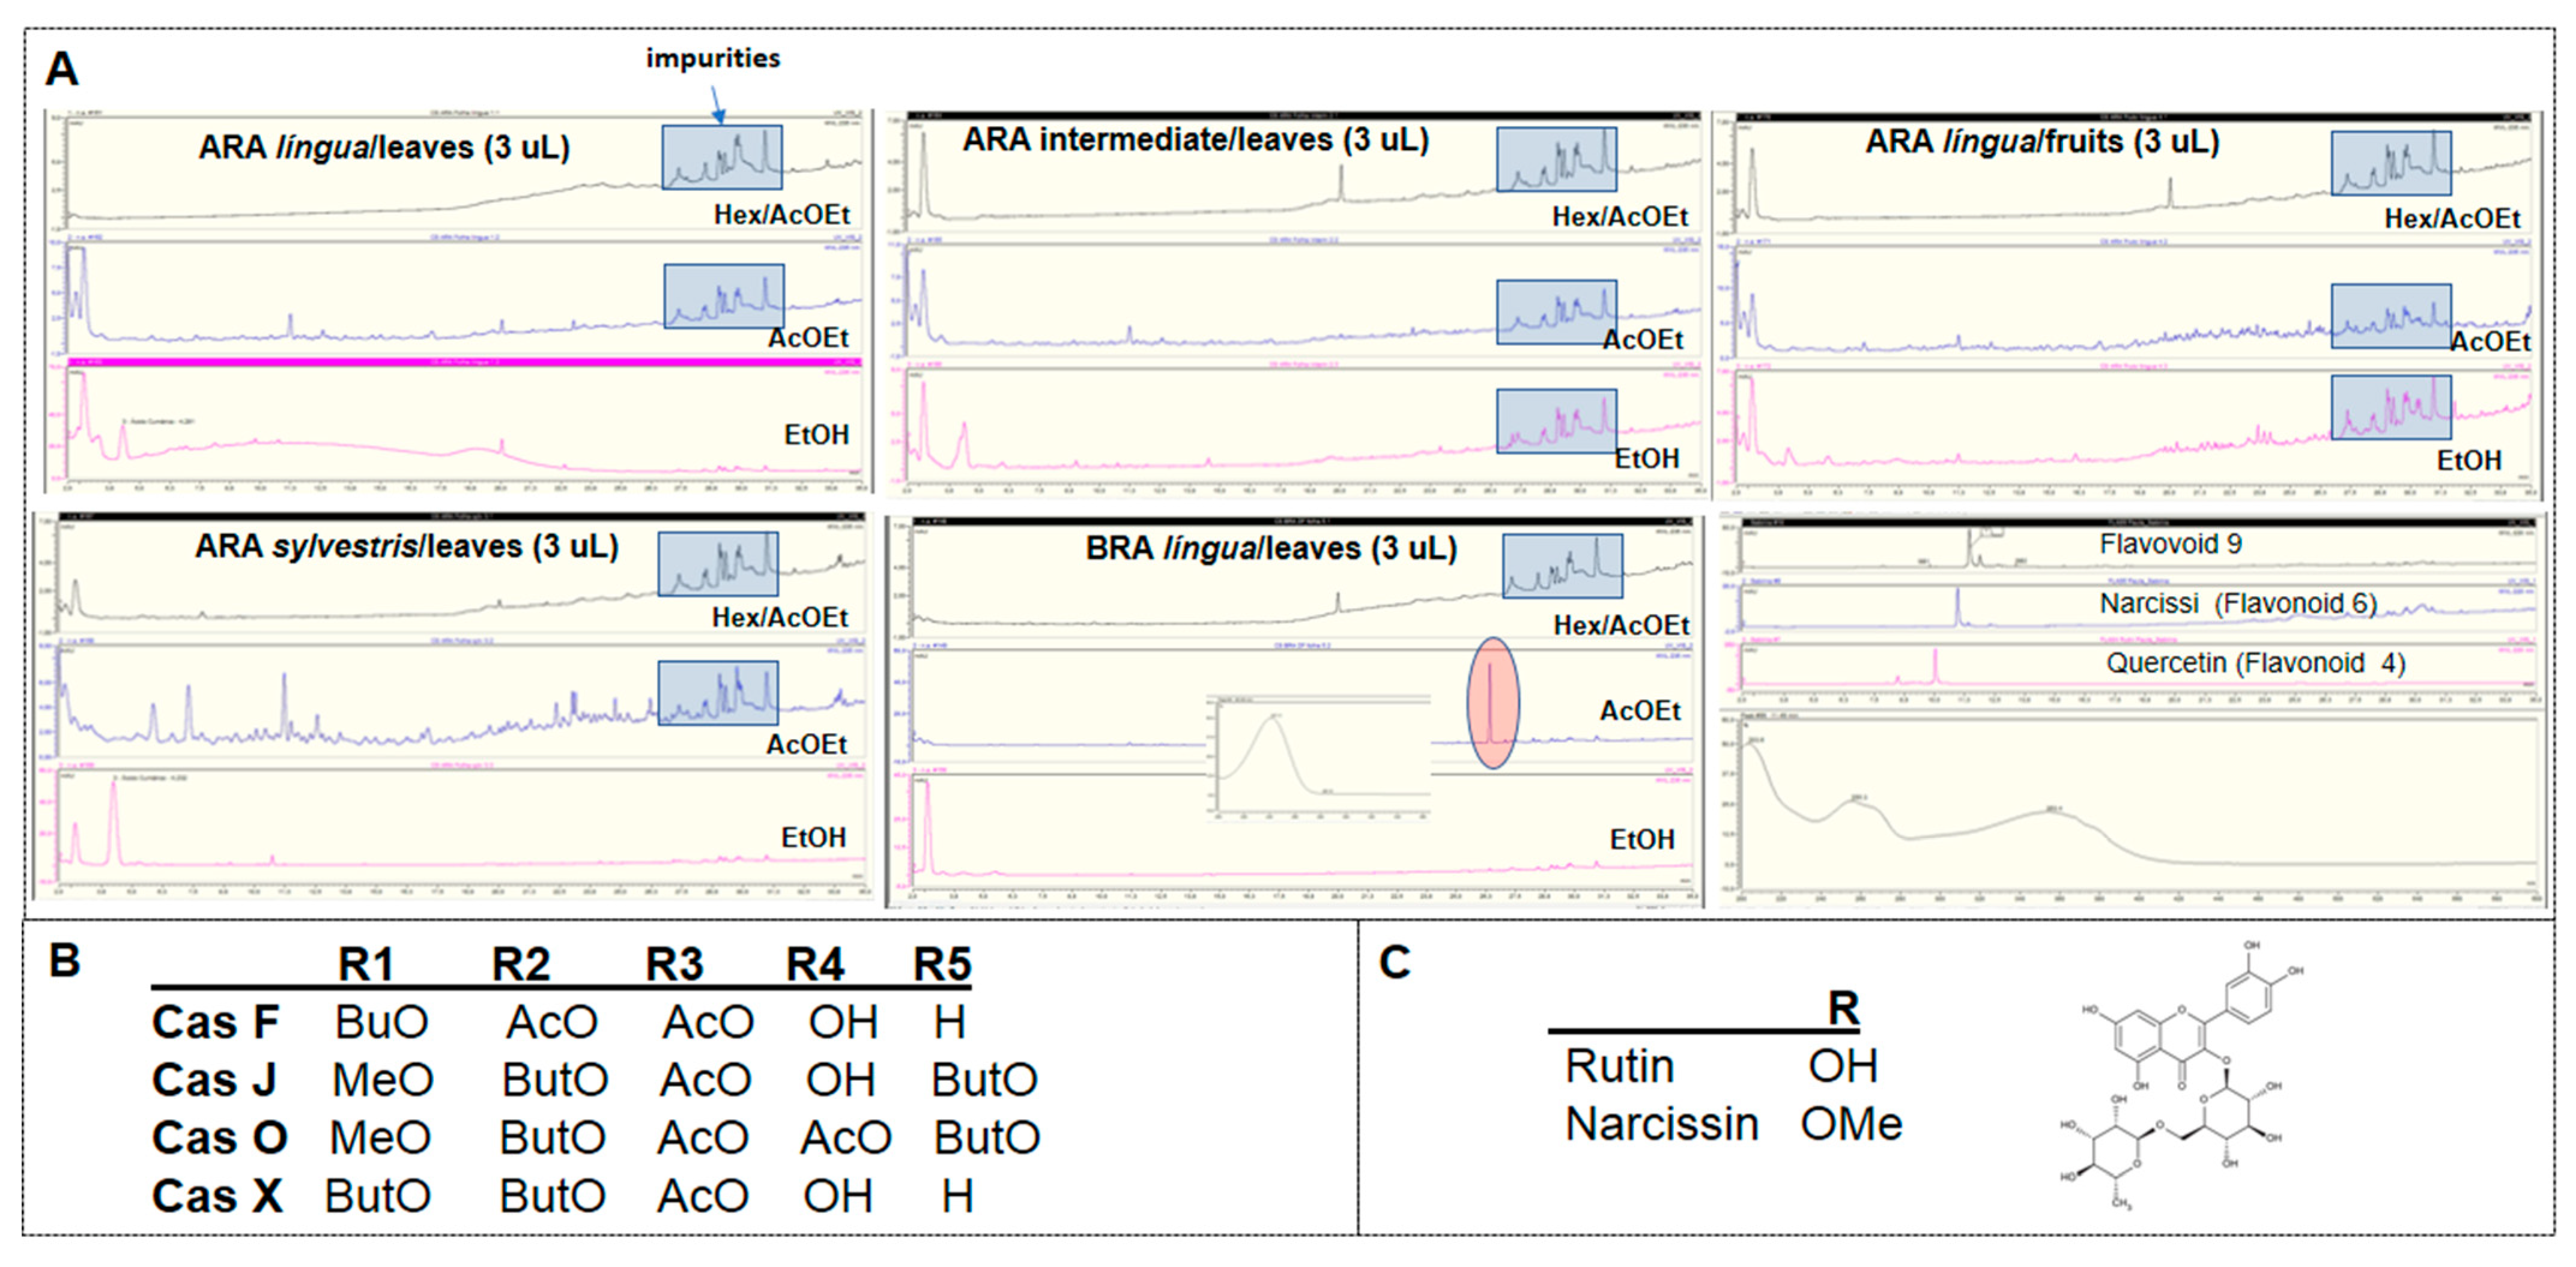
Four compounds were isolated from leaves extracts screened in a previous study [
18]: the flavonoid 4 (rutin), and the clerodane diterpenes Caseargrewiin F, Casearins X and J (
Table 2). The isolation of molecules was performed as described before [
17,
28]. Casearin substitutes are represented in
Table 3.
Casearin substitutes represented in
Table 2 and used in the study, where: OBu = n-C
3H
7CO
2 group; OMe = OCH
3 (methoxy) group; OAc group = CH
3CO
2 (acetate); OH = O-H (hydroxyl) group; H = hydrogen (adapted from [
17]).
4.3. Bacterium Strain and Growth Conditions
Stocks of S. mutans strain UA159 (ATCC 700610) stored at −80 °C (tryptic soy broth containing 25% glycerol; Synth, Diadema, SP, Brazil) were thawed and seeded on blood agar plates (5% blood of sheep; Laborclin, Pinhais, PR, Brazil) and incubated at 37 °C, 5% CO2 for 48 h (Thermo Scientific, Waltham, MA, USA). After, starter cultures were prepared using 10 colonies that were inoculated in tryptone-yeast extract broth (TY; 2.5% tryptone, 1.5% yeast extract, pH 7.0; Becton Dickinson and Company, Sparks, MD, USA) containing 1% glucose (Synth, Diadema, SP, Brazil), followed by incubation for 16 h (37 °C, 5% CO2). Then, the starter cultures were diluted 1:20 in fresh TY + 1% glucose and incubated until the middle of the logarithmic growth phase (optical density or OD540nm 0.847 (±0.273) and colony forming units per milliliter (CFU/mL) 1.37 × 10⁹ (±6.10 × 10⁷); Kasvi spectrophotometer, Beijing, China)). Inoculums for the assays described here were prepared with a defined population of 2 × 10⁶ CFU/mL in TY + 1% glucose for antimicrobial assays and TY + 1% sucrose (Synth, Diadema, SP, Brazil) for biofilm assays.
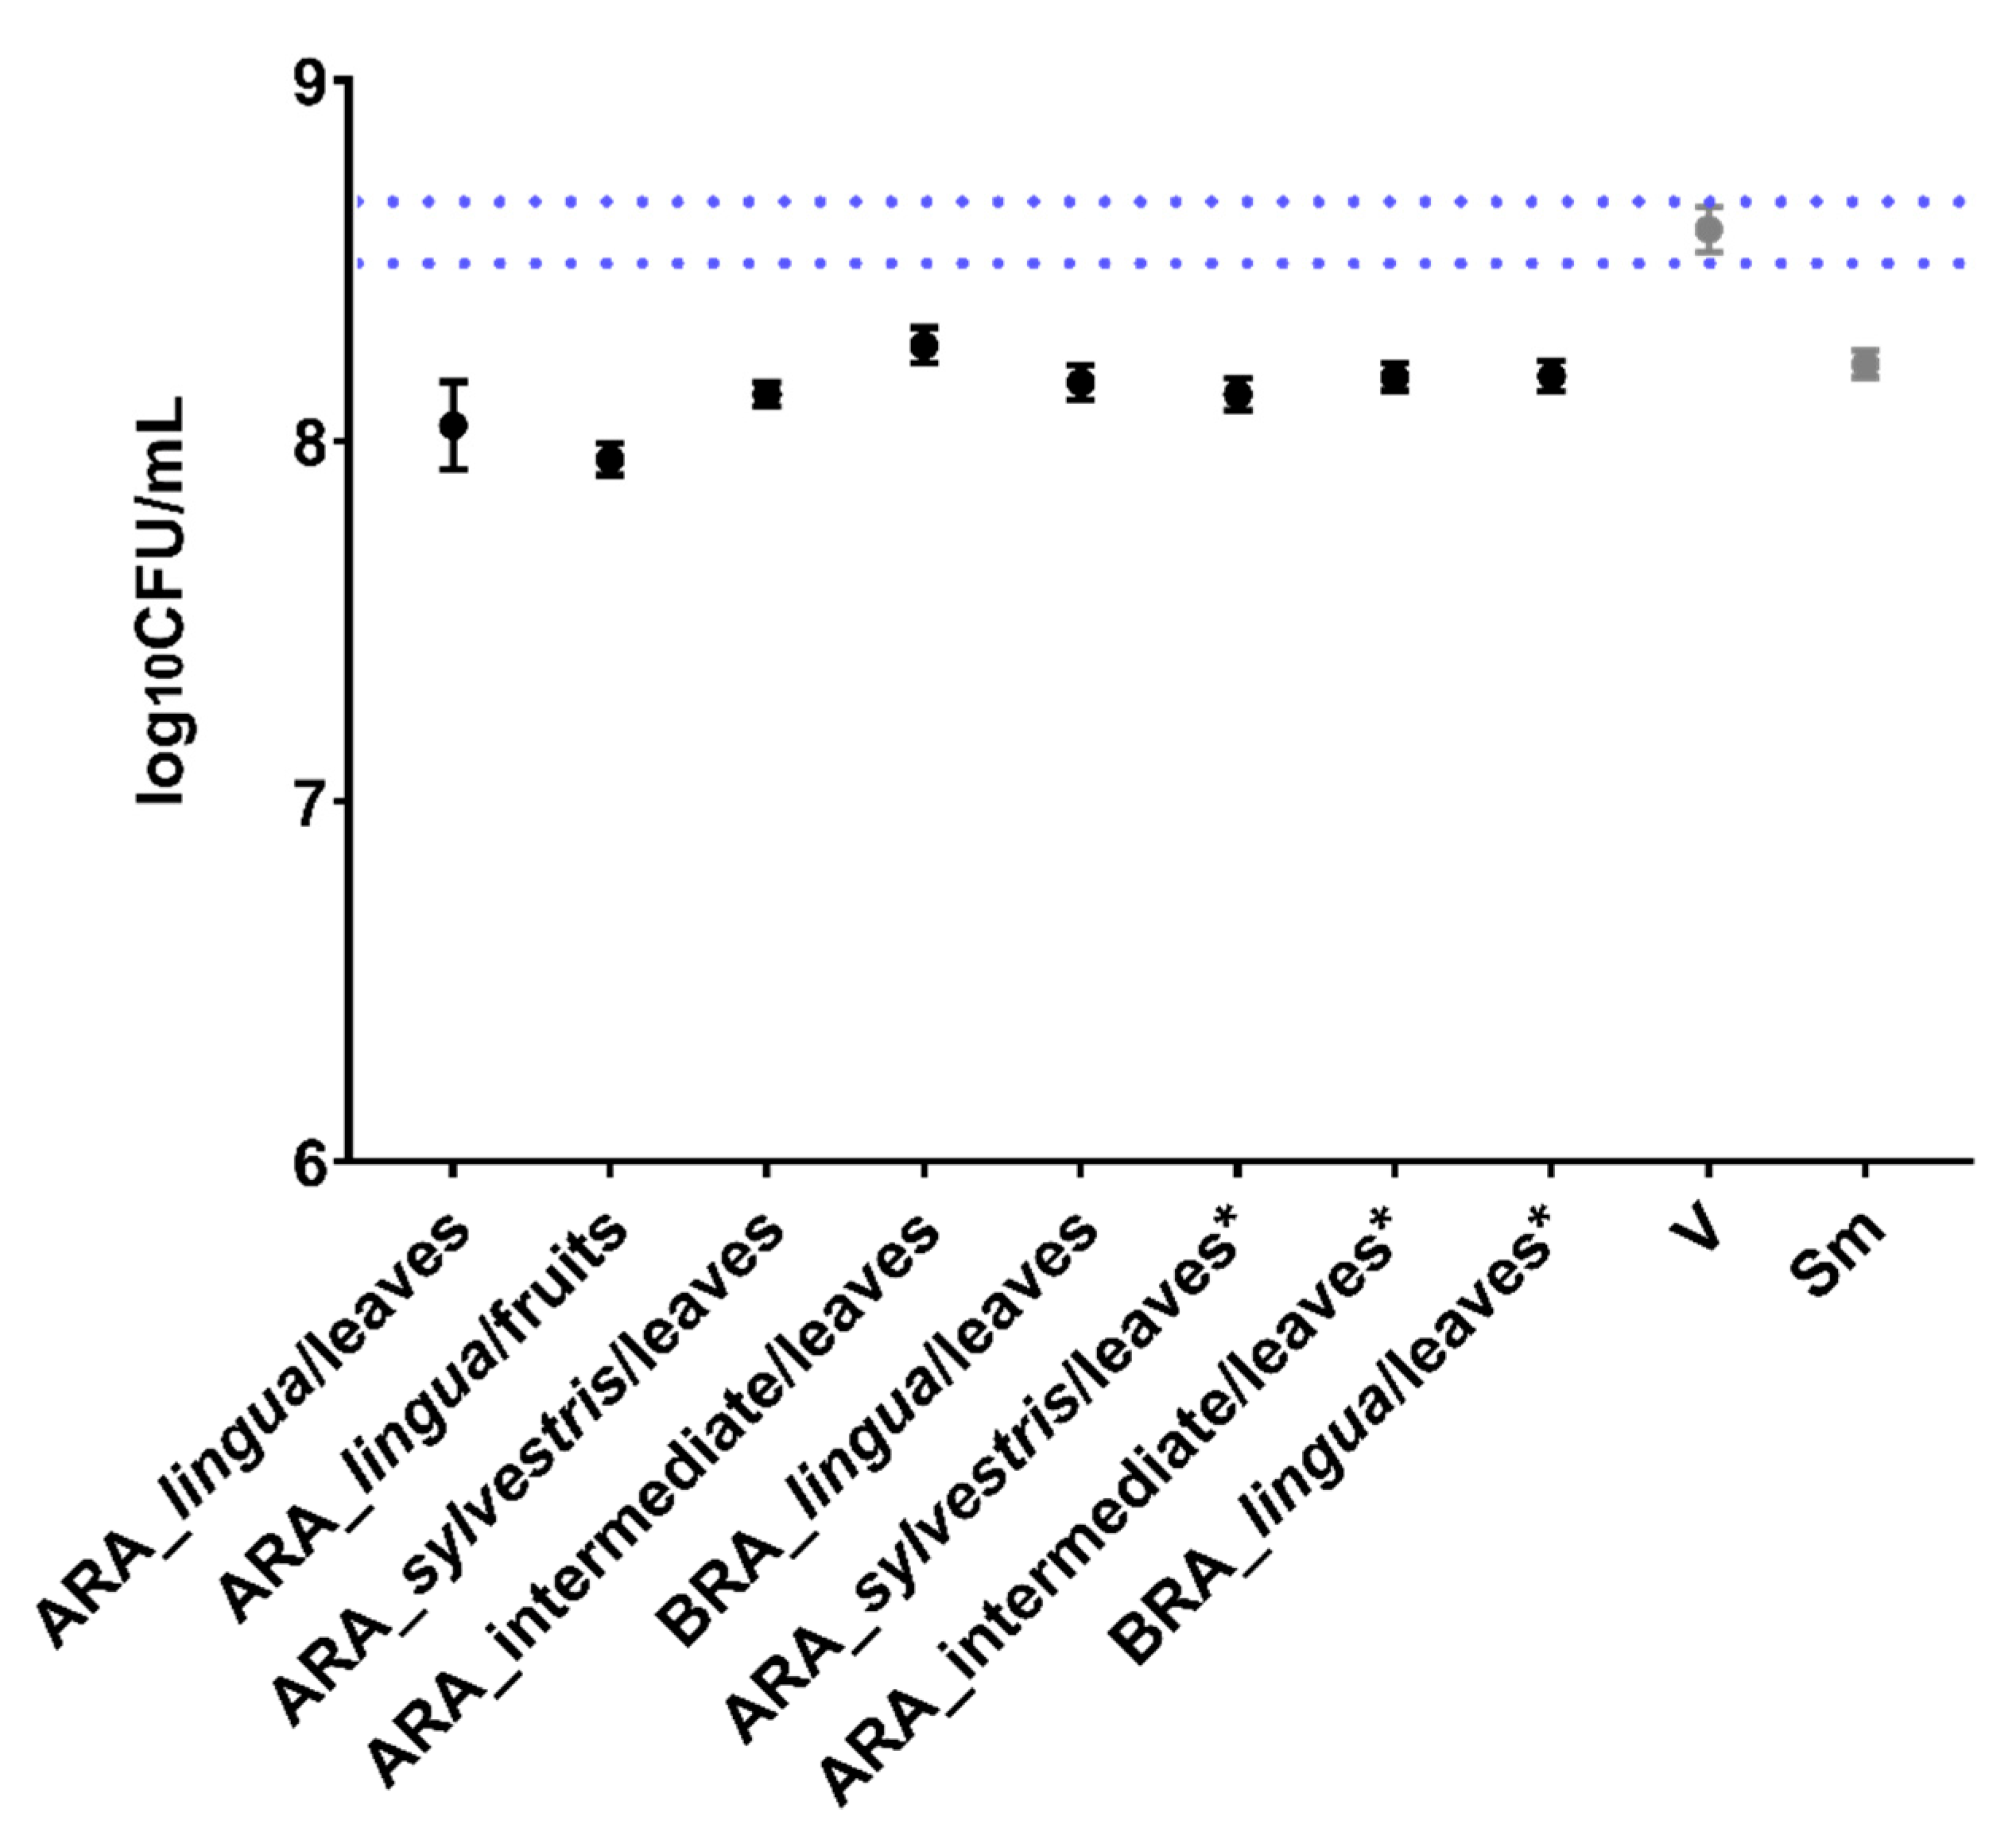
4.4. Antimicrobial Activity through Prolonged Exposure Model (24 h)
Antimicrobial activity was evaluated for crude extracts (500 µg/mL). These concentrations were used due to the yield of extracts and fractions and the scientific literature, which considers adequate studies with 1 mg/mL for extracts or 0.1 mg/mL for isolated molecules [
46]. First, 100 µL of
S. mutans cultures (2 × 10
6 CFU/mL) were transferred to 96-well microplates (Kasvi, Beijing, China) containing test concentrations of treatments or vehicle (control with diluent of treatments) and culture medium (TY + 1% glucose), totalizing 200 µL (resulting in 1 × 10
6 CFU/mL). All experiments contained the following controls: wells containing culture medium only, wells containing only the experiment inoculum (microbial growth control), and wells containing the inoculum plus vehicle or 0 µg/mL). Then, the microplates were incubated (24 h, 37 °C, 5% CO
2). After, a visual analysis of the wells was performed (turbidity: microbial growth; clear: no growth), followed by the reading of OD
562nm readings (ELISA plate reader, Biochrom Ez, Cambourne, UK). Furthermore, to determine the viability of the microbial cells, an aliquot from each well was used for a serial 10-fold dilution (10
−1 to 10
−5) in microtubes containing saline solution (0.89% NaCl; Química Moderna, Barueri, SP, Brazil) and 10 µL aliquots of each dilution plus undiluted culture were used for plating in duplicate on BHI agar plates (Himedia, Dindhori, Nashik, India) and incubated (48, 37 °C, 5% CO
2) followed by colony counting. CFU data were transformed into log
10 and analyzed versus the vehicle control. Each treatment was performed in triplicate on two separate occasions (
n = 2) [
18,
29].
4.5. Antibiofilm Activity through Prolonged Exposure Models (24 h)
The antibiofilm activity of crude extracts 500 µg/mL, fractions (250 µg/mL and 500 µg/mL), and molecules (125 µg/mL) was investigated [
18,
46]. This analysis was performed using two treatment exposure settings: (I) activity against initial biofilm formation (incubation of agents with cells from the beginning of biofilm formation until analysis after 24 h) for crude extracts, Hex; AcOEt and EtOH fractions, and SPE-C18 fractions; (II) activity against pre-formed biofilm (24 h old biofilms were exposed to treatments for 24 h, yielding 48 h old biofilms) for AcOEt_BRA/DF and EtOH_BRA/DF, Flavonoid 4, Caseargrewiin F (or CsF), and Casearins X and J.
4.5.1. Activity against Initial Biofilm Formation (24 h Old Biofilms)
For 24 h old biofilms, treatments were introduced at 0 h, and biofilms were evaluated at 24 h of development to assess inhibition of biofilm formation. Biofilms were formed in polystyrene microplate wells to verify the viable population (CFU/biofilm) of bacterium cells in biofilms treated by crude extracts or fractions, as described before [
29]. A 96-well plate was prepared as described in item 4.4, including the set of controls. However, here, the culture medium used was TY + 1% sucrose. The plate was incubated (24 h, 37 °C, 5% CO
2). Then, a visual analysis of wells was performed, and the plate was subjected to orbital shaking (5 min, 75 rpm, 37 °C; Quimis, G816 M20, São Paulo, Brazil). The culture medium with loose cells was aspirated and discarded. The biofilms remaining in the wells were washed (three times) with a pipette and 200 µL of 0.89% NaCl solution to remove non-adhered cells. Next, these biofilms were scraped with pipet tips five times with 200 µL of 0.89% NaCl, totalizing 1 mL of biofilm suspension (from each well). This biofilm suspension was placed in a microtube and subjected to serial dilutions (10
−1 to 10
−5), which were plated, as were the undiluted biofilm suspensions. The BHI plates were incubated (48 h, 37 °C, 5% CO
2), followed by colony counting. Next, data CFU were transformed into log
10 and analyzed compared to the vehicle control. Two independent experiments were performed in triplicate (
n = 2).
4.5.2. Activity against Pre-Formed Biofilms (48 h Old Biofilms)
In this setting, the biofilms were formed in polystyrene microplate wells without the addition of any treatment or vehicle control. After 24 h, the formed biofilms were exposed to treatments for 24 h to determine the prevention of biofilm accumulation (48 h biofilms). Then, the biofilms were evaluated at 48 h of development to verify the inhibition of biofilm formation via viable population analysis (CFU/biofilm) [
33]. For this evaluation, 50 µL of final inoculum of
S. mutans (2 × 10
6 CFU/mL) and 50 µL of TY + 1% sucrose (to obtain 1 × 10
6 CFU/mL), and 50 µL of TY + 1% sucrose (to reach 1 × 10
6 CFU/mL) were added to wells of 96-well plates. The microplate was incubated (24 h, 37 °C, 5% CO
2) without any treatment or vehicle control. After incubation and biofilm formation, visual analysis was performed, followed by culture medium removal and washing of the remaining biofilms (three times with 0.89% NaCl solution). Next, fresh culture medium TY + 1% sucrose and test concentrations of treatments or the vehicle were added. For each experiment, the same controls described in item 4.4 were included. The microplate was incubated again (24 h, 37 °C, 5% CO
2). After incubation (when biofilms were 48 h old), the same processing protocol applied for 24 h old biofilms was conducted until obtaining 1 mL of biofilm suspension. The biofilm suspensions were sonicated (30 s, 7 w, Sonicator QSonica, Q125, Newtown, CT, USA) and subjected to serial dilutions (10
−1 to 10
−5), which were plated in BHI agar (in addition to undiluted biofilm suspensions), followed by incubation (48 h, 37 °C, 5% CO
2) and colony counting. Next, data CFU were transformed into log
10 and analyzed compared to the vehicle control. Two independent experiments were performed in triplicate (
n = 2).
4.6. Analysis of the Effect of Topical Application (Brief Exposure Time) of Formulations on Biofilms Formed on sHA Discs
In this step, selected treatments (“promising” data for antibiofilm activity on initial and pre-formed biofilms) were used to prepare formulations (combined with and without sodium fluoride-NaF). These formulations were then tested on sHA discs and biofilms grown on them [
47]. The selected fractions were AcOEt_BRA/DF, SPE-C18 Water/EtOH 40:60 (G3.3a), and Water/EtOH 60:40 (F4.2b), and the molecule was CsF.
4.7. Biofilm Analyses
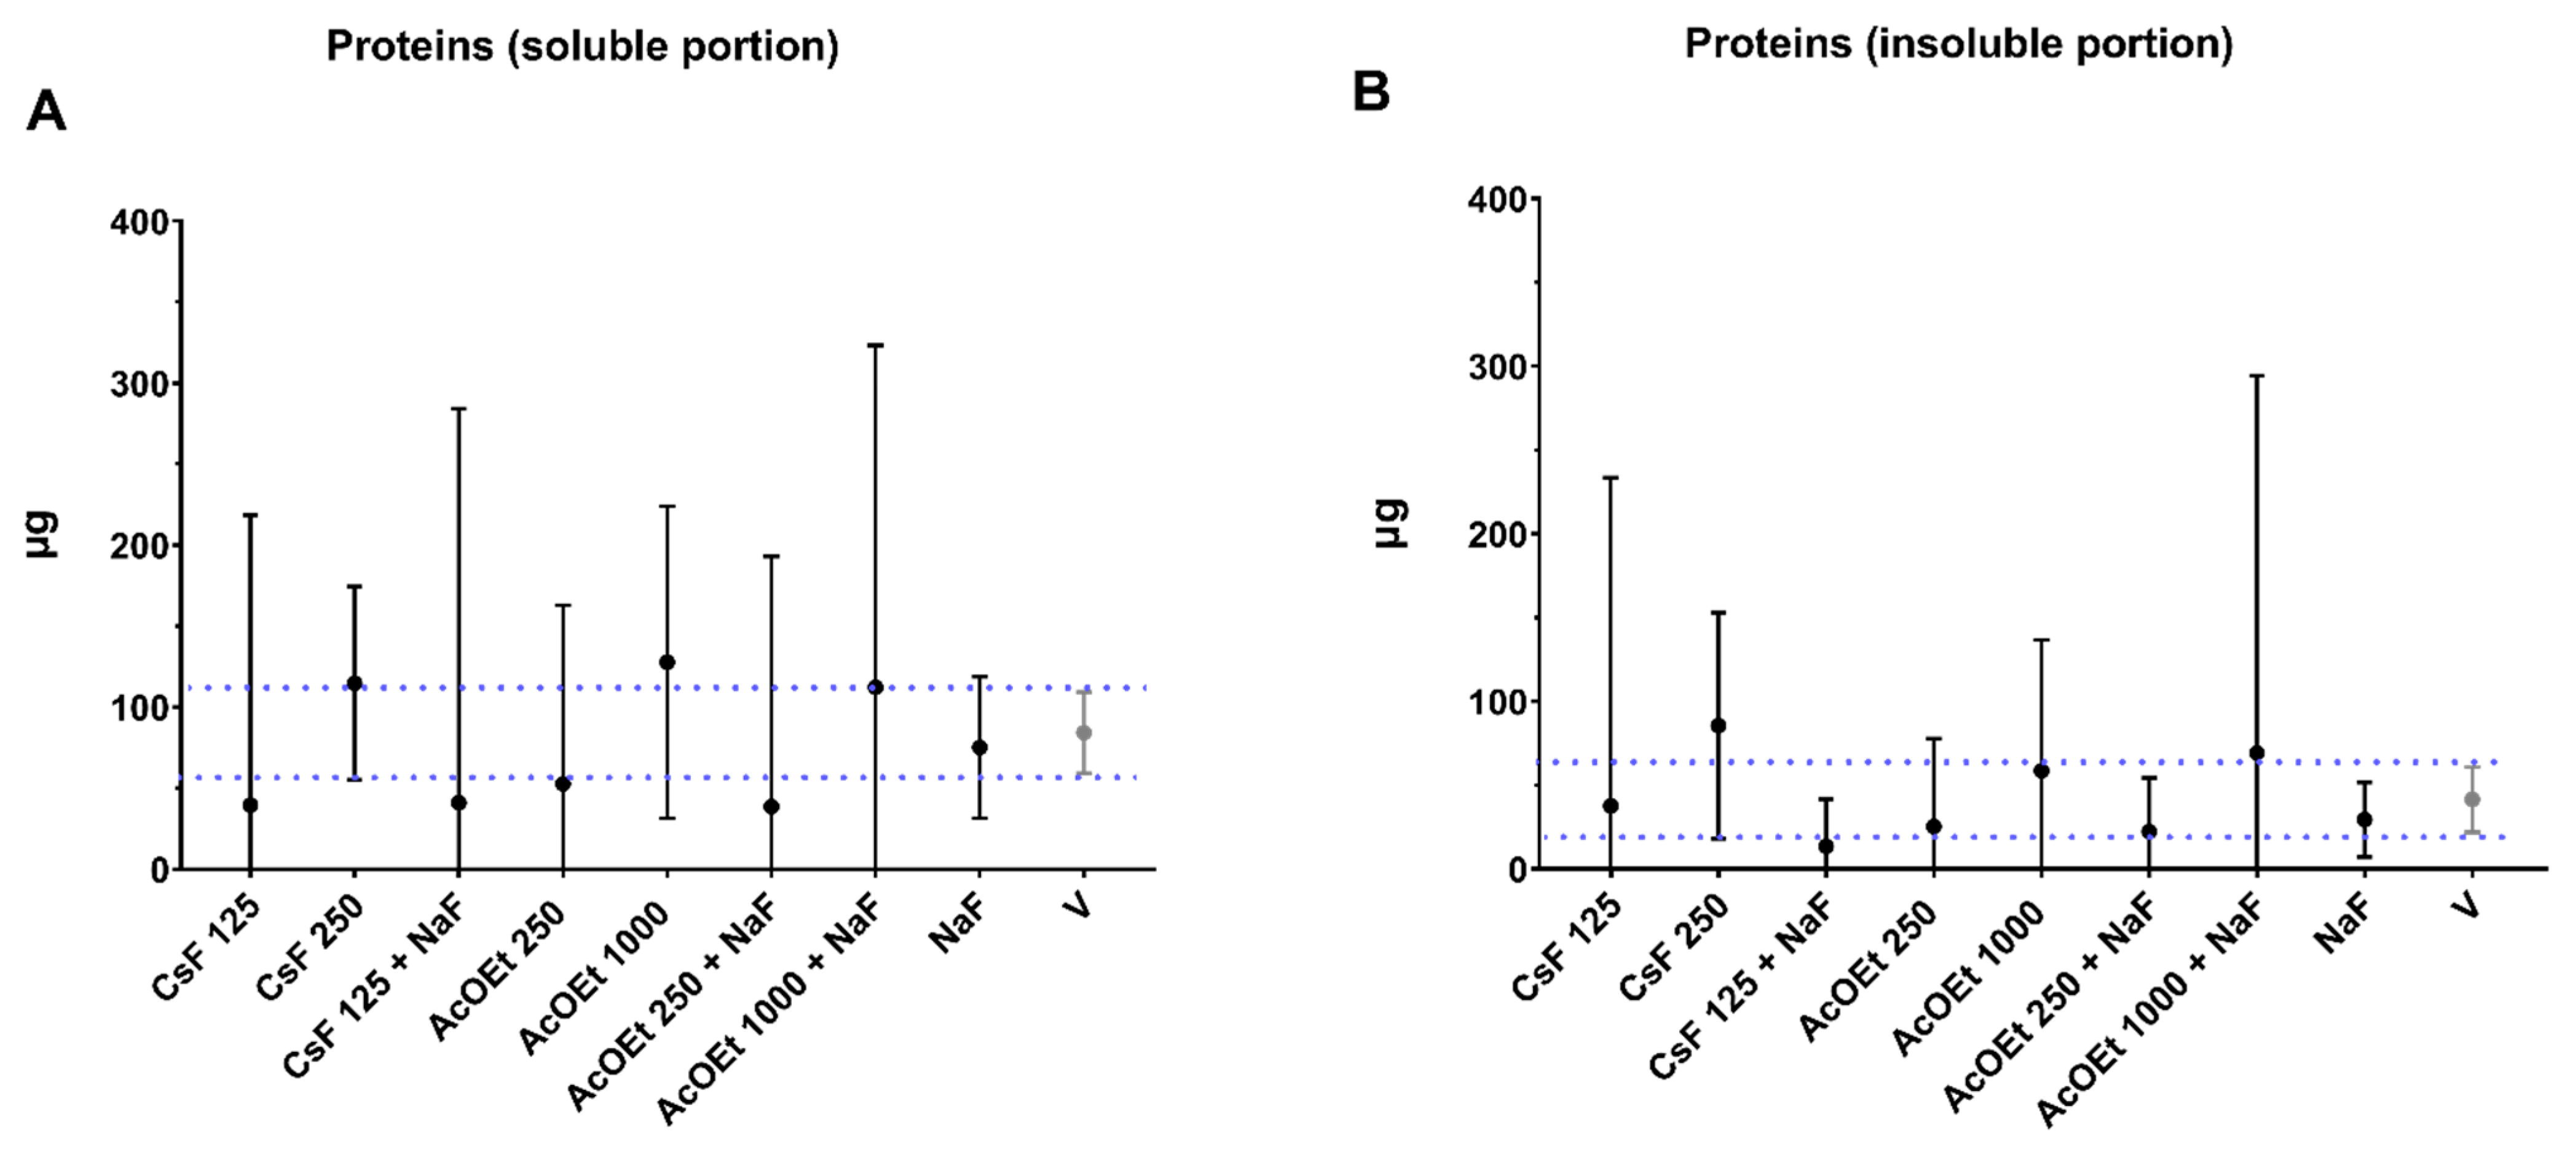
4.7.1. Biofilm Processing and Standard Methods of Biochemical Analysis (Colorimetric) and Microbial Culture Method
When they reached 67 h, the biofilms were processed for analyses following previously described protocols [
48]. Standard methods of biochemical analysis (colorimetric) were used to determine total protein content (in the soluble portion and the insoluble portion;
Figure A4), exopolysaccharides content (water-soluble and -insoluble) and a bacterial culture method to determine the biofilm biomass (dry weight) and population. Furthermore, the amount of eDNA in the matrix was evaluated [
47]. Briefly, after 67 h of formation, the biofilms were washed by immersion in wells containing sterile 0.89% NaCl solution. Each biofilm (disc) was transferred to a glass tube containing 1 mL of saline. Then, the walls of each tube were washed with 1 mL of saline solution. The glass tubes with biofilms/discs were placed in a Beaker, and the set was sonicated in a water bath for 10 min (model CD-4820, Kondentech Digital, São Carlos, Brazil). Afterward, the surfaces of each disc were scraped with the aid of a sterile metal spatula, taking care to remove any remaining biofilm from each disc. The volume of each biofilm suspension (2 mL) was transferred to a new 15 mL tube. Then, each glass tube was washed with 3 mL of saline solution, which was transferred to the tube containing the initial 2 mL, totaling 5 mL of biofilm suspension per biofilm/disc. Each biofilm suspension (5 mL) was sonicated through a probe at 7 w for 30 s. An aliquot of each suspension (100 µL) was used for serial dilutions (10
−1 to 10
−5) to determine the number of CFU/biofilm by plating on BHI agar plates (48 h, 37 °C, 5% CO
2). Next, data CFU were transformed into log
10 and analyzed compared to the vehicle control. One or two independent experiments were performed in duplicate.
The remaining volume (4.9 mL) was centrifuged (3220×
g, 20 min, 4 °C). The supernatant (with soluble extracellular matrix components) was transferred to a new tube (15 mL Falcon tube–supernatant), and the pellet (precipitate with the microbial cells and insoluble matrix components) was washed twice with 2.6 mL sterile Milli-Q water (3220×
g, 20 min, 4 °C). The supernatants generated during the two washes were combined with the first supernatant obtained, totaling 10 mL, which was used to isolate and quantify water-soluble exopolysaccharides (6 mL plus 18 mL of 99% EtOH to precipitate the polysaccharides, followed by phenol-sulfuric colorimetric assay) [
49], eDNA (500 µL) and proteins (500 µL) [
9]. The pellet was suspended in 1 mL of Milli-Q water, of which 50 µL was used to quantify proteins and 950 μL to quantify insoluble dry weight (biomass), followed by the isolation and quantitation of water-insoluble exopolysaccharides (or alkali-soluble polysaccharides [
48].
4.7.2. Laser Scanning Confocal Fluorescence Microscopy
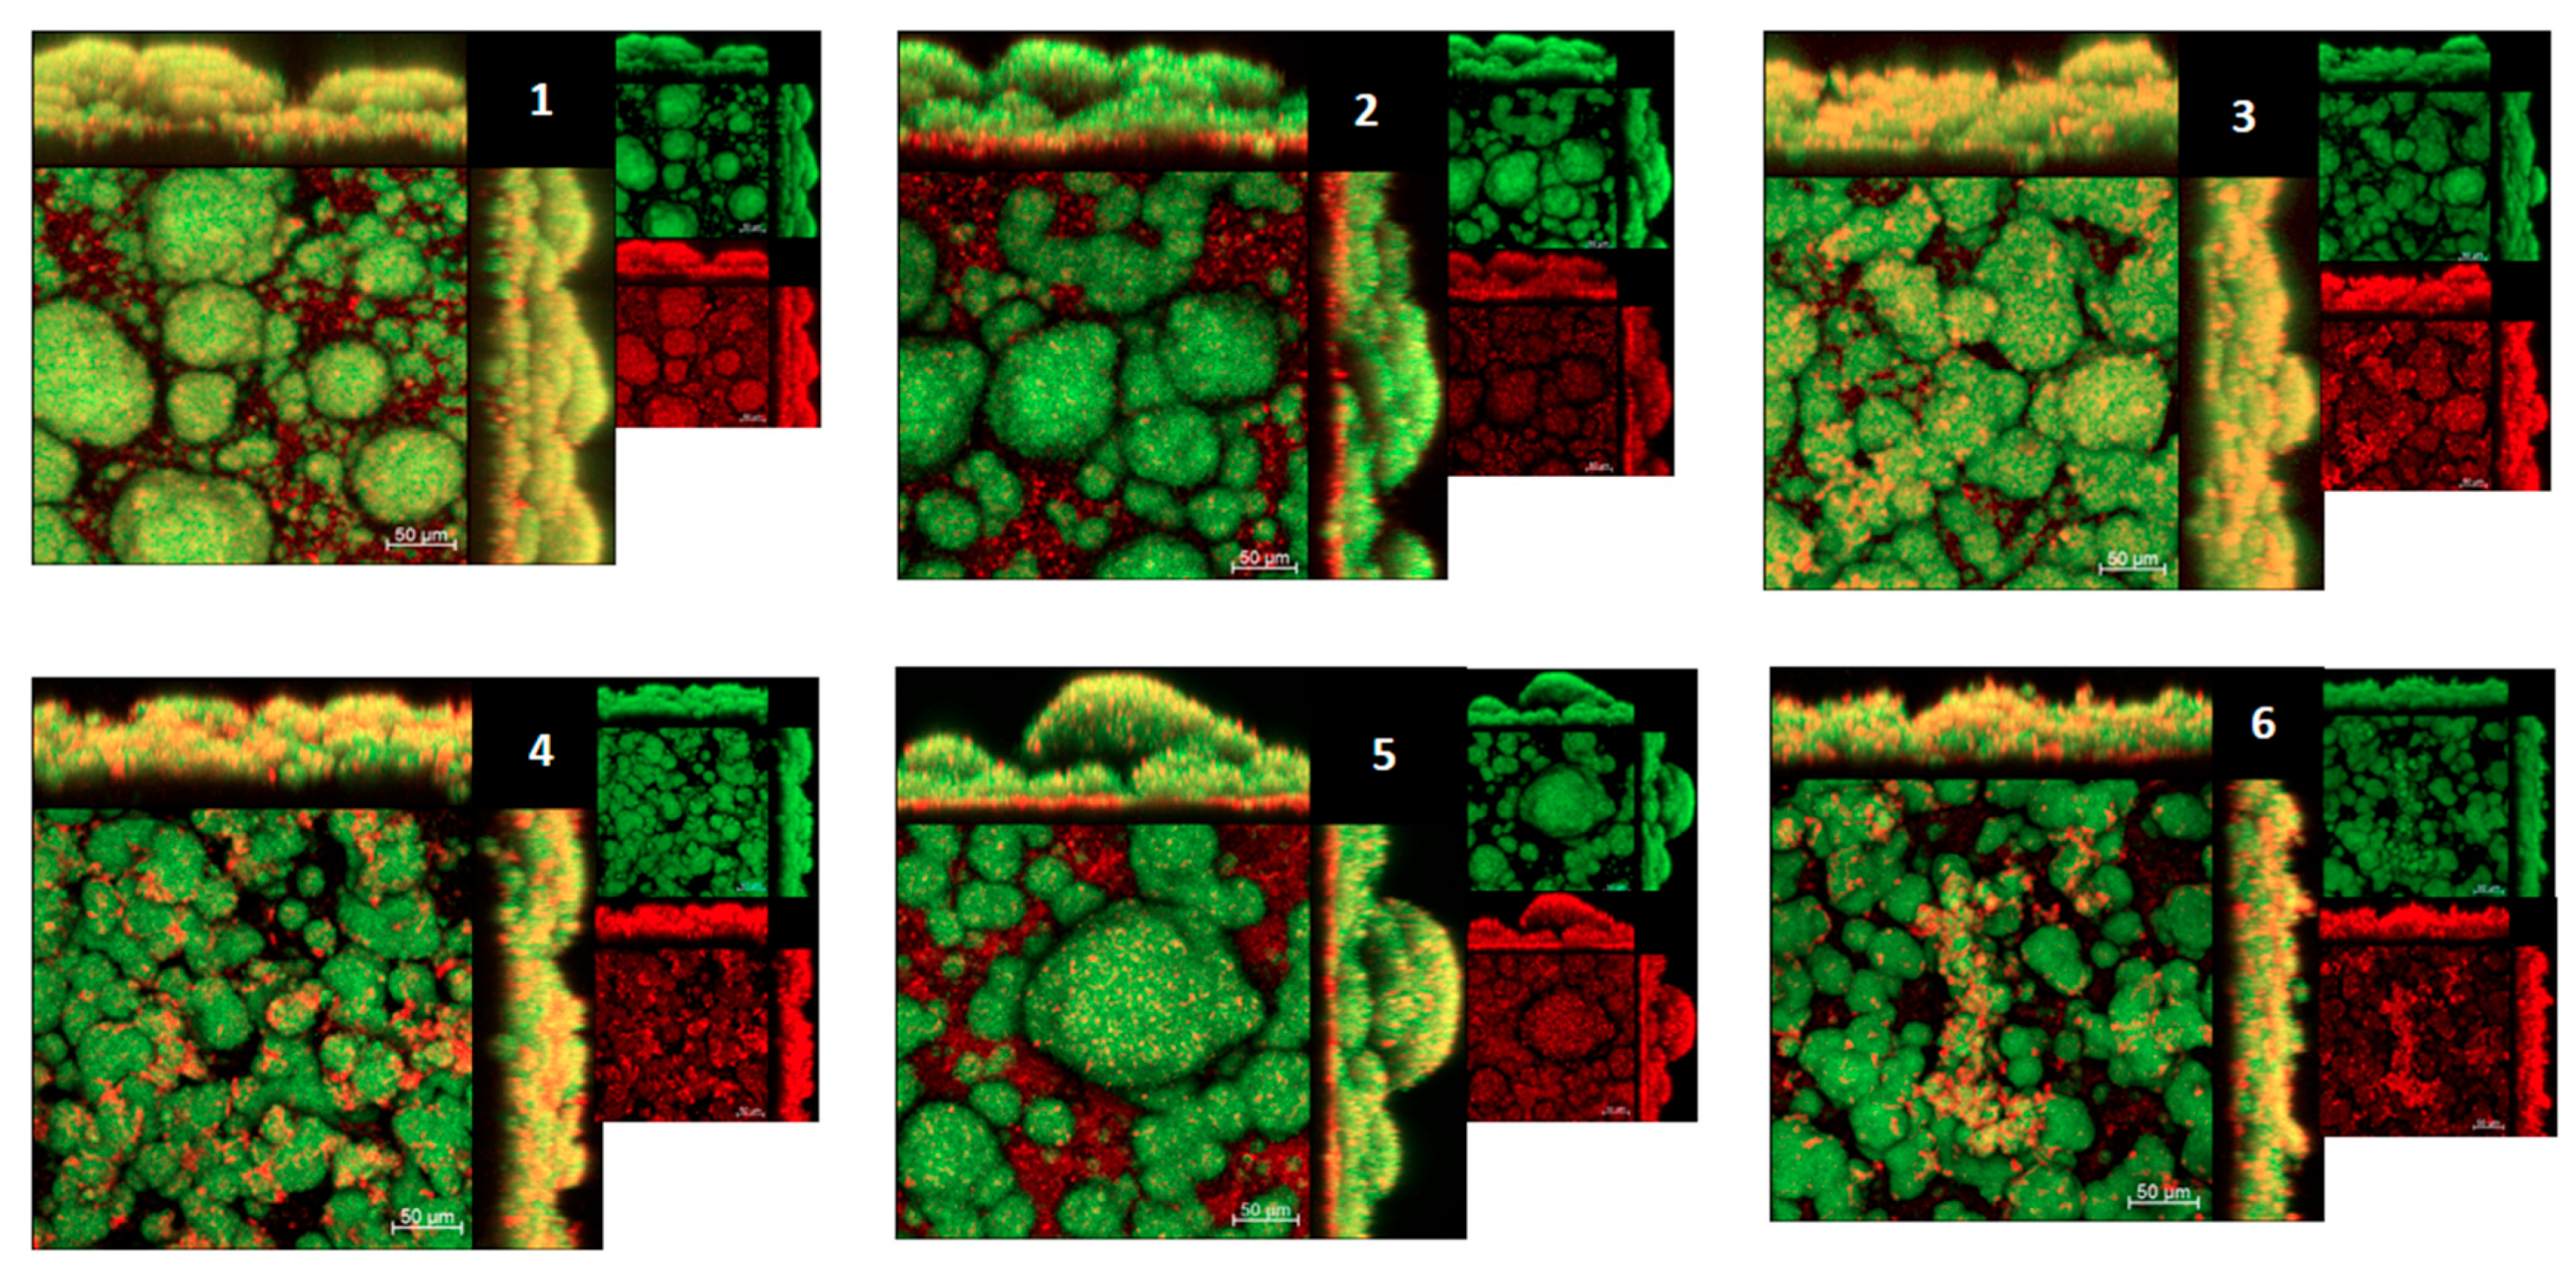
For confocal microscopy analyses, biofilms were formed and treated with SPE-C18 (as described above), except that here, 1 μM Alexa Fluor™ 647-labeled dextran conjugate (absorbance/fluorescence emission maxima of 647/668 nm; Molecular Probes, Carlsbad, CA, USA) was added to the culture medium at the beginning of and during the development of the biofilms [
50]. This method allows for the incorporation of labeled dextrans into exopolysaccharides during its synthesis process and matrix build-up. At 67 h of development, biofilms/discs were dip-washed into wells containing 0.89% NaCl and transferred to wells containing 0.89% NaCl solution and SYTO™ 9 (485/498 nm; Molecular Probes, Carlsbad, CA, USA), which is a green, fluorescent nucleic acid marker for detecting bacteria [
50]. Each biofilm was scanned at three randomly chosen positions, and optical sectioning at each of these positions generated a series of confocal images. The image of the three-dimensional structure of these biofilms was performed using a Zeiss LSM 780 microscope (Zeiss, Jena, Germany) equipped with a Multialkali-PMT detector, 488 nm (SYTO9) and 561 nm (Alexa Fluor 647) laser, EC Plan-Neofluar objective of 20x, with a scale of 0.312 × 0.312 μm per pixel and increments of 1.5 μm. Images were acquired and analyzed using ZEN Blue 2.3 software for 3D reconstruction.
4.8. Growth Inhibition Curve for Selected Treatments Associated with Gene Expression Analysis
The fraction AcOEt_BRA/DF (250 µg/mL) showed activity against initial biofilm formation (24 h), and the molecule CsF (125 µg/mL) showed activity against pre-formed biofilm (48 h). Thus, they were tested in planktonic culture to determine
S. mutans growth inhibition curve, using the cultures at the mid-log growth phase [
51].
4.8.1. Growth Inhibition Curve
In a 48-well polystyrene microplate, 150 μL of S. mutans inoculum (prepared as described above) was added to each well of the plate containing the treatments at the concentrations to be evaluated. Two wells were prepared to contain the inoculum and culture medium (TY + 1% glucose) and one containing only the culture medium (control for visual analysis of bacterial growth). An aliquot of the inoculum was seeded to determine the amount of CFU/mL at 0 h (before starting incubation and adding treatments-inoculum control). After incubation for 1 h, 2 h, 4 h, 6 h, and 24 h (37 °C, 5% CO2), visual observation and seeding of cultures on BHI agar plates were performed. For that, a 10 μL aliquot of the pure culture was seeded on a BHI agar plate, and 40 μL was removed from each well and transferred to microtubes containing 360 μL of 0.89% NaCl (dilution 1:10 v/v), followed by serial dilution and seeding on BHI agar plates. The plates were incubated (48 h, 37 °C, 5% CO2). After that, colony counts were performed for the treatment and vehicle control, and the calculation of the log number of CFU/mL of the treatment was compared to the vehicle control. Two experimental occasions were carried out, in duplicate, for the treatments and control tested (n = 2). At 2 h, 4 h and 24 h an aliquot of AcOEt_BRA/DF was diluted 1:1 (v/v) in 2.5% glutaraldehyde, and the same procedure was performed for CsF at 4 h and 24 h. The samples were stored in a refrigerator for scanning electron microscopy (SEM) analysis.
4.8.2. Preparation of Cultures for SEM Analysis
Samples were diluted 1:11 v/v in 2.5% glutaraldehyde and were centrifuged (5 min, 15,294× g, 4 °C). Then, the supernatant was discarded, taking care not to detach the pellet, and 500 µL of 70% EtOH was added to the pellets, and the samples were incubated for 1 h at room temperature. Afterward, the samples were centrifuged (5 min, 15,294× g, 4 °C; Centrifugue 5430R, Eppendorf, Hamburg, Germany), the supernatant discarded, 500 µL of 90% EtOH was added to the pellets, and the samples were incubated for another 1 h at room temperature. Afterward, the samples were centrifuged (5 min, 15,294× g, 4 °C) and the supernatant was discarded. Then, the pellets were resuspended in 10 µL of absolute EtOH, and this volume was transferred to clean coverslips and placed in a 24-well plate. After complete evaporation of absolute EtOH, the plate was kept in a glass desiccator with silica until the analysis. Each sample was fixed with double-sided tape on the sample holder, and after, the samples were covered with carbon. The analysis using a high-resolution field emission electron microscope (MEV-FEG; JEOL, model JSM-7500F) with PC operating software PC-SEM v 2,1,0,3, equipped with secondary electron detectors, backscattered and chemical analysis (energy dispersive spectroscopy-EDS; Thermo Scientific, Ultra Dry model, USA) with NSS 2.3 operating software.
4.9. Inhibition of Growth by Different Compounds for Gene Expression Analysis
Lastly, to explain the difference in survival profile between the compounds, S. mutans planktonic cells were treated with different agents with recognized targets to know which possible targets were involved in the observed biological activity. The following agents were used: compound 1771 [(5-phenyl-1,3,4-oxadiazol-2-yl)carbamoyl]methyl 2-{naphtho [2,1-b]furan-1-yl}acetate) (UkrOrgSynthesis, Ltd., Kiev, Ukraine, catalog n° PB25353228; purity not available), 4′ hydroxychalcone (C135) [(2E)-1-(4-hydroxyphenyl)-3-phenylprop-2-en-1-one) (AK Scientific, Inc., Union City, USA, catalog n° C135; 98% purity), myricetin (J10595) [3,5,7-trihydroxy-2-(3,4,5-trihydroxyphenyl)-4H-chromen-4-one] (AK Scientific, Inc., catalog n° J10595; 95% purity), tt-farnesol [(E,E)-3,7,11-trimethyl-2,6,10-dodecatrien-1-ol, trans,trans-3,7,11-trimethyl-2,6,10-dodecatrien-1-ol] (Sigma-Aldrich Co., St. Louis, MO, USA, catalog n° 46,193; 96% purity)], sodium fluoride (Sigma-Aldrich, catalog n° 71519), chlorhexidine digluconate solution (Sigma-Aldrich, catalog no C9394).
The agents and their concentrations were selected based on antimicrobial activity data previously tested in the laboratory [
33,
47,
51]. The concentration of CHX was the same in mouthwashes commercialized for the control of biofilms, and sodium fluoride is the most seen in mouthwashes [
52]. A starter culture was prepared as described above. For the inoculum, two 50 mL Falcon tubes were used to dilute the starter culture (1:20) using 2 mL of starter culture plus 38 mL TY + 1% glucose. When the appropriate OD was reached, the cultures were centrifuged (3220×
g, 20 min, 4 °C), and the supernatants were discarded. Next, the pellet was resuspended with half the initial volume of TY + 1% glucose. This volume was divided into 12 tubes, then treatments were added, followed by incubation, but the time was different based on the survival curve (
Table S4 in the
Supplementary Materials). After incubation for the described time, an aliquot was removed for plating (to confirm the reduction in cell viability;
Table S5 in the
Supplementary Materials). The tubes were placed on ice for 15 min, centrifuged (3220×
g, 20 min, 4 °C), the supernatants were discarded, and the pellets were resuspended with 1 mL of RNAlater (Ambion, Molecular Probes, Austin, TX, USA). Samples were frozen at −80 °C until RNA was isolated.
Gene Expression of S. mutans
The RT-qPCR (Reverse Transcription–quantitative Polymerase chain reaction) methodology included RNA isolation, cDNA synthesis, and gene expression analysis via qPCR of selected genes. Five specific genes were selected for expression profile analysis: genes associated with exopolysaccharides (
gtfB, synthesis of insoluble glucans) and eDNA (
lrgA) metabolism, acid stress tolerance (
atpD), and acid and oxidative stress tolerance (
nox1), with glycolysis (
eno, enolase enzyme, fluoride target;
Table 5) [
6,
51,
53,
54]. The 16S rRNA gene was included as an expression control (as a normalizer for the expression of specific genes) [
55].
An optimized methodology for
S. mutans was used to isolate the RNA, following a phenol-chloroform separation method, and the purification through the treatment with DNAse in column (Rneasy Micro Kit, Qiagen) and DNAse in solution (TURBO DNAse; Ambion) [
56]. Afterward, spectrophotometry was used to evaluate the amount (ƞg/µL-OD260nm) and purity (OD 260/280 ratio) of the RNA samples (Nano-spectrophotometer DS-11+, Denovix). After purification, the RNA was evaluated for integrity through 1% agarose gel electrophoresis (Ultra Pure Invitrogen). There was no adequate RNA yield for the CHX-treated culture, and this sample was excluded from the analyses. Samples were kept at −80 °C until cDNA synthesis for RT-qPCR.
cDNA was synthesized (in triplicate per sample) using 0.25 µg of total RNA, and the High-Capacity cDNA Reverse Transcription kit (Thermo Fisher; catalog n° 4368814). Reactions containing all kit ingredients except the reverse transcriptase enzyme served as negative controls, determining whether there was DNA contamination. Reactions were incubated using the CFX96 Touch™ Real-Time PCR Detection System (Bio-Rad Laboratories, Hercules, CA, USA), using the protocol determined by the manufacturer, following the cycle: 10 min/25 °C, 120 min/37 °C, 5 min/85 °C, ∞/4 °C. Then, the samples were stored in a freezer at −20 °C until their dilution (1:5 for specific genes; 1:1000 for 16S rRNA gene and cDNA negative controls were not diluted) and used to quantify gene expression. The cDNA dilutions and negative controls were also stored in a −20 °C freezer.
The cDNA and negative controls were amplified by the CFX96 using specific primers from the literature and 2× SYBR PowerUp Green Master Mix (Thermo Fisher; catalog n° A25776), following previously determined protocols [
54]. For each gene, a standard curve based on the purified PCR product of the target gene was included [
57]. The reactions were incubated in the CFX96 thermocycler, using the following amplification cycle: 2 min/50 °C; 2 min/95 °C; 39 times: 0:15 min/95 °C; 0:30 min/58 °C and 1 min/72 °C; 0:15 min/95 °C; Melt Curve 60.0 °C to 95.0 °C: Increment 0.5 °C 0:05. It was observed that for the
gtfB and
lrgA genes, the amplification was inadequate using the SYBR Thermo (i.e., the efficiency was lower than 90%), and so, the reaction was carried out with the iQ
TM SYBR
® Green Supermix, Bio-rad (catalog n° 170-8882) and its cycle. This amplification was adequate, as per the MIQE246 guidelines [
58]. The standard curves were used to transform the Quantification Cycle (Cq) values to relative numbers of cDNA molecules. Next, a fold difference was calculated per agent/treatment vs. the vehicle control for each gene.
4.10. Data Analyses
The data obtained were submitted to descriptive statistical analysis to compare groups with the vehicle. Data were organized in a database (Excel). The graphical representation of the results was performed using the statistical software Prism 8 (GraphPad Software). Data from antimicrobial activity, antibiofilm activity (long exposure time), and growth inhibition curve were analyzed by comparing the evaluated groups with vehicle control (independent variables) as CFU/mL count (dependent variable) and gene expression (fold-change). The biofilm characterization data included the response variables: biomass (mg), population (CFU/biofilm), and extracellular matrix components (ASP (µg), WSP (µg), and eDNA (ƞg)).


