Next Article in Journal
Recent Advances in Molecular and Immunological Diagnostic Platform for Virus Detection: A Review
Next Article in Special Issue
Development of Taste Sensor with Lipid/Polymer Membranes for Detection of Umami Substances Using Surface Modification
Previous Article in Journal
Integration of G-Quadruplex and Pyrene as a Simple and Efficient Ratiometric Fluorescent Platform That Programmed by Contrary Logic Pair for Highly Sensitive and Selective Coralyne (COR) Detection
 
 
Correction published on 24 July 2023, see Biosensors 2023, 13(7), 756.
Article

An Electrochemical Screen-Printed Sensor Based on Gold-Nanoparticle-Decorated Reduced Graphene Oxide–Carbon Nanotubes Composites for the Determination of 17-β Estradiol

1
Institute of Bio-Sensing Technology (IBST), University of the West of England, Bristol BS16 1QY, UK
2
Centre for Research in Biosciences (CRIB), School of Applied Sciences, University of the West of England, Bristol BS16 1QY, UK
*
Author to whom correspondence should be addressed.
Biosensors 2023, 13(4), 491; https://doi.org/10.3390/bios13040491
Submission received: 14 March 2023 / Revised: 7 April 2023 / Accepted: 10 April 2023 / Published: 19 April 2023 / Corrected: 24 July 2023

Abstract

:
In this study, a screen-printed electrode (SPE) modified with gold-nanoparticle-decorated reduced graphene oxide–carbon nanotubes (rGO-AuNPs/CNT/SPE) was used for the determination of estradiol (E2). The AuNPs were produced through an eco-friendly method utilising plant extract, eliminating the need for severe chemicals, and remove the requirements of sophisticated fabrication methods and tedious procedures. In addition, rGO-AuNP serves as a dispersant for the CNT to improve the dispersion stability of CNTs. The composite material, rGO-AuNPs/CNT, underwent characterisation through scanning electron microscopy (SEM), ultraviolet–visible absorption spectroscopy (UV–vis), Fourier-transform infrared (FTIR) spectroscopy, and atomic force microscopy (AFM). The electrochemical performance of the modified SPE for estradiol oxidation was characterised using cyclic voltammetry (CV) and differential pulse voltammetry (DPV) techniques. The rGO-AuNPs/CNT/SPE exhibited a notable improvement compared to bare/SPE and GO-CNT/SPE, as evidenced by the relative peak currents. Additionally, we employed a baseline correction algorithm to accurately adjust the sensor response while eliminating extraneous background components that are typically present in voltammetric experiments. The optimised estradiol sensor offers linear sensitivity from 0.05–1.00 µM, with a detection limit of 3 nM based on three times the standard deviation (3δ). Notably, this sensing approach yields stable, repeatable, and reproducible outcomes. Assessment of drinking water samples indicated an average recovery rate of 97.5% for samples enriched with E2 at concentrations as low as 0.5 µM%, accompanied by only a modest coefficient of variation (%CV) value of 2.7%.

1. Introduction

In recent years, there has been growing concern over the presence of endocrine-disrupting chemicals in the environment. These substances have the potential to impede growth and development across a wide array of species [1], underscoring the importance of developing methods that can detect their occurrence [2]. Among these pollutants, 17-β-estradiol (E2) is particularly worrisome due to its reported ability as a steroidal oestrogen to disrupt endocrine function by interfering with oestrogen receptors, leading to reproductive system abnormalities and immune dysfunction, among other effects [3,4]. The need for rapid, economic, reproducible, sensitive, and accurate detection methods is apparent; however, most currently available techniques require specialised personnel and access to well-equipped laboratories [5], making them relatively costly. Electrochemical sensors are a versatile and advantageous analytical tool, providing various benefits such as affordability, high sensitivity, portability, and user-friendliness. All that is required for their optimal operation is a low-cost potentiostat. These advanced sensors can be modified to provide dynamic ranges across varying concentrations, from extremely low levels to parts per million (ppm) or higher, indicating their adaptability in diverse settings. Electroanalytical methods have emerged over the past few decades as effective alternatives to traditional analysis techniques, due to their unique capabilities in accumulating various analytes on electrode surfaces while eliminating associated drawbacks [4]. Among these methods, disposable screen-printed electrodes (SPEs) have been notably recognised for their utility and practicality. They promise alternatives to the common three-electrode setup in their portability, measurement speed, mass production, and low cost [5,6]. However, some of the components within the ink formulation of a screen-printed electrode are non-conductive, resulting in poor conductivity and performance, ultimately affecting the performance of the SPE.
Screen-printed electrodes (SPEs) present a promising option for replacing the typical three-electrode configuration, due to their portability, rapid measurement capabilities, low cost, and potential for mass production [5,6]. Nevertheless, some non-conductive constituents make up the ink formulation of an SPE, which can impede its conductivity and overall effectiveness, consequently compromising its performance. Therefore, there is a need to improve the conductivity of SPEs by either modifying their ink formulation or employing additional conductive materials to enhance the electrode’s performance.
Several studies [7,8,9,10,11,12,13,14,15,16,17,18] have reported the determination of E2 through different sensor surfaces. Electrochemical oxidation of the phenolic group present in the hormone leads to electrode fouling, due to the formation of an insoluble layer on its surface, resulting in electrode passivation and negatively impacting the analytical performance [19]. Hence, it is necessary to explore new materials for SPEs’ modification that can enhance their analytical capabilities [20].
Electrochemical sensors incorporating carbon-based nanomaterials have been employed to detect various analytes [21]. Among these, graphene (Gr) and carbon nanotubes (CNTs) are frequently used in sensor fabrication, owing to their significant electrochemical windows, high conductivity, large specific surface area, and stability that enhance electron transfer reactions [21,22,23] while also promoting electrochemical reactivity [24]. Additionally, research indicates that fouling is less likely with graphene [25], further establishing its potential as a suitable electrode modification material alongside CNTs [26,27,28,29,30,31,32,33,34,35,36,37].
Gold nanoparticles (AuNPs) have been widely employed in the development of electrochemical sensors [38,39,40,41] through various synthesis methods, including physical, chemical, biological, and electrochemical techniques [38]. The use of plant extracts as bio-reductants for producing metallic nanoparticles has received considerable attention in research by previous reports [42,43]. This approach obviates the necessity for noxious chemicals that can be corrosive or harmful and advocates a sustainable methodology for their production. A variety of plant extracts—such as lemongrass (Cymbopogon citratus), Zingiber oicinale, Acalypha indica, and Abelmoschus esculentus—have been utilised for the preparation of AuNPs. In addition to electrochemical reduction methods, thermal and photocatalytic reduction methods have also been employed in this context [44]. Notably, bay leaf extract from laurus nobilis (bay laurel) has been reported as a promising alternative for generating AuNPs without the requirement for stabilising or capping agents. Moreover, it has demonstrated efficacy in reducing graphene oxide, serving a dual purpose [45,46].
The combination of graphene and CNTs as a composite has been extensively researched for various electrochemical sensor applications [27]. Carbon nanomaterials, including CNTs and graphene, have shown promise in immobilising metal nanoparticles [47], enhancing their individual properties through material synergy. This ultimately leads to improved electrochemical sensitivity within sensors [48]. It is necessary to disperse these materials using solvents and surfactants before electrode modification can occur with CNTs and graphene. However, the abundant oxygen within graphene oxide allows it to serve as a dispersant agent for CNTs, improving the overall composite properties and preventing irreversible aggregation of the graphene material. A careful approach towards tailoring these materials will prove promising during efforts towards the development of novel hybrid nanocomposites [29].
This research investigates an eco-friendly method for fabricating a composite material based on reduced graphene oxide decorated with gold nanoparticles synthesized via a sustainable, single-step method without the requirement of intricate processes or harsh chemicals. This approach involves employing plant extracts to synthesize AuNPs and bio-reducing graphene oxide in conjunction with rGO acting as a dispersant for CNTs. Additionally, this methodology adheres to non-toxic standards aligned with the 12 principles of green chemistry when producing an electrochemical sensor [49,50].

2. Materials and Methods

2.1. Chemicals and Reagents

Bay laurel leaves were purchased from JustIngredients Ltd. (UK). Graphene oxide with 4–10% edge-oxidised and carboxylic-acid-functionalised multiwalled carbon nanotubes (>8%), with an average diameter of 9.5 nm and a length of 1.5 μm, was used in the study. Chemicals such as gold chloride trihydrate HAuCl4·3H2O, sodium hydroxide NaOH, potassium ferricyanide K3[Fe(CN)6], potassium ferrocyanide K4[Fe(CN)6], potassium chloride KCl, glacial acetic acid, phosphoric acid H3PO4, boric acid H3BO3, and sulfuric acid H2SO4, along with gold(II) chloride and estradiol standard, were obtained from Merck (Dorset, UK). A solution of E2 (0.01 M), prepared in ethanol, was stored at +4 °C for future use. Deionised water from Suez Water System (UK) was used to prepare solutions for the study. A potassium ferricyanide solution was created by dissolving K3[Fe(CN)6] and potassium ferrocyanide K4[Fe(CN)6] in 0.1 M KCl and deionised water at concentrations of 5 mM, respectively. Britton–Robinson buffer solution (B-R) with varying pH levels between 2 and 8 was made using acetic acid (0.04 M), boric acid (0.04 M), phosphoric acid (0.04 M), and NaOH as needed to adjust the pH levels accordingly.

2.2. Apparatus and Instrumentation

All voltammetric measurements were carried out using a PalmSens EmStat3 Potentiostat (PalmSens BV, Houten, the Netherlands) and PSTrace 5.8 software for instrument control and data acquisition during the voltammetric measurements. Screen-printed carbon electrodes (SPEs), obtained from Palintest Limited (Gateshead, UK), were used in a three-electrode system that included a working electrode, a carbon counter-electrode, and a silver reference electrode. The working electrode was modified in some cases. The materials were characterised using scanning electron microscopy (Oxford Instruments SEM, 20 kV) and energy-dispersive X-ray spectroscopy (EDX) with an Oxford Instruments AZtec E.D.S. Atomic force microscopy (AFM) was conducted with a Bruker-Innova AFM instrument. Fourier-transform infrared spectroscopy using attenuated total reflection (ATR-FTIR) was carried out on a PerkinElmer Spectrum 1000 spectrometer. An Agilent Cary 60 UV–VIS spectrophotometer in Santa Clara, United States, was used for ultraviolet–visible absorption spectroscopic measurements.
Cyclic voltammograms were initially recorded with blank buffer solutions, and then in the same solutions containing E2. A starting potential of 0.0 V, an initial switching potential of 0.8 V, and an end potential of 0.0 V were utilised. Differential pulse voltammetry was undertaken using a starting potential of 0.0 V and a final potential of 0.8 V, using a step height of 7 mV, pulse repetition time of 0.5 s, and pulse amplitude of 100 mV. The DPV parameters were selected based on previous works reported in the literature for estradiol sensing [51].

Synthesis of rGO-AuNPs/CNT and Electrode Fabrication

Gold-nanoparticle-decorated reduced graphene/carbon nanotubes composites were prepared by methods adapted from our group, with a few modifications [52]. Briefly, bay leaf extract was prepared by grinding dried bay leaves to a powder, adding the powdered leaves to deionised water at 80 °C for 10 min, and then straining and centrifuging the resultant solution to remove plant material. The bay leaf extract was then stored at 4 °C and used within four weeks. Equal volumes of the abovementioned GO suspension, bay leaf extract, and HAuCl4 (10 mM) (1:1:1) v/v/ were then mixed and kept overnight for nanoparticle formation, where the light-yellow-coloured mixture changed to a wine-red colour, indicating the formation of AuNPs [53]. The decorated graphene oxide containing AuNPs was extracted by centrifugation at 5000 rpm for 15 min, washed three times in deionised water, and then suspended again in deionised water with the concentration of GO set to 0.05 mg/mL. Carbon nanotubes (0.1 mg/mL) were added to the rGO-AuNPs and then ultrasonicated for three hours to ensure full dispersion of the rGO-AuNPs/CNT. Finally, the SPE was modified with rGO-AuNPs/CNT by drop-casting suspensions of either 0.3, 0.5, 0.7, or 1.0 µL on the working electrode of the SPE. These were then allowed to dry at room temperature. An untreated MWCNT/GO concentration dispersion was also created. AuNP solutions without GO or MWCNTs were prepared for characterisation as previously stated.
A graphical representation of the steps of modification of the rGO-AuNP/SPE sensor’s fabrication is shown in Figure 1.

3. Results

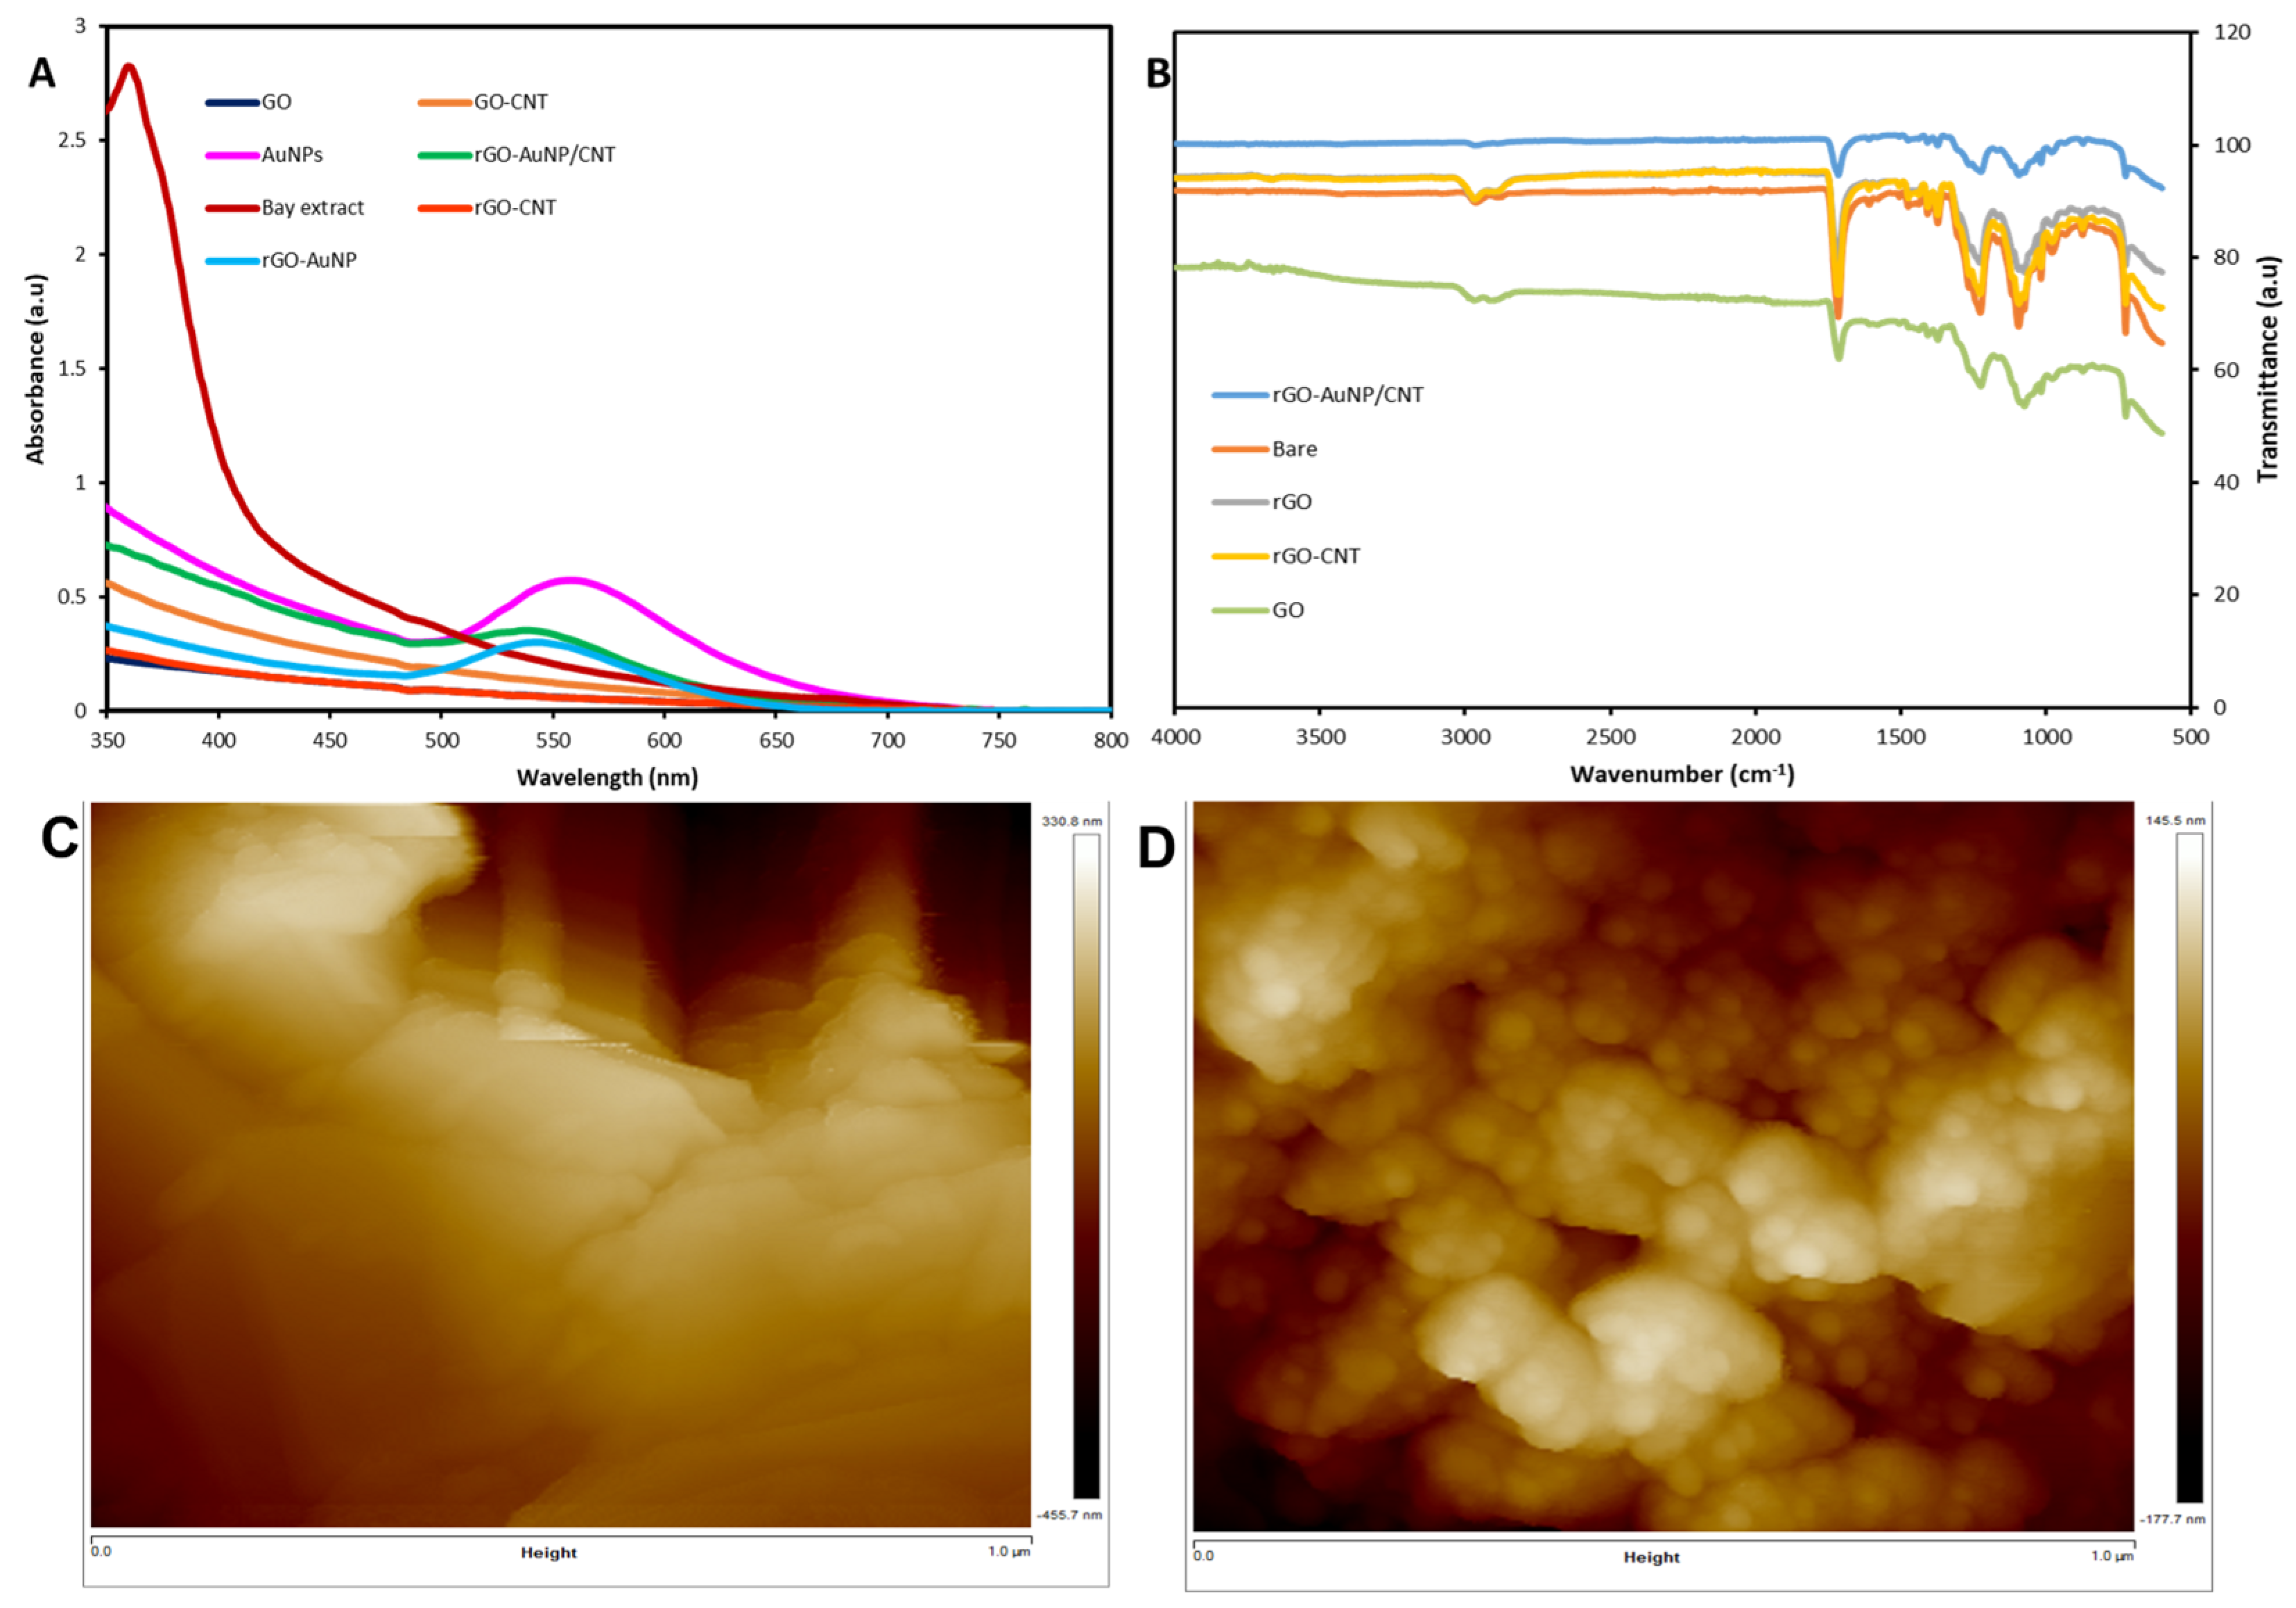
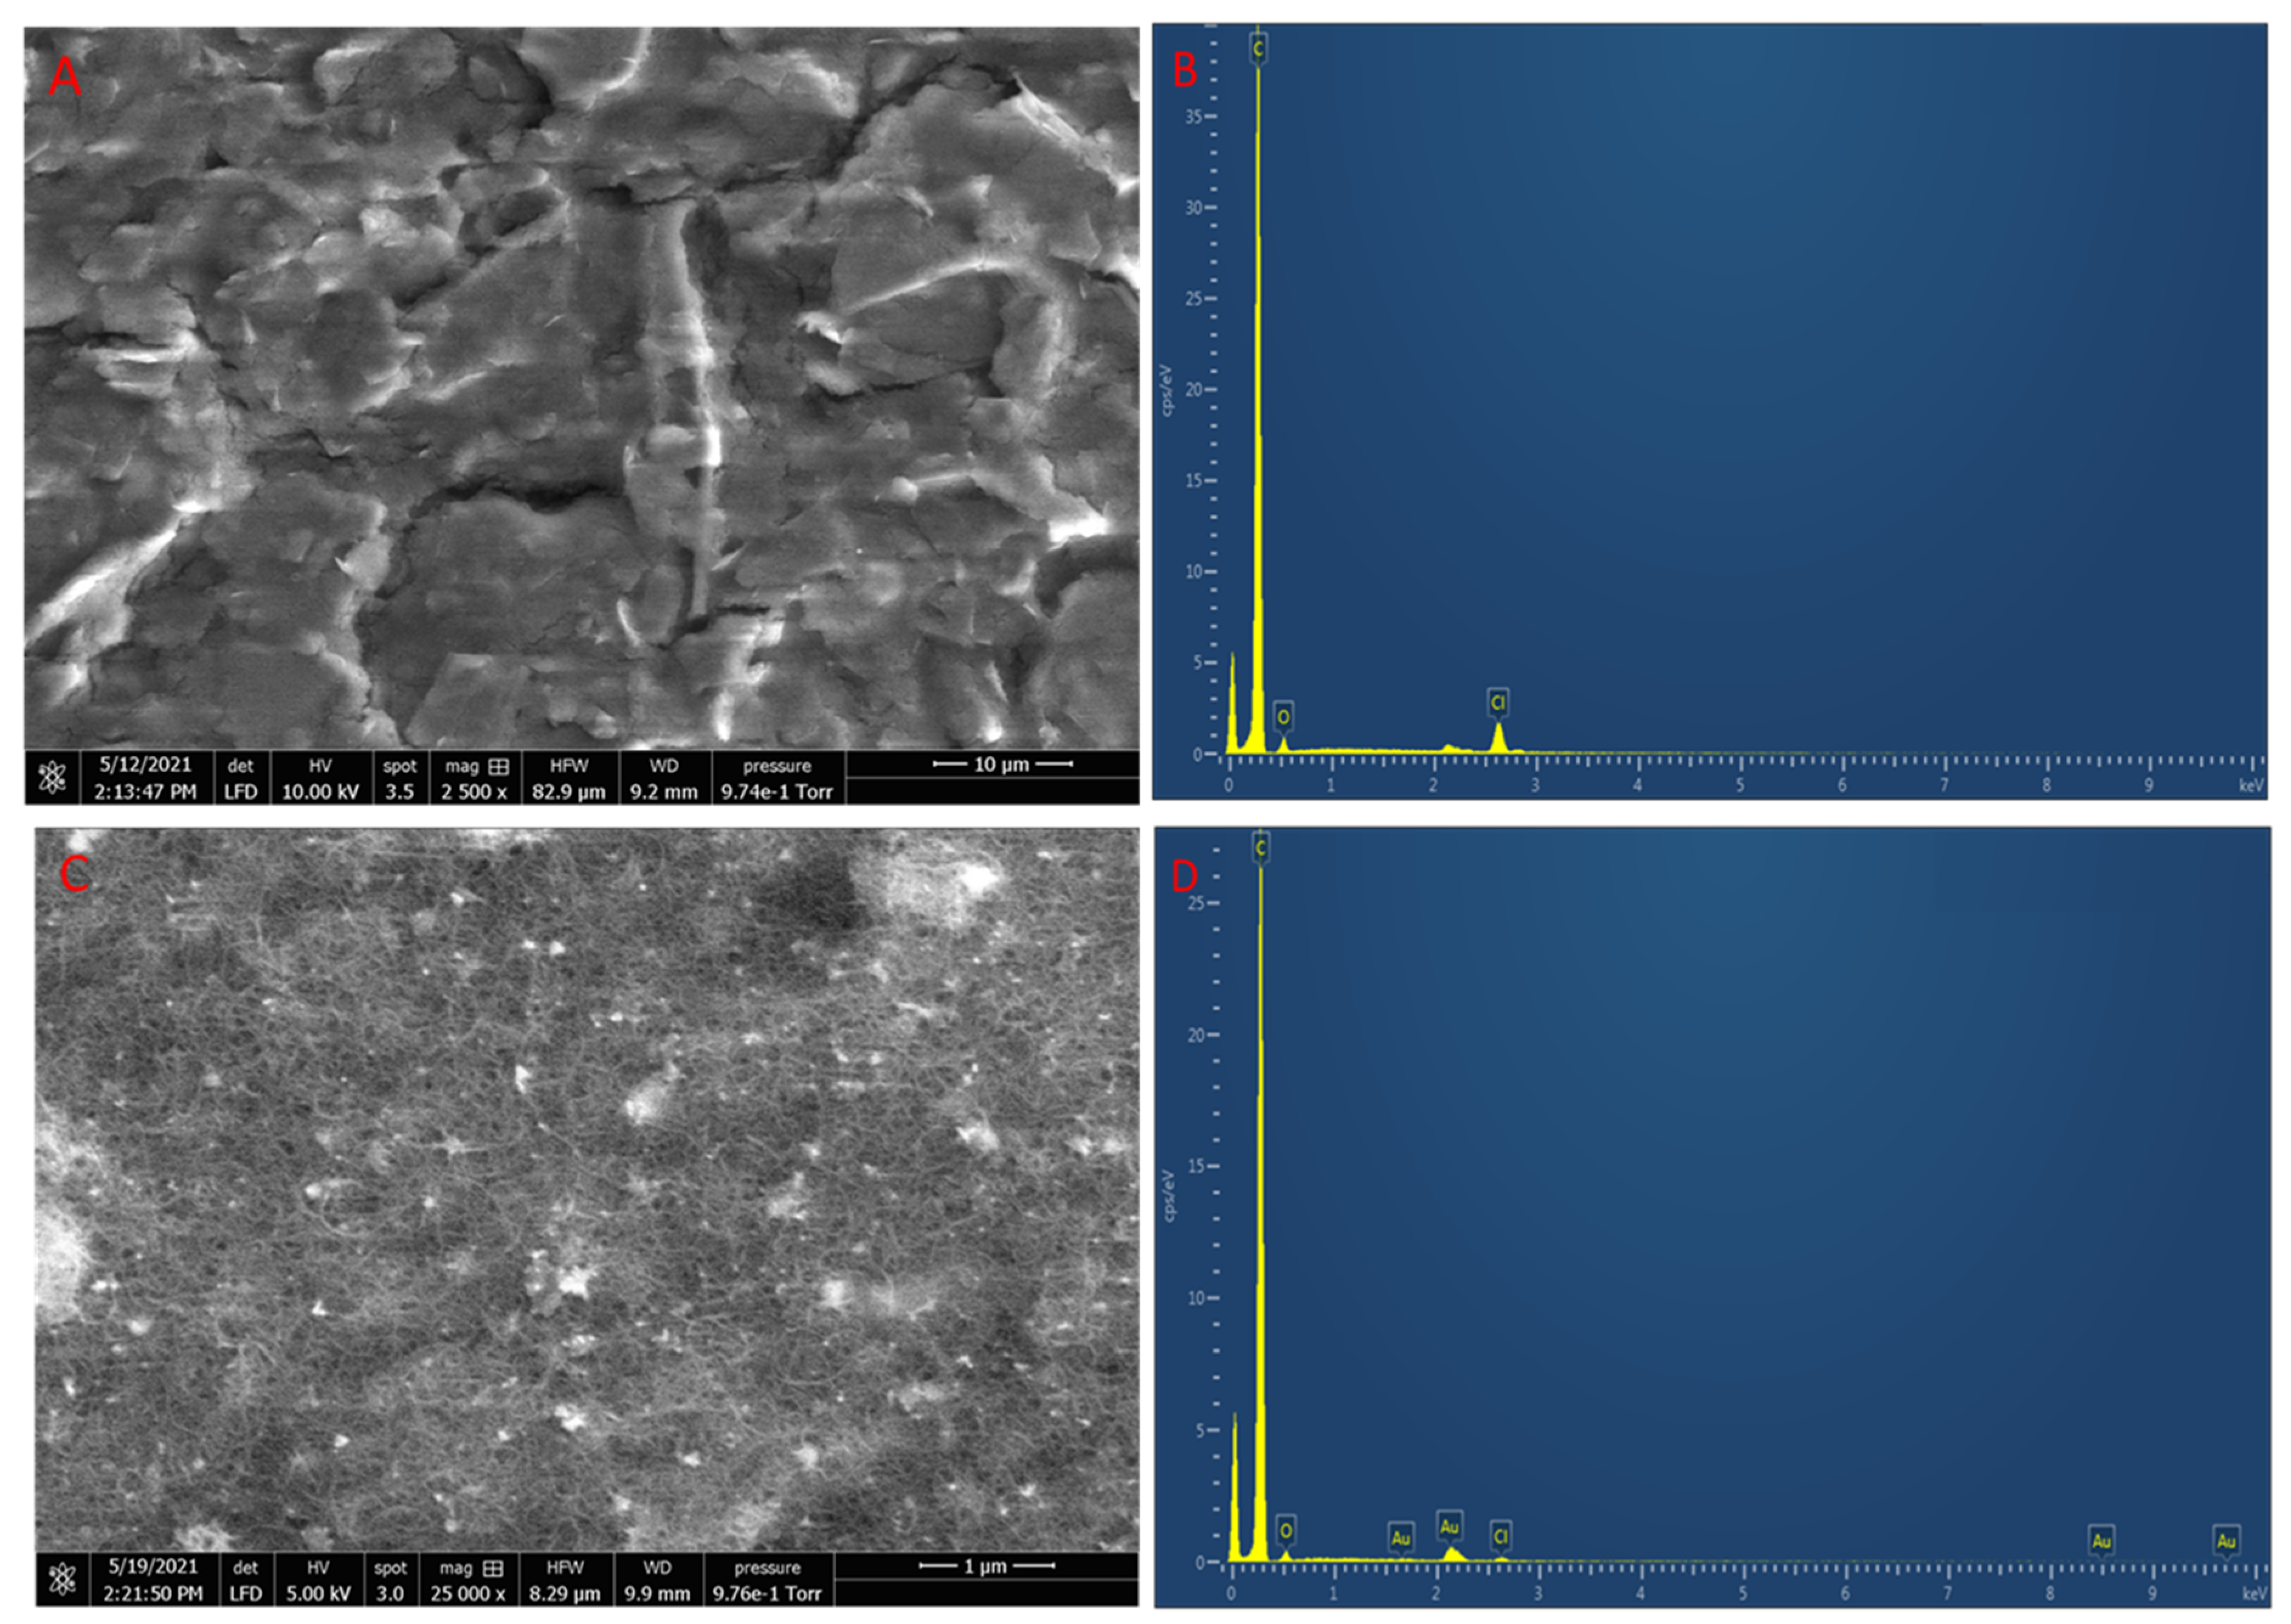
3.1. Characterisation of rGO-AuNPs/CNT

In Figure 2, the UV–Vis spectra of various substances—including bay leaf extract, rGO-AuNPs/CNT, AuNPs, rGO-AuNP, rGO-CNT, GO/CNT, and GO—are depicted. The absorption peak at 560 nm observed in the spectrum of the AuNPs is indicative of successful formation using bay leaf extract, since this falls within a typical range for such particles. Additionally, a similar peak was discerned in rGO-AuNPs/CNT, implying that these composites also contain AuNPs. Previous studies have reported absorbance levels for AuNPs between 500 and 550 nm [42,53]. The rGO-AuNPs/CNT shows a broad absorbance peak around a wavelength of 560 nm, indicating the presence of AuNPs. The absorption peaks observed here correspond to the wavelengths given in the literature for AuNPs at 520, 522, 524, 528, and 530 nm, respectively [42,53], and are consistent with the typically quoted absorption seen at 500–550 nm for AuNPs. The difference in peak values (absorption) compared to the reports in the literature can be attributed to the presence of GO in the solution. No peaks were seen for GO, rGO-CNT, GO-CNT, and bay leaf extract. Wang et al. reported the GO spectrum peak at 226 nm [54]. A shoulder at ∼300 nm can be attributed to the n→π* transition of the carbonyl groups (C=O bond), similar to a previous report [55]. However, this study was carried out between 400 and 800 nm, which would explain why no GO peaks were recorded. These absorption peaks cannot be seen in the spectrum of rGO-AuNPs/CNT, indicating that these free carboxyl groups are committed to accommodating AuNPs.
The FTIR spectrum of the bare SPE (illustrated by the orange spectrum in Figure 2B) demonstrates distinct peaks at 2966 cm−1, 1714 cm−1, 1227 cm−1, and 1094 cm−1 that correspond to OH, CH3, COOCH3, and C=O functional groups, respectively. These same groups were also identified not as well-defined peaks in the rGO-CNT/AuNPs (depicted by the blue spectrum in Figure 2B), indicating that oxygen functionalities had been eliminated during reduction. A similar occurrence has been reported with plant extracts converted graphene nanosheets (PCGN) [56].
Furthermore, we examined the morphological characterisation in terms of surface topography and roughness [46,57] of the rGO-AuNPs/CNT using atomic force microscopy (AFM). The respective AFM images of bare and rGO-AuNP/CNT SPE’s in Figure 2C,D displays morphological AFM images of the rGO-AuNPs/CNT composite material, indicating a thick compacted uniform sheet of material [56]. The surface of the rGO-AuNP/CNT (Figure 2D) showed a significant increase in surface roughness compared with that of the bare SPE (Figure 2C). It is noteworthy that the drop-casting procedure can yield agglomerations of material [56]. In Figure 2C, clear rough surfaces with sharp layered steps and terraces can be observed in the topography of the carbon ink on the bare SPE. No peak-to-peak interlayer distance was measured, due to the lack of X-ray diffraction measurements of the composite.
Figure 3A–D show SEM images of the bare SPE and the rGO-AuNPs/CNT/SPE. As can be seen in Figure 3A, the bare SPE shows graphitic sheet-like structures as typical of the SPE surface. According to the composition of the electrode, these structures can be assigned as graphitic carbon powder. SPEs have been reported to show small particles dispersed throughout the surface electrodes based on the different curing temperatures suggested by [58,59] and the composition of the ink. These structures can be assigned as graphitic graphite particles illustrating typical features of a non-uniform pattern from different graphite particles. Figure 3C shows uniform mesh-like structures that result from the presence of rGO-AuNPs/CNT, which covered and bridged the graphene sheet and small particles of AuNPs. Graphene oxide has been reported to have individual sheets formed in bundles, while reduced graphene has flocculent flake-type layers [60]; however, the presence of CNTs alters the behaviour of graphene, as illustrated in the figure, showing a CNT-interwoven mesh of nanotubes, with thin layers of space between each nanotube [61]. This can be attributed to reducing the graphene oxide to sheet-like graphene with ‘sprinkled’ AuNPs. Figure 3C shows the rGO-AuNPs/CNT/SPE, depicting the presence of well-decorated graphene oxide–carbon nanotubes. The synthesis of gold nanoparticles via this route has the following advantages: (a) applying a bio-reduction synthesis route without using a hazardous reducing agent such as sodium borohydride; (b) AuNPs can be attached to the surface more accessible to the rGO/CNT surface to form a composite [62,63].
To confirm the assembly of AuNPs and the surface composition of rGO-AuNPs/CNT, EDS analysis was performed. Figure 3D shows the resulting EDS spectra. This suggests that the composite mainly includes the elements C, O, Au, and Cl. The observed Au elemental peaks are indicative of AuNPs being incorporated into the composite, indicating the successful incorporation of the AuNPs—unlike the bare unmodified SPE, which was characterised by C, O, and Cl (Figure 3B). We speculated that the presence of Cl in this spectrum could have stemmed from the ink itself, as seen in the bare SPE. A similar phenomenon has been reported in electrochemically synthesised AuNPs/single-walled carbon nanotube hybrids [64]. This study revealed that the bare SPE is not comparable with the rGO-AuNPs/CNT material, which is obviously smoother compared to the bare SPE, which appeared clumped and stacked [64]. Jian et al. reported similar results for the electrochemically reduced graphene oxide/AuNPs [58,65,66].

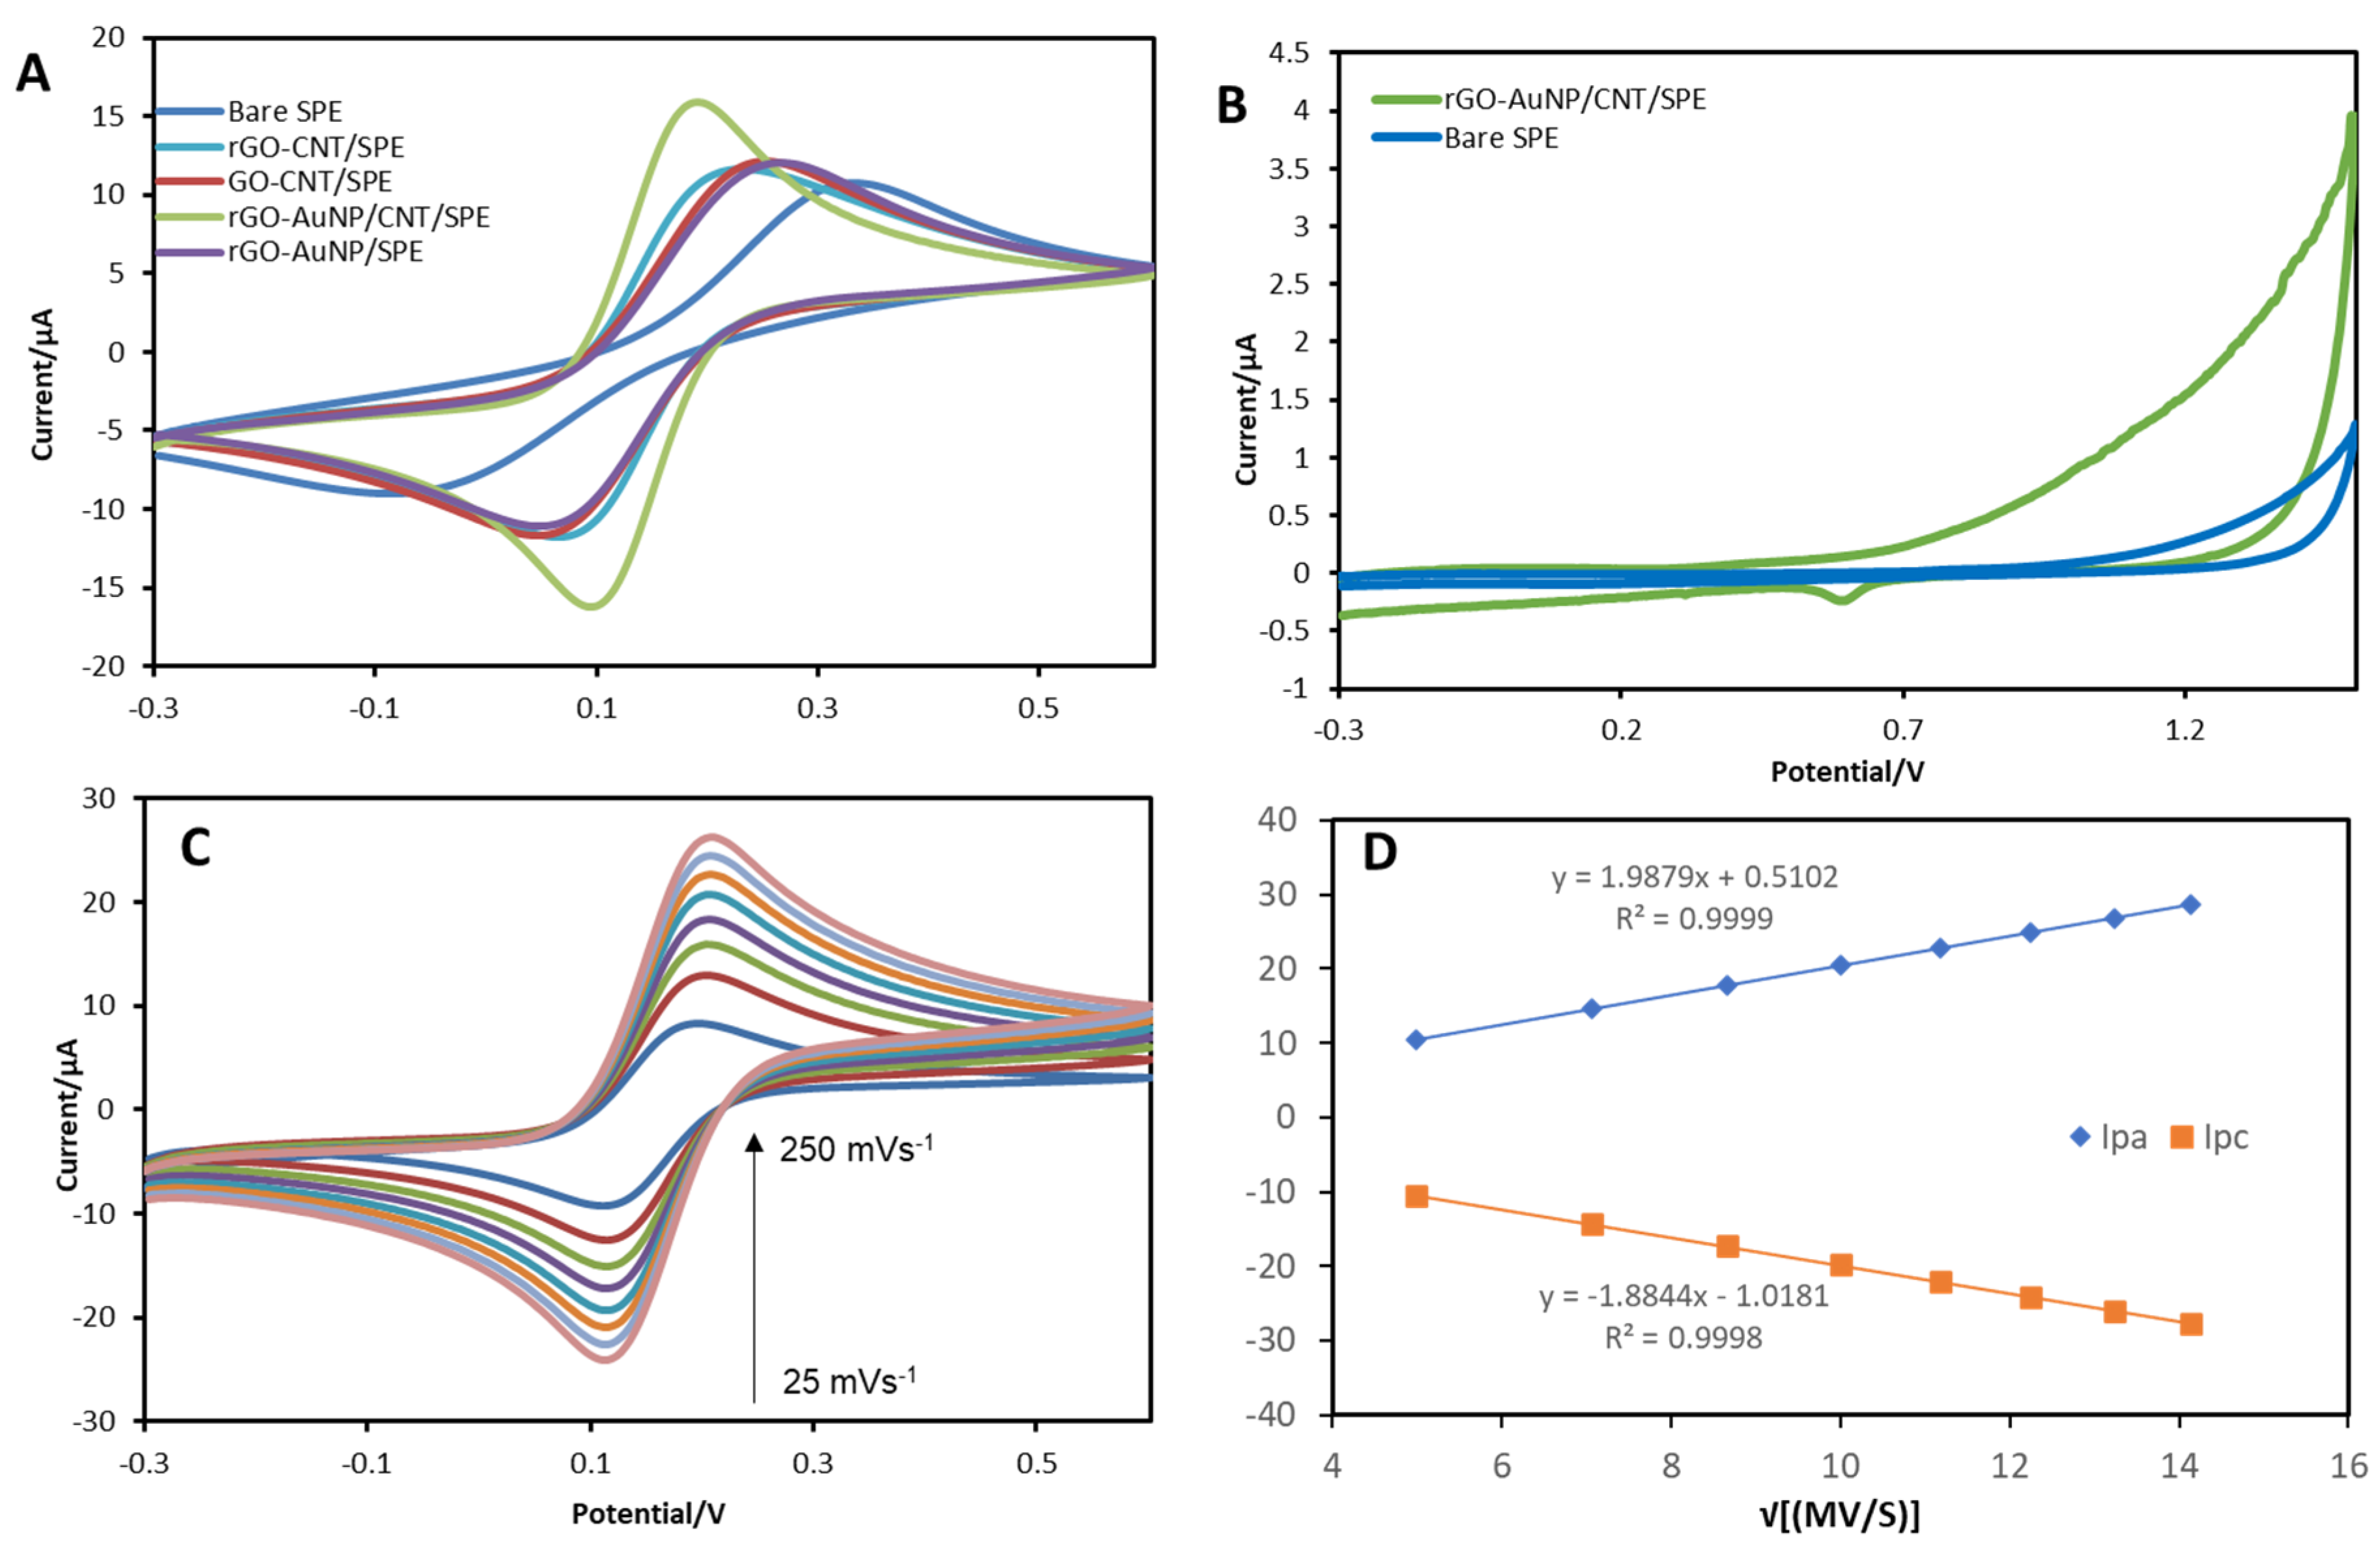
3.2. Electrochemical Characterisation

In Figure 4A, the CVs of bare SPE, rGO-CNT/SPE, GO-CNT/SPE, rGO-AuNPs/CNT/SPE, and rGO-AuNP are illustrated immersed in 0.1 M KCl containing a mixture of ferricyanide/ferrocyanide at concentrations of 5 mM [Fe(CN)6]−3/−4at 100 mVs−1. According to Figure 4A, the peak current of redox was consistently for GO-CNT, rGO-AuNP, and rGO-CNT and remained unaffected by any discernible impact observed from rGO-AuNPs/CNT. Hence, it was concluded that model electrodes in subsequent measurements would use rGO-AuNPs/CNT, GO-CNT benchmarked to bare SPE. Further characterisation can be found provided in Supplementary Information (S).
In Figure 4B, the cyclic voltammograms for bare SPE and rGO-AuNPs/CNT/SPEs are displayed in solution containing 0.5 M H2SO4 under the same experimental conditions are presented. The data show that at a scan rate of 50 mV/s and in the solution containing 0.5 M H2SO4, a single reduction peak of oxide species was observed on the rGO-AuNPs/CNT/SPE electrode, at around 0.58 V, corresponding to gold oxide reduction, indicating successful voltammetric reduction of gold oxide by this material. This result is consistent with previous findings [66] documenting Au surface behaviour during sulfuric acid exposure [63,64,67,68,69].
In Figure 4C, the CVs of an rGO-AuNPs/CNT/SPE at different scan rates (ranging from 25 to 250 mVs−1), with the same concentration and solution as above, are presented. Linear correlations between the anodic/cathodic current peak and the square root of the scan rate were observed over the range examined, as can be seen in Figure 4D.
The utilisation of the rGO-AuNPs/CNT/SPE composite led to an increase in the specific surface area, resulting in well-defined cathodic and anodic peak currents. The modification also improved the ΔEp separation by 91.94 mV as compared to the bare SPE, which had a value of 331.8 mV, suggesting a faster electron transfer processes. This heightened efficiency could be attributed to the rGO-AuNPs/CNT modifier facilitating charge transfer for [Fe(CN)6]−3/−4 through improvements in conductivity, while overcoming potential hindrances caused by insulating layers, according to previous research [70].
The rGO-AuNPs/CNT/SPE composite exhibited an improved electrochemical response due to the presence of AuNPs, which could be attributed to their large surface-to-volume ratio, superior catalytic activity, and enhanced electrical conductivity. This finding corroborates Wang et al.’s research on an rGO/CNT/AuNPs-SPE, where a peak-to-peak separation of 97 mV was achieved for Fe(CN)6 detection using an electrochemical sensor [70]. In Figure 4D, a linear correlation between the anodic and cathodic peak currents implies that the uniform deposition of the composite’s electroactive thin layer contributes significantly to its overall electrochemical behaviour [71]. The peak potential shift indicates slow electron transfer and a quasi-reversible reaction for the unmodified SPE. In addition, the theoretically ideal equal number of electron oxidation/reduction reactions due to this shift would not be observed.
We next investigated the electrochemically active surface area of the electrode, which are essential factors in electrochemical processes occurring at the electrode surface in electrochemical sensors [72,73]. The electrochemical active surface area of the modified electrode was measured using 5 mM [Fe(CN)6]−3/−4 as the redox probe. The current for the electrochemical reaction of ferrocyanide (at a mass-transfer-limited rate) that diffuses to an electrode surface is described by the Randles–Sevcik equation [72].
The electrochemical active surface area of rGO-AuNPs/CNT was calculated using Equation (1) for the peak current (Ip) [74]:
Ip = (2.69 × 10⁵) AD1/2 n3⁄2 v1⁄2C
where n is the number of electrons, A is the electroactive surface area of the rGO-AuNPs/CNT/SPE (cm2), D is the diffusion coefficient of the redox marker [Fe(CN)6]−3/−4 (D = 7.2 × 10⁻⁶ cm2 s−1 [74,75] in 0.1 M KCl), C is the concentration of the redox probe in the solution (M), and v is the scan rate (V/s). Figure 4A shows an increase in the peak currents for the [Fe(CN)6]4−/3− redox couple at the rGO-AuNPs/CNT/SPE compared to that at the bare, unmodified SPE. These results indicate that the electron transfer is enhanced by modifying the bare SPE with rGO-AuNPs/CNT. The surface area value was estimated to be 0.014 cm2 for the rGO-AuNPs/CNT/SPE–significantly higher than the bare SPE’s figure of 0.009 cm2. Scan rate studies were carried out using equimolar ferri/ferrocyanide at 5 mM [Fe(CN)6]−3/4−. Both showed a linear relationship between peak current and the square root of the scan rate, indicating a diffusion-limited response in all cases. The electroactive surface area values of all SPEs are provided in Supplementary Information (Table S1).

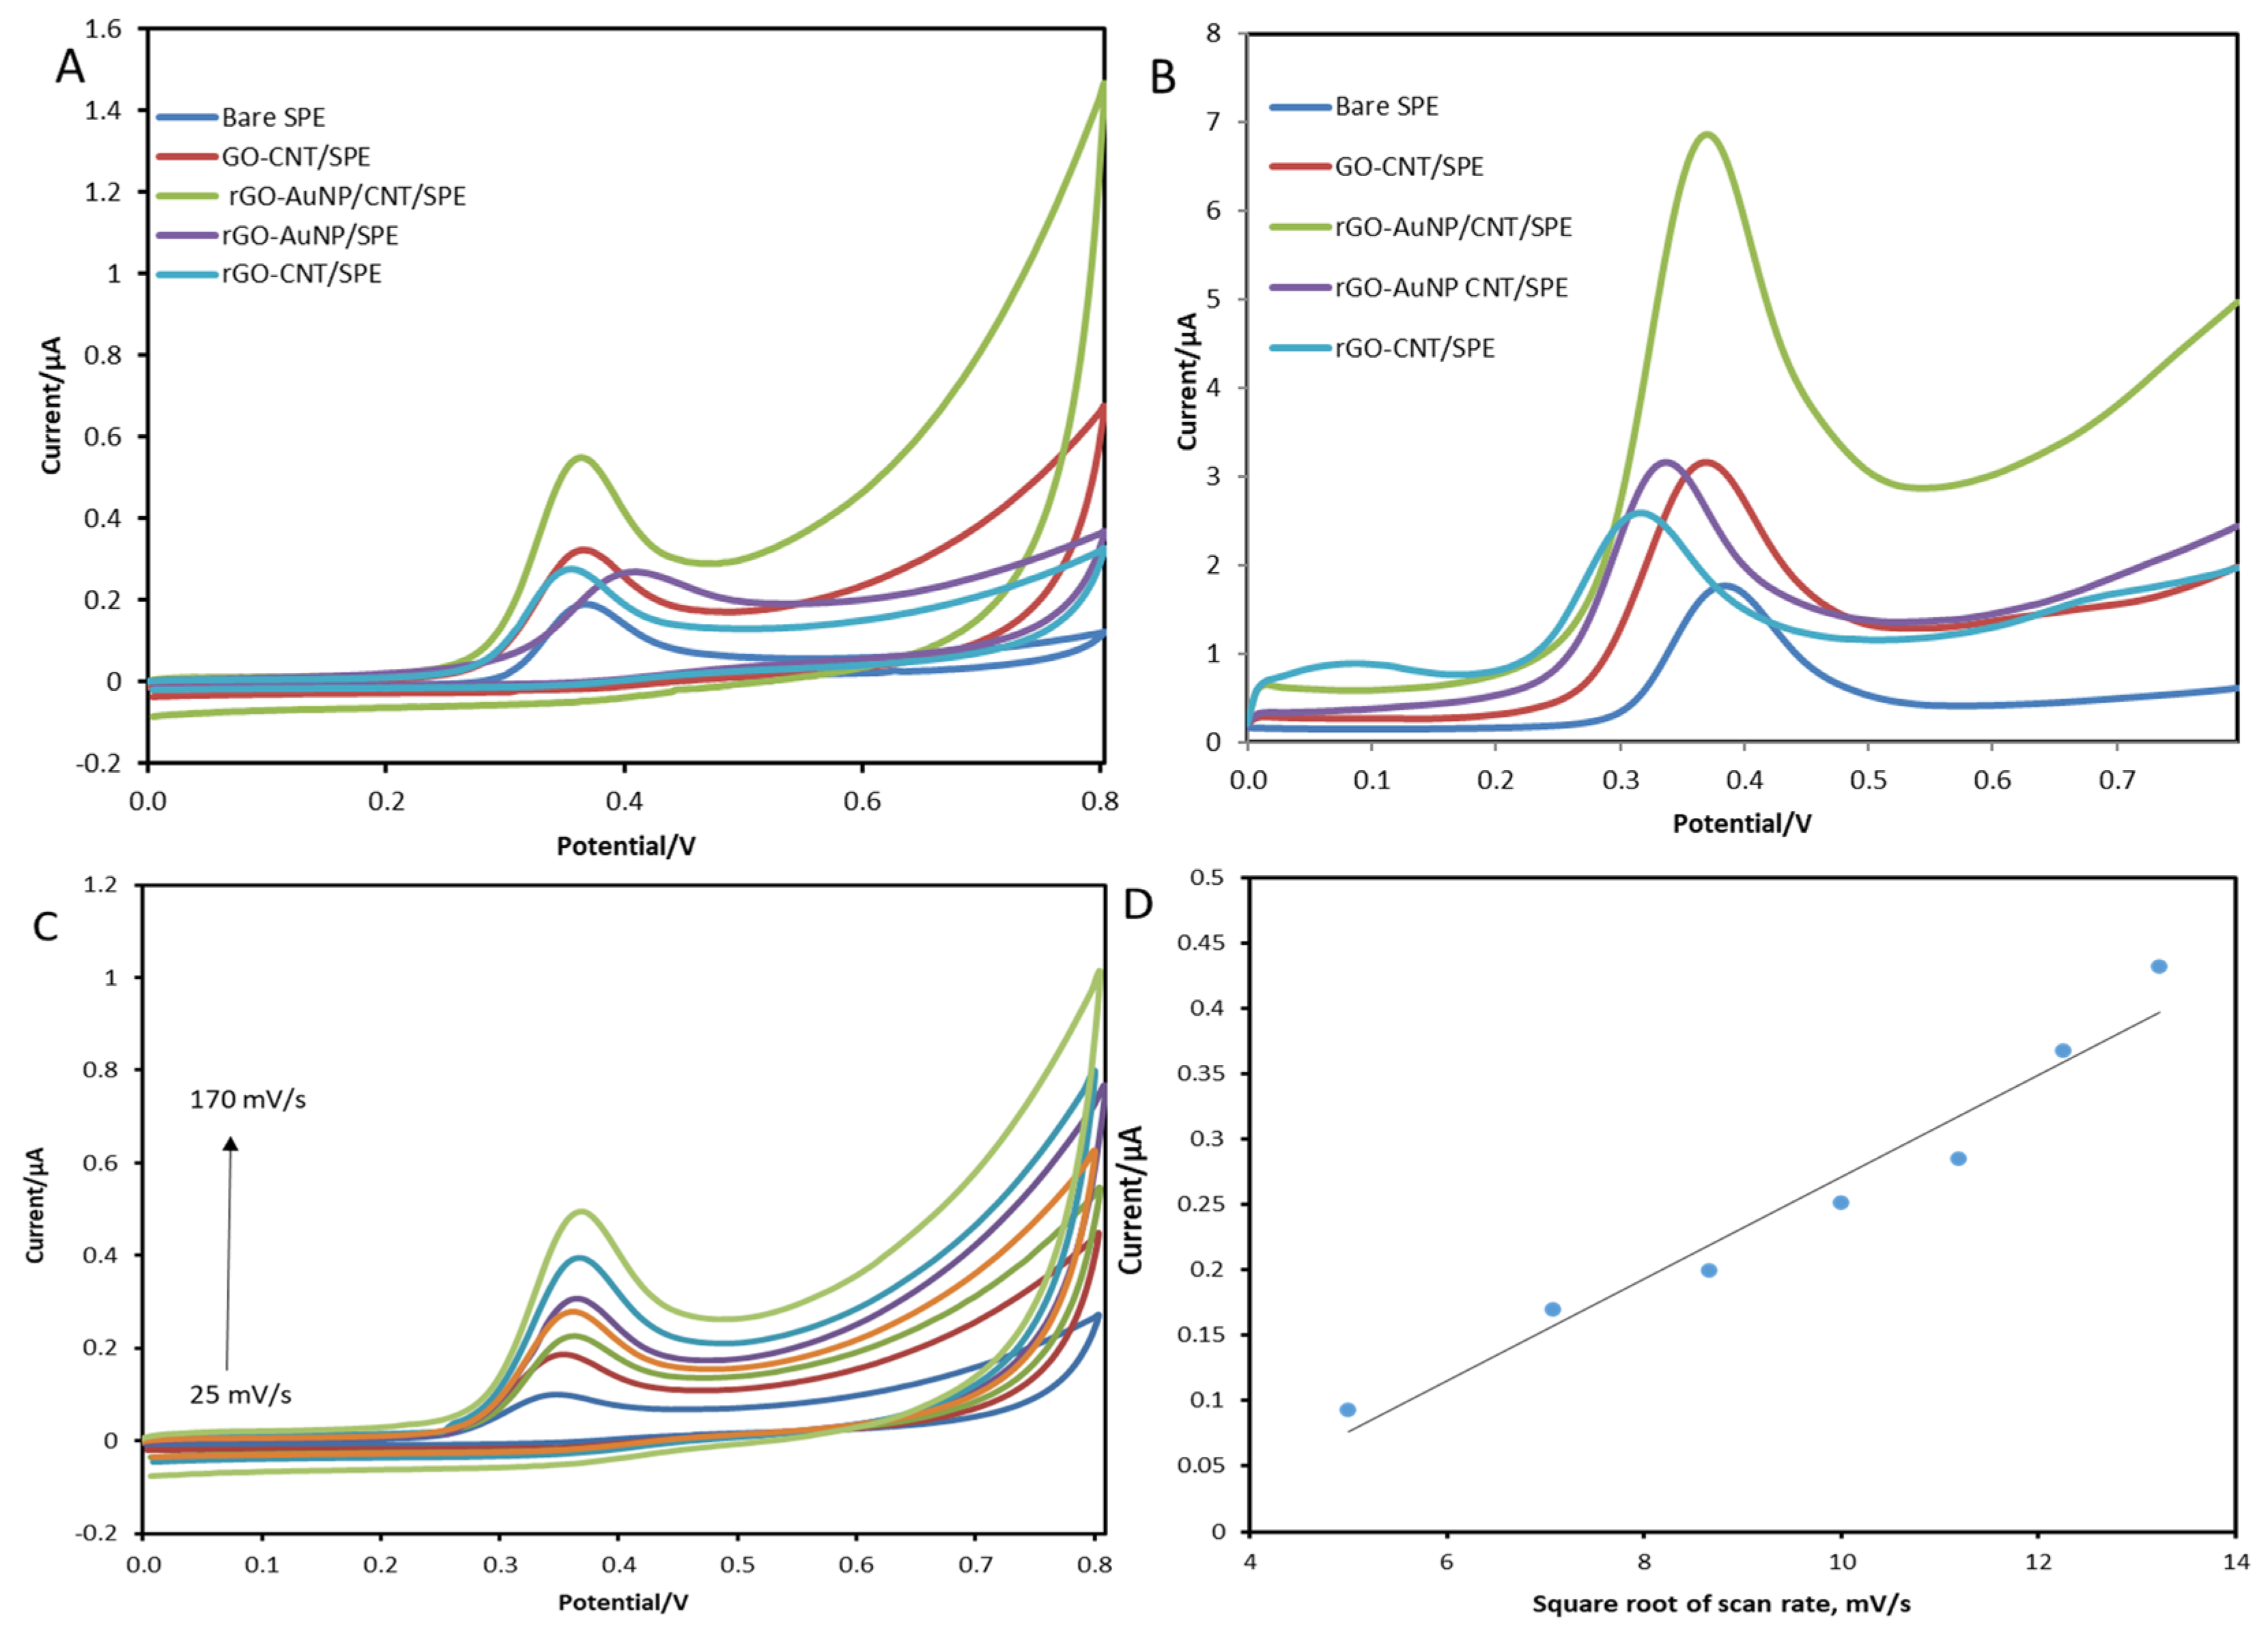
Voltammetric Behaviour of 17β-Estradiol
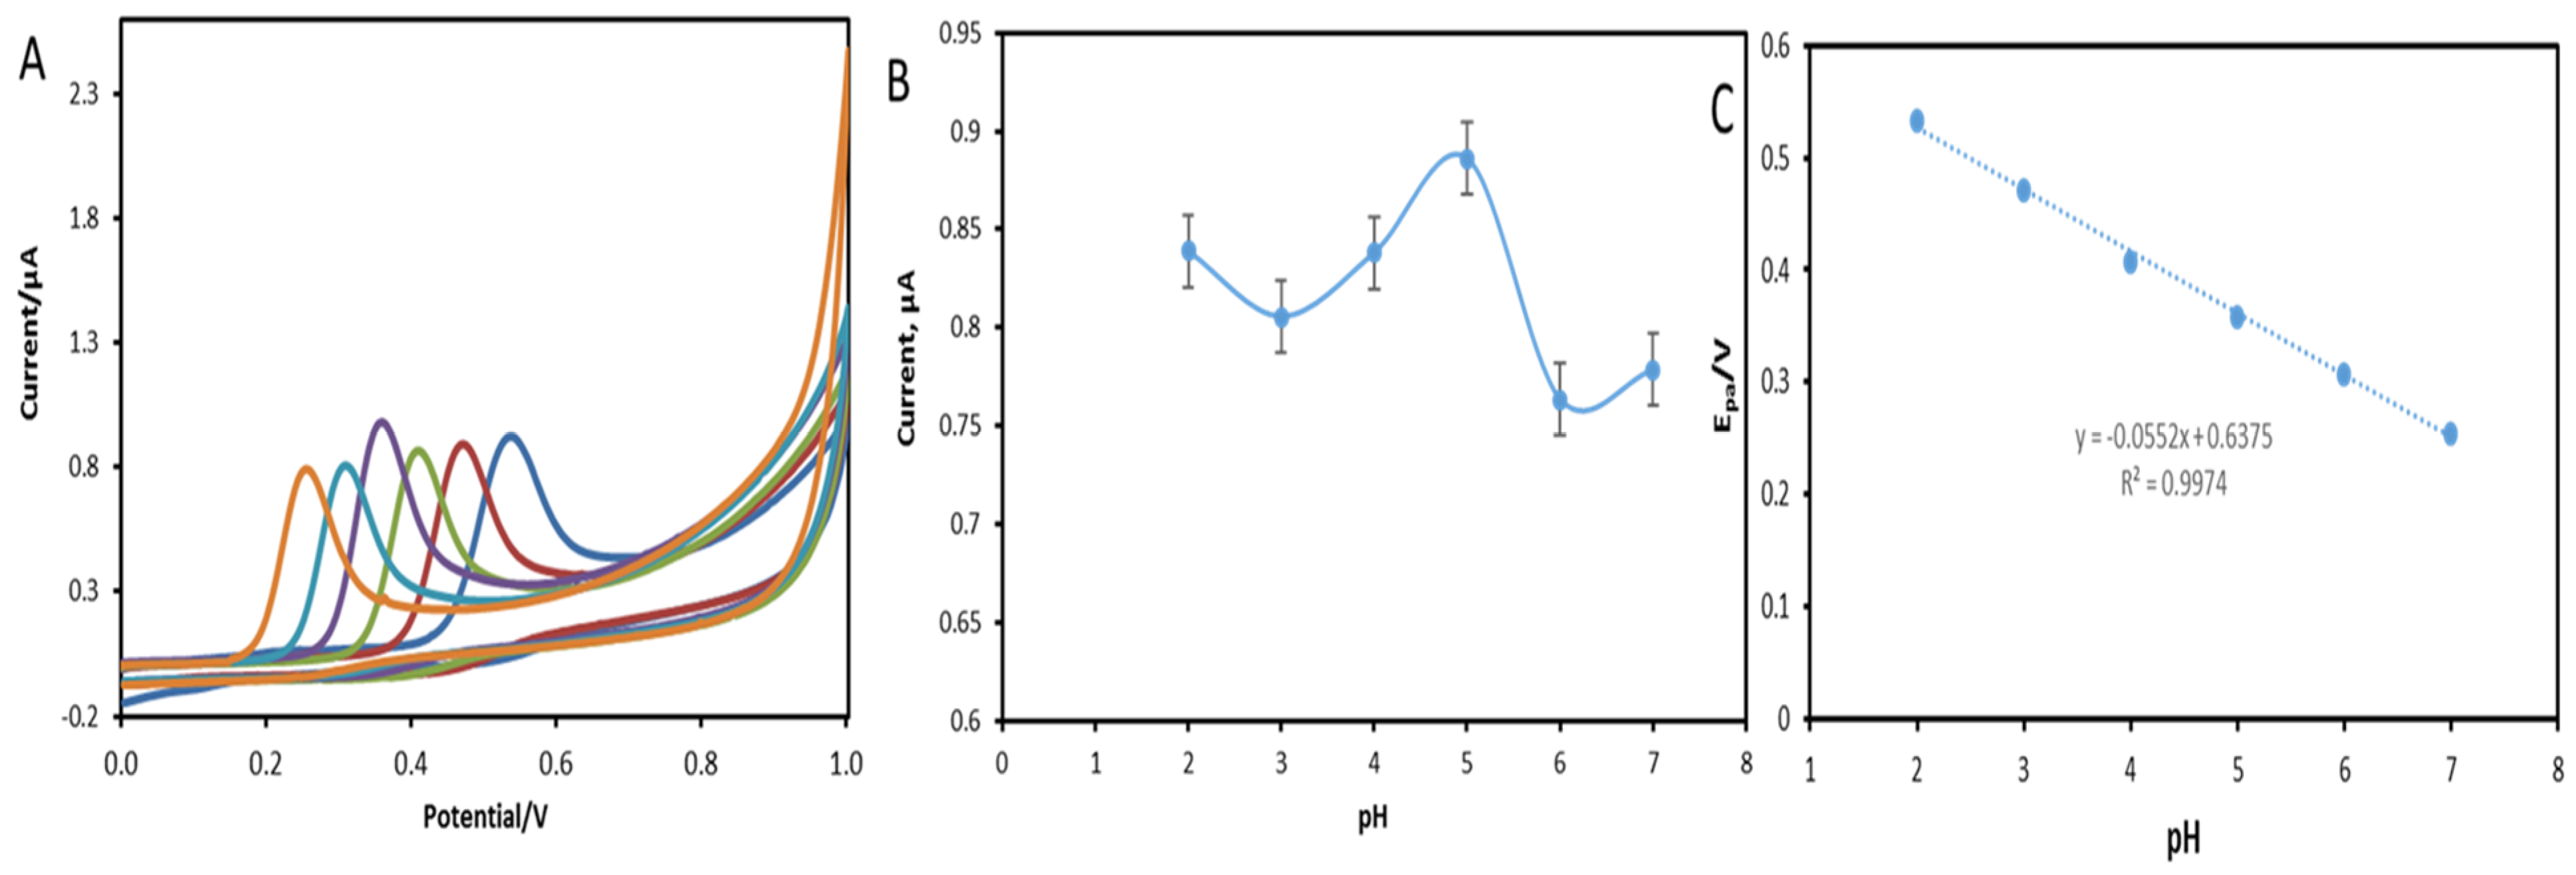
The modified SPEs were utilised to study the electro-oxidation of E2, as depicted in Figure 5. The CVs for the bare SPE, rGO-CNT/SPE, GO-CNT/SPE, rGO-AuNPs/CNT/SPE, and rGO-AuNP were recorded at pH 5 using a B-R buffer solution with a 20 μM concentration of E2. To achieve greater depth, an investigation was conducted into the influence of various configurations of modified SPEs—on the oxidation peaks of the estradiol, as shown in Figure 5A,B. Figure 5A revealed shows varying oxidation peaks obtained, according to the Figure 5A below with rGO-AuNPs/CNT had the highest, followed by GO-CNT. Also, the differential pulse voltammograms of the bare SPE, GO-CNT/SPE, and rGO-AuNPs/CNT/SPE at 20 μM E2 are depicted in Figure 5B. The results show that the E2 peak current for the bare SPE, GO/CNT/SPE, and rGO-AuNPs/CNT/SPE is elevated compared to CV. This is because differential pulse voltammetry (DPV) is a frequently used electrochemical technique due to its heightened sensitivity and specificity in detecting different analytes. This enables better differentiation between charging and Faradaic currents [16]. The oxidation peak current recorded at +0.385 V was 1.48 µA for the bare SPE, while GO-CNT/SPE exhibited a value of 2.95 µA at 0.392 V, and rGO-AuNPs/CNT/SPE showed an even higher reading of 5.079 µA at 0.371 V.
Meanwhile, rGO-AuNPs and rGO-CNT had no discernible impact on estradiol’s peak current, which maintained a consistent value of approximately 2.9 µA (as depicted in Figure 5B). As such, it was determined that rGO-AuNPs/CNT would be utilised for subsequent measurements against the bare SPE as model electrodes.
The outcome revealed that the rGO-AuNPs/CNT/SPE had the highest response for E2 peak current, as compared to the GO-CNT/SPE and bare electrodes. At + 0.363 V, an oxidation peak current value of 0.19 µA was observed on the unmodified SPE surface, whereas it was found to be higher (i.e., 0.322 µA at 0.359 V and 0.536 µA at + 0.363 V) for the GO-CNT/SPE and rGO-AuNPs/CNT/SPE surfaces, respectively; this is consistent with the prior literature [76]. This increase was due to the rGO-AuNPs/CNT material properties providing enhanced electron transfer.
Moreover, to clarify the oxidation mechanism of E2 at the rGO-AuNPs/CNT electrode in a Britton–Robinson solution with pH 5, cyclic voltammetry studies were conducted at varying scan rates between 25 and 170 mVs−1 (Figure 5C). The peak currents obtained demonstrated a linear correlation with the square root of scan rate, indicating that the process is controlled by diffusion (Figure 5D).

3.3. Effect of pH

Figure 6 shows the effects of pH on the direct oxidation of E2 at the rGO-AuNPs/CNT electrode. Values of pH ranging from 2 to 7 were investigated, with rGO-AuNPs/CNT having the highest peak currents (Ip) at pH 5 (Figure 6C). According to the equation, the E2 peak potential would move to more negative potential values with increasing pH (Ep = −0.0552, pH + 0.6375, indicating a 55 mV/pH slope). This slope is close to the Nernst theoretical value of 59 mV/pH for an oxidation involving an equal number of electrons and protons. Consequently, a pH 5 0.04 M Britton–Robison buffer was selected for subsequent studies. Various electrolytes have been studied for the oxidation of E2 as shown in the Supplementary Information in Figure S1. A similar pH value was the choice for optimum estradiol determination using voltammetry by Ozcan et al. [77]. Based on this information, and result below, pH 5 was selected for subsequent experiments.

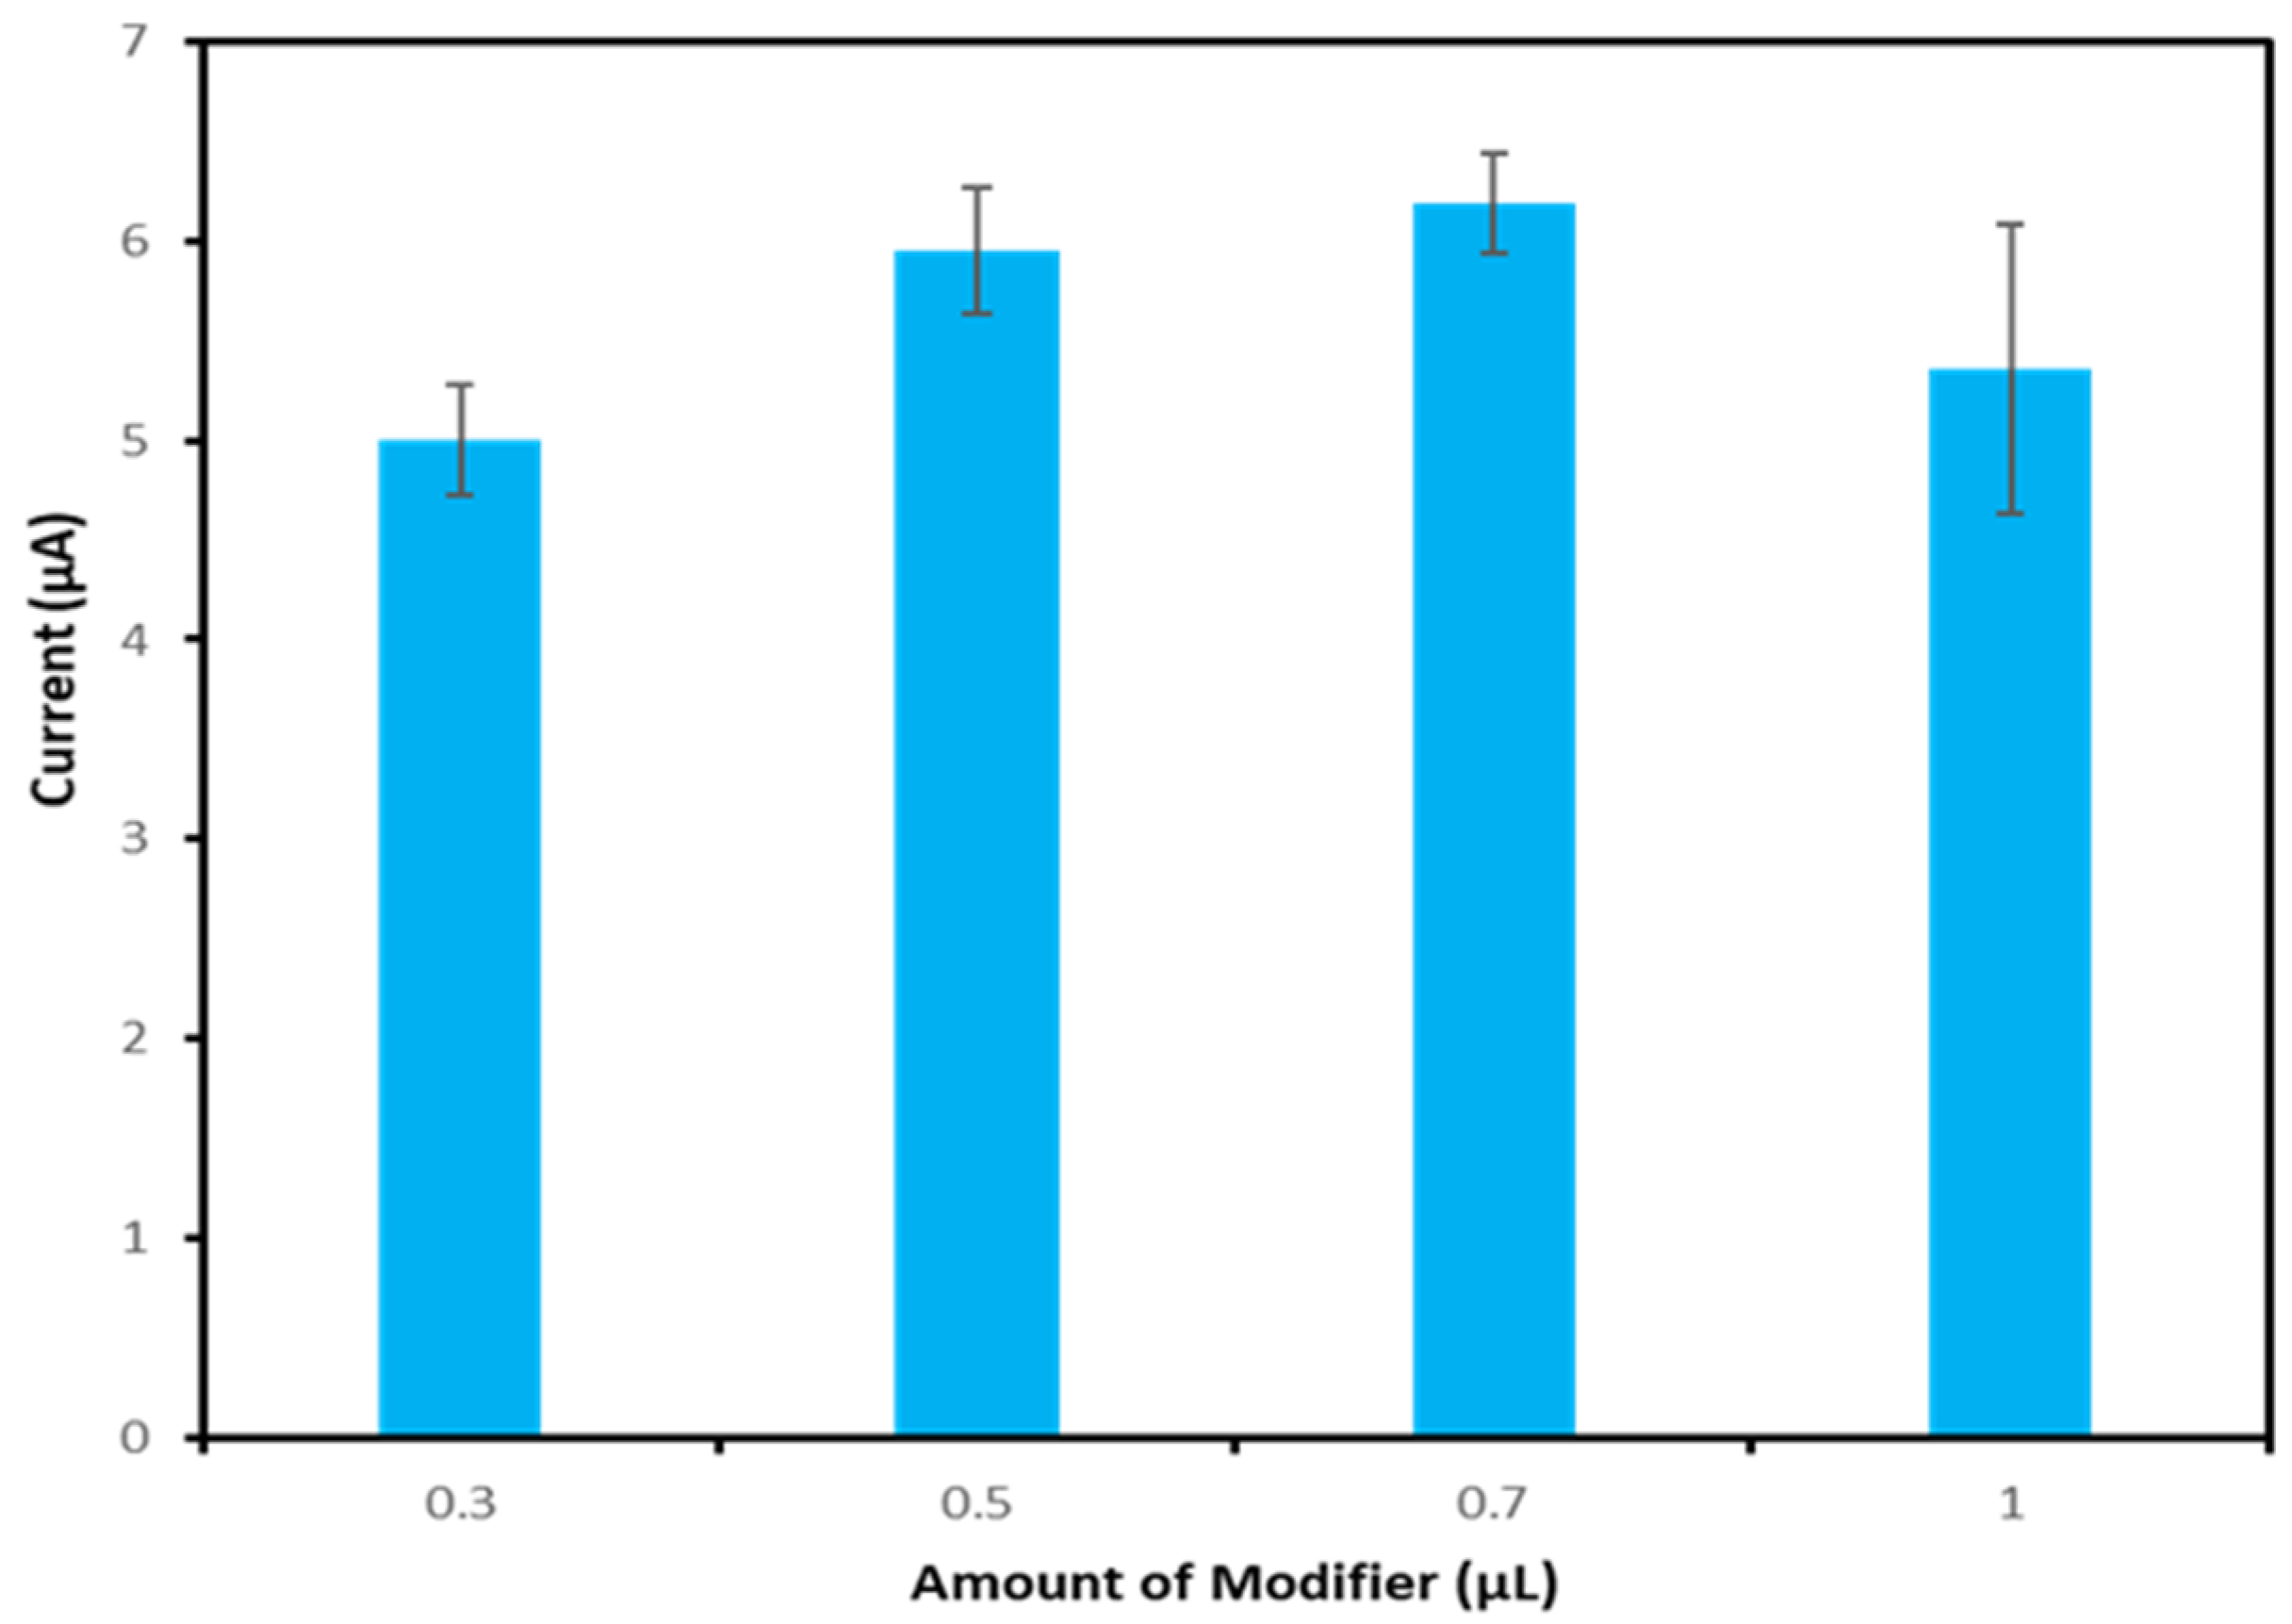
3.4. Optimisation of Modifier

Figure 7 shows the effects of utilising different amounts of rGO-AuNPs/CNT to modify the SPE in terms of its resulting sensitivity. Volumes of 0.3–1.0 µL of the rGO-AuNPs/CNT suspension were drop-casted onto the working electrode. Figure 5 shows the effects of the composites on the direct oxidation of E2 on the rGO-AuNPs/CNT electrode. The highest peak current was obtained for 0.7 µL of suspension; consequently, this volume was selected to modify the SPE in further investigations. As the amount of the rGO-AuNPs/CNT modifier increased, the peak current decreased. A further study that was carried out involved adding 0.7 µL of the modifier in the form of layer-by-layer modification (2x). However, the resulting current was observed to decrease using this approach, which was considered to be due to the aggregation of the modifier particles and the stacking of various materials in the composite. Consequently, a single 0.7 µL drop-cast was utilised for the rest of the experiments.

3.5. Chemometric Fourier Analysis

The discipline of chemometrics has found utility in the realm of electrochemistry for differentiating faradaic current contributions from background interferences arising due to charging current. A multitude of approaches have been employed, including curve-fitting [78], Kalman filters [79], derivative techniques [80], and Fourier transforms [72,81,82]. Carvalho et al. implemented Fourier-transform-based noise reduction methods in voltammetric analysis to minimise background interference effects [83]. This study used a multivariate calibration method to replicate and evaluate voltammetric data [83]. Additionally, Górski et al. [84] created an algorithm that addresses the contribution of net faradaic current. The report indicated that implementing the algorithm effectively reduced the background current and enhanced the signal-to-noise ratio [84]. Consequently, DPV can be regarded as an efficient electroanalytical technique with established benefits, such as superior discrimination against background currents and low detection or determination limits when combined with appropriate data processing algorithms. This led to exploring rGO-AuNPs/CNT/SPE analytical capabilities for detecting E2 using DPV.

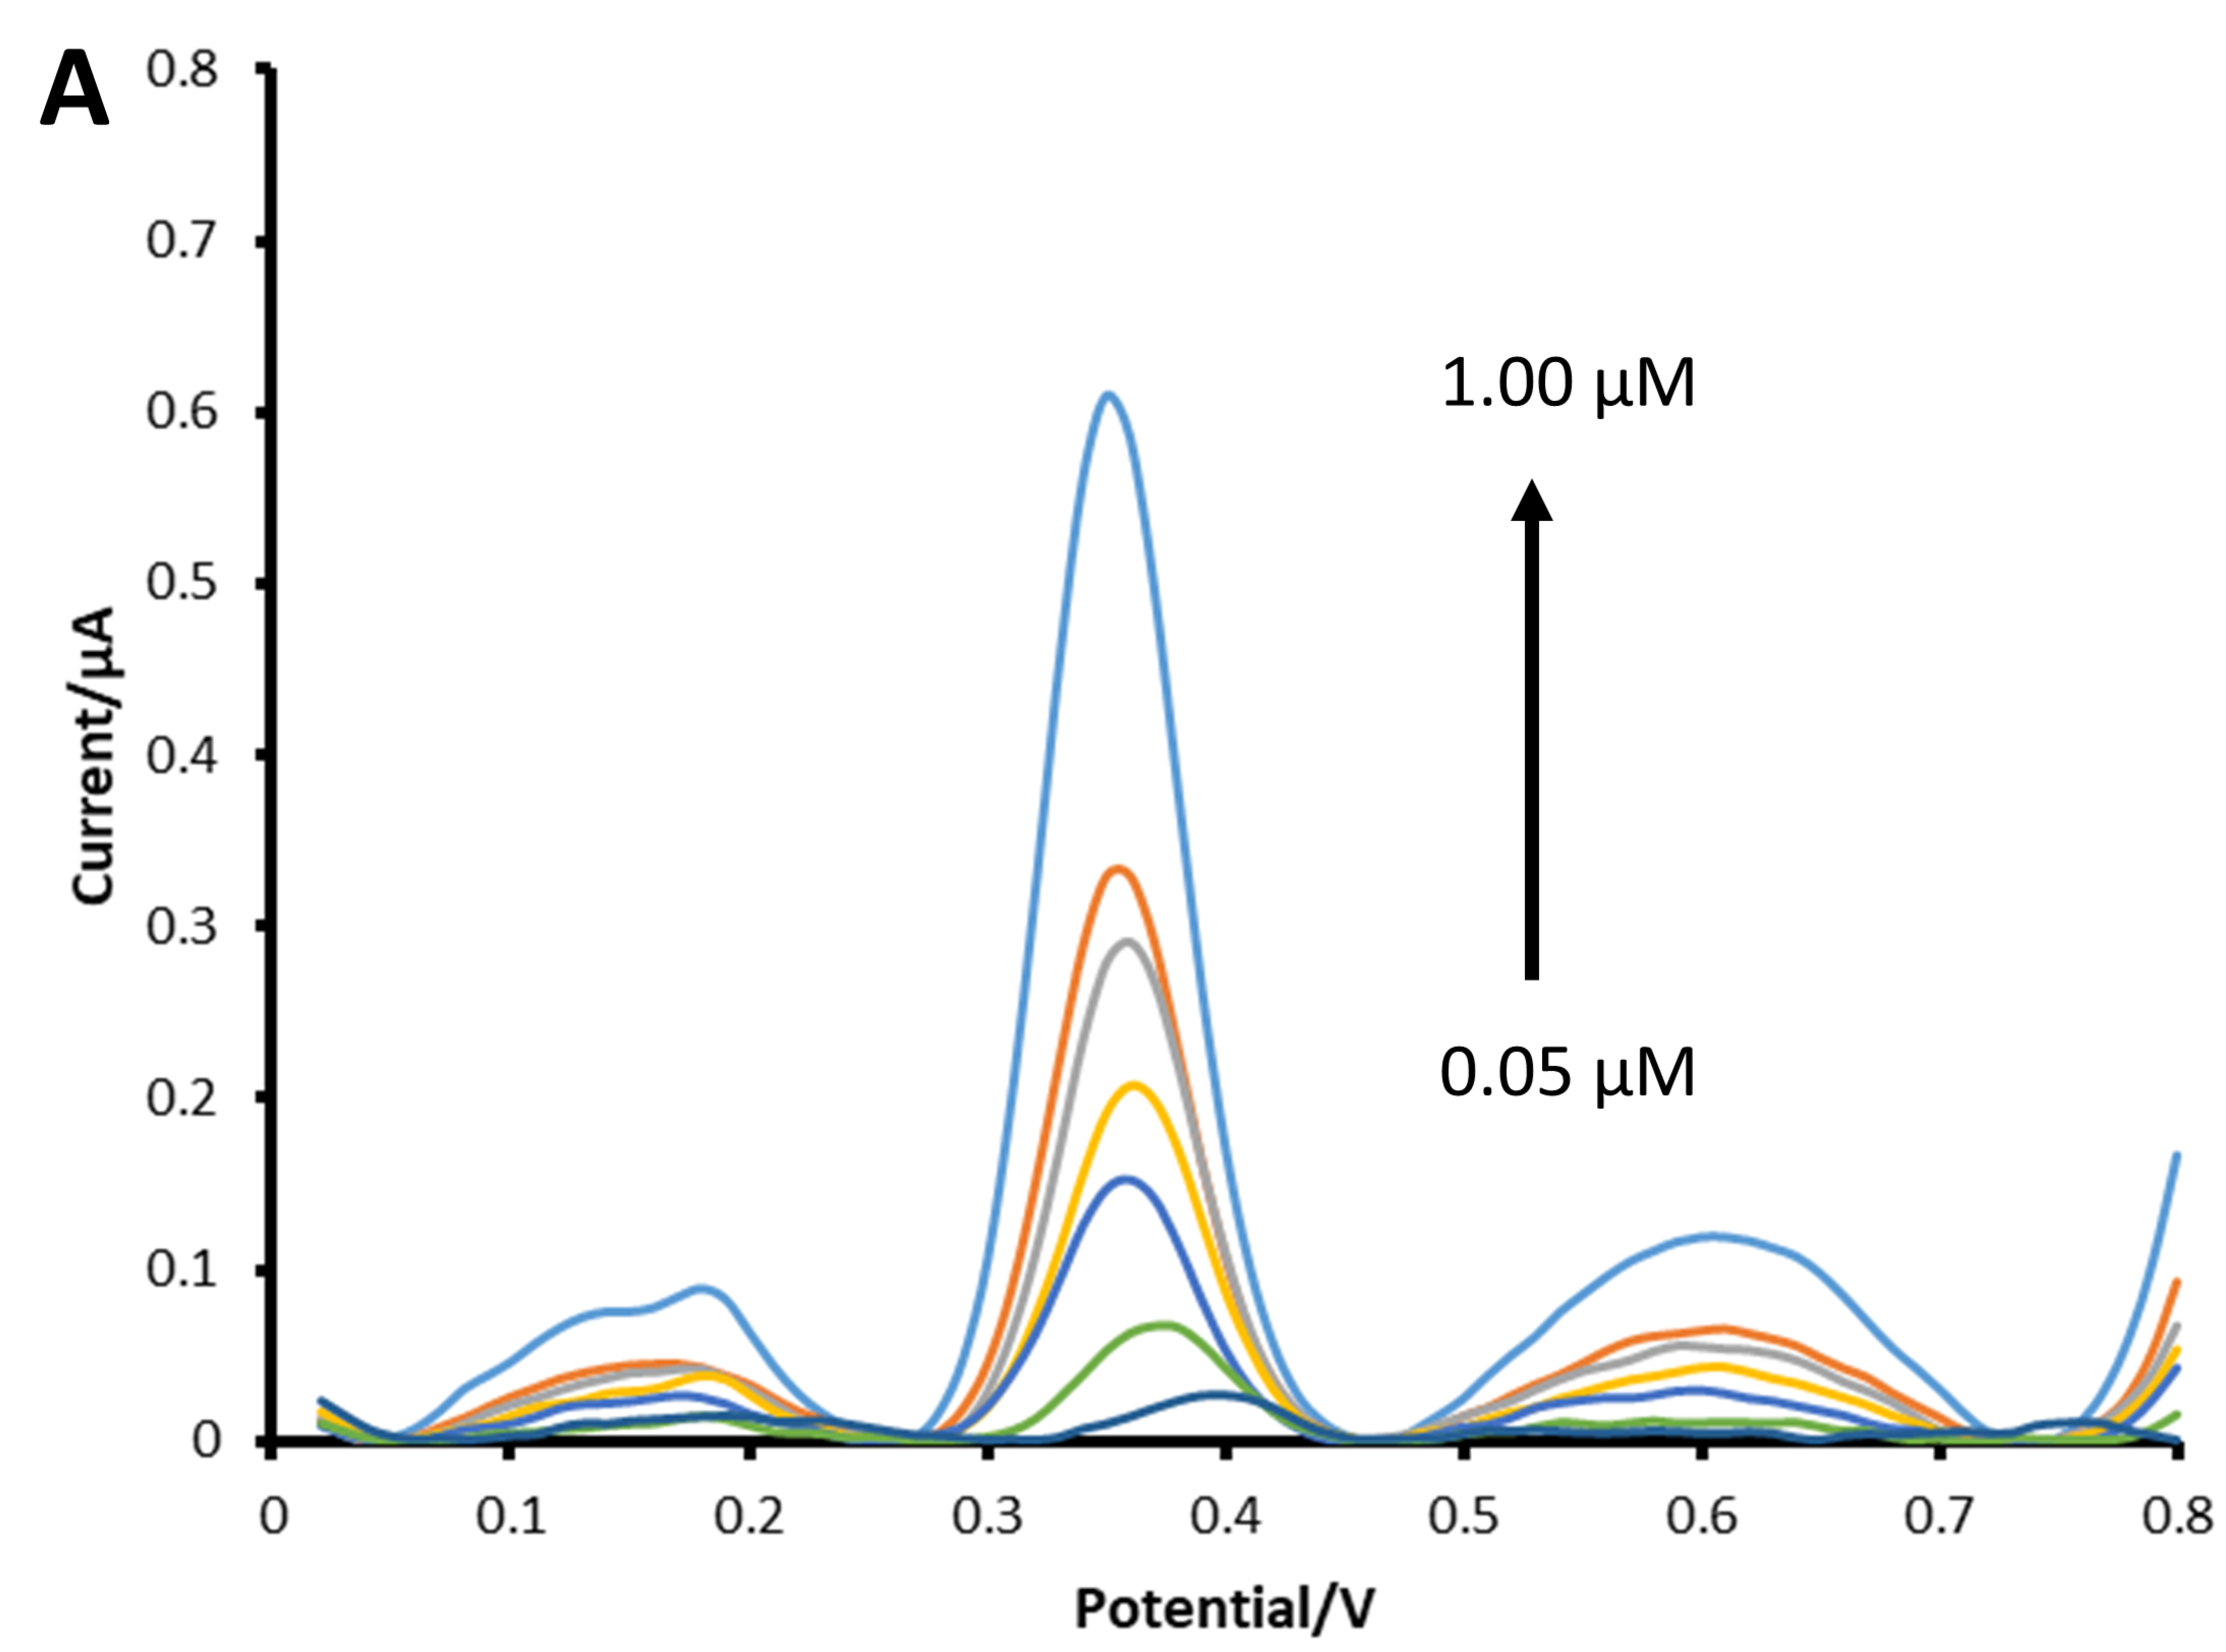
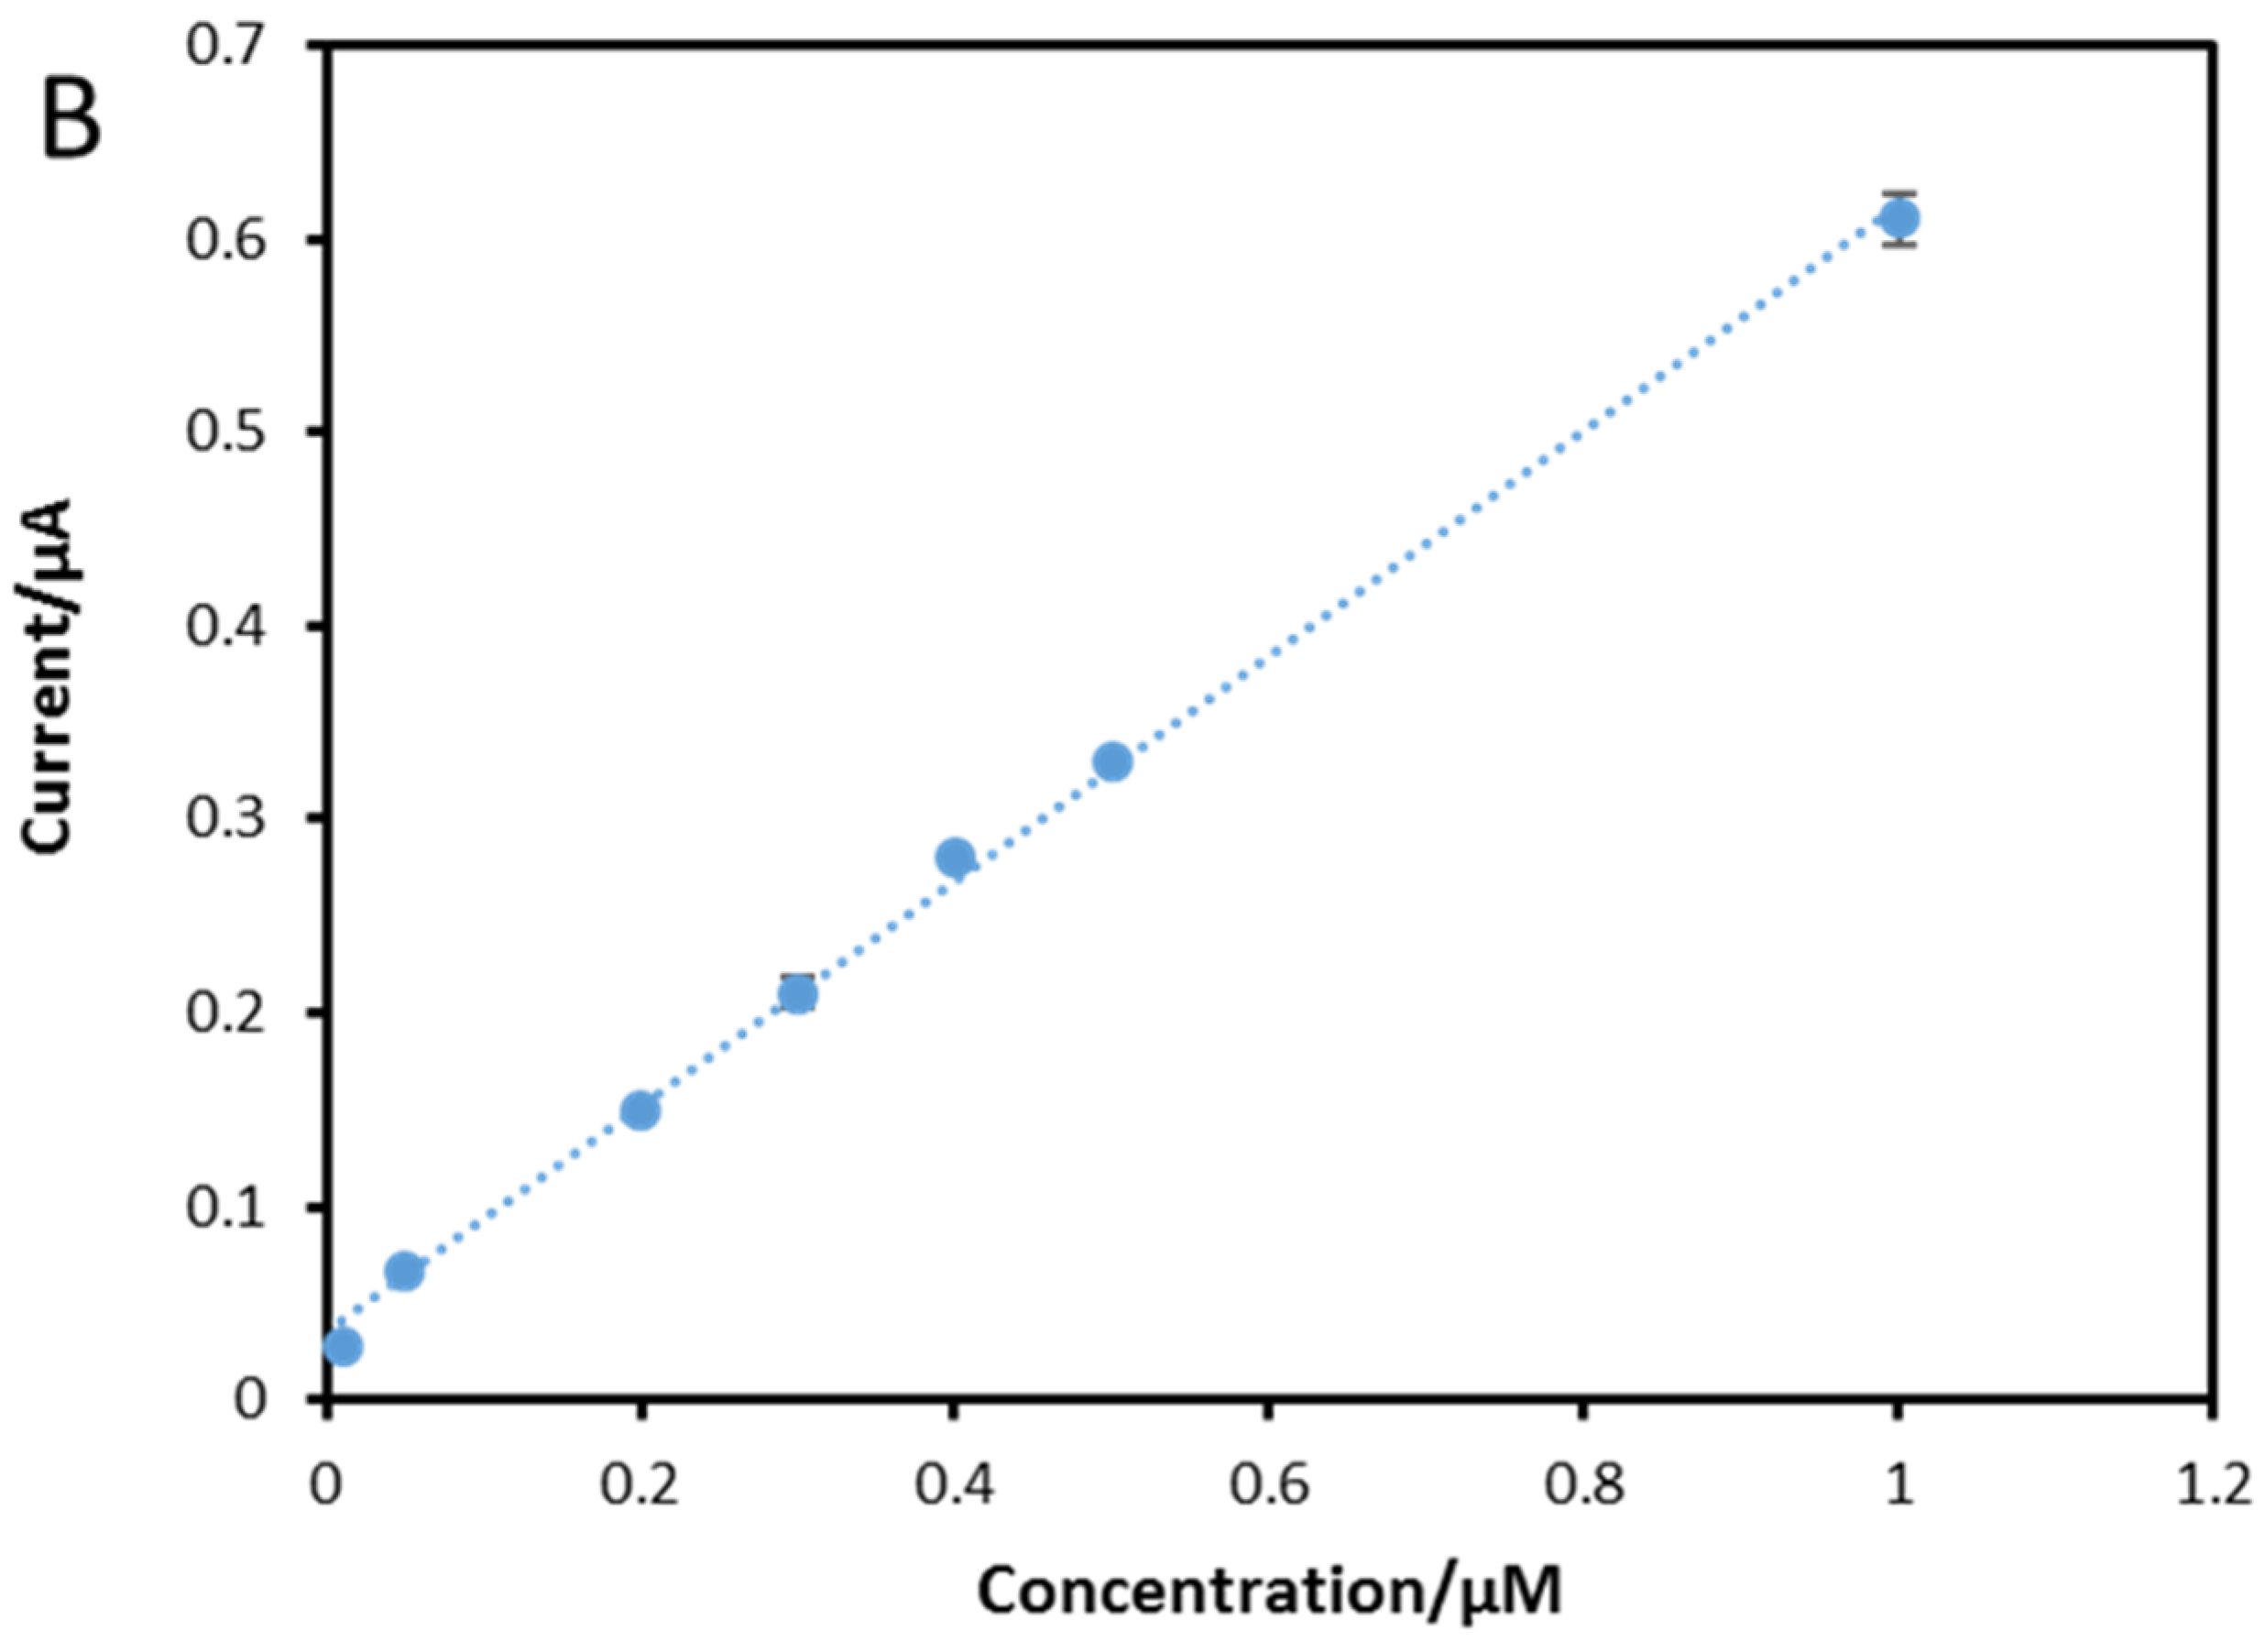
3.6. Calibration Curve and Limit of Detection

To examine the sensor’s response to various concentrations of E2 (ranging from 0.05 to 1.0 µM), differential pulse voltammetry was performed utilising a modified SPE consisting of rGO-AuNPs/CNT. Calibration plots were generated by analysing the peak current, and each investigation was repeated three times to ensure accuracy. The limits of detection (LOD) and quantification (LOQ) were computed as LOD = 3 δ/m and LOQ = 10 δ/m, respectively, with δ being the standard deviation for oxidation peak currents at the lowest detectable concentration, while m represents the slope gradient in the calibration curve analysis. This method enabled the accurate evaluation of low levels of E2 using electrochemical sensors through advanced modifications incorporating nanomaterials such as rGO-AuNPs/CNT on an SPE platform. The linear response of the sensor to E2 within the range of 0.05–1.00 µM E2 is illustrated in Figure 8A,B, with an R2 value of 0.9945 and a sample size (n) of seven. The limit of quantification (LOQ) was determined to be 0.66 µM, while the corresponding limit of detection (LOD) was calculated as low as 3 nM, indicating superior performance compared to previous studies on graphene-based materials such as RGO/CuTthP [27], CPE/GNR-FS-Au-CA [77], Gr–PANI [85], and GQDs-PSSA/GO [86]. Table 1 presents a comparison of the detection limits for estradiol using various graphene-based materials reported in the literature.

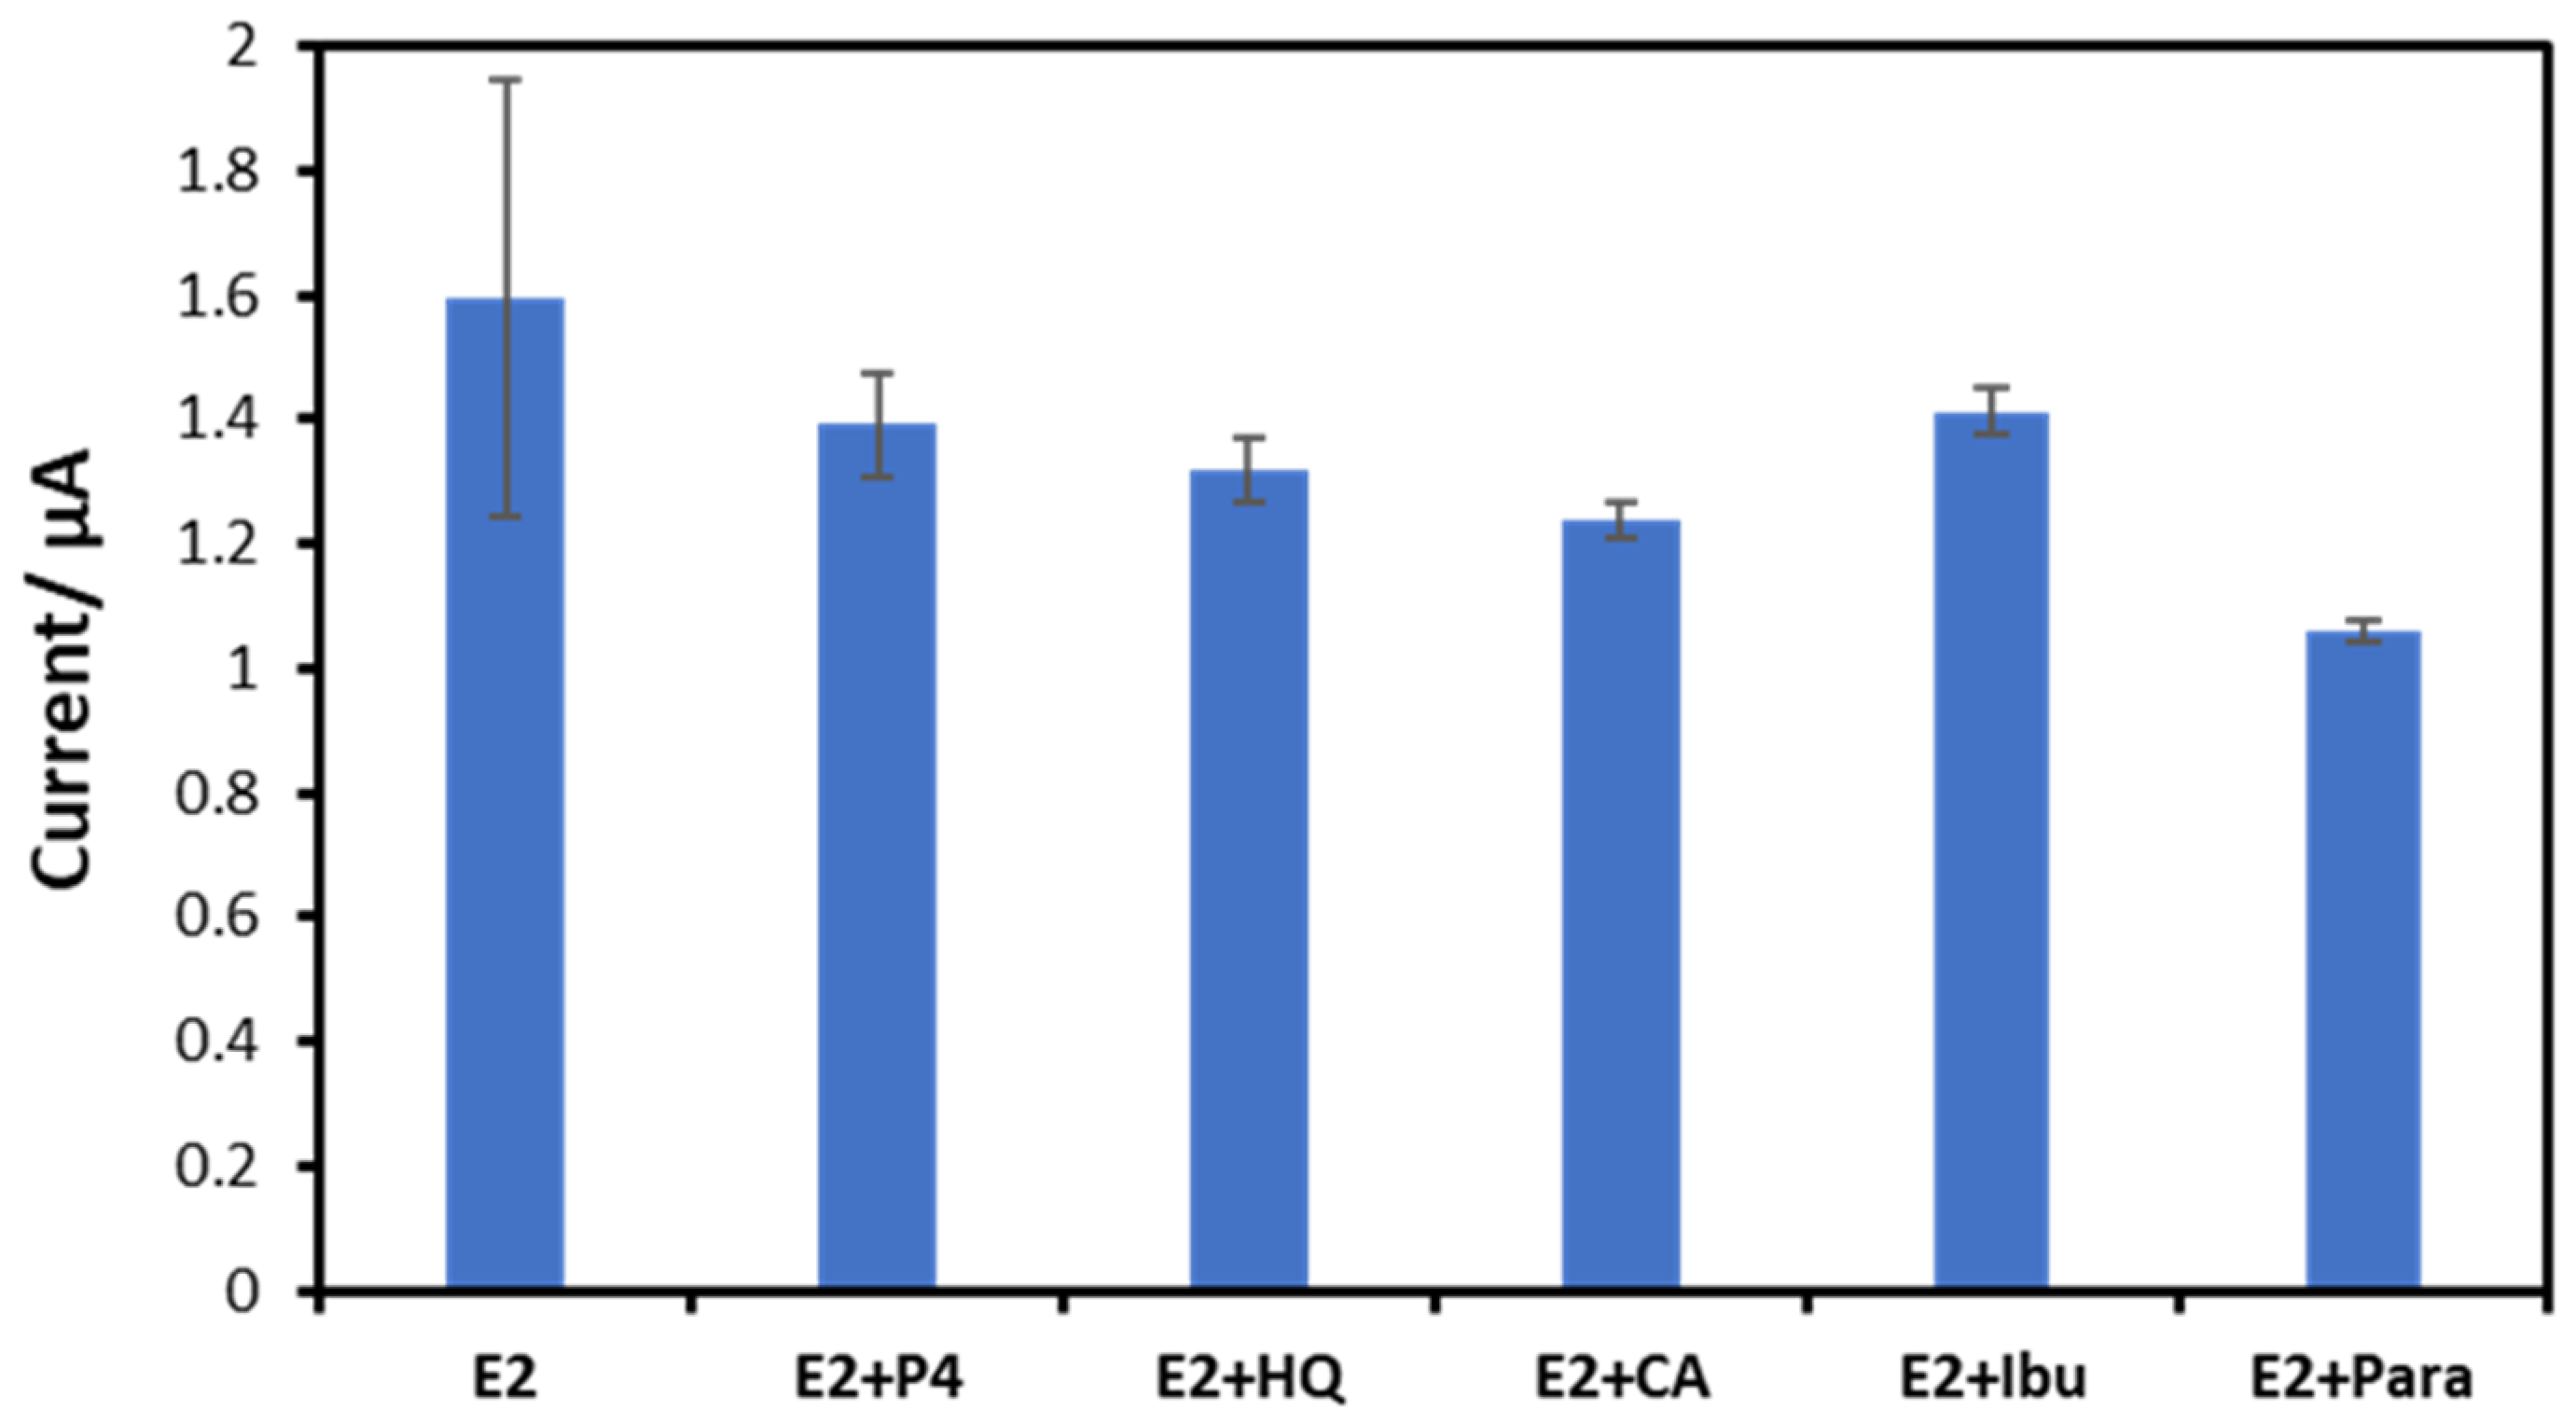
3.7. Reproducibility and Interference Studies

Stability and reproducibility studies were carried out to test the performance of the modified electrodes. In addition, reproducibility studies were carried out to test the rGO-AuNP-CNT/SPCE modified electrode using DPV measurements (n = 5) in the Britton–Robinson buffer. The results revealed that the fabricated sensor showed good reproducibility for a 5 µM E2 solution, with a coefficient of variance of 5.3%. To assess the influence of interferents, hydroquinone, dopamine, paracetamol, ibuprofen, and bisphenol A were investigated, as they are present in the water environment. An E2 concentration of 5 µM was used, with a 10-molar excess of the interferent under investigation as shown in Figure 9. No interference was observed for paracetamol and hydroquinone or for dopamine or ibuprofen. However, bisphenol A significantly influenced the oxidation peak current of estradiol, as it had a broad oxidation peak, increasing the signal for E2 by more than 50%, in contrast to less than 10% for the other interferents studied.

3.8. Analysis of E2 in Drinking Water Samples

To ascertain the sensor’s analytical applicability for water testing, drinking water samples were fortified with E2 and investigated using the optimised SPE and voltammetric conditions. The samples (30 mL) were fortified with E2 at 0.5 and 0.9 µM with no dilution with buffer. Table 2 shows the recovery studies on water samples to determine the sensor’s performance, along with the spiked water samples with various amounts of E2.

4. Conclusions

This study has successfully demonstrated a one-step method for synthesising hybrid composites to modify screen-printed electrodes to determine E2 in water samples. The developed strategy, using a green synthesis of AuNPs and integration with reduced graphene oxide and carbon nanotubes, significantly improves the electrochemical characteristics and reproducibility of the sensor.
The one-step method for synthesising hybrid composites for the modification of the SPE was developed by reducing AuNPs via a graphene oxide suspension with extracts obtained from bay laurel at room temperature. Correspondingly, combining them with carbon nanotubes produced rGO-AuNPs/CNT composite materials. The overall strategy for the green synthesis of AuNPs was developed using an organic, solvent-free method. In addition, the AuNP-decorated reduced graphene oxide serves as a dispersant for carbon nanotubes, removing the need to avoid the application of harsh solvents. Combining AuNP-integrated reduced graphene oxide and carbon nanotubes improved the performance of the sensor, showing superior electrochemical characteristics compared with other graphene-based sensors for E2 detection. In addition to reproducibility (relative standard of deviation of 2.58%), an LOD of 3 nM and an associated recovery of 92% were reported for the analysis of drinking water samples.

Supplementary Materials

The following supporting information can be downloaded at: https://www.mdpi.com/2079-6374/13/4/491/s1, Figure S1: Shows the peak currents in various supporting electrolytes; Figure S2: (A) Cyclic voltammograms (CVs) of bare SPE in 20 µM E2 at 25–170 mVs−1 scan rate. (B) Plot of current peak vs. scan rate. (C) Plot of current peak vs. square root of scan rate; Figure S3: Photograph of (A) Bay leaf extract (B) carbon-nanotubes in water (C) Gold nanoparticle reduced/graphene Oxide-Carbon nanotubes (D) Gold nanoparticle; Figure S4: (A) CV of Bare SPE immersed in 0.1 M KCl containing 5 mM [FeCN6]−3/−4 at 100 mVs−1 scan rate. (B) anodic current peak vs. square root of scan rate, and cathodic current peak vs. square root of scan rate of bare SPE. (C) CVs of rGO/CNT/SPE at different scan rates (25–200 mVs−1) 0.1 M KCl containing 5 mM [FeCN6]−3/−4. (D) Anodic current peak vs. square root of scan rate, and cathodic current peak vs. square root of scan rate of rGO/CNT/SPE electrode; Table S1: Electroactive surface area vs. electrode composition.

Author Contributions

Conceptualisation, A.M.M.; writing, A.M.M.; visualisation, A.M.M.; writing—original draft preparation, K.C.H.; writing—review and editing, K.C.H.; supervision, R.L.; project administration, J.K. supervision, K.C.H., R.L., and J.K.; funding acquisition, J.K. All authors have read and agreed to the published version of the manuscript.

Funding

This research received funding from Petroleum Technology Development Fund (PTDF), Nigeria, with funding (No. PTDF/ED/PHD/AMM/1519/19) for Auwal. M Musa.

Institutional Review Board Statement

Not applicable.

Informed Consent Statement

Not applicable.

Data Availability Statement

Not applicable.

Acknowledgments

The authors would like to thank the University of the West of England, and Palintest Limited, UK. Thanks also go to David Ferrier of Health Technology Hub, University of the West of England for his support, James Iacobini and Samantha Lunn of Palintest for their helpful comments and suggestions.

Conflicts of Interest

The authors declare no conflict of interest.

References

  1. Geissen, V.; Mol, H.; Klumpp, E.; Umlauf, G.; Nadal, M.; van der Ploeg, M.; van de Zee, S.E.A.T.M.; Ritsema, C.J. Emerging pollutants in the environment: A challenge for water resource management. Int. Soil Water Conserv. Res. 2015, 3, 57–65. [Google Scholar] [CrossRef]
  2. Liu, Z.-H.; Dang, Z.; Yin, H.; Liu, Y. Making waves: Improving removal performance of conventional wastewater treatment plants on endocrine disrupting compounds (EDCs): Their conjugates matter. Water Res. 2021, 188, 116469. [Google Scholar] [CrossRef] [PubMed]
  3. Pillon, A.; Boussioux, A.-M.; Escande, A.; Ait-Aissa, S.; Gomez, E.; Fenet, H.; Ruff, M.; Moras, D.; Vignon, F.; Duchesne, M.-J.; et al. Binding of Estrogenic Compounds to Recombinant Estrogen Receptor-α: Application to Environmental Analysis. Environ. Health Perspect. 2005, 113, 278–284. [Google Scholar] [CrossRef] [PubMed] [Green Version]
  4. Lee, M.-H.; Thomas, J.L.; Liu, W.-C.; Zhang, Z.-X.; Liu, B.-D.; Yang, C.-H.; Lin, H.-Y. A multichannel system integrating molecularly imprinted conductive polymers for ultrasensitive voltammetric determination of four steroid hormones in urine. Microchim. Acta 2019, 186, 695. [Google Scholar] [CrossRef]
  5. Honeychurch, K.C.; Piano, M. Electrochemical (Bio) Sensors for Environmental and Food Analyses. Biosensors 2018, 8, 57. [Google Scholar] [CrossRef] [Green Version]
  6. Barton, J.; García, M.B.G.; Santos, D.H.; Fanjul-Bolado, P.; Ribotti, A.; McCaul, M.; Diamond, D.; Magni, P. Screen-printed electrodes for environmental monitoring of heavy metal ions: A review. Microchim. Acta 2016, 183, 503–517. [Google Scholar] [CrossRef]
  7. Hu, S.; Wu, K.; Yi, H.; Cui, D. Voltammetric behavior and determination of estrogens at Nafion-modified glassy carbon electrode in the presence of cetyltrimethylammonium bromide. Anal. Chim. Acta 2002, 464, 209–216. [Google Scholar] [CrossRef]
  8. Moreira, F.; Santana, E.R.; Spinelli, A. Ionic liquid-supported magnetite nanoparticles as electrode modifier materials for estrogens sensing. Sci. Rep. 2020, 10, 1–11. [Google Scholar] [CrossRef] [Green Version]
  9. Pavinatto, A.; Mercante, L.A.; Leandro, C.S.; Mattoso, L.H.; Correa, D.S. Layer-by-Layer assembled films of chitosan and multi-walled carbon nanotubes for the electrochemical detection of 17α-ethinylestradiol. J. Electroanal. Chem. 2015, 755, 215–220. [Google Scholar] [CrossRef]
  10. Barreca, S.; Busetto, M.; Colzani, L.; Clerici, L.; Daverio, D.; Dellavedova, P.; Balzamo, S.; Calabretta, E.; Ubaldi, V. Determination of estrogenic endocrine disruptors in water at sub-ng L−1 levels in compliance with Decision 2015/495/EU using offline-online solid phase extraction concentration coupled with high performance liquid chromatography-tandem mass spectrometry. Microchem. J. 2019, 147, 1186–1191. [Google Scholar] [CrossRef]
  11. Barreiros, L.; Queiroz, J.F.; Magalhães, L.M.; Silva, A.M.; Segundo, M.A. Analysis of 17-β-estradiol and 17-α-ethinylestradiol in biological and environmental matrices—A review. Microchem. J. 2016, 126, 243–262. [Google Scholar] [CrossRef]
  12. Pereira, A.C.; Braga, G.B.; Oliveira, A.E.F.; Silva, R.C.; Borges, K.B. Synthesis and characterization of molecularly imprinted polymer for ethinylestradiol. Chem. Pap. 2019, 73, 141–149. [Google Scholar] [CrossRef]
  13. Zhang, G.; Li, T.; Zhang, J.; Chen, A. A simple FRET-based turn-on fluorescent aptasensor for 17β-estradiol determination in environmental water, urine and milk samples. Sens. Actuators B Chem. 2018, 273, 1648–1653. [Google Scholar] [CrossRef]
  14. Liu, X.; Deng, K.; Wang, H.; Li, C.; Zhang, S.; Huang, H. Aptamer based ratiometric electrochemical sensing of 17β-estradiol using an electrode modified with gold nanoparticles, thionine, and multiwalled carbon nanotubes. Microchim. Acta 2019, 186, 347. [Google Scholar] [CrossRef] [PubMed]
  15. Wong, A.; Santos, A.M.; Cincotto, F.H.; Moraes, F.C.; Fatibello-Filho, O.; Sotomayor, M.D. A new electrochemical platform based on low cost nanomaterials for sensitive detection of the amoxicillin antibiotic in different matrices. Talanta 2019, 206, 120252. [Google Scholar] [CrossRef]
  16. Santos, A.M.; Wong, A.; Prado, T.M.; Fava, E.L.; Fatibello-Filho, O.; Sotomayor, M.D.; Moraes, F.C. Voltammetric determination of ethinylestradiol using screen-printed electrode modified with functionalized graphene, graphene quantum dots and magnetic nanoparticles coated with molecularly imprinted polymers. Talanta 2021, 224, 121804. [Google Scholar] [CrossRef] [PubMed]
  17. Sun, D.; Deng, Q.; Long, J. Highly sensitive electrochemical sensor for estradiol based on the signal amplification strategy of Cu-BDC frameworks. J. Solid State Electrochem. 2018, 22, 487–493. [Google Scholar] [CrossRef]
  18. Ji, L.; Wang, Y.; Wu, K.; Zhang, W. Simultaneous determination of environmental estrogens: Diethylstilbestrol and estradiol using Cu-BTC frameworks-sensitized electrode. Talanta 2016, 159, 215–221. [Google Scholar] [CrossRef]
  19. Ghalkhani, M.; Fernandes, I.P.; Oliveira, S.C.B.; Shahrokhian, S.; Oliveira-Brett, A.M. Anodic behavior of clioquinol at a glassy carbon electrode. Bioelectrochemistry 2011, 80, 175–181. [Google Scholar] [CrossRef]
  20. Liu, X.; Yao, Y.; Ying, Y.; Ping, J. Recent advances in nanomaterial-enabled screen-printed electrochemical sensors for heavy metal detection. TrAC Trends Anal. Chem. 2019, 115, 187–202. [Google Scholar] [CrossRef]
  21. Radhakrishnan, S.; Mathiyarasu, J. Graphene-Carbon Nanotubes Modified Electrochemical Sensors; Elsevier Inc.: Amsterdam, The Netherlands, 2018. [Google Scholar] [CrossRef]
  22. Vasilescu, A.; Fanjul-Bolado, P.; Titoiu, A.-M.; Porumb, R.; Epure, P. Progress in Electrochemical (Bio)Sensors for Monitoring Wine Production. Chemosensors 2019, 7, 66. [Google Scholar] [CrossRef] [Green Version]
  23. Rowley-Neale, S.J.; Brownson, D.A.C.; Smith, G.; Banks, C.E. Graphene Oxide Bulk-Modified Screen-Printed Electrodes Provide Beneficial Electroanalytical Sensing Capabilities. Biosensors 2020, 10, 27. [Google Scholar] [CrossRef] [PubMed] [Green Version]
  24. Cinti, S.; Arduini, F.; Carbone, M.; Sansone, L.; Cacciotti, I.; Moscone, D.; Palleschi, G. Screen-Printed Electrodes Modified with Carbon Nanomaterials: A Comparison among Carbon Black, Carbon Nanotubes and Graphene. Electroanalysis 2015, 27, 2230–2238. [Google Scholar] [CrossRef]
  25. Velický, M.; Bradley, D.F.; Cooper, A.J.; Hill, E.W.; Kinloch, I.A.; Mishchenko, A.; Novoselov, K.S.; Patten, H.V.; Toth, P.S.; Valota, A.T.; et al. Electron Transfer Kinetics on Mono- and Multilayer Graphene. ACS Nano 2014, 8, 10089–10100. [Google Scholar] [CrossRef] [PubMed]
  26. Iijima, S.; Ichihashi, T. Single-shell carbon nanotubes of 1-nm diameter. Nature 1993, 363, 603–605. [Google Scholar] [CrossRef]
  27. Moraes, F.C.; Rossi, B.; Donatoni, M.C.; de Oliveira, K.T.; Pereira, E.C. Sensitive determination of 17β-estradiol in river water using a graphene based electrochemical sensor. Anal. Chim. Acta 2015, 881, 37–43. [Google Scholar] [CrossRef]
  28. Jacobs, C.B.; Peairs, M.J.; Venton, B.J. Review: Carbon nanotube based electrochemical sensors for biomolecules. Anal. Chim. Acta 2010, 662, 105–127. [Google Scholar] [CrossRef]
  29. Ferrier, D.C.; Honeychurch, K.C. Carbon Nanotube (CNT)-Based Biosensors. Biosensors 2021, 11, 486. [Google Scholar] [CrossRef]
  30. Grosse, W.; Champavert, J.; Gambhir, S.; Wallace, G.G.; Moulton, S.E. Aqueous dispersions of reduced graphene oxide and multi wall carbon nanotubes for enhanced glucose oxidase bioelectrode performance. Carbon 2013, 61, 467–475. [Google Scholar] [CrossRef] [Green Version]
  31. Zhang, C.; Ren, L.; Wang, X.; Liu, T. Graphene Oxide-Assisted Dispersion of Pristine Multiwalled Carbon Nanotubes in Aqueous Media. J. Phys. Chem. C 2010, 114, 11435–11440. [Google Scholar] [CrossRef]
  32. Avouris, P.; Dimitrakopoulos, C. Graphene: Synthesis and applications. Mater. Today 2012, 15, 86–97. [Google Scholar] [CrossRef]
  33. Balandin, A. Thermal properties of graphene and nanostructured carbon materials. Nature Mater. 2011, 10, 569–581. [Google Scholar] [CrossRef] [PubMed] [Green Version]
  34. Keeley, G.P.; O’Neill, A.; Holzinger, M.; Cosnier, S.; Coleman, J.N.; Duesberg, G.S. DMF-exfoliated graphene for electrochemical NADH detection. Phys. Chem. Chem. Phys. 2011, 13, 7747–7750. [Google Scholar] [CrossRef] [PubMed]
  35. Allen, M.J.; Tung, V.C.; Kaner, R.B. Honeycomb Carbon: A Review of Graphene. Chem. Rev. 2010, 110, 132–145. [Google Scholar] [CrossRef] [PubMed]
  36. Verma, D.; Ranjan, K.R.; Mukherjee, M.D.; Solanki, P.R. Bioinspired synthesis of hematite nanoparticles-reduced graphene oxide composite for application in bisphenol a detection: A new in-sight. Biosens. Bioelectron. X 2022, 11, 100217. [Google Scholar] [CrossRef]
  37. Ambrosi, A.; Pumera, M. Electrochemically Exfoliated Graphene and Graphene Oxide for Energy Storage and Electrochemistry Applications. Chem. A Eur. J. 2016, 22, 153–159. [Google Scholar] [CrossRef] [PubMed]
  38. Truong, T.N.L.; Van Toan, P.; Hao, N.Q. Using AuNPs-modified screen-printed electrode in the development of molecularly imprinted polymer for artificial bioreceptor fabrication to improve biosensor sensitivity for 17 β -estradiol detection. Adv. Nat. Sci. Nanosci. Nanotechnol. 2019, 10, 015015. [Google Scholar] [CrossRef]
  39. Zhang, D.; Zhang, W.; Ye, J.; Zhan, S.; Xia, B.; Lv, J.; Xu, H.; Du, G.; Wang, L. A Label-Free Colorimetric Biosensor for 17β-Estradiol Detection Using Nanoparticles Assembled by Aptamer and Cationic Polymer. Aust. J. Chem. 2016, 69, 12–19. [Google Scholar] [CrossRef]
  40. Xiao, T.; Huang, J.; Wang, D.; Meng, T.; Yang, X. Au and Au-Based nanomaterials: Synthesis and recent progress in electrochemical sensor applications. Talanta 2020, 206, 120210. [Google Scholar] [CrossRef]
  41. Yildirim, N.; Long, F.; Gao, C.; He, M.; Shi, H.-C.; Gu, A.Z. Aptamer-Based Optical Biosensor for Rapid and Sensitive Detection of 17β-Estradiol In Water Samples. Environ. Sci. Technol. 2012, 46, 3288–3294. [Google Scholar] [CrossRef]
  42. Hasyim, M.F.; Wahab, W.A.; Pratiwi, M.W. Synthesis and Characterization of Gold Nanoparticles Using the Bioreductor Bay Leaf (Syzygium polyanthum). J. Akta Kim. Indones. (Indones. Chim. Acta) 2020, 13, 79–84. [Google Scholar] [CrossRef]
  43. Ismail, Z. Green reduction of graphene oxide by plant extracts: A short review. Ceram. Int. 2019, 45, 23857–23868. [Google Scholar] [CrossRef]
  44. Altintas, Z.; Guerreiro, A.; Piletsky, S.A.; Tothill, I.E. NanoMIP based optical sensor for pharmaceuticals monitoring. Sens. Actuators B Chem. 2015, 213, 305–313. [Google Scholar] [CrossRef]
  45. Singh, C.; Sharma, V.; Naik, P.K.; Khandelwal, V.; Singh, H. A green biogenic approach for synthesis of gold and silver nanoparticles using zingiber officinale. Dig. J. Nanomater. Biostructures 2011, 6, 535–542. [Google Scholar]
  46. Ensafi, A.A.; Amini, M.; Rezaei, B. Molecularly imprinted electrochemical aptasensor for the attomolar detection of bisphenol A. Microchim. Acta 2018, 185, 265. [Google Scholar] [CrossRef]
  47. Zhao, W.-R.; Kang, T.-F.; Lu, L.-P.; Shen, F.-X.; Cheng, S.-Y. A novel electrochemical sensor based on gold nanoparticles and molecularly imprinted polymer with binary functional monomers for sensitive detection of bisphenol A. J. Electroanal. Chem. 2017, 786, 102–111. [Google Scholar] [CrossRef]
  48. Gao, Q.; Liu, N.; Ma, Z. Prussian blue–gold nanoparticles-ionic liquid functionalized reduced graphene oxide nanocomposite as label for ultrasensitive electrochemical immunoassay of alpha-fetoprotein. Anal. Chim. Acta 2014, 829, 15–21. [Google Scholar] [CrossRef]
  49. Petrucci, R.; Bortolami, M.; Di Matteo, P.; Curulli, A. Gold Nanomaterials-Based Electrochemical Sensors and Biosensors for Phenolic Antioxidants Detection: Recent Advances. Nanomaterials 2022, 12, 959. [Google Scholar] [CrossRef]
  50. Yaseen, M.; Humayun, M.; Khan, A.; Usman, M.; Ullah, H.; Tahir, A.; Ullah, H. Preparation, Functionalization, Modification, and Applications of Nanostructured Gold: A Critical Review. Energies 2021, 14, 1278. [Google Scholar] [CrossRef]
  51. Raymundo-Pereira, P.A.; Gomes, N.O.; Machado, S.A.S.; Oliveira, O.N., Jr. Simultaneous, ultrasensitive detection of hydroquinone, paracetamol and estradiol for quality control of tap water with a simple electrochemical method. J. Electroanal. Chem. 2019, 848, 113319. [Google Scholar] [CrossRef]
  52. Ferrier, D.C.; Kiely, J.; Luxton, R. Metal oxide decorated carbon nanocomposite electrodes for propofol monitoring. Biosens. Bioelectron. X 2022, 12, 100286. [Google Scholar] [CrossRef]
  53. Wang, B.; Yang, G.; Chen, J.; Fang, G. Green synthesis and characterization of gold nanoparticles using lignin nanoparticles. Nanomaterials 2020, 10, 1869. [Google Scholar] [CrossRef] [PubMed]
  54. Aunkor, M.T.H.; Mahbubul, I.M.; Saidur, R.; Metselaar, H.S.C. The green reduction of graphene oxide. RSC Adv. 2016, 6, 27807–27828. [Google Scholar] [CrossRef]
  55. Shanmugam, M.; Kim, K. Electrodeposited gold dendrites at reduced graphene oxide as an electrocatalyst for nitrite and glucose oxidation. J. Electroanal. Chem. 2016, 776, 82–92. [Google Scholar] [CrossRef]
  56. Mhamane, D.; Ramadan, W.; Fawzy, M.; Rana, A.; Dubey, M.; Rode, C.; Lefez, B.; Hannoyer, B.; Ogale, S. From graphite oxide to highly water dispersible functionalized graphene by single step plant extract-induced deoxygenation. Green Chem. 2011, 13, 1990–1996. [Google Scholar] [CrossRef]
  57. Hou, D.; Liu, Q.; Cheng, H.; Zhang, H.; Wang, S. Green reduction of graphene oxide via Lycium barbarum extract. J. Solid State Chem. 2017, 246, 351–356. [Google Scholar] [CrossRef]
  58. Grennan, K.; Killard, A.J.; Smyth, M.R. Physical Characterizations of a Screen-Printed Electrode for Use in an Amperometric Biosensor System. Electroanalysis 2001, 13, 745–750. [Google Scholar] [CrossRef]
  59. Morrin, A.; Killard, A.; Smyth, M.R. Electrochemical Characterization of Commercial and Home-Made Screen-Printed Carbon Electrodes. Anal. Lett. 2003, 36, 2021–2039. [Google Scholar] [CrossRef] [Green Version]
  60. Nazarpour, S.; Hajian, R.; Sabzvari, M.H. A novel nanocomposite electrochemical sensor based on green synthesis of reduced graphene oxide/gold nanoparticles modified screen printed electrode for determination of tryptophan using response surface methodology approach. Microchem. J. 2020, 154, 104634. [Google Scholar] [CrossRef]
  61. Wang, Y.-C.; Cokeliler, D.; Gunasekaran, S. Reduced Graphene Oxide/Carbon Nanotube/Gold Nanoparticles Nanocomposite Functionalized Screen-Printed Electrode for Sensitive Electrochemical Detection of Endocrine Disruptor Bisphenol A. Electroanalysis 2015, 27, 2527–2536. [Google Scholar] [CrossRef]
  62. Gonçalves, G.; Marques, P.; Granadeiro, C.; Nogueira, H.S.; Singh, M.K.; Grácio, J. Surface Modification of Graphene Nanosheets with Gold Nanoparticles: The Role of Oxygen Moieties at Graphene Surface on Gold Nucleation and Growth. Chem. Mater. 2009, 21, 4796–4802. [Google Scholar] [CrossRef]
  63. Lo, T.W.; Aldous, L.; Compton, R.G. The use of nano-carbon as an alternative to multi-walled carbon nanotubes in modified electrodes for adsorptive stripping voltammetry. Sens. Actuators B Chem. 2012, 162, 361–368. [Google Scholar] [CrossRef]
  64. Yang, J.; Strickler, J.R.; Gunasekaran, S. Indium tin oxide-coated glass modified with reduced graphene oxide sheets and gold nanoparticles as disposable working electrodes for dopamine sensing in meat samples. Nanoscale 2012, 4, 4594–4602. [Google Scholar] [CrossRef]
  65. Jian, J.-M.; Fu, L.; Ji, J.; Lin, L.; Guo, X.; Ren, T.-L. Electrochemically reduced graphene oxide/gold nanoparticles composite modified screen-printed carbon electrode for effective electrocatalytic analysis of nitrite in foods. Sens. Actuators B Chem. 2018, 262, 125–136. [Google Scholar] [CrossRef]
  66. Randviir, E.P.; Brownson, D.A.; Metters, J.P.; Kadara, R.O.; Banks, C.E. The fabrication, characterisation and electrochemical investigation of screen-printed graphene electrodes. Phys. Chem. Chem. Phys. 2014, 16, 4598–4611. [Google Scholar] [CrossRef] [Green Version]
  67. Zhang, W.; Bas, A.D.; Ghali, E.; Yeonuk, C.H.O.I. Passive behavior of gold in sulfuric acid medium. Trans. Nonferrous Met. Soc. China 2015, 25, 2037–2046. [Google Scholar] [CrossRef]
  68. Panchompoo, J.; Aldous, L.; Downing, C.; Crossley, A.; Compton, R.G. Facile synthesis of Pd nanoparticle modified carbon black for electroanalysis: Application to the detection of hydrazine. Electroanalysis 2011, 23, 1568–1578. [Google Scholar] [CrossRef]
  69. Kamal Eddin, F.B.; Wing Fen, Y. Recent Advances in Electrochemical and Optical Sensing of Dopamine. Sensors 2020, 20, 1039. [Google Scholar] [CrossRef] [Green Version]
  70. Garry, L.M. The Electrochemical Characterisation of Carbon-based Nanomaterials and their Application in the Detection of Heavy Metal Ions. Ph.D. Thesis, National University of Ireland Maynooth, Maynooth, Ireland, 2013. [Google Scholar]
  71. He, Y.Q.; Liu, S.P.; Kong, L.; Liu, Z.F. A study on the sizes and concentrations of gold nanoparticles by spectra of absorption, resonance Rayleigh scattering and resonance non-linear scattering. Spectrochim. Acta Part A Mol. Biomol. Spectrosc. 2005, 61, 2861–2866. [Google Scholar] [CrossRef]
  72. Presa, M.J.R.; Gassa, L.M.; Azzaroni, O.; Gervasi, C.A. Estimating Diffusion Coefficients of Probe Molecules into Polyelectrolyte Brushes by Electrochemical Impedance Spectroscopy. Anal. Chem. 2009, 81, 7936–7943. [Google Scholar] [CrossRef]
  73. García-Miranda Ferrari, A.; Foster, C.W.; Kelly, P.J.; Brownson, D.A.C.; Banks, C.E. Determination of the Electrochemical Area of Screen-Printed Electrochemical Sensing Platforms. Biosensors 2018, 8, 53. [Google Scholar] [CrossRef] [Green Version]
  74. Dawson, K.; Strutwolf, J.; Herzog, G.; Arrigan, D.; Quinn, A.; O’Riordan, A.J. Nanofabrication of robust nanoelectrodes for electrochemical Applications. ECS Trans. 2010, 28, 29. [Google Scholar] [CrossRef] [Green Version]
  75. Hassan, N.; Holze, R. A comparative electrochemical study of electrosorbed 2- and 4-mercaptopyridines and their application as corrosion inhibitors at C60 steel. J. Chem. Sci. 2009, 121, 693–701. [Google Scholar] [CrossRef]
  76. Smajdor, J.; Piech, R.; Ławrywianiec, M.; Paczosa-Bator, B. Glassy carbon electrode modified with carbon black for sensitive estradiol determination by means of voltammetry and flow injection analysis with amperometric detection. Anal. Biochem. 2018, 544, 7–12. [Google Scholar] [CrossRef] [PubMed]
  77. Özcan, A.; Topçuoğulları, D. Voltammetric determination of 17-β-estradiol by cysteamine self-assembled gold nanoparticle modified fumed silica decorated graphene nanoribbon nanocomposite. Sens. Actuators B Chem. 2017, 250, 85–90. [Google Scholar] [CrossRef]
  78. Bös, M. Kalman filtering for the evaluation of the current-time function in d.c. polarography. Talanta 1986, 33, 583–586. [Google Scholar] [CrossRef] [PubMed] [Green Version]
  79. Zhang, J.; Guo, S.-X.; Bond, A.M.; Marken, F. Large-Amplitude Fourier Transformed High-Harmonic Alternating Current Cyclic Voltammetry: Kinetic Discrimination of Interfering Faradaic Processes at Glassy Carbon and at Boron-Doped Diamond Electrodes. Anal. Chem. 2004, 76, 3619–3629. [Google Scholar] [CrossRef] [PubMed]
  80. Trasatti, S.; Petrii, O.A. Real surface area measurements in electrochemistry. Pure Appl. Chem. 1991, 63, 711–734. [Google Scholar] [CrossRef]
  81. Azzaroni, O.; Gervasi, C. Characterization of responsive polymer brushes at solid/liquid interfaces by electrochemical impedance spectroscopy. Funct. Polym. Film. 2011, 2, 809–830. [Google Scholar] [CrossRef]
  82. Konopka, S.J.; McDuffie, B. Diffusion coefficients of ferri- and ferrocyanide ions in aqueous media, using twin-electrode thin-layer electrochemistry. Anal. Chem. 1970, 42, 1741–1746. [Google Scholar] [CrossRef]
  83. De Carvalho, R.M.; Mello, C.; Kubota, L.T. Simultaneous determination of phenol isomers in binary mixtures by differential pulse voltammetry using carbon fibre electrode and neural network with pruning as a multivariate calibration tool. Anal. Chim. Acta 2000, 420, 109–121. [Google Scholar] [CrossRef]
  84. Górski, Ł.; Ciepiela, F.; Jakubowska, M. Automatic baseline correction in voltammetry. Electrochim. Acta 2014, 136, 195–203. [Google Scholar] [CrossRef]
  85. Li, J.; Liu, S.; Yu, J.; Lian, W.; Cui, M.; Xu, W.; Huang, J. Electrochemical immunosensor based on graphene–polyaniline composites and carboxylated graphene oxide for estradiol detection. Sens. Actuators B Chem. 2013, 188, 99–105. [Google Scholar] [CrossRef]
  86. Arvand, M.; Hemmati, S. Analytical methodology for the electro-catalytic determination of estradiol and progesterone based on graphene quantum dots and poly(sulfosalicylic acid) co-modified electrode. Talanta 2017, 174, 243–255. [Google Scholar] [CrossRef]
Figure 1. Scheme for the rGO-AuNP/CNT modified screen-printed electrode’s fabrication process.
Biosensors 13 00491 g001
Figure 2. (A) UV−vis absorbance spectra of GO, AuNPs, bay laurel extract, rGO-AuNPs, GO-CNT, rGO-CNT, and rGO-AuNPs/CNT. (B) FTIR spectra of rGO-AuNPs/CNT/SPE, rGO, rGO-CNT, GO and bare SPE). (C) AFM images of bare SPE and (D) rGO-AuNPs/CNT/SPE as model electrodes.
Biosensors 13 00491 g002
Figure 3. (A) SEM image of bare SPE. (B) EDS image of bare SPE showing elemental C, O, and Cl. (C) SEM image of rGO-AuNP/CNT/SPE at 25,000× magnification, with no observable rGO. (D) EDS image of rGO-AuNPs/CNT/SPE showing elemental C, O, Cl, and Au.
Biosensors 13 00491 g003
Figure 4. (A) CV of (a) bare SPE, rGO-CNT/SPE, GO-CNT/SPE, rGO-AuNPs/CNT/SPE, and rGO-AuNP immersed in 0.1 M KCl containing 5 mM [Fe(CN)6]−3/−4. (B) Cyclic voltammograms of bare SPE (blue) and rGO-AuNPs-CNT/SPE (green) in a 0.5 M H2SO4 solution. Scan rate: 50 mVs−1. At 100 mVs−1 scan rate: (C) CVs of rGO-AuNPs/CNT/SPE at different scan rates (25–250 mVs−1) in 0.1 M KCl containing 5 mM [Fe(CN)6]−3/−4. (D) Plots of anodic current peak vs. square root of scan rate and cathodic current peak vs. square root of scan rate.
Biosensors 13 00491 g004
Figure 5. (A) Cyclic voltammograms (CVs) of the bare SPE, GO-CNT/SPE, rGO-AuNPs/CNT/SPE, rGO-AuNPs/SPE, and rGO-CNT/SPE in 20 µM E2 at 100 mVs−1. (B) Differential pulse voltammograms (DPVs) of the bare SPE, GO-CNT/SPE, rGO-AuNPs/CNT/SPE, rGO-AuNPs/SPE, and rGO-CNT/SPE in 20 µM E2 in Britton–Robinson buffer (pH 5). (C) Cyclic voltammograms (CVs) of rGO-AuNPs/CNT/SPE in 20 µM E2 at a 25–170 mVs−1 scan rate. (D) Plot of current peak vs. square root of scan rate.
Biosensors 13 00491 g005
Figure 6. (A) CVs of the effects of pH on the oxidation. (B) Plot of estradiol peak current vs. pH. (C) A plot of peak potential versus pH.
Biosensors 13 00491 g006
Figure 7. Bar chart of DPV oxidation peak current of E2 vs. the amount of rGO-AuNPs/CNT modifier.
Biosensors 13 00491 g007
Figure 8. (A) DPVs of RGO-AuNPs/CNT/SPEs with different concentrations of E2 (0.05–1 µM) in B-R buffer (pH 5). Automatic baseline correction was carried out based on the report of Górski et al. [84]. (B) The oxidation peak current plot against the estradiol concentration, with y = 0.583x and + 0.0343 R2 = 0.9982. Error bar: standard deviation for n = 3.
Biosensors 13 00491 g008aBiosensors 13 00491 g008b
Figure 9. Effects of interferents that coexist in water on detecting estradiol. The initial concentration of target and interference (analyte:interferent) was 1:10 (µM/µM).
Biosensors 13 00491 g009
Table 1. Literature report on electrochemical sensors for estradiol detection.
Electrode-Design-ModifierApplied TechniqueSensor TypeLinear
Range
Detection LimitReference
Glassy carbon electrode (GCE)2 GR–PANI1 DPVImmunosensor0.04–7.00 ng/mL0.02 ng/mL[85]
Glassy carbon electrode (GCE)3 RGO/CuTthP1 DPVElectrochemical sensor0.1–1.0 μM 5.3 nM[27]
Carbon paste electrode4 GNR-FS-Au-CA1 DPVElectrochemical sensor0.1–5.0 μM7.4 nM[77]
Glassy carbon electrode (GCE)5 GQDs-PSSA/GO 1 DPVElectrochemical sensor0.001–6.0 μM 0.23 nM[86]
Screen-printed carbon electrode6 rGO/AuNP/CNT) 1 DPV Electrochemical sensor0.05–1.0 μM3 nMThis work
1 Differential pulse voltammetry (DPV). 2 Graphene–polyaniline (GR–PANI). 3 Reduced graphene oxide and a metal complex porphyrin (RGO/CuTthP). 4 Cysteamine self-assembled gold-nanoparticle-modified silica-decorated graphene-nanoribbon (GNR-FS-Au-CA). 5 Graphene quantum dots and poly (sulfosalicylic acid) (GQDs-PSSA/GO). 6 Gold nanoparticles (AuNPs) integrated on reduced graphene oxide–carbon nanotubes (rGO-AuNP/CNT).
Table 2. Determination for E2 in water samples using a rGO/AuNP/CNT/SPE sensor.
Added (μM)Found (μM)RSDRecoveries (%)
0.50.462.792
0.50.452.590
0.90.963.2106
0.90.922.8102
Disclaimer/Publisher’s Note: The statements, opinions and data contained in all publications are solely those of the individual author(s) and contributor(s) and not of MDPI and/or the editor(s). MDPI and/or the editor(s) disclaim responsibility for any injury to people or property resulting from any ideas, methods, instructions or products referred to in the content.

