Obtaining of ZnO/Fe2O3 Thin Nanostructured Films by AACVD for Detection of ppb-Concentrations of NO2 as a Biomarker of Lung Infections

 , , , , and
Abstract
:1. Introduction
2. Materials and Methods
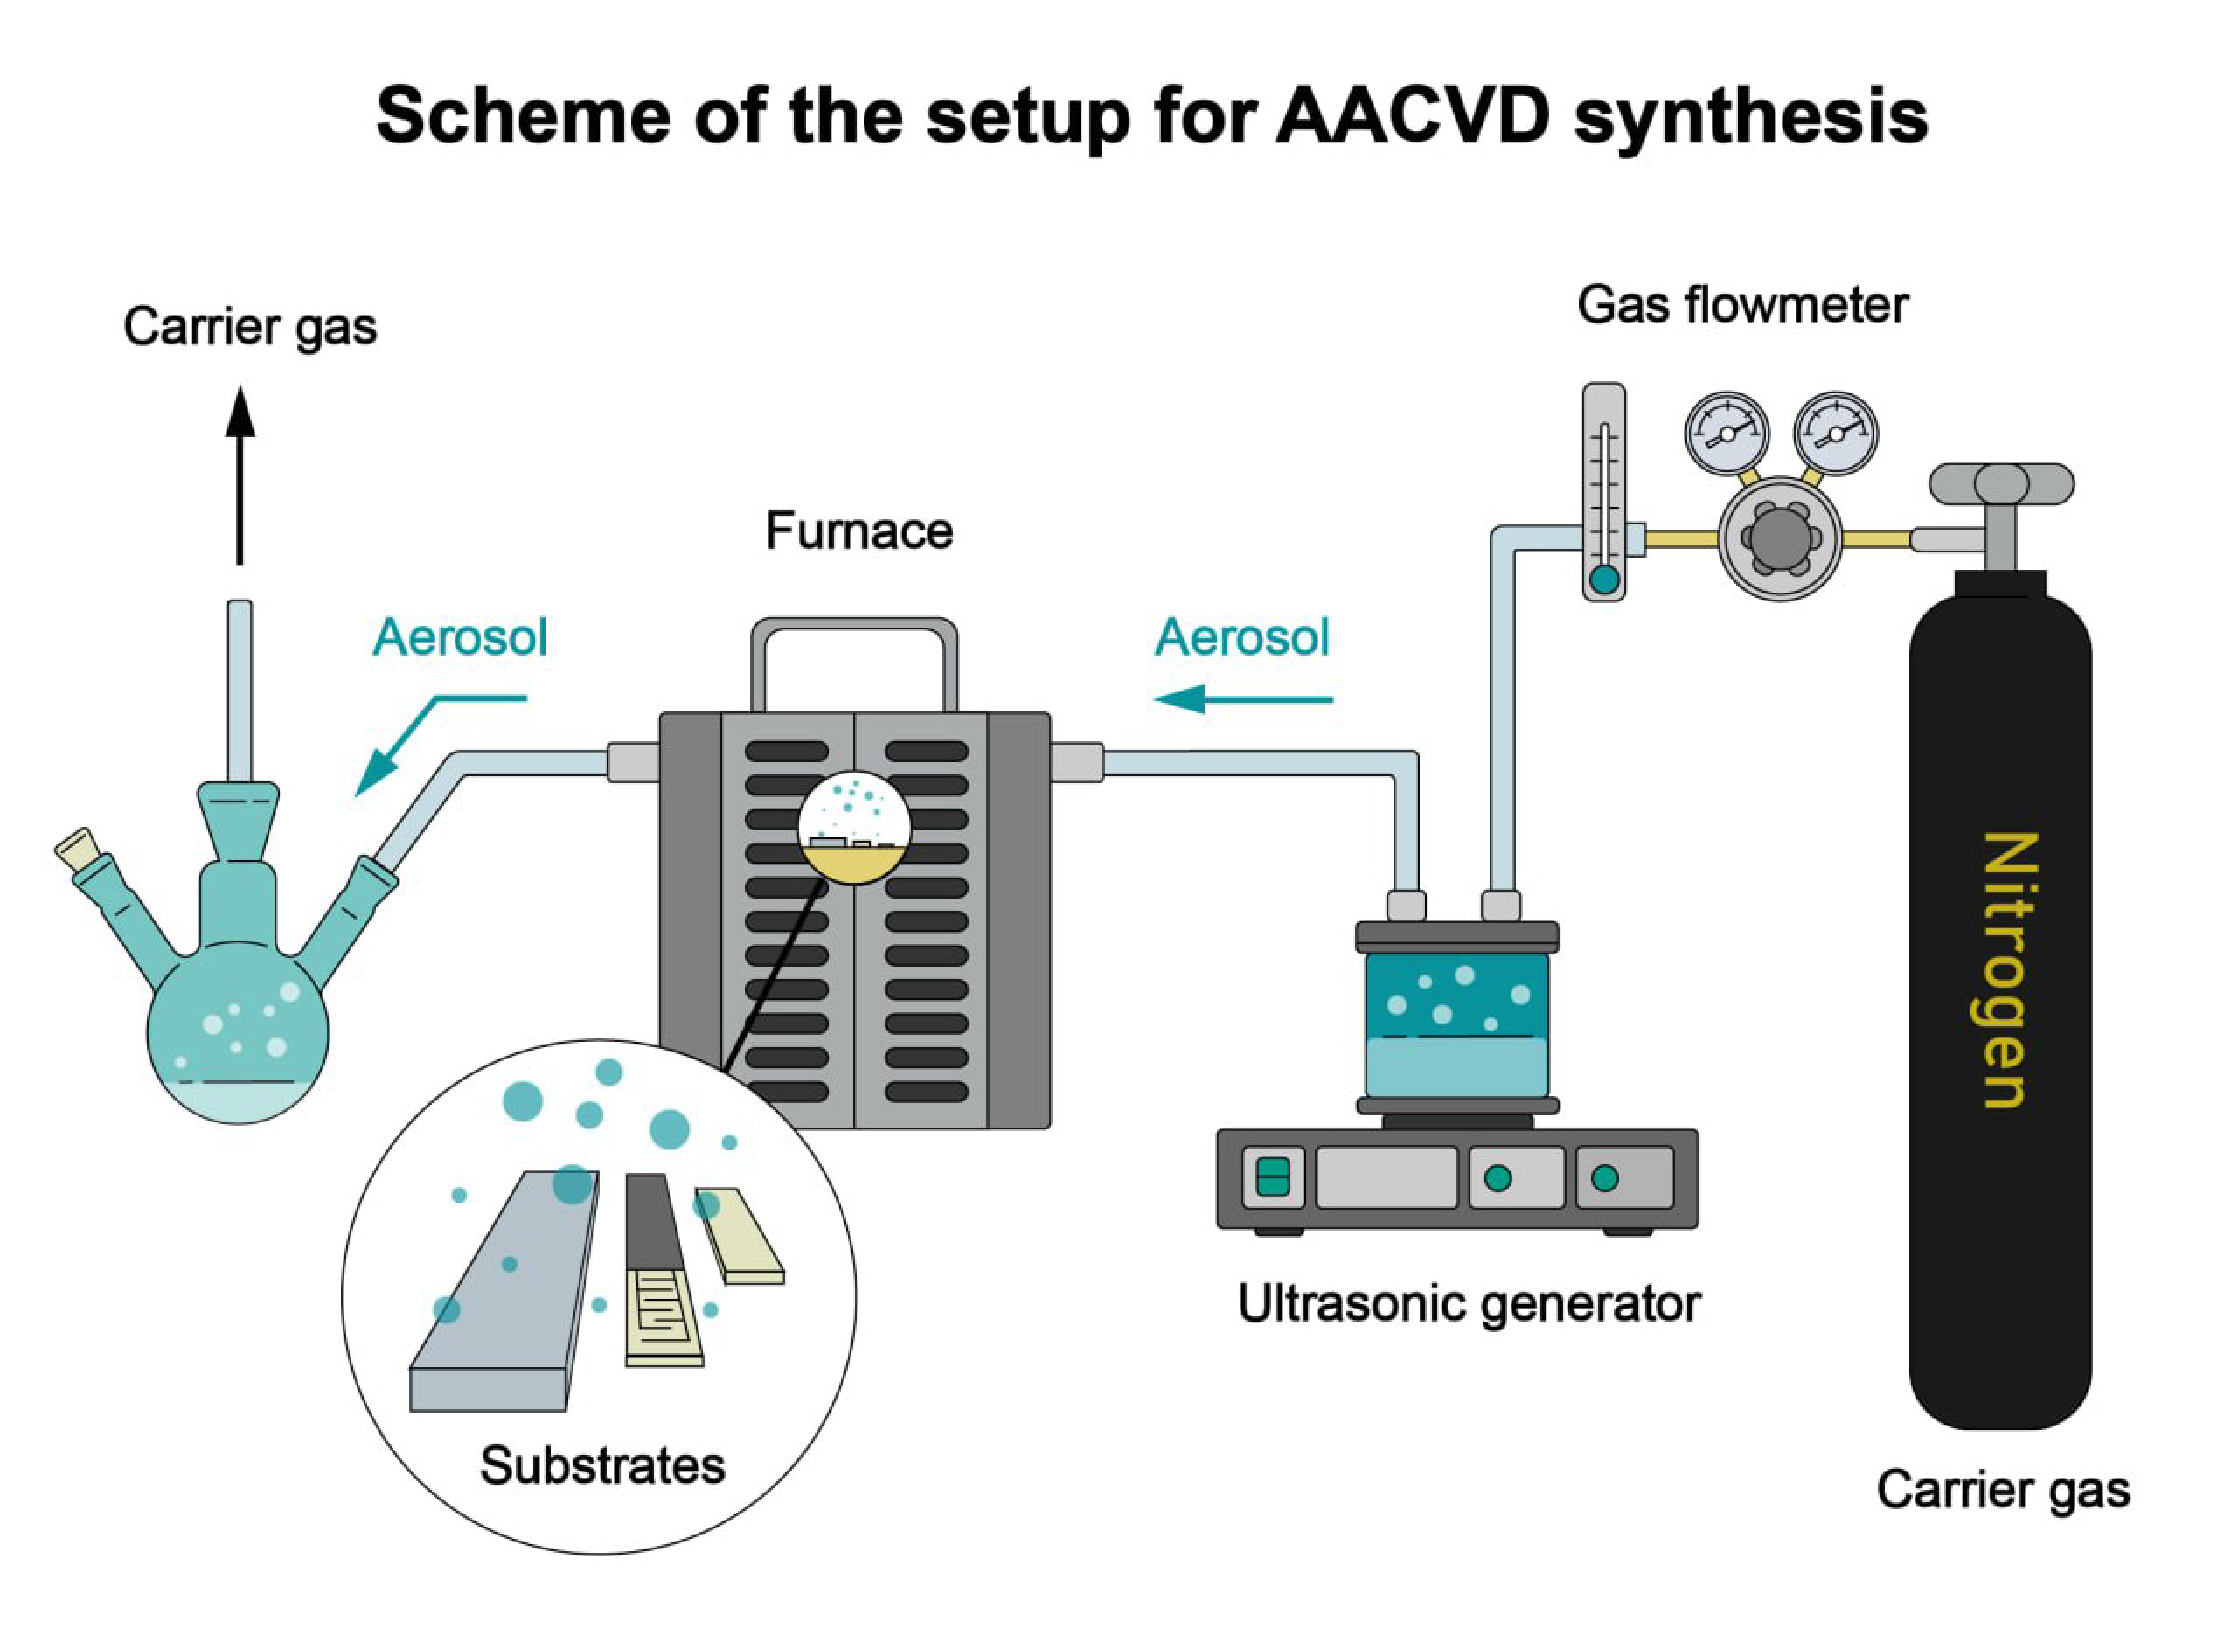
2.1. AACVD Synthesis of ZnO/Fe2O3 Films
2.2. Instrumentation
3. Results and Discussion
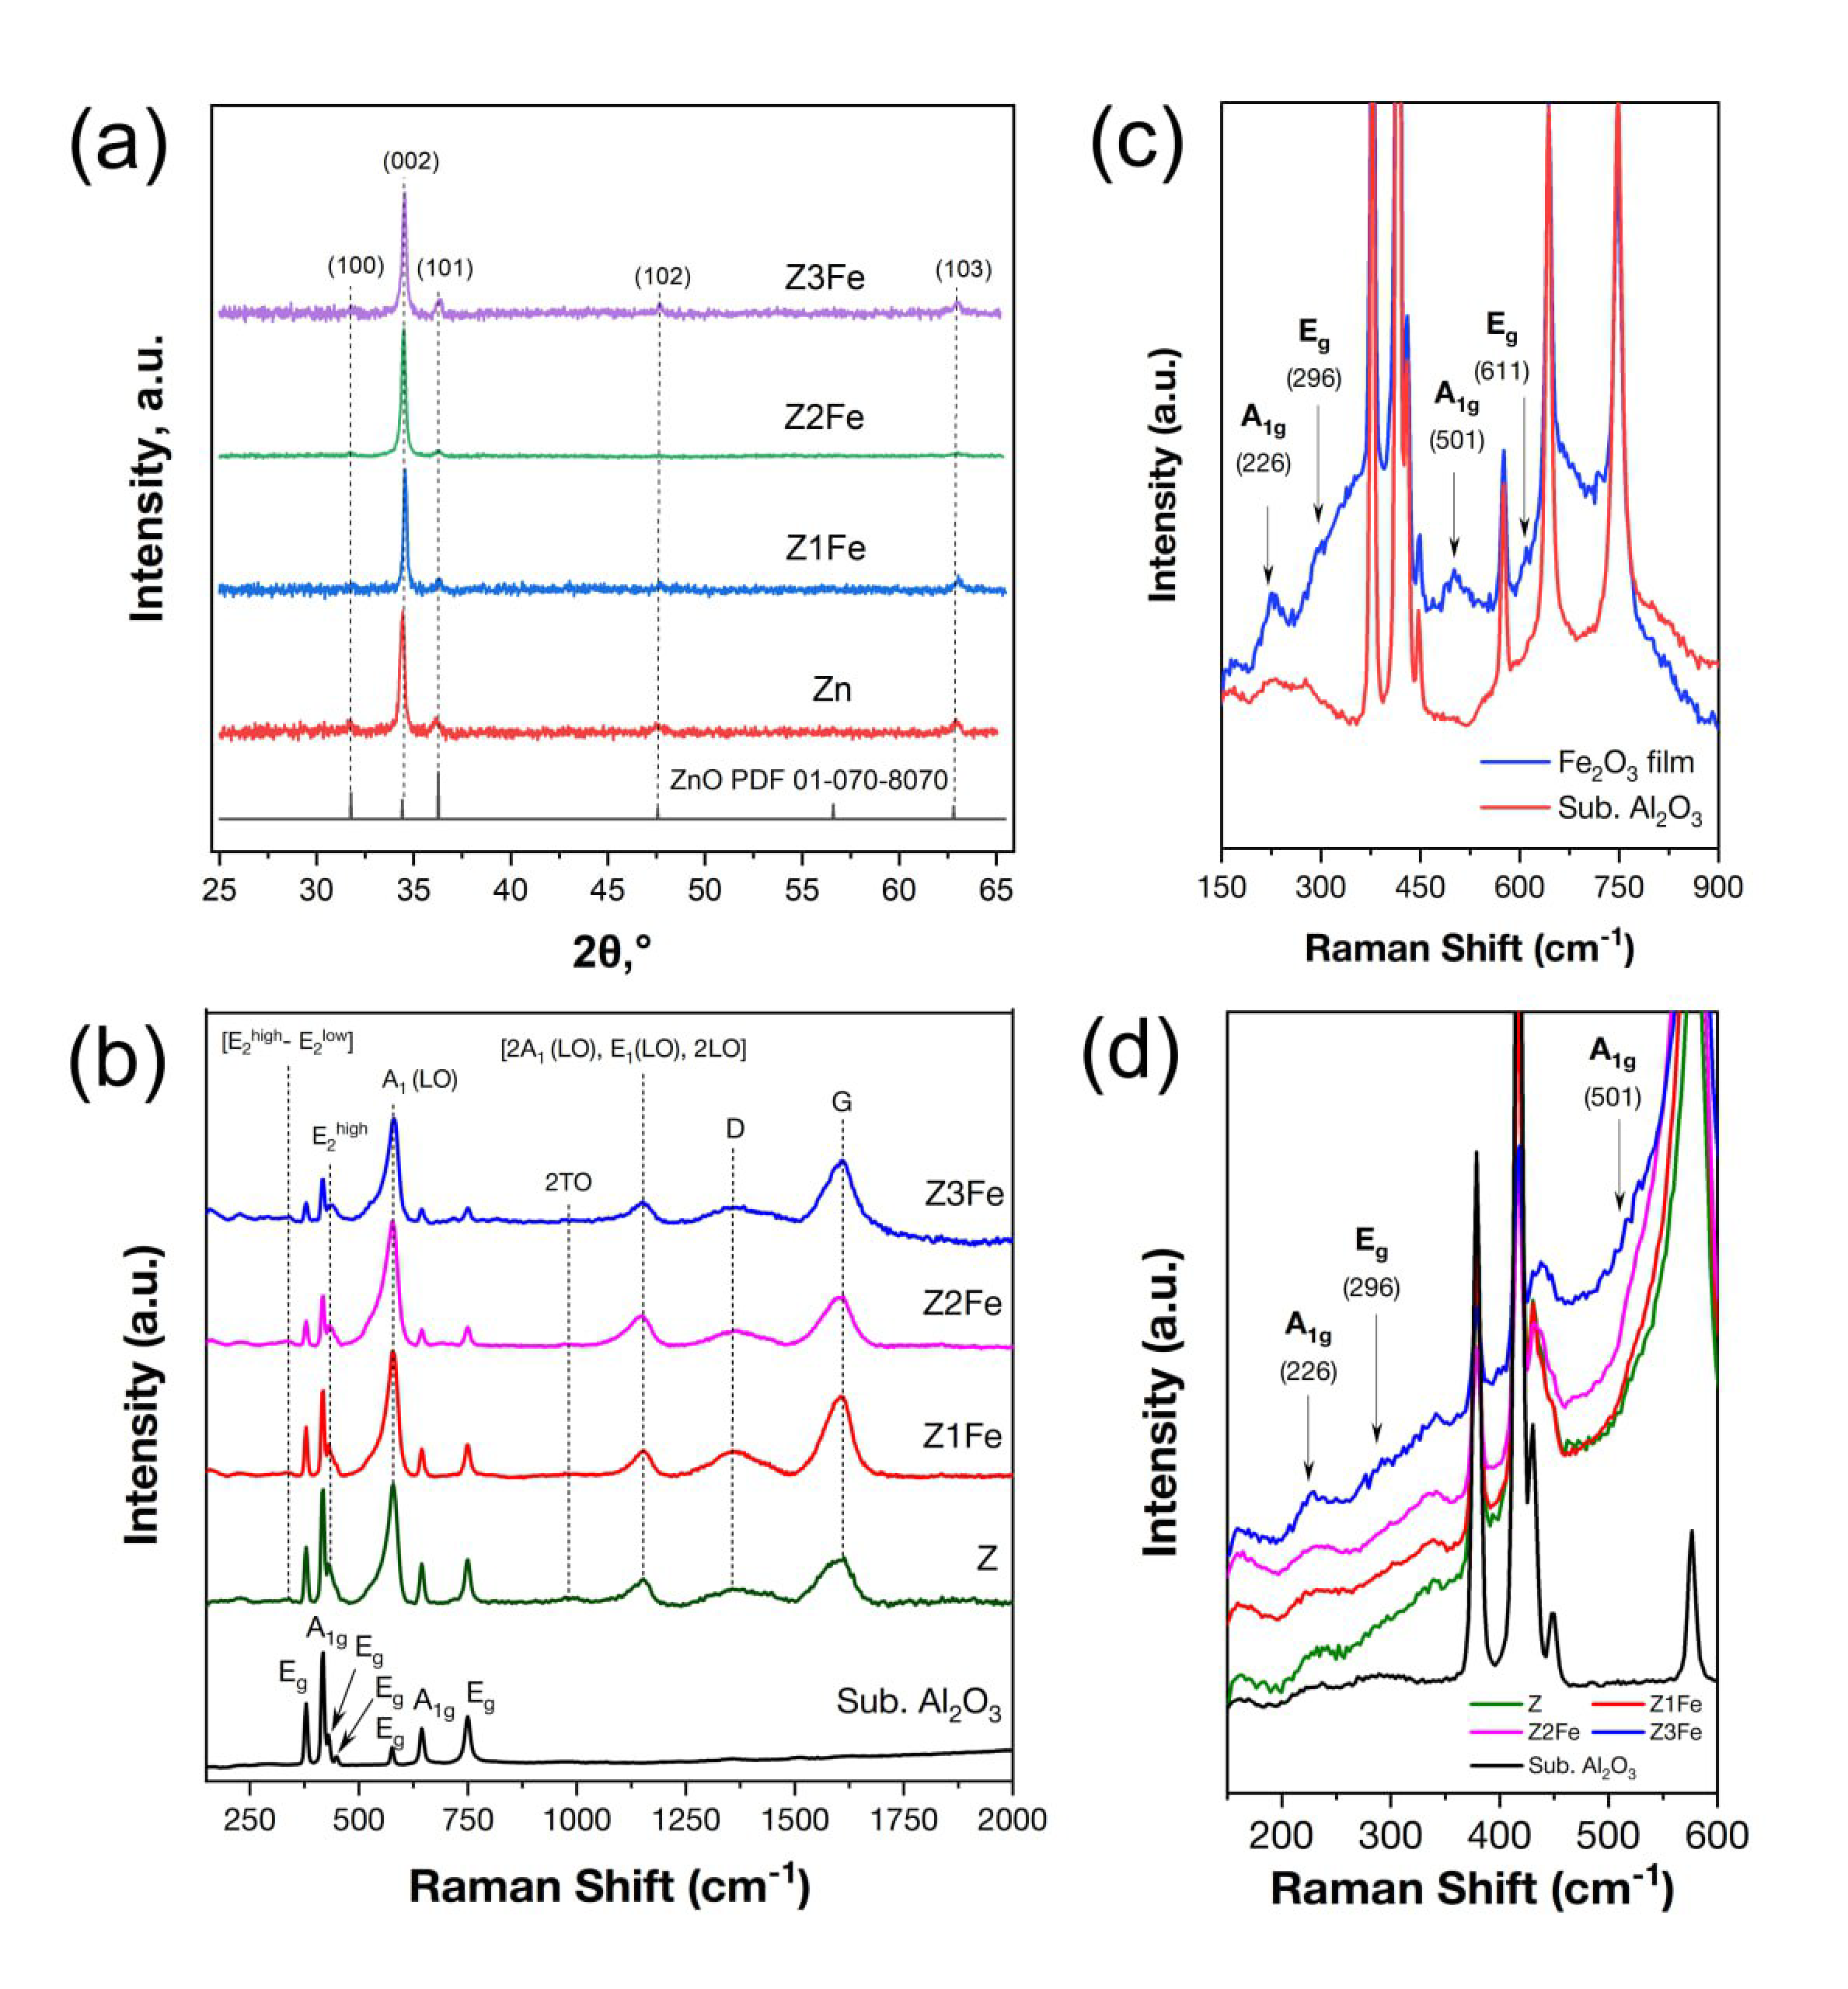
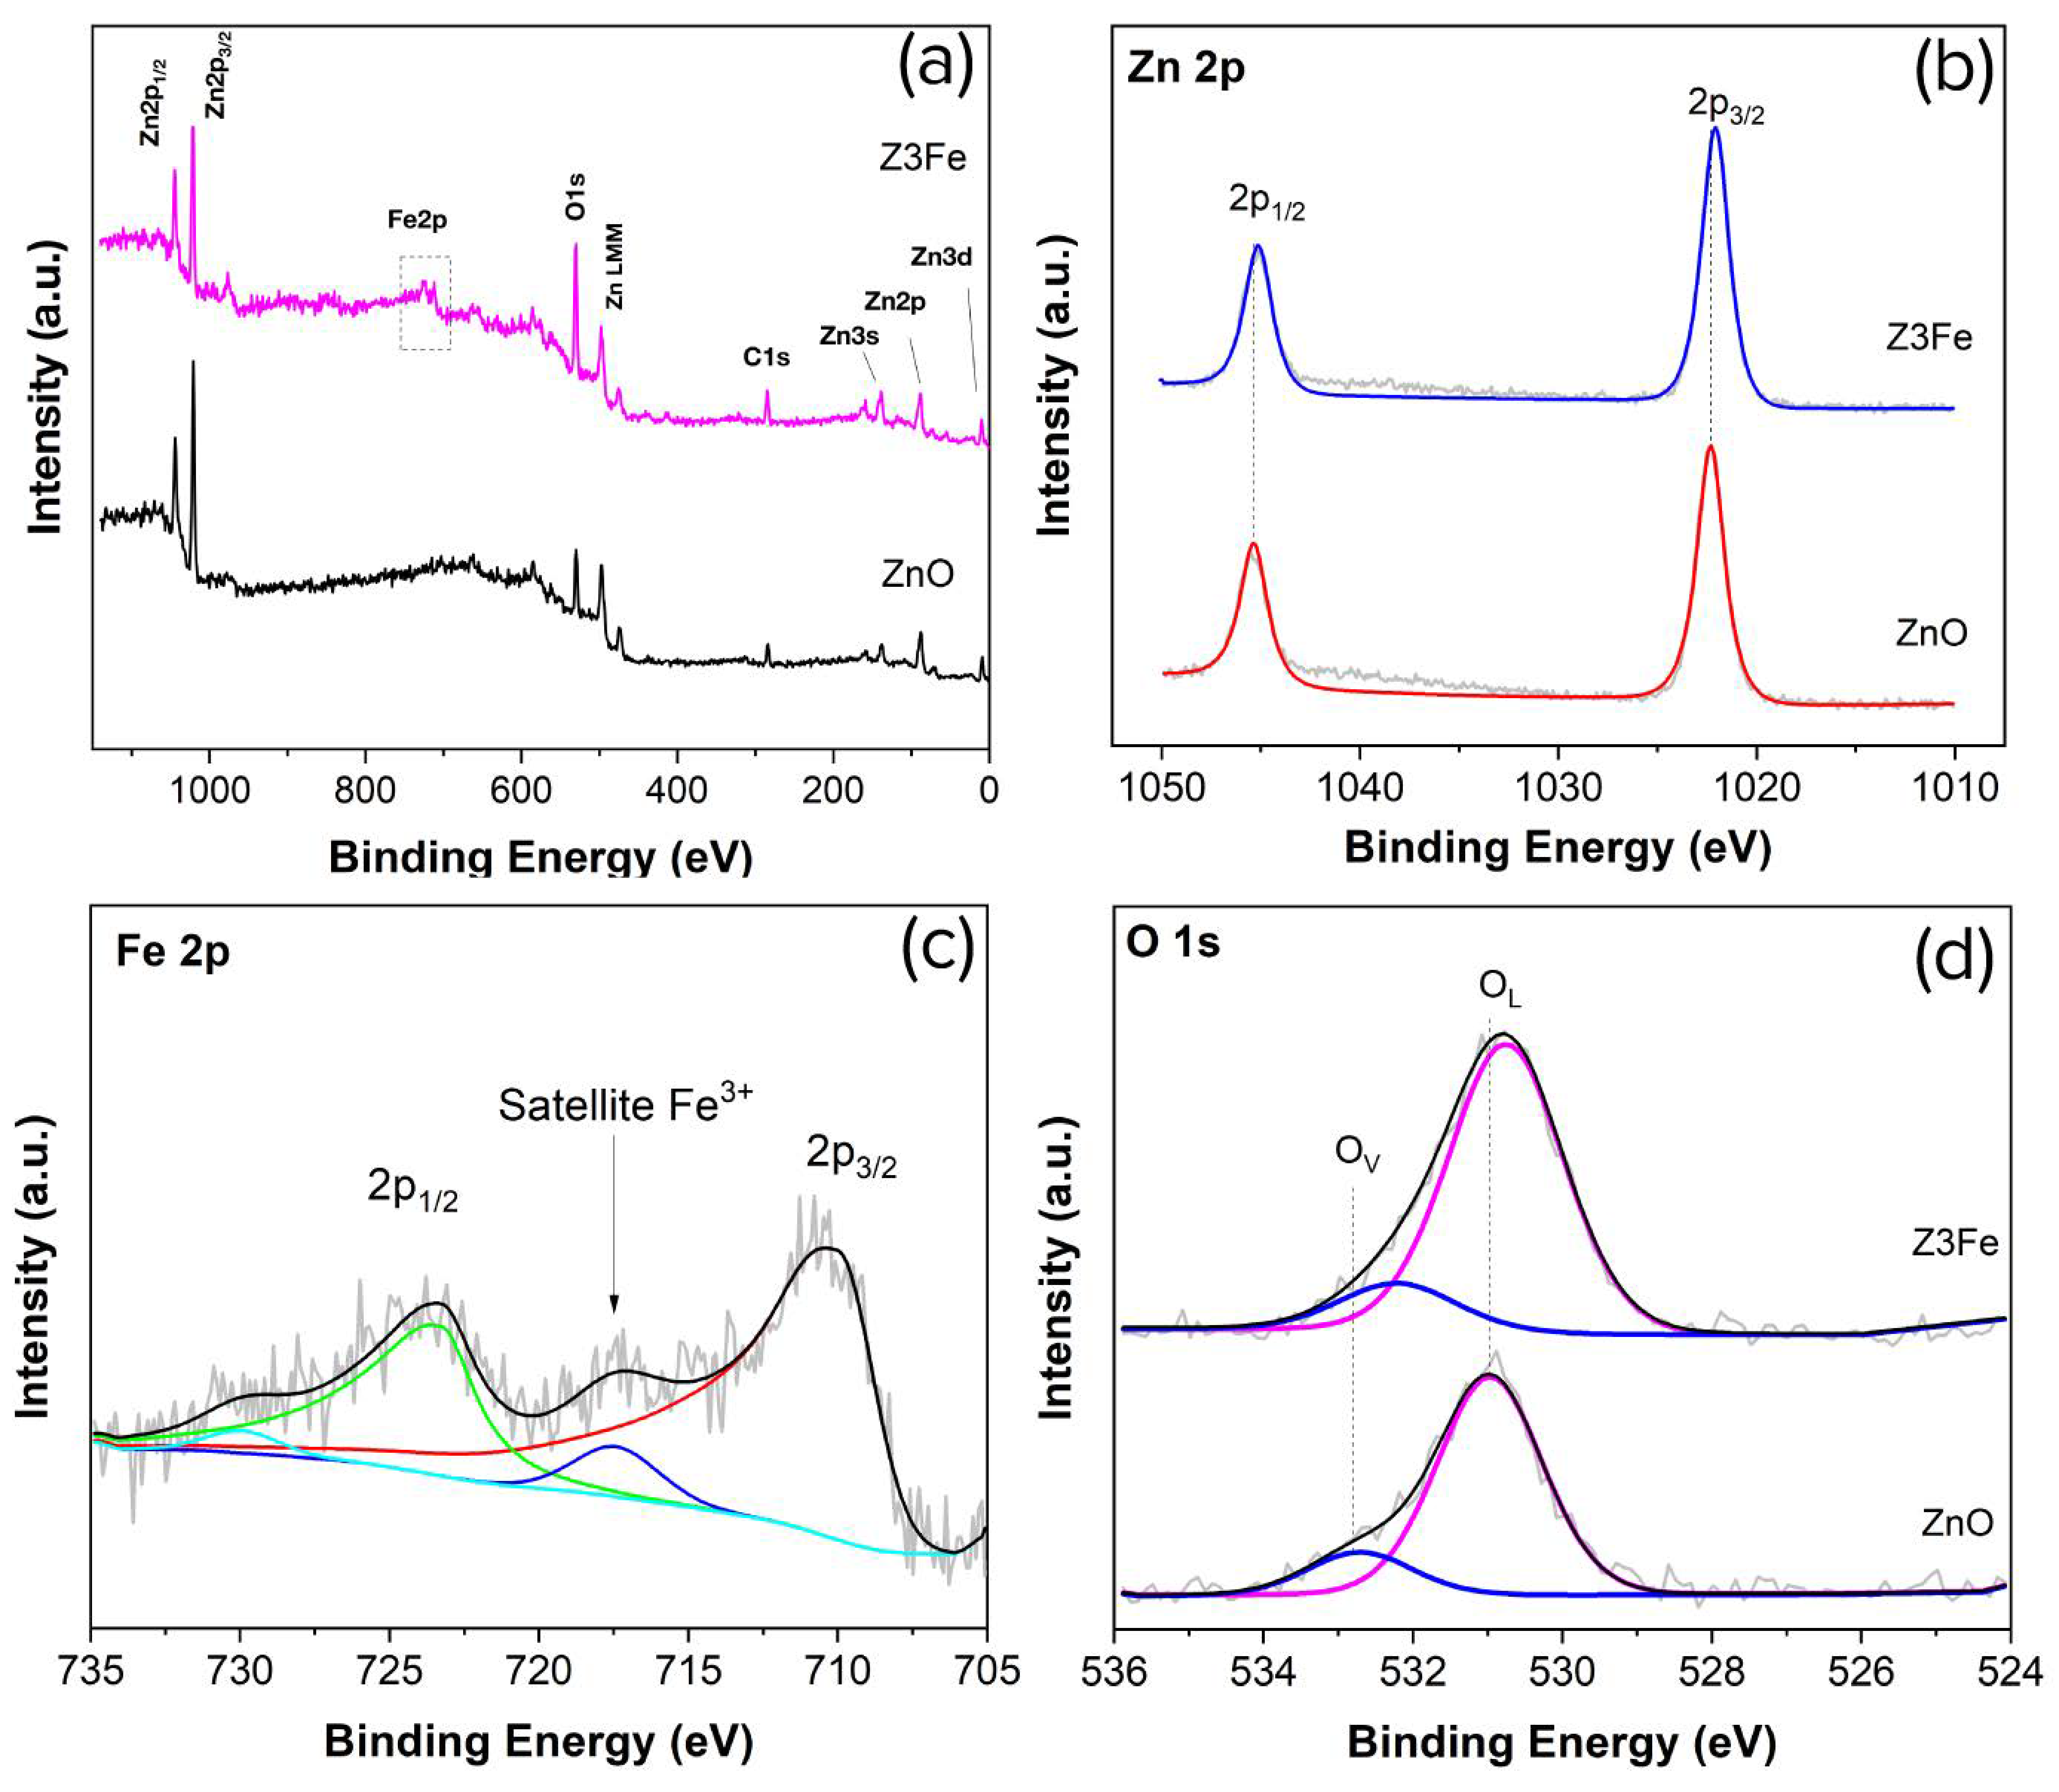
3.1. Chemical and Phase Composition
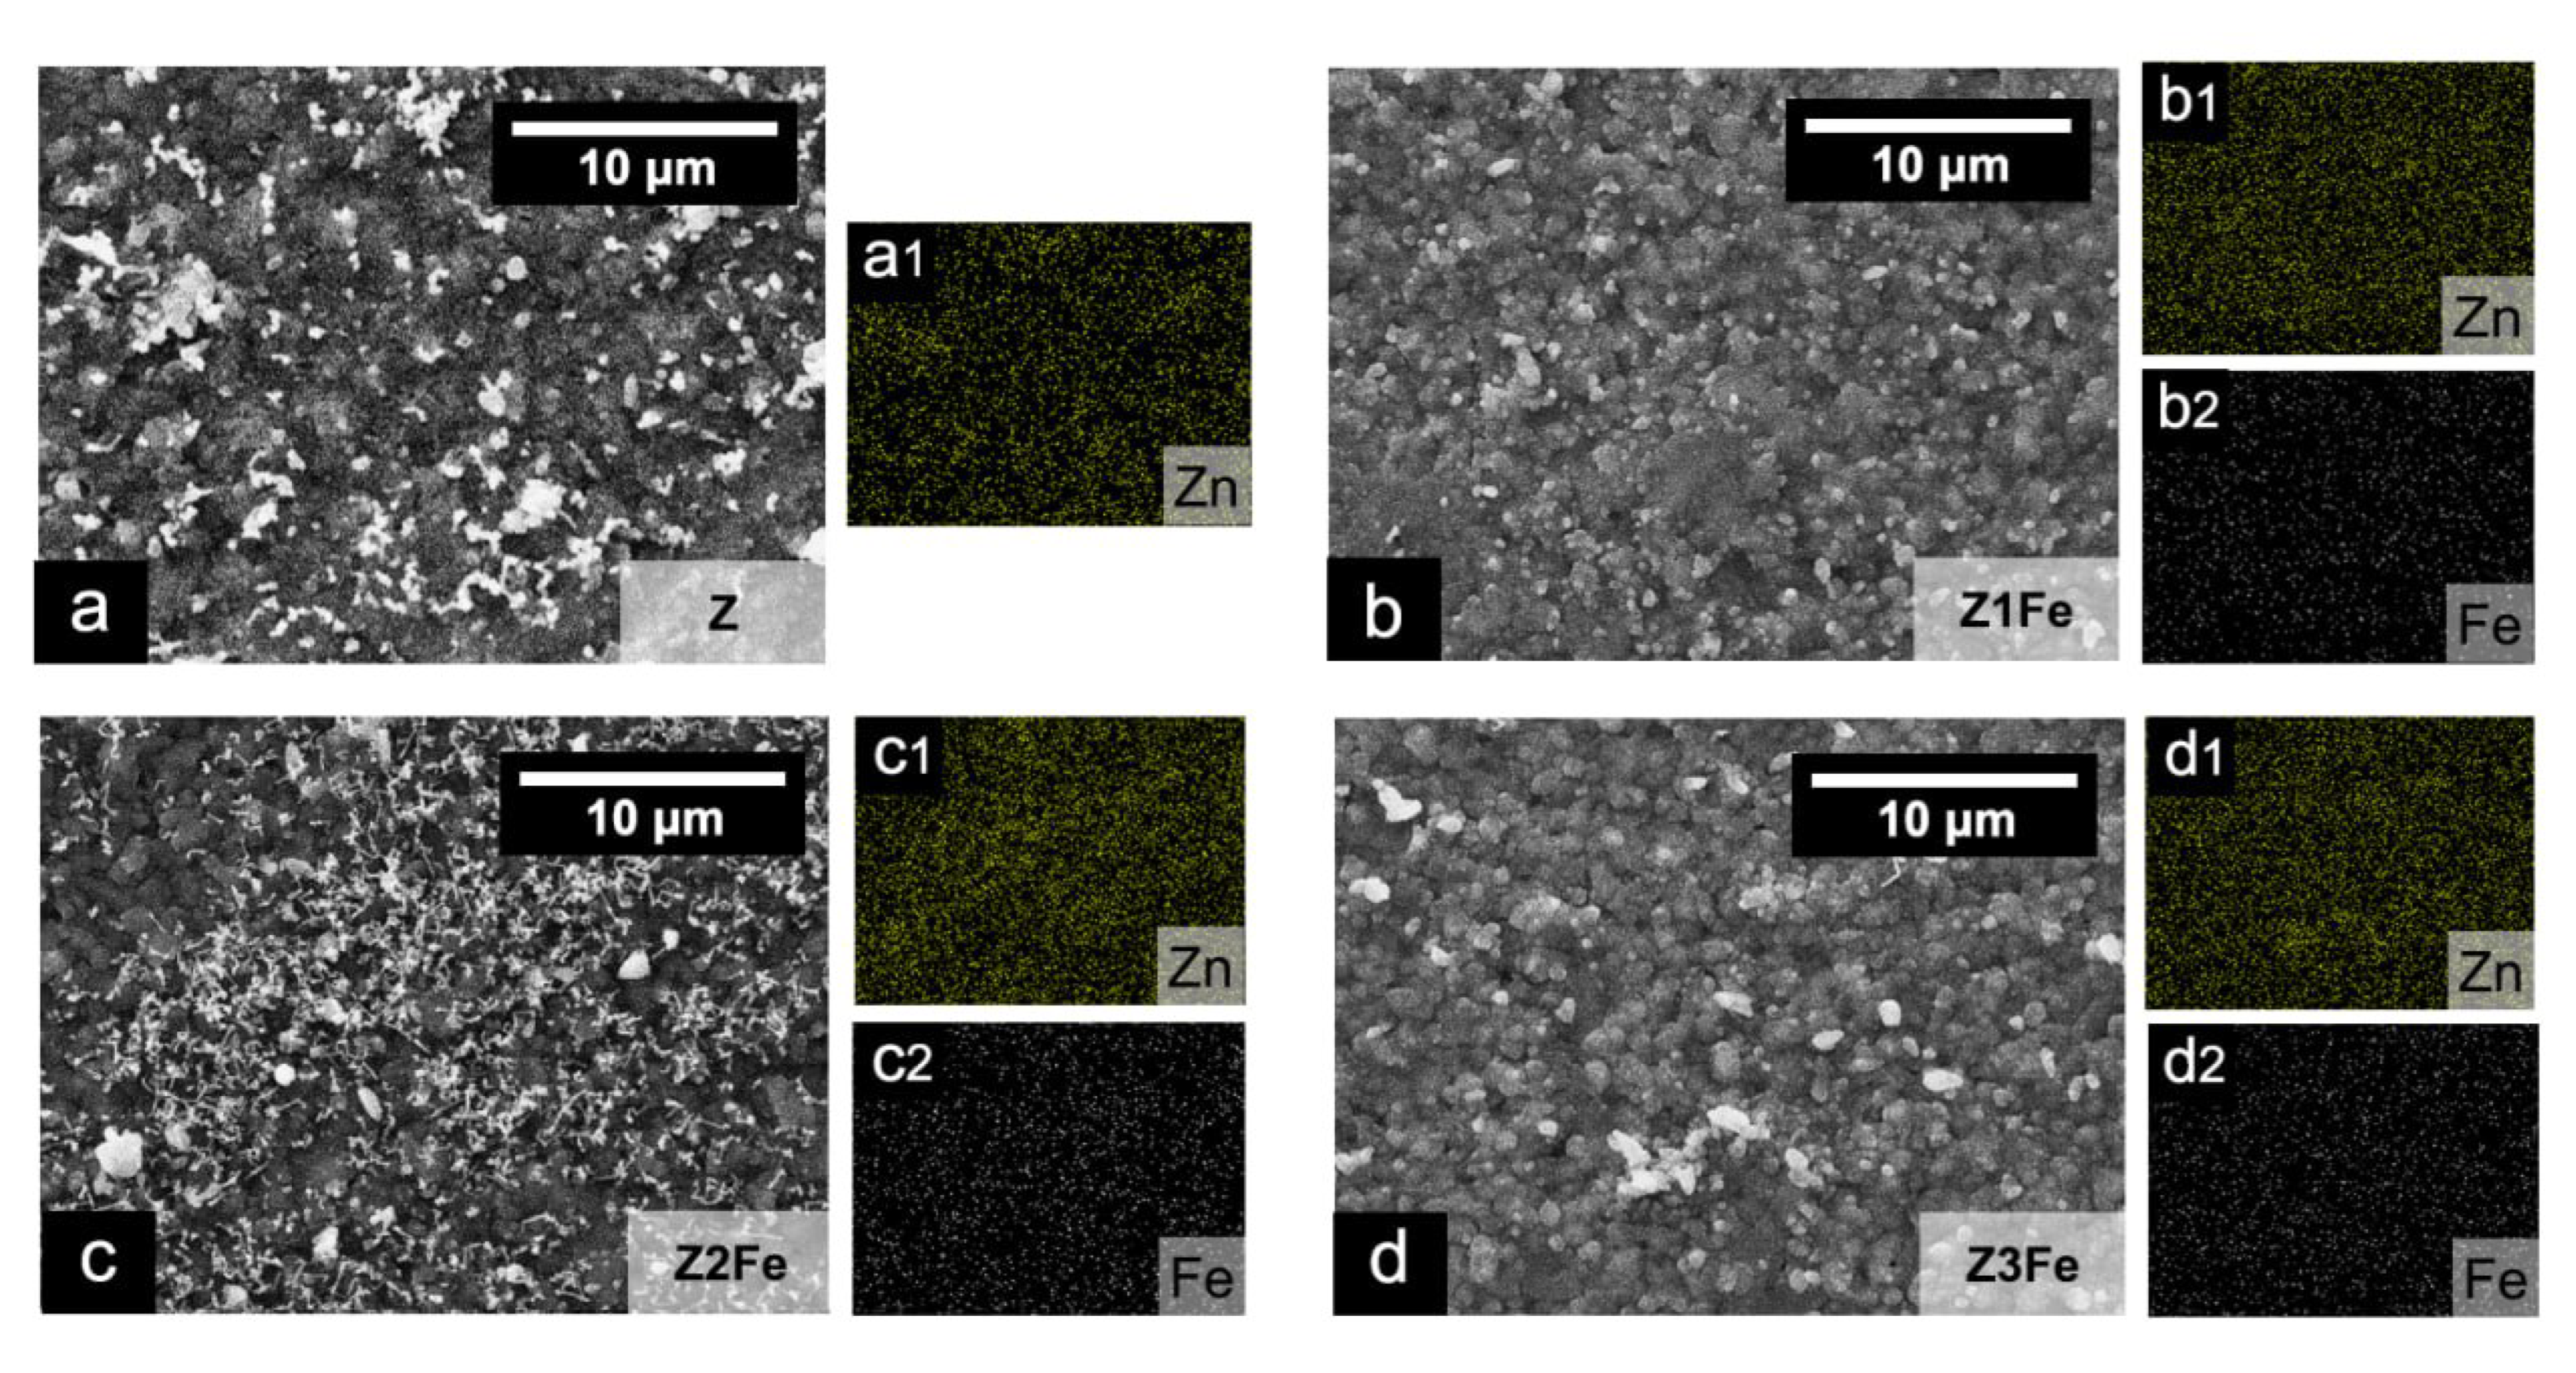
3.2. Microstructure and Morphology
3.3. UV Transmittance Spectra and Optical Band Gap
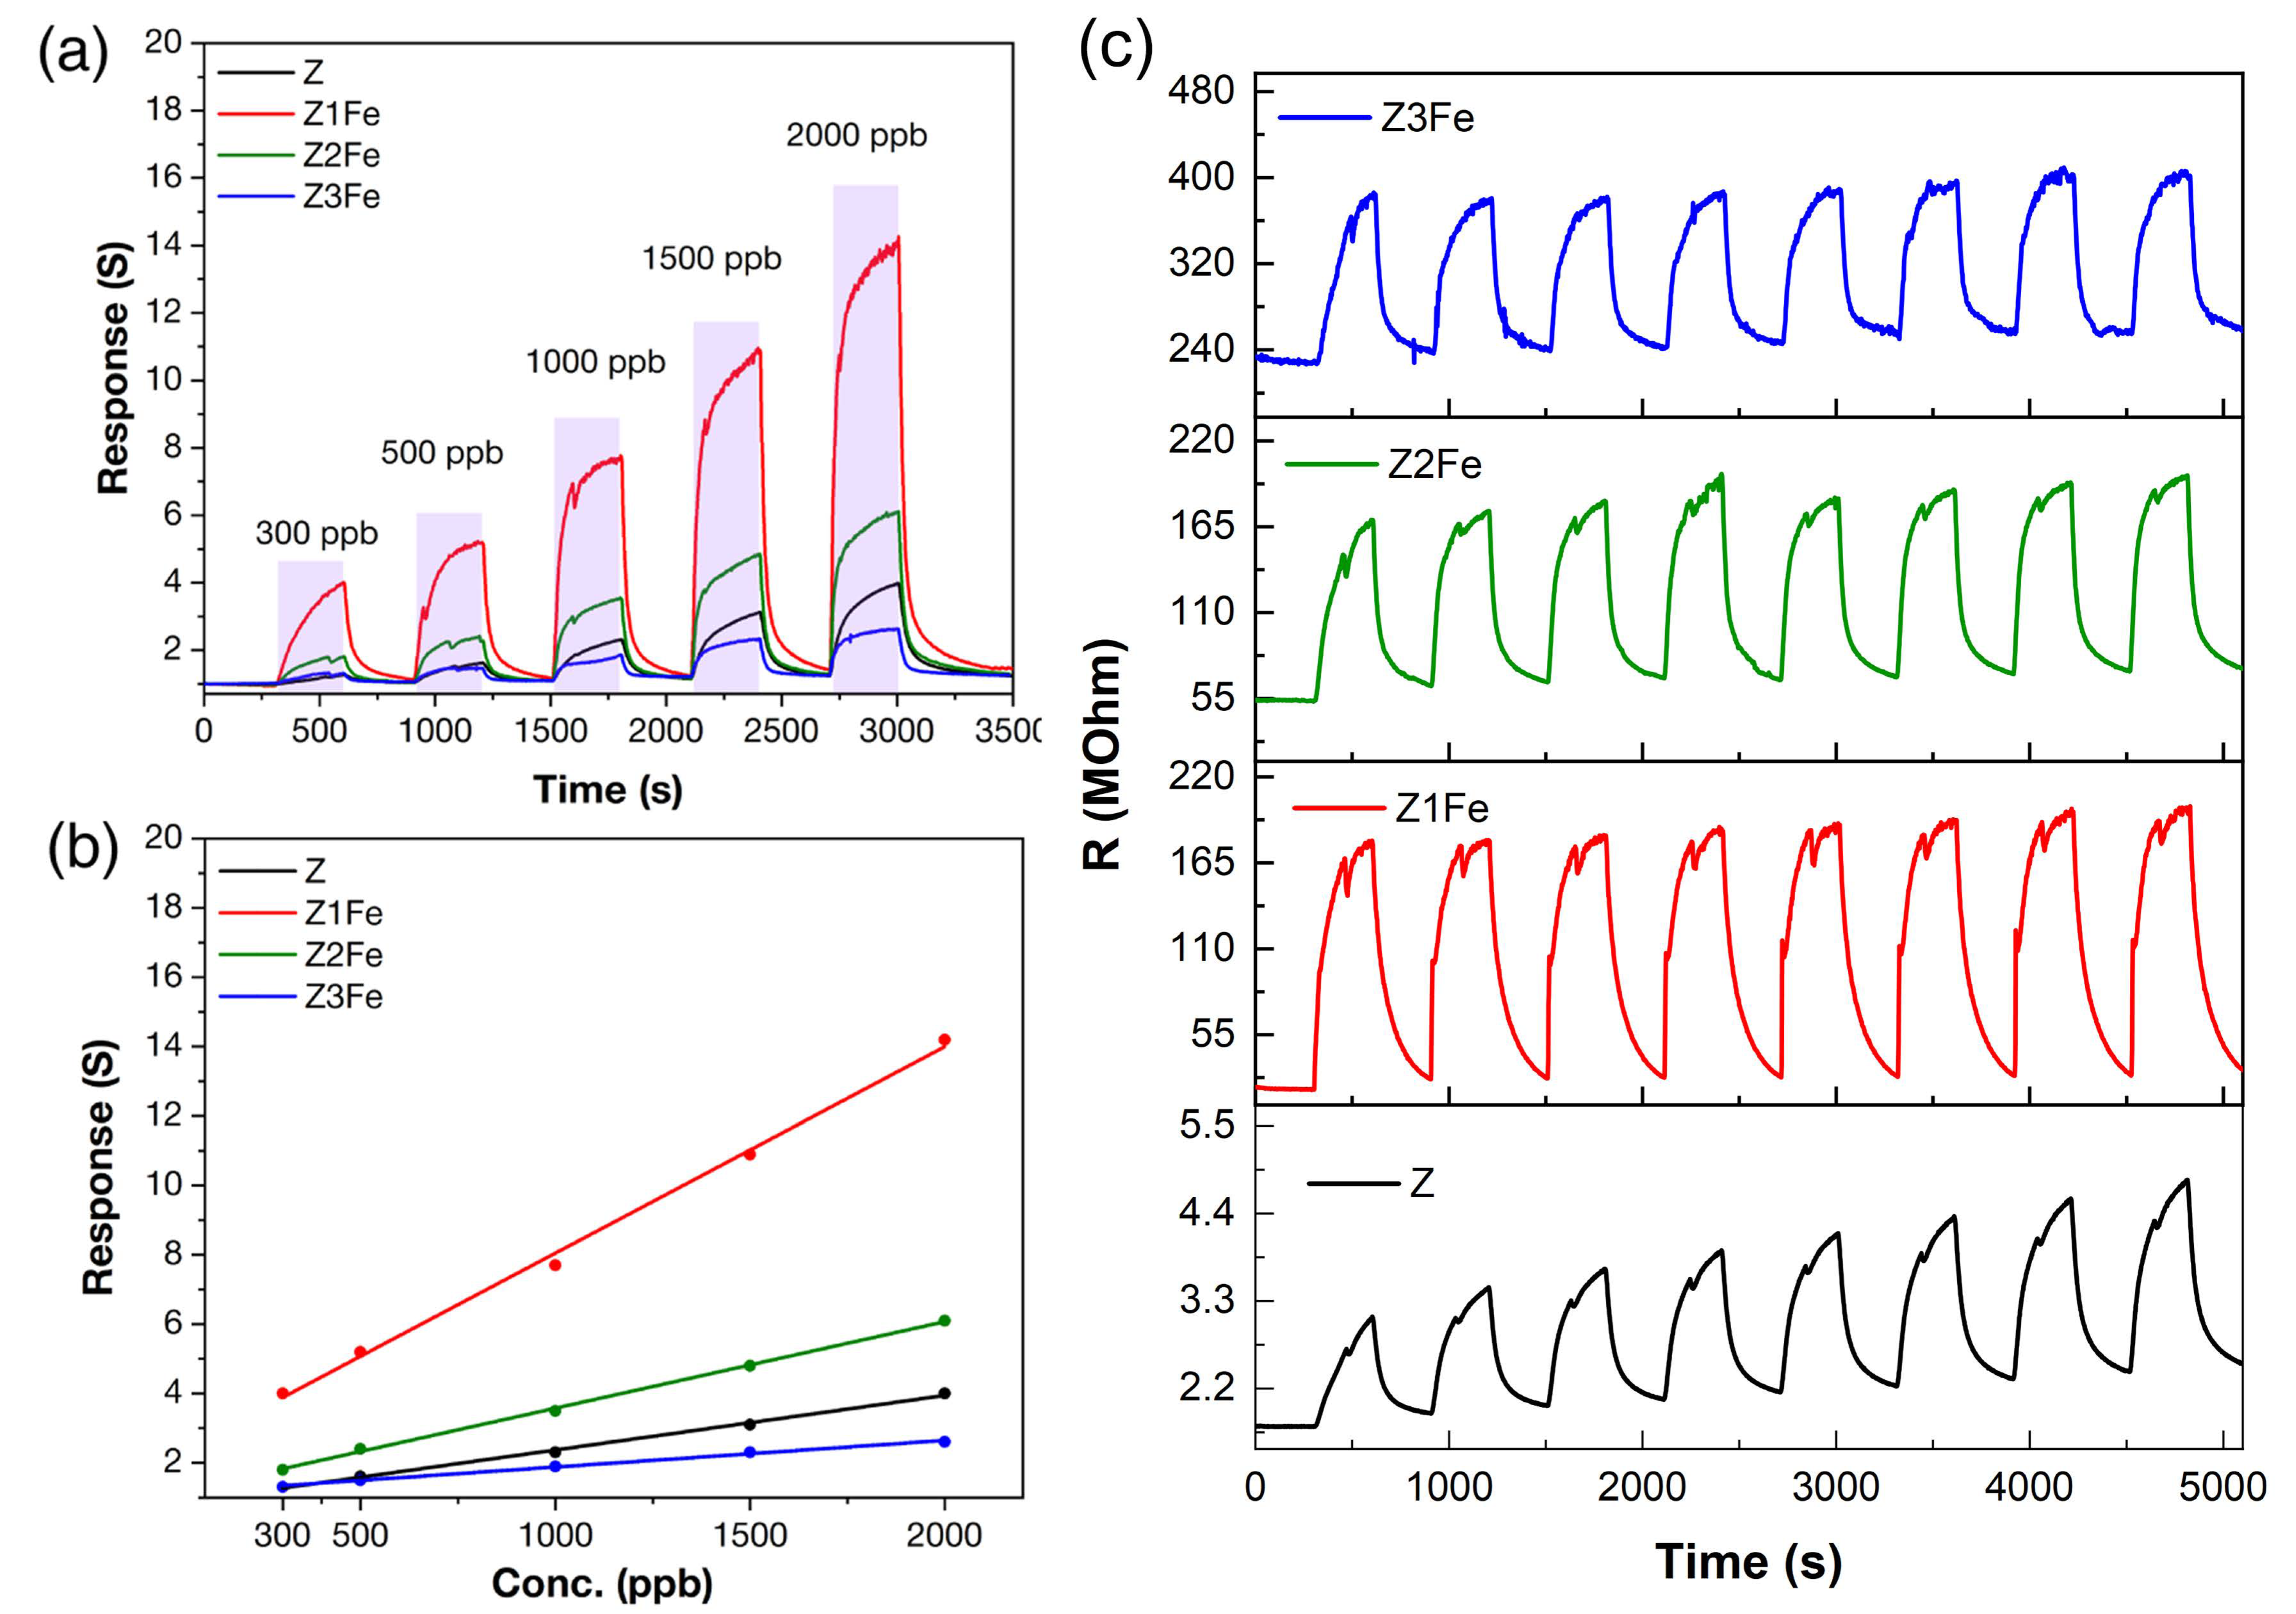
3.4. Gas-Sensing Chemoresistive Properties
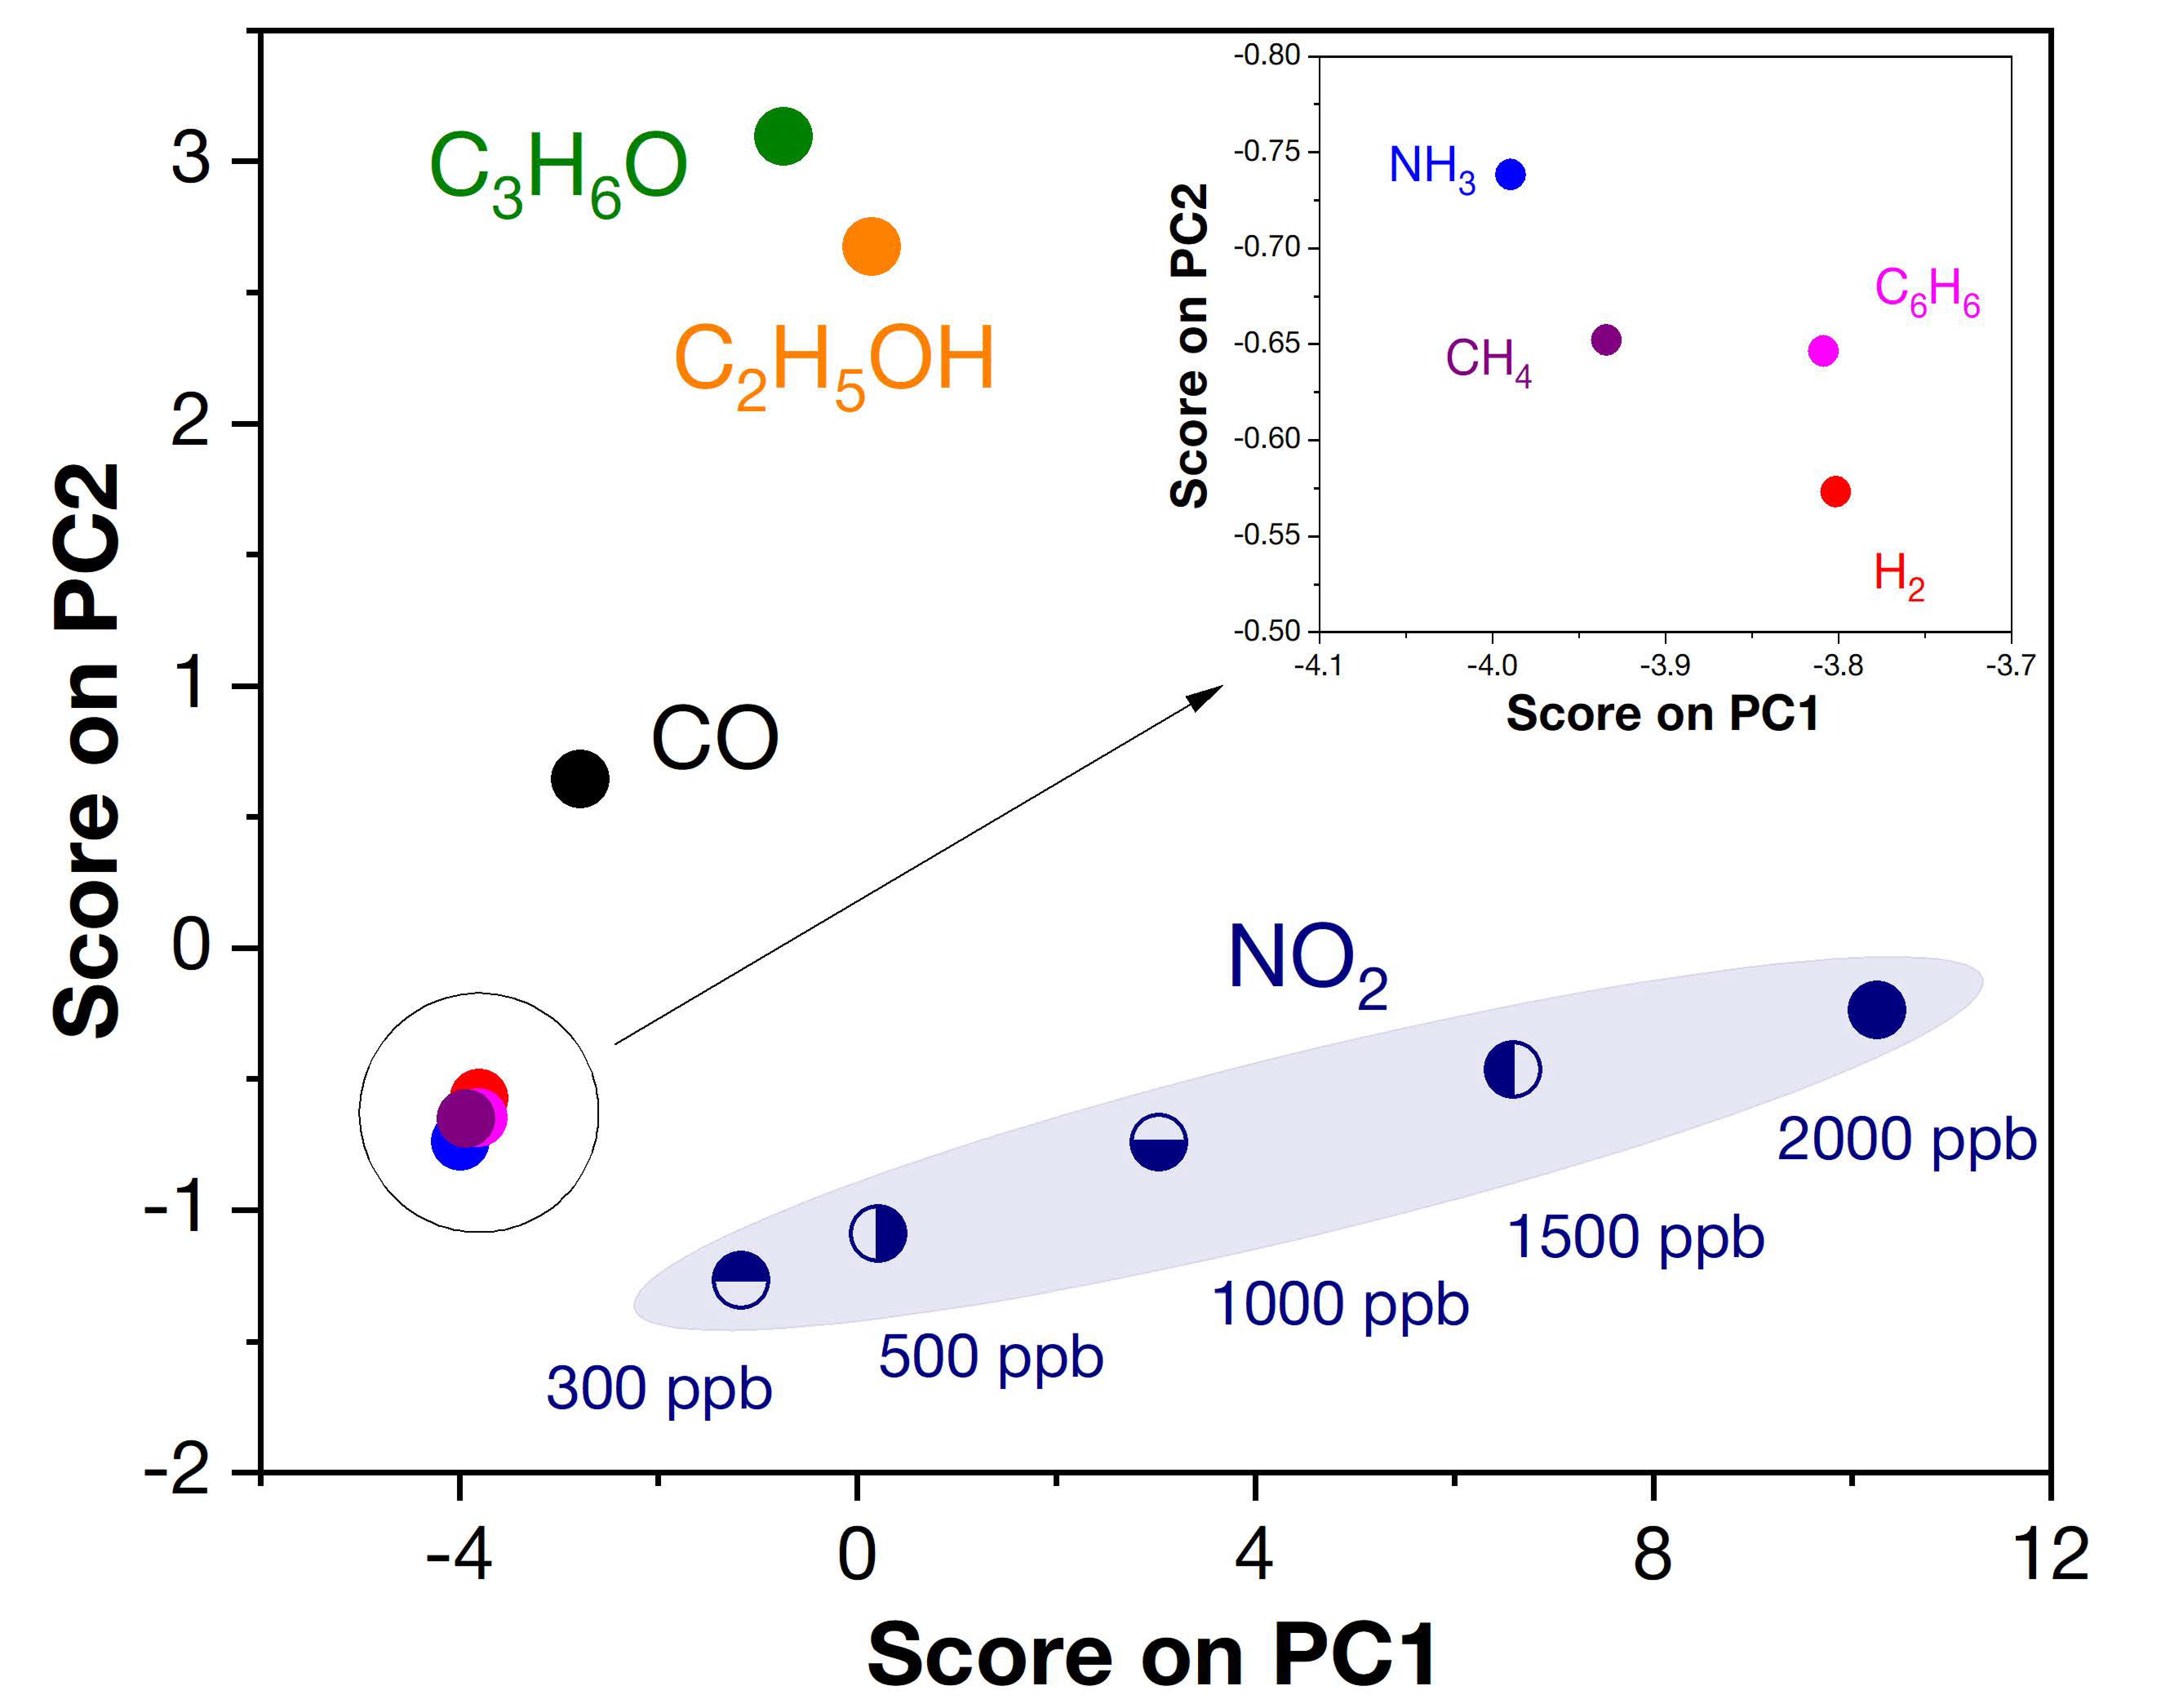
3.4.1. Selectivity
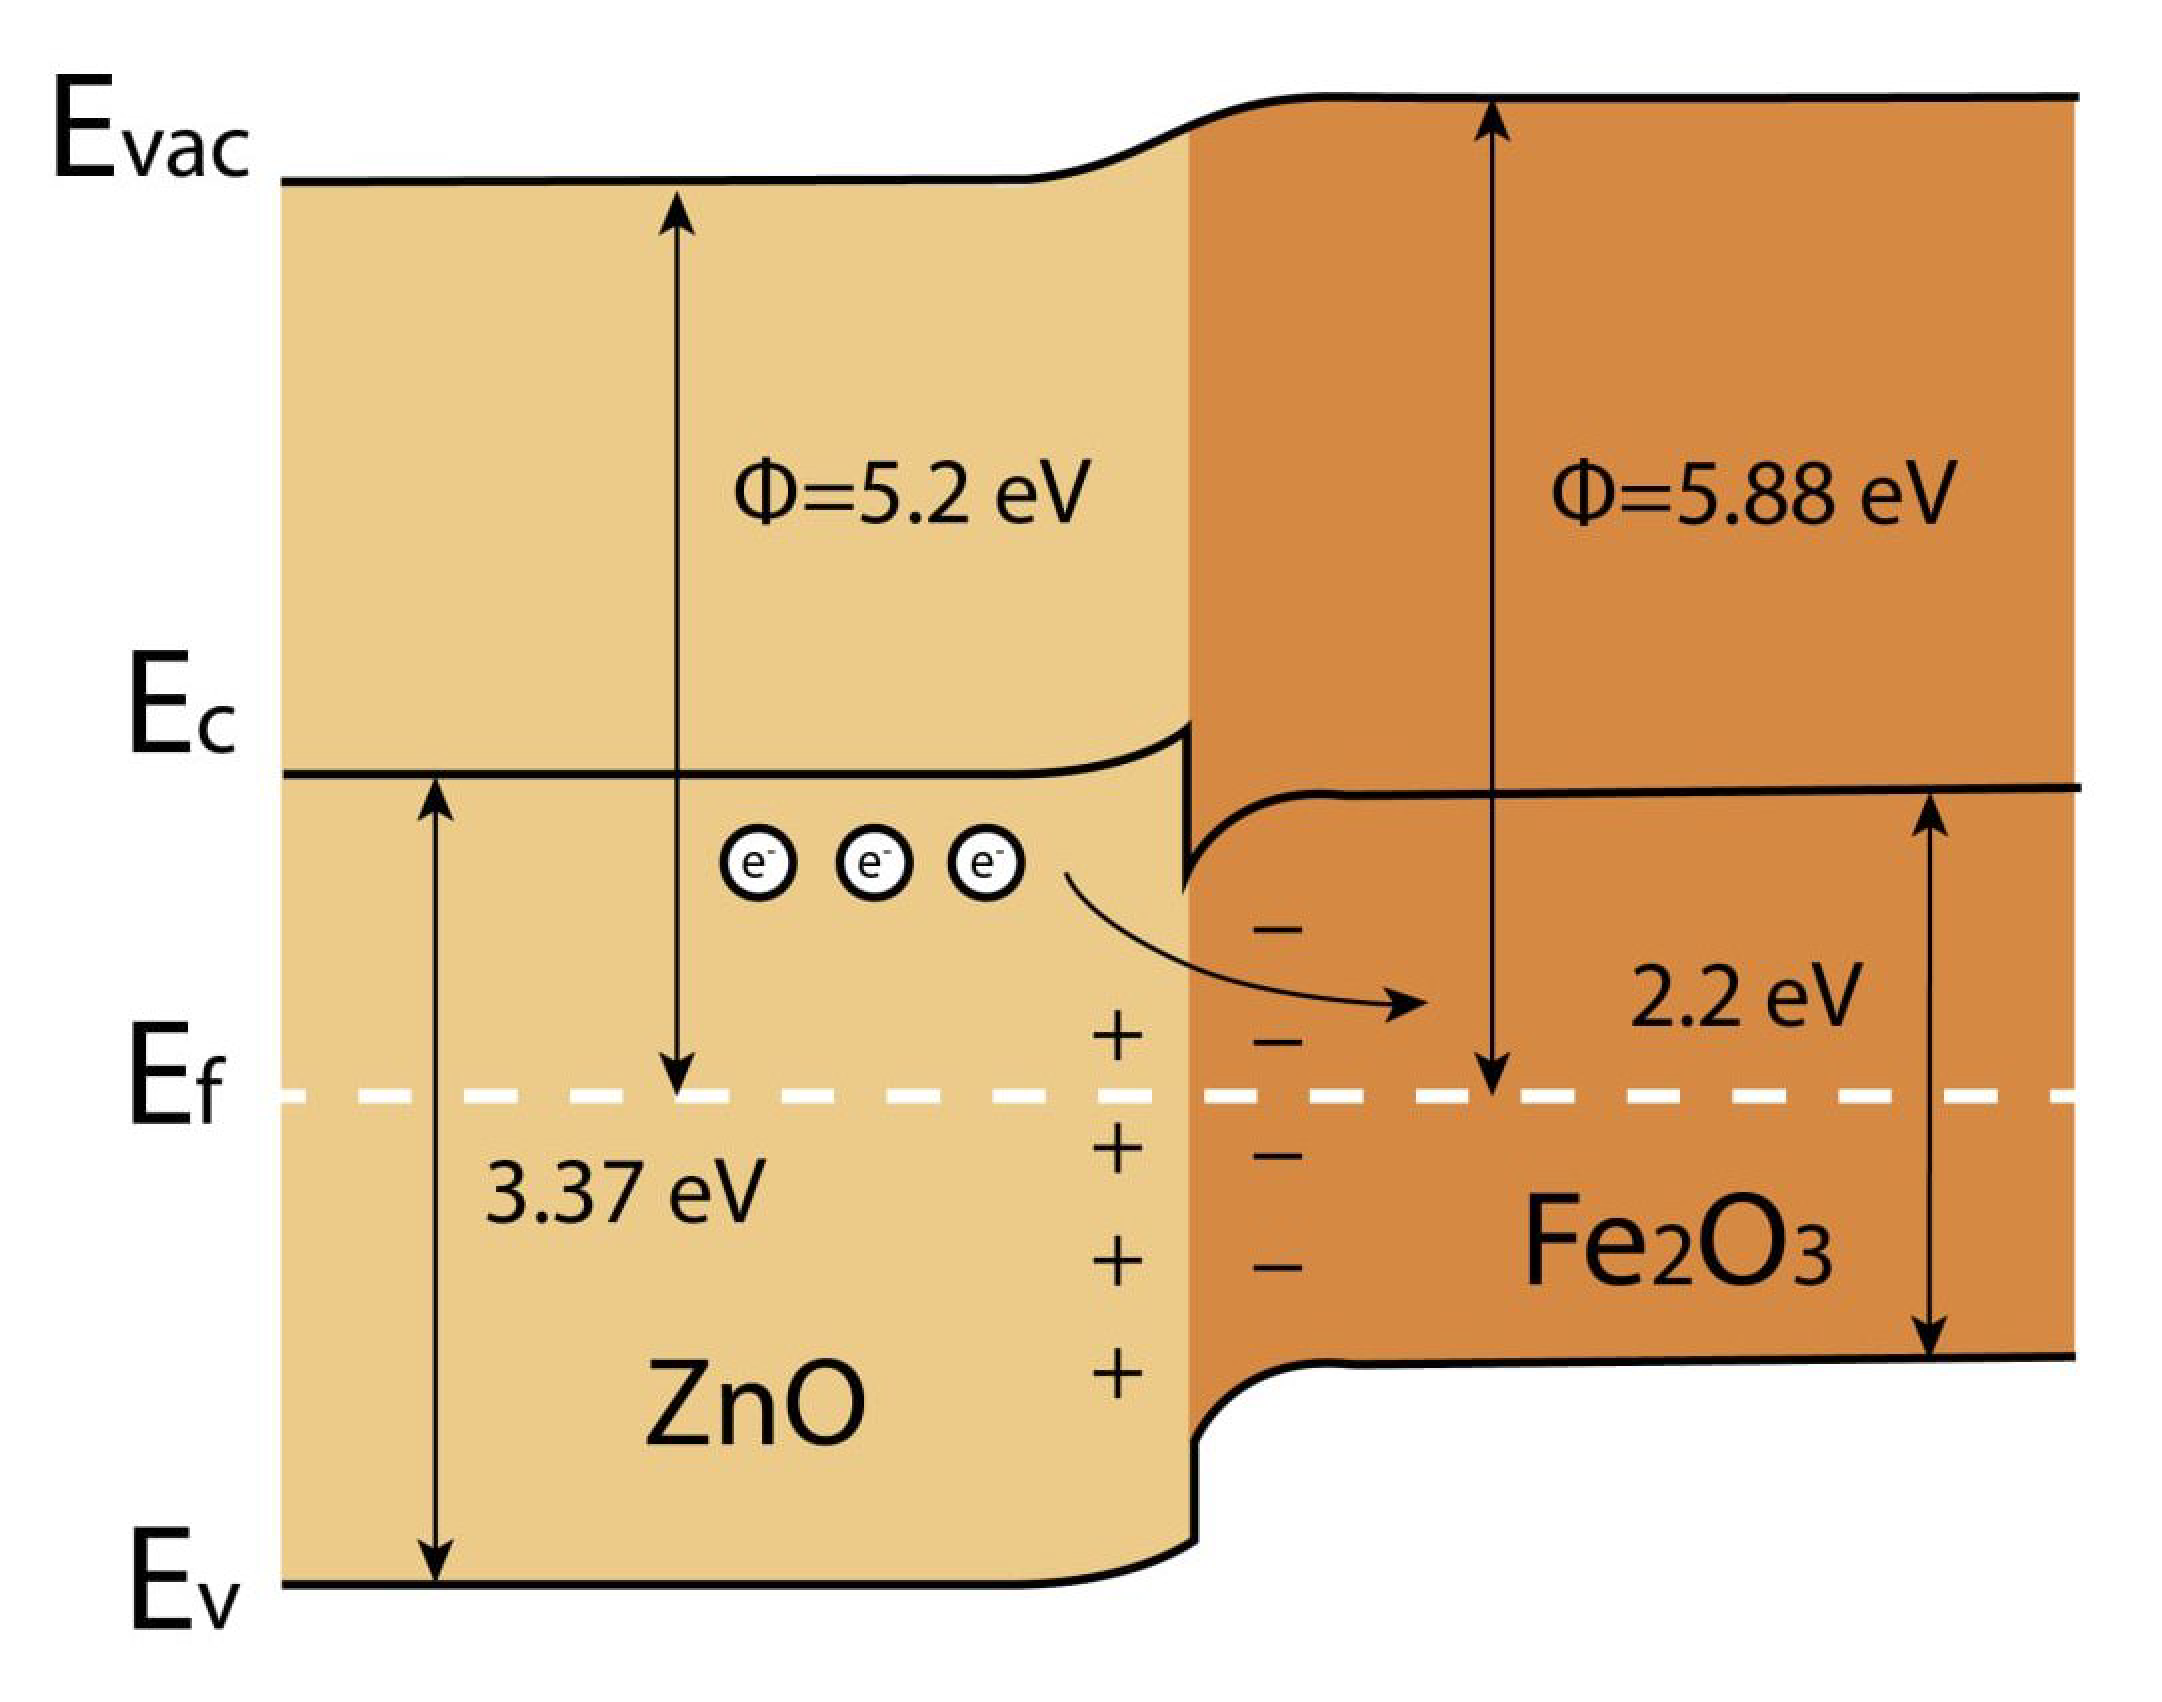
3.4.2. Detection Mechanism
3.4.3. ZnO/Fe2O3 Nanostructured Thin Films As Gas Biosensors
4. Conclusions
Author Contributions
Funding
Institutional Review Board Statement
Informed Consent Statement
Data Availability Statement
Conflicts of Interest
References
- Zhang, B.; Fu, W.; Meng, X.; Ruan, A.; Su, P.; Yang, H. Synthesis and Enhanced Gas Sensing Properties of Flower-like ZnO/α-Fe2O3 Core-Shell Nanorods. Ceram. Int. 2017, 43, 5934–5940. [Google Scholar] [CrossRef]
- Deng, Y. Semiconducting Metal Oxides for Gas Sensing; Elsivier: Amsterdam, The Netherlands, 2019; ISBN 9789811358524. [Google Scholar]
- Hsu, C.L.; Chang, L.F.; Hsueh, T.J. Light-Activated Humidity and Gas Sensing by ZnO Nanowires Grown on LED at Room Temperature. Sens. Actuators B Chem. 2017, 249, 265–277. [Google Scholar] [CrossRef]
- Kang, Y.; Yu, F.; Zhang, L.; Wang, W.; Chen, L.; Li, Y. Review of ZnO-Based Nanomaterials in Gas Sensors. Solid State Ion. 2021, 360, 115544. [Google Scholar] [CrossRef]
- Ma, T. Effect of Precursor Concentration and Sintering on Functional Properties of ZnO Thin Films Deposited by Aerosol-Assisted Chemical Vapour Deposition (AACVD). Mater. Sci. Semicond. Process. 2021, 121, 105413. [Google Scholar] [CrossRef]
- Zhang, B.; Fu, W.; Li, H.; Fu, X.; Wang, Y.; Bala, H.; Sun, G.; Wang, X.; Wang, Y.; Cao, J.; et al. Actinomorphic ZnO/SnO2 Core-Shell Nanorods: Two-Step Synthesis and Enhanced Ethanol Sensing Propertied. Mater. Lett. 2015, 160, 227–230. [Google Scholar] [CrossRef]
- Bai, S.; Guo, T.; Zhao, Y.; Sun, J.; Li, D.; Chen, A.; Liu, C.C. Sensing Performance and Mechanism of Fe-Doped ZnO Microflowers. Sens. Actuators B Chem. 2014, 195, 657–666. [Google Scholar] [CrossRef]
- Ganbavle, V.V.; Inamdar, S.I.; Agawane, G.L.; Kim, J.H.; Rajpure, K.Y. Synthesis of Fast Response, Highly Sensitive and Selective Ni:ZNO Based NO2 Sensor. Chem. Eng. J. 2016, 286, 36–47. [Google Scholar] [CrossRef]
- Wang, C.N.; Li, Y.L.; Gong, F.L.; Zhang, Y.H.; Fang, S.M.; Zhang, H.L. Advances in Doped ZnO Nanostructures for Gas Sensor. Chem. Rec. 2020, 20, 1553–1567. [Google Scholar] [CrossRef]
- Sankar Ganesh, R.; Durgadevi, E.; Navaneethan, M.; Patil, V.L.; Ponnusamy, S.; Muthamizhchelvan, C.; Kawasaki, S.; Patil, P.S.; Hayakawa, Y. Low Temperature Ammonia Gas Sensor Based on Mn-Doped ZnO Nanoparticle Decorated Microspheres. J. Alloys Compd. 2017, 721, 182–190. [Google Scholar] [CrossRef]
- Chang, C.J.; Lin, C.Y.; Chen, J.K.; Hsu, M.H. Ce-Doped ZnO Nanorods Based Low Operation Temperature NO2 Gas Sensors. Ceram. Int. 2014, 40, 10867–10875. [Google Scholar] [CrossRef]
- Zhang, X.H.; Chen, J.; Wu, Y.; Xie, Z.; Kang, J.; Zheng, L. A Simple Route to Fabricate High Sensibility Gas Sensors Based on Erbium Doped ZnO Nanocrystals. Colloids Surfaces A Physicochem. Eng. Asp. 2011, 384, 580–584. [Google Scholar] [CrossRef]
- Kim, J.H.J.Y.; Lee, J.H.; Park, Y.; Kim, J.H.J.Y.; Mirzaei, A.; Kim, H.W.; Kim, S.S. Toluene- and Benzene-Selective Gas Sensors Based on Pt- and Pd-Functionalized ZnO Nanowires in Self-Heating Mode. Sens. Actuators B Chem. 2019, 294, 78–88. [Google Scholar] [CrossRef]
- Postica, V.; Vahl, A.; Santos-Carballal, D.; Dankwort, T.; Kienle, L.; Hoppe, M.; Cadi-Essadek, A.; De Leeuw, N.H.; Terasa, M.I.; Adelung, R.; et al. Tuning ZnO Sensors Reactivity toward Volatile Organic Compounds via Ag Doping and Nanoparticle Functionalization. ACS Appl. Mater. Interfaces 2019, 11, 31452–31466. [Google Scholar] [CrossRef]
- Hosseini, Z.S.; Mortezaali, A.; Iraji Zad, A.; Fardindoost, S. Sensitive and Selective Room Temperature H2S Gas Sensor Based on Au Sensitized Vertical ZnO Nanorods with Flower-like Structures. J. Alloys Compd. 2015, 628, 222–229. [Google Scholar] [CrossRef]
- Yadav, A.A.; Lokhande, A.C.; Kim, J.H.; Lokhande, C.D. Improvement in CO2 Sensing Characteristics Using Pd Nanoparticles Decorated La2O3 Thin Films. J. Ind. Eng. Chem. 2017, 49, 76–81. [Google Scholar] [CrossRef]
- Hsu, K.C.; Fang, T.H.; Hsiao, Y.J.; Li, Z.J. Rapid Detection of Low Concentrations of H2S Using CuO-Doped ZnO Nanofibers. J. Alloys Compd. 2021, 852, 157014. [Google Scholar] [CrossRef]
- Qu, Z.; Fu, Y.; Yu, B.; Deng, P.; Xing, L.; Xue, X. High and Fast H2S Response of NiO/ZnO Nanowire Nanogenerator as a Self-Powered Gas Sensor. Sens. Actuators B Chem. 2016, 222, 78–86. [Google Scholar] [CrossRef]
- Franco, M.A.; Conti, P.P.; Andre, R.S.; Correa, D.S. A Review on Chemiresistive ZnO Gas Sensors. Sens. Actuators Rep. 2022, 4, 100100. [Google Scholar] [CrossRef]
- Andre, R.S.; Pereira, J.C.; Mercante, L.A.; Locilento, D.; Mattoso, L.H.C.; Correa, D.S. ZnO-Co3O4 Heterostructure Electrospun Nanofibers Modified with Poly(Sodium 4-Styrenesulfonate): Evaluation of Humidity Sensing Properties. J. Alloys Compd. 2018, 767, 1022–1029. [Google Scholar] [CrossRef]
- Zhang, J.; Liu, X.; Wang, L.; Yang, T.; Guo, X.; Wu, S.; Wang, S.; Zhang, S. Synthesis and Gas Sensing Properties of α-Fe2O 3@ZnO Core-Shell Nanospindles. Nanotechnology 2011, 22, 185501. [Google Scholar] [CrossRef]
- Mirzaei, A.; Hashemi, B.; Janghorban, K. α-Fe2O3 Based Nanomaterials as Gas Sensors. J. Mater. Sci. Mater. Electron. 2016, 27, 3109–3144. [Google Scholar] [CrossRef]
- Kim, S.; Park, S.; Kheel, H.; Lee, W.I.; Lee, C. Enhanced Ethanol Gas Sensing Performance of the Networked Fe2O3-Functionalized ZnO Nanowire Sensor. J. Nanosci. Nanotechnol. 2016, 16, 8585–8588. [Google Scholar] [CrossRef]
- Zhou, X.; Xiao, Y.; Wang, M.; Sun, P.; Liu, F.; Liang, X.; Li, X.; Lu, G. Highly Enhanced Sensing Properties for ZnO Nanoparticle-Decorated Round-Edged α-Fe2O3 Hexahedrons. ACS Appl. Mater. Interfaces 2015, 7, 8743–8749. [Google Scholar] [CrossRef]
- Lupan, O.; Postica, V.; Gröttrup, J.; Mishra, A.K.; de Leeuw, N.H.; Adelung, R. Enhanced UV and Ethanol Vapour Sensing of a Single 3-D ZnO Tetrapod Alloyed with Fe2O3 Nanoparticles. Sens. Actuators B Chem. 2017, 245, 448–461. [Google Scholar] [CrossRef]
- Jeongseok, L.; Se-Hyeong, L.; So-Young, B.; Yoojong, K.; Kyoungwan, W.; Sanghyun, L.; Yooseong, L.; Moonsuk, Y. Improved Sensitivity of α-Fe2O3 Nanoparticle-Decorated ZnO Nanowire Gas Sensor for CO. Sensors 2019, 19, 1903. [Google Scholar] [CrossRef]
- Iram, S.; Mahmood, A.; Ehsan, M.F.; Mumtaz, A.; Sohail, M.; Sitara, E.; Mushtaq, S.; Malik, M.A.; Fatima, S.A.; Shaheen, R.; et al. Impedance Spectroscopy Analysis of Pbse Nanostructures Deposited by Aerosol Assisted Chemical Vapor Deposition Approach. Nanomaterials 2021, 11, 2817. [Google Scholar] [CrossRef]
- Knapp, C.E.; Carmalt, C.J. Solution Based CVD of Main Group Materials. Chem. Soc. Rev. 2016, 45, 1036–1064. [Google Scholar] [CrossRef]
- Shukla, A.; Kaushik, V.K.; Prasher, D. Growth and Characterization of MgxZn1-XO Thin Films by Aerosol-Assisted Chemical Vapor Deposition (AACVD). Electron. Mater. Lett. 2014, 10, 61–65. [Google Scholar] [CrossRef]
- Potter, D.B.; Parkin, I.P.; Carmalt, C.J. The Effect of Solvent on Al-Doped ZnO Thin Films Deposited via Aerosol Assisted CVD. RSC Adv. 2018, 8, 33164–33173. [Google Scholar] [CrossRef]
- Claros, M.; Setka, M.; Jimenez, Y.P.; Vallejos, S. Aacvd Synthesis and Characterization of Iron and Copper Oxides Modified Zno Structured Films. Nanomaterials 2020, 10, 471. [Google Scholar] [CrossRef]
- Corradi, M.; Majori, M.; Cacciani, G.C.; Consigli, G.F.; De’Munari, E.; Pesci, A. Increased Exhaled Nitric Oxide in Patients with Stable Chronic Obstructive Pulmonary Disease. Thorax 1999, 54, 572–575. [Google Scholar] [CrossRef]
- Wilson, A.D. Advances in Electronic-Nose Technologies for the Detection of Volatile Biomarker Metabolites in the Human Breath. Metabolites 2015, 5, 140–163. [Google Scholar] [CrossRef] [PubMed]
- van der Sar, I.G.; Wijbenga, N.; Nakshbandi, G.; Aerts, J.G.J.V.; Manintveld, O.C.; Wijsenbeek, M.S.; Hellemons, M.E.; Moor, C.C. The Smell of Lung Disease: A Review of the Current Status of Electronic Nose Technology. Respir. Res. 2021, 22, 1–22. [Google Scholar] [CrossRef] [PubMed]
- Yang, D.; Gopal, R.A.; Lkhagvaa, T.; Choi, D. Metal-Oxide Gas Sensors for Exhaled-Breath Analysis: A Review. Meas. Sci. Technol. 2021, 32, 102004. [Google Scholar] [CrossRef]
- Smith, A.D.; Cowan, J.O.; Filsell, S.; McLachlan, C.; Monti-Sheehan, G.; Jackson, P.; Taylor, D.R. Diagnosing Asthma: Comparisons between Exhaled Nitric Oxide Measurements and Conventional Tests. Am. J. Respir. Crit. Care Med. 2004, 169, 473–478. [Google Scholar] [CrossRef] [PubMed]
- Kim, J.S.; Yoon, J.W.; Hong, Y.J.; Kang, Y.C.; Abdel-Hady, F.; Wazzan, A.A.; Lee, J.H. Highly Sensitive and Selective Detection of Ppb-Level NO2 Using Multi-Shelled WO3 Yolk-Shell Spheres. Sens. Actuators B Chem. 2016, 229, 561–569. [Google Scholar] [CrossRef]
- Natkaeo, A.; Phokharatkul, D.; Hodak, J.H.; Wisitsoraat, A.; Hodak, S.K. Highly Selective Sub–10 ppm H2S Gas Sensors Based on Ag-Doped CaCu3Ti4O12 Films. Sens. Actuators B Chem. 2018, 260, 571–580. [Google Scholar] [CrossRef]
- Pan, W.; Zhang, Y.; Zhang, D. Self-Assembly Fabrication of Titanium Dioxide Nanospheres-Decorated Tungsten Diselenide Hexagonal Nanosheets for Ethanol Gas Sensing Application. Appl. Surf. Sci. 2020, 527, 146781. [Google Scholar] [CrossRef]
- Simonenko, T.L.; Simonenko, N.P.; Gorobtsov, P.Y.; Mokrushin, A.S.; Solovey, V.R.; Pozharnitskaya, V.M.; Simonenko, E.P.; Glumov, O.V.; Melnikova, N.A.; Lizunova, A.A.; et al. Pen Plotter Printing of Co3O4 Thin Films: Features of the Microstructure, Optical, Electrophysical and Gas-Sensing Properties. J. Alloys Compd. 2020, 832, 154957. [Google Scholar] [CrossRef]
- Mokrushin, A.S.; Fisenko, N.A.; Gorobtsov, P.Y.; Simonenko, T.L.; Simonenko, E.P.; Simonenko, N.P.; Glumov, O.V.; Melnikova, N.A.; Bukunov, K.A.; Sevastyanov, V.G.; et al. Pen Plotter Printing of ITO Thin Film as a Highly CO Sensitive Component of a Resistive Gas Sensor. Talanta 2021, 221, 121455. [Google Scholar] [CrossRef]
- Mokrushin, A.S.; Simonenko, T.L.; Simonenko, N.P.; Yu, P.; Kadyrov, N.C.; Simonenko, E.P.; Sevastyanov, V.G.; Kuznetsov, N.T. Chemoresistive Gas-Sensing Properties of Highly Dispersed Nb2O5 Obtained by Programmable Precipitation. J. Alloys Compd. 2021, 868, 159090. [Google Scholar] [CrossRef]
- Nagornov, I.A.; Mokrushin, A.S.; Simonenko, E.P.; Simonenko, N.P.; Gorobtsov, P.Y.; Sevastyanov, V.G.; Kuznetsov, N.T. Zinc Oxide Obtained by the Solvothermal Method with High Sensitivity and Selectivity to Nitrogen Dioxide. Ceram. Int. 2020, 46, 7756–7766. [Google Scholar] [CrossRef]
- Vallejos, S.; Pizúrová, N.; Gràcia, I.; Sotelo-Vazquez, C.; Čechal, J.; Blackman, C.; Parkin, I.; Cané, C. ZnO Rods with Exposed {100} Facets Grown via a Self-Catalyzed Vapor-Solid Mechanism and Their Photocatalytic and Gas Sensing Properties. ACS Appl. Mater. Interfaces 2016, 8, 33335–33342. [Google Scholar] [CrossRef] [PubMed]
- Roy, A.; Sood, A.K. Phonons and Fractons in Sol-Gel Alumina: Raman Study. Pramana J. Phys. 1995, 44, 201–209. [Google Scholar] [CrossRef]
- Šćepanović, M.; Grujić-Brojčin, M.; Vojisavljević, K.; Bernikc, S.; Srećković, T. Raman Study of Structural Disorder in ZnO Nanopowders. J. Raman Spectrosc. 2010, 41, 914–921. [Google Scholar] [CrossRef]
- Wu, H.; Wu, G.; Wang, L. Peculiar Porous α-Fe2O3, γ-Fe2O3 and Fe3O4 Nanospheres: Facile Synthesis and Electromagnetic Properties. Powder Technol. 2015, 269, 443–451. [Google Scholar] [CrossRef]
- Sáaedi, A.; Yousefi, R.; Jamali-Sheini, F.; Zak, A.K.; Cheraghizade, M.; Mahmoudian, M.R.; Baghchesara, M.A.; Dezaki, A.S. XPS Studies and Photocurrent Applications of Alkali-Metals-Doped ZnO Nanoparticles under Visible Illumination Conditions. Phys. E Low-Dimensional Syst. Nanostructures 2016, 79, 113–118. [Google Scholar] [CrossRef]
- Mahana, A.; Mehta, S.K. Potential of Scenedesmus-Fabricated ZnO Nanorods in Photocatalytic Reduction of Methylene Blue under Direct Sunlight: Kinetics and Mechanism. Environ. Sci. Pollut. Res. 2021, 28, 28234–28250. [Google Scholar] [CrossRef]
- Zhang, Z.; Lu, J.; Yun, T.; Zheng, M.; Pan, J.; Sow, C.H.; Tok, E.S. Desorption of Ambient Gas Molecules and Phase Transformation of α-Fe2O3 Nanostructures during Ultrahigh Vacuum Annealing. J. Phys. Chem. C 2013, 117, 1509–1517. [Google Scholar] [CrossRef]
- Hawn, D.D.; DeKoven, B.M. Deconvolution as a Correction for Photoelectron Inelastic Energy Losses in the Core Level XPS Spectra of Iron Oxides. Surf. Interface Anal. 1987, 10, 63–74. [Google Scholar] [CrossRef]
- Hu, X.; Yu, J.C.; Gong, J.; Li, Q.; Li, G. α-Fe2O3 Nanorings Prepared by a Microwave-Assisted Hydrothermal Process and Their Sensing Properties. Adv. Mater. 2007, 19, 2324–2329. [Google Scholar] [CrossRef]
- Wang, J.; Wang, Z.; Huang, B.; Ma, Y.; Liu, Y.; Qin, X.; Zhang, X.; Dai, Y. Oxygen Vacancy Induced Band-Gap Narrowing and Enhanced Visible Light Photocatalytic Activity of ZnO. ACS Appl. Mater. Interfaces 2012, 4, 4024–4030. [Google Scholar] [CrossRef] [PubMed]
- Ansari, S.A.; Khan, M.M.; Kalathil, S.; Nisar, A.; Lee, J.; Cho, M.H. Oxygen Vacancy Induced Band Gap Narrowing of ZnO Nanostructures by an Electrochemically Active Biofilm. Nanoscale 2013, 5, 9238–9246. [Google Scholar] [CrossRef]
- Caglar, M.; Ilican, S.; Caglar, Y. Influence of Dopant Concentration on the Optical Properties of ZnO: In Films by Sol-Gel Method. Thin Solid Films 2009, 517, 5023–5028. [Google Scholar] [CrossRef]
- Gosdy, W.; Orville Thomas, W.J. Electronegativities of the Elements. J. Chem. Phys. 1956, 24, 439–444. [Google Scholar] [CrossRef]
- Firooz, A.A.; Abbas, A.; Khodadadi, A.A. The Effect of Different Fe2O3/ZnO Nanocomposites on Optical Properties. In Proceedings of the 4th International Conference on Nanostructures (ICNS4), Kish Island, Iran, 12–14 March 2012; pp. 10–12. [Google Scholar] [CrossRef]
- Mokrushin, A.S.; Nagornov, I.A.; Simonenko, T.L.; Simonenko, N.P.; Gorobtsov, P.Y.; Khamova, T.V.; Kopitsa, G.P.; Evzrezov, A.N.; Simonenko, E.P.; Sevastyanov, V.G.; et al. Chemoresistive Gas-Sensitive ZnO/Pt Nanocomposites Films Applied by Microplotter Printing with Increased Sensitivity to Benzene and Hydrogen. Mater. Sci. Eng. B Solid-State Mater. Adv. Technol. 2021, 271, 115233. [Google Scholar] [CrossRef]
- Mokrushin, A.S.; Nagornov, I.A.; Simonenko, T.L.; Simonenko, N.P.; Gorobtsov, P.Y.; Arkhipushkin, I.A.; Simonenko, E.P.; Sevastyanov, V.G.; Kuznetsov, N.T. Gas-Sensitive Nanostructured ZnO Films Praseodymium and Europium Doped: Electrical Conductivity, Selectivity, Influence of UV Irradiation and Humidity. Appl. Surf. Sci. 2022, 589, 152974. [Google Scholar] [CrossRef]
- NOISH Documentation for Immediately Dangerous to Life or Health Concentrations (IDLHs)-7783064; National Institute Occupational Safety Health: Washington, DC, USA, 1996. Available online: http://www.cdc.gov/niosh/idlh/7783064.html (accessed on 14 December 2022).
- Jung, H.; Cho, W.; Yoo, R.; Lee, H.S.; Choe, Y.S.; Jeon, J.Y.; Lee, W. Highly Selective Real-Time Detection of Breathacetone by Using ZnO Quantum Dots with a Miniaturized Gas Chromatographic Column. Sens. Actuators B Chem. 2018, 274, 527–532. [Google Scholar] [CrossRef]
- Kim, H.J.; Lee, J.H.; Hyo-Joong, K.; Jong-Heun, L. Highly Sensitive and Selective Gas Sensors Using P-Type Oxide Semiconductors: Overview. Sens. Actuators B Chem. 2014, 192, 607–627. [Google Scholar] [CrossRef]
- Chen, M.; Wang, Z.; Han, D.; Gu, F.; Guo, G. Porous ZnO Polygonal Nanoflakes: Synthesis, Use in High-Sensitivity NO2 Gas Sensor, and Proposed Mechanism of Gas Sensing. J. Phys. Chem. C 2011, 115, 12763–12773. [Google Scholar] [CrossRef]
- Chizhov, A.; Rumyantseva, M.; Gaskov, A. Light Activation of Nanocrystalline Metal Oxides for Gas Sensing: Principles, Achievements, Challenges. Nanomaterials 2021, 11, 892. [Google Scholar] [CrossRef] [PubMed]
- Zhang, T.; Hui, Y.; Chen, L.; Li, G.; Mao, B.; Zhao, Y. Interfacial Crosslinked Quasi-2D Perovskite with Boosted Carrier Transport and Enhanced Stability. J. Phys. D. Appl. Phys. 2018, 51, 404001. [Google Scholar] [CrossRef]
- Hong, H.S.; Phan, D.T.; Chung, G.S. High-Sensitivity Humidity Sensors with ZnO Nanorods Based Two-Port Surface Acoustic Wave Delay Line. Sens. Actuators B Chem. 2012, 171–172, 1283–1287. [Google Scholar] [CrossRef]
- Liang, Y.C.; Hsu, Y.W. Enhanced Sensing Ability of Brush-like Fe2O3-ZnO Nanostructures towards NO2 Gas via Manipulating Material Synergistic Effect. Int. J. Mol. Sci. 2021, 22, 6884. [Google Scholar] [CrossRef]
- Zhang, B.; Huang, Y.; Vinluan, R.; Wang, S.; Cui, C.; Lu, X.; Peng, C.; Zhang, M.; Zheng, J.; Gao, P.X. Enhancing ZnO Nanowire Gas Sensors Using Au/Fe2O3 Hybrid Nanoparticle Decoration. Nanotechnology 2020, 31, 325505. [Google Scholar] [CrossRef] [PubMed]
- Wen, Z.; Ren, H.; Li, D.; Lu, X.; Joo, S.W.; Huang, J. A Highly Efficient Acetone Gas Sensor Based on 2D Porous ZnFe2O4 Nanosheets. Sens. Actuators B Chem. 2023, 379, 133287. [Google Scholar] [CrossRef]
- Yang, J.H.; Yuan, K.P.; Zhu, L.Y.; Hang, C.Z.; Li, X.X.; Tao, J.J.; Ma, H.P.; Jiang, A.Q.; Lu, H.L. Facile Synthesis of α-Fe2O3/ZnO Core-Shell Nanowires for Enhanced H2S Sensing. Sens. Actuators B Chem. 2020, 307, 127617. [Google Scholar] [CrossRef]
- Aleksanyan, M.; Sayunts, A.; Shahkhatuni, G.; Simonyan, Z.; Kasparyan, H.; Kopecký, D. Room Temperature Detection of Hydrogen Peroxide Vapor by Fe2O3:ZnO Nanograins. Nanomaterials 2022, 13, 120. [Google Scholar] [CrossRef]
- Aleksanyan, M.S.; Sayunts, A.G.; Shahkhatuni, G.H.; Aroutiounian, V.M.; Shahnazaryan, G.E. Study of Characteristics of the Sensor Detecting of Low Concentration of Ammonia. J. Contemp. Phys. 2021, 56, 352–358. [Google Scholar] [CrossRef]
- Aleksanyan, M.S.; Sayunts, A.G.; Shahkhatuni, G.H.; Simonyan, Z.G.; Shahnazaryan, G.E.; Aroutiounian, V.M. Use of Nanostructured Fe2O3:ZnO Film for Detection of Hydrogen. J. Contemp. Phys. 2022, 57, 140–145. [Google Scholar] [CrossRef]


| Sample | Content Fe, at.% | Average Crystallite Size (L), nm | Average Particle Size of ZnO, nm | Average Particle Size of Fe2O3, nm | Average Film Thickness, nm | Eg, eV | Response (S) to 300–2000 ppb NO2 | Selectivity Coefficient (Sel) | Response Drop (RD) at 25–75%RH | Response Time, c |
|---|---|---|---|---|---|---|---|---|---|---|
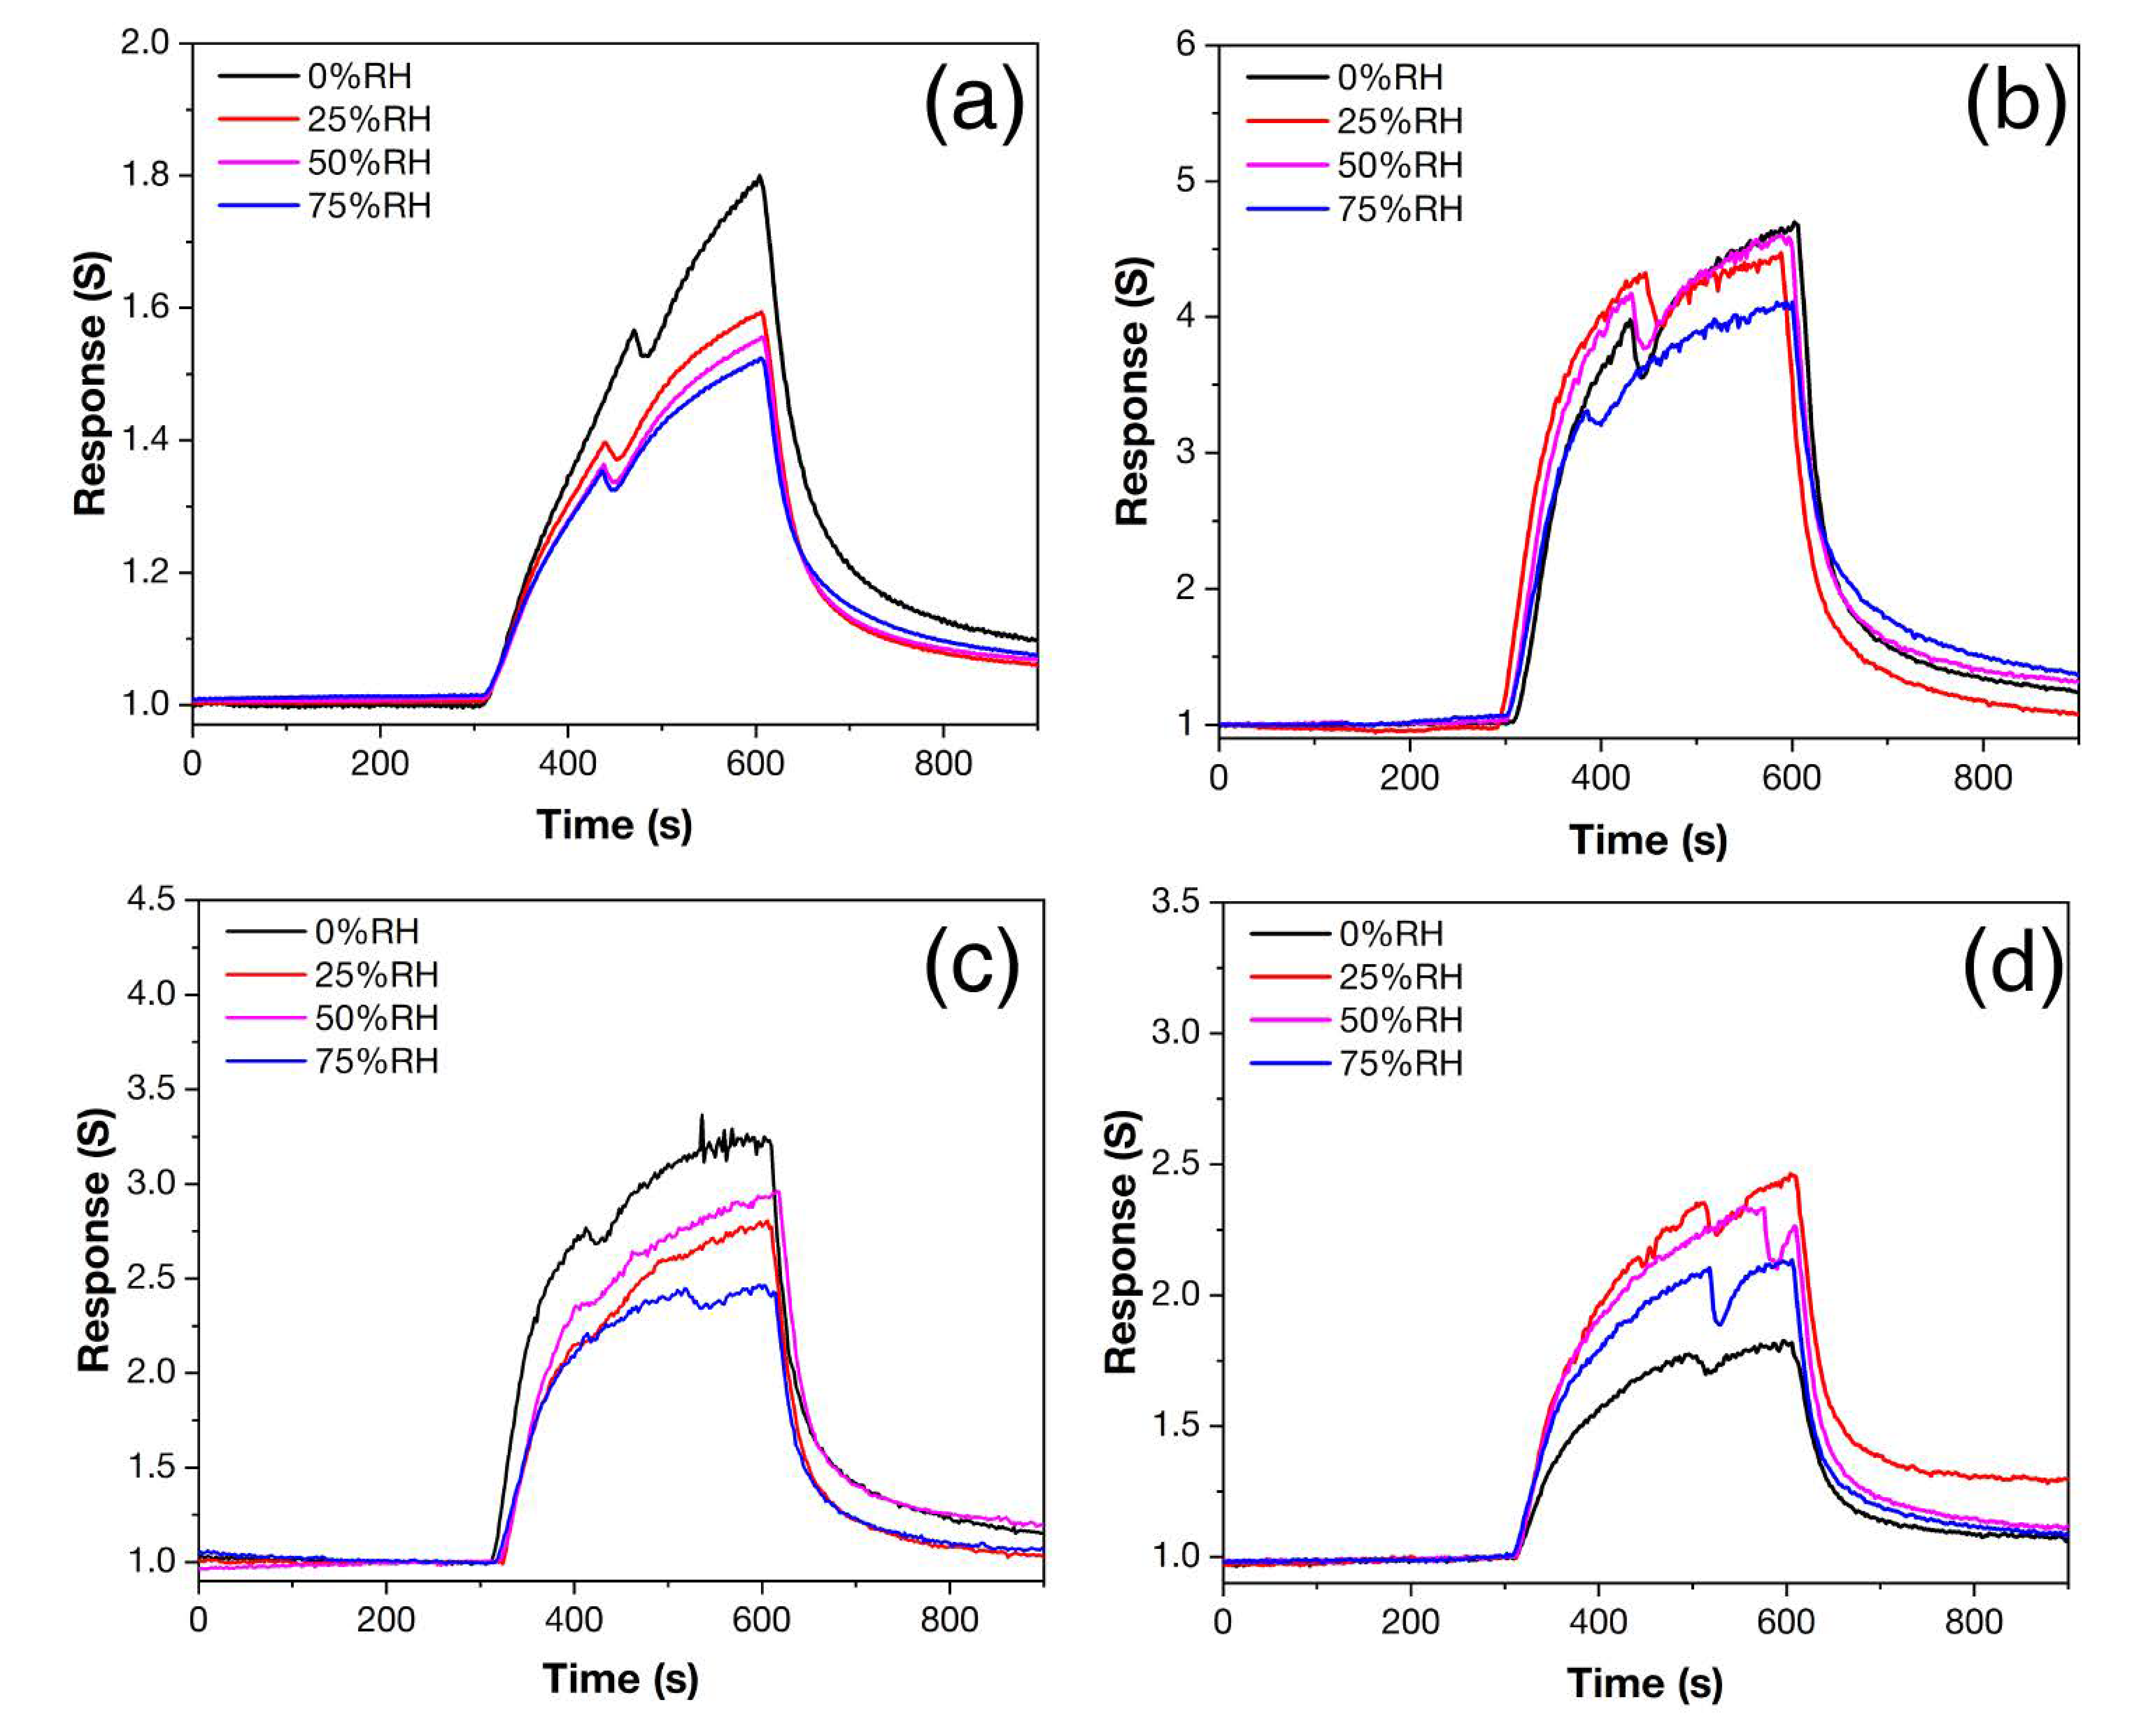
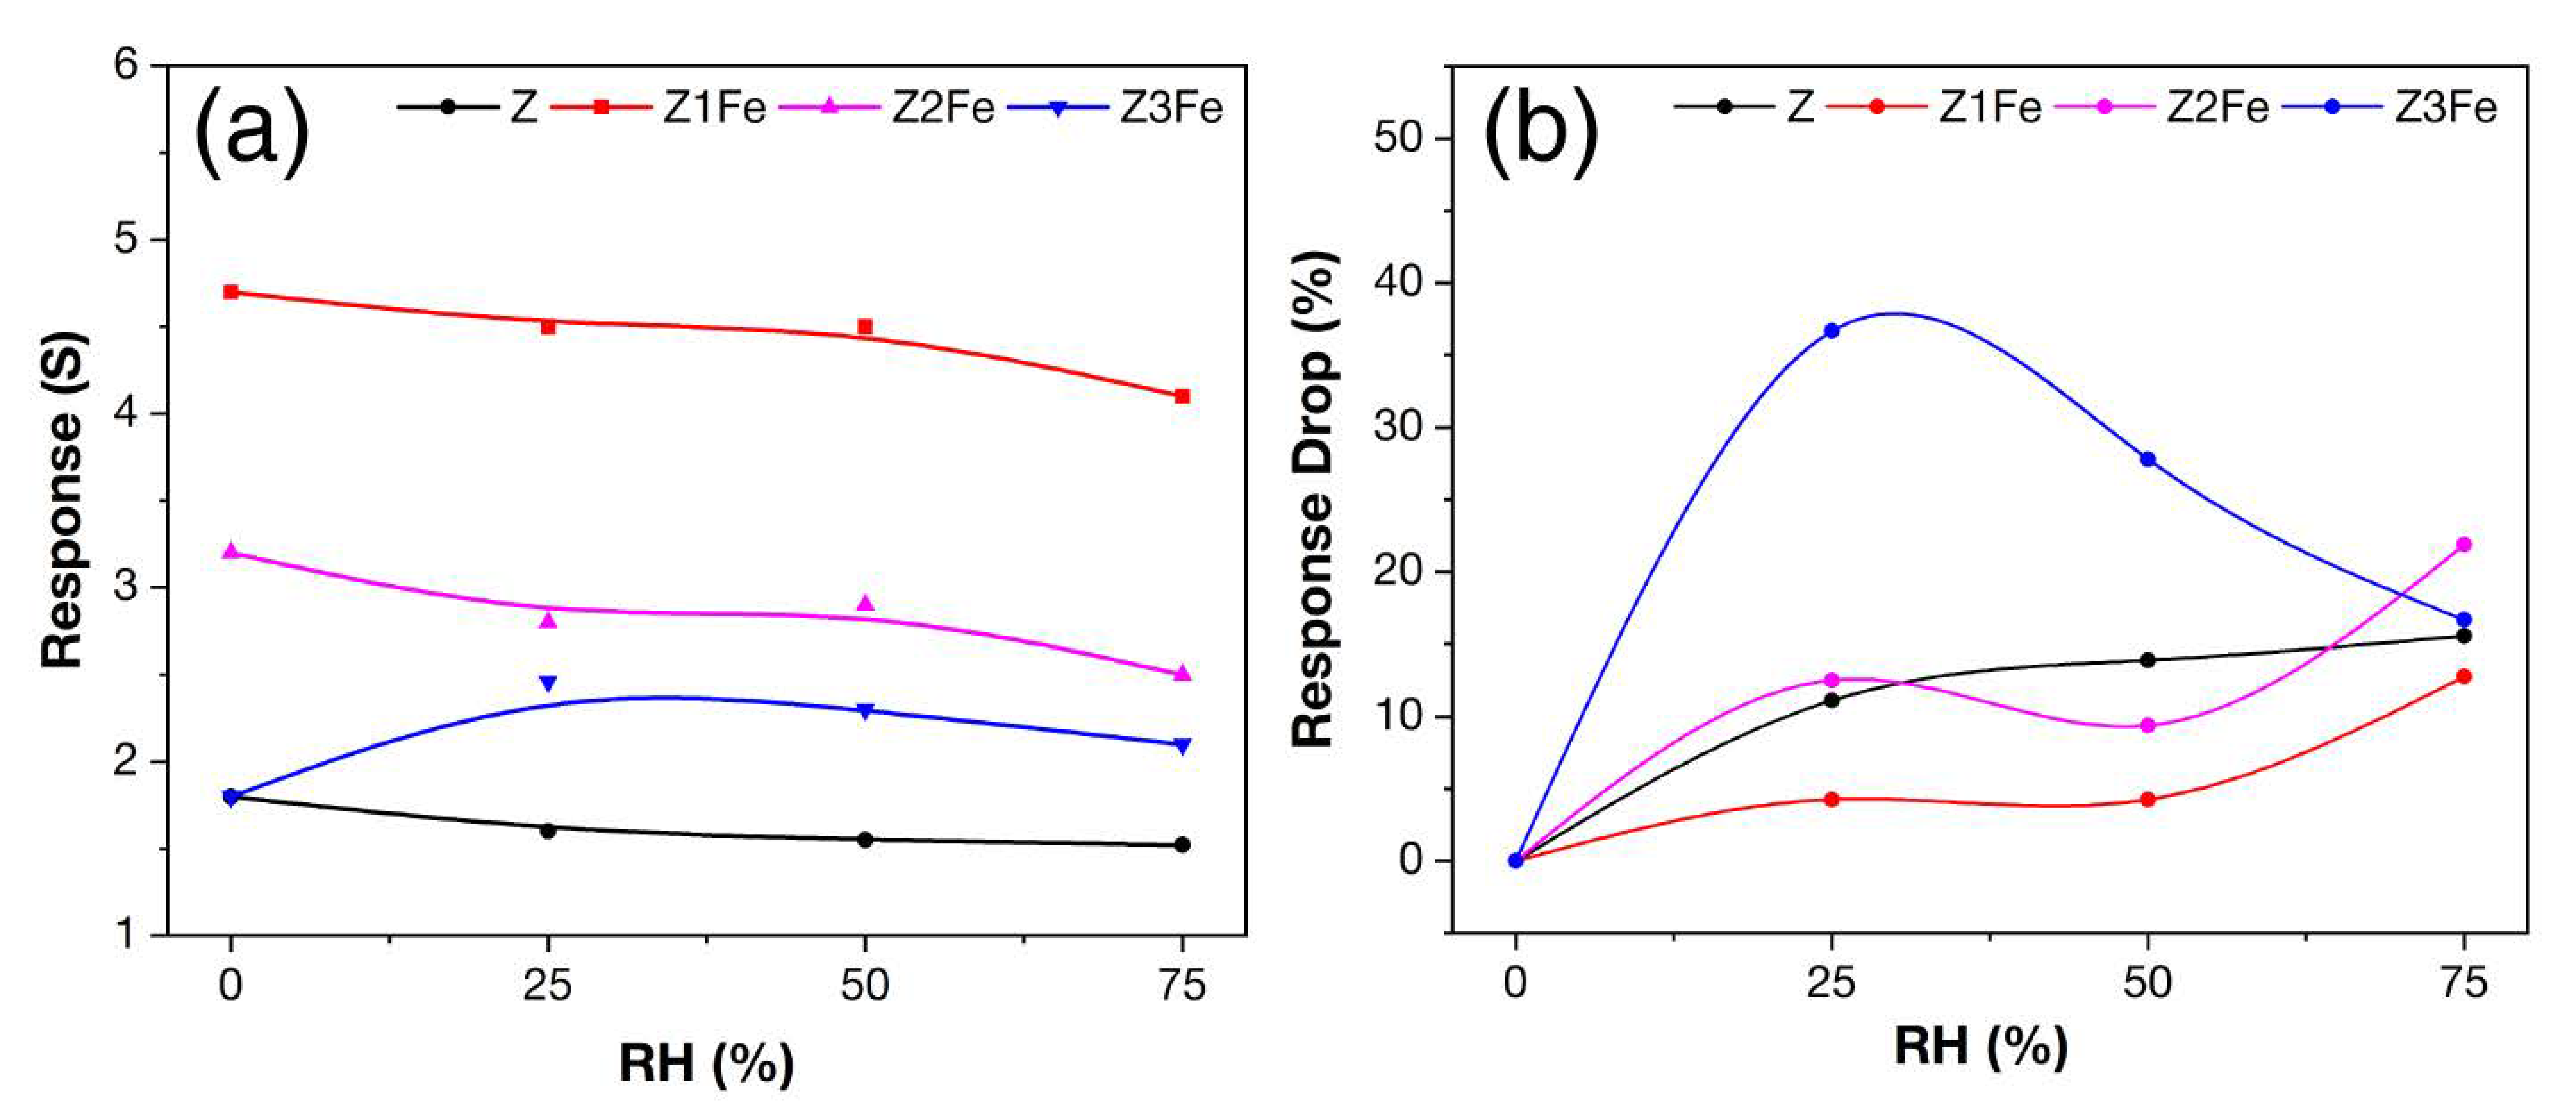
| Z | 0 | 40 | 66 | - | 174 | 3.26 | 1.3–4.0 | 1.2 | 11.1–15.6 | 143–180 |
| Z1Fe | 1.3 | 42 | 50 | - | 181 | 3.26 | 4.0–14.2 | 3.4 | 4.2–12.8 | 118–203 |
| Z2Fe | 4.8 | 30 | 51 | 23 | 185 | 3.23 | 1.9–6.1 | 1.7 | 9.3–21.9 | 121–160 |
| Z3Fe | 5.8 | 35 | - | 28 | 198 | 3.16 | 1.3–2.6 | 0.6 | 16.7–36.7 | 58–176 |
| Composition | Synthesis/Coating Method | Gas | Conc, ppm | Temp, °C | Response | Response Time (s) | Selectivity | Ref. |
|---|---|---|---|---|---|---|---|---|
| α-Fe2O3-ZnO | Hydrothermal method | NO2 | 10 | 300 | 6.34 | 26 | - | [67] |
| ZnO-Fe2O3 | Co-precipitation method | NO2 | 250 | 400 | 10.53 | 1000 | - | [68] |
| ZnFe2O4 nanosheets | Soaking, freeze-drying and calcination | Acetone | 50 | 220 | 64.9 | 23 | 1.6 | [69] |
| α- Fe2O3-ZnO core-shell nanowires | thermal oxidation/ ALD | H2S | 5 | 250 | 5.98 | 81 | 5.2 | [70] |
| Fe2O3-ZnO Nanograins | solid-state reaction method/RF magnetron sputtering | H2O2 | 1.5 | RT + UV | 12 | 91 | 4.9 | [71] |
| Fe2O3-ZnO | solid-state reaction method/RF magnetron sputtering | NH3 | 548 | 250 | 6 | ~70 | - | [72] |
| Fe2O3-ZnO | solid-state reaction method/RF magnetron sputtering | H2 | 2000 | 100 | 5045 | 372 | >40 | [73] |
| ZnO/α-Fe2O3 core-shell nanorods | chemical solution method/ionic-layer adsorption and reaction method | Ethanol | 400 | 240 | 39 | 8 | ~4.9 | [1] |
| ZnO-Fe2O3 | solvothermal method | Acetone | 100 | 290 | 29.9 | - | 1.4 | [24] |
| ZnO-Fe2O3 | thermal evaporation/solvothermal deposition | Ethanol | 2000 | 200 | ~70 | ~115 | - | [23] |
| tetrapod ZnO doped with Fe2O3 | flame transport synthesis/ annealing with Fe | Ethanol | 100 | RT | 51 | 2.5 | 20.4 | [25] |
| ZnO-Fe2O3 | vapor–liquid–solid process/sol–gel process | CO | 100 | 300 | 18.8 | ~200 | 3 | [26] |
| ZnO-Fe2O3 | AACVD | NO2 | 2 | 175 | 14.2 | 118 | 3.4 | This work |
Disclaimer/Publisher’s Note: The statements, opinions and data contained in all publications are solely those of the individual author(s) and contributor(s) and not of MDPI and/or the editor(s). MDPI and/or the editor(s) disclaim responsibility for any injury to people or property resulting from any ideas, methods, instructions or products referred to in the content. |
© 2023 by the authors. Licensee MDPI, Basel, Switzerland. This article is an open access article distributed under the terms and conditions of the Creative Commons Attribution (CC BY) license (https://creativecommons.org/licenses/by/4.0/).
Share and Cite
Mokrushin, A.S.; Gorban, Y.M.; Averin, A.A.; Gorobtsov, P.Y.; Simonenko, N.P.; Lebedinskii, Y.Y.; Simonenko, E.P.; Kuznetsov, N.T. Obtaining of ZnO/Fe2O3 Thin Nanostructured Films by AACVD for Detection of ppb-Concentrations of NO2 as a Biomarker of Lung Infections. Biosensors 2023, 13, 445. https://doi.org/10.3390/bios13040445
Mokrushin AS, Gorban YM, Averin AA, Gorobtsov PY, Simonenko NP, Lebedinskii YY, Simonenko EP, Kuznetsov NT. Obtaining of ZnO/Fe2O3 Thin Nanostructured Films by AACVD for Detection of ppb-Concentrations of NO2 as a Biomarker of Lung Infections. Biosensors. 2023; 13(4):445. https://doi.org/10.3390/bios13040445
Chicago/Turabian StyleMokrushin, Artem S., Yulia M. Gorban, Aleksey A. Averin, Philipp Yu. Gorobtsov, Nikolay P. Simonenko, Yury Yu. Lebedinskii, Elizaveta P. Simonenko, and Nikolay T. Kuznetsov. 2023. "Obtaining of ZnO/Fe2O3 Thin Nanostructured Films by AACVD for Detection of ppb-Concentrations of NO2 as a Biomarker of Lung Infections" Biosensors 13, no. 4: 445. https://doi.org/10.3390/bios13040445