Estradiol Detection for Aquaculture Exploiting Plasmonic Spoon-Shaped Biosensors

 ,
,  ,
,  and
and 
Abstract
:1. Introduction
2. Materials and Methods
2.1. Chemicals
2.2. SPR Sensor Platform Fabrication
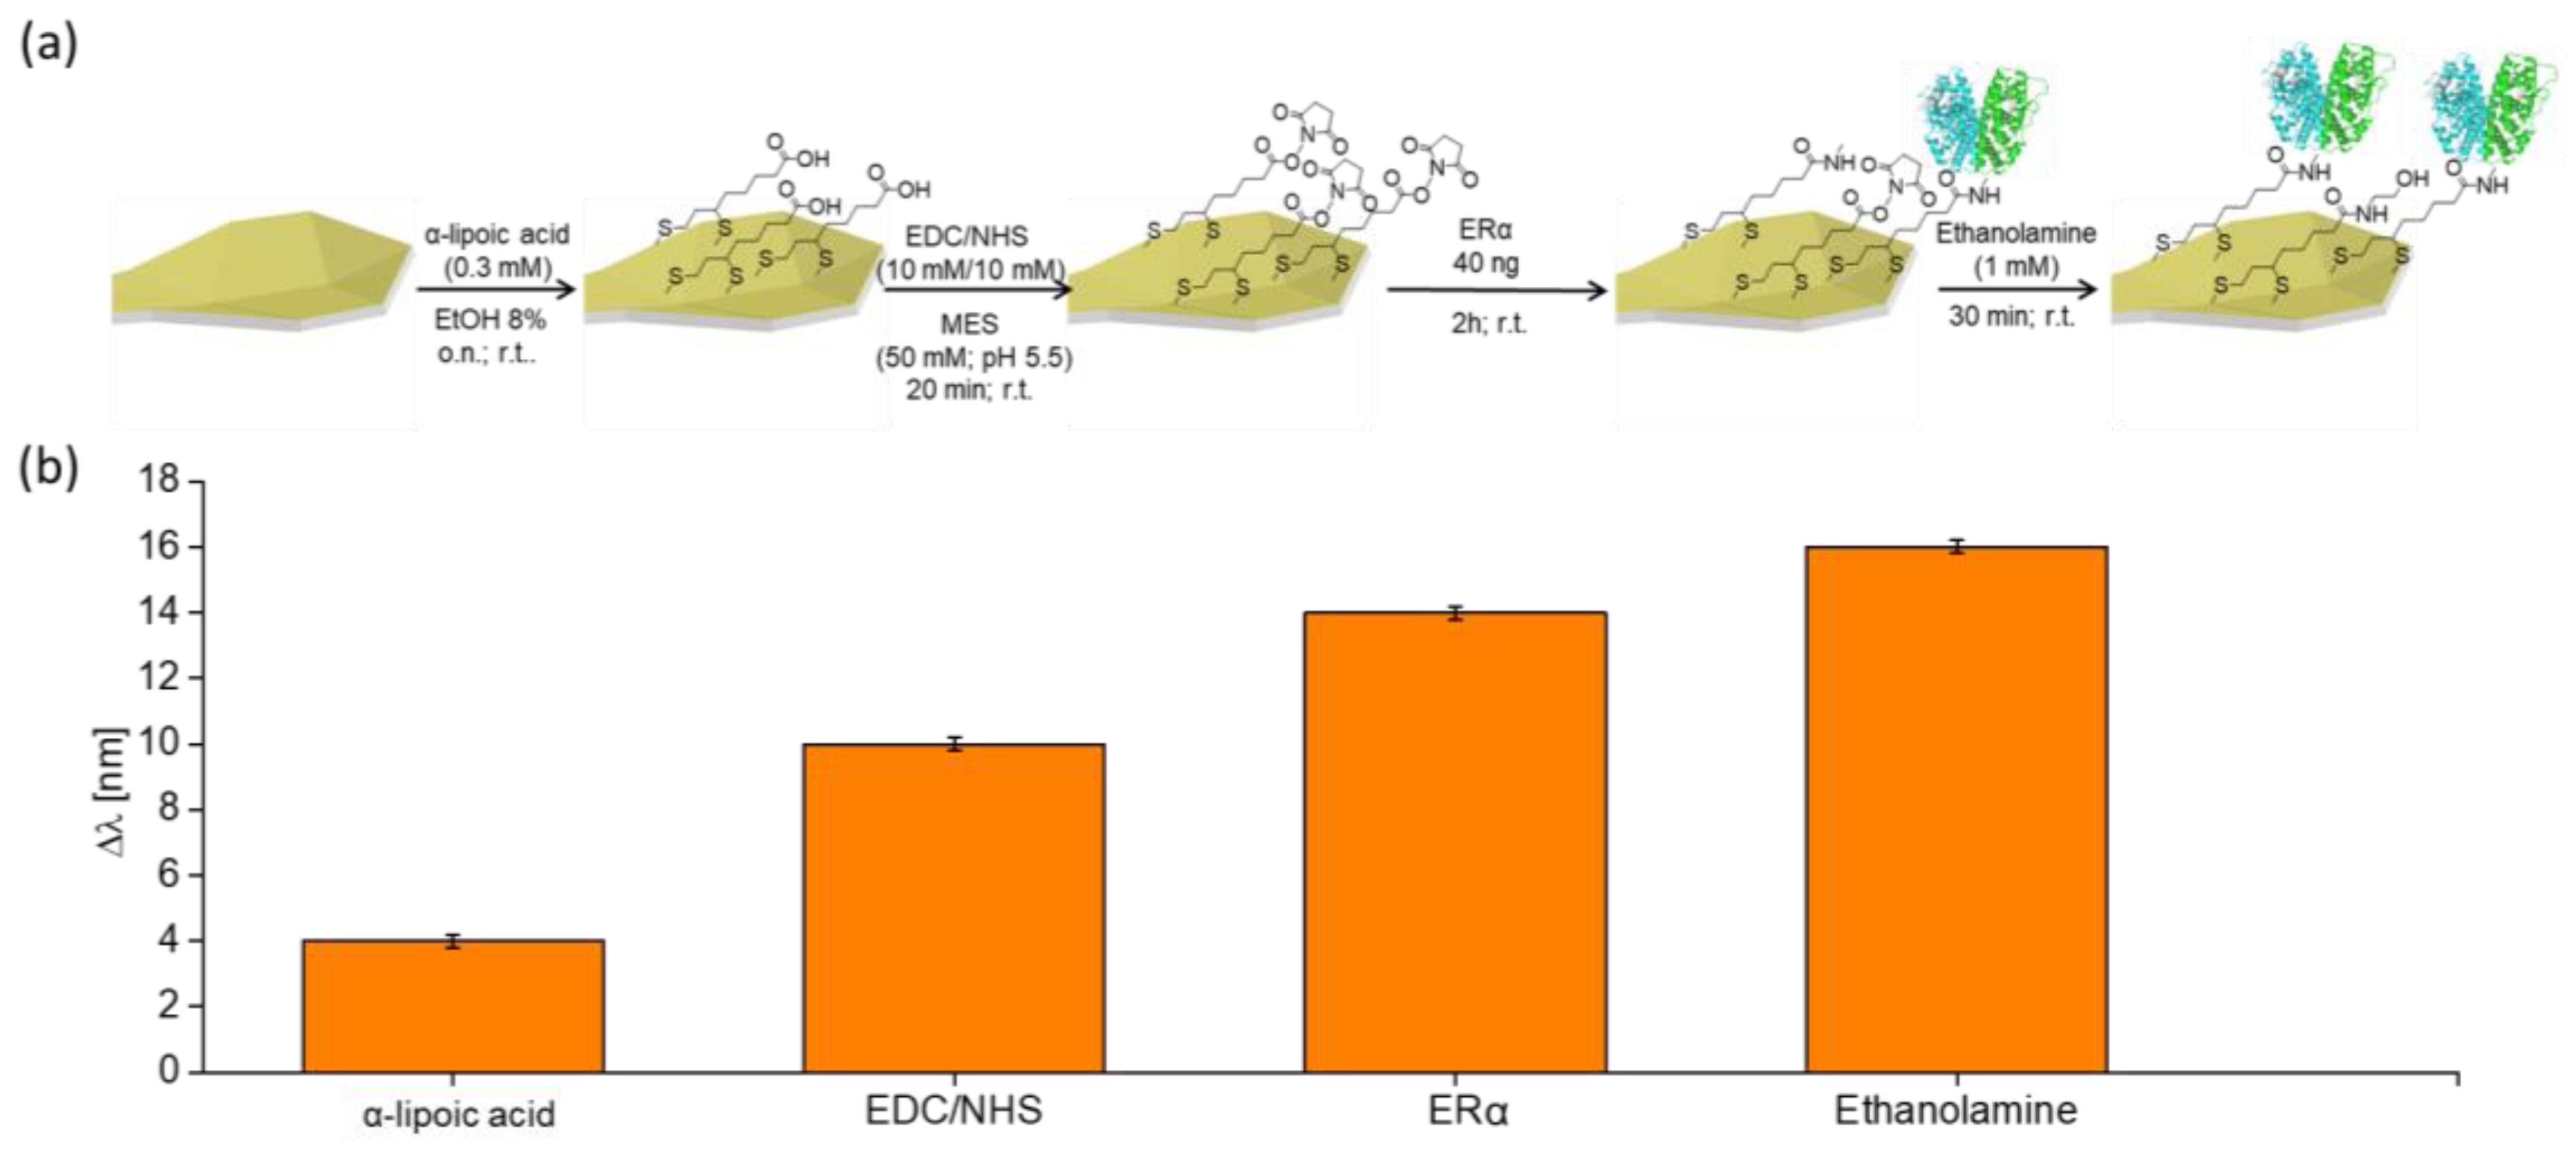
2.3. ERα Functionalization Protocol
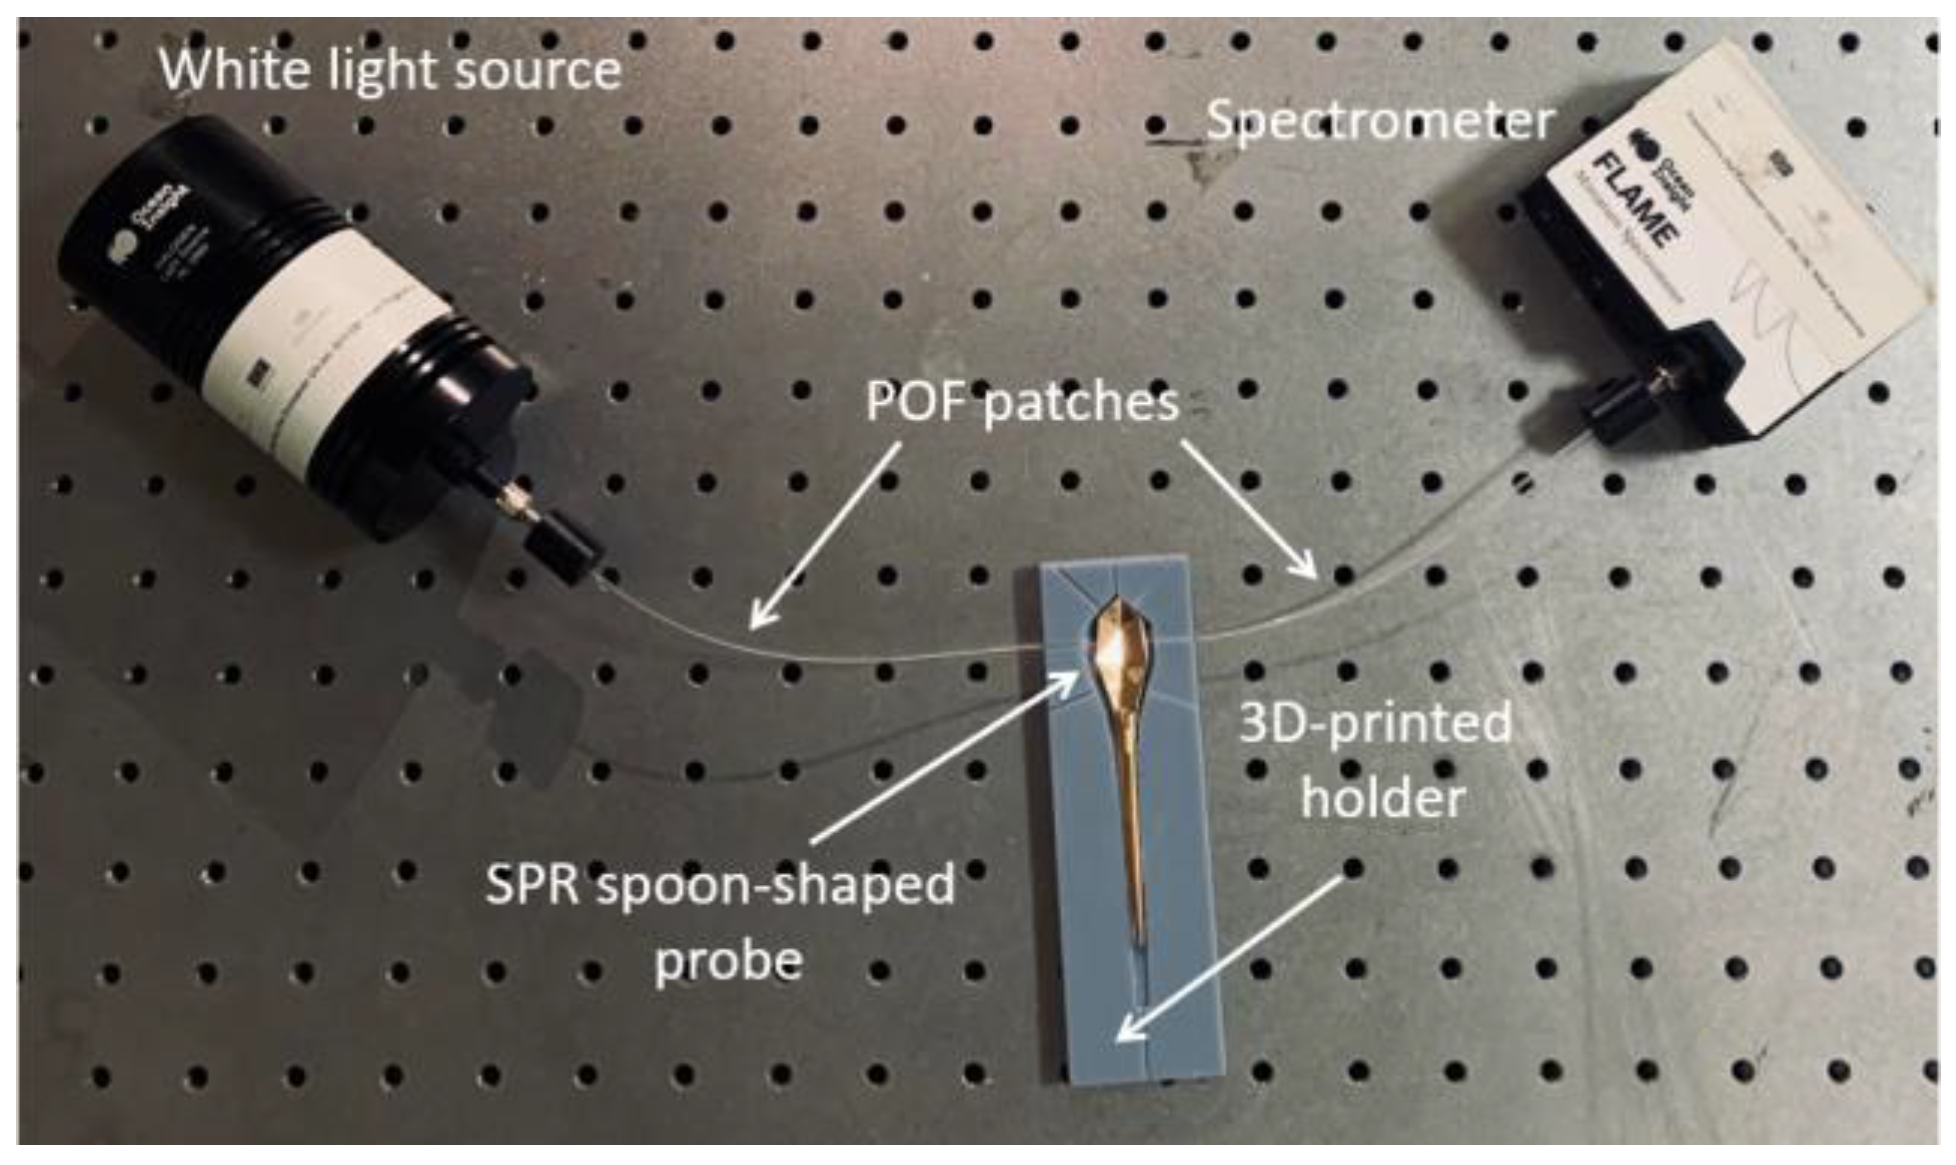
2.4. Experimental Setup
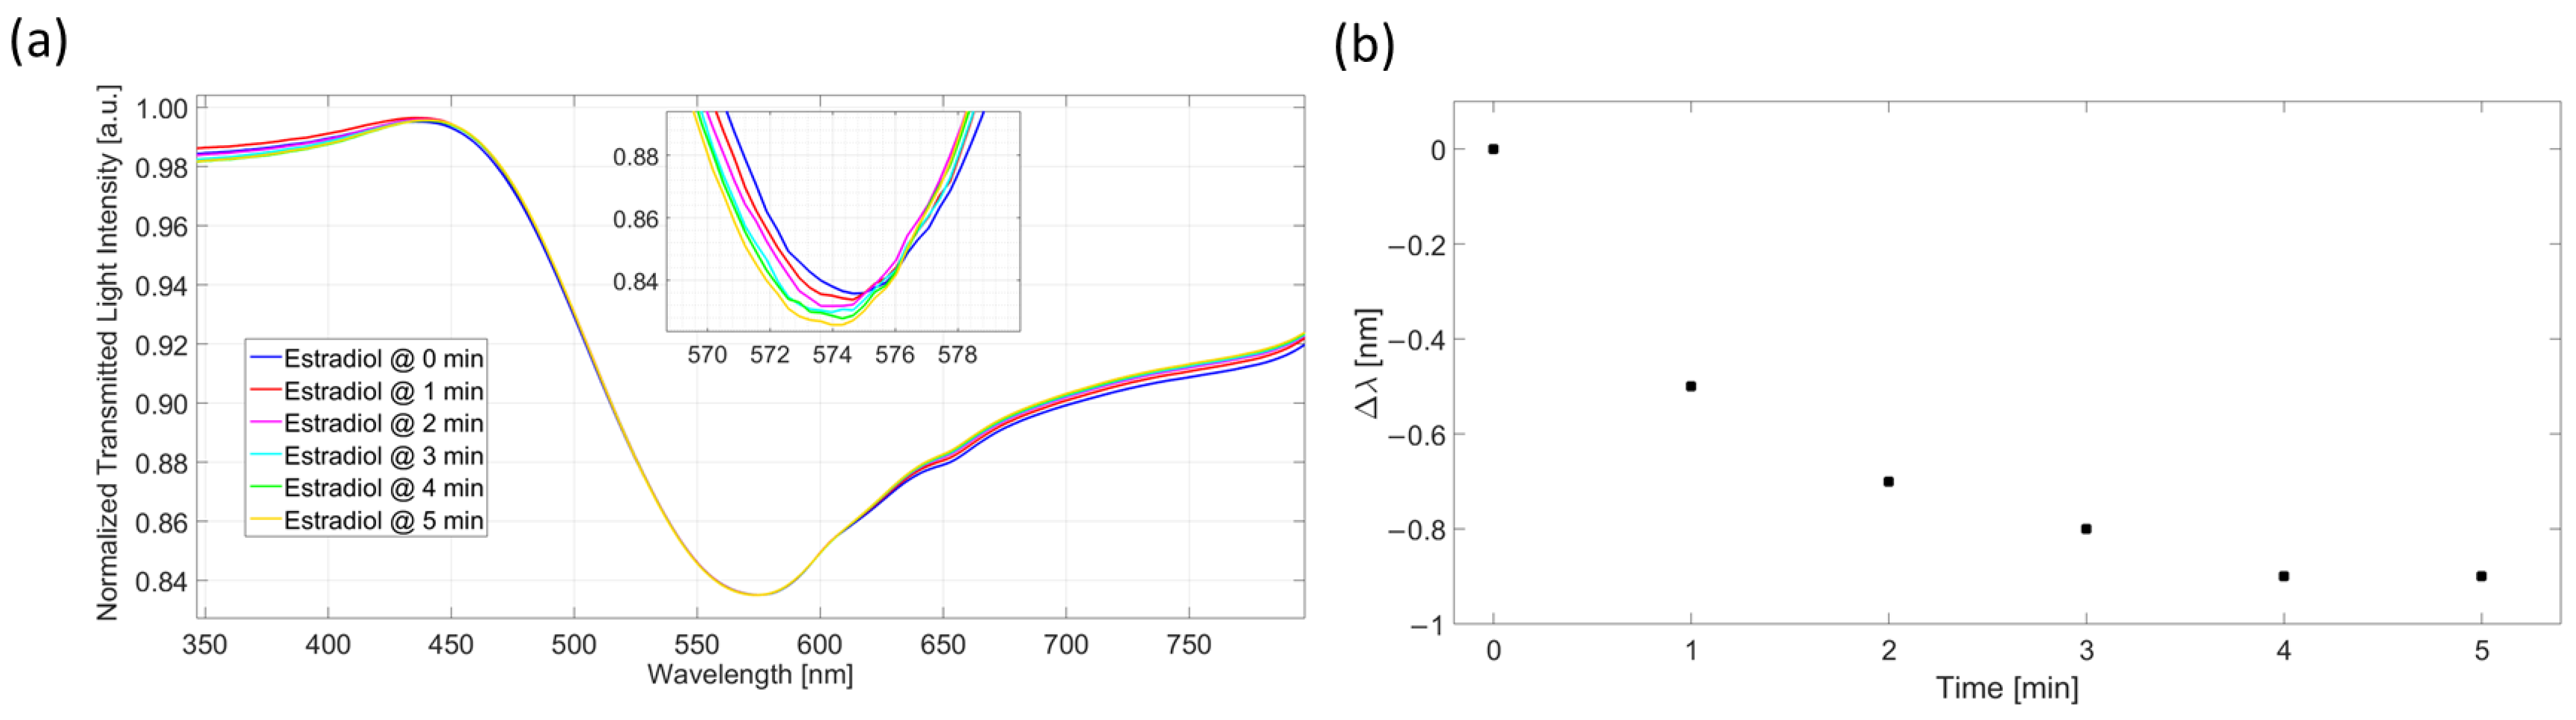
2.5. Measurements Procedure
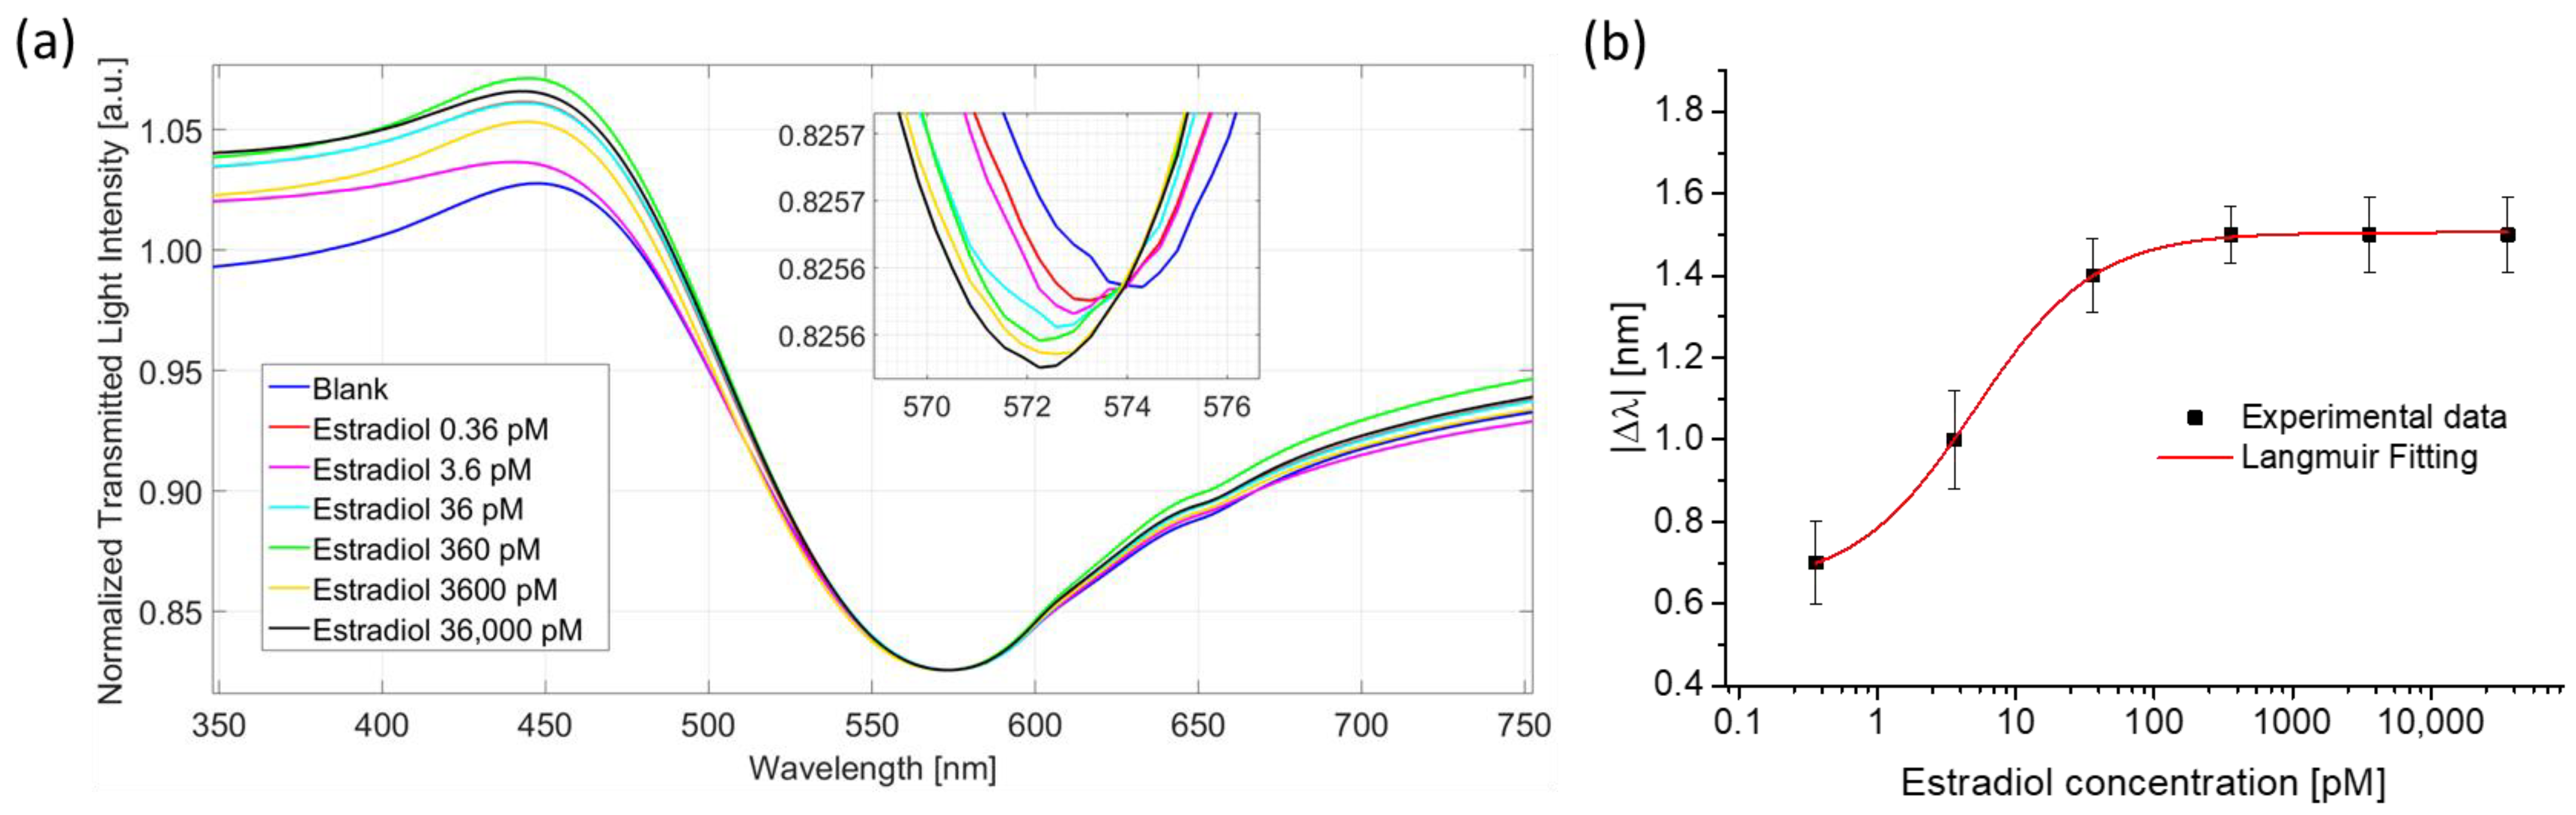
3. Results and Discussion
4. Conclusions
Author Contributions
Funding
Institutional Review Board Statement
Informed Consent Statement
Data Availability Statement
Acknowledgments
Conflicts of Interest
References
- Nilsson, S.; Mäkelä, S.; Treuter, E.; Tujague, M.; Thomsen, J.; Andersson, G.; Enmark, E.; Pettersson, K.; Warner, M.; Gustafsson, J.-Å. Mechanisms of Estrogen Action. Physiol. Rev. 2001, 81, 1535–1565. [Google Scholar] [CrossRef] [PubMed]
- MohanKumar, S.M.J.; Balasubramanian, P.; Subramanian, M.; MohanKumar, P.S. Chronic Estradiol Exposure-Harmful Effects on Behavior, Cardiovascular and Reproductive Functions. Reproduction 2018, 156, R169–R186. [Google Scholar] [CrossRef] [Green Version]
- Moore, S.C.; Matthews, C.E.; Ou Shu, X.; Yu, K.; Gail, M.H.; Xu, X.; Ji, B.-T.; Chow, W.-H.; Cai, Q.; Li, H.; et al. Endogenous Estrogens, Estrogen Metabolites, and Breast Cancer Risk in Postmenopausal Chinese Women. JNCI J. Natl. Cancer Inst. 2016, 108, djw103. [Google Scholar] [CrossRef] [PubMed] [Green Version]
- Piferrer, F. Endocrine sex control strategies for the feminization of teleost fish. Aquaculture 2001, 197, 229–281. [Google Scholar] [CrossRef]
- Adeel, M.; Song, X.; Wang, Y.; Francis, D.; Yang, Y. Environmental Impact of Estrogens on Human, Animal and Plant Life: A Critical Review. Environ. Int. 2017, 99, 107–119. [Google Scholar] [CrossRef]
- You, H.H.; Song, G. Review of Endocrine Disruptors on Male and Female Reproductive Systems. Comp. Biochem. Physiol. Part-C Toxicol. Pharmacol. 2021, 244, 109002. [Google Scholar] [CrossRef]
- Jeong, S.-H.; Kang, D.-J.; Lim, M.-W.; Kang, C.-S.; Sung, H.-J. Risk Assessment of Growth Hormones and Antimicrobial Residues in Meat. Toxicol. Res. 2010, 26, 301–313. [Google Scholar] [CrossRef] [PubMed]
- López-Roldán, P.; López de Alda, M.J.; Barceló, D. Simultaneous determination of selected endocrine disrupters (pesticides, phenols and phthalates) in water by in-field solid-phase extraction (SPE) using the prototype PROFEXS followed by on-line SPE (PROSPEKT) and analysis by liquid chromatography-atmospheric pressure chemical ionization-mass spectrometry. Anal. Bioanal. Chem. 2004, 378, 599–609. [Google Scholar]
- Rodriguez-Mozaz, S.; Lopez de Alda, M.J.; Barceló, D. Picogram per Liter Level Determination of Estrogens in Natural Waters and Waterworks by a Fully Automated On-Line Solid-Phase Extraction-Liquid Chromatography-Electrospray Tandem Mass Spectrometry Method. Anal. Chem. 2004, 76, 6998–7006. [Google Scholar] [CrossRef]
- Habauzit, D.; Armengaud, J.; Roig, B.; Chopineau, J. Determination of Estrogen Presence in Water by SPR Using Estrogen Receptor Dimerization. Anal. Bioanal. Chem. 2007, 390, 873–883. [Google Scholar] [CrossRef]
- Locatelli, M.; Sciascia, F.; Cifelli, R.; Malatesta, L.; Bruni, P.; Croce, F. Analytical Methods for the Endocrine Disruptor Compounds Determination in Environmental Water Samples. J. Chromatogr. A 2016, 1434, 1–18. [Google Scholar] [CrossRef]
- Homola, J. Surface Plasmon Resonance Sensors for Detection of Chemical and Biological Species. Chem. Rev. 2008, 108, 462–493. [Google Scholar] [CrossRef]
- Nguyen, H.H.; Park, J.; Kang, S.; Kim, M. Surface Plasmon Resonance: A Versatile Technique for Biosensor Applications. Sensors 2015, 15, 10481–10510. [Google Scholar] [CrossRef] [Green Version]
- Cennamo, N.; D’Agostino, G.; Porto, G.; Biasiolo, A.; Perri, C.; Arcadio, F.; Zeni, L. A Molecularly Imprinted Polymer on a Plasmonic Plastic Optical Fiber to Detect Perfluorinated Compounds in Water. Sensors 2018, 18, 1836. [Google Scholar] [CrossRef] [Green Version]
- Sharma, S.; Usha, S.P.; Shrivastav, A.M.; Gupta, B.D. A Novel Method of SPR Based SnO2: GNP Nano-Hybrid Decorated Optical Fiber Platform for Hexachlorobenzene Sensing. Sens. Actuat. B-Chem. 2017, 246, 927–936. [Google Scholar] [CrossRef]
- Cai, S.; Pan, H.; González-Vila, Á.; Guo, T.; Gillan, D.C.; Wattiez, R.; Caucheteur, C. Selective Detection of Cadmium Ions Using Plasmonic Optical Fiber Gratings Functionalized with Bacteria. Opt. Express 2020, 28, 19740. [Google Scholar] [CrossRef]
- Arcadio, F.; Seggio, M.; Del Prete, D.; Buonanno, G.; Mendes, J.; Coelho, L.C.C.; Jorge, P.A.S.; Zeni, L.; Bossi, A.M.; Cennamo, N. A Plasmonic Biosensor Based on Light-Diffusing Fibers Functionalized with Molecularly Imprinted Nanoparticles for Ultralow Sensing of Proteins. Nanomaterials 2022, 12, 1400. [Google Scholar] [CrossRef]
- Ribaut, C.; Loyez, M.; Larrieu, J.-C.; Chevineau, S.; Lambert, P.; Remmelink, M.; Wattiez, R.; Caucheteur, C. Cancer Biomarker Sensing Using Packaged Plasmonic Optical Fiber Gratings: Towards in Vivo Diagnosis. Biosens. Bioelectron. 2017, 92, 449–456. [Google Scholar] [CrossRef]
- Lobry, M.; Lahem, D.; Loyez, M.; Debliquy, M.; Chah, K.; David, M.; Caucheteur, C. Non-Enzymatic D-Glucose Plasmonic Optical Fiber Grating Biosensor. Biosens. Bioelectron. 2019, 142, 111506. [Google Scholar] [CrossRef] [PubMed] [Green Version]
- Gupta, B.D.; Verma, R.K. Surface Plasmon Resonance-Based Fiber Optic Sensors: Principle, Probe Designs, and Some Applications. J. Sens. 2009, 2009, 979761. [Google Scholar] [CrossRef] [Green Version]
- Klantsataya, E.; Jia, P.; Ebendorff-Heidepriem, H.; Monro, T.; François, A. Plasmonic Fiber Optic Refractometric Sensors: From Conventional Architectures to Recent Design Trends. Sensors 2016, 17, 12. [Google Scholar] [CrossRef] [PubMed] [Green Version]
- Martínez-Hernández, M.E.; Rivero, P.J.; Goicoechea, J.; Arregui, F.J. Trends in the Implementation of Advanced Plasmonic Materials in Optical Fiber Sensors (2010–2020). Chemosensors 2021, 9, 64. [Google Scholar] [CrossRef]
- Agrawal, N.; Saha, C.; Kumar, C.; Singh, R.; Zhang, B.; Kumar, S. Development of Uric Acid Sensor Using Copper Oxide and Silver Nanoparticles Immobilized SMSMS Fiber Structure-Based Probe. IEEE Trans. Instrum. Meas. 2020, 69, 9097–9104. [Google Scholar] [CrossRef]
- Huang, Y.; Wang, Y.; Xu, G.; Rao, X.; Zhang, J.; Wu, X.; Liao, C.; Wang, Y. Compact Surface Plasmon Resonance IgG Sensor Based on H-Shaped Optical Fiber. Biosensors 2022, 12, 141. [Google Scholar] [CrossRef] [PubMed]
- Kumar, S.; Singh, R.; Yang, Q.; Cheng, S.; Zhang, B.; Kaushik, B.K. Highly Sensitive, Selective and Portable Sensor Probe Using Germanium-Doped Photosensitive Optical Fiber for Ascorbic Acid Detection. IEEE Sens. J. 2020, 21, 62–70. [Google Scholar] [CrossRef]
- Cheskis, B.J.; Karathanasis, S.; Lyttle, C.R. Estrogen receptor ligands modulate its interaction with DNA. J. Biol. Chem. 1997, 272, 11384–11391. [Google Scholar] [CrossRef] [Green Version]
- Cennamo, N.; Arcadio, F.; Seggio, M.; Maniglio, D.; Zeni, L.; Bossi, A.M. Spoon-Shaped Polymer Waveguides to Excite Multiple Plasmonic Phenomena: A Multisensor Based on Antibody and Molecularly Imprinted Nanoparticles to Detect Albumin Concentrations over Eight Orders of Magnitude. Biosens. Bioelectron. 2022, 217, 114707. [Google Scholar] [CrossRef]
- Pasquardini, L.; Cennamo, N.; Malleo, G.; Vanzetti, L.; Zeni, L.; Bonamini, D.; Salvia, R.; Bassi, C.; Bossi, A.M. A Surface Plasmon Resonance Plastic Optical Fiber Biosensor for the Detection of Pancreatic Amylase in Surgically-Placed Drain Effluent. Sensors 2021, 21, 3443. [Google Scholar] [CrossRef]
- Lin, A.H.Y.; Li, R.W.S.; Ho, E.Y.W.; Leung, G.P.H.; Leung, S.W.S.; Vanhoutte, P.M.; Man, R.Y.K. Differential Ligand Binding Affinities of Human Estrogen Receptor-α Isoforms. PLoS ONE 2013, 8, e63199. [Google Scholar] [CrossRef] [Green Version]
- Celik, L.; Lund, J.D.; Schiøtt, B. Conformational dynamics of the estrogen receptor α: molecular dynamics simulations of the influence of binding site structure on protein dynamics. Biochemistry 2007, 46, 1743–1758. [Google Scholar] [CrossRef]
- Zeni, L.; Perri, C.; Cennamo, N.; Arcadio, F.; D’Agostino, G.; Salmona, M.; Beeg, M.; Gobbi, M. A Portable Optical-Fibre-Based Surface Plasmon Resonance Biosensor for the Detection of Therapeutic Antibodies in Human Serum. Sci. Rep. 2020, 10, 11154. [Google Scholar] [CrossRef] [PubMed]
- Bencivenga, D.; Arcadio, F.; Piccirillo, A.; Annunziata, M.; Della Ragione, F.; Cennamo, N.; Borriello, A.; Zeni, L.; Guida, L. Plasmonic Optical Fiber Biosensor Development for Point-of-Care Detection of Malondialdehyde as a Biomarker of Oxidative Stress. Free Radic. Biol. Med. 2023, 199, 177–188. [Google Scholar] [CrossRef]
- Thompson, M.; Ellison, S.L.R.; Wood, R. Harmonized Guidelines for Single-Laboratory Validation of Methods of Analysis (IUPAC Technical Report). Pure Appl. Chem. 2002, 74, 835–855. [Google Scholar] [CrossRef]
- Liu, L.; Zhang, X.; Zhu, Q.; Li, K.; Lu, Y.; Zhou, X.; Guo, T. Ultrasensitive Detection of Endocrine Disruptors via Superfine Plasmonic Spectral Combs. Light Sci. Appl. 2021, 10, 181. [Google Scholar] [CrossRef]
- La Spina, R.; Ferrero, V.E.V.; Aiello, V.; Pedotti, M.; Varani, L.; Lettieri, T.; Calzolai, L.; Haasnoot, W.; Colpo, P. Label-Free Biosensor Detection of Endocrine Disrupting Compounds Using Engineered Estrogen Receptors. Biosensors 2018, 8, 1. [Google Scholar] [CrossRef] [PubMed] [Green Version]
- Kumbhat, S.; Gehlot, R.; Sharma, K.; Singh, U.; Joshi, V. Surface Plasmon Resonance Based Indirect Immunoassay for Detection of 17β-Estradiol. J. Pharm. Biomed. Anal. 2019, 163, 211–216. [Google Scholar] [CrossRef] [PubMed]
- Tan, Y.; Wei, T. Detection of 17β-Estradiol in Water Samples by a Novel Double-Layer Molecularly Imprinted Film-Based Biosensor. Talanta 2015, 141, 279–287. [Google Scholar] [CrossRef]
- Jia, Y.; Peng, Y.; Bai, J.; Zhang, X.; Cui, Y.; Ning, B.; Cui, J.; Gao, Z. Magnetic Nanoparticle Enhanced Surface Plasmon Resonance Sensor for Estradiol Analysis. Sens. Actuat. B Chem. 2018, 254, 629–635. [Google Scholar] [CrossRef]


| ER–SPR Spoon-Shaped | ∆λ0 [nm] | ∆λmax [nm] | K [pM] | Statistics | |
|---|---|---|---|---|---|
| Reduced χ2 | Adj. R2 | ||||
| In PBS | 0.64 ± 0.01 | 1.51 ± 0.01 | 5.05 ± 0.24 | 0.01 | 0.999 |
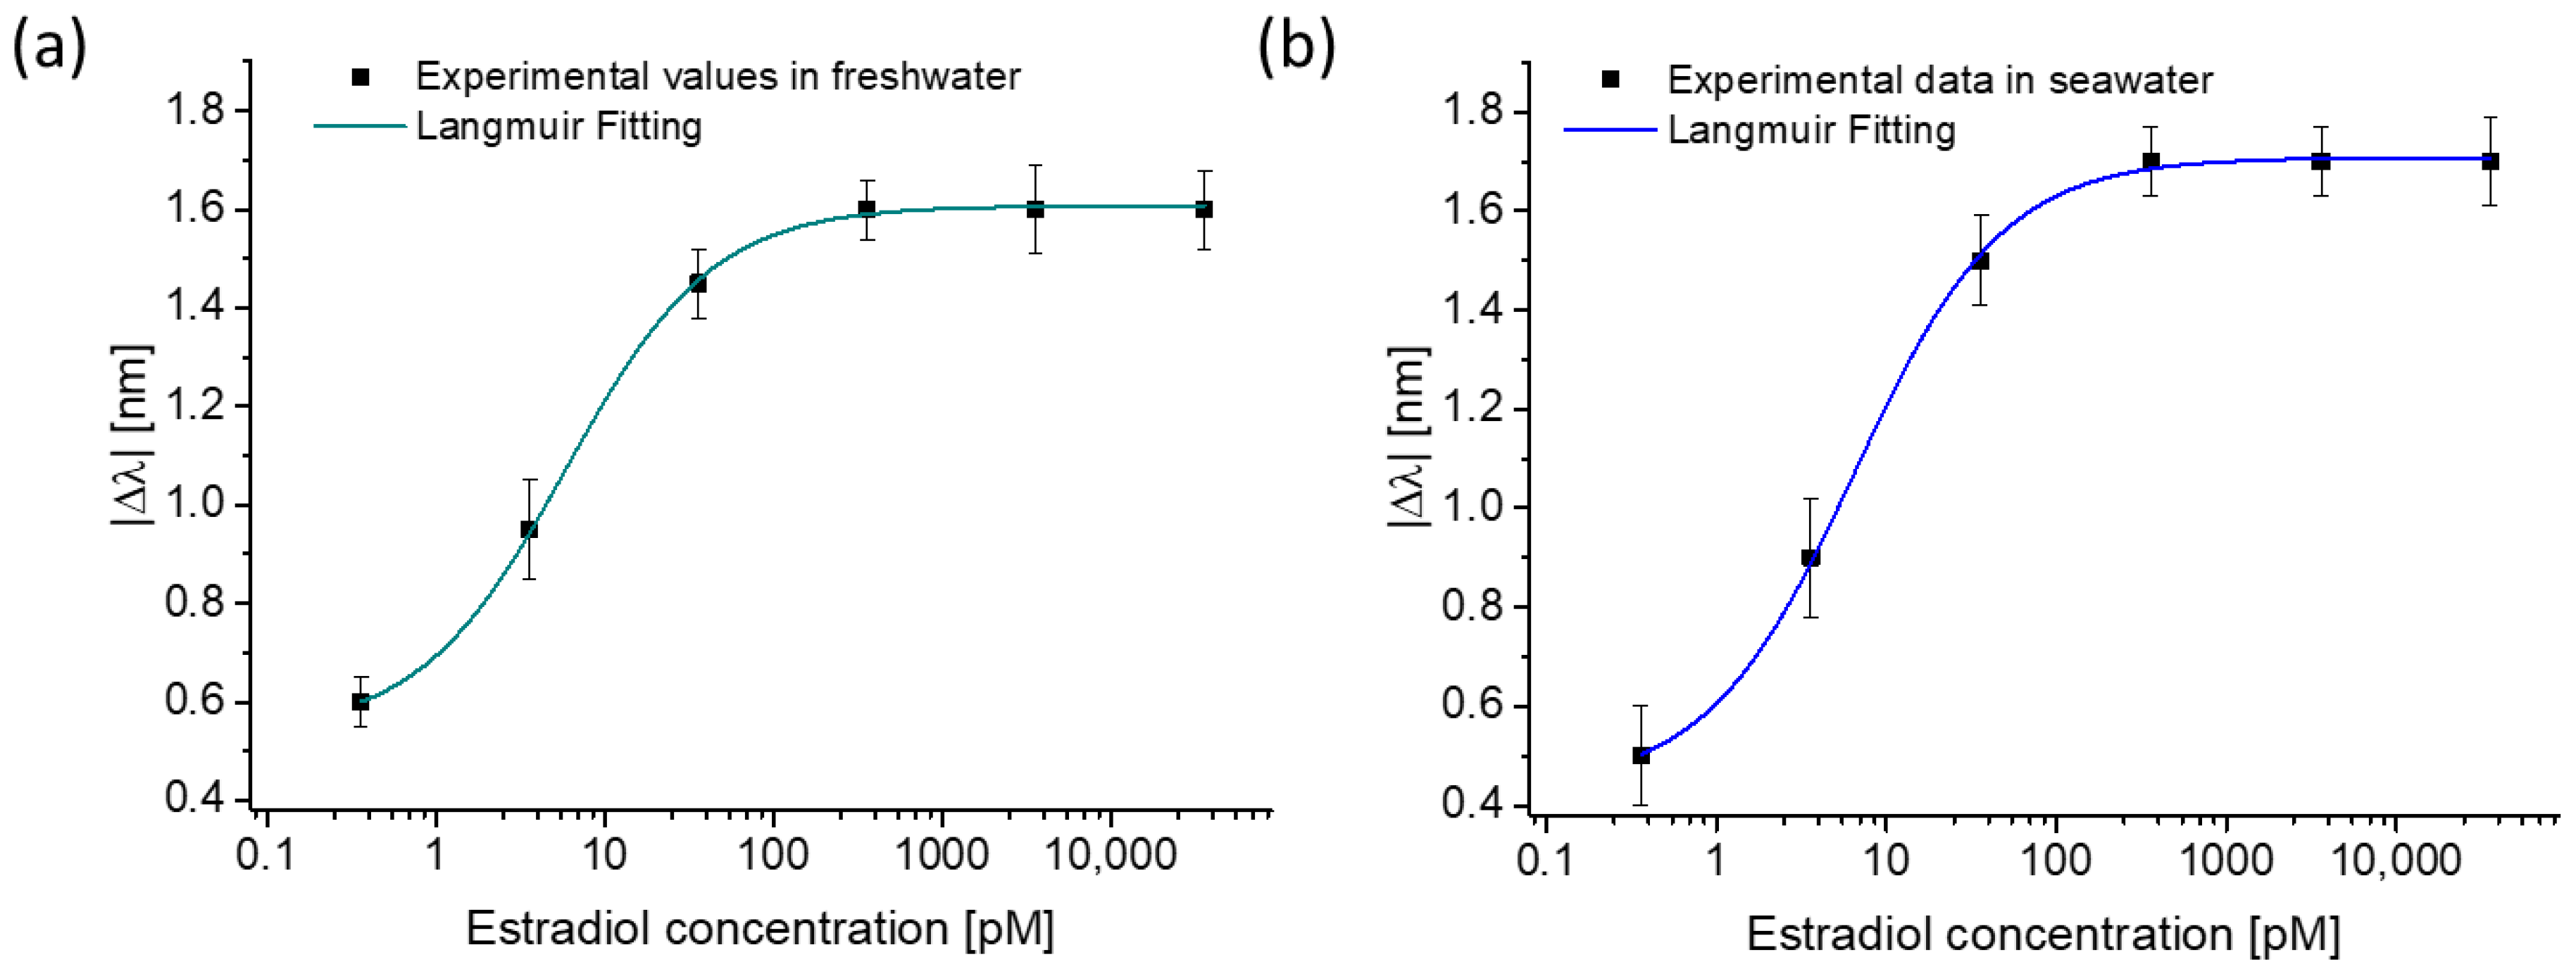
| In freshwater | 0.55 ± 0.01 | 1.62 ± 0.01 | 5.89 ± 0.33 | 0.02 | 0.999 |
| In simulated seawater | 0.43 ± 0.02 | 1.70 ± 0.01 | 6.50 ± 0.50 | 0.03 | 0.999 |
| ER–SPR Spoon-Shaped | Sensitivity at Low Concentration (|Δλmax|/K) | LOD * (3 × Standard Deviation of Blank (Δλ0)/Sensitivity at Low Concentration) | Kaff (1/K) |
|---|---|---|---|
| In PBS | 0.299 nm/pM | 0.10 pM | 0.198 pM−1 |
| In freshwater | 0.275 nm/pM | 0.11 pM | 0.170 pM−1 |
| In simulated seawater | 0.261 nm/pM | 0.23 pM | 0.154 pM−1 |
| Transducer | Receptor | LOD [pM] | Reference |
|---|---|---|---|
| highly tilted fiber Bragg grating | hERα ligand-binding domain | 5.4 | [34] |
| commercial SPR chip | ERα combined with conformation-sensitive peptides | 1000 | [35] |
| commercial SPR chip | 11-MUA/E2-BSA conjugate vs. Ab-E2 | 3.6 | [36] |
| commercial SPR chip | Molecularly Imprinted Polymer (MIP) | 0.25 | [37] |
| commercial SPR chip | Antibody combined with magnetic nanoparticles | 292 | [38] |
| spoon-shaped waveguides | ERα | 0.1 | This work |
Disclaimer/Publisher’s Note: The statements, opinions and data contained in all publications are solely those of the individual author(s) and contributor(s) and not of MDPI and/or the editor(s). MDPI and/or the editor(s) disclaim responsibility for any injury to people or property resulting from any ideas, methods, instructions or products referred to in the content. |
© 2023 by the authors. Licensee MDPI, Basel, Switzerland. This article is an open access article distributed under the terms and conditions of the Creative Commons Attribution (CC BY) license (https://creativecommons.org/licenses/by/4.0/).
Share and Cite
Arcadio, F.; Seggio, M.; Zeni, L.; Bossi, A.M.; Cennamo, N. Estradiol Detection for Aquaculture Exploiting Plasmonic Spoon-Shaped Biosensors. Biosensors 2023, 13, 432. https://doi.org/10.3390/bios13040432
Arcadio F, Seggio M, Zeni L, Bossi AM, Cennamo N. Estradiol Detection for Aquaculture Exploiting Plasmonic Spoon-Shaped Biosensors. Biosensors. 2023; 13(4):432. https://doi.org/10.3390/bios13040432
Chicago/Turabian StyleArcadio, Francesco, Mimimorena Seggio, Luigi Zeni, Alessandra Maria Bossi, and Nunzio Cennamo. 2023. "Estradiol Detection for Aquaculture Exploiting Plasmonic Spoon-Shaped Biosensors" Biosensors 13, no. 4: 432. https://doi.org/10.3390/bios13040432