Mental Stress Detection Using a Wearable In-Ear Plethysmography


Abstract
:1. Introduction
- The design and development of an ear-mounted wearable biosensor for the detection of mental stress.
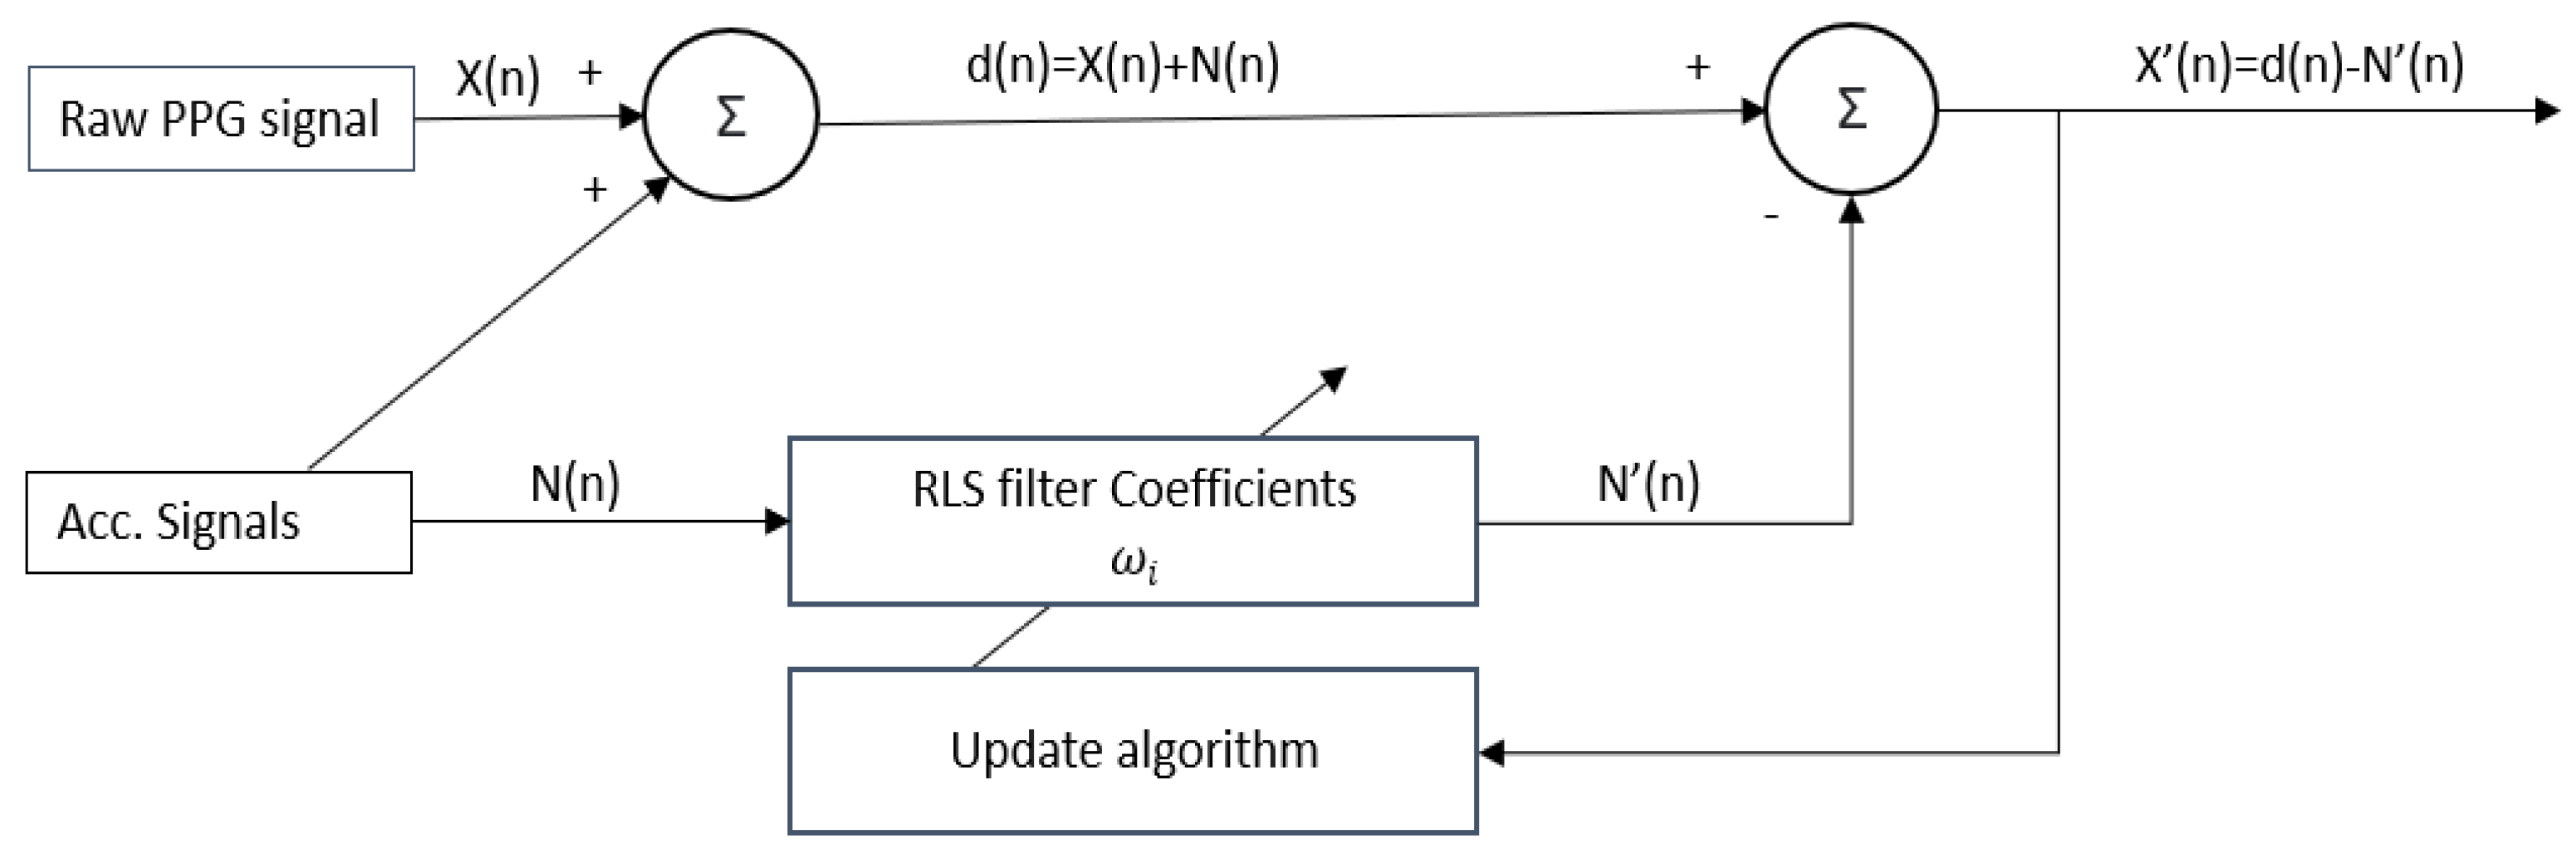
- Development of a motion artifact reduction method that employs an adaptive recursive least squares (RLS) filter in conjunction with a dynamic reference signal.
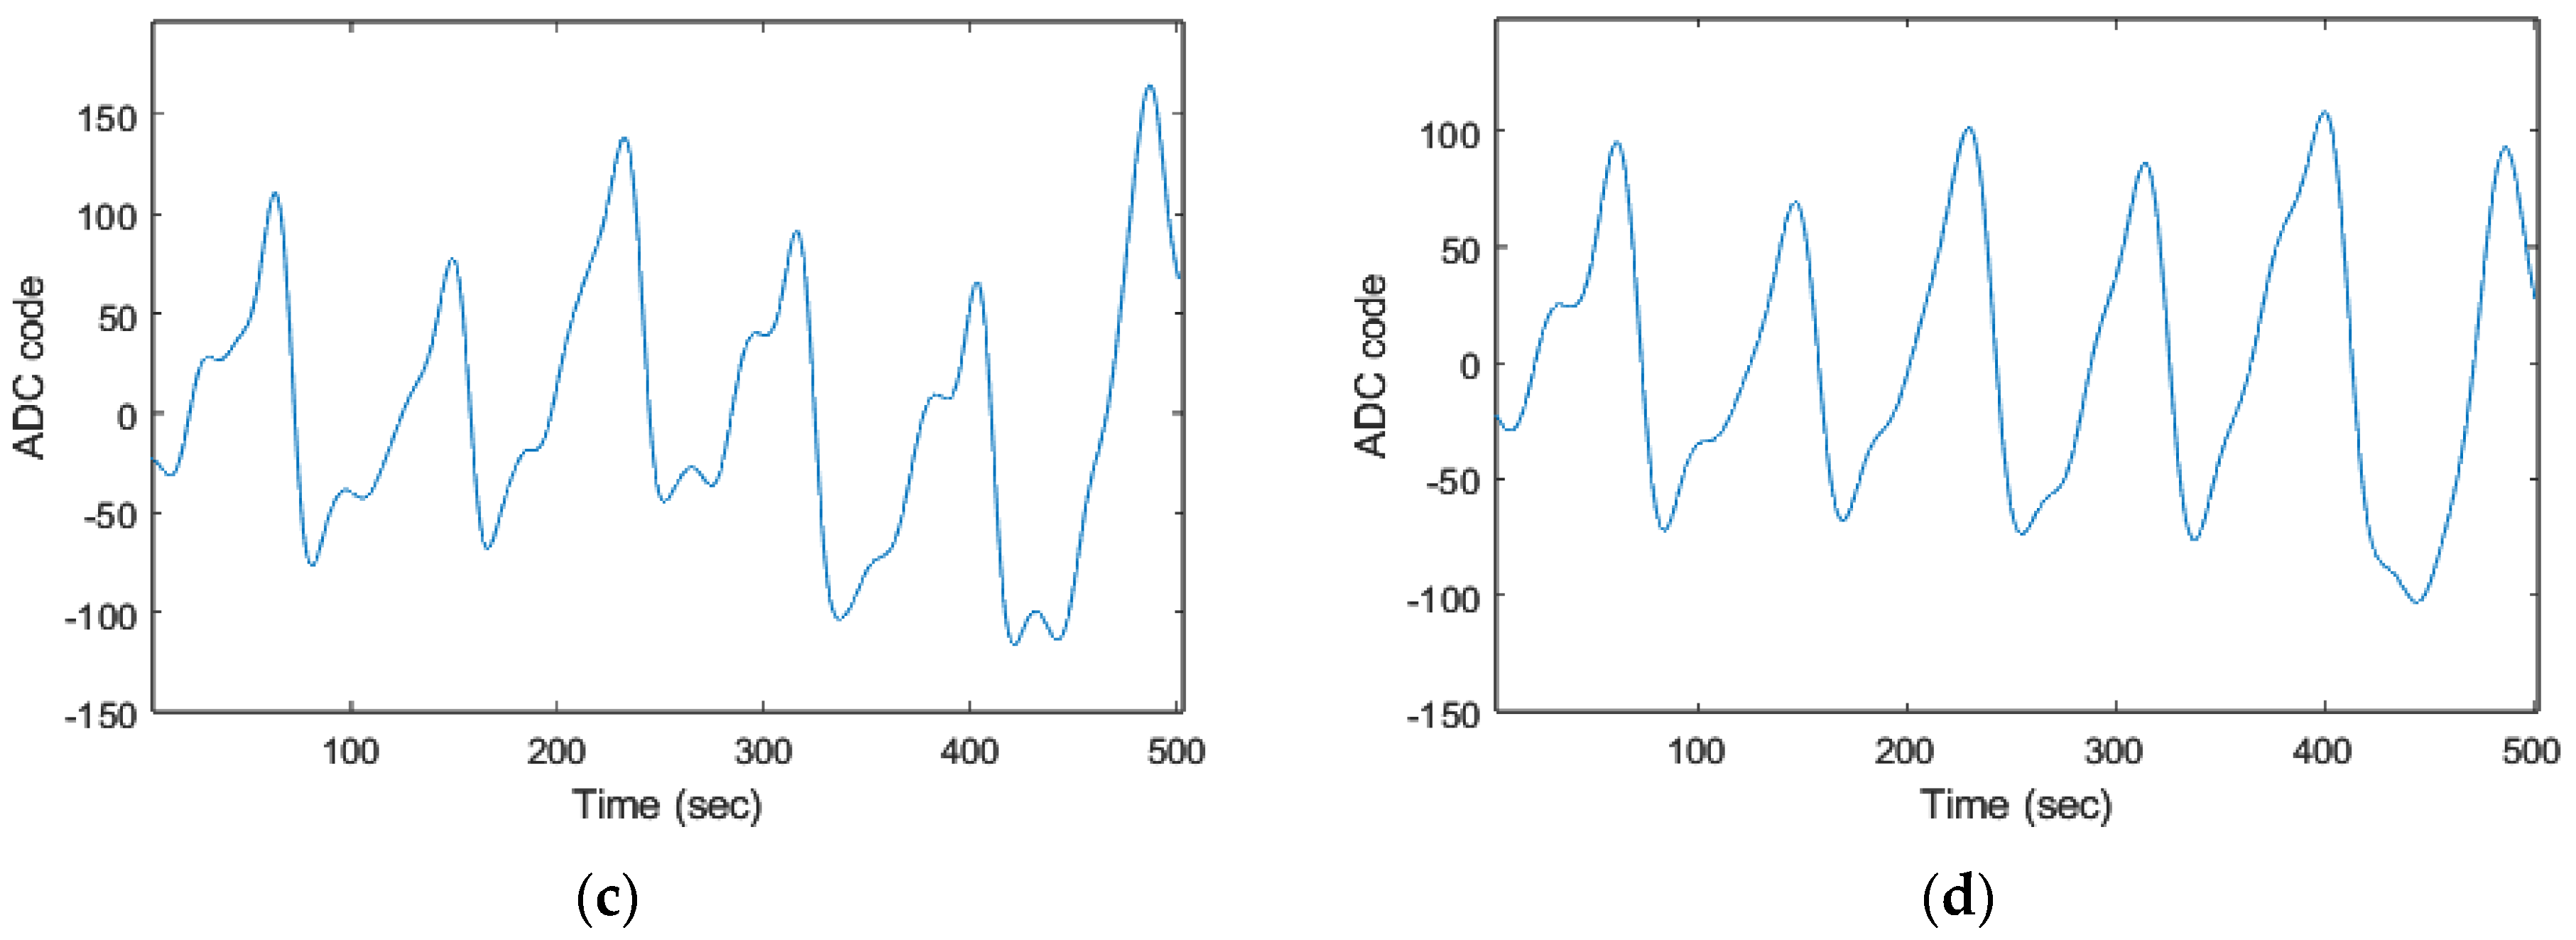
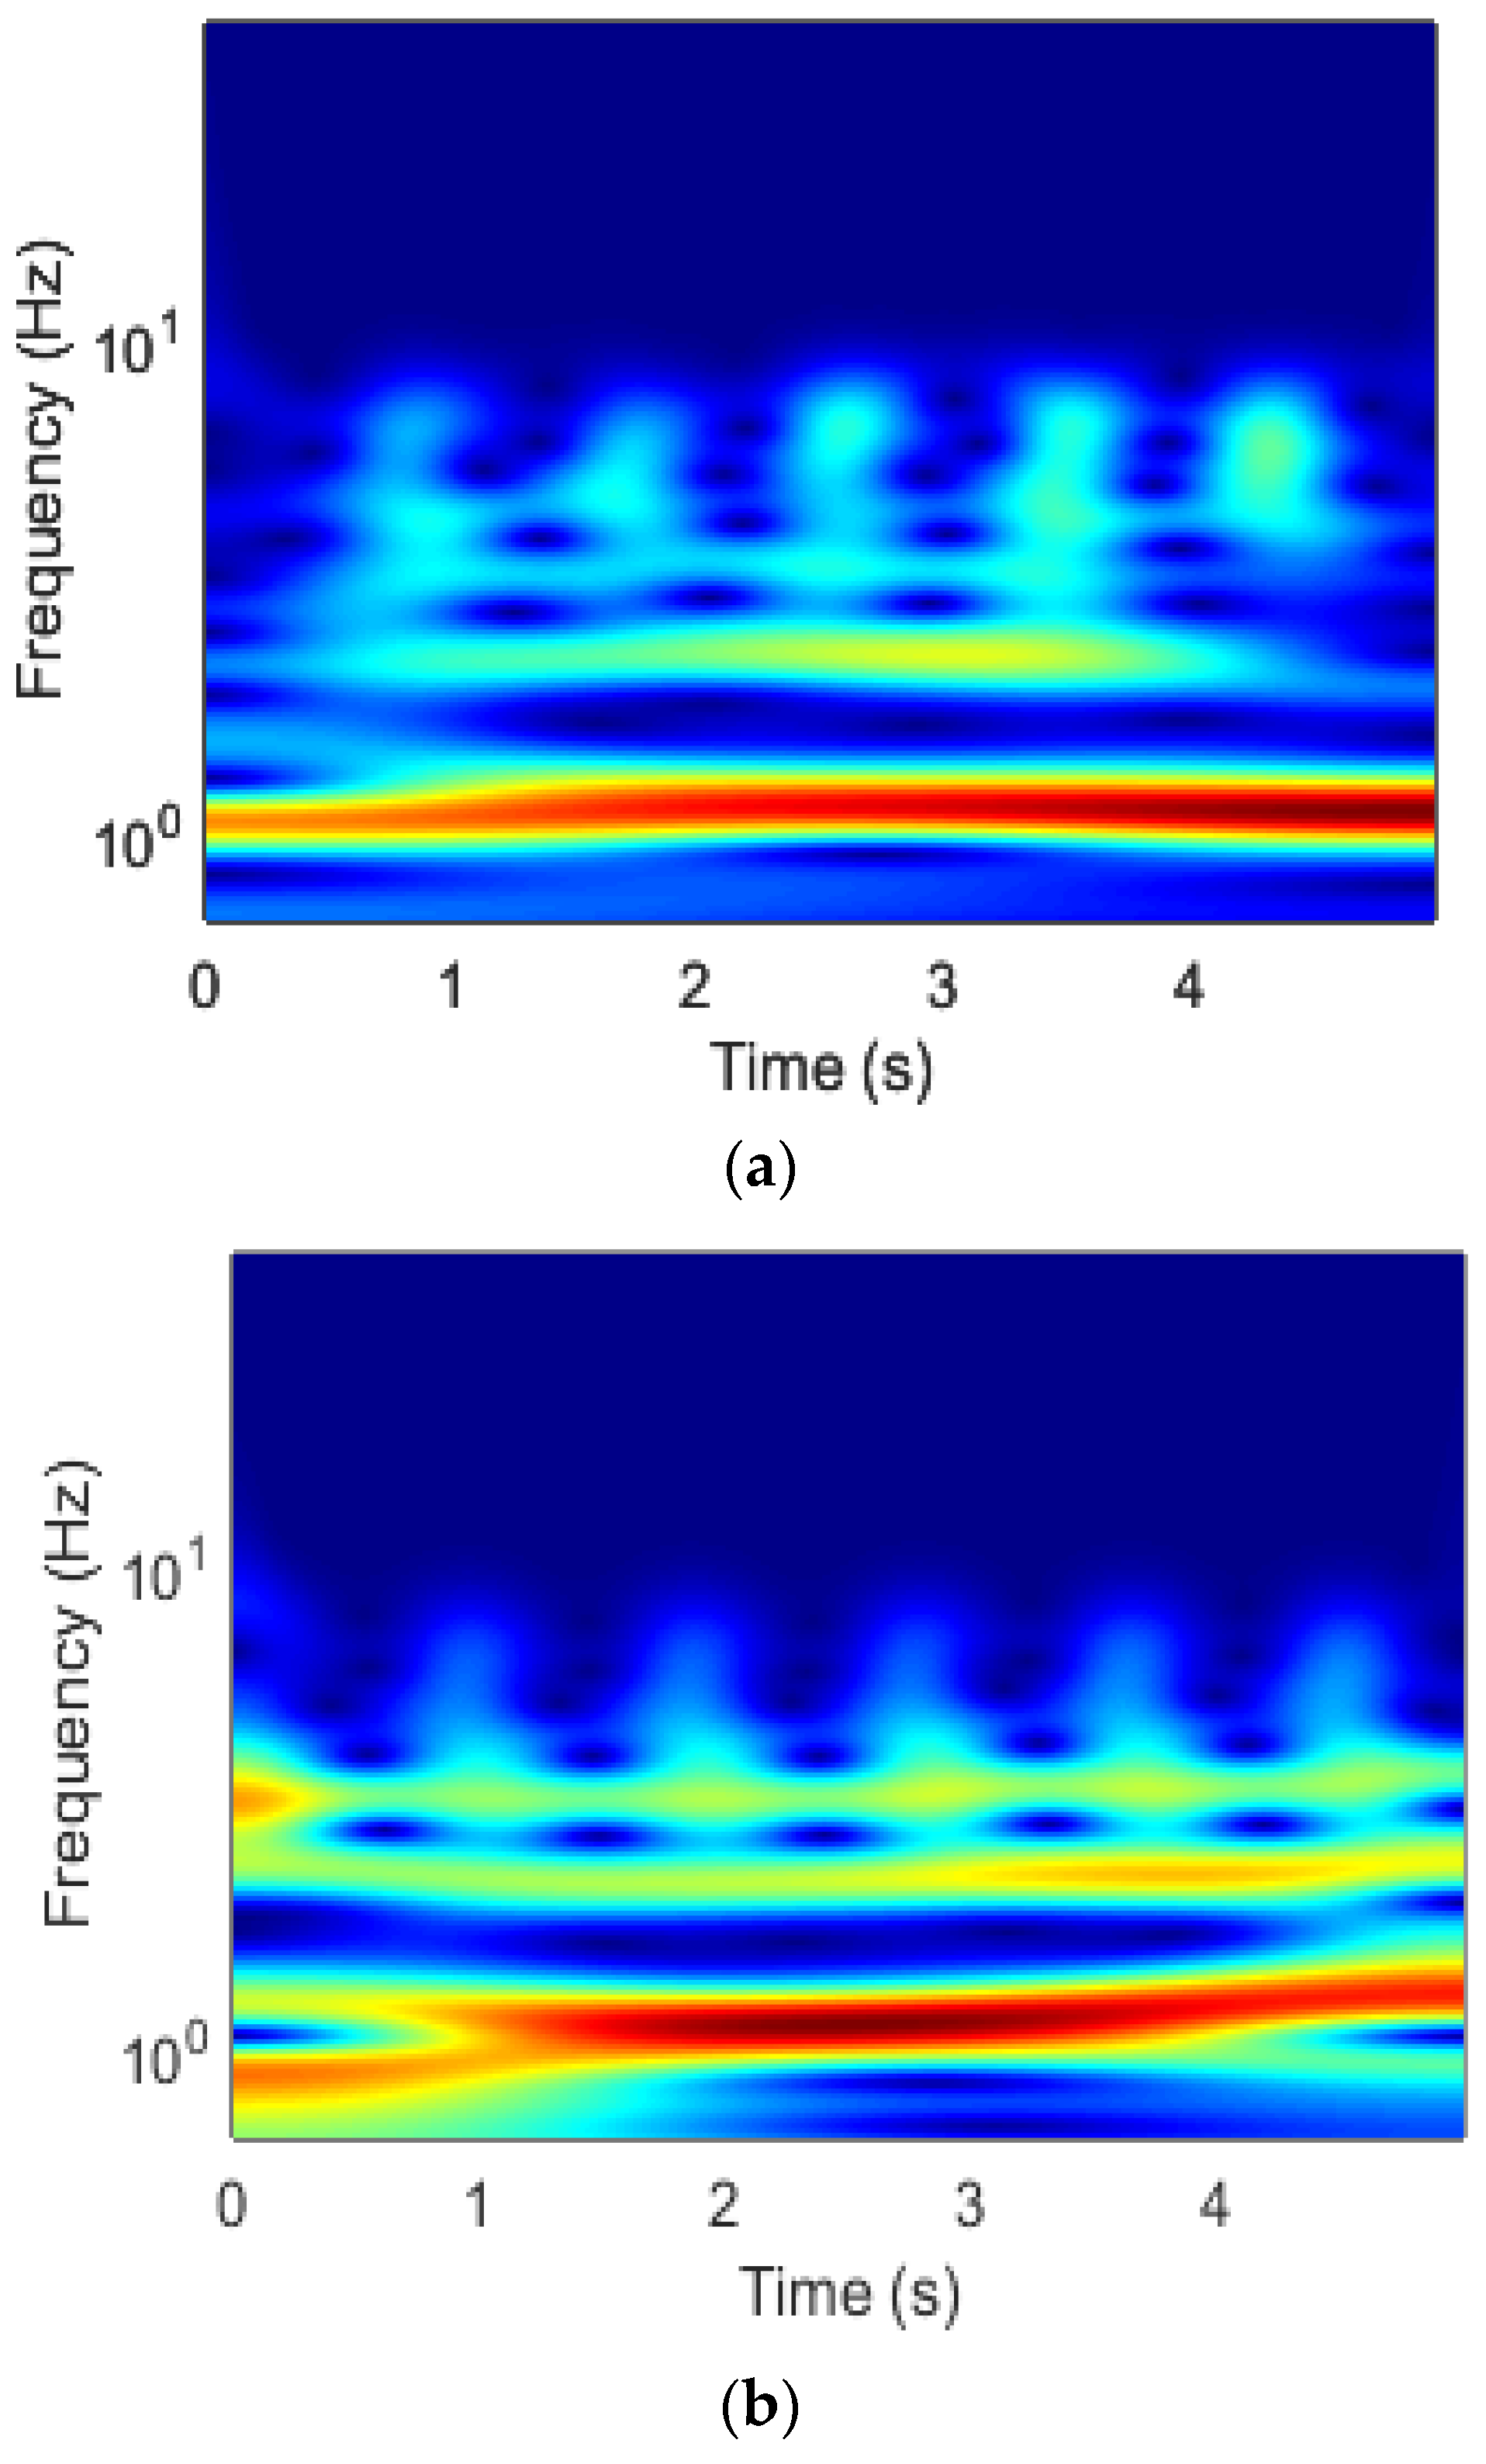
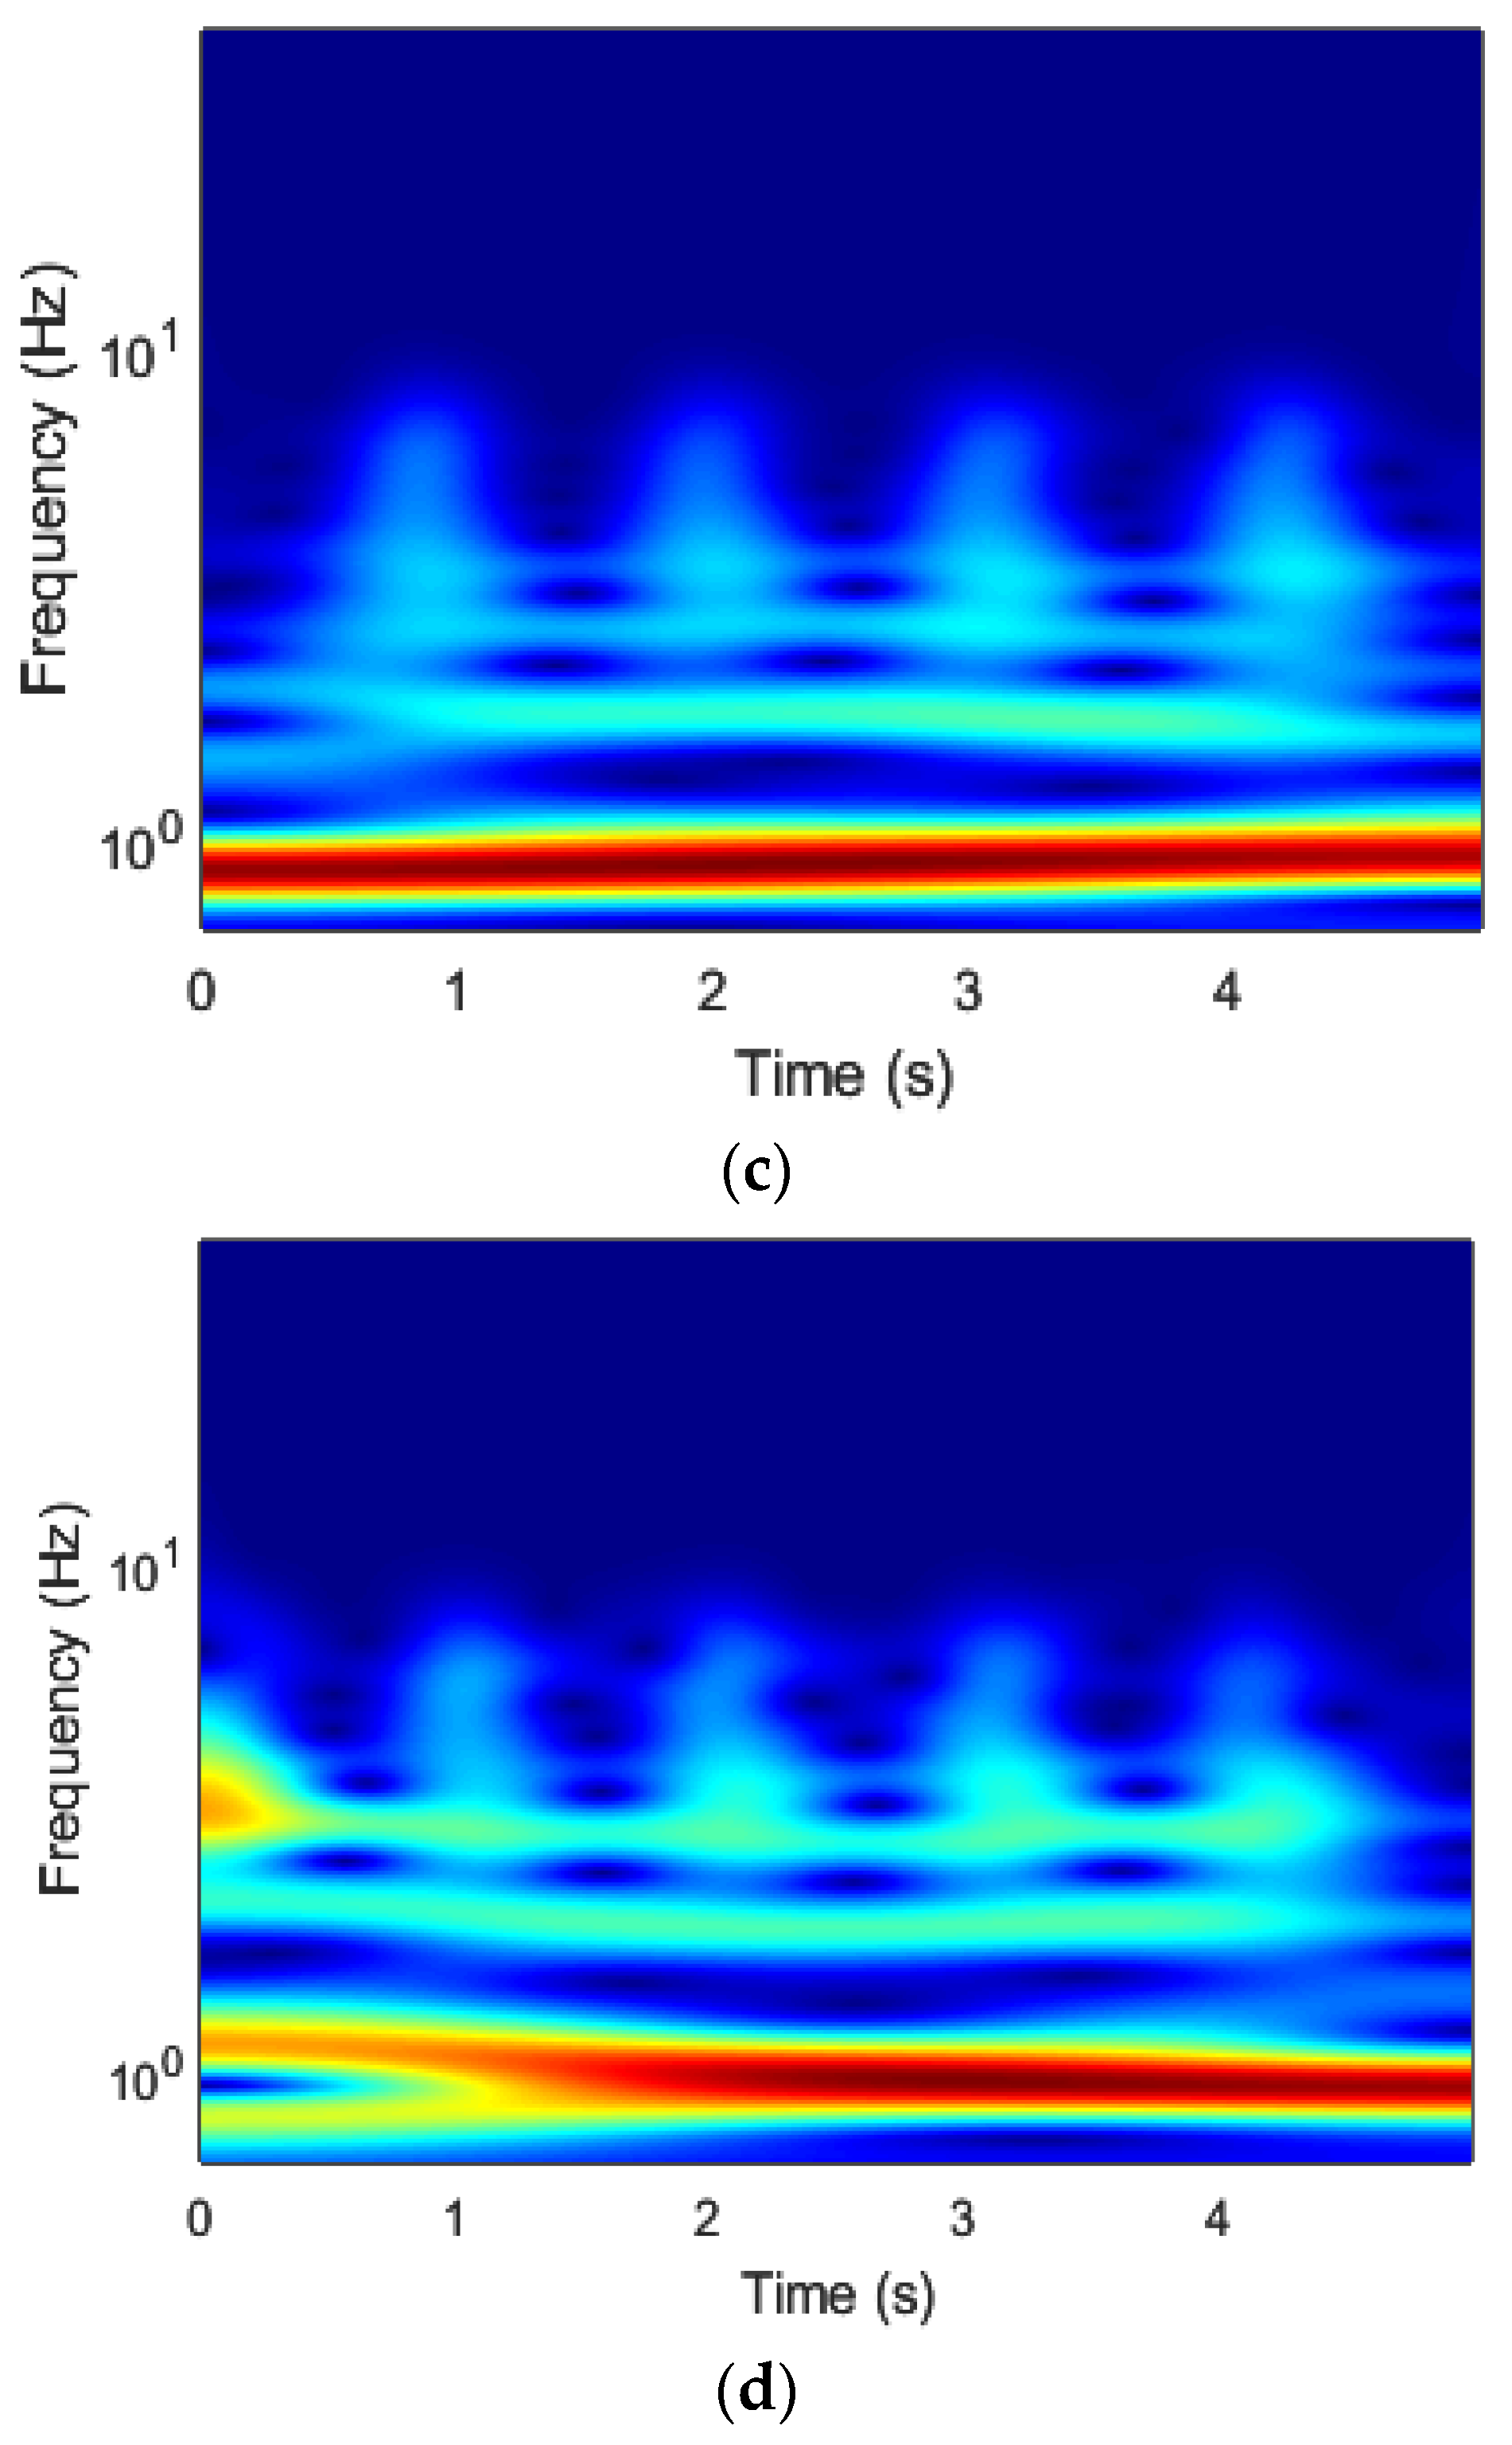
- Transformation of the 1D PPG signals into 2D time–frequency images (scalograms) using CWT and evaluation of the performance of the transformed signals at different signal segments.
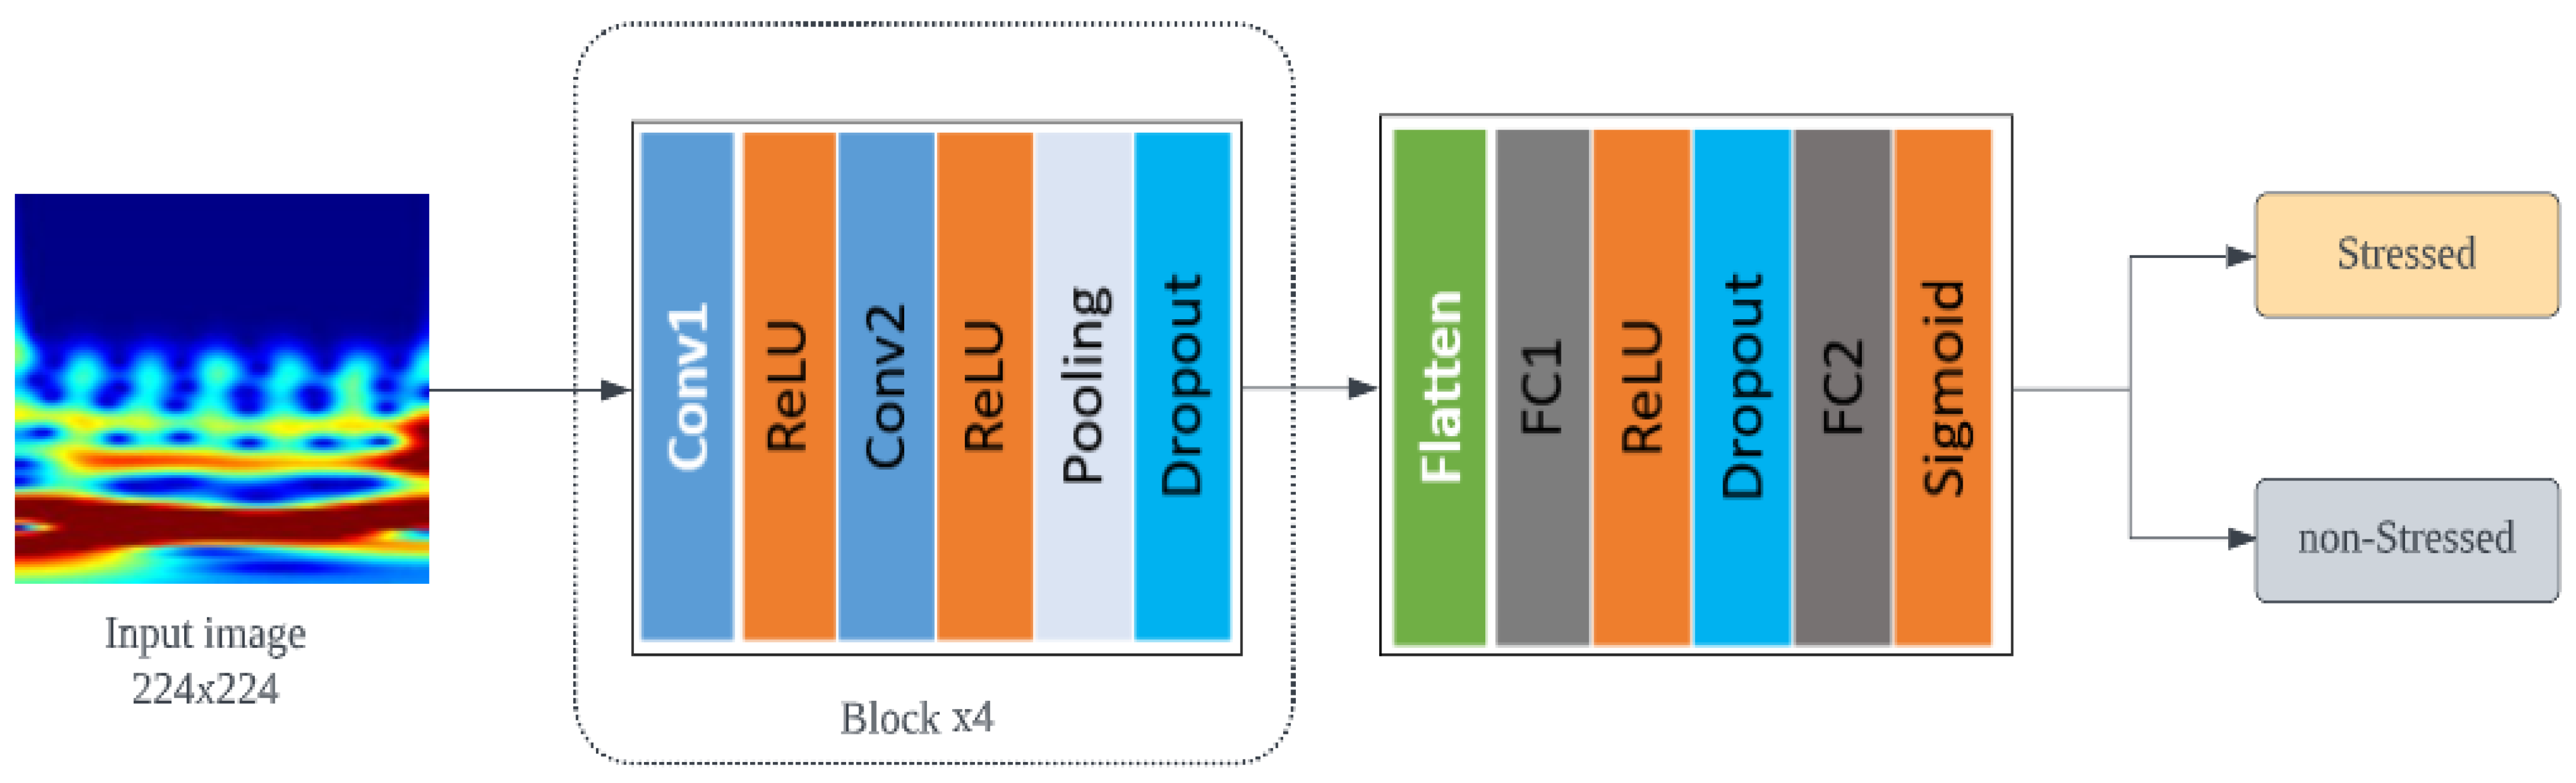
- The design and implementation of an efficient and accurate CNN model for stress detection using the 2D scalogram images of PPG signals obtained from 14 volunteers.
2. Materials and Methods
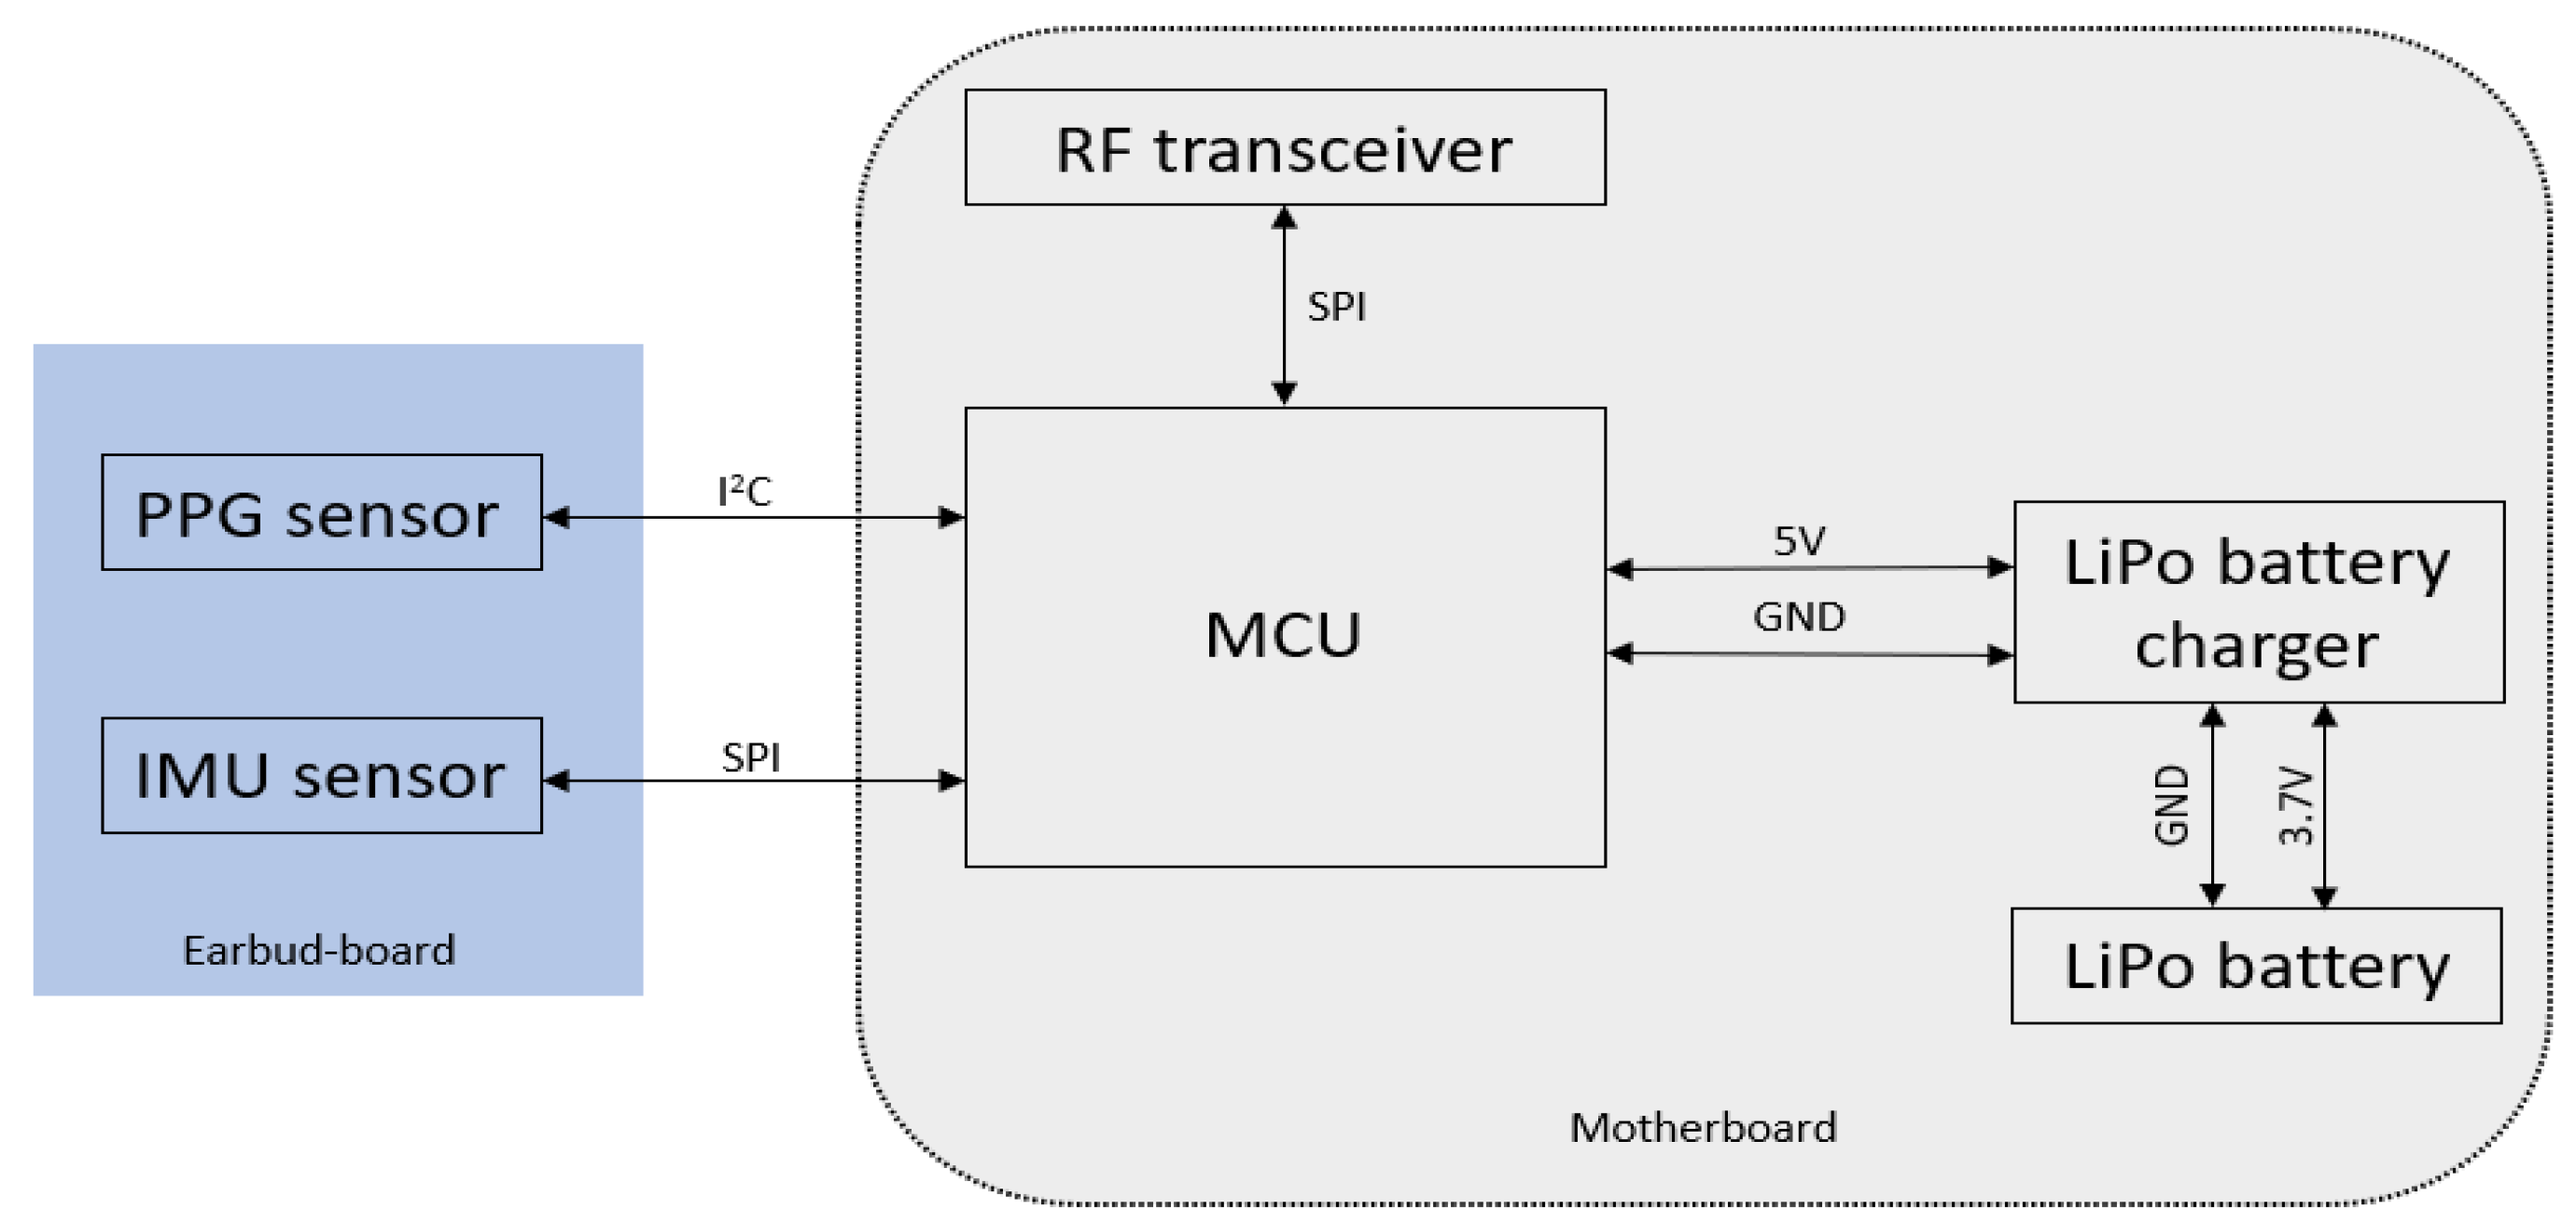
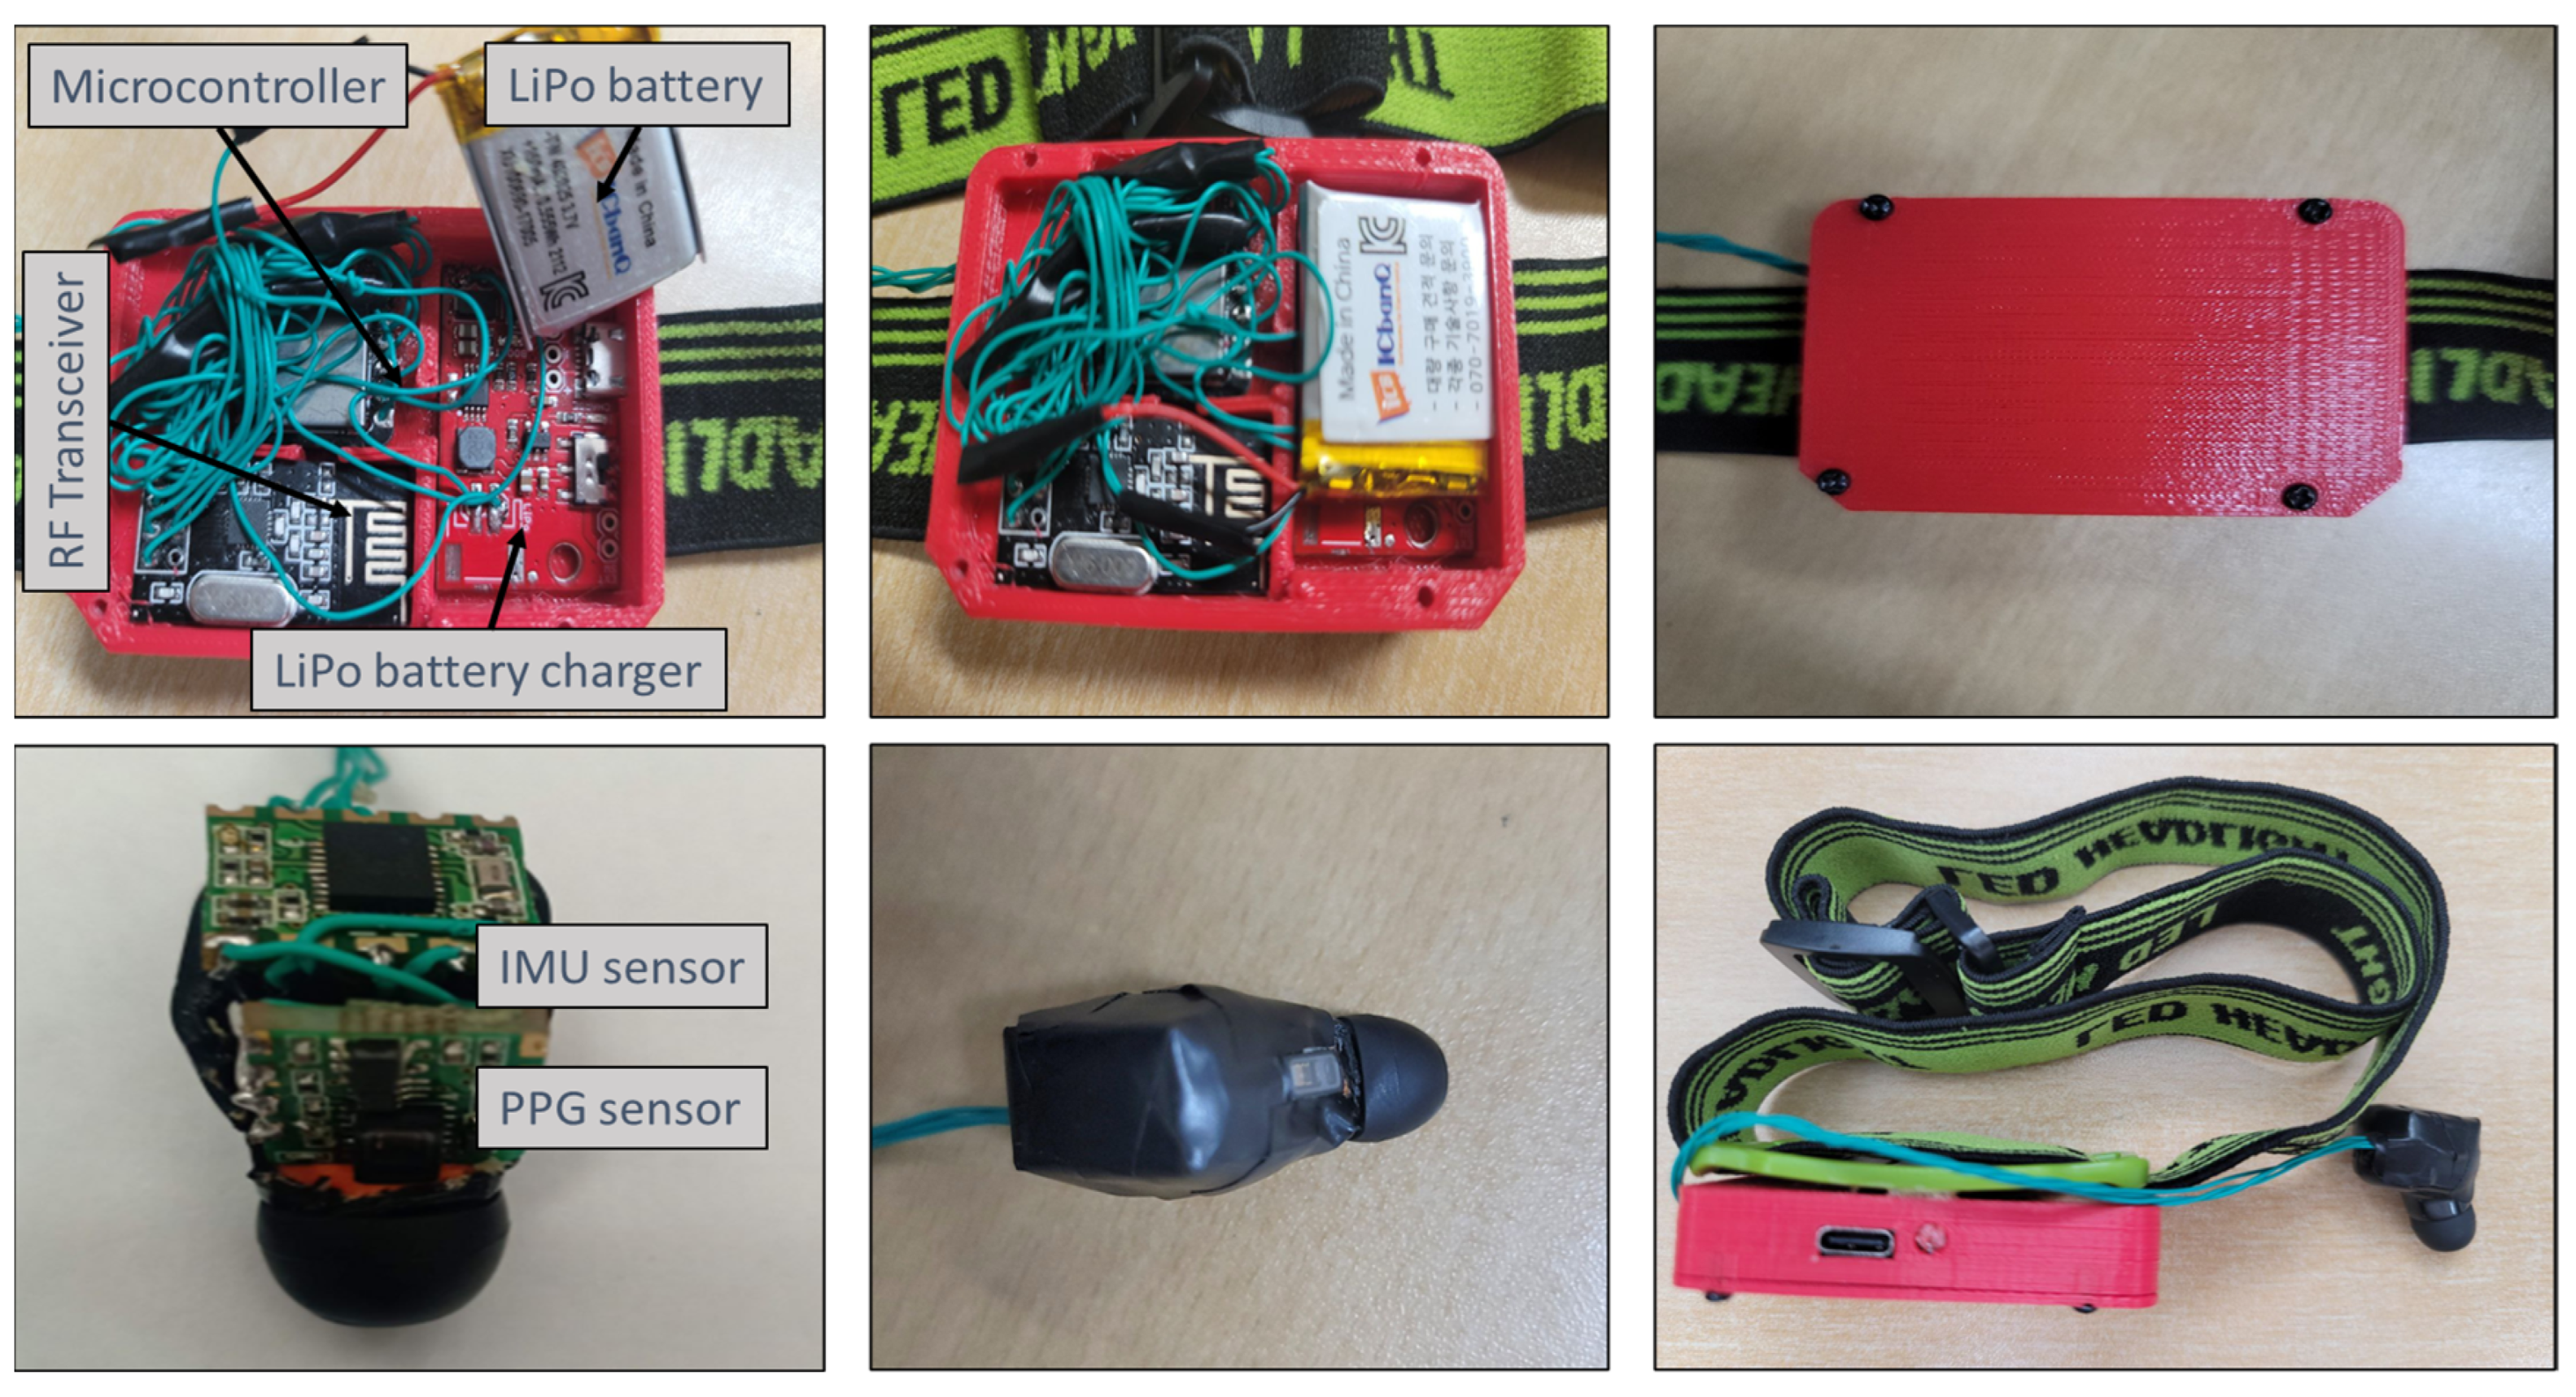
2.1. Proposed Hardware Architecture
- Motherboard
- Earbud board
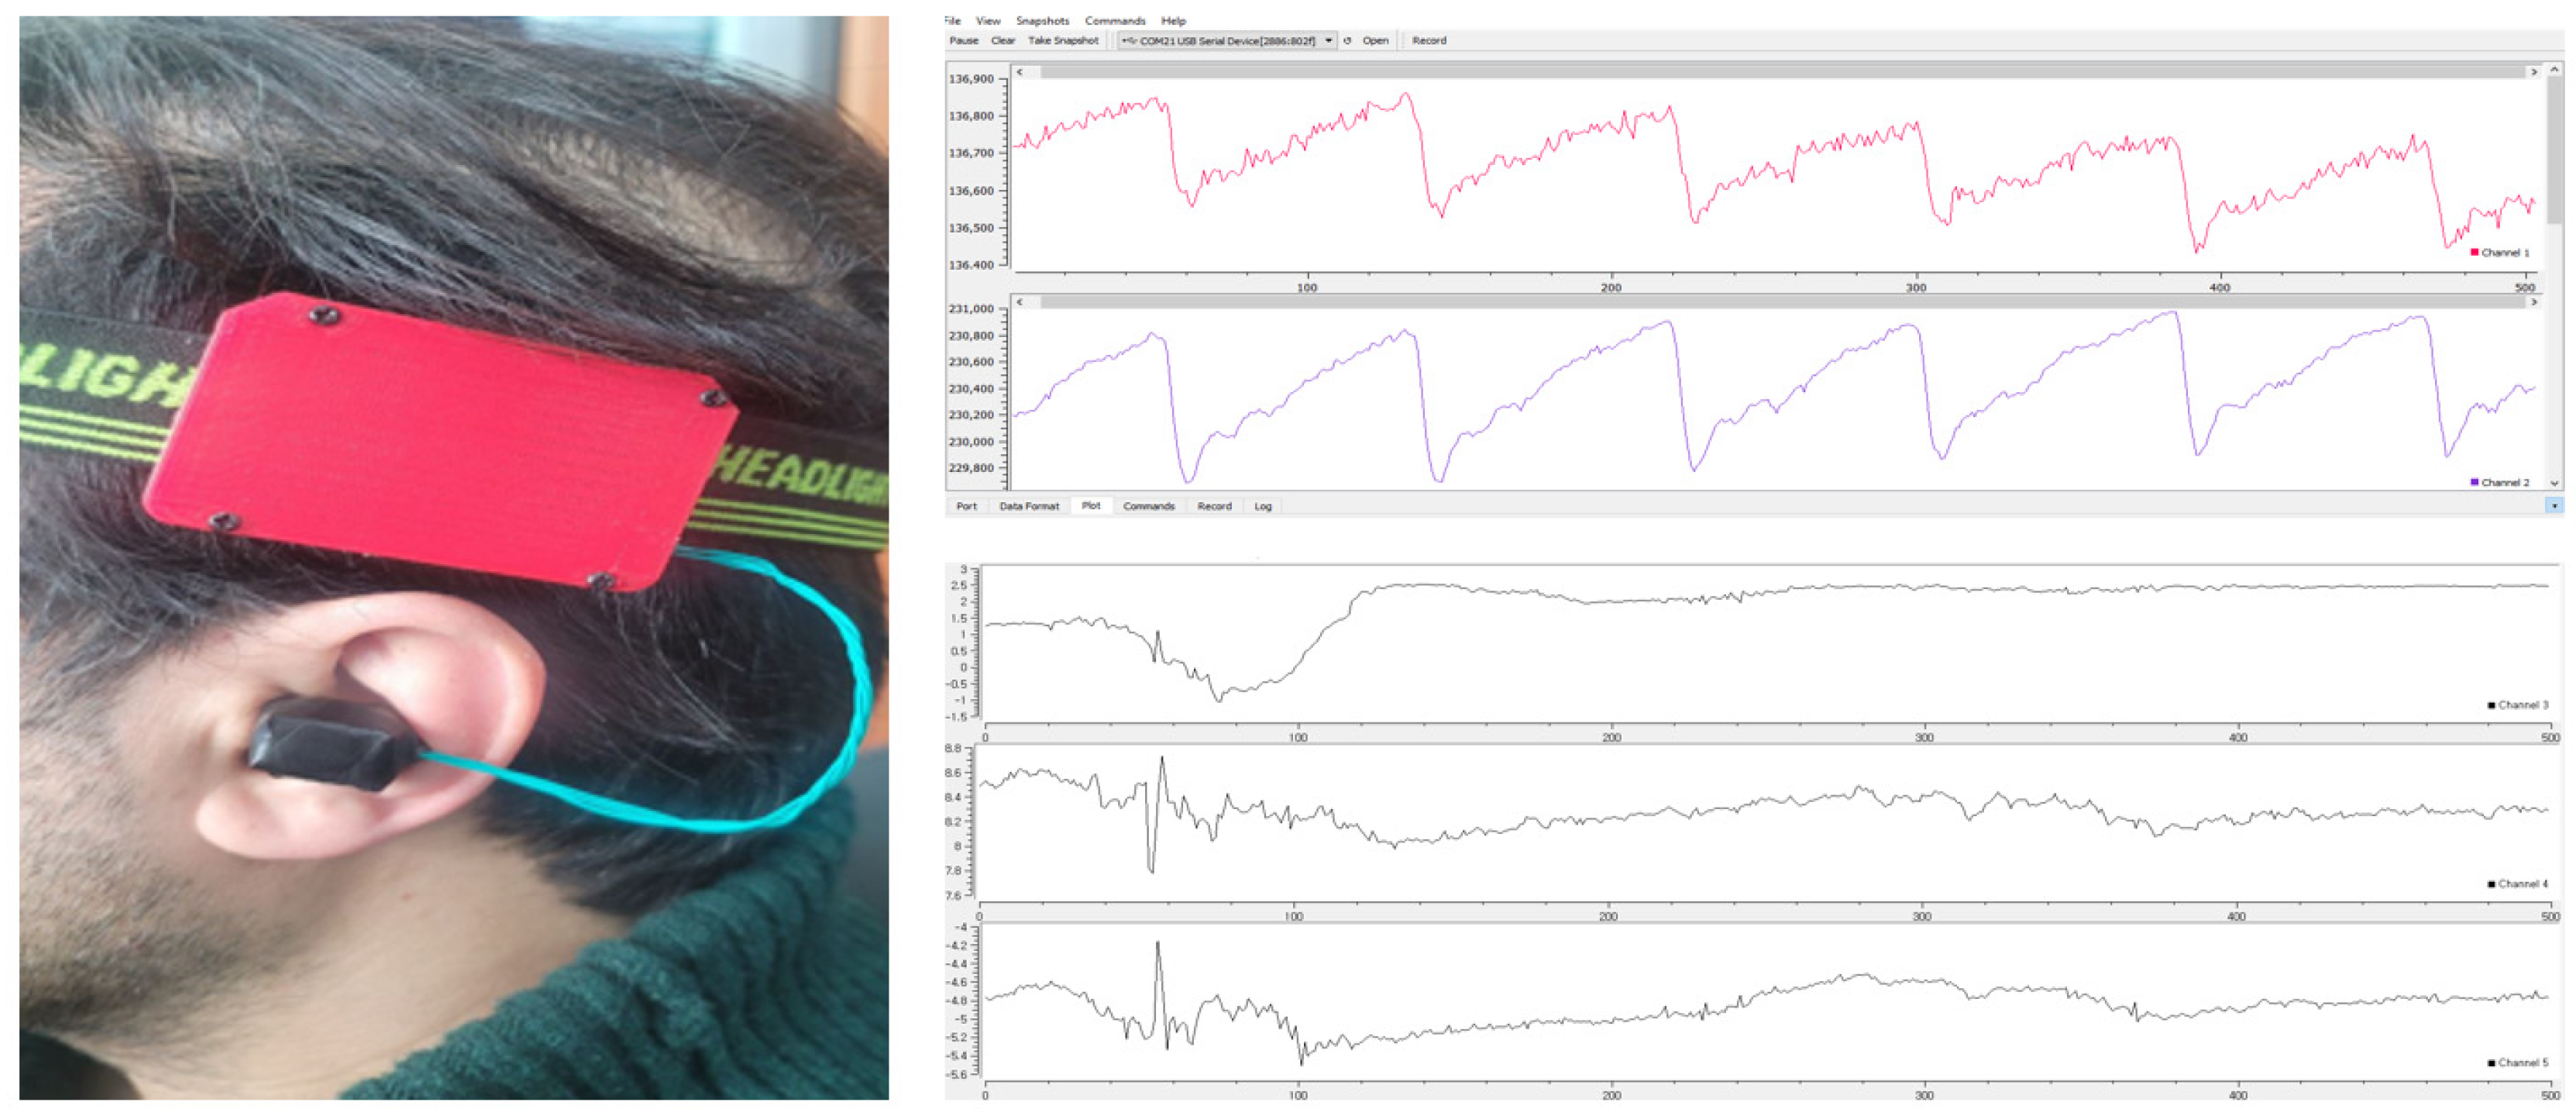
2.2. Experimental Methodology
2.2.1. Data Acquisition and Protocol
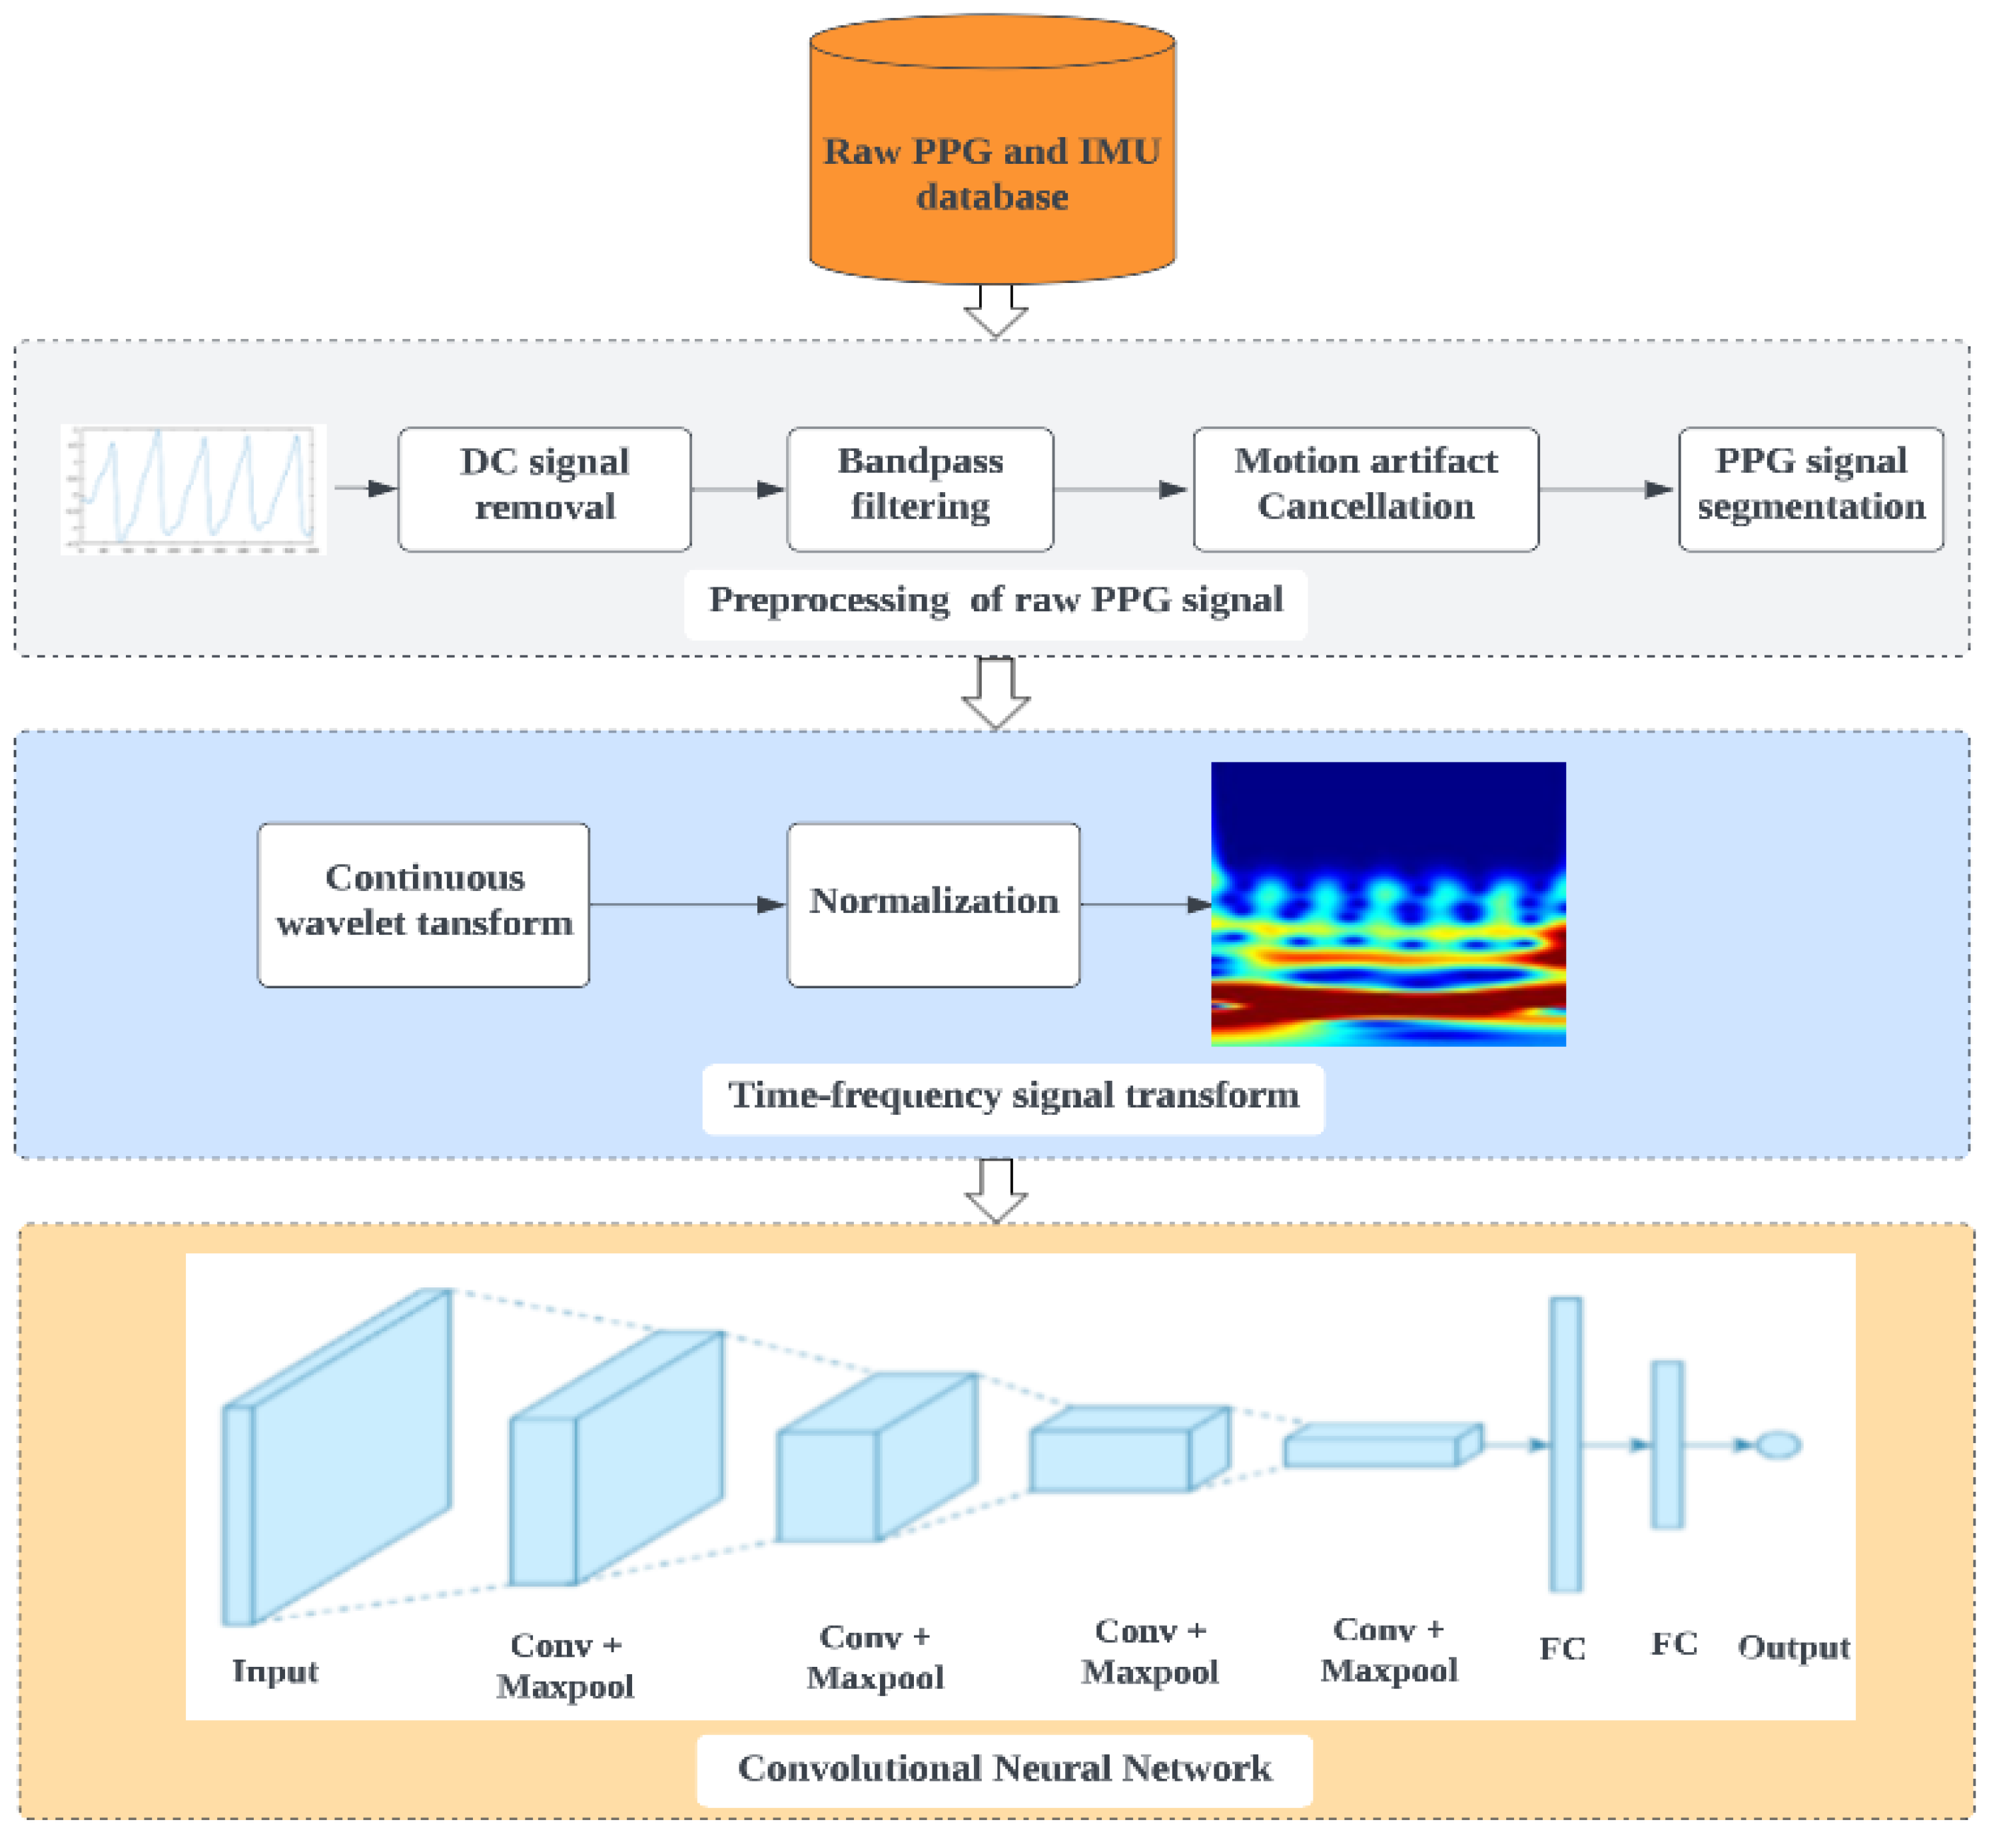
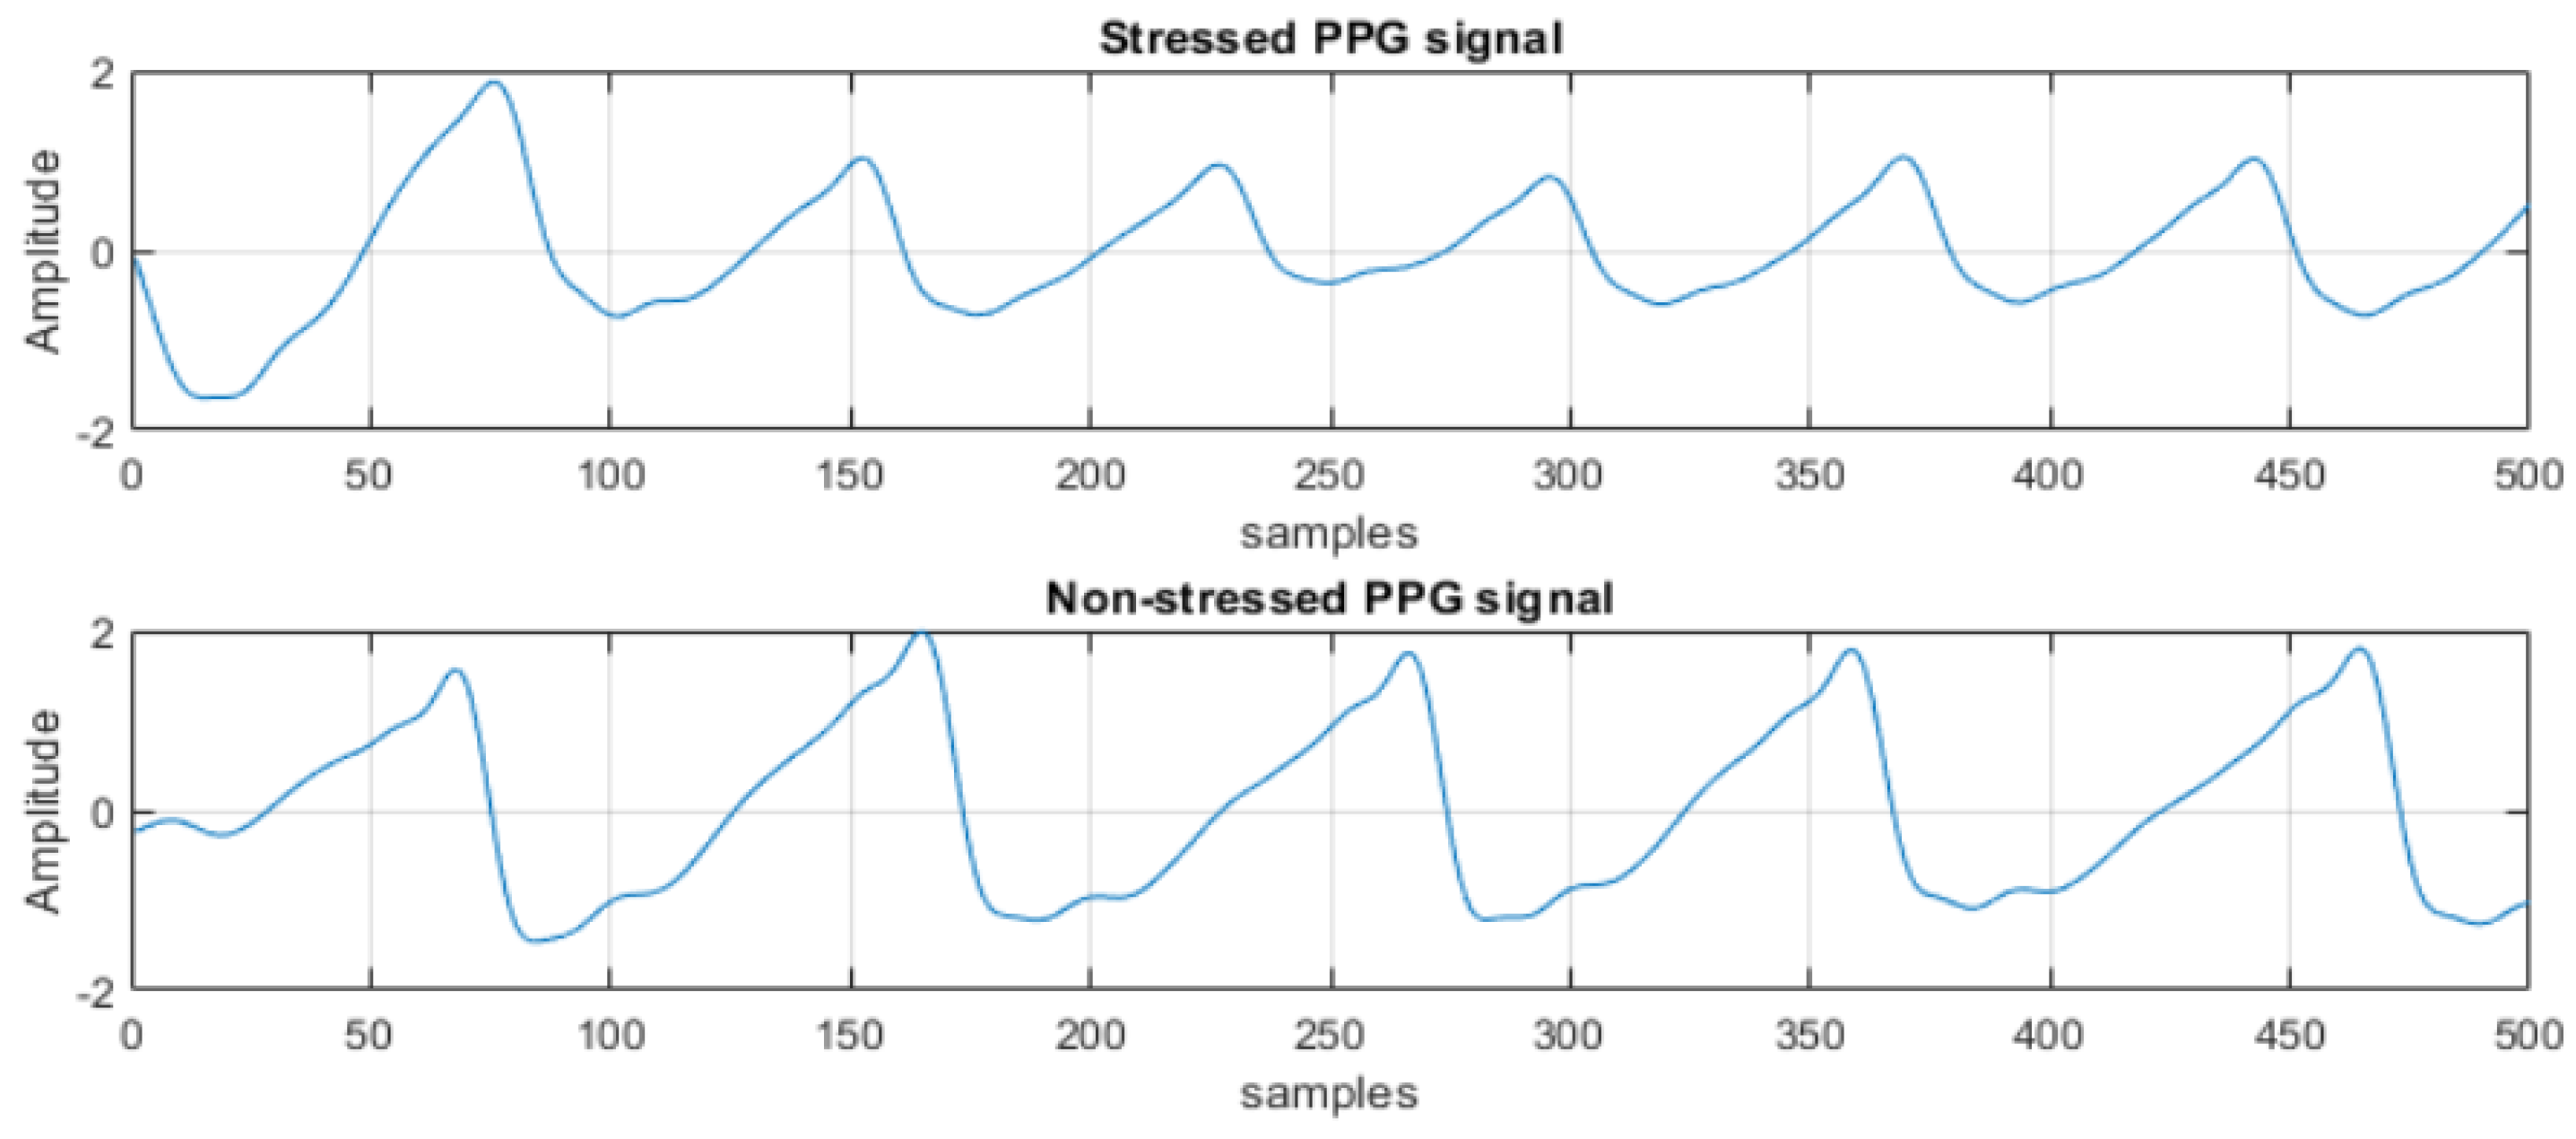
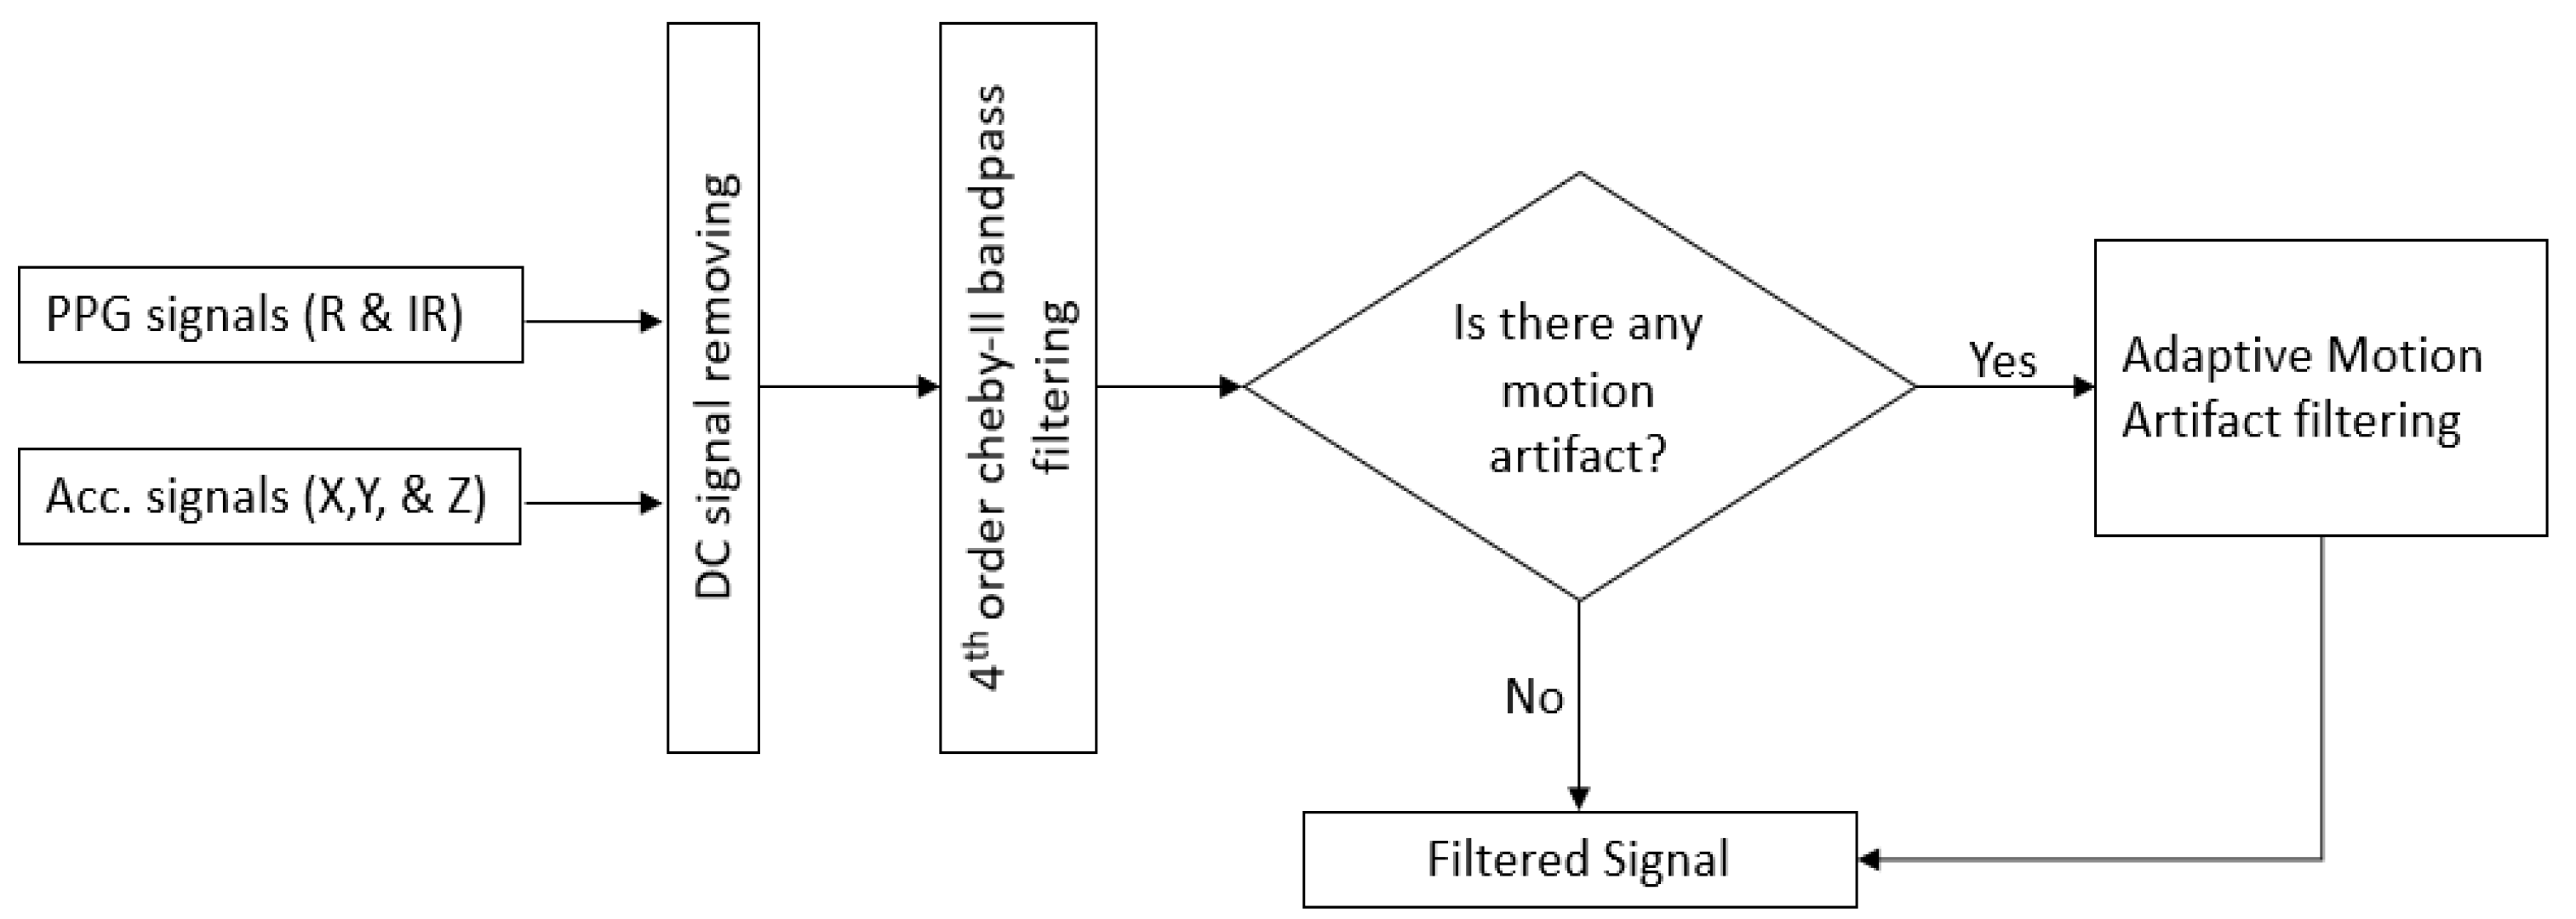
2.2.2. PPG Signal Preprocessing
- DC Remover
- Bandpass filtering
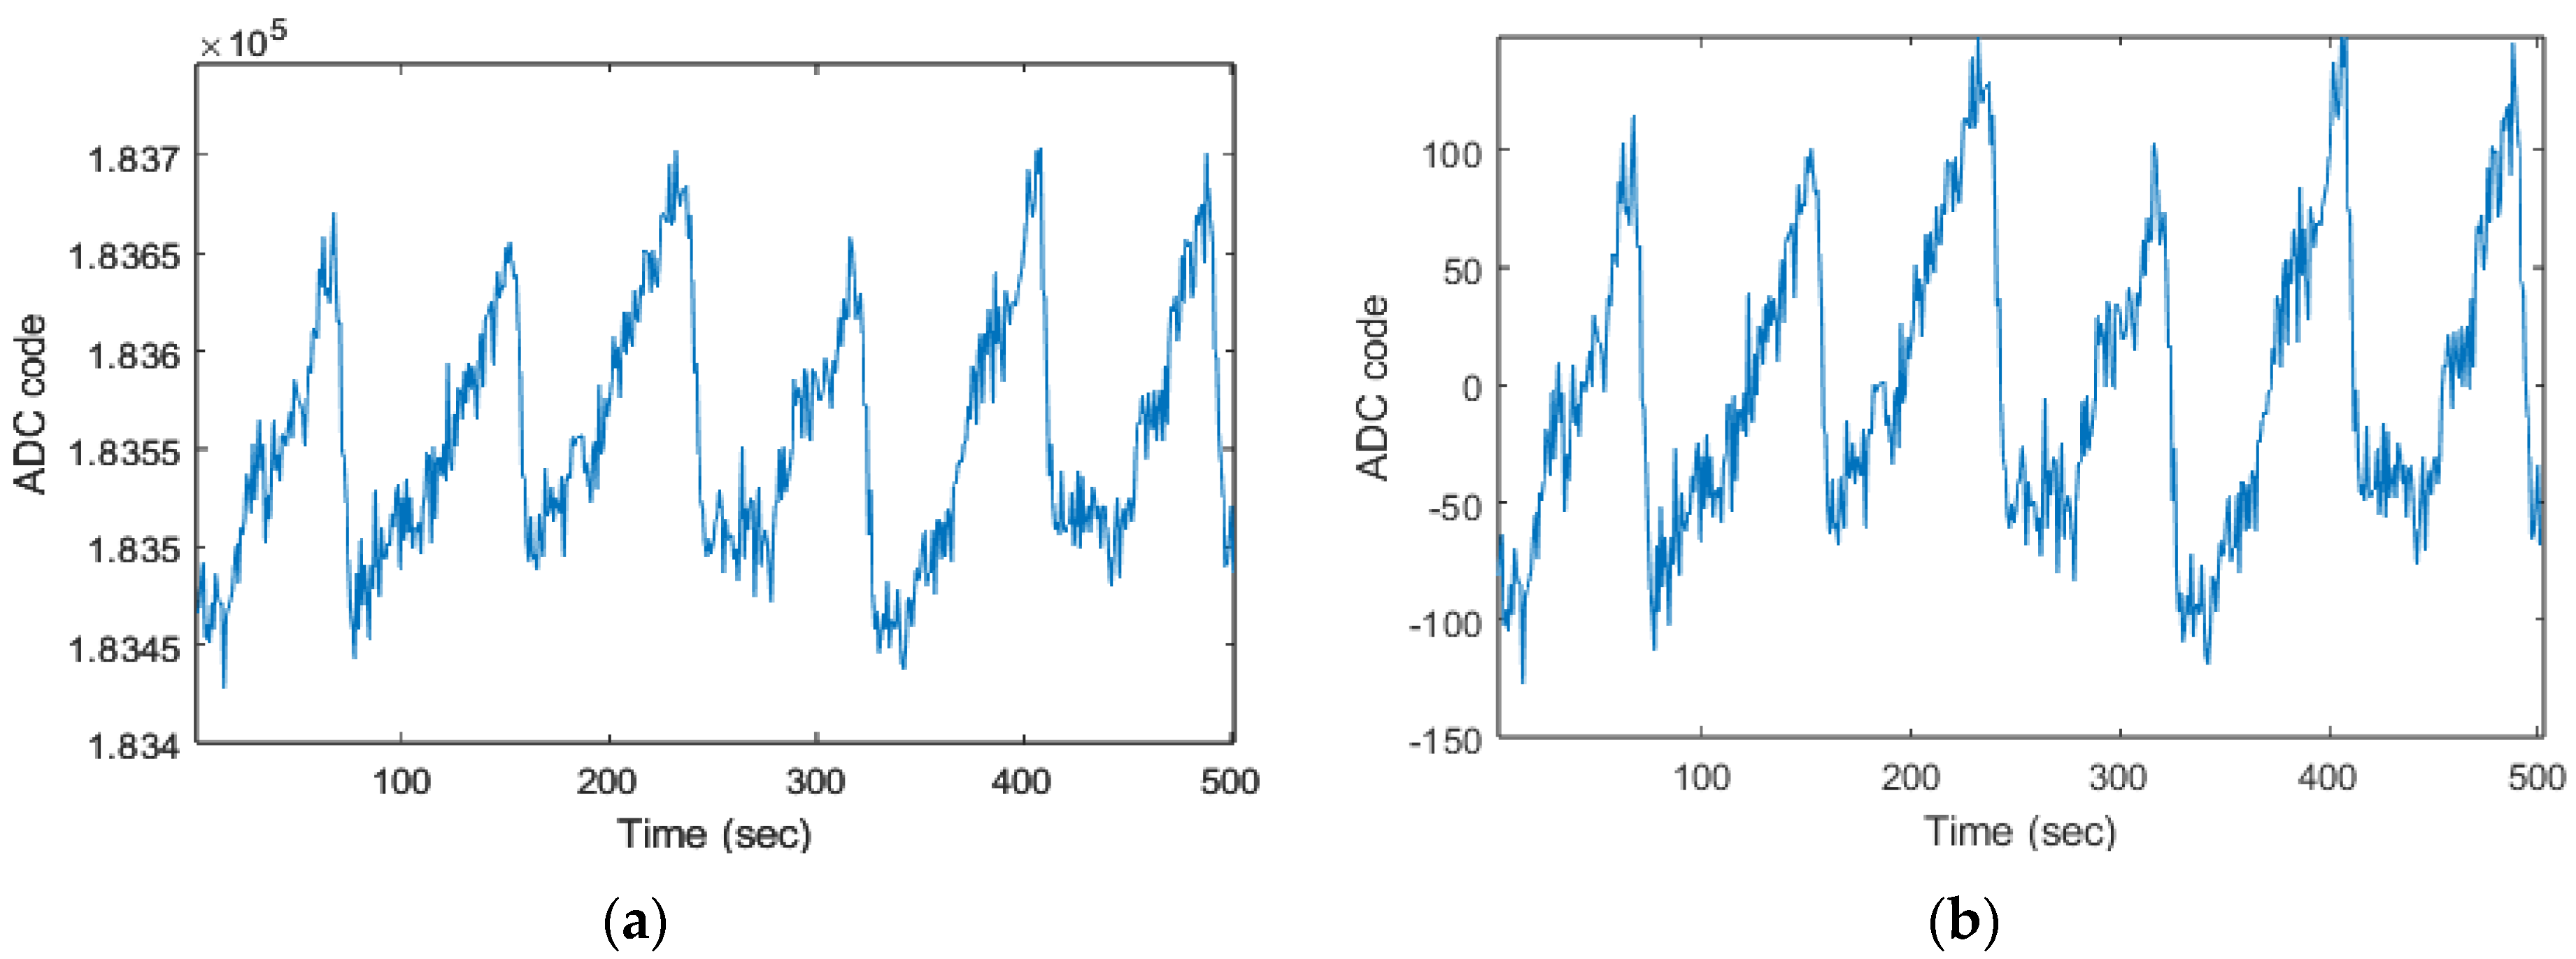
- Motion Artifact Cancellation using Adaptive Filtering
- d.
- PPG Signal Segmentation
2.2.3. PPG Signal Transformation
2.2.4. Proposed CNN for Mental Stress Detection
2.2.5. Performance Evaluation
3. Experimental Results
4. Discussion and Conclusions
Author Contributions
Funding
Institutional Review Board Statement
Informed Consent Statement
Data Availability Statement
Conflicts of Interest
References
- Cho, D.; Ham, J.; Oh, J.; Park, J.; Kim, S.; Lee, N.K.; Lee, B. Detection of Stress Levels from Biosignals Measured in Virtual Reality Environments Using a Kernel-Based Extreme Learning Machine. Sensors 2017, 17, 2435. [Google Scholar] [CrossRef] [PubMed] [Green Version]
- Can, Y.S.; Chalabianloo, N.; Ekiz, D.; Ersoy, C. Continuous Stress Detection Using Wearable Sensors in Real Life: Algorithmic Programming Contest Case Study. Sensors 2019, 19, 1849. [Google Scholar] [CrossRef] [PubMed] [Green Version]
- Vogel, J.; Auinger, A.; Riedl, R.; Kindermann, H.; Helfert, M.; Ocenasek, H. Digitally Enhanced Recovery: Investigating the Use of Digital Self-Tracking for Monitoring Leisure Time Physical Activity of Cardiovascular Disease (CVD) Patients Undergoing Cardiac Rehabilitation. PLoS ONE 2017, 12, e0186261. [Google Scholar] [CrossRef] [PubMed] [Green Version]
- Järvelin-Pasanen, S.; Sinikallio, S.; Tarvainen, M.P. Heart Rate Variability and Occupational Stress—Systematic Review. Ind. Health 2018, 56, 500–511. [Google Scholar] [CrossRef] [PubMed] [Green Version]
- Kivimäki, M.; Leino-Arjas, P.; Luukkonen, R.; Riihimäki, H.; Vahtera, J.; Kirjonen, J. Work Stress and Risk of Cardiovascular Mortality: Prospective Cohort Study of Industrial Employees. Br. Med. J. 2002, 325, 857–860. [Google Scholar] [CrossRef] [Green Version]
- Occupational Stress and Work-Related Unintentional Injuries among Iranian Car Manufacturing Workers. Available online: https://apps.who.int/iris/handle/10665/117482 (accessed on 3 January 2023).
- Salminen, S.; Kivimäki, M.; Elovainio, M.; Vahtera, J. Stress Factors Predicting Injuries of Hospital Personnel. Am. J. Ind. Med. 2003, 44, 32–36. [Google Scholar] [CrossRef]
- Bhardwaj, R.; Natrajan, P.; Balasubramanian, V. Study to Determine the Effectiveness of Deep Learning Classifiers for ECG Based Driver Fatigue Classification. In Proceedings of the 2018 13th International Conference on Industrial and Information Systems, ICIIS 2018, Rupnagar, India, 1–2 December 2018; pp. 98–102. [Google Scholar] [CrossRef]
- Dai, X.; Ding, Y. Mental Health Monitoring Based on Multiperception Intelligent Wearable Devices. Contrast Media Mol. Imaging 2021, 2021, 8307576. [Google Scholar] [CrossRef]
- Goyal, A.; Singh, S.; Vir, D.; Pershad, D. Automation of Stress Recognition Using Subjective or Objective Measures. Psychol. Stud. 2016, 61, 348–364. [Google Scholar] [CrossRef]
- Urwyler, S.A.; Schuetz, P.; Sailer, C.; Christ-Crain, M. Copeptin as a Stress Marker Prior and after a Written Examination—The CoEXAM Study. Int. J. Biol. Stress 2015, 18, 134–137. [Google Scholar] [CrossRef]
- Garcia, E.; Valdés, A.A.; Aguiló, J.; García, E.; Aguiló, S.; Arza, A.; Garzón-Reya, J.M. Psychological and Physiological Profiles in Oncology Caregivers: A Multivariable Cross-Sectional Study Health Monitoring on Embedded Platforms View Project Psychological and Physiological Profiles in Oncology Caregivers: A Multivariable Cross-Sectional Study. Trans. Mach. Learn. Artif. Intell. 2017, 5, 547–557. [Google Scholar] [CrossRef] [Green Version]
- Szakonyi, B.; Vassányi, I.; Schumacher, E.; Kósa, I. Efficient Methods for Acute Stress Detection Using Heart Rate Variability Data from Ambient Assisted Living Sensors. Biomed. Eng. Online 2021, 20, 73. [Google Scholar] [CrossRef]
- Kalatzis, A.; Stanley, L.; Karthikeyan, R.; Mehta, R.K. Mental Stress Classification during a Motor Task in Older Adults Using an Artificial Neural Network. In Proceedings of the 2020 ACM International Joint Conference on Pervasive and Ubiquitous Computing—UbiComp/ISWC 2020 Adjunct and Proceedings of the 2020 ACM International Symposium on Wearable Computers, Virtual, 12–17 September 2020; Association for Computing Machinery: New York, NY, USA, 2020; pp. 244–248. [Google Scholar] [CrossRef]
- Lee, S.; Hwang, H.B.; Park, S.; Kim, S.; Ha, J.H.; Jang, Y.; Hwang, S.; Park, H.K.; Lee, J.; Kim, I.Y. Mental Stress Assessment Using Ultra Short Term HRV Analysis Based on Non-Linear Method. Biosensors 2022, 12, 465. [Google Scholar] [CrossRef]
- Greco, A.; Valenza, G.; Lazaro, J.; Garzon-Rey, J.M.; Aguilo, J.; De-la-Camara, C.; Bailon, R.; Scilingo, E.P. Acute Stress State Classification Based on Electrodermal Activity Modeling. IEEE Trans. Affect. Comput. 2021, 14, 788–799. [Google Scholar] [CrossRef]
- Villarejo, M.V.; Zapirain, B.G.; Zorrilla, A.M. A Stress Sensor Based on Galvanic Skin Response (GSR) Controlled by ZigBee. Sensors 2012, 12, 6075–6101. [Google Scholar] [CrossRef] [Green Version]
- Garcia-Ceja, E.; Osmani, V.; Mayora, O. Automatic Stress Detection in Working Environments From Smartphones’ Accelerometer Data: A First Step. IEEE J. Biomed. Health Inform. 2016, 20, 1053–1060. [Google Scholar] [CrossRef] [Green Version]
- Arsalan, A.; Majid, M.; Butt, A.R.; Anwar, S.M. Classification of Perceived Mental Stress Using A Commercially Available EEG Headband. IEEE J. Biomed. Health Inform. 2019, 23, 2257–2264. [Google Scholar] [CrossRef]
- Asif, A.; Majid, M.; Anwar, S.M. Human Stress Classification Using EEG Signals in Response to Music Tracks. Comput. Biol. Med. 2019, 107, 182–196. [Google Scholar] [CrossRef]
- Arsalan, A.; Majid, M. Human Stress Classification during Public Speaking Using Physiological Signals. Comput. Biol. Med. 2021, 133, 104377. [Google Scholar] [CrossRef]
- Greene, S.; Thapliyal, H.; Caban-Holt, A. A Survey of Affective Computing for Stress Detection: Evaluating Technologies in Stress Detection for Better Health. IEEE Consum. Electron. Mag. 2016, 5, 44–56. [Google Scholar] [CrossRef]
- Gedam, S.; Paul, S. A Review on Mental Stress Detection Using Wearable Sensors and Machine Learning Techniques. IEEE Access 2021, 9, 84045–84066. [Google Scholar] [CrossRef]
- Charlton, P.H.; Celka, P.; Farukh, B.; Chowienczyk, P.; Alastruey, J. Assessing Mental Stress from the Photoplethysmogram: A Numerical study. Physiol. Meas. 2018, 39, 054001. [Google Scholar] [CrossRef] [PubMed]
- Ming, D.K.; Sangkaew, S.; Chanh, H.Q.; Nhat, P.T.H.; Yacoub, S.; Georgiou, P.; Holmes, A.H. Continuous Physiological Monitoring Using Wearable Technology to Inform Individual Management of Infectious Diseases, Public Health and Outbreak Responses. Int. J. Infect. Dis. 2020, 96, 648–654. [Google Scholar] [CrossRef] [PubMed]
- Correia, B.; Dias, N.; Costa, P.; Pêgo, J.M. Validation of a Wireless Bluetooth Photoplethysmography Sensor Used on the Earlobe for Monitoring Heart Rate Variability Features during a Stress-Inducing Mental Task in Healthy Individuals. Sensors 2020, 20, 3905. [Google Scholar] [CrossRef] [PubMed]
- Chauhan, U.; Reithinger, N.; MacKey, J.R. Real-Time Stress Assessment through PPG Sensor for VR Biofeedback. In Proceedings of the 20th International Conference on Multimodal Interaction, ICMI 2018, Boulder, CO, USA, 16–20 October 2018. [Google Scholar] [CrossRef]
- Tomita, Y.; Mitsukura, Y. An Earbud-Based Photoplethysmography and Its Application. Electron. Commun. Jpn. 2018, 101, 32–38. [Google Scholar] [CrossRef] [Green Version]
- Celka, P.; Charlton, P.H.; Farukh, B.; Chowienczyk, P.; Alastruey, J. Influence of Mental Stress on the Pulse Wave Features of Photoplethysmograms. Healthc. Technol. Lett. 2020, 7, 7–12. [Google Scholar] [CrossRef]
- Hao, T.; Chang, H.; Ball, M.; Lin, K.; Zhu, X. CHRV Uncovering Daily Stress Dynamics Using Bio-Signal from Consumer Wearables. Stud. Health Technol. Inform. 2017, 245, 98–102. [Google Scholar] [CrossRef]
- Zangróniz, R.; Martínez-Rodrigo, A.; López, M.T.; Pastor, J.M.; Fernández-Caballero, A. Estimation of Mental Distress from Photoplethysmography. Appl. Sci. 2018, 8, 69. [Google Scholar] [CrossRef] [Green Version]
- Baek, H.J.; Cho, J. Novel Heart Rate Variability Index for Wrist-Worn Wearable Devices Subject to Motion Artifacts That Complicate Measurement of the Continuous Pulse Interval. Physiol. Meas. 2019, 40, 105010. [Google Scholar] [CrossRef]
- Tazarv, A.; Labbaf, S.; Reich, S.M.; Dutt, N.; Rahmani, A.M.; Levorato, M. Personalized Stress Monitoring Using Wearable Sensors in Everyday Settings. In Proceedings of the Annual International Conference of the IEEE Engineering in Medicine and Biology Society, EMBS 2021, Virtual, 1–5 November 2021; pp. 7332–7335. [Google Scholar] [CrossRef]
- Rashid, N.; Chen, L.; Dautta, M.; Jimenez, A.; Tseng, P.; Al Faruque, M.A. Feature Augmented Hybrid CNN for Stress Recognition Using Wrist-Based Sensor. arXiv 2021, arXiv:2108.03166. [Google Scholar]
- Rezapour, M.; Khavaninzadeh, M. Association between Non-Matured Arterio-Venus Fistula and Blood Pressure in Hemodialysis Patients. Med. J. Islam. Repub. Iran 2014, 28, 144. [Google Scholar]
- Rezapour, M.; Taran, S.; Parast, M.B.; Zadeh, M.K. The Impact of Vascular Diameter Ratio on Hemodialysis Maturation Time: Evidence from Data Mining Approaches and Thermodynamics Law. Med. J. Islam. Repub. Iran 2016, 30, 359. [Google Scholar]
- Garg, P.; Santhosh, J.; Dengel, A.; Ishimaru, S. Stress Detection by Machine Learning and Wearable Sensors. In Proceedings of the International Conference on Intelligent User Interfaces, Proceedings IUI, College Station, TX, USA, 14–17 April 2021; pp. 43–45. [Google Scholar] [CrossRef]
- Wang, X.; Xiao, Y.; Deng, F.; Chen, Y.; Zhang, H. Eye-Movement-Controlled Wheelchair Based on Flexible Hydrogel Biosensor and WT-SVM. Biosensors 2021, 11, 198. [Google Scholar] [CrossRef]
- Barayeu, U.; Horlava, N.; Libert, A.; van Hulle, M. Robust Single-Trial EEG-Based Authentication Achieved with a 2-Stage Classifier. Biosensors 2020, 10, 124. [Google Scholar] [CrossRef]
- Wu, C.C.; Chen, I.W.; Fang, W.C. An Implementation of Motion Artifacts Elimination for PPG Signal Processing Based on Recursive Least Squares Adaptive Filter. In Proceedings of the 2017 IEEE Biomedical Circuits and Systems Conference, BioCAS 2017, Turin, Italy, 19–21 October 2017; pp. 1–4. [Google Scholar] [CrossRef]
- Zhang, Z.; Pi, Z.; Liu, B. TROIKA: A General Framework for Heart Rate Monitoring Using Wrist-Type Photoplethysmographic Signals during Intensive Physical Exercise. IEEE Trans. Biomed. Eng. 2015, 62, 522–531. [Google Scholar] [CrossRef] [Green Version]
- Pan, H.; Temel, D.; Alregib, G. HeartBEAT: Heart Beat Estimation through Adaptive Tracking. In Proceedings of the 3rd IEEE EMBS International Conference on Biomedical and Health Informatics, BHI 2016, Las Vegas, NV, USA, 24–27 February 2016; pp. 587–590. [Google Scholar] [CrossRef] [Green Version]
- Kim, B.S.; Yoo, S.K. Motion Artifact Reduction in Photoplethysmography Using Independent Component Analysis. IEEE Trans. Biomed. Eng. 2006, 53, 566–568. [Google Scholar] [CrossRef]
- Zhang, Y.; Liu, B.; Zhang, Z. Combining Ensemble Empirical Mode Decomposition with Spectrum Subtraction Technique for Heart Rate Monitoring Using Wrist-Type Photoplethysmography. Biomed. Signal Process. Control 2015, 21, 119–125. [Google Scholar] [CrossRef]
- Khan, E.; Al Hossain, F.; Uddin, S.Z.; Alam, S.K.; Hasan, M.K. A Robust Heart Rate Monitoring Scheme Using Photoplethysmographic Signals Corrupted by Intense Motion Artifacts. IEEE Trans. Biomed. Eng. 2016, 63, 550–562. [Google Scholar] [CrossRef]
- Roy, B.; Gupta, R. MoDTRAP: Improved Heart Rate Tracking and Preprocessing of Motion-Corrupted Photoplethysmographic Data for Personalized Healthcare. Biomed. Signal Process. Control 2020, 56, 101676. [Google Scholar] [CrossRef]
- Galli, A.; Narduzzi, C.; Giorgi, G. Measuring Heart Rate during Physical Exercise by Subspace Decomposition and Kalman Smoothing. IEEE Trans. Instrum. Meas. 2018, 67, 1102–1110. [Google Scholar] [CrossRef]
- Wan, C.; Chen, D.; Yang, J.; Huang, M. Combining Parallel Adaptive Filtering and Wavelet Threshold Denoising for Photoplethysmography-Based Pulse Rate Monitoring during Intensive Physical Exercise. IEICE Trans. Inf. Syst. 2020, E103.D, 612–620. [Google Scholar] [CrossRef] [Green Version]
- Arunkumar, K.R.; Bhaskar, M. Heart Rate Estimation from Photoplethysmography Signal for Wearable Health Monitoring Devices. Biomed. Signal Process. Control 2019, 50, 1–9. [Google Scholar] [CrossRef]
- Wang, M.; Li, Z.; Zhang, Q.; Wang, G. Removal of Motion Artifacts in Photoplethysmograph Sensors during Intensive Exercise for Accurate Heart Rate Calculation Based on Frequency Estimation and Notch Filtering. Sensors 2019, 19, 3312. [Google Scholar] [CrossRef] [PubMed] [Green Version]
- Lin, W.-H.; Wang, H.; Samuel, W.; Fallet, S.; Vesin, J.-M. Robust Heart Rate Estimation Using Wrist-Type Photoplethysmographic Signals during Physical Exercise: An Approach Based on Adaptive Filtering. Physiol. Meas. 2017, 38, 155. [Google Scholar] [CrossRef]
- Kirch, W. (Ed.) Pearson’s Correlation Coefficient. In Encyclopedia of Public Health; Springer: Dordrecht, The Netherlands, 2008; pp. 1090–1091. [Google Scholar] [CrossRef]
- Guo, M.F.; Zeng, X.D.; Chen, D.Y.; Yang, N.C. Deep-Learning-Based Earth Fault Detection Using Continuous Wavelet Transform and Convolutional Neural Network in Resonant Grounding Distribution Systems. IEEE Sens. J. 2018, 18, 1291–1300. [Google Scholar] [CrossRef]
- Wu, Z.; Lan, T.; Yang, C.; Nie, Z. A Novel Method to Detect Multiple Arrhythmias Based on Time-Frequency Analysis and Convolutional Neural Networks. IEEE Access 2019, 7, 170820–170830. [Google Scholar] [CrossRef]
- Yamashita, R.; Nishio, M.; Do, R.K.G.; Togashi, K. Convolutional Neural Networks: An Overview and Application in Radiology. Insights Imaging 2018, 9, 611–629. [Google Scholar] [CrossRef] [Green Version]
- Krizhevsky, A.; Sutskever, I.; Hinton, G.E. ImageNet Classification with Deep Convolutional Neural Networks. Commun. ACM 2017, 60, 84–90. [Google Scholar] [CrossRef] [Green Version]
- Sokolova, M.; Japkowicz, N.; Szpakowicz, S. Beyond Accuracy, F-Score and ROC: A Family of Discriminant Measures for Performance Evaluation. AAAI Workshop Tech. Rep. 2006, WS-06-06, 24–29. [Google Scholar] [CrossRef]
- Atzori, M.; Cognolato, M.; Müller, H. Deep Learning with Convolutional Neural Networks Applied to Electromyography Data: A Resource for the Classification of Movements for Prosthetic Hands. Front. Neurorobot 2016, 10, 9. [Google Scholar] [CrossRef] [Green Version]
- Szegedy, C.; Liu, W.; Jia, Y.; Sermanet, P.; Reed, S.; Anguelov, D.; Erhan, D.; Vanhoucke, V.; Rabinovich, A. Going Deeper with Convolutions. In Proceedings of the IEEE Computer Society Conference on Computer Vision and Pattern Recognition, Boston, MA, USA, 7–12 June 2015; pp. 1–9. [Google Scholar] [CrossRef]
- He, K.; Zhang, X.; Ren, S.; Sun, J. Deep Residual Learning for Image Recognition. In Proceedings of the IEEE Computer Society Conference on Computer Vision and Pattern Recognition 2016, Las Vegas, NV, USA, 27–30 June 2016; pp. 770–778. [Google Scholar] [CrossRef]
- Huang, G.; Liu, Z.; van der Maaten, L.; Weinberger, K.Q. Densely Connected Convolutional Networks. In Proceedings of the 30th IEEE Conference on Computer Vision and Pattern Recognition, CVPR 2017, Honolulu, HI, USA, 21–26 July 2017; pp. 2261–2269. [Google Scholar] [CrossRef]


| Components | Specification |
|---|---|
| MAX30101 sensor | Operating Voltage: 1.8 V Operating Temp. (°C): −40 to +85 Size: 5.6 mm × 3.3 mm × 1.55 mm |
| BNO055 sensor | Acceleration Ranges: ±2 g/±4 g/±8 g/±16 g Operating Voltage: 3–5 V |
| Seeeduino XIAO MCU | Operating Voltage: 3.3 V/5 V CPU: 40 MHz ARM Cortex-M0+ Flash Memory: 256 Kb RAM: 32 KB Size: 20 mm × 7.5 mm × 3.5 mm I2C: 1 pair |
| nRF24l01module | Operating Voltage: 1.9–3.6 V Modulation: GFSK Data Rate: 250 kbps, 1 Mbps, and 2 Mbps Size: 2.9 cm × 5 cm × 1.2 cm |
| LiPo battery | Operating Voltage: 3.7 V Capacity: 500 mAh |
| LiPo battery charger | Capacity: 5 V, 1 A output |
| Length of Signal | Number of Training Data | Number of Testing Data |
|---|---|---|
| 3 s | 1320 | 360 |
| 5 s | 792 | 216 |
| Layer | Output Number | Kernel Size/Pool Size | Stride | Activation Function | Padding | Dropout Rate |
|---|---|---|---|---|---|---|
| Input layer | 1 | - | - | - | - | - |
| Conv1-1 | 64 | 3 × 3 | 2 × 2 | ReLU | same | - |
| Conv1-2 | 64 | 3 × 3 | 2 × 2 | ReLU | same | - |
| Maxpool | 64 | 3 × 3 | 2 × 2 | ReLU | valid | - |
| Droupout1 | 64 | - | - | - | - | 0.25 |
| Flatten | - | - | - | - | - | - |
| FC1 | 128 | - | - | ReLU | - | - |
| Droupout2 | 128 | - | - | - | - | 0.5 |
| FC2 | 1 | - | - | Sigmoid | - | - |
| Parameter Tuning for CNN | |
|---|---|
| Optimizer | Adam, RMSprop, SGDM |
| Learning Rate | 1 × 10⁻⁴ |
| Max. Epochs | 50 |
| Validation Patience | 10 |
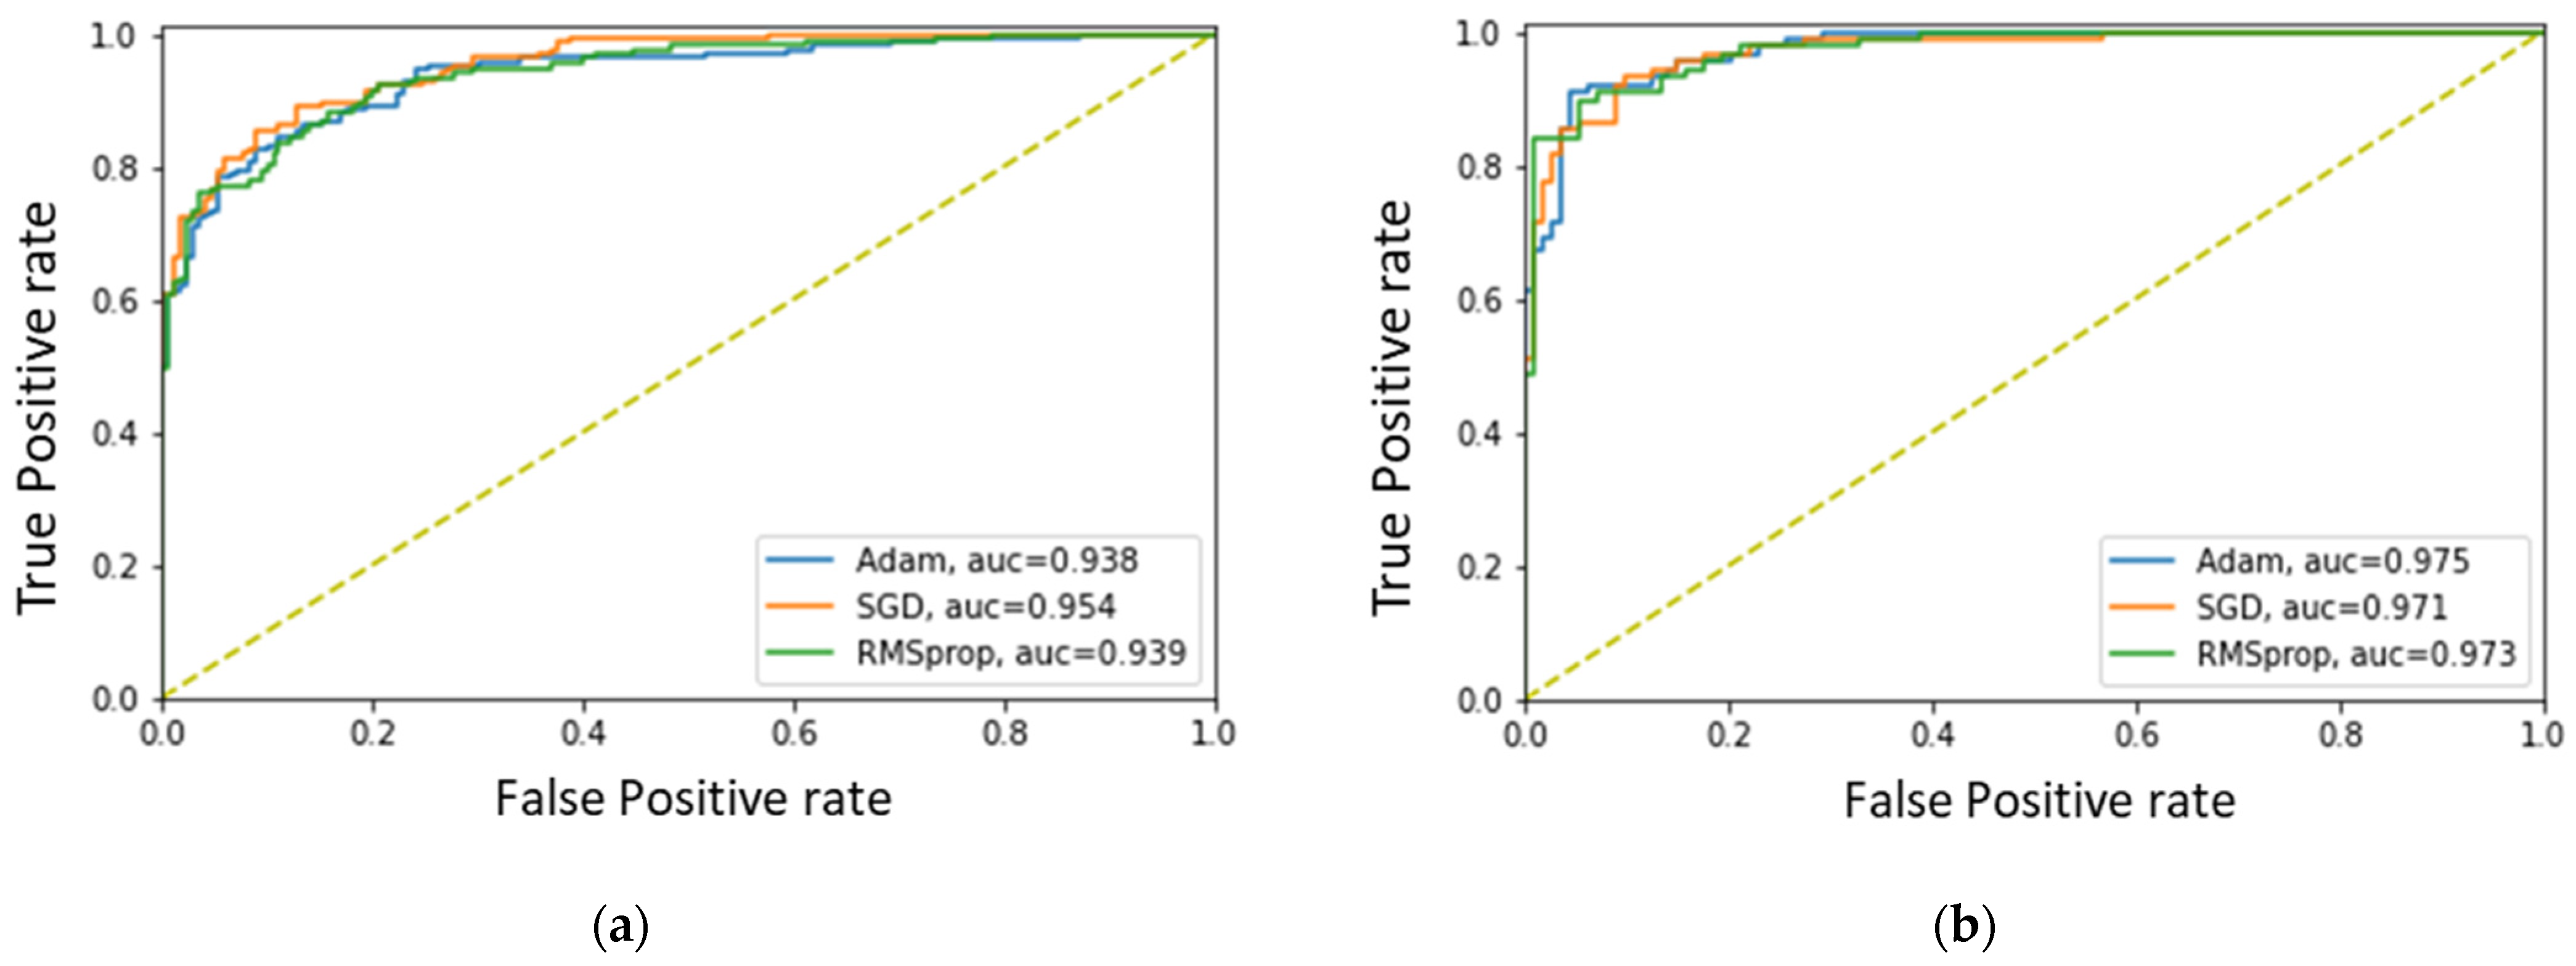
| Optimizers | LR | Accuracy (%) | Precision (%) | Recall (%) | F1-Score (%) | Elapsed Time |
|---|---|---|---|---|---|---|
| Adam | 0.0001 | 86.01 | 84.39 | 87.95 | 86.14 | 21 min 11 s |
| RMSprop | 0.0001 | 88.1 | 85.8 | 90.96 | 88.3 | 23 min 36 s |
| SGDM | 0.0001 | 86.61 | 86.67 | 86.14 | 86.4 | 52 min 52 s |
| Optimizers | LR | Accuracy (%) | Precision (%) | Recall (%) | F1-Score (%) | Elapsed Time |
|---|---|---|---|---|---|---|
| Adam | 0.0001 | 91.54 | 87.91 | 90.91 | 89.39 | 9 min 49 s |
| RMSprop | 0.0001 | 92.04 | 91.86 | 89.77 | 90.8 | 14 min 38 s |
| SGDM | 0.0001 | 90.05 | 94.74 | 81.82 | 87.8 | 28 min 55 s |
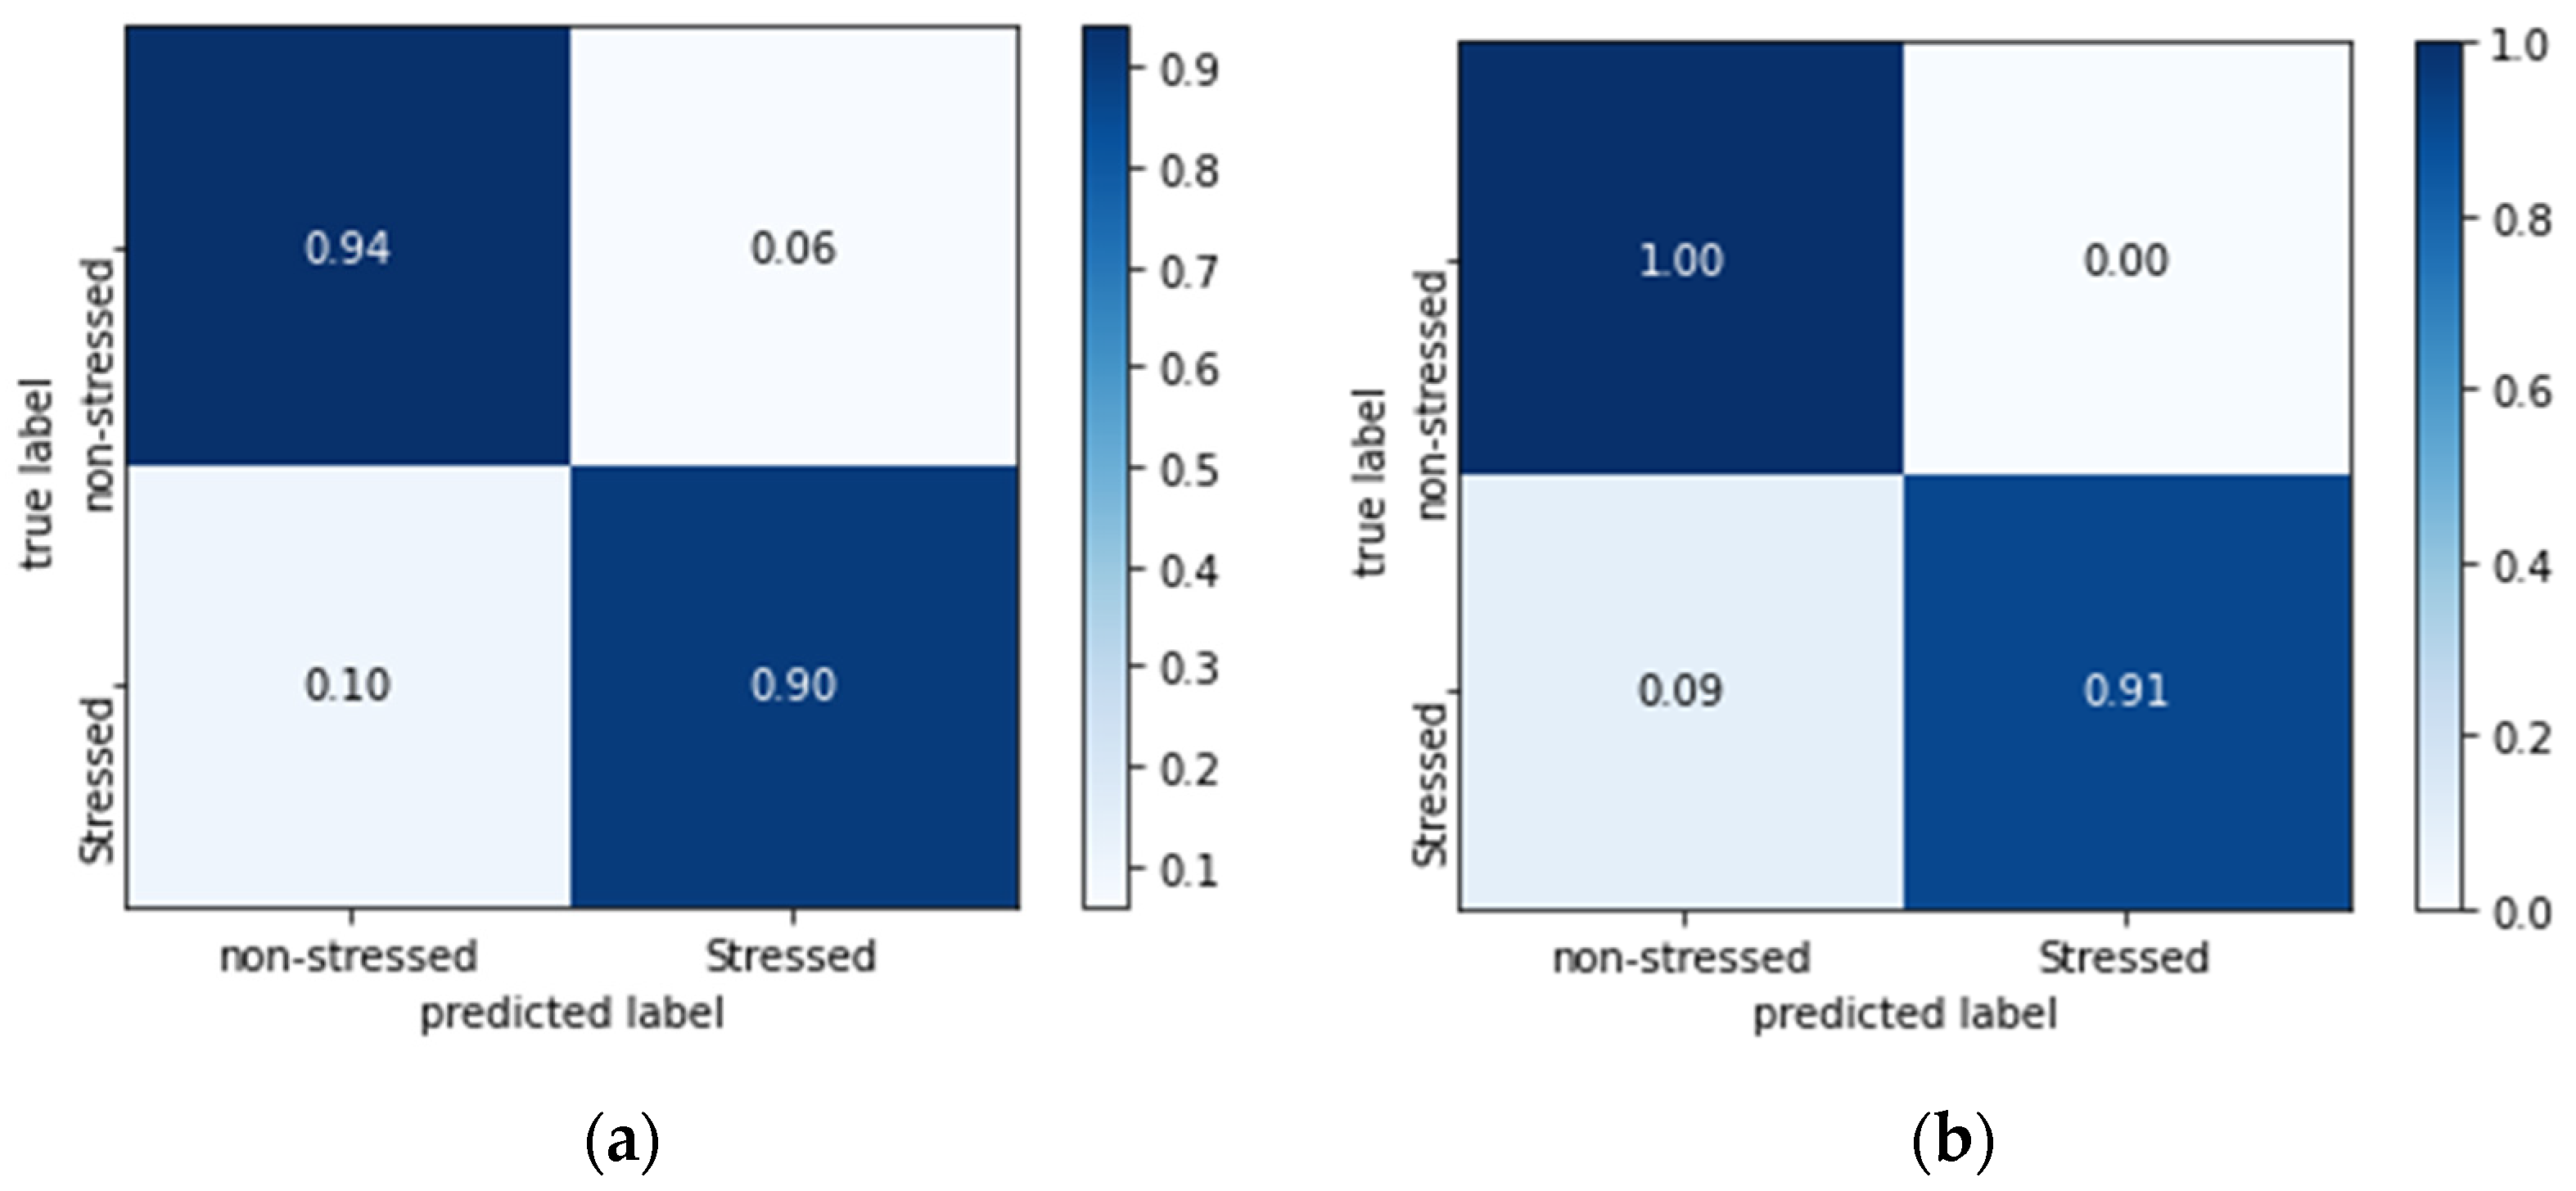
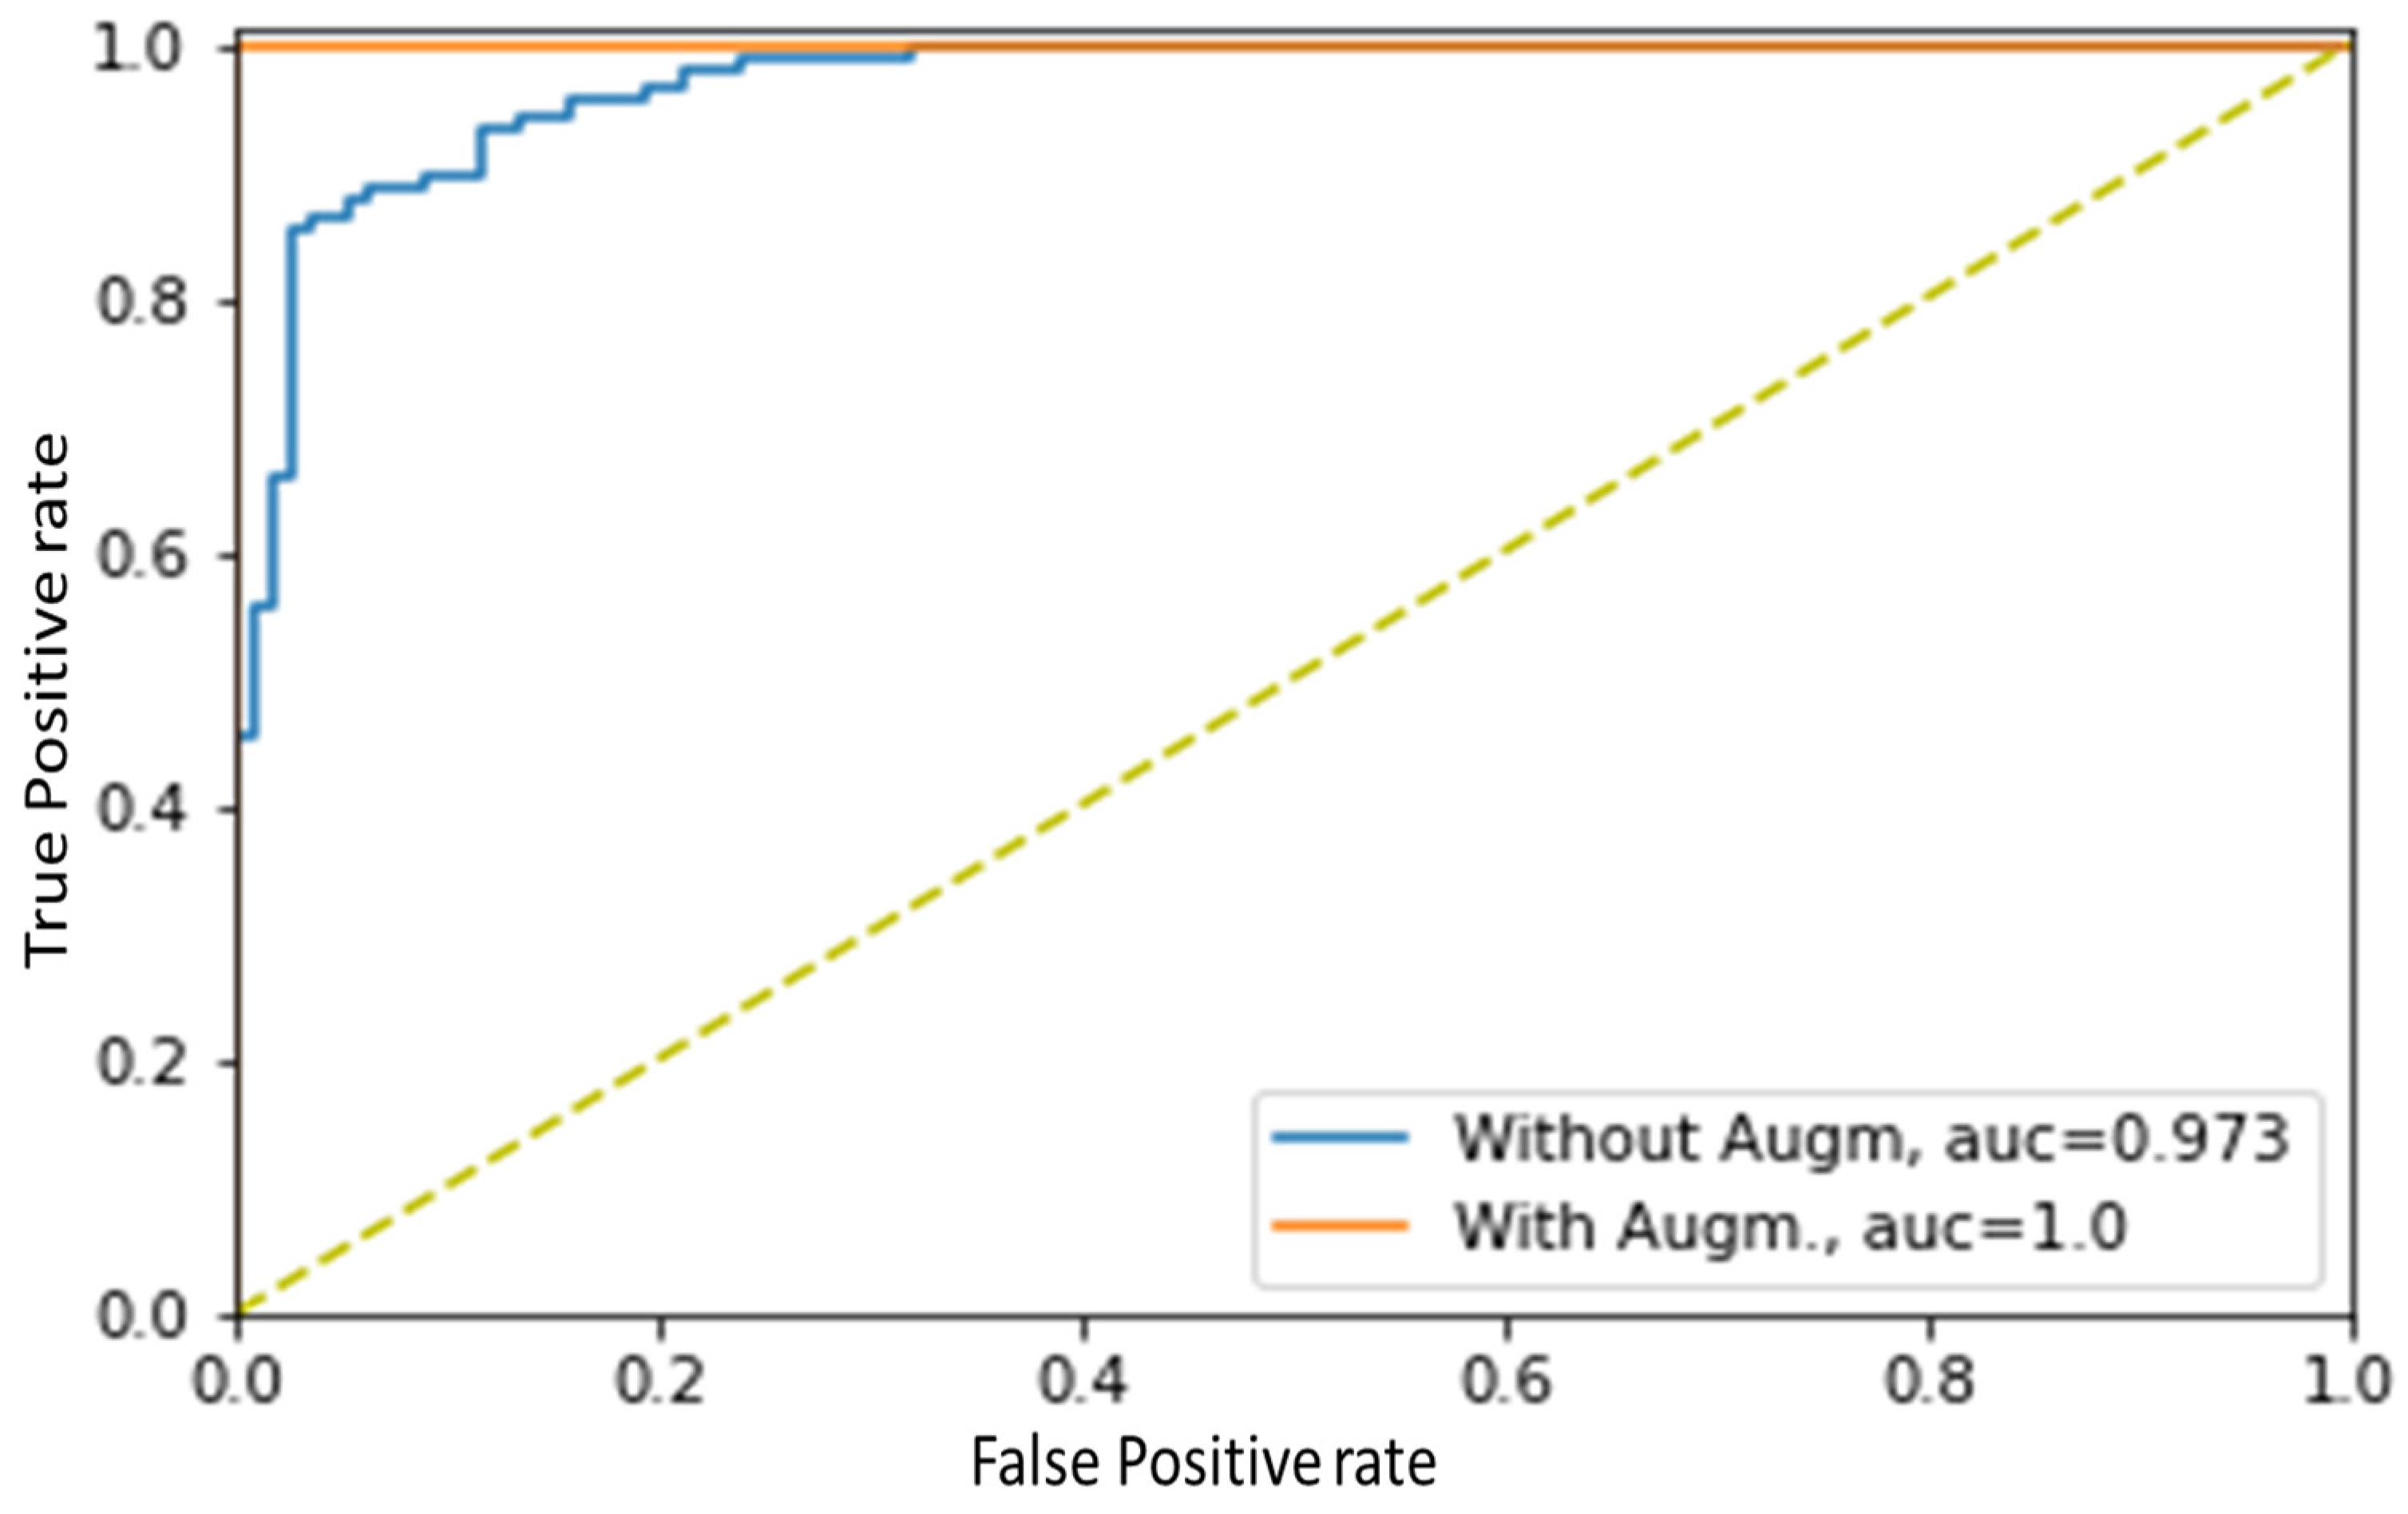
| Evaluation Metrics (in %) | Without Data Augmentation | With Data Augmentation |
|---|---|---|
| Accuracy | 92.04 | 96.02 |
| Precision | 91.86 | 100 |
| Recall | 89.77 | 90.91 |
| F1-Score | 90.8 | 95.24 |
| AUC | 97.3 | 100 |
| Elapsed time | 14 min 38 s | 36 min 35 s |
| Models | LR | Optimizer | Accuracy | Precision | Recall | F1-Score | Elapsed Time |
|---|---|---|---|---|---|---|---|
| GoogleNet | 0.0001 | RMSprop | 90.1 | 93.54 | 86.13 | 89.69 | 21 min 11 s |
| ResNet101 | 0.0001 | RMSprop | 90.59 | 89.22 | 89.11 | 90.58 | 32 min 56 s |
| ResNet-50 | 0.0001 | RMSprop | 90.59 | 92.71 | 88.12 | 90.56 | 35 min 43 s |
| DenseNet-201 | 0.0001 | RMSprop | 88.61 | 86.79 | 91.09 | 88.89 | 33 min 46 s |
| Proposed CNN | 0.0001 | RMSprop | 92.04 | 91.86 | 89.77 | 90.8 | 14 min 38 s |
Disclaimer/Publisher’s Note: The statements, opinions and data contained in all publications are solely those of the individual author(s) and contributor(s) and not of MDPI and/or the editor(s). MDPI and/or the editor(s) disclaim responsibility for any injury to people or property resulting from any ideas, methods, instructions or products referred to in the content. |
© 2023 by the authors. Licensee MDPI, Basel, Switzerland. This article is an open access article distributed under the terms and conditions of the Creative Commons Attribution (CC BY) license (https://creativecommons.org/licenses/by/4.0/).
Share and Cite
Barki, H.; Chung, W.-Y. Mental Stress Detection Using a Wearable In-Ear Plethysmography. Biosensors 2023, 13, 397. https://doi.org/10.3390/bios13030397
Barki H, Chung W-Y. Mental Stress Detection Using a Wearable In-Ear Plethysmography. Biosensors. 2023; 13(3):397. https://doi.org/10.3390/bios13030397
Chicago/Turabian StyleBarki, Hika, and Wan-Young Chung. 2023. "Mental Stress Detection Using a Wearable In-Ear Plethysmography" Biosensors 13, no. 3: 397. https://doi.org/10.3390/bios13030397