Current Advances in Technologies for Single Extracellular Vesicle Analysis and Its Clinical Applications in Cancer Diagnosis

Abstract
:1. Introduction
2. Current Advances in the Single EV Analysis Techniques
2.1. Electron Microscopy-Based Methods for the Single EV Morphology Characterization
2.2. Enumeration Techniques for Single EVs

2.3. Techniques for the Single EV Molecular Analysis
2.3.1. High-Sensitivity Flow Cytometer
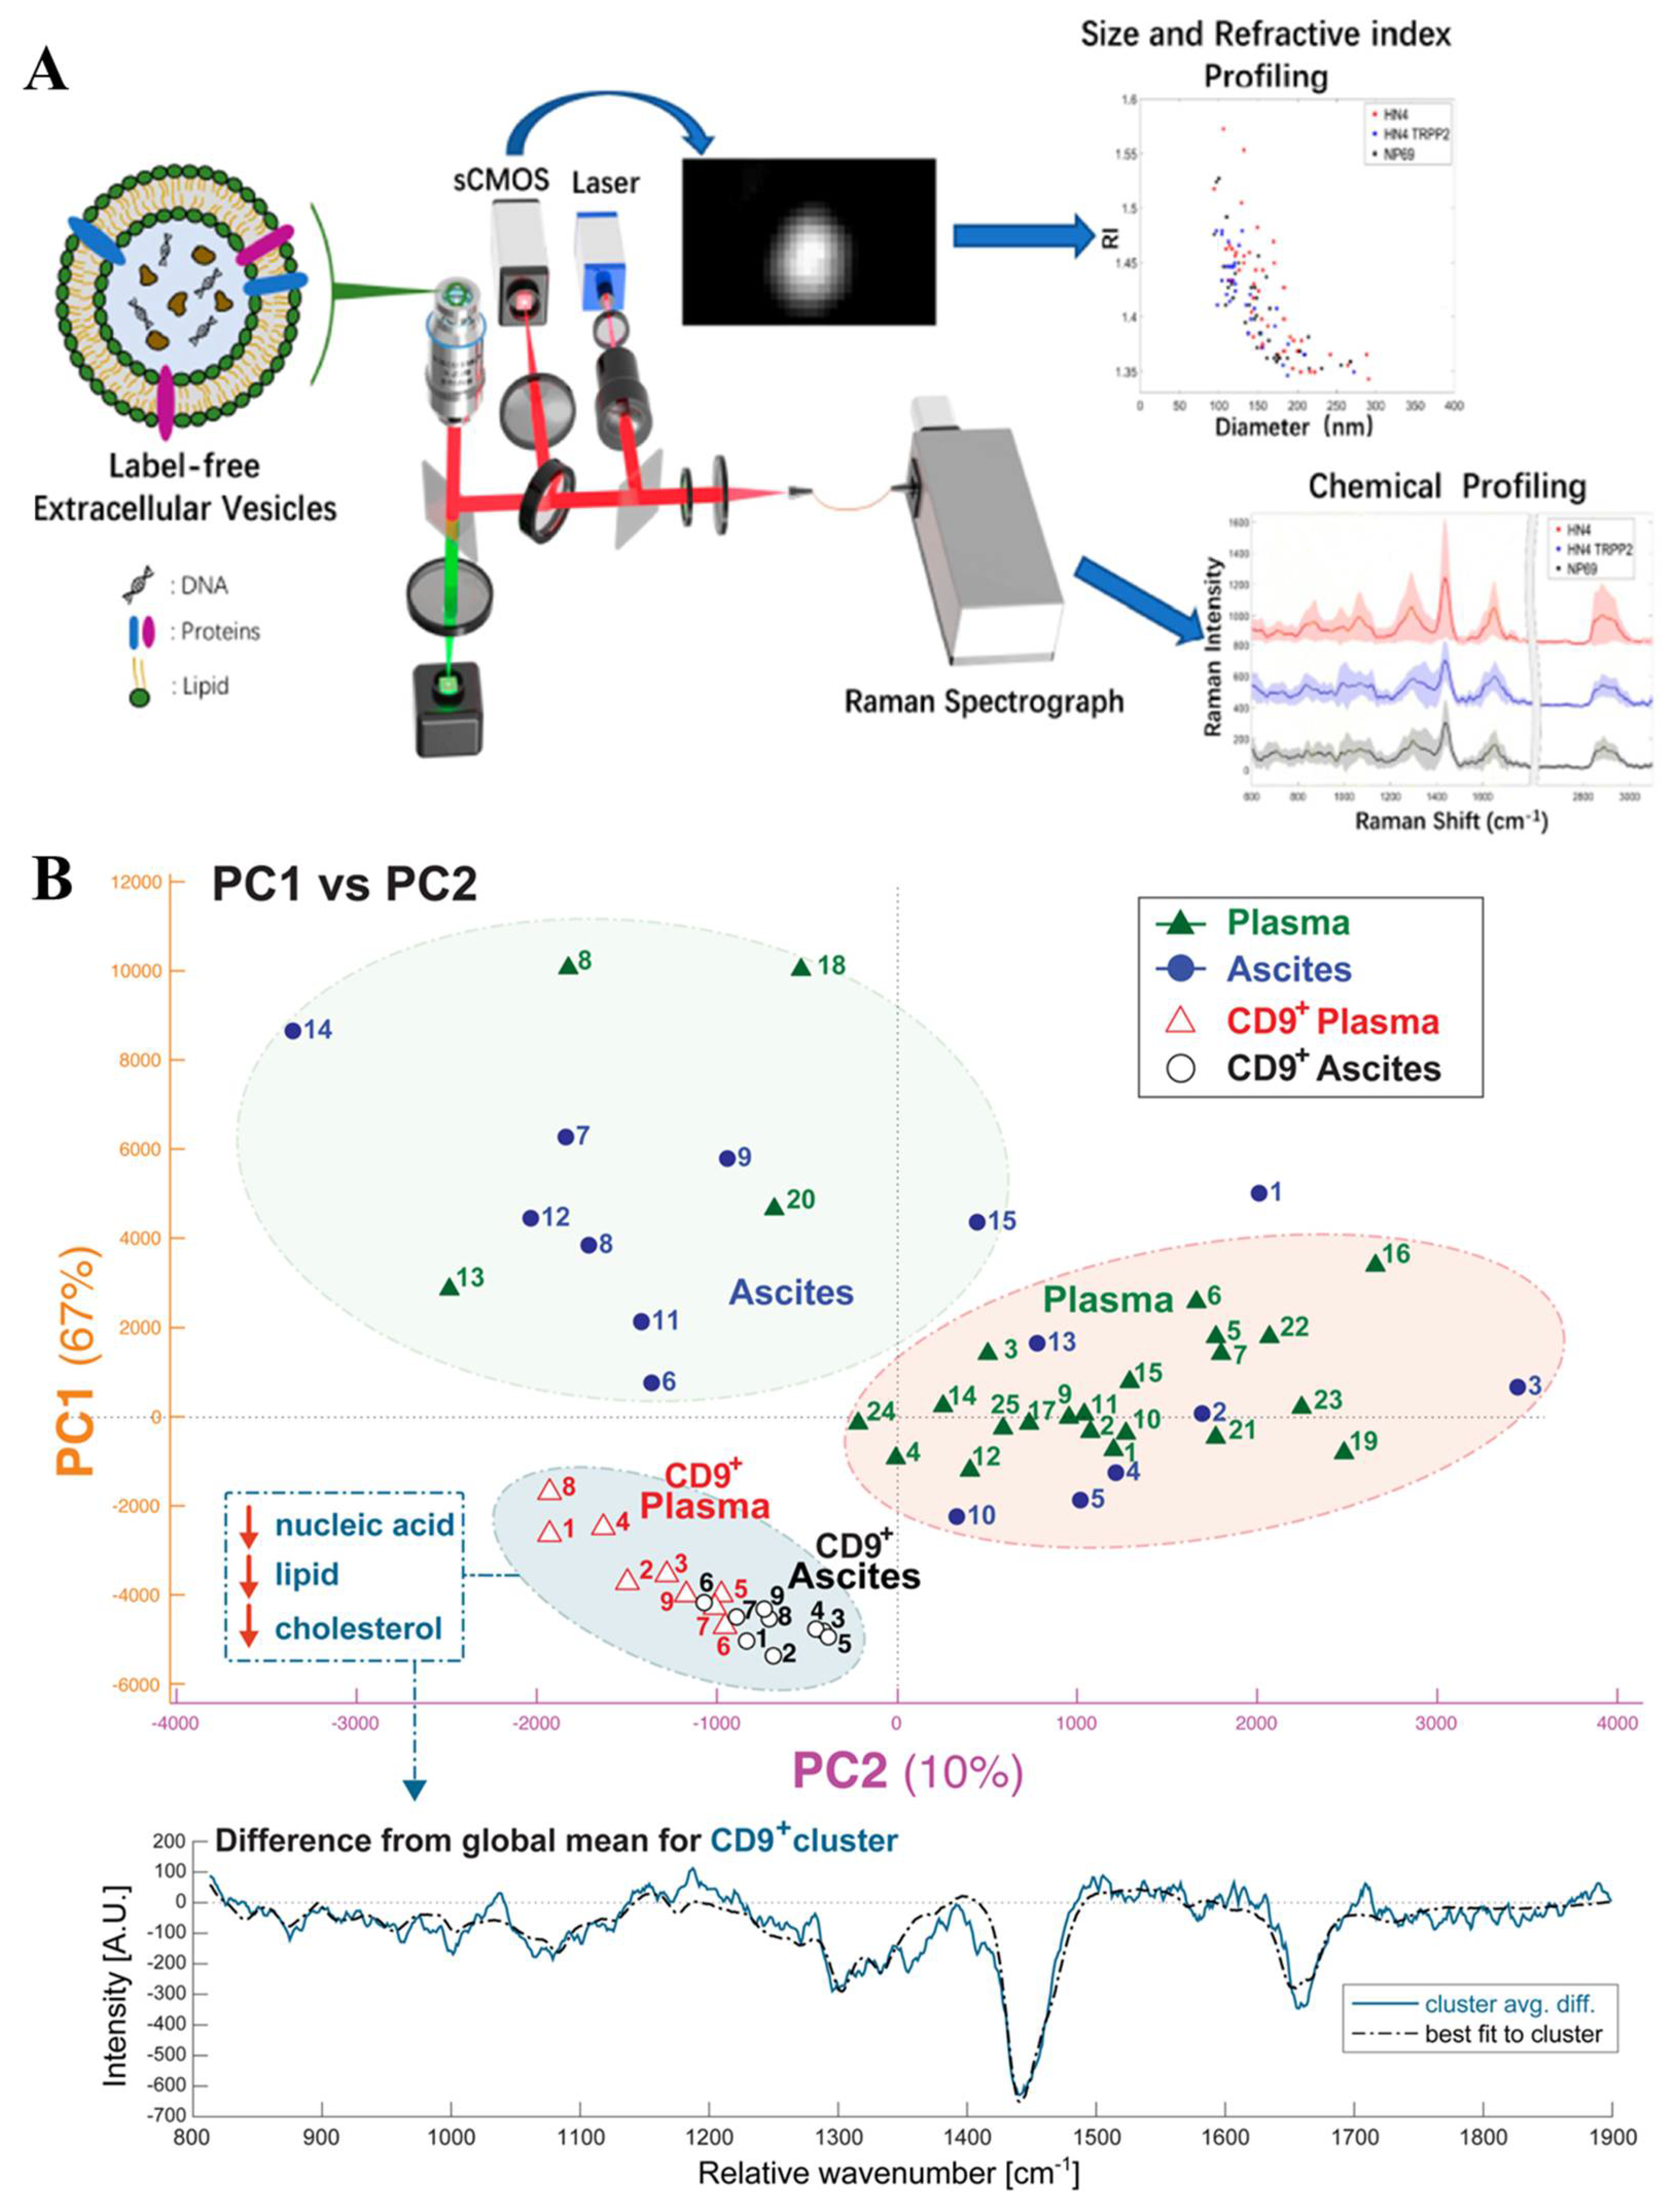
2.3.2. Raman Spectroscopy-Based Technique
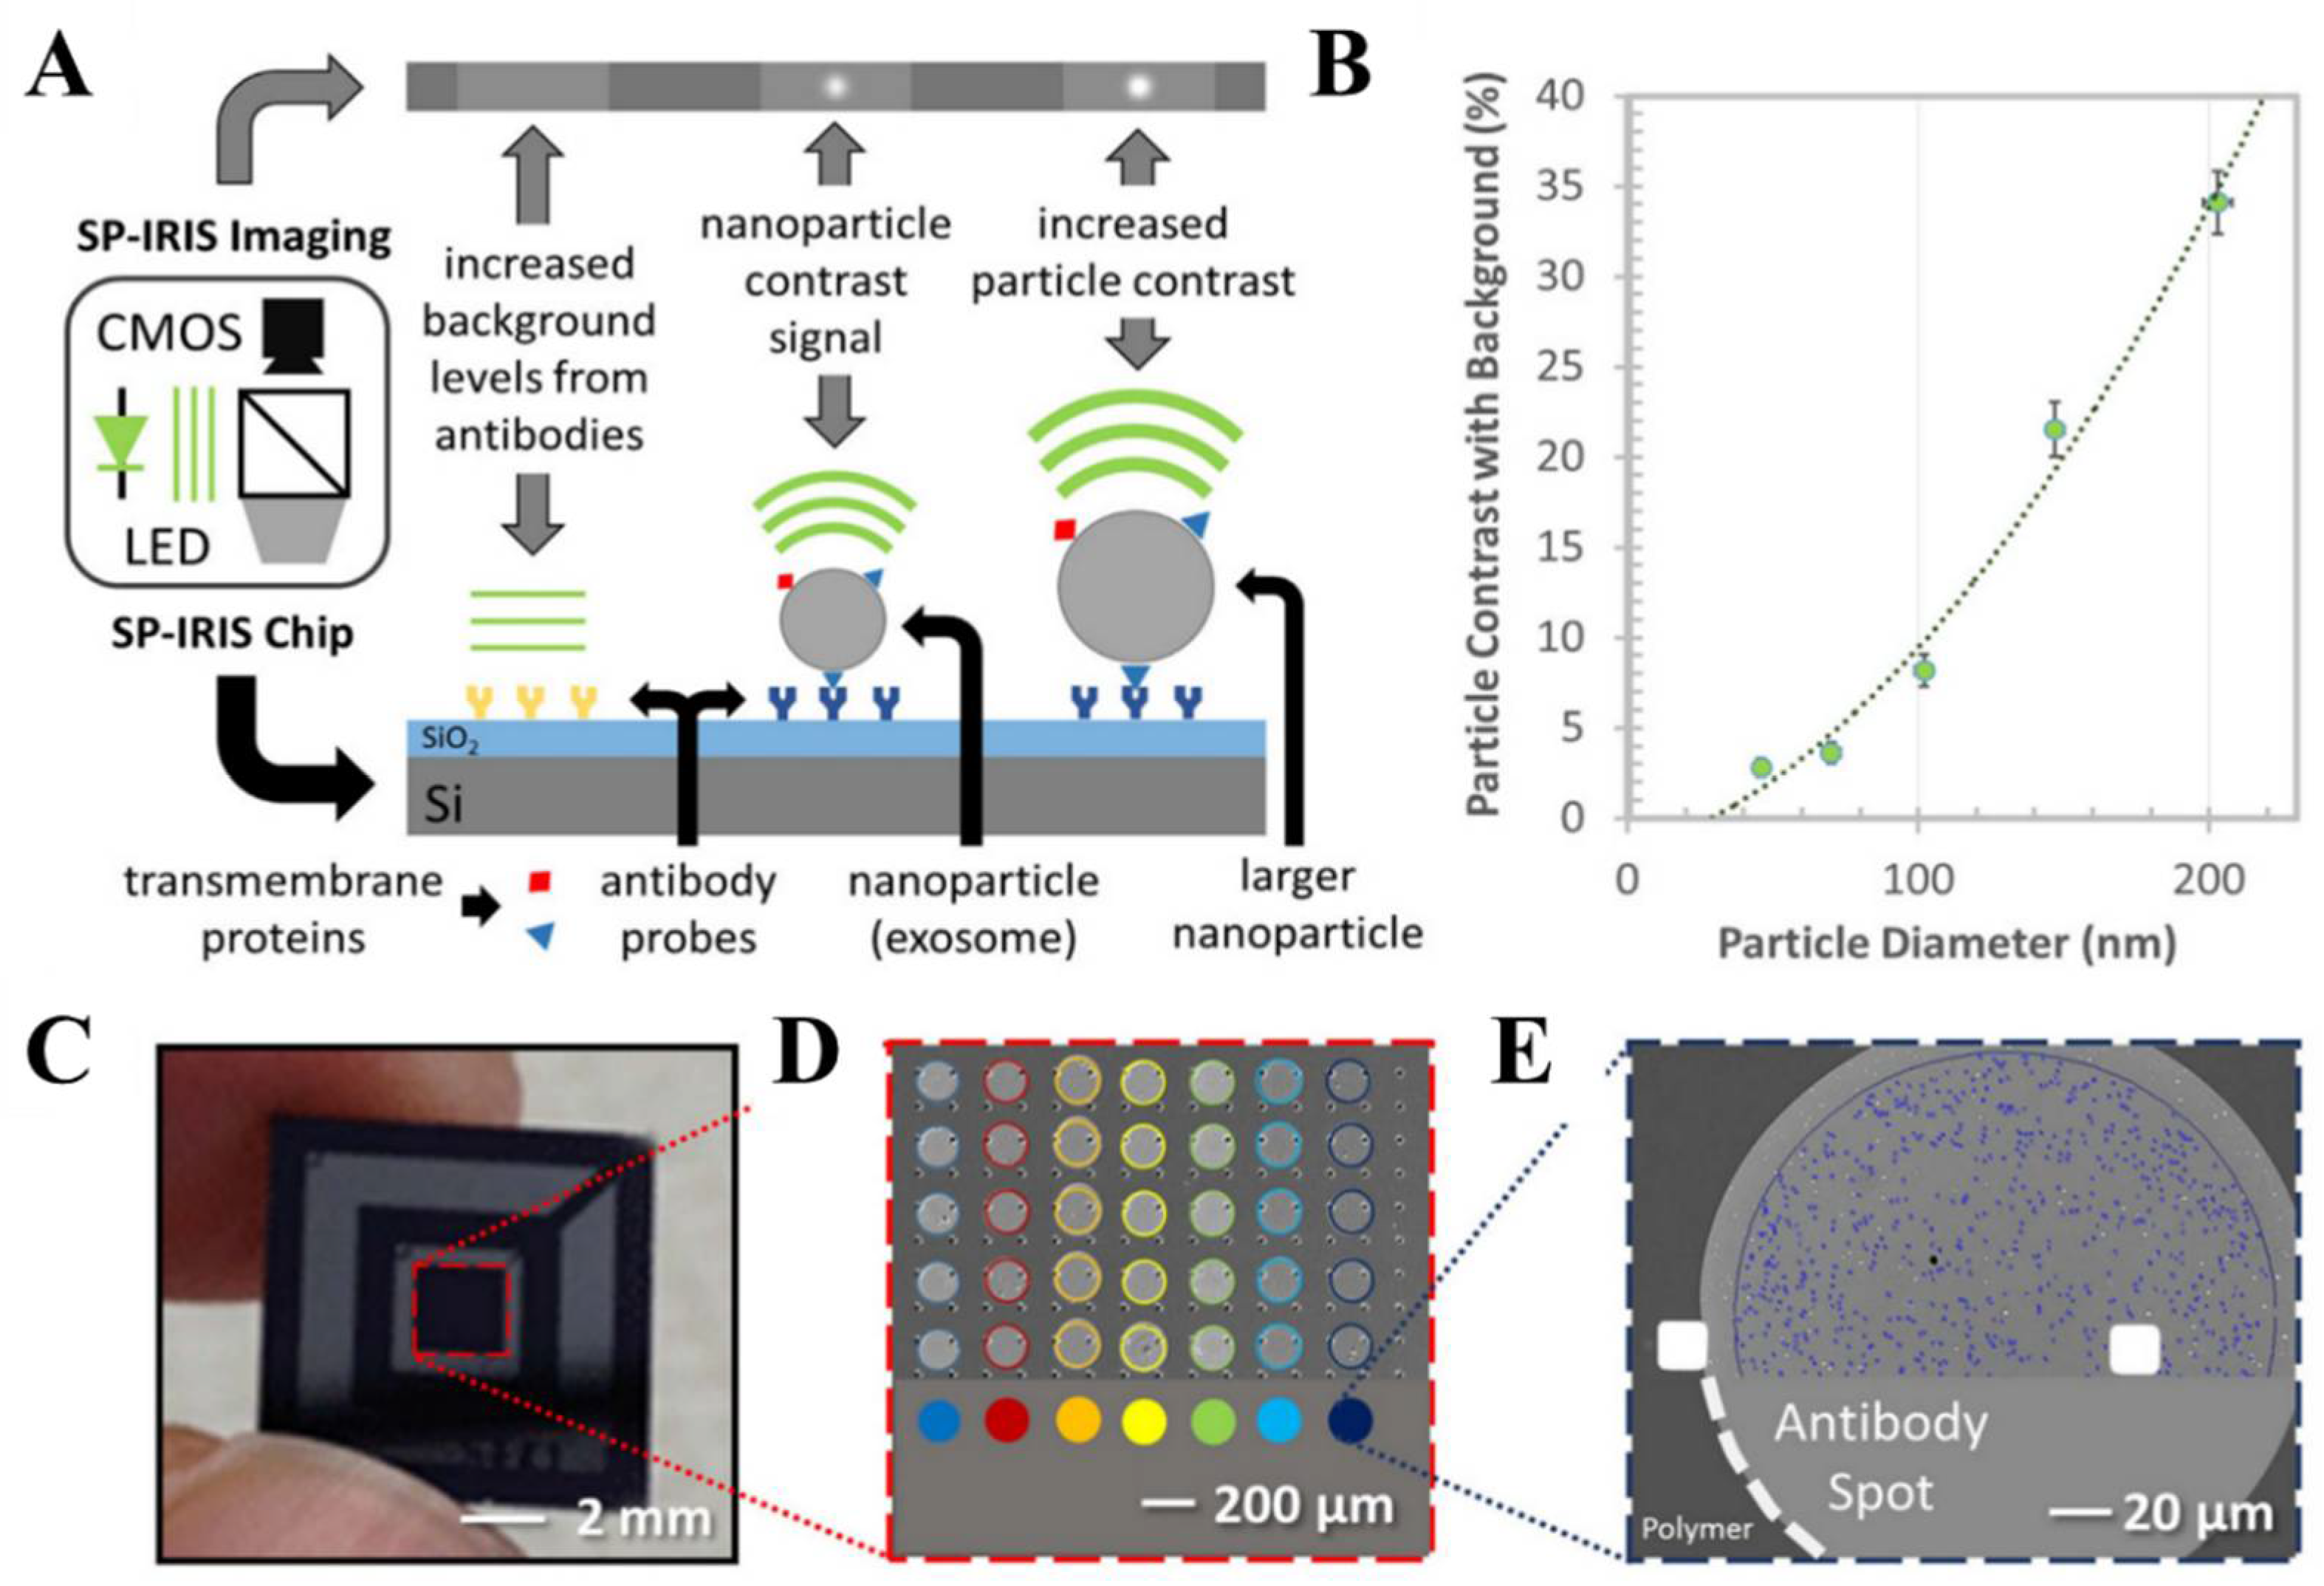
2.3.3. Single Particle Interferometric Imaging Sensing (SP-IRIS) Technology
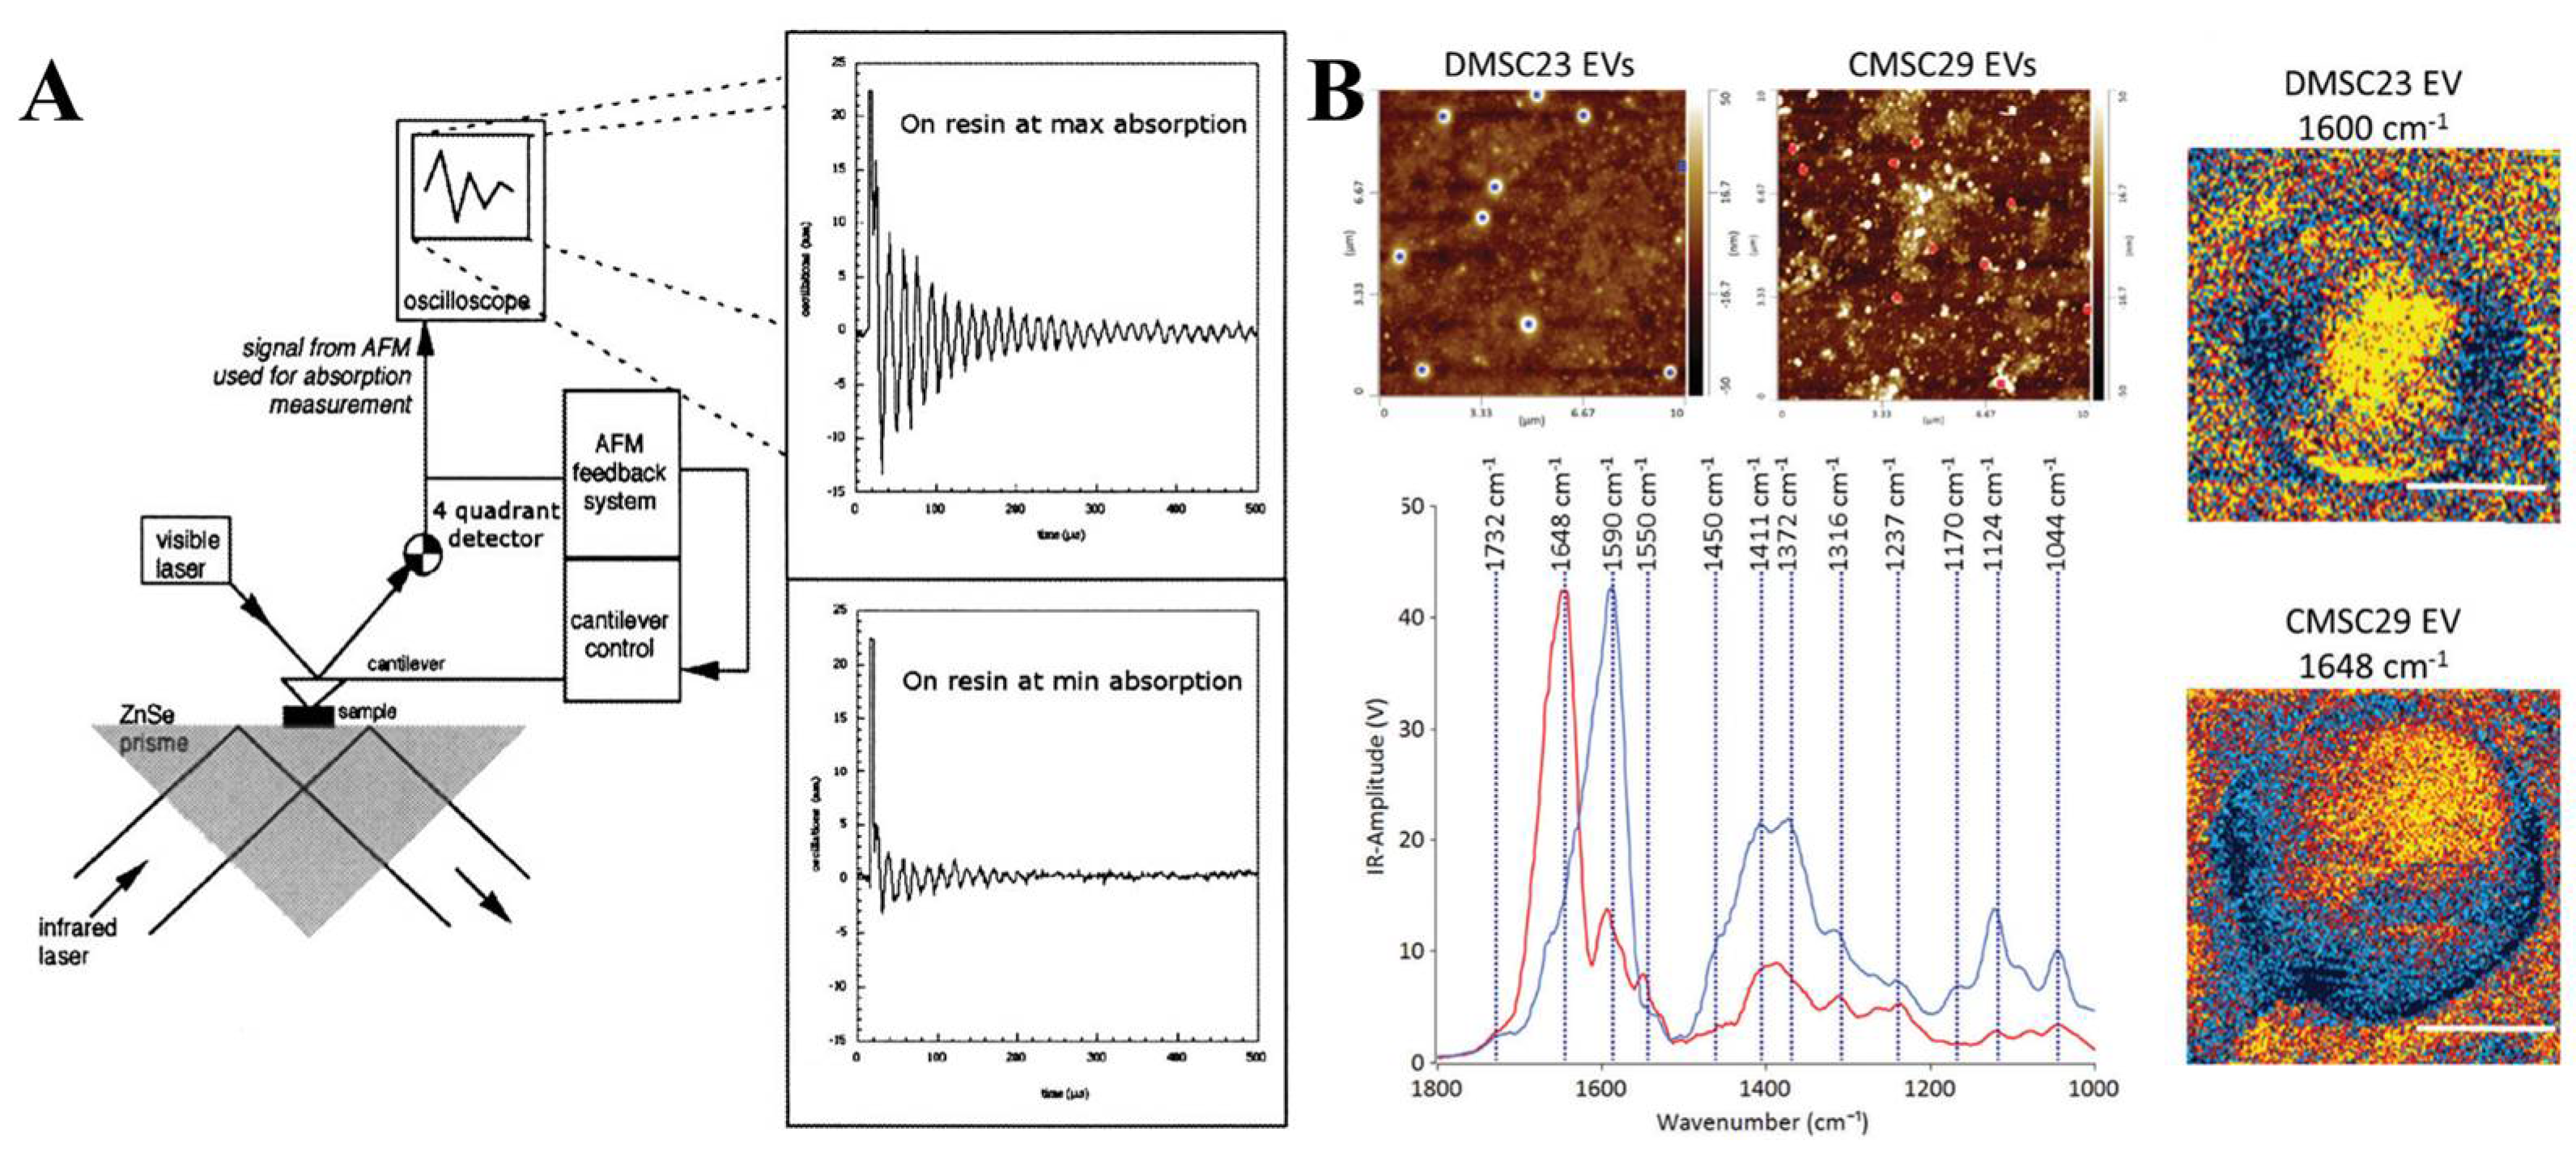
2.3.4. Atomic Force Microscope—Infrared Spectroscopy (AFM-IR)
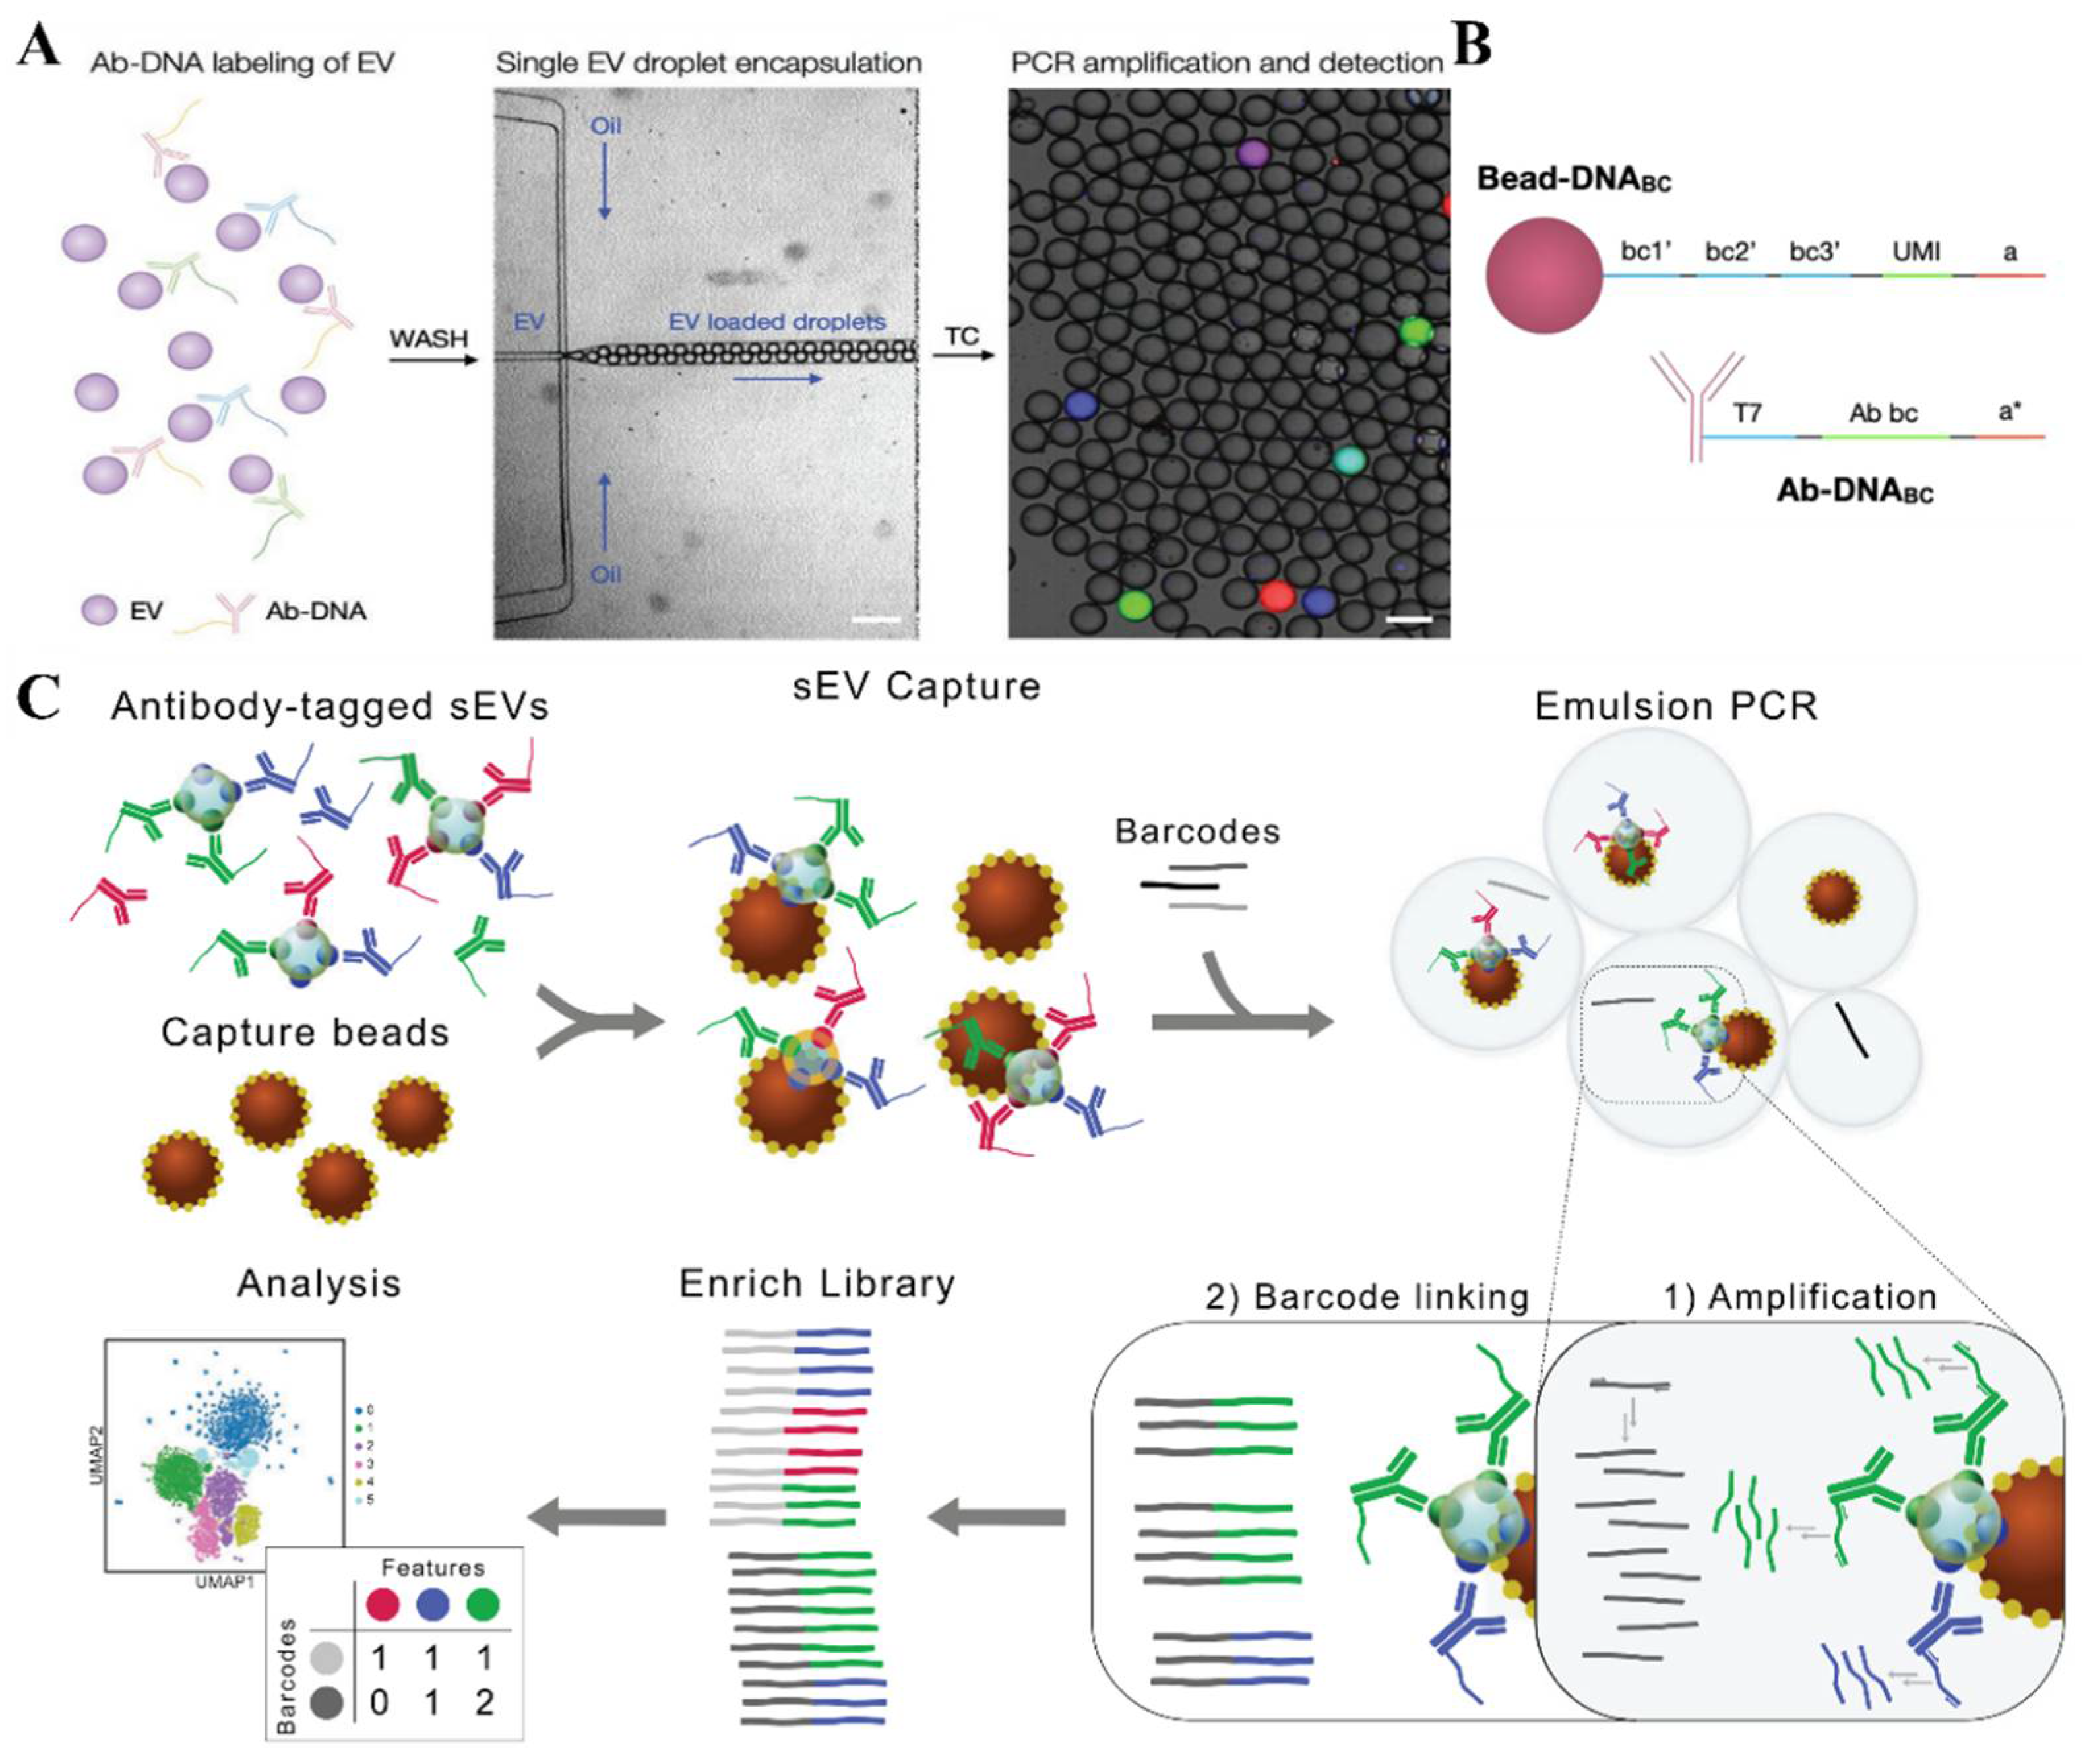
2.3.5. Droplet Digital Polymerase Chain Reaction (ddPCR) Technology
3. Clinical Applications of the Single EV Analysis in Early Cancer Detection
3.1. Subpopulation Analysis
3.2. Protein Profiling
3.3. RNA Analysis
4. Conclusions and Outlook
Author Contributions
Funding
Institutional Review Board Statement
Informed Consent Statement
Data Availability Statement
Conflicts of Interest
References
- Fais, S.; O’Driscoll, L.; Borras, F.E.; Buzas, E.; Camussi, G.; Cappello, F.; Carvalho, J.; da Silva, A.C.; Del Portillo, H.; El Andaloussi, S.; et al. Evidence-Based Clinical Use of Nanoscale Extracellular Vesicles in Nanomedicine. ACS Nano 2016, 10, 3886–3899. [Google Scholar] [CrossRef] [PubMed]
- Doyle, L.M.; Wang, M.Z. Overview of Extracellular Vesicles, Their Origin, Composition, Purpose, and Methods for Exosome Isolation and Analysis. Cells 2019, 8, 727. [Google Scholar] [CrossRef] [Green Version]
- Kilinc, S.; Paisner, R.; Camarda, R.; Gupta, S.; Momcilovic, O.; Kohnz, R.A.; Avsaroglu, B.; L’Etoile, N.D.; Perera, R.M.; Nomura, D.K.; et al. Oncogene-regulated release of extracellular vesicles. Dev. Cell 2021, 56, 1989–2006. [Google Scholar] [CrossRef]
- Nizamudeen, Z.A.; Xerri, R.; Parmenter, C.; Suain, K.; Markus, R.; Chakrabarti, L.; Sottile, V. Low-Power Sonication Can Alter Extracellular Vesicle Size and Properties. Cells 2021, 10, 2413. [Google Scholar] [CrossRef]
- Wang, J.; Cao, Z.; Wang, P.; Zhang, X.; Tang, J.; He, Y.; Huang, Z.; Mao, X.; Shi, S.; Kou, X. Apoptotic Extracellular Vesicles Ameliorate Multiple Myeloma by Restoring Fas-Mediated Apoptosis. ACS Nano 2021, 15, 14360–14372. [Google Scholar] [CrossRef] [PubMed]
- Johnstone, R.M.; Adam, M.; Hammond, J.R.; Orr, L.; Turbide, C. Vesicle formation during reticulocyte maturation—Association of plasma-membrane activities with released vesicles (exosomes). J. Biol. Chem. 1987, 262, 9412–9420. [Google Scholar] [CrossRef]
- Dalton, A.J. Microvesicles and vesicles of multivesicular bodies versus virus-like particles. J. Natl. Cancer Inst. 1975, 54, 1137–1148. [Google Scholar] [CrossRef]
- Michael, A.; Bajracharya, S.D.; Yuen, P.S.T.; Zhou, H.; Star, R.A.; Illei, G.G.; Alevizos, I. Exosomes from human saliva as a source of microRNA biomarkers. Oral Dis. 2010, 16, 34–38. [Google Scholar] [CrossRef] [Green Version]
- Karimi, N.; Cvjetkovic, A.; Jang, S.C.; Crescitelli, R.; Feizi, M.A.H.; Nieuwland, R.; Lotvall, J.; Lasser, C. Detailed analysis of the plasma extracellular vesicle proteome after separation from lipoproteins. Cell. Mol. Life Sci. 2018, 75, 2873–2886. [Google Scholar] [CrossRef] [PubMed] [Green Version]
- Erdbrugger, U.; Blijdorp, C.J.; Bijnsdorp, I.V.; Borras, F.E.; Burger, D.; Bussolati, B.; Byrd, J.B.; Clayton, A.; Dear, J.W.; Falcon-Perez, J.M.; et al. Urinary extracellular vesicles: A position paper by the Urine Task Force of the International Society for Extracellular Vesicles. J. Extracell. Vesicles 2021, 10, 7. [Google Scholar] [CrossRef]
- Bozack, A.K.; Colicino, E.; Rodosthenous, R.; Bloomquist, T.R.; Baccarelli, A.A.; Wright, R.O.; Wright, R.J.; Lee, A.G. Associations between maternal lifetime stressors and negative events in pregnancy and breast milk-derived extracellular vesicle microRNAs in the programming of intergenerational stress mechanisms (PRISM) pregnancy cohort. Epigenetics 2021, 16, 389–404. [Google Scholar] [CrossRef] [PubMed]
- Mercadal, M.; Herrero, C.; Lopez-Rodrigo, O.; Castells, M.; de la Fuente, A.; Vigues, F.; Bassas, L.; Larriba, S. Impact of Extracellular Vesicle Isolation Methods on Downstream miRNA Analysis in Semen: A Comparative Study. Int. J. Mol. Sci. 2020, 21, 5949. [Google Scholar] [CrossRef] [PubMed]
- Delauzun, V.; Amigues, B.; Gaubert, A.; Leone, P.; Grange, M.; Gauthier, L.; Roussel, A. Extracellular vesicles as a platform to study cell-surface membrane proteins. Methods 2020, 180, 35–44. [Google Scholar] [CrossRef]
- Gerth, K.; Kodidela, S.; Mahon, M.; Haque, S.; Verma, N.; Kumar, S. Circulating Extracellular Vesicles Containing Xenobiotic Metabolizing CYP Enzymes and Their Potential Roles in Extrahepatic Cells Via Cell-Cell Interactions. Int. J. Mol. Sci. 2019, 20, 6178. [Google Scholar] [CrossRef] [Green Version]
- Hagey, D.W.; Kordes, M.; Gorgens, A.; Mowoe, M.O.; Nordin, J.Z.; Moro, C.F.; Lohr, J.M.; El Andaloussi, S. Extracellular vesicles are the primary source of blood-borne tumour-derived mutant KRAS DNA early in pancreatic cancer. J. Extracell. Vesicles 2021, 10, 12. [Google Scholar] [CrossRef]
- Harrell, C.R.; Jovicic, N.; Djonov, V.; Arsenijevic, N.; Volarevic, V. Mesenchymal Stem Cell-Derived Exosomes and Other Extracellular Vesicles as New Remedies in the Therapy of Inflammatory Diseases. Cells 2019, 8, 1605. [Google Scholar] [CrossRef] [Green Version]
- Garcia-Martin, R.; Wang, G.; Brandao, B.B.; Zanotto, T.M.; Shah, S.; Patel, S.K.; Schilling, B.; Kahn, C.R. MicroRNA sequence codes for small extracellular vesicle release and cellular retention. Nature 2022, 601, 446–474. [Google Scholar] [CrossRef] [PubMed]
- Su, H.; Rustam, Y.H.; Masters, C.L.; Makalic, E.; McLean, C.A.; Hill, A.F.; Barnham, K.J.; Reid, G.E.; Vella, L.J. Characterization of brain-derived extracellular vesicle lipids in Alzheimer’s disease. J. Extracell. Vesicles 2021, 10, 7. [Google Scholar] [CrossRef]
- Popena, I.; Abols, A.; Saulite, L.; Pleiko, K.; Zandberga, E.; Jekabsons, K.; Endzelins, E.; Llorente, A.; Line, A.; Riekstina, U. Effect of colorectal cancer-derived extracellular vesicles on the immunophenotype and cytokine secretion profile of monocytes and macrophages. Cell Commun. Signal. 2018, 16, 17. [Google Scholar] [CrossRef] [PubMed] [Green Version]
- Hasegawa, K.; Kuwata, K.; Yoshitake, J.; Shimomura, S.; Uchida, K.; Shibata, T. Extracellular vesicles derived from inflamed murine colorectal tissue induce fibroblast proliferation via epidermal growth factor receptor. FEBS J. 2021, 288, 1906–1917. [Google Scholar] [CrossRef] [PubMed]
- Mulvey, H.E.; Chang, A.; Adler, J.; Del Tatto, M.; Perez, K.; Quesenberry, P.J.; Chatterjee, D. Extracellular vesicle-mediated phenotype switching in malignant and non-malignant colon cells. BMC Cancer 2015, 15, 571. [Google Scholar] [CrossRef]
- Li, J.-W.; Shi, D.; Wan, X.-C.; Hu, J.; Su, Y.-F.; Zeng, Y.-P.; Hu, Z.-J.; Yu, B.-H.; Zhang, Q.-L.; Wei, P.; et al. Universal extracellular vesicles and PD-L1+extracellular vesicles detected by single molecule array technology as circulating biomarkers for diffuse large B cell lymphoma. Oncoimmunology 2021, 10, 1. [Google Scholar] [CrossRef]
- Gwak, H.; Park, S.; Kim, J.; Lee, J.D.; Kim, I.-S.; Kim, S.-I.; Hyun, K.-A.; Jung, H.-I. Microfluidic chip for rapid and selective isolation of tumor-derived extracellular vesicles for early diagnosis and metastatic risk evaluation of breast cancer. Biosens. Bioelectron. 2021, 192, 113495. [Google Scholar] [CrossRef]
- Maire, C.L.; Fuh, M.M.; Kaulich, K.; Fita, K.D.; Stevic, I.; Heiland, D.H.; Welsh, J.A.; Jones, J.C.; Goergens, A.; Ricklefs, T.; et al. Genome-wide methylation profiling of glioblastoma cell-derived extracellular vesicle DNA allows tumor classification. Neuro Oncol. 2021, 23, 1087–1099. [Google Scholar] [CrossRef]
- Nabariya, D.K.; Pallu, R.; Yenuganti, V.R. Exosomes: The protagonists in the tale of colorectal cancer? BBA-Rev. Cancer 2020, 1874, 2. [Google Scholar] [CrossRef] [PubMed]
- Sourani, A.; Saghaei, S.; Sabouri, M.; Soleimani, M.; Dehghani, L. A systematic review of extracellular vesicles as non-invasive biomarkers in glioma diagnosis, prognosis, and treatment response monitoring. Mol. Biol. Rep. 2021, 48, 6971–6985. [Google Scholar] [CrossRef] [PubMed]
- Nanou, A.; Mol, L.; Coumans, F.A.W.; Koopman, M.; Punt, C.J.A.; Terstappen, L.W.M.M. Endothelium-Derived Extracellular Vesicles Associate with Poor Prognosis in Metastatic Colorectal Cancer. Cells 2020, 9, 2688. [Google Scholar] [CrossRef] [PubMed]
- Park, J.; Park, J.S.; Huang, C.-H.; Jo, A.; Cook, K.; Wang, R.; Lin, H.-Y.; Van Deun, J.; Li, H.; Min, J.; et al. An integrated magneto-electrochemical device for the rapid profiling of tumour extracellular vesicles from blood plasma. Nat. Biomed. Eng. 2021, 5, 678–689. [Google Scholar] [CrossRef] [PubMed]
- Castorph, S.; Riedel, D.; Arleth, L.; Sztucki, M.; Jahn, R.; Holt, M.; Salditt, T. Structure Parameters of Synaptic Vesicles Quantified by Small-Angle X-Ray Scattering. Biophys. J. 2010, 98, 1200–1208. [Google Scholar] [CrossRef] [PubMed] [Green Version]
- Van der Pol, E.; Coumans, F.; Varga, Z.; Krumrey, M.; Nieuwland, R. Innovation in detection of microparticles and exosomes. J. Thromb. Haemost. 2013, 11, 36–45. [Google Scholar] [CrossRef] [PubMed]
- Ferguson, S.; Yang, K.S.; Weissleder, R. Single extracellular vesicle analysis for early cancer detection. Trends Mol. Med. 2022, 28, 681–692. [Google Scholar] [CrossRef]
- Shen, W.; Guo, K.; Adkins, G.B.; Jiang, Q.; Liu, Y.; Sedano, S.; Duan, Y.; Yan, W.; Wang, S.E.; Bergersen, K.; et al. A Single Extracellular Vesicle (EV) Flow Cytometry Approach to Reveal EV Heterogeneity. Angew. Chem. Int. Ed. 2018, 57, 15675–15680. [Google Scholar] [CrossRef] [PubMed]
- Penders, J.; Nagelkerke, A.; Cunnane, E.M.; Pedersen, S.V.; Pence, I.J.; Coombes, R.C.; Stevens, M.M. Single Particle Automated Raman Trapping Analysis of Breast Cancer Cell-Derived Extracellular Vesicles as Cancer Biomarkers. ACS Nano 2021, 15, 18192–18205. [Google Scholar] [CrossRef]
- Liu, H.; Tian, Y.; Xue, C.; Niu, Q.; Chen, C.; Yan, X. Analysis of extracellular vesicle DNA at the single-vesicle level by nano-flow cytometry. J. Extracell. Vesicles 2022, 11, 4. [Google Scholar] [CrossRef] [PubMed]
- Pascucci, L.; Scattini, G. Imaging extracelluar vesicles by transmission electron microscopy: Coping with technical hurdles and morphological interpretation. BBA-Gen. Subj. 2021, 1865, 129648. [Google Scholar] [CrossRef] [PubMed]
- Brisson, A.R.; Tan, S.; Linares, R.; Gounou, C.; Arraud, N. Extracellular vesicles from activated platelets: A semiquantitative cryo-electron microscopy and immuno-gold labeling study. Platelets 2017, 28, 263–271. [Google Scholar] [CrossRef]
- Kurtjak, M.; Kereiche, S.; Klepac, D.; Krizan, H.; Percic, M.; Krusic Alic, V.; Lavrin, T.; Lenassi, M.; Wechtersbach, K.; Kojc, N.; et al. Unveiling the Native Morphology of Extracellular Vesicles from Human Cerebrospinal Fluid by Atomic Force and Cryogenic Electron Microscopy. Biomedicines 2022, 10, 1251. [Google Scholar] [CrossRef] [PubMed]
- Wolf, P. Nature and Significance of Platelet products in human plasma. Br. J. Haematol. 1967, 13, 269. [Google Scholar] [CrossRef]
- Pan, B.T.; Johnstone, R.M. Fate of the transferrin receptor during maturation of sheep reticulocytes invitro—Selective externalization of the receptor. Cell 1983, 33, 967–977. [Google Scholar] [CrossRef]
- Pan, B.T.; Teng, K.; Wu, C.; Adam, M.; Johnstone, R.M. Electron-microscopic evidence for externalization of the transferrin receptor in vesicular form in sheep reticulocytes. J. Cell Biol. 1985, 101, 942–948. [Google Scholar] [CrossRef]
- Tatischeff, I.; Larquet, E.; Falcon-Perez, J.M.; Turpin, P.-Y.; Kruglik, S.G. Fast characterisation of cell-derived extracellular vesicles by nanoparticles tracking analysis, cryo-electron microscopy, and Raman tweezers microspectroscopy. J. Extracell. Vesicles 2012, 1, 19179. [Google Scholar] [CrossRef] [PubMed]
- Poliakov, A.; Spilman, M.; Dokland, T.; Amling, C.L.; Mobley, J.A. Structural Heterogeneity and Protein Composition of Exosome-Like Vesicles (Prostasomes) in Human Semen. Prostate 2009, 69, 159–167. [Google Scholar] [CrossRef] [PubMed]
- Yurtsever, A.; Yoshida, T.; Behjat, A.B.; Araki, Y.; Hanayama, R.; Fukuma, T. Structural and mechanical characteristics of exosomes from osteosarcoma cells explored by 3D-atomic force microscopy. Nanoscale 2021, 13, 6661–6677. [Google Scholar] [CrossRef] [PubMed]
- Ye, S.; Li, W.; Wang, H.; Zhu, L.; Wang, C.; Yang, Y. Quantitative Nanomechanical Analysis of Small Extracellular Vesicles for Tumor Malignancy Indication. Adv. Sci. 2021, 8, 18. [Google Scholar] [CrossRef] [PubMed]
- Kaszuba, M.; McKnight, D.; Connah, M.T.; McNeil-Watson, F.K.; Nobbmann, U. Measuring sub nanometre sizes using dynamic light scattering. J. Nanopart. Res. 2008, 10, 823–829. [Google Scholar] [CrossRef] [Green Version]
- Szatanek, R.; Baj-Krzyworzeka, M.; Zimoch, J.; Lekka, M.; Siedlar, M.; Baran, J. The Methods of Choice for Extracellular Vesicles (EVs) Characterization. Int. J. Mol. Sci. 2017, 18, 1153. [Google Scholar] [CrossRef] [Green Version]
- Lyu, T.S.; Ahn, Y.; Im, Y.-J.; Kim, S.-S.; Lee, K.-H.; Kim, J.; Choi, Y.; Lee, D.; Kang, E.; Jin, G.; et al. The characterization of exosomes from fibrosarcoma cell and the useful usage of Dynamic Light Scattering (DLS) for their evaluation. PLoS ONE 2021, 16, 1. [Google Scholar] [CrossRef]
- Dragovic, R.A.; Collett, G.P.; Hole, P.; Ferguson, D.J.P.; Redman, C.W.; Sargent, I.L.; Tannetta, D.S. Isolation of syncytiotrophoblast microvesicles and exosomes and their characterisation by multicolour flow cytometry and fluorescence Nanoparticle Tracking Analysis. Methods 2015, 87, 64–74. [Google Scholar] [CrossRef]
- Dragovic, R.A.; Gardiner, C.; Brooks, A.S.; Tannetta, D.S.; Ferguson, D.J.P.; Hole, P.; Carr, B.; Redman, C.W.G.; Harris, A.L.; Dobson, P.J.; et al. Sizing and phenotyping of cellular vesicles using Nanoparticle Tracking Analysis. Nanomedicine 2011, 7, 780–788. [Google Scholar] [CrossRef] [PubMed] [Green Version]
- Song, Y.; Zhang, J.; Li, D. Microfluidic and Nanofluidic Resistive Pulse Sensing: A Review. Micromachines 2017, 8, 4. [Google Scholar] [CrossRef] [Green Version]
- Jia, R.; Rotenberg, S.A.V.; Mirkin, M. Electrochemical Resistive-Pulse Sensing of Extracellular Vesicles. Anal. Chem. 2022, 94, 12614–12620. [Google Scholar] [CrossRef]
- Anderson, W.; Lane, R.; Korbie, D.; Trau, M. Observations of Tunable Resistive Pulse Sensing for Exosome Analysis: Improving System Sensitivity and Stability. Langmuir 2015, 31, 6577–6587. [Google Scholar] [CrossRef]
- Sivakumaran, M.; Platt, M. Tunable resistive pulse sensing: Potential applications in nanomedicine. Nanomedicine 2016, 11, 2197–2214. [Google Scholar] [CrossRef] [Green Version]
- De Vrij, J.; Maas, S.L.N.; van Nispen, M.; Sena-Esteves, M.; Limpens, R.W.A.; Koster, A.J.; Leenstra, S.; Lamfers, M.L.; Broekman, M.L.D. Quantification of nanosized extracellular membrane vesicles with scanning ion occlusion sensing. Nanomedicine 2013, 8, 1443–1458. [Google Scholar] [CrossRef] [PubMed]
- Van der Vlist, E.J.; Nolte-’t Hoen, E.N.M.; Stoorvogel, W.; Arkesteijn, G.J.A.; Wauben, M.H.M. Fluorescent labeling of nano-sized vesicles released by cells and subsequent quantitative and qualitative analysis by high-resolution flow cytometry. Nat. Protoc. 2012, 7, 1311–1326. [Google Scholar] [CrossRef]
- Zhu, S.; Ma, L.; Wang, S.; Chen, C.; Zhang, W.; Yang, L.; Hang, W.; Nolan, J.P.; Wu, L.; Yan, X. Light-Scattering Detection below the Level of Single Fluorescent Molecules for High-Resolution Characterization of Functional Nanoparticles. ACS Nano 2014, 8, 10998–11006. [Google Scholar] [CrossRef] [PubMed] [Green Version]
- Tian, Y.; Ma, L.; Gong, M.; Su, G.; Zhu, S.; Zhang, W.; Wang, S.; Li, Z.; Chen, C.; Li, L.; et al. Protein Profiling and Sizing of Extracellular Vesicles from Colorectal Cancer Patients via Flow Cytometry. ACS Nano 2018, 12, 671–680. [Google Scholar] [CrossRef] [PubMed]
- Teh, S.-Y.; Lin, R.; Hung, L.-H.; Lee, A.P. Droplet microfluidics. LChip 2008, 8, 198–220. [Google Scholar] [CrossRef]
- Liu, C.; Xu, X.; Li, B.; Situ, B.; Pan, W.; Hu, Y.; An, T.; Yao, S.; Zheng, L. Single-Exosome-Counting Immunoassays for Cancer Diagnostics. Nano Lett. 2018, 18, 4226–4232. [Google Scholar] [CrossRef]
- Yang, Z.; Atiyas, Y.; Shen, H.; Siedlik, M.J.; Wu, J.; Beard, K.; Fonar, G.; Dolle, J.P.; Smith, D.H.; Eberwine, J.H.; et al. Ultrasensitive Single Extracellular Vesicle Detection Using High Throughput Droplet Digital Enzyme-Linked Immunosorbent Assay. Nano Lett. 2022, 22, 4315–4324. [Google Scholar] [CrossRef]
- Ricklefs, F.L.; Maire, C.L.; Reimer, R.; Duehrsen, L.; Kolbe, K.; Holz, M.; Schneider, E.; Rissiek, A.; Babayan, A.; Hille, C.; et al. Imaging flow cytometry facilitates multiparametric characterization of extracellular vesicles in malignant brain tumours. J. Extracell. Vesicles 2019, 8, 1. [Google Scholar] [CrossRef] [PubMed] [Green Version]
- Spedalieri, C.; Kneipp, J. Surface enhanced Raman scattering for probing cellular biochemistry. Nanoscale 2022, 14, 5314–5328. [Google Scholar] [CrossRef] [PubMed]
- Tirinato, L.; Gentile, F.; Di Mascolo, D.; Coluccio, M.L.; Das, G.; Liberale, C.; Pullano, S.A.; Perozziello, G.; Francardi, M.; Accardo, A.; et al. SERS analysis on exosomes using super-hydrophobic surfaces. Microelectron. Eng. 2012, 97, 337–340. [Google Scholar] [CrossRef]
- Kruglik, S.G.; Royo, F.; Guigner, J.-M.; Palomo, L.; Seksek, O.; Turpin, P.-Y.; Tatischeff, I.; Falcon-Perez, J.M. Raman tweezers microspectroscopy of circa 100 nm extracellular vesicles. Nanoscale 2019, 11, 1661–1679. [Google Scholar] [CrossRef] [PubMed] [Green Version]
- Dai, Y.; Bai, S.; Hu, C.; Chu, K.; Shen, B.; Smith, Z.J. Combined Morpho-Chemical Profiling of Individual Extracellular Vesicles and Functional Nanoparticles without Labels. Anal. Chem. 2020, 92, 5585–5594. [Google Scholar] [CrossRef]
- Carney, R.P.; Hazari, S.; Colquhoun, M.; Tran, D.; Hwang, B.; Mulligan, M.S.; Bryers, J.D.; Girda, E.; Leiserowitz, G.S.; Smith, Z.J.; et al. Multispectral Optical Tweezers for Biochemical Fingerprinting of CD9-Positive Exosome Subpopulations. Anal. Chem. 2017, 89, 5357–5363. [Google Scholar] [CrossRef] [Green Version]
- Carter, E.P.; Seymour, E.C.; Scherr, S.M.; Daaboul, G.G.; Freedman, D.S.; Selim Unlu, M.; Connor, J.H. Visualizing Ebolavirus Particles Using Single-Particle Interferometric Reflectance Imaging Sensor (SP-IRIS). Methods Mol. Biol. 2017, 1628, 259–270. [Google Scholar]
- Reddington, A.P.; Trueb, J.T.; Freedman, D.S.; Tuysuzoglu, A.; Daaboul, G.G.; Lopez, C.A.; Karl, W.C.; Connor, J.H.; Fawcett, H.; Unlu, M.S. An Interferometric Reflectance Imaging Sensor for Point of Care Viral Diagnostics. IEEE Trans. Biomed. Eng. 2013, 60, 3276–3283. [Google Scholar] [CrossRef] [Green Version]
- Lopez, C.A.; Daaboul, G.G.; Vedula, R.S.; Oezkumur, E.; Bergstein, D.A.; Geisbert, T.W.; Fawcett, H.E.; Goldberg, B.B.; Connor, J.H.; Uenlue, M.S. Label-free, multiplexed virus detection using spectral reflectance imaging. Biosens. Bioelectron. 2011, 26, 3432–3437. [Google Scholar] [CrossRef] [Green Version]
- Obeid, S.; Sung, P.-S.; Le Roy, B.; Chou, M.-L.; Hsieh, S.-L.; Elie-Caille, C.; Burnouf, T.; Boireau, W. NanoBioAnalytical characterization of extracellular vesicles in 75-nm nanofiltered human plasma for transfusion: A tool to improve transfusion safety. Nanomed.-Nanotechnol. 2019, 20, 101977. [Google Scholar] [CrossRef]
- Unlu, N.L.; Kanik, F.E.; Seymour, E.; Connor, J.H.; Unlu, M.S. DNA-Directed Antibody Immobilization for Robust Protein Microarrays: Application to Single Particle Detection ′DNA-Directed Antibody Immobilization. Methods Mol. Biol. 2017, 1571, 187–206. [Google Scholar]
- Daaboul, G.G.; Yurt, A.; Zhang, X.; Hwang, G.M.; Goldberg, B.B.; Uenlue, M.S. High-Throughput Detection and Sizing of Individual Low-Index Nanoparticles and Viruses for Pathogen Identification. Nano Lett. 2010, 10, 4727–4731. [Google Scholar] [CrossRef]
- Daaboul, G.G.; Lopez, C.A.; Chinnala, J.; Goldberg, B.B.; Connor, J.H.; Unlue, M.S. Digital Sensing and Sizing of Vesicular Stomatitis Virus Pseudotypes in Complex Media: A Model for Ebola and Marburg Detection. ACS Nano 2014, 8, 6047–6055. [Google Scholar] [CrossRef] [Green Version]
- Khan, N.Z.; Cao, T.; He, J.; Ritzel, R.M.; Li, Y.; Henry, R.J.; Colson, C.; Stoica, B.A.; Faden, A.I.; Wu, J. Spinal cord injury alters microRNA and CD81+exosome levels in plasma extracellular nanoparticles with neuroinflammatory potential. Brain Behav. Immun. 2021, 92, 165–183. [Google Scholar] [CrossRef]
- Deng, F.Y.; Ratri, A.; Deighan, C.; Daaboul, G.; Geiger, P.C.; Christenson, L.K. Single-Particle Interferometric Reflectance Imaging Characterization of Individual Extracellular Vesicles and Population Dynamics. JOVE-J. Vis. Exp. 2022, 179, e62988. [Google Scholar] [CrossRef]
- Daaboul, G.G.; Gagni, P.; Benussi, L.; Bettotti, P.; Ciani, M.; Cretich, M.; Freedman, D.S.; Ghidoni, R.; Ozkumur, A.Y.; Piotto, C.; et al. Digital Detection of Exosomes by Interferometric Imaging. Sci. Rep. 2016, 6, 37246. [Google Scholar] [CrossRef] [PubMed]
- An, H.J.; Cho, H.-K.; Song, D.H.; Kee, C. Quantitative analysis of exosomes in the aqueous humor of Korean patients with pseudoexfoliation glaucoma. Sci. Rep. 2022, 12, 1. [Google Scholar] [CrossRef]
- Hutter, J.L.; Bechhoefer, J. Calibration of atomic-force microscope tips. Rev. Sci. Instrum. 1993, 64, 1868–1873. [Google Scholar] [CrossRef] [Green Version]
- Butt, H.J.; Cappella, B.; Kappl, M. Force measurements with the atomic force microscope: Technique, interpretation and applications. Surf. Sci. Rep. 2005, 59, 1–152. [Google Scholar]
- Krieg, M.; Flaschner, G.; Alsteens, D.; Gaub, B.M.; Roos, W.H.; Wuite, G.J.L.; Gaub, H.E.; Gerber, C.; Dufrene, Y.F.; Muller, D.J. Atomic force microscopy-based mechanobiology. Nat. Rev. Phys. 2019, 1, 41–57. [Google Scholar] [CrossRef] [Green Version]
- Sharma, S.; Gillespie, B.M.; Palanisamy, V.; Gimzewski, J.K. Quantitative Nanostructural and Single-Molecule Force Spectroscopy Biomolecular Analysis of Human-Saliva-Derived Exosomes. Langmuir 2011, 27, 14394–14400. [Google Scholar] [CrossRef] [PubMed] [Green Version]
- Dazzi, A.; Prazeres, R.; Glotin, E.; Ortega, J.M. Local infrared microspectroscopy with subwavelength spatial resolution with an atomic force microscope tip used as a photothermal sensor. Opt. Lett. 2005, 30, 2388–2390. [Google Scholar] [CrossRef] [PubMed]
- Dazzi, A.; Prazeres, R.; Glotin, F.; Ortega, J.M. Analysis of nano-chemical mapping performed by an AFM-based ("AFMIR") acousto-optic technique. Ultramicroscopy 2007, 107, 1194–1200. [Google Scholar] [CrossRef] [PubMed]
- Dazzi, A.; Prazeres, R.; Glotin, F.; Ortega, J.M. Subwavelength infrared spectromicroscopy using an AFM as a local absorption sensor. Infrared Phys. Technol. 2006, 49, 113–121. [Google Scholar] [CrossRef]
- Khanal, D.; Kondyurin, A.; Hau, H.; Knowles, J.C.; Levinson, O.; Ramzan, I.; Fu, D.; Marcott, C.; Chrzanowski, W. Biospectroscopy of Nanodiamond-Induced Alterations in Conformation of Intra- and Extracellular Proteins: A Nanoscale IR Study. Anal. Chem. 2016, 88, 7530–7538. [Google Scholar] [CrossRef] [Green Version]
- Ruggeri, F.S.; Longo, G.; Faggiano, S.; Lipiec, E.; Pastore, A.; Dietler, G. Infrared nanospectroscopy characterization of oligomeric and fibrillar aggregates during amyloid formation. Nat. Commun. 2015, 6, 7831. [Google Scholar] [CrossRef] [Green Version]
- Ridolfi, A.; Brucale, M.; Montis, C.; Caselli, L.; Paolini, L.; Borup, A.; Boysen, A.T.; Loria, F.; van Herwijnen, M.J.C.; Kleinjan, M.; et al. AFM-Based High-Throughput Nanomechanical Screening of Single Extracellular Vesicles. Anal. Chem. 2020, 92, 10274–10282. [Google Scholar] [CrossRef]
- Kim, S.Y.; Khanal, D.; Kalionis, B.; Chrzanowski, W. High-fidelity probing of the structure and heterogeneity of extracellular vesicles by resonance-enhanced atomic force microscopy infrared spectroscopy. Nat. Protoc. 2019, 14, 576–593. [Google Scholar] [CrossRef]
- Kim, S.Y.; Khanal, D.; Tharkar, P.; Kalionis, B.; Chrzanowski, W. None of us is the same as all of us: Resolving the heterogeneity of extracellular vesicles using single-vesicle, nanoscale characterization with resonance enhanced atomic force microscope infrared spectroscopy (AFM-IR). Nanoscale Horiz. 2018, 3, 430–438. [Google Scholar] [CrossRef]
- Ko, J.; Wang, Y.; Carlson, J.C.T.; Marquard, A.; Gungabeesoon, J.; Charest, A.; Weitz, D.; Pittet, M.J.; Weissleder, R. Single Extracellular Vesicle Protein Analysis Using Immuno-Droplet Digital Polymerase Chain Reaction Amplification. Adv. Biosyst. 2020, 4, 12. [Google Scholar] [CrossRef]
- Ko, J.; Wang, Y.; Sheng, K.; Weitz, D.A.; Weissleder, R. Sequencing-Based Protein Analysis of Single Extracellular Vesicles. ACS Nano 2021, 15, 5631–5638. [Google Scholar] [CrossRef] [PubMed]
- Lee, K.; Fraser, K.; Ghaddar, B.; Yang, K.; Kim, E.; Balaj, L.; Chiocca, E.A.; Breakefield, X.O.; Lee, H.; Weissleder, R. Multiplexed Profiling of Single Extracellular Vesicles. ACS Nano 2018, 12, 494–503. [Google Scholar] [CrossRef] [PubMed]
- Banijamali, M.; Hojer, P.; Nagy, A.; Haag, P.; Paz Gomero, E.; Stiller, C.; Kaminskyy, V.O.; Ekman, S.; Lewensohn, R.; Karlstrom, A.E.; et al. Characterizing single extracellular vesicles by droplet barcode sequencing for protein analysis. J. Extracell. Vesicles 2022, 11, 11. [Google Scholar] [CrossRef] [PubMed]
- Pasini, L.; Notarangelo, M.; Vagheggini, A.; Burgio, M.A.; Crino, L.; Chiadini, E.; Prochowski, A.I.; Delmonte, A.; Ulivi, P.; D’Agostino, V.G. Unveiling mutational dynamics in non-small cell lung cancer patients by quantitative EGFR profiling in vesicular RNA. Mol. Oncol. 2021, 15, 2423–2438. [Google Scholar] [CrossRef]
- Huang, G.; Zhu, Y.; Wen, S.; Mei, H.; Liu, Y.; Wang, D.; Maddahfar, M.; Su, Q.P.; Lin, G.; Chen, Y.; et al. Single Small Extracellular Vesicle (sEV) Quantification by Upconversion Nanoparticles. Nano Lett. 2022, 22, 3761–3769. [Google Scholar] [CrossRef]
- Huang, G.; Liu, Y.; Wang, D.; Zhu, Y.; Wen, S.; Ruan, J.; Jin, D.J.E. Upconversion nanoparticles for super-resolution quantification of single small extracellular vesicles. eLight 2022, 2, 1. [Google Scholar] [CrossRef]
- Nikoloff, J.M.; Saucedo-Espinosa, M.A.; Kling, A.; Dittrich, P.S. Identifying extracellular vesicle populations from single cells. Proc. Natl. Acad. Sci. USA 2021, 118, 38. [Google Scholar] [CrossRef] [PubMed]
- Zhang, J.; Shi, J.; Zhang, H.; Zhu, Y.; Liu, W.; Zhang, K.; Zhang, Z. Localized fluorescent imaging of multiple proteins on individual extracellular vesicles using rolling circle amplification for cancer diagnosis. J. Extracell. Vesicles 2020, 10, 1. [Google Scholar] [CrossRef]
- Li, J.; Sina, A.A.I.; Antaw, F.; Fielding, D.; Moller, A.; Lobb, R.; Wuethrich, A.; Trau, M. Digital Decoding of Single Extracellular Vesicle Phenotype Differentiates Early Malignant and Benign Lung Lesions. Adv. Sci. 2022, 10, 2204207. [Google Scholar] [CrossRef]
- Hu, Y.; Tian, Y.; Di, H.; Xue, C.; Zheng, Y.; Hu, B.; Lin, Q.; Yan, X. Noninvasive Diagnosis of Nasopharyngeal Carcinoma Based on Phenotypic Profiling of Viral and Tumor Markers on Plasma Extracellular Vesicles. Anal. Chem. 2022, 94, 9740–9749. [Google Scholar] [CrossRef]
- Lennon, K.M.; Wakefield, D.L.; Maddox, A.L.; Brehove, M.S.; Willner, A.N.; Garcia-Mansfield, K.; Meechoovet, B.; Reiman, R.; Hutchins, E.; Miller, M.M.; et al. Single molecule characterization of individual extracellular vesicles from pancreatic cancer. J. Extracell. Vesicles 2019, 8, 1. [Google Scholar] [CrossRef] [PubMed] [Green Version]
- Li, J.; Li, Y.; Chen, S.; Duan, W.; Kong, X.; Wang, Y.; Zhou, L.; Li, P.; Zhang, C.; Du, L.; et al. Highly Sensitive Exosome Detection for Early Diagnosis of Pancreatic Cancer Using Immunoassay Based on Hierarchical Surface-Enhanced Raman Scattering Substrate. Small Methods 2022, 6, 6. [Google Scholar] [CrossRef] [PubMed]
- Ferguson, S.; Yang, K.S.; Zelga, P.; Liss, A.S.; Carlson, J.C.T.; del Castillo, C.F.; Weissleder, R. Single-EV analysis (sEVA) of mutated proteins allows detection of stage 1 pancreatic cancer. Sci. Adv. 2022, 8, 16. [Google Scholar] [CrossRef] [PubMed]
- Kibria, G.; Ramos, E.K.; Lee, K.E.; Bedoyan, S.; Huang, S.; Samaeekia, R.; Athman, J.J.; Harding, C.V.; Lotvall, J.; Harris, L.; et al. A rapid, automated surface protein profiling of single circulating exosomes in human blood. Sci. Rep. 2016, 6, 36502. [Google Scholar] [CrossRef] [PubMed] [Green Version]
- Yang, K.S.; Ciprani, D.; O’Shea, A.; Liss, A.S.; Yang, R.; Fletcher-Mercaldo, S.; Mino-Kenudson, M.; Fernandez-del Castillo, C.; Weissleder, R. Extracellular Vesicle Analysis Allows for Identification of Invasive IPMN. Gastroenterology 2021, 160, 1345–1358. [Google Scholar] [CrossRef] [PubMed]
- Xiao, X.; Wu, K.; Yan, A.; Wang, J.-G.; Zhang, Z.; Li, D. Intelligent Probabilistic System for Digital Tracing Cellular Origin of Individual Clinical Extracellular Vesicles. Anal. Chem. 2021, 93, 10343–10350. [Google Scholar] [CrossRef]
- Wei, P.; Wu, F.; Kang, B.; Sun, X.; Heskia, F.; Pachot, A.; Liang, J.; Li, D. Plasma extracellular vesicles detected by Single Molecule array technology as a liquid biopsy for colorectal cancer. J. Extracell. Vesicles 2020, 9, 1. [Google Scholar] [CrossRef]
- Chen, C.; Zong, S.; Liu, Y.; Wang, Z.; Zhang, Y.; Chen, B.; Cui, Y. Profiling of Exosomal Biomarkers for Accurate Cancer Identification: Combining DNA-PAINT with Machine- Learning-Based Classification. Small 2019, 15, 43. [Google Scholar] [CrossRef]
- Han, Z.; Wan, F.; Deng, J.; Zhao, J.; Li, Y.; Yang, Y.; Jiang, Q.; Ding, B.; Liu, C.; Dai, B.; et al. Ultrasensitive detection of mRNA in extracellular vesicles using DNA tetrahedron-based thermophoretic assay. Nano Today 2021, 38, 101203. [Google Scholar] [CrossRef]
- Zhou, J.; Wu, Z.; Hu, J.; Yang, D.; Chen, X.; Wang, Q.; Liu, J.; Dou, M.; Peng, W.; Wu, Y.; et al. High-throughput single-EV liquid biopsy: Rapid, simultaneous, and multiplexed detection of nucleic acids, proteins, and their combinations. Sci. Adv. 2020, 6, 47. [Google Scholar] [CrossRef]
- Nguyen, L.T.H.; Zhang, J.; Rima, X.Y.; Wang, X.; Kwak, K.J.; Okimoto, T.; Amann, J.; Yoon, M.J.; Shukuya, T.; Chiang, C.-L.; et al. An immunogold single extracellular vesicular RNA and protein ((SERP)-S-Au) biochip to predict responses to immunotherapy in non-small cell lung cancer patients. J. Extracell. Vesicles 2022, 11, 9. [Google Scholar] [CrossRef] [PubMed]


| Technology | Advantages | Disadvantages | Time Required per Measurement | Limit of Detection | Ref. |
|---|---|---|---|---|---|
| DLS | Rapid; Samples are reusable | Not suitable for polydispersed particles; High sample purity required | 10 min | 105 EVs μL−1 | [47] |
| NTA | Rapid; Samples are reusable | High sample purity required | 10 min | 105 EVs μL−1 | [49] |
| TRPS | Suitable for polydispersed Samples; Single particle detection | Influenced by membrane pore size, shape and vesicle surface property; Membrane clogging | Few minutes | 102 EVs μL−1 | [52] |
| nFCM | Single particle detection; Rapid | High cost | Few minutes | 104 EVs μL−1 | [57] |
| Digital droplet Technology | Single particle detection; Low detection limit | Time-consuming | 30 min | 10 EVs μL−1 | [59] |
| EV Analysis | Target Type | Multiplexing | Biomarkers | Cancer Type | Sources | Patient Number | Detection Methods | Diagnostic Performance | Year | Ref. |
|---|---|---|---|---|---|---|---|---|---|---|
| subpopulation | protein | no | CD147 (+) EVs | Colorectal cancer | Plasma | N = 37 | nFCM | CRC vs. HD, ROCAUC = 0.932 | 2018 | [57] |
| subpopulation | protein | no | GPC-1 (+) exosomes | Breast cancer | Serum | N = 12 | droplet digital ExoELISA | N/D | 2018 | [59] |
| subpopulation | protein | yes | CD63/EpCAM/MUC1-triple-positive EVs | Breast cancer | Plasma | N = 14 | surface plasmon resonance (SPR) | BrCa vs. HD, accuracy = 91% | 2020 | [98] |
| subpopulation | protein | yes | CD9-CD63 (+) EVs, PD-L1-CD63 (+) EVs | Large B-cell lymphoma | Plasma | N = 164 | single molecule array technology (SiMoa) | LBCL vs. HD ROCAUC = 0.99 | 2021 | [22] |
| subpopulation | protein | yes | CD63 (+) EVs, THBS2 (+) EVs, VCAN (+) EVs, TNC (+) EVs | Lung cancer | Plasma | N = 22 | SERS | ROCAUC = 0.85 | 2022 | [99] |
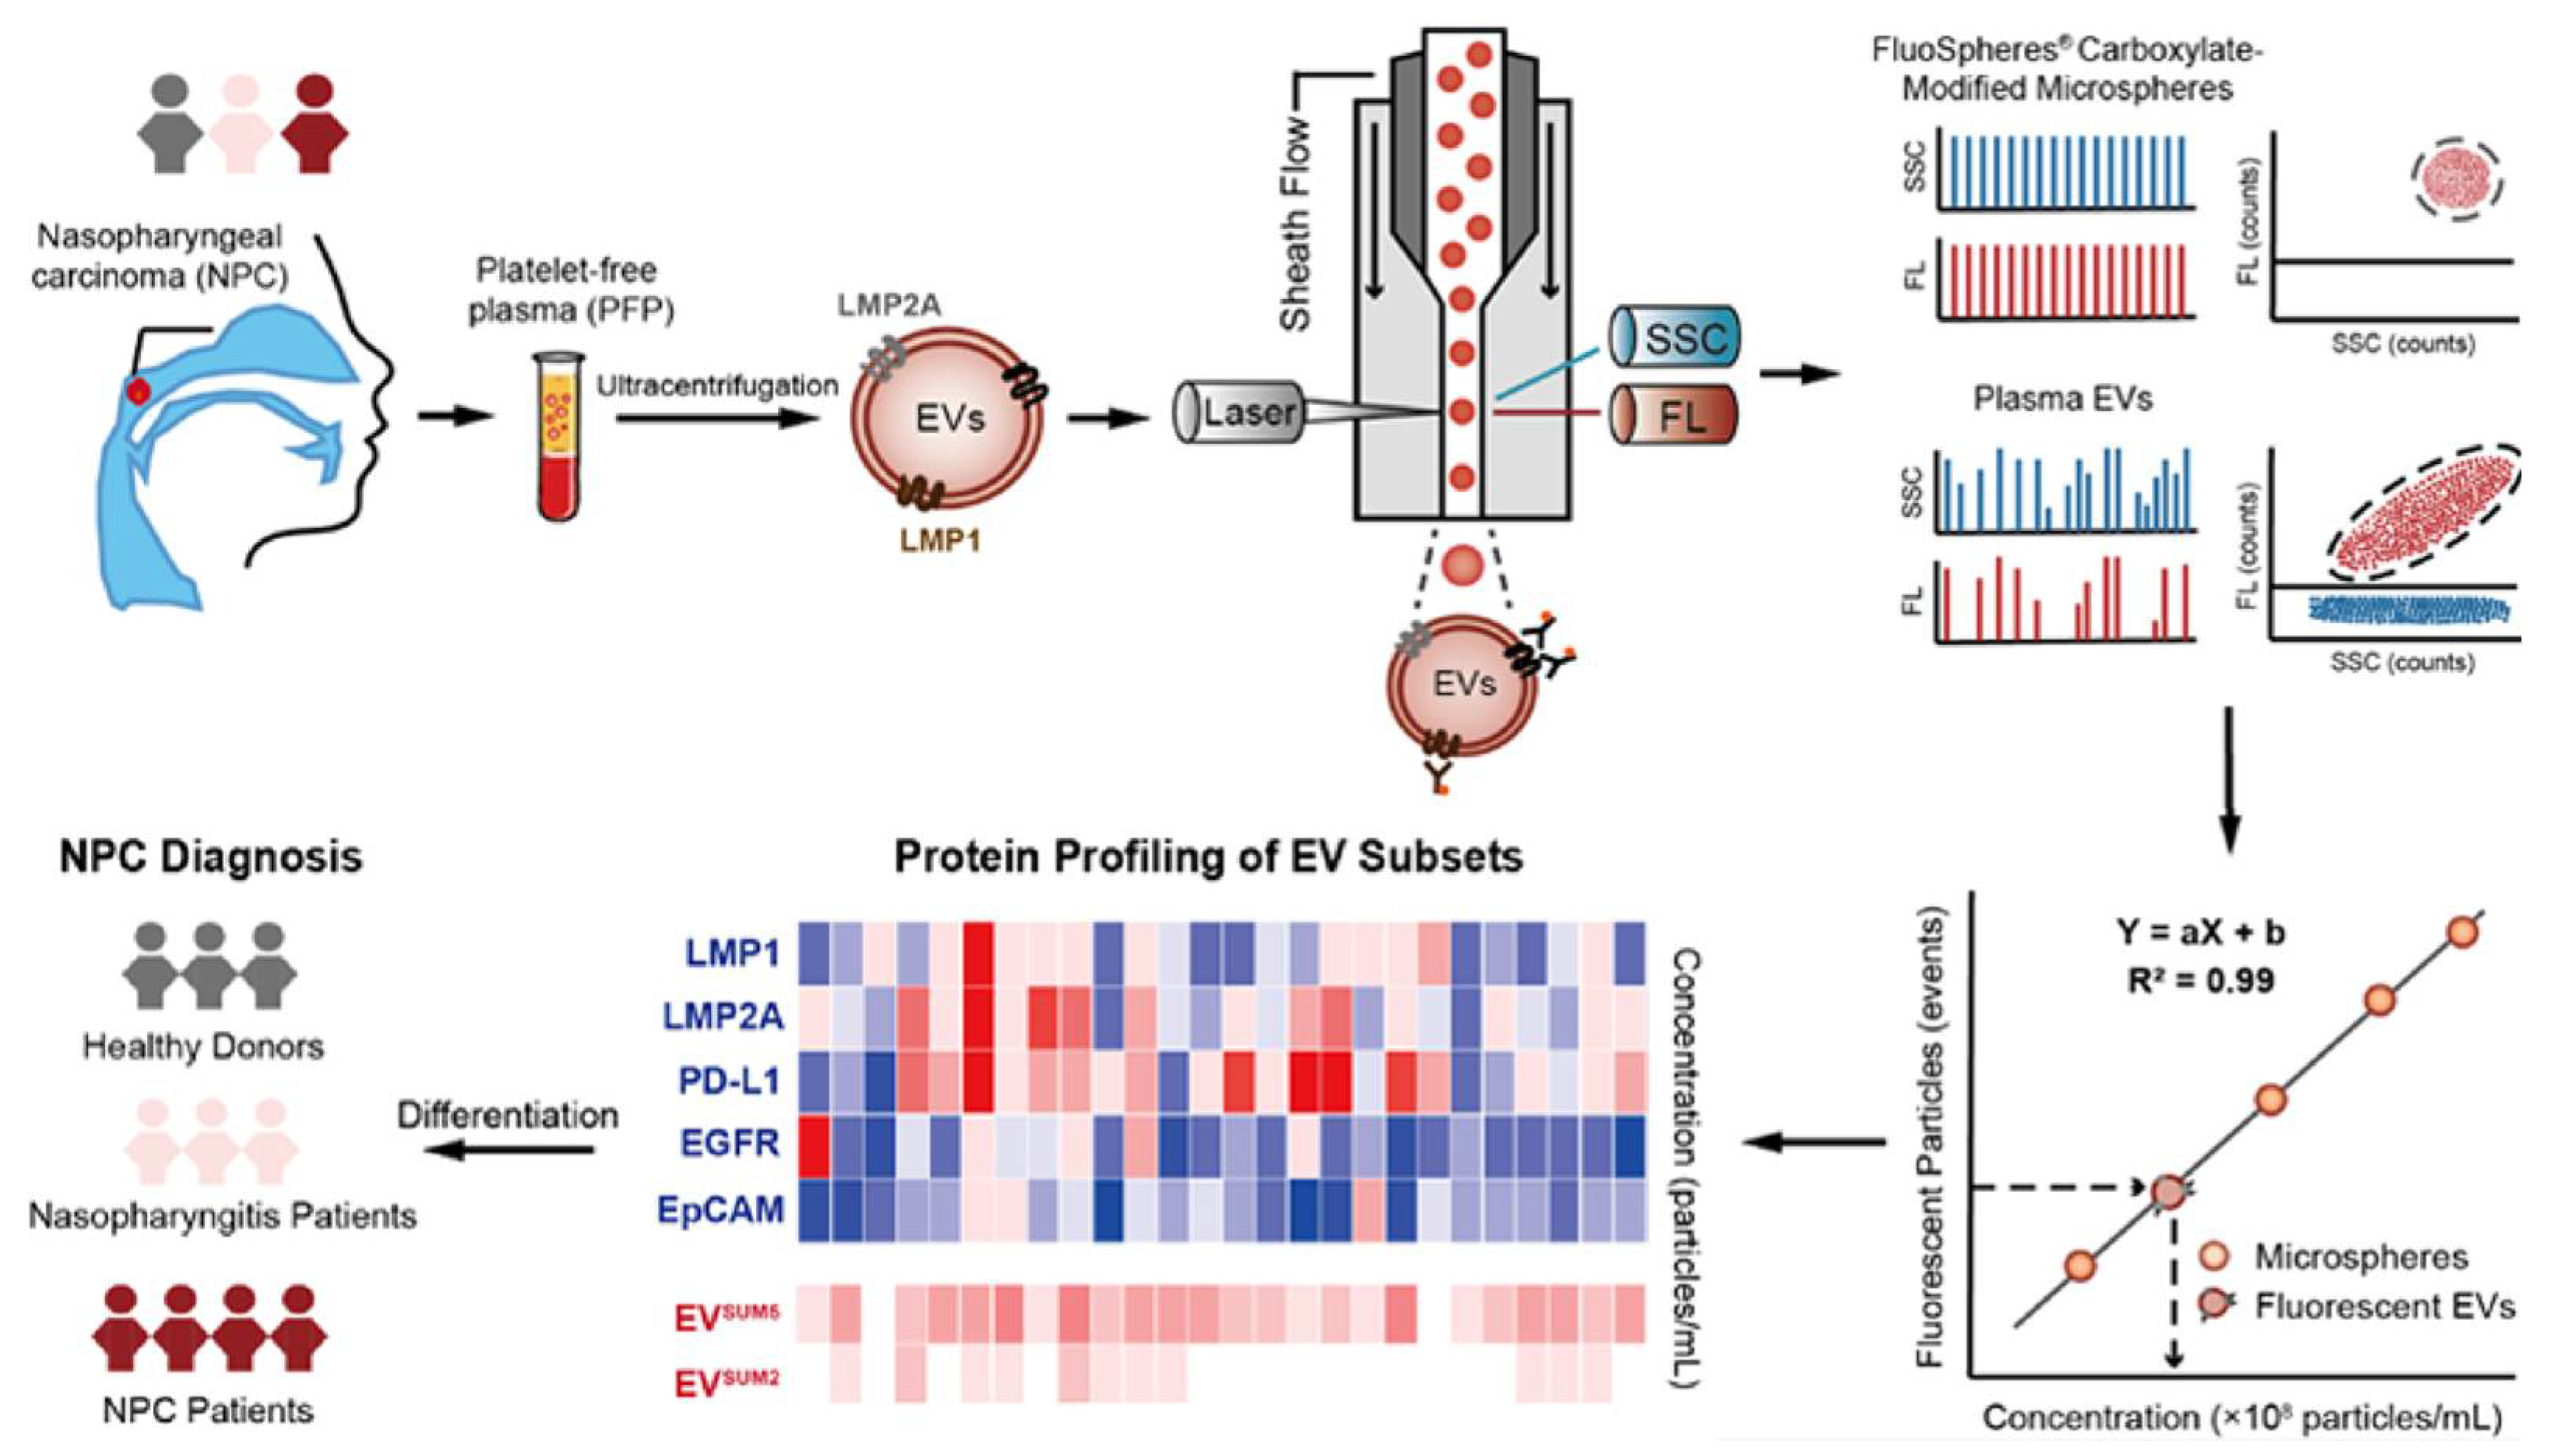
| subpopulation | protein | yes | 5 EV subsets of LMP1, LMP2A, PD-L1, EGFR, EpCAM | Nasopharyngeal cancer | Plasma | N = 42 | nFCM | NPC vs. HD, accuracy = 96.3%. NPC vs. NPG, accuracy = 83.1%. | 2022 | [100] |
| subpopulation | protein | no | EGFR (+) EVs, CA19-9 (+) EVs | Pancreatic cancer | Plasma | N = 5 | quantitative single molecule localization microscopy (qSMLM) | N/D | 2019 | [101] |
| subpopulation | protein | no | LRG-1 (+) EVs, GPC-1 (+) EVs | Pancreatic cancer | Serum | N = 15 | SERS | ROCAUC= 0.95, sensitivity = 90.0%, specificity = 86.7% | 2022 | [102] |
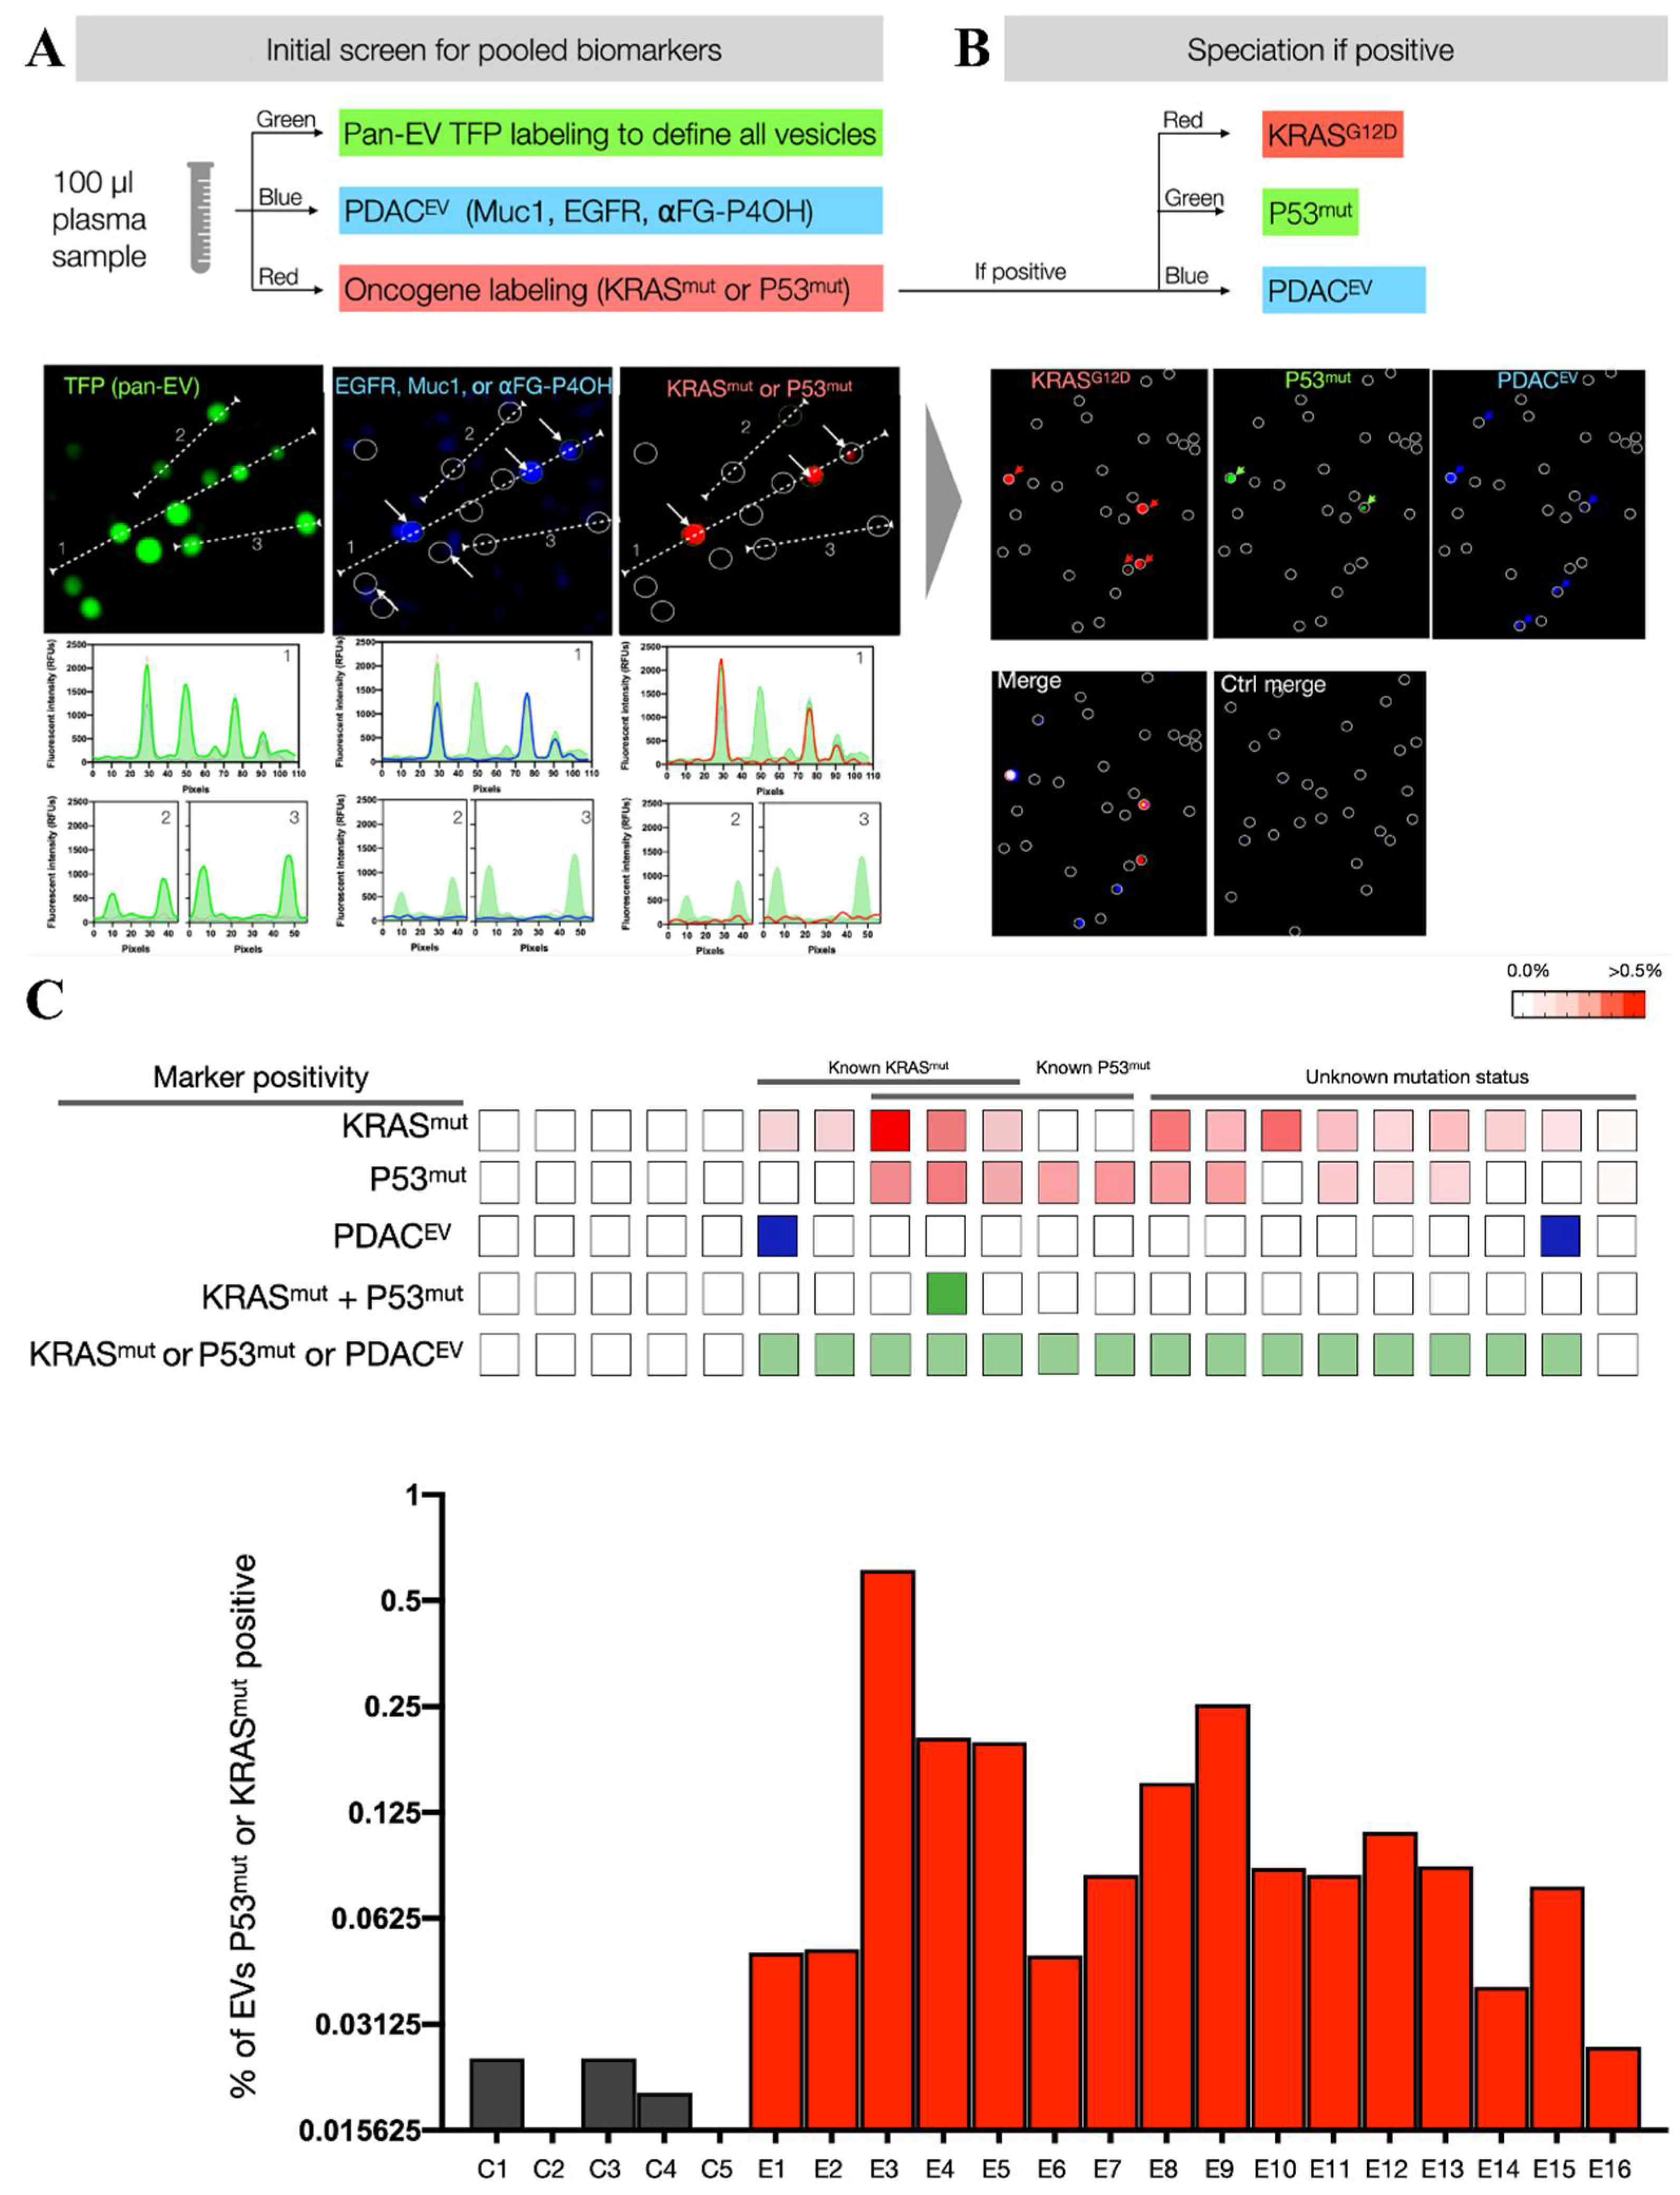
| subpopulation | protein | yes | KRASmut and/or P53mut positive EVs | Pancreatic cancer | Plasma | N = 16 | high-resolution microscopy | early stage PDAC, accuracy = 15/16 | 2022 | [103] |
| protein | protein | no | CD47 | Breast cancer | Serum | N = 60 | micro flow cytometry (MFC) | N/D | 2016 | [104] |
| protein | protein | no | MUC5AC | Intraductal papillary mucinous neoplasms | Plasma | N = 133 | FCM | Sensitivity = 82%, specificity = 100% | 2020 | [105] |
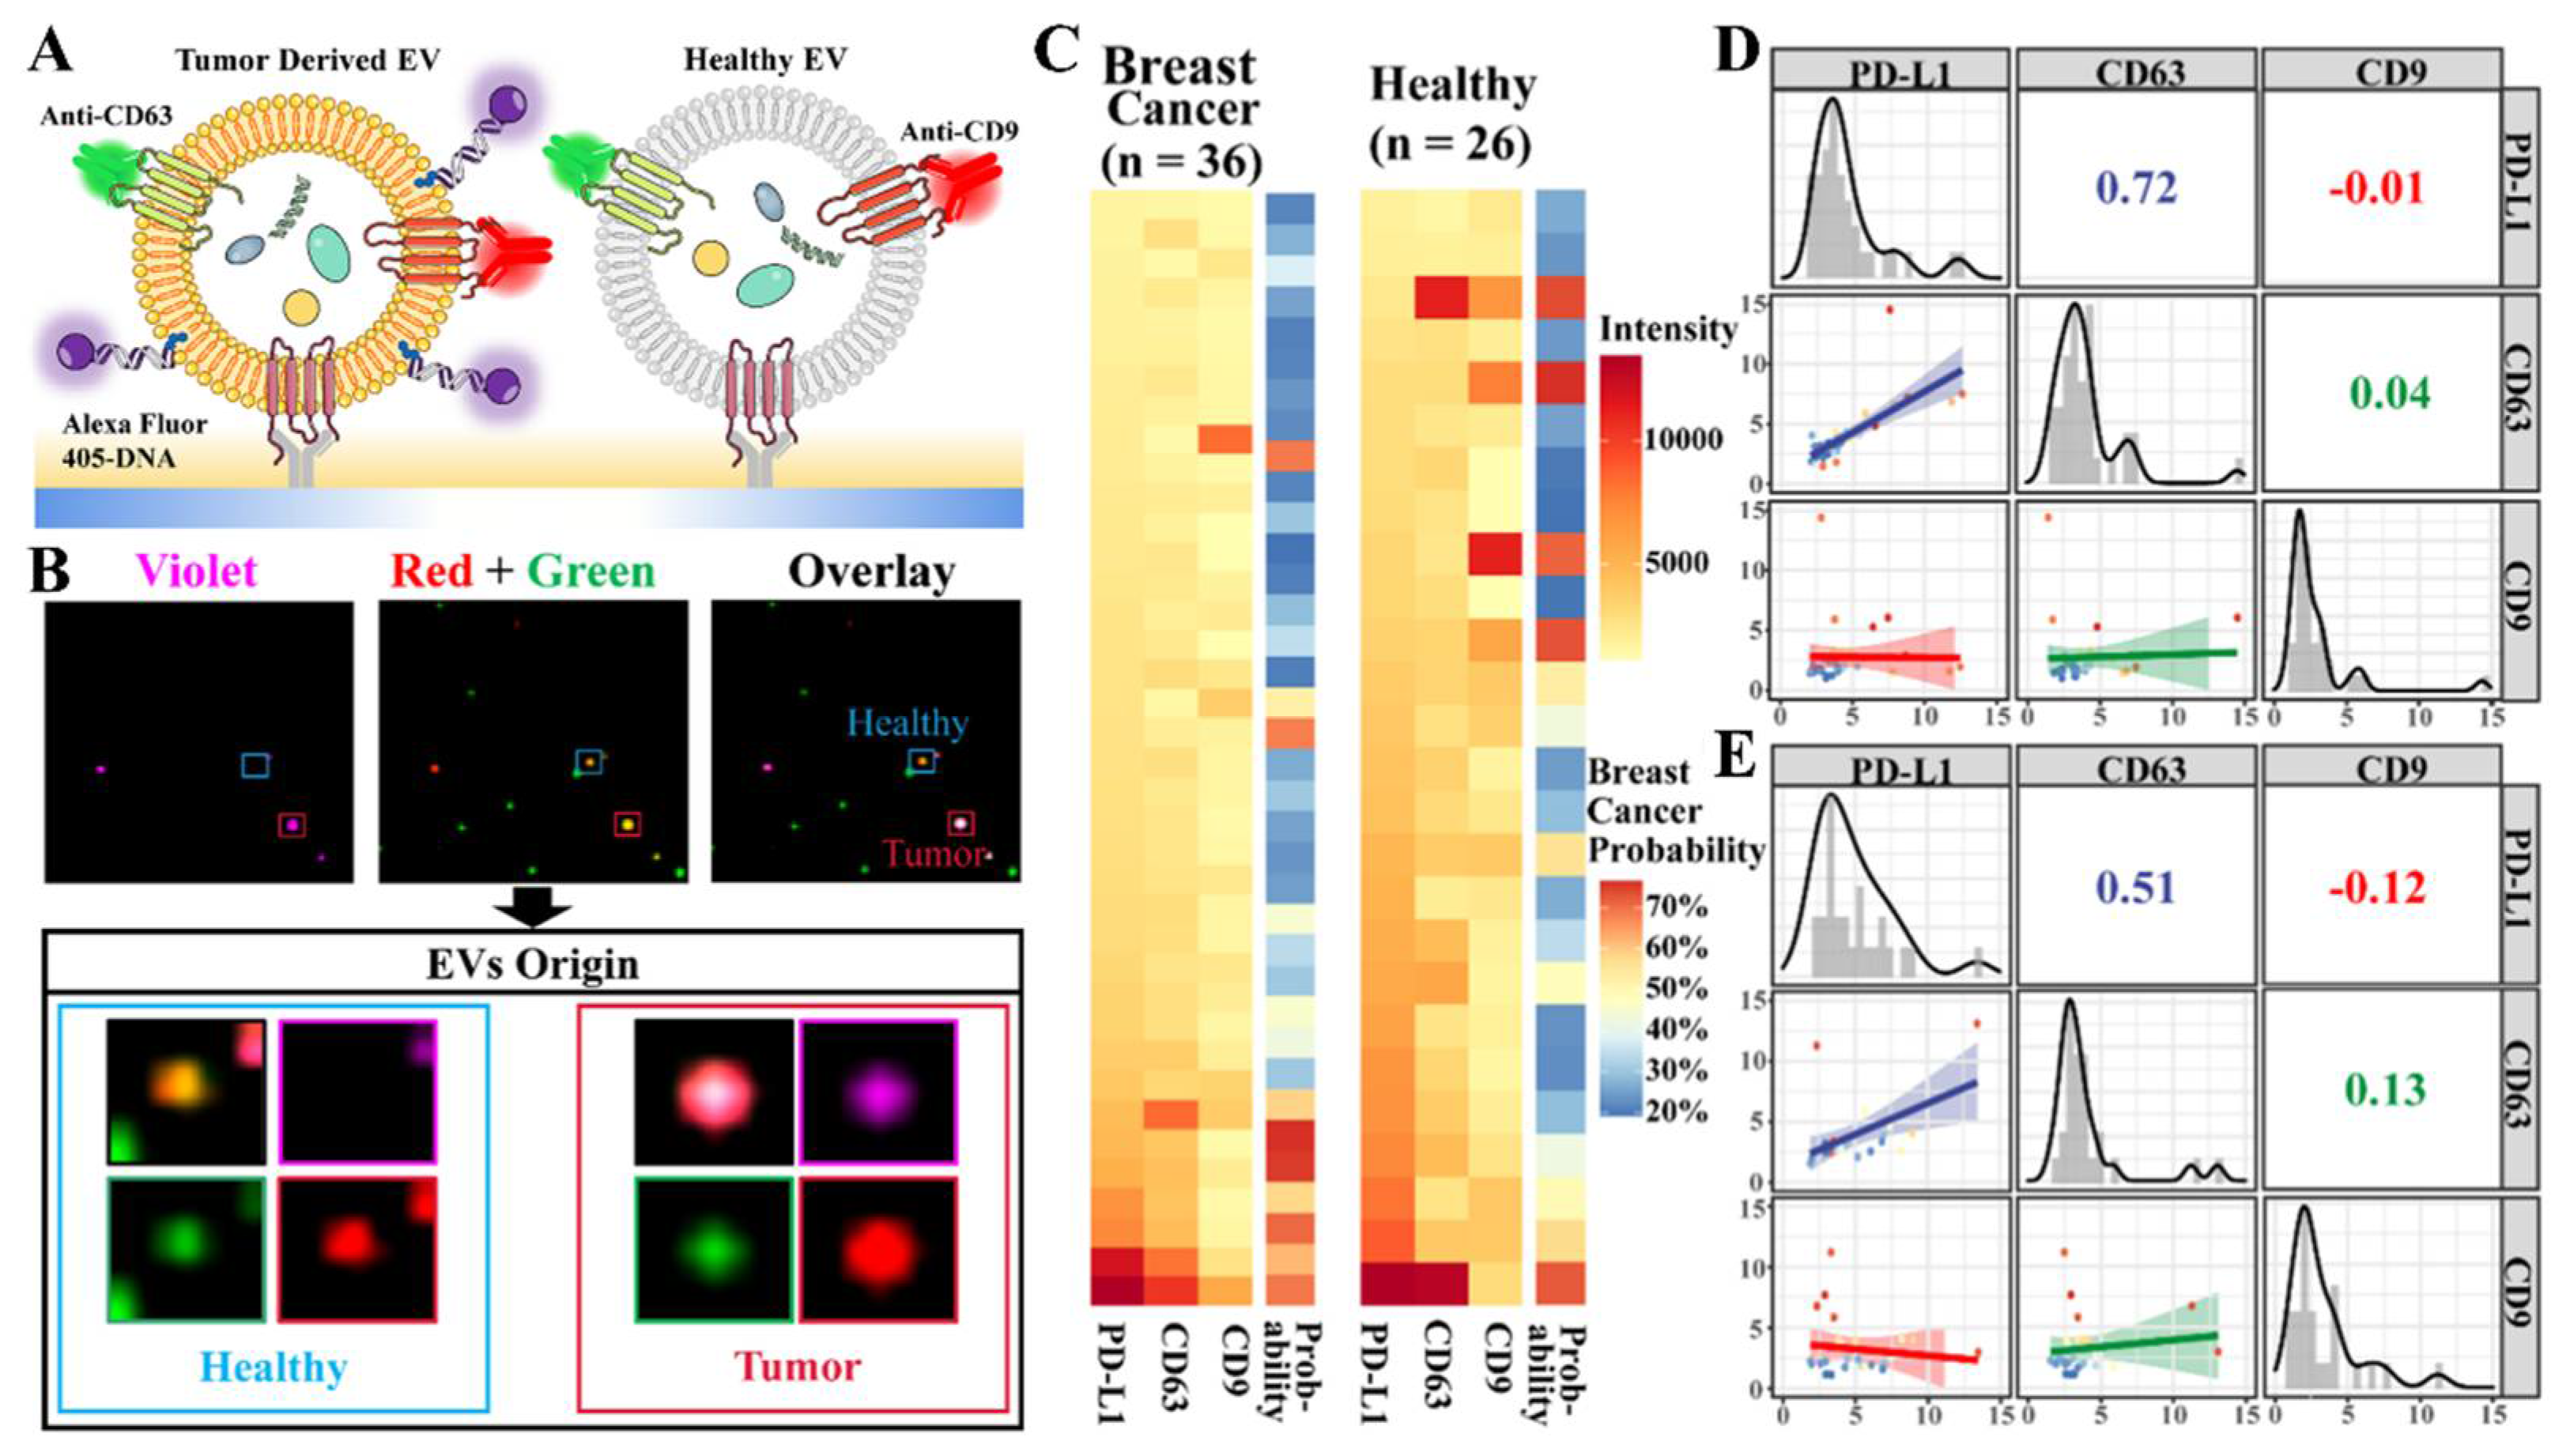
| protein | protein | yes | PD-L1, CD9, CD63 | Breast cancer | Plasma | N = 36 | total internal reflection fluorescence (TIRF) | N/D | 2021 | [106] |
| protein | protein | yes | CD9-CD63, EpCAM-CD63 | Colorectal cancer | Plasma | N = 163 | single molecule array technology (SiMoa) | CD9-CD63, AUC = 0.96; EpCAM-CD63, AUC = 0.90; | 2020 | [107] |
| protein | protein | yes | HER2, GPC-1, EpCAM, EGFR | Pancreatic cancer, Breast cancer | Serum | N = 7, N = 7 | DNA points accumulation for imaging in nanoscale topography (DNA-PAINT) | PaCa, accuracy =100% BrCa, accuracy = 100% | 2019 | [108] |
| RNA | RNA | no | PSA mRNA | Prostate cancer | Serum | N = 42 | DNA tetrahedron-based thermophoretic assay (DTTA) | PCa vs. benign prostatic hyperplasia ROCAUC = 0.93 | 2021 | [109] |
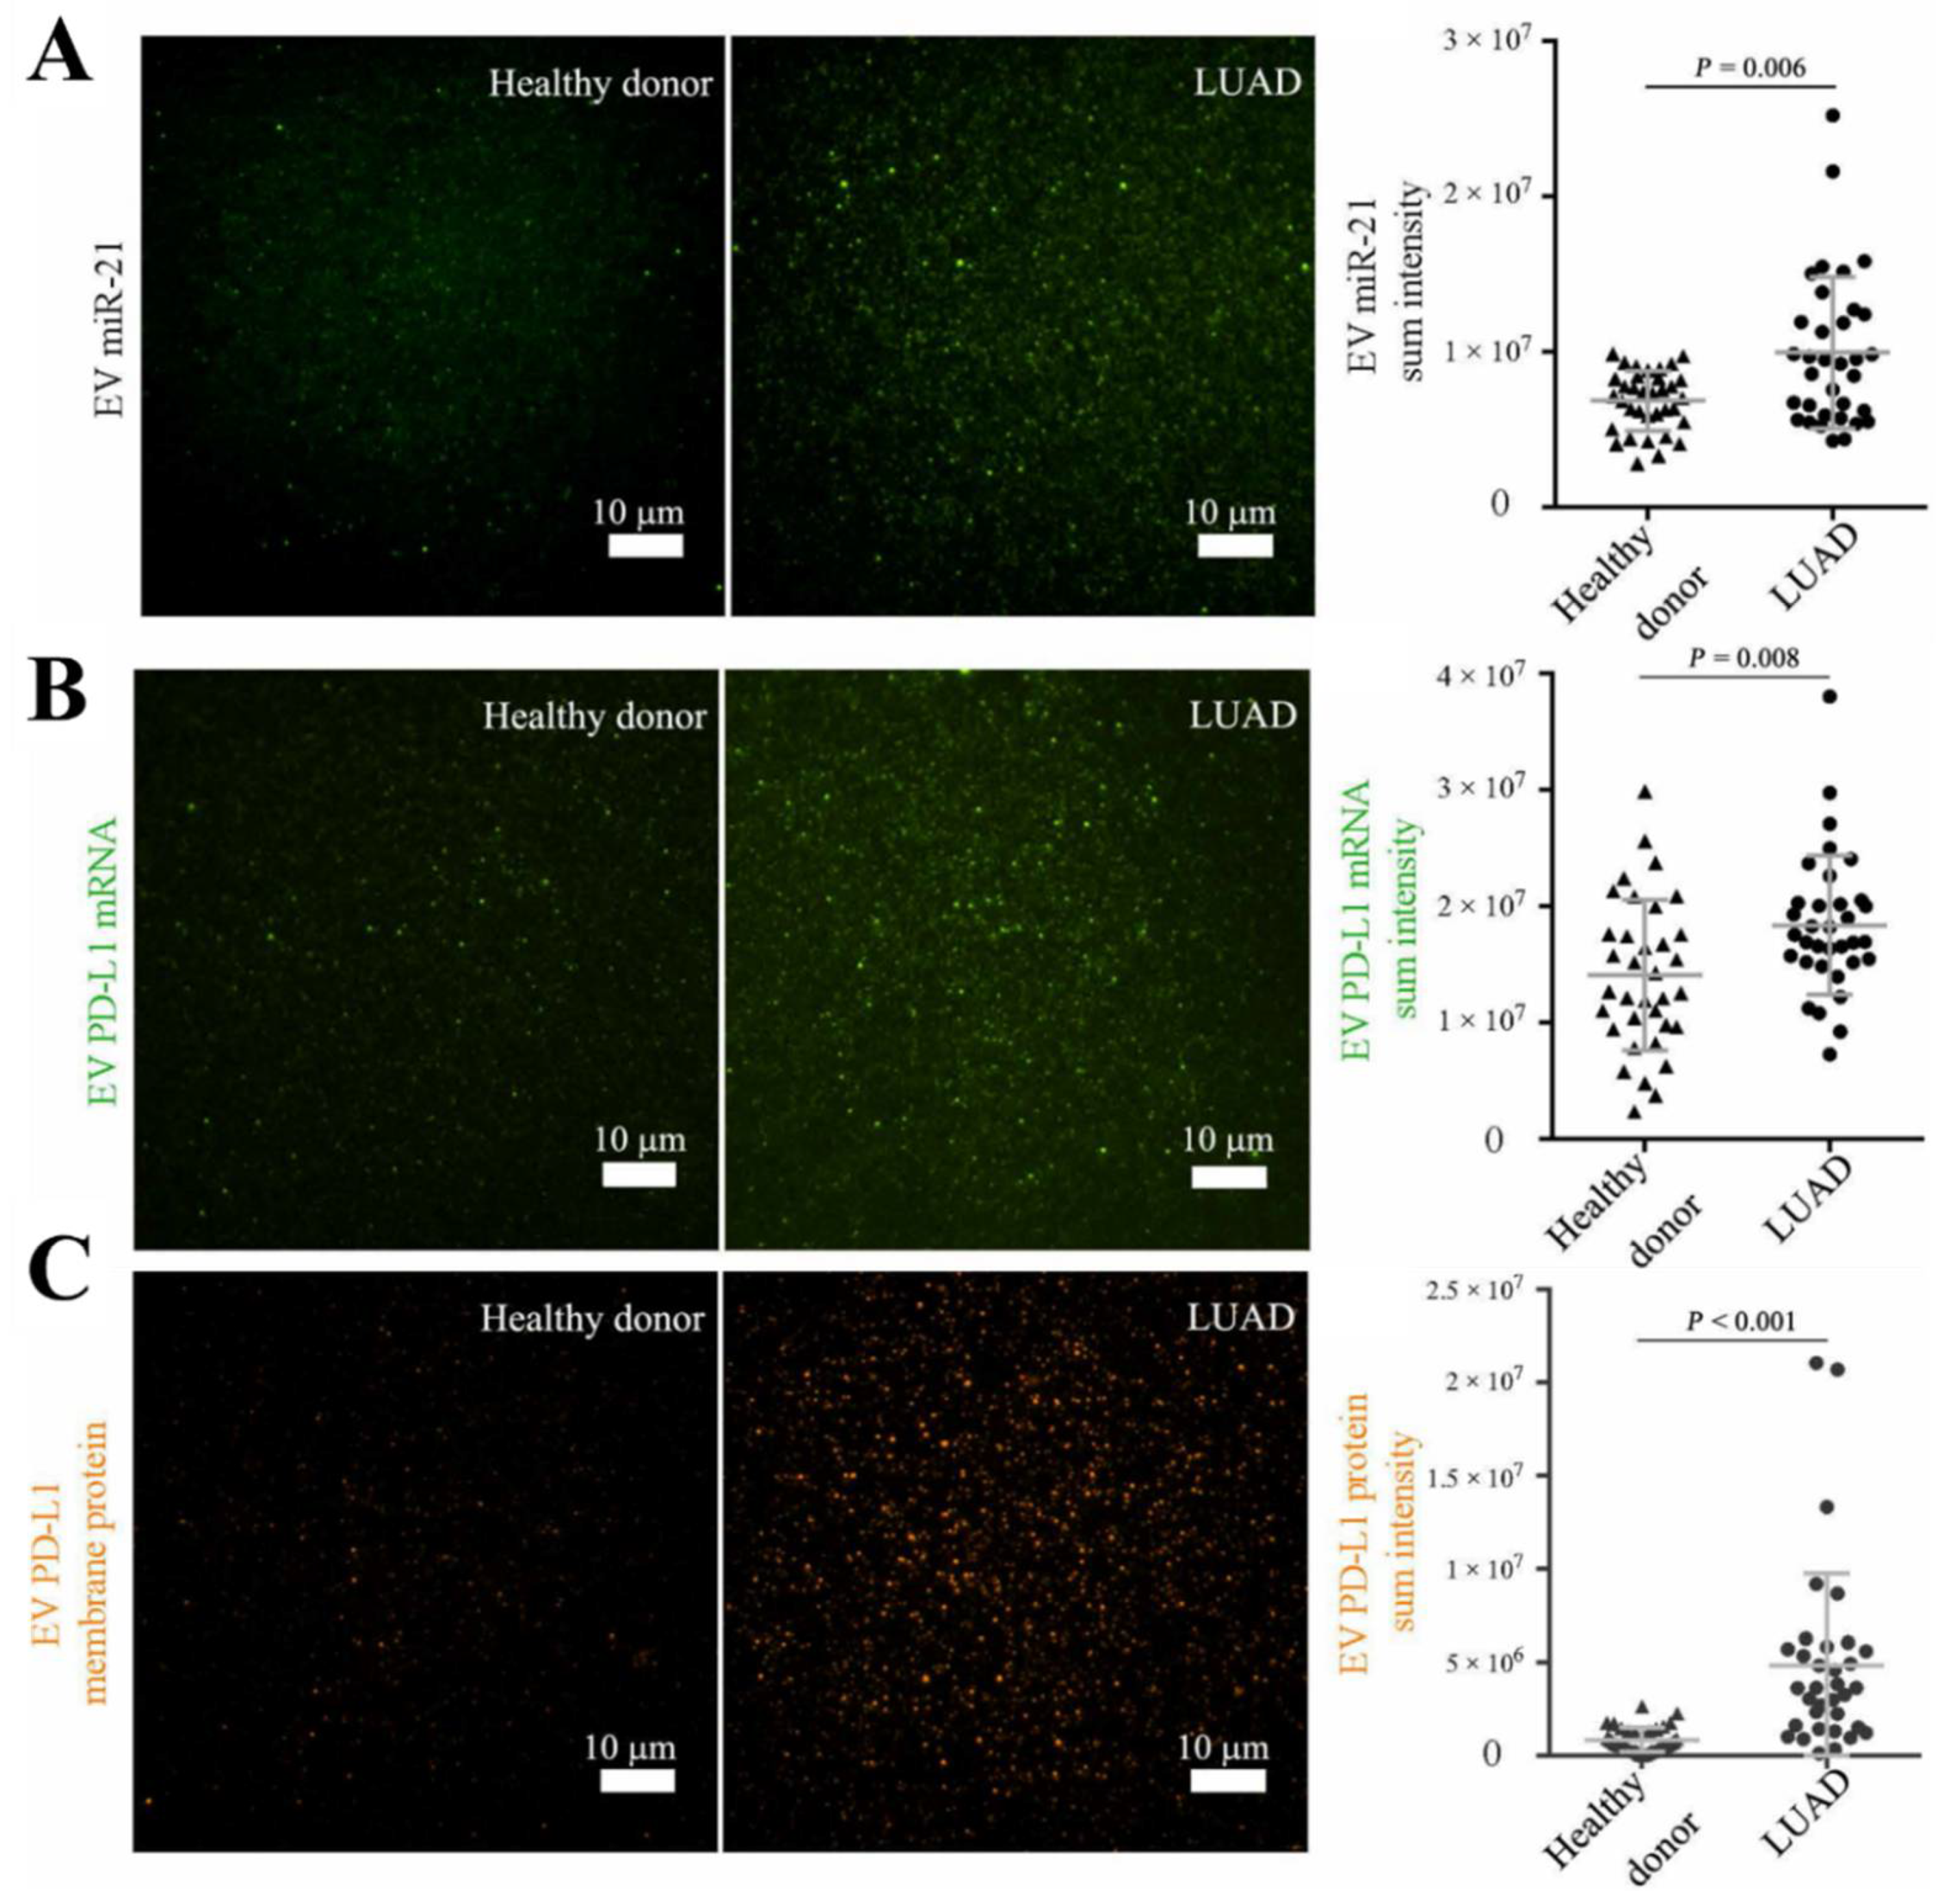
| RNA, protein | RNA, protein | yes | miR-21, PD-L1 | Lung cancer | Plasma | N = 34 | high-throughput Nano-bio Chip | N/D | 2020 | [110] |
| RNA, protein | RNA, protein | yes | PD-1, PD-L1, PD-1 mRNA, PD-L1 mRNA | Lung cancer | Serum | N = 54 | total internal reflection fluorescence (TIRF) | Accuracy = 93.2% | 2022 | [111] |
Disclaimer/Publisher’s Note: The statements, opinions and data contained in all publications are solely those of the individual author(s) and contributor(s) and not of MDPI and/or the editor(s). MDPI and/or the editor(s) disclaim responsibility for any injury to people or property resulting from any ideas, methods, instructions or products referred to in the content. |
© 2023 by the authors. Licensee MDPI, Basel, Switzerland. This article is an open access article distributed under the terms and conditions of the Creative Commons Attribution (CC BY) license (https://creativecommons.org/licenses/by/4.0/).
Share and Cite
Qiu, L.; Liu, X.; Zhu, L.; Luo, L.; Sun, N.; Pei, R. Current Advances in Technologies for Single Extracellular Vesicle Analysis and Its Clinical Applications in Cancer Diagnosis. Biosensors 2023, 13, 129. https://doi.org/10.3390/bios13010129
Qiu L, Liu X, Zhu L, Luo L, Sun N, Pei R. Current Advances in Technologies for Single Extracellular Vesicle Analysis and Its Clinical Applications in Cancer Diagnosis. Biosensors. 2023; 13(1):129. https://doi.org/10.3390/bios13010129
Chicago/Turabian StyleQiu, Lei, Xingzhu Liu, Libo Zhu, Liqiang Luo, Na Sun, and Renjun Pei. 2023. "Current Advances in Technologies for Single Extracellular Vesicle Analysis and Its Clinical Applications in Cancer Diagnosis" Biosensors 13, no. 1: 129. https://doi.org/10.3390/bios13010129