Wearable Flexible Electronics Based Cardiac Electrode for Researcher Mental Stress Detection System Using Machine Learning Models on Single Lead Electrocardiogram Signal

 ,
, 
 , , , and
Abstract
:1. Introduction
- (a)
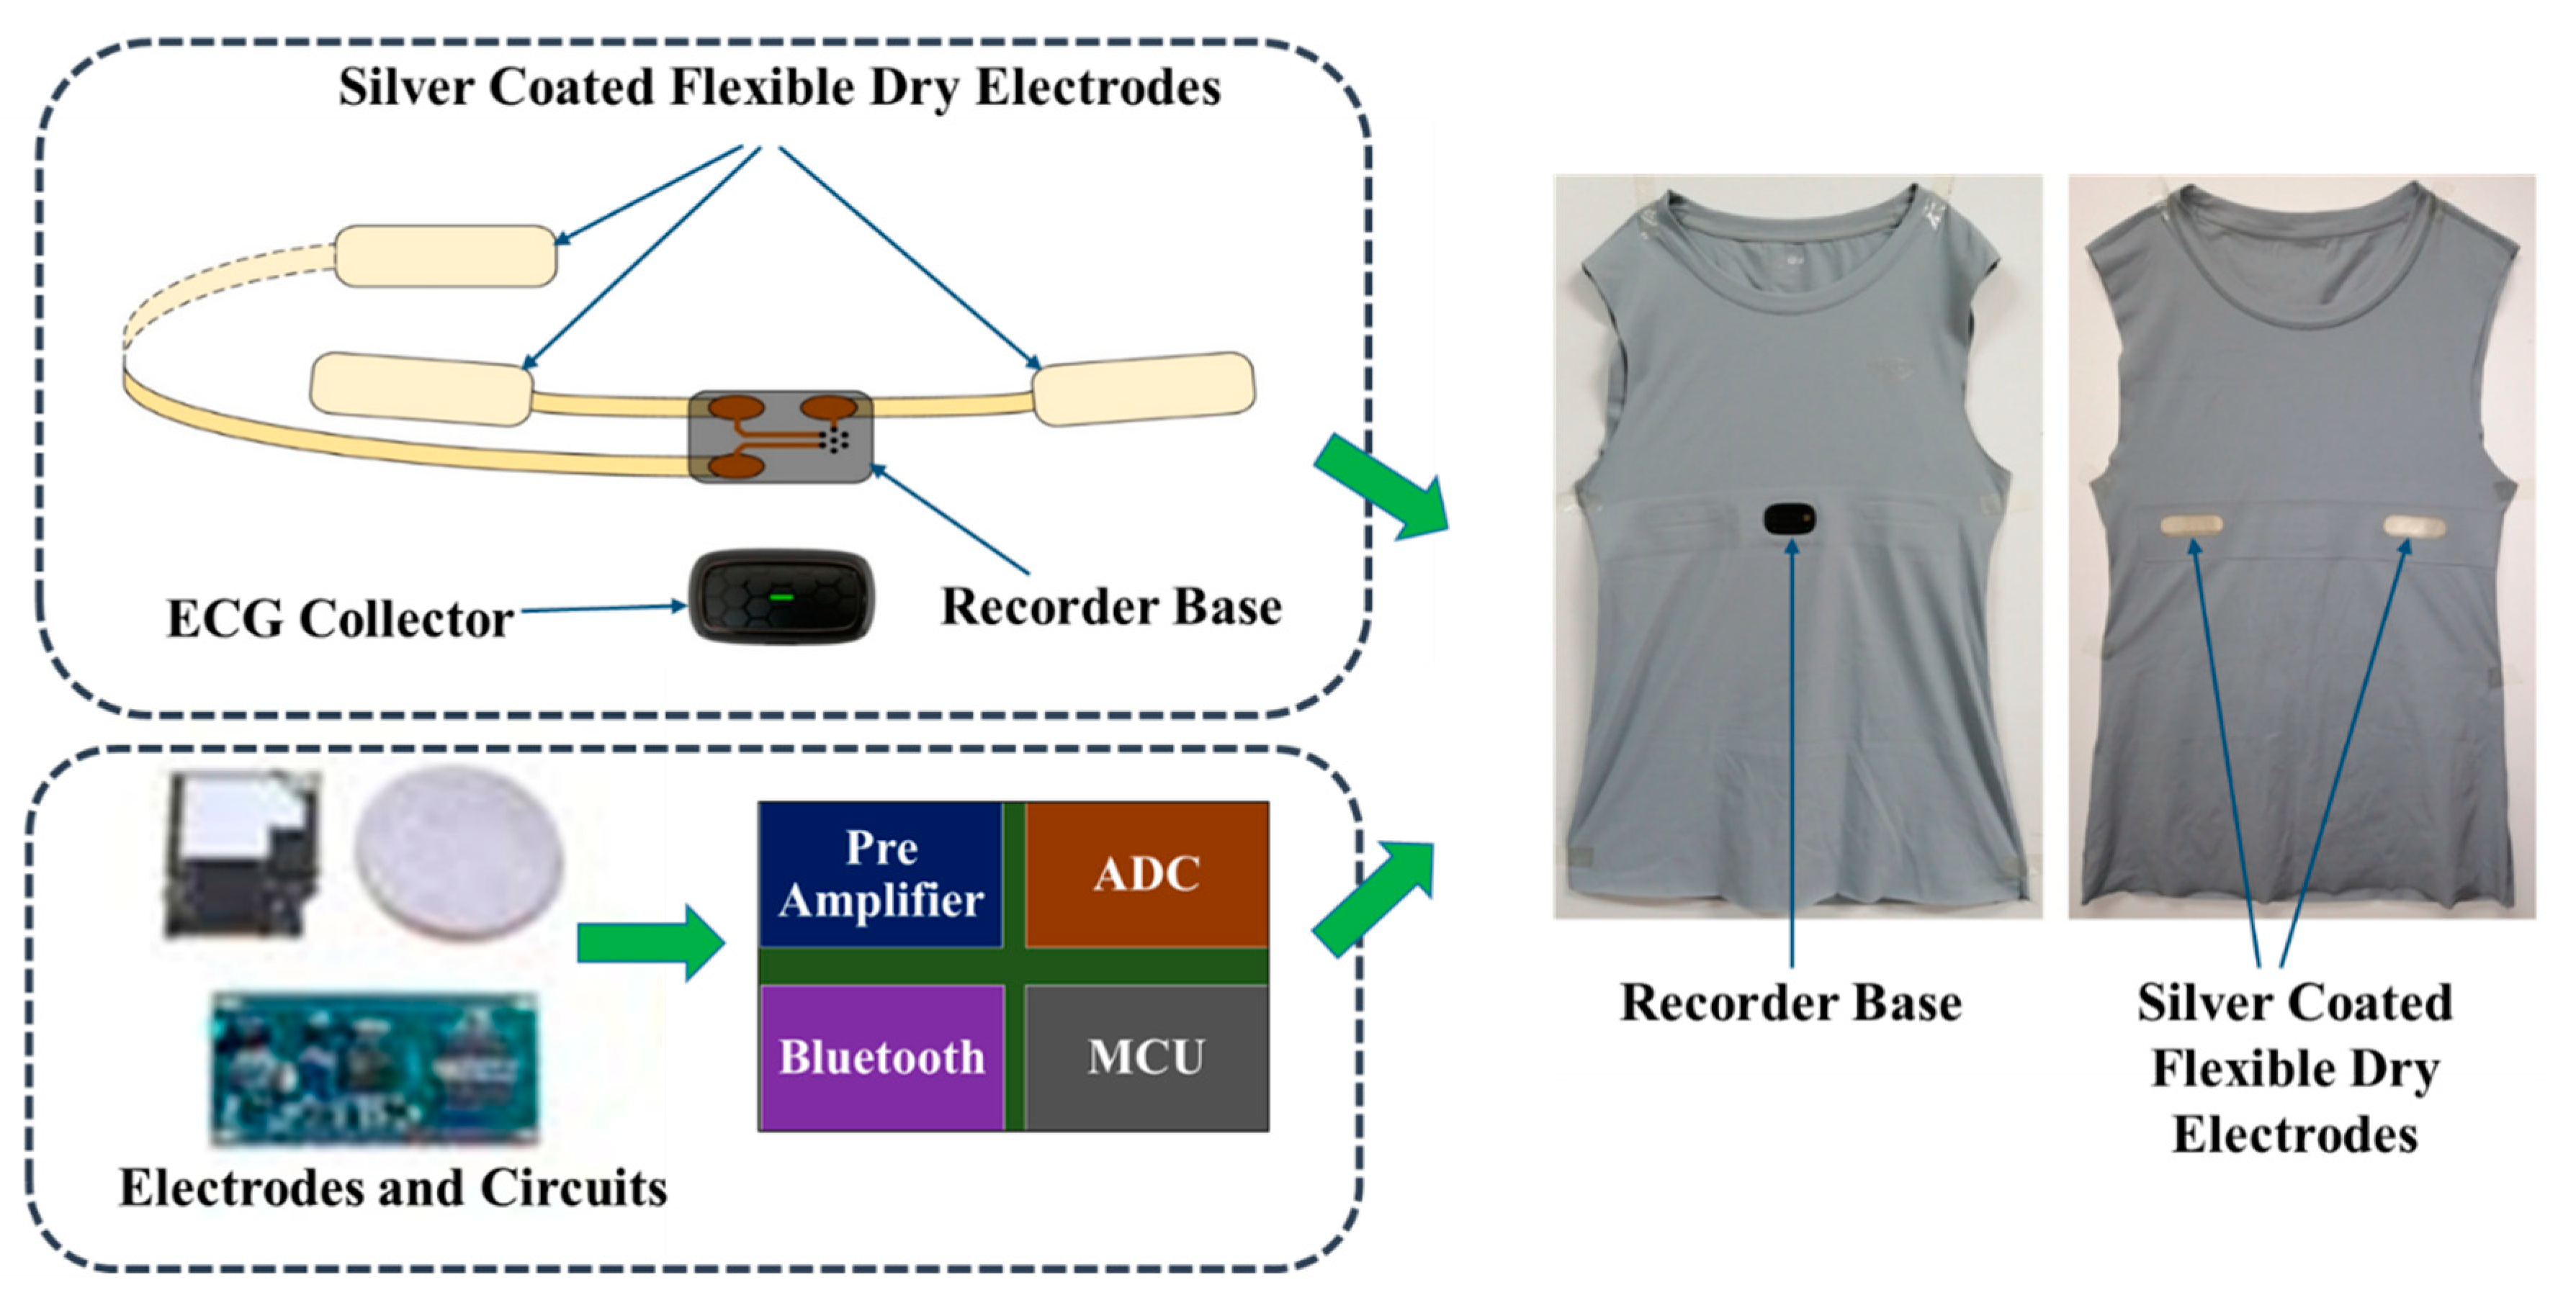
- Introducing flexible dry electrodes based on wearable smart T-shirts to monitor researchers’ health.
- (b)
- An automatic system based on extracted features from ECG signals and demographic features for the detection of researchers’ mental stress.
- (c)
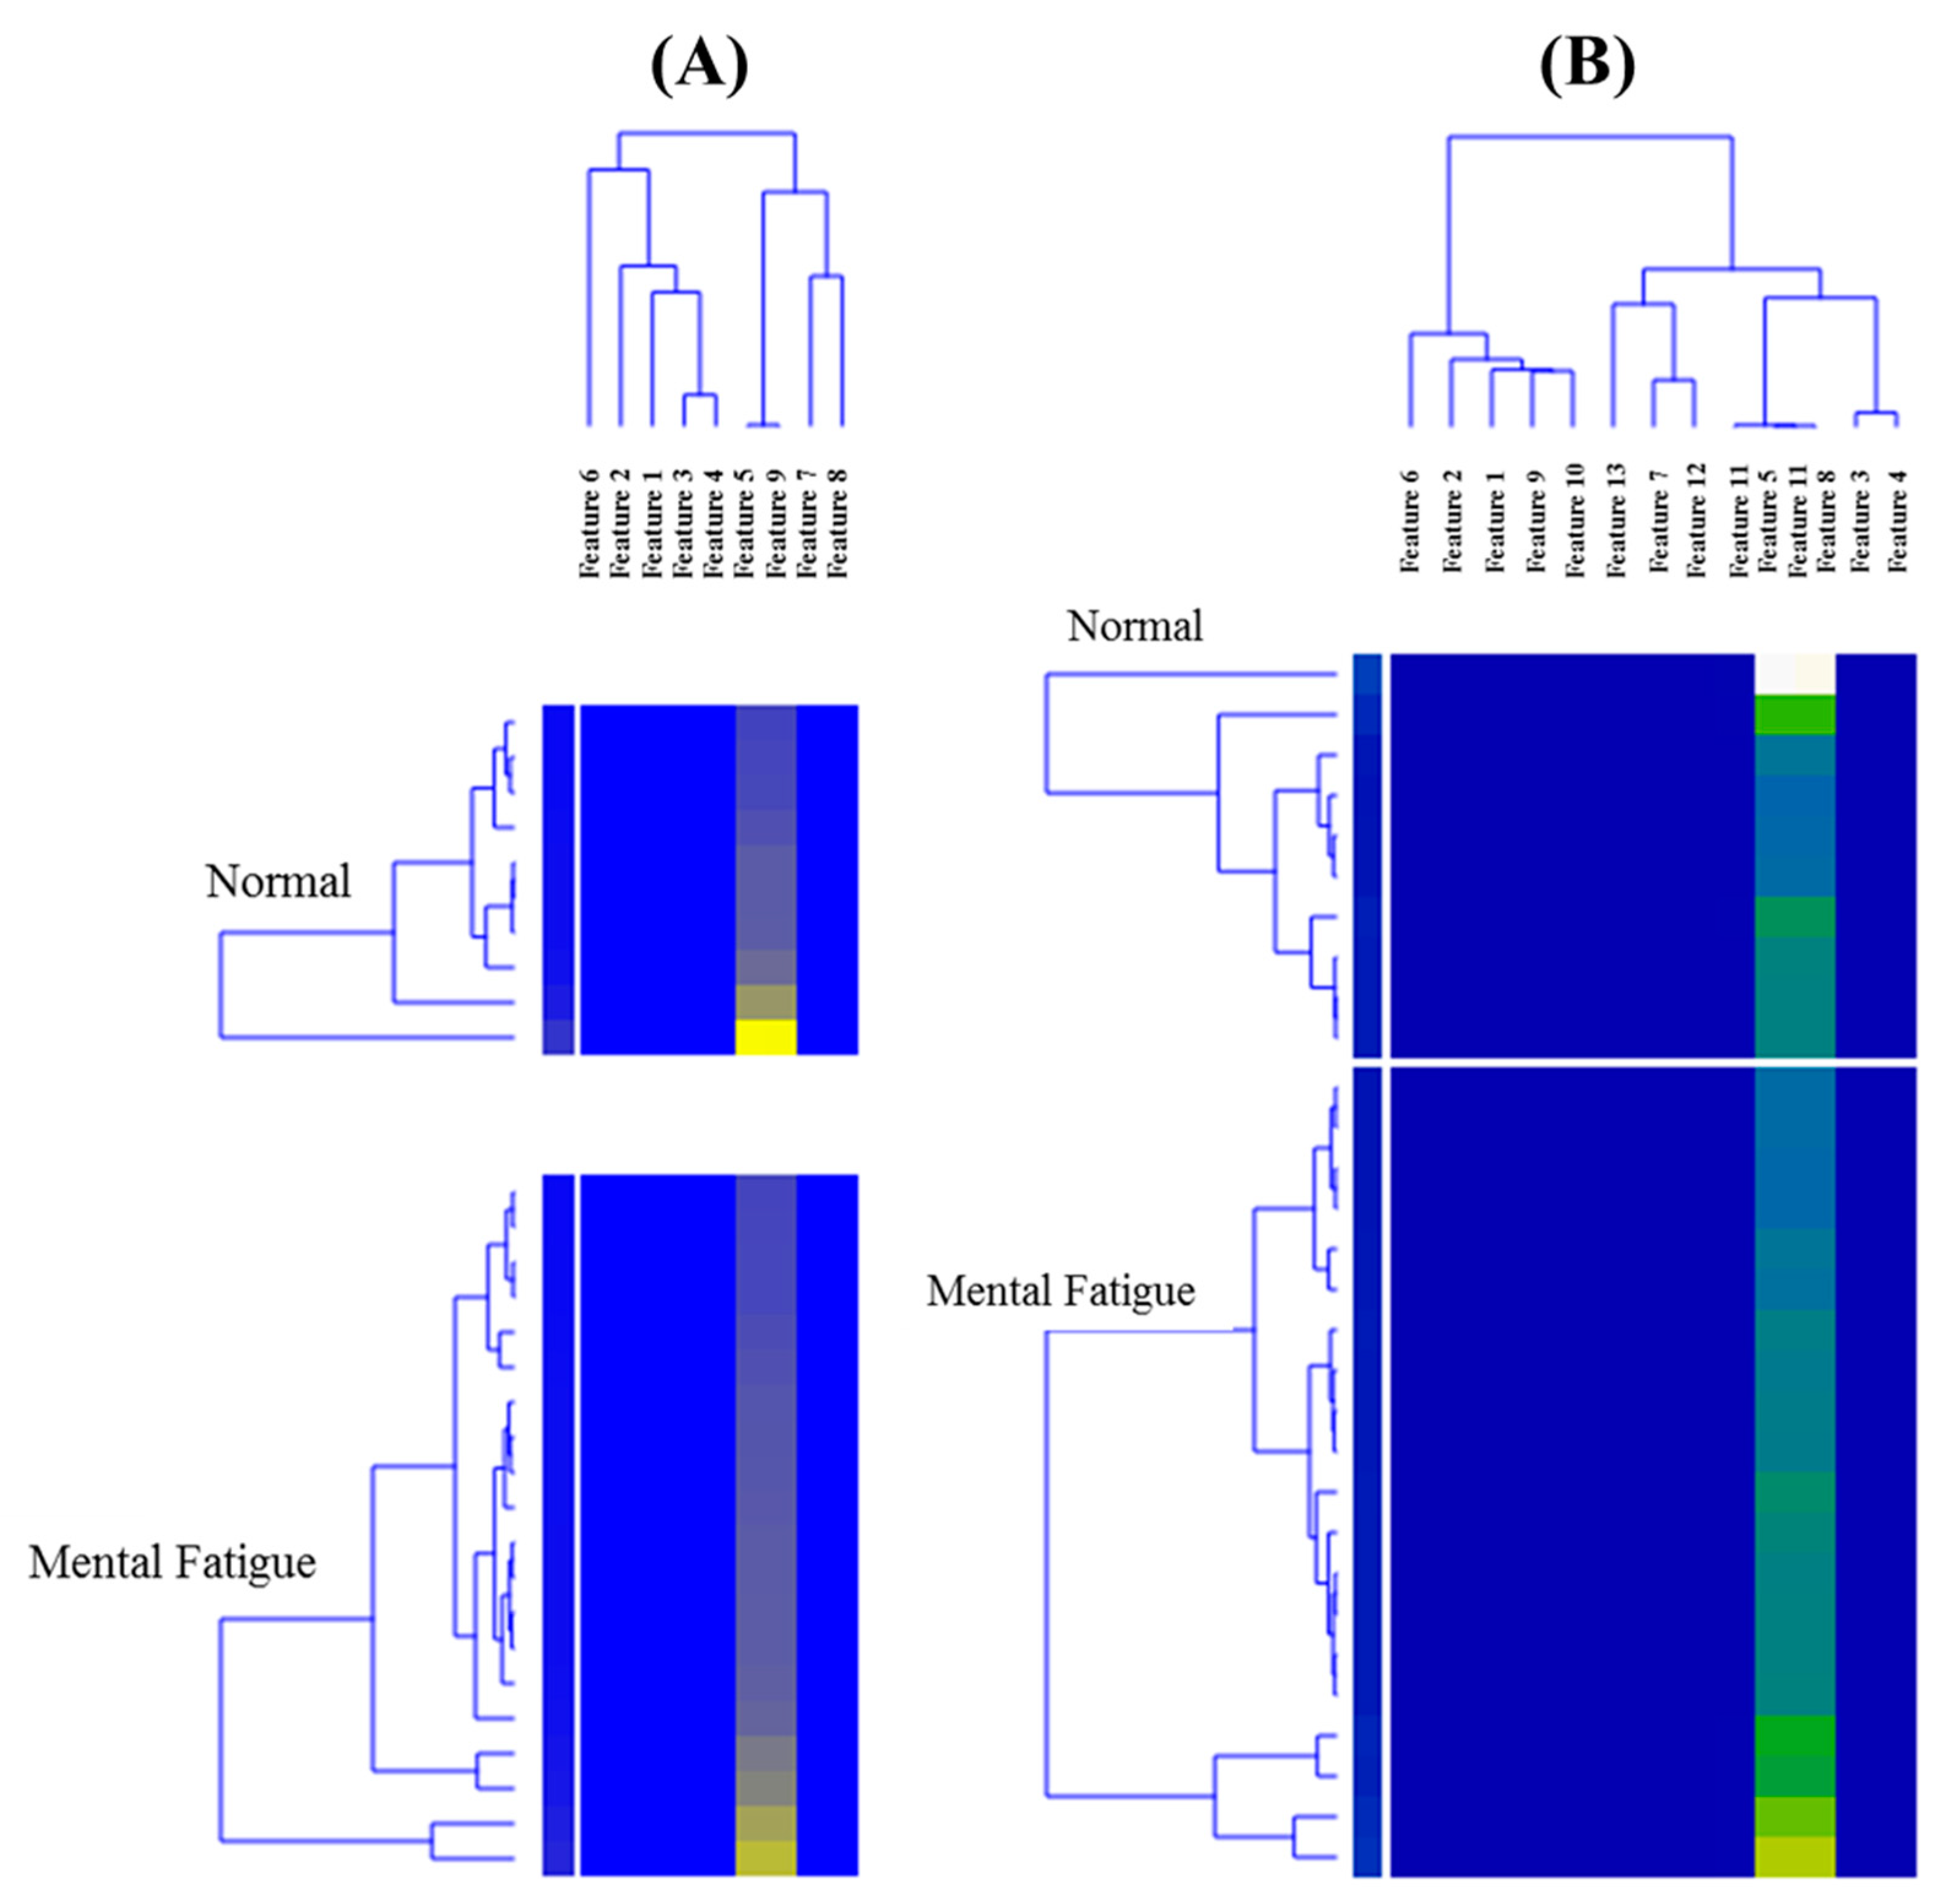
- Relationship between demographic and extracted features based on clustering technique.
- (d)
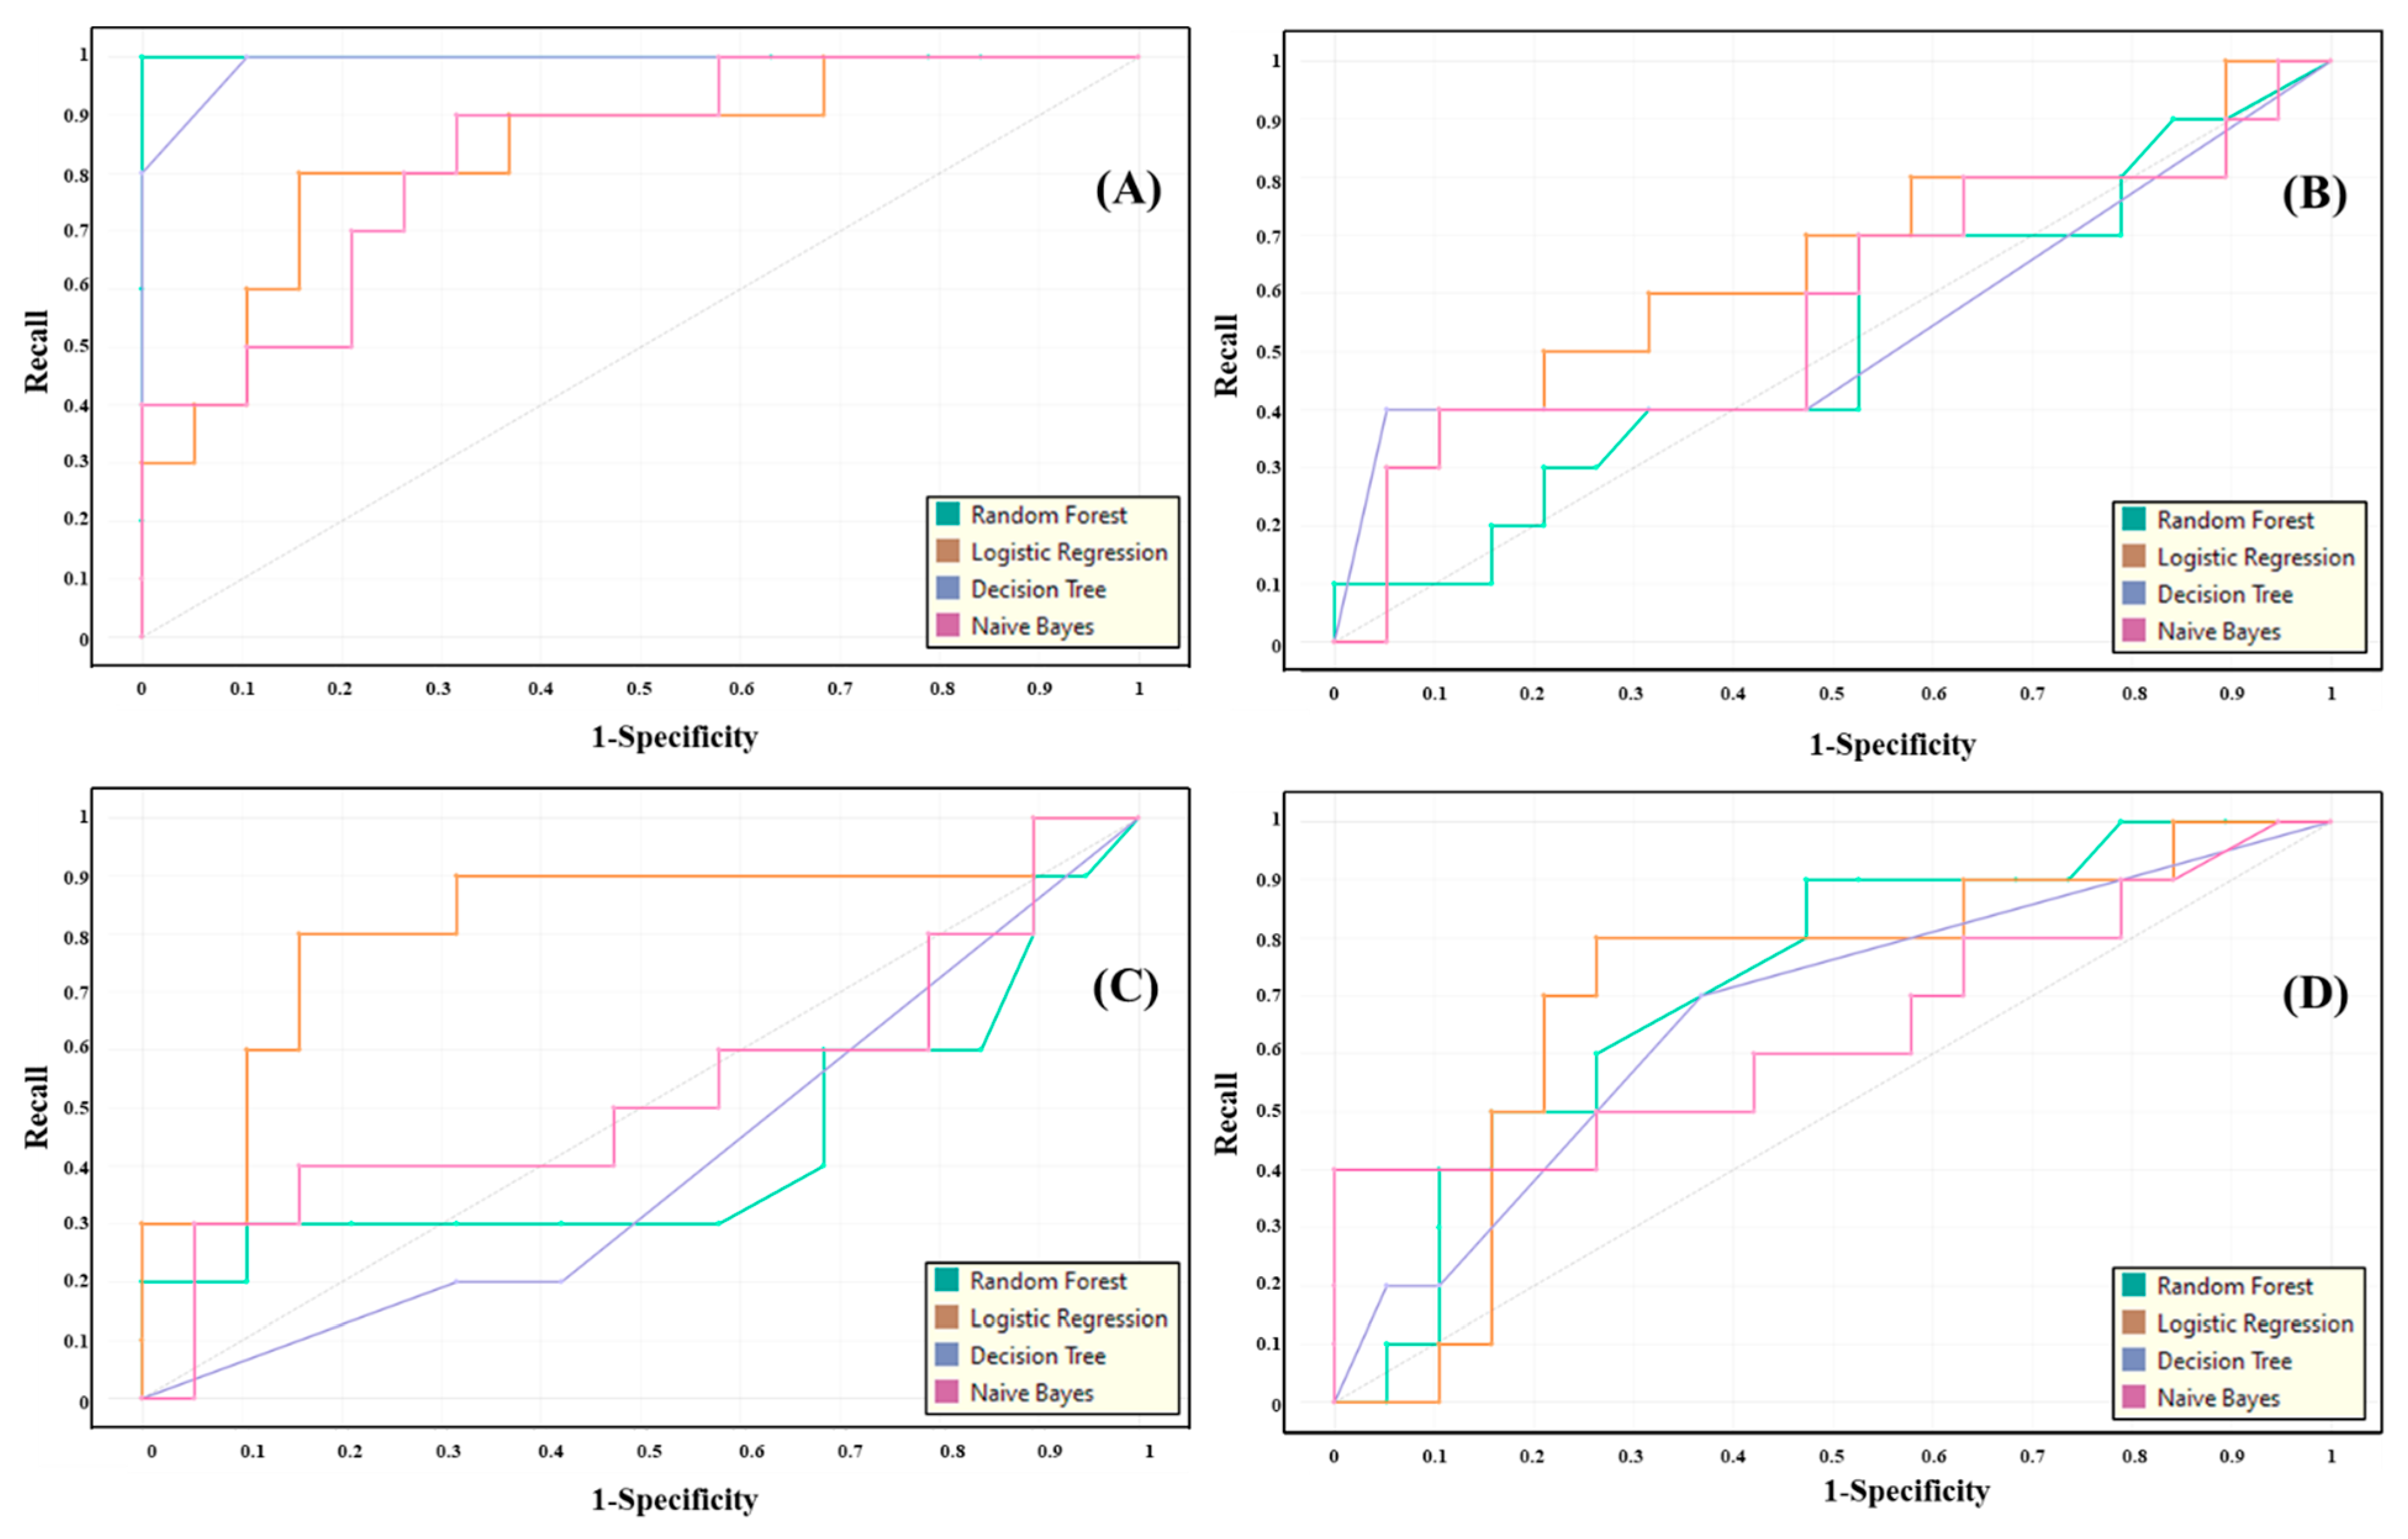
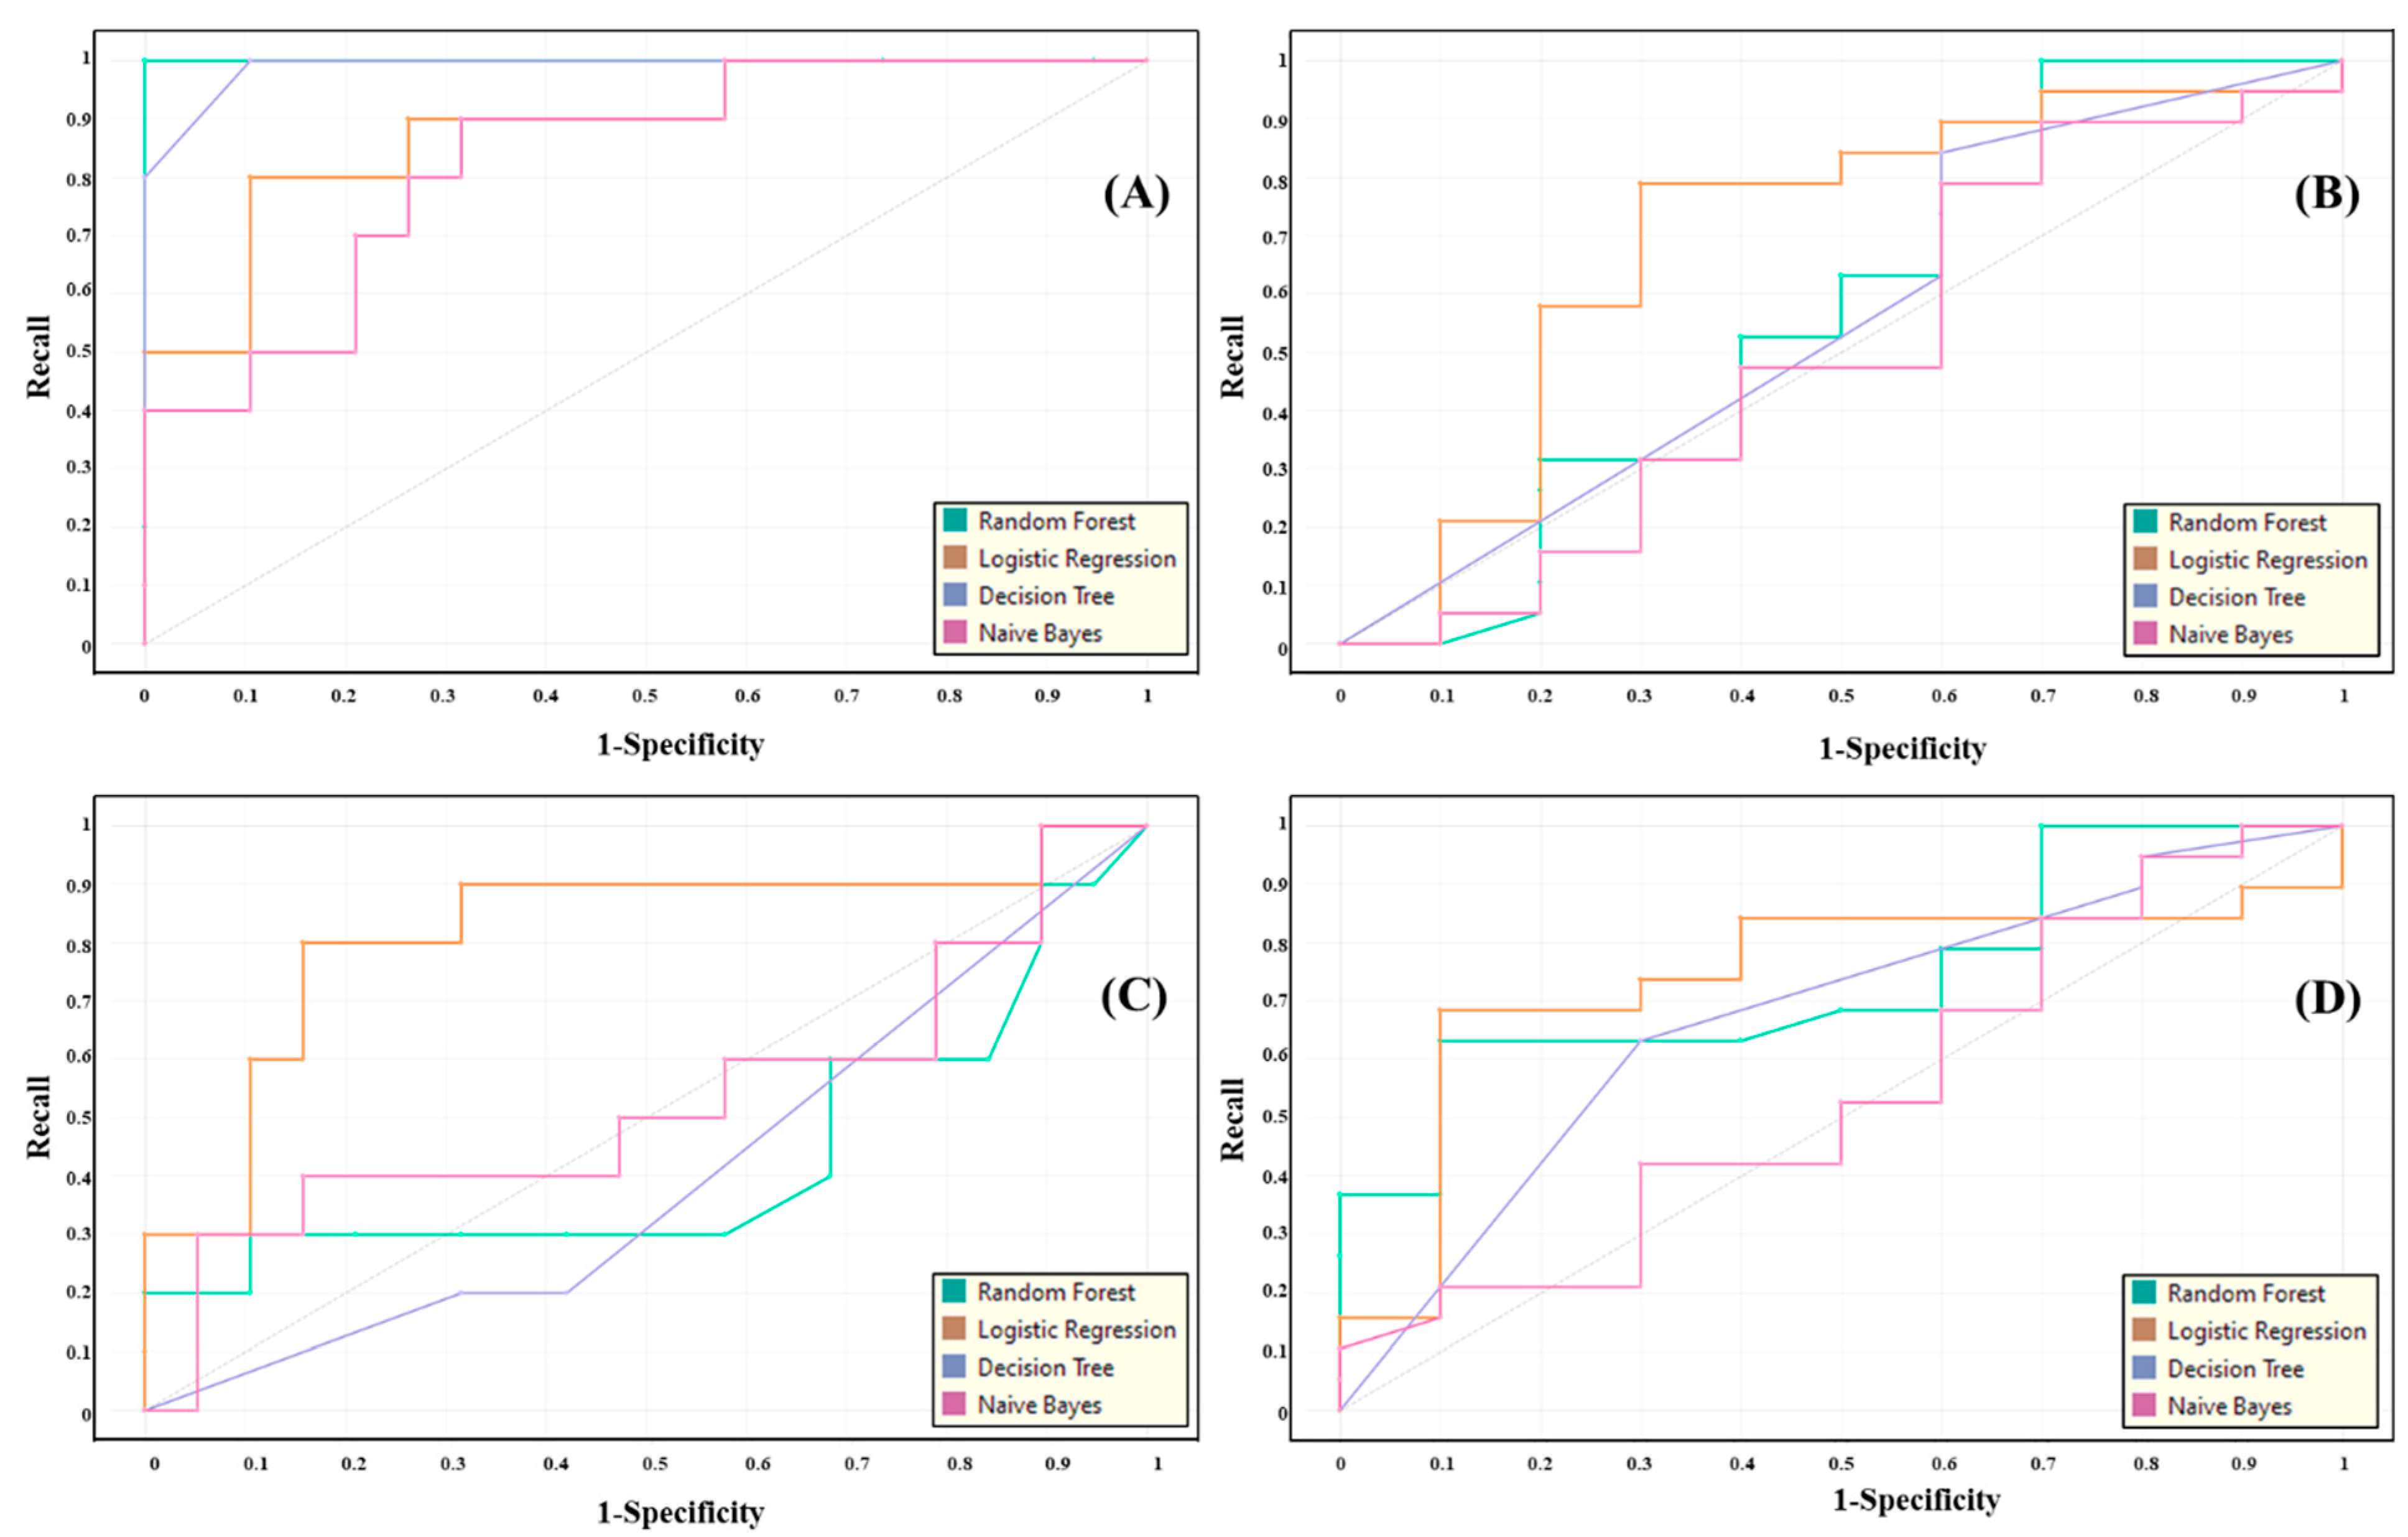
- Comparison between different machine learning classifiers to find a suitable classification method for the automatic mental stress detection system.
- (e)
- To achieve the average accuracy for the inter-subject (subject-wise) classification using the best performer classifier of the intra-subject (mental stress and normal) classification.
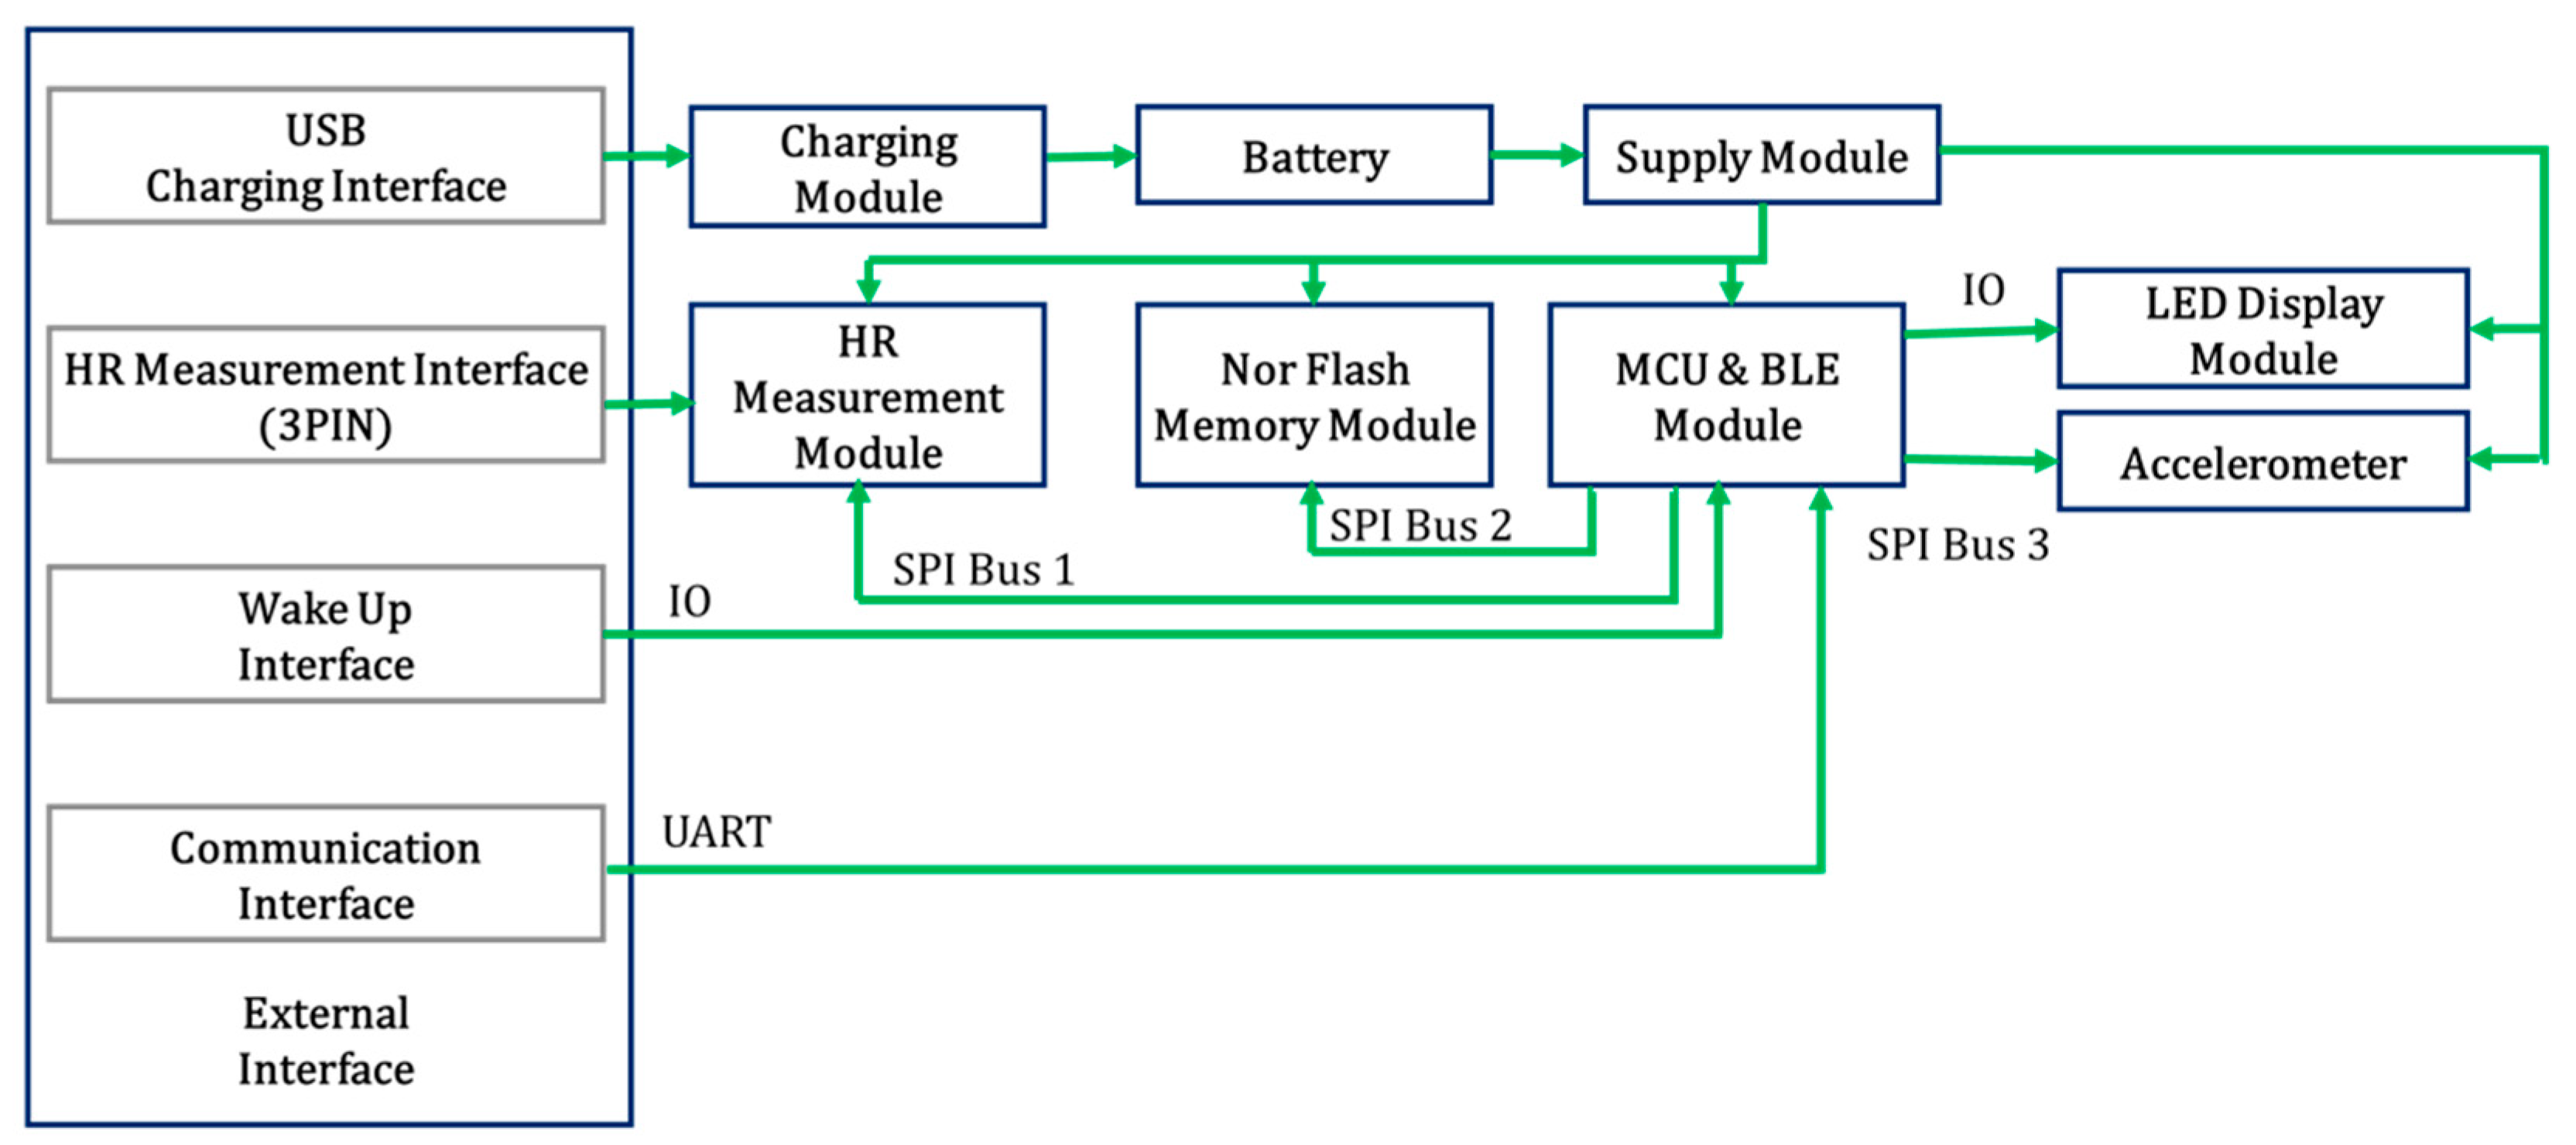
2. Wearable Smart T-Shirt
3. Materials and Methods
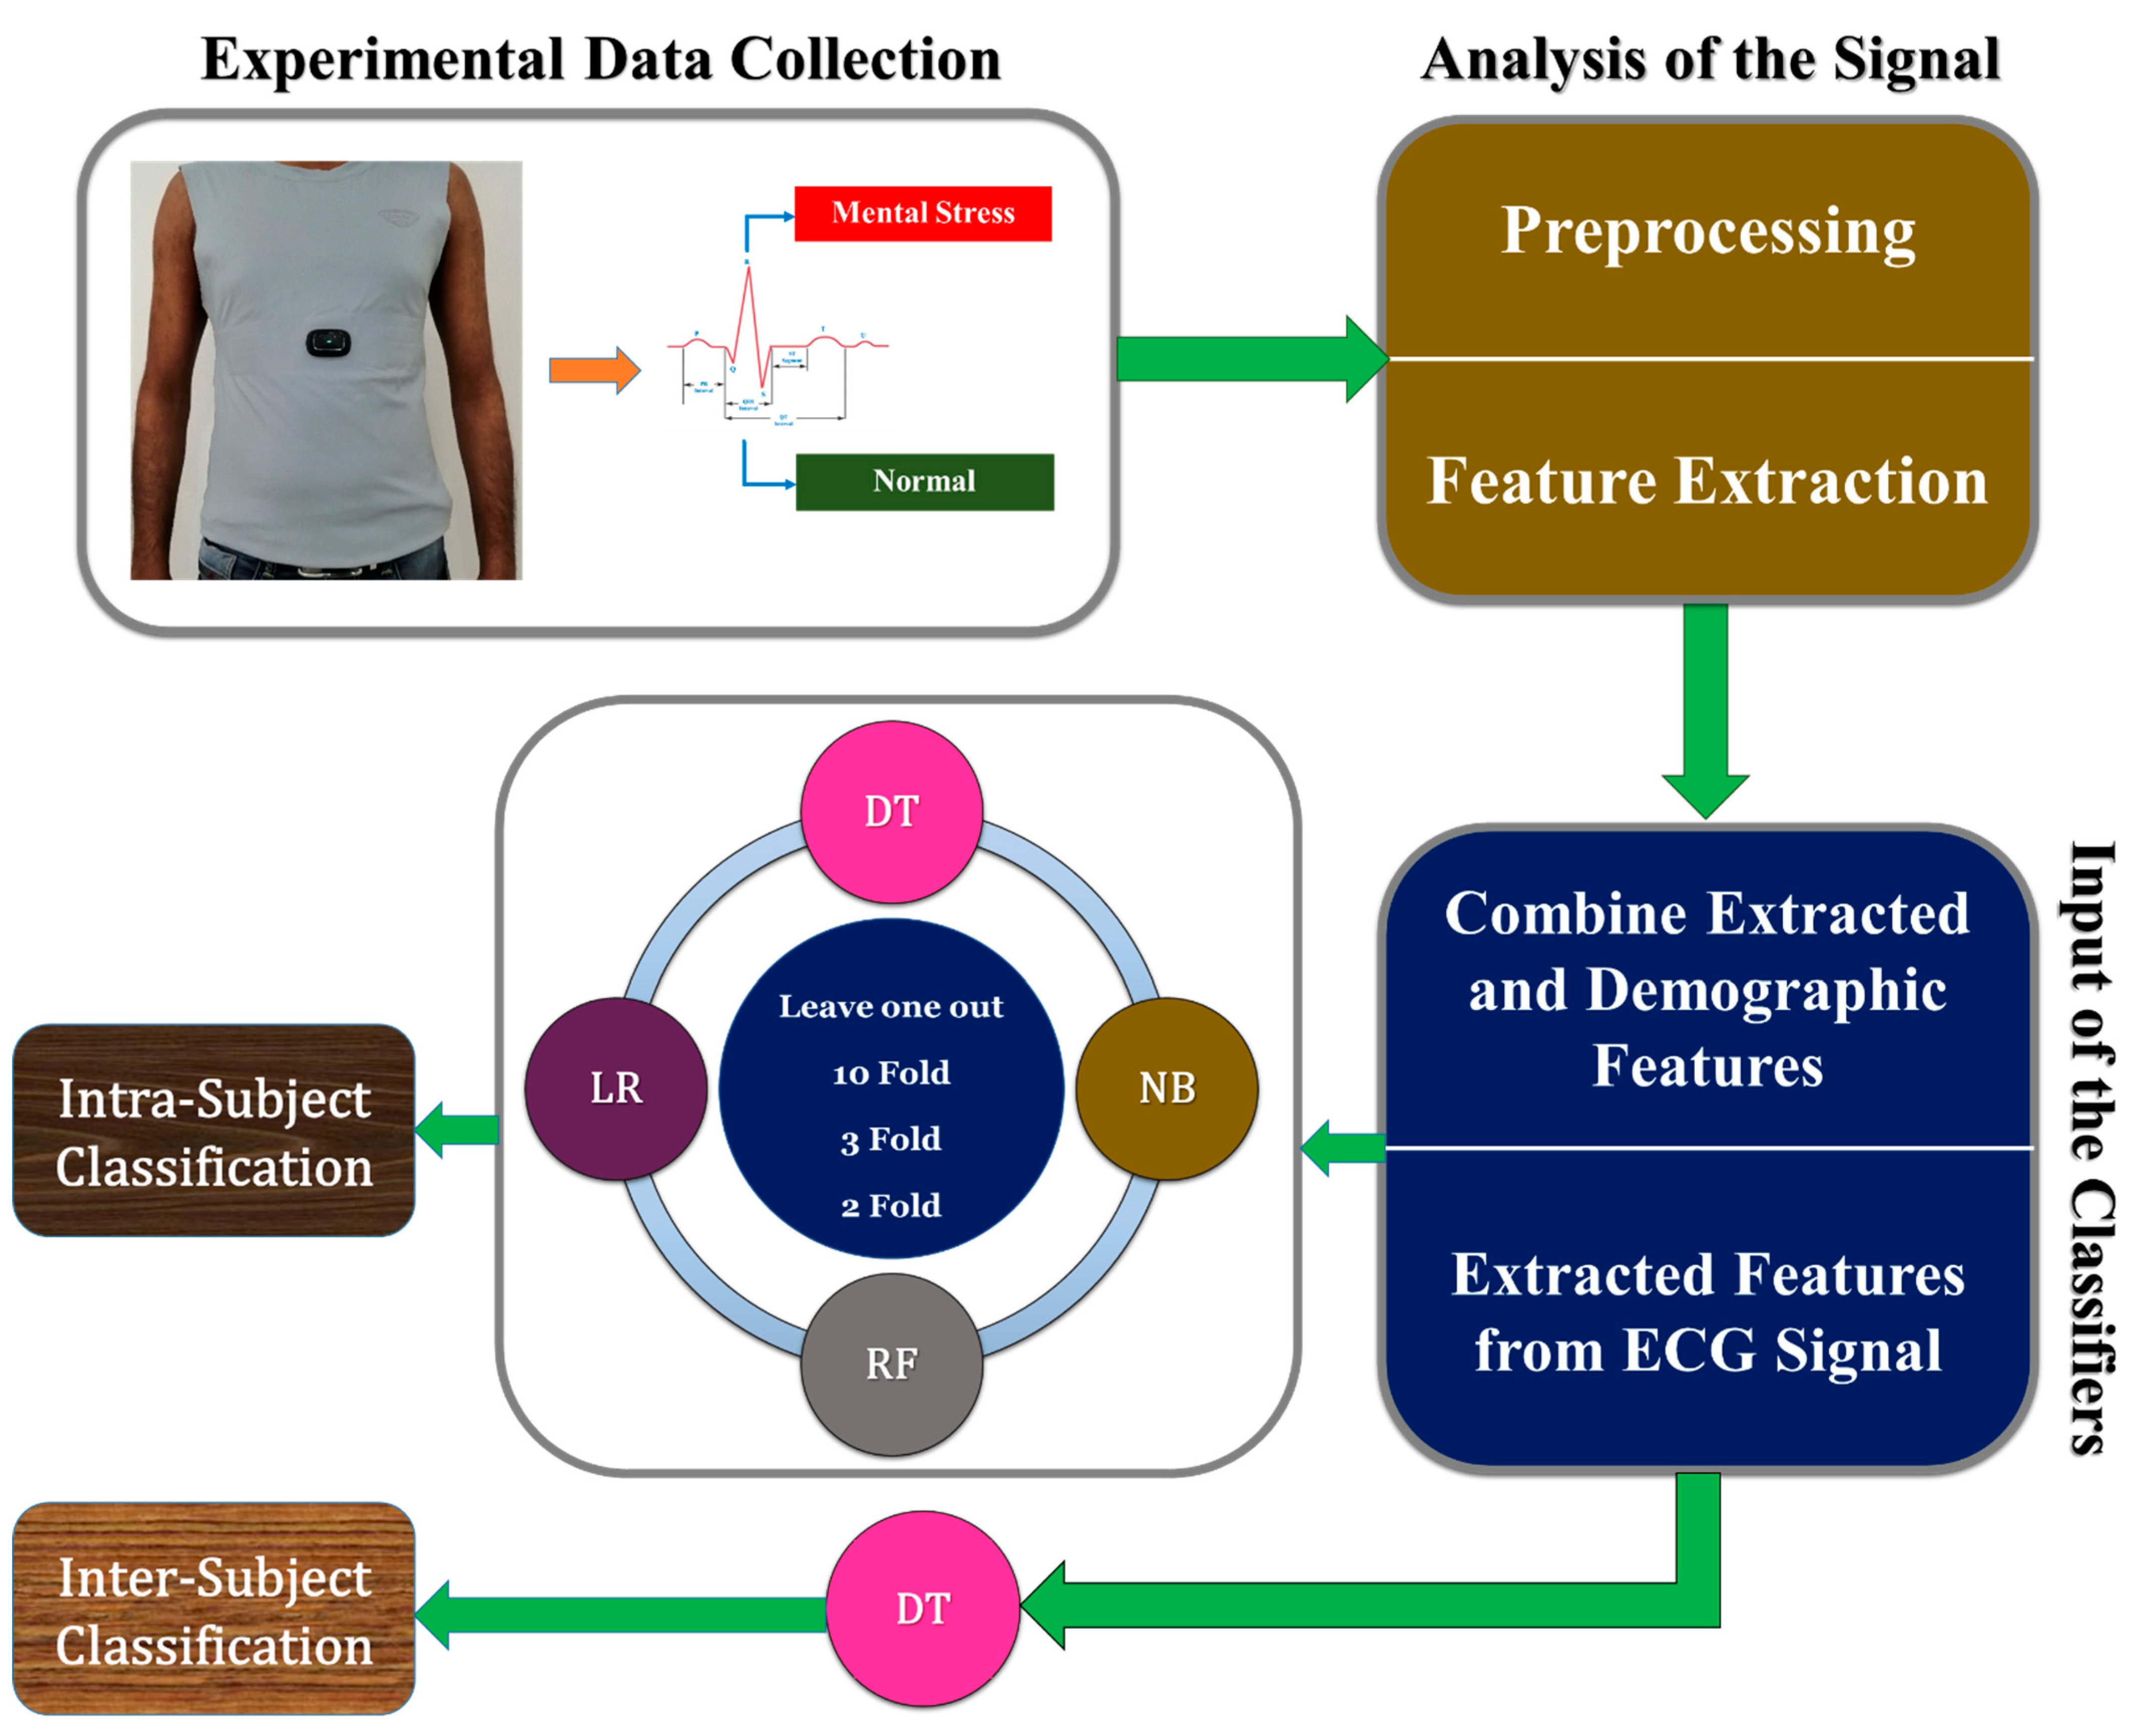
3.1. Experimental Design and Data Collection
3.2. Preprocessing and Features Calculation
3.3. Classification Techniques
3.4. Performance Evaluation of the Proposed System
3.5. Normalization Method
3.6. Statistical Analysis
4. Results and Discussion
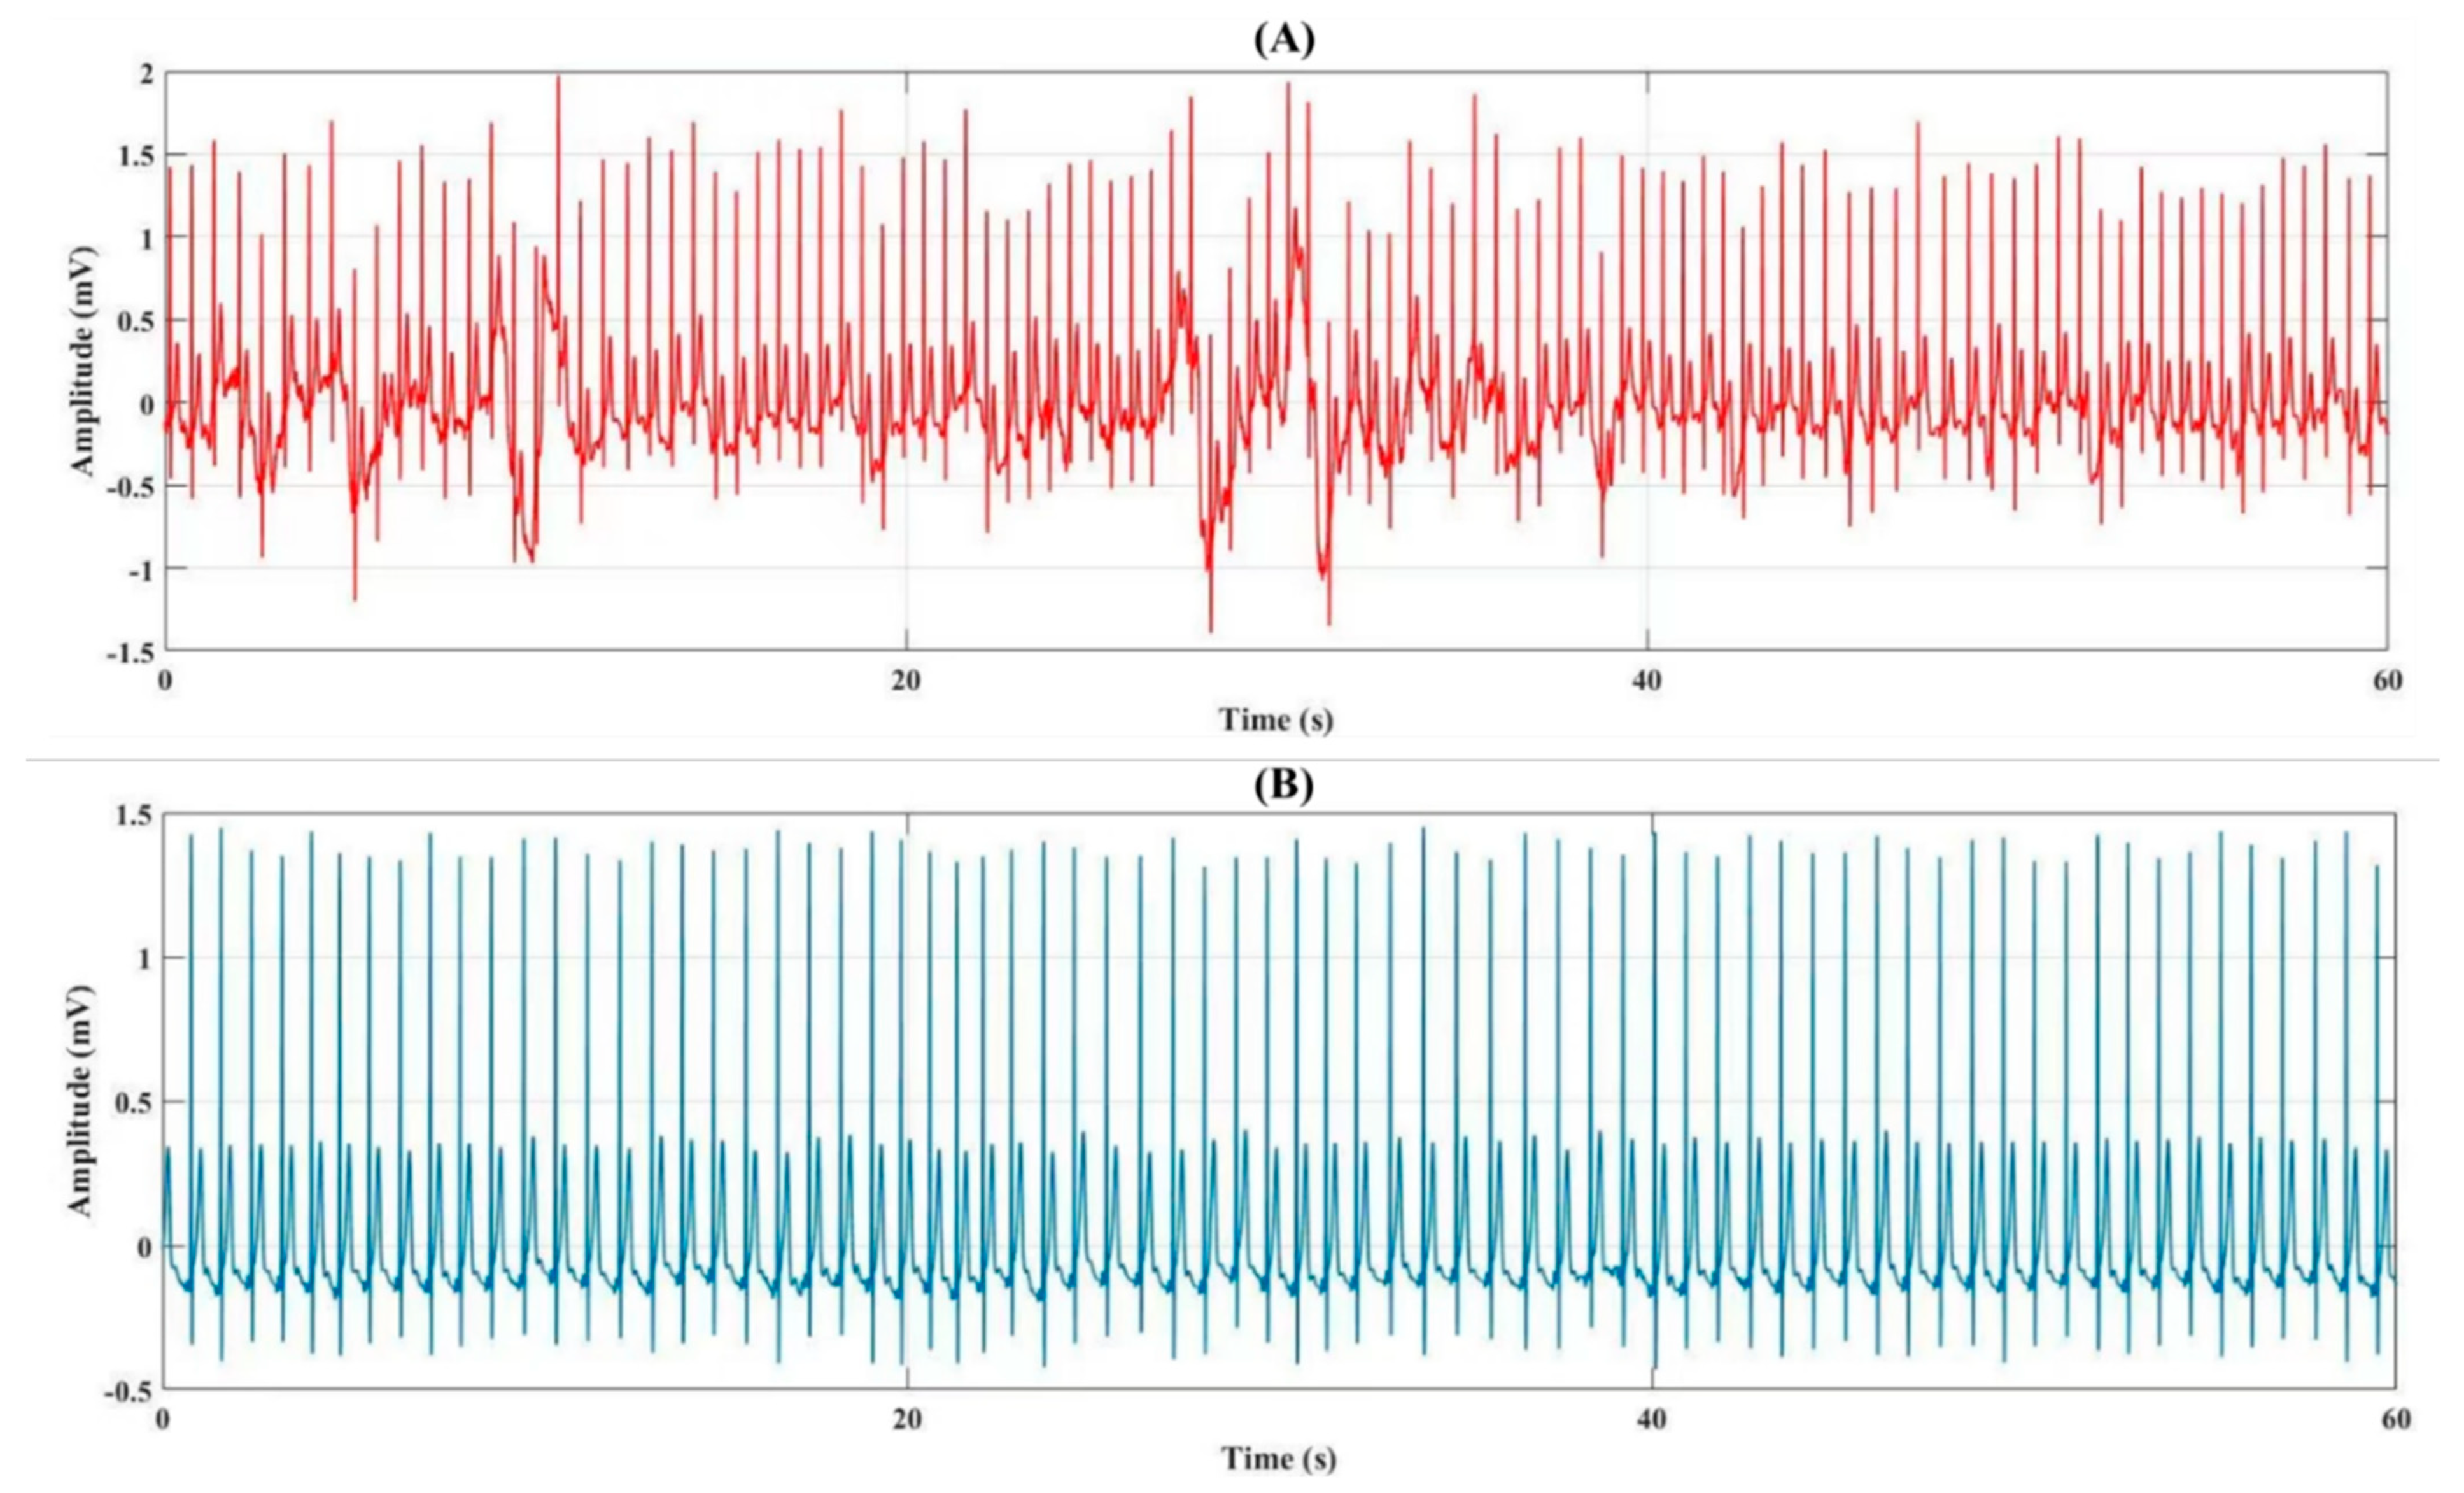
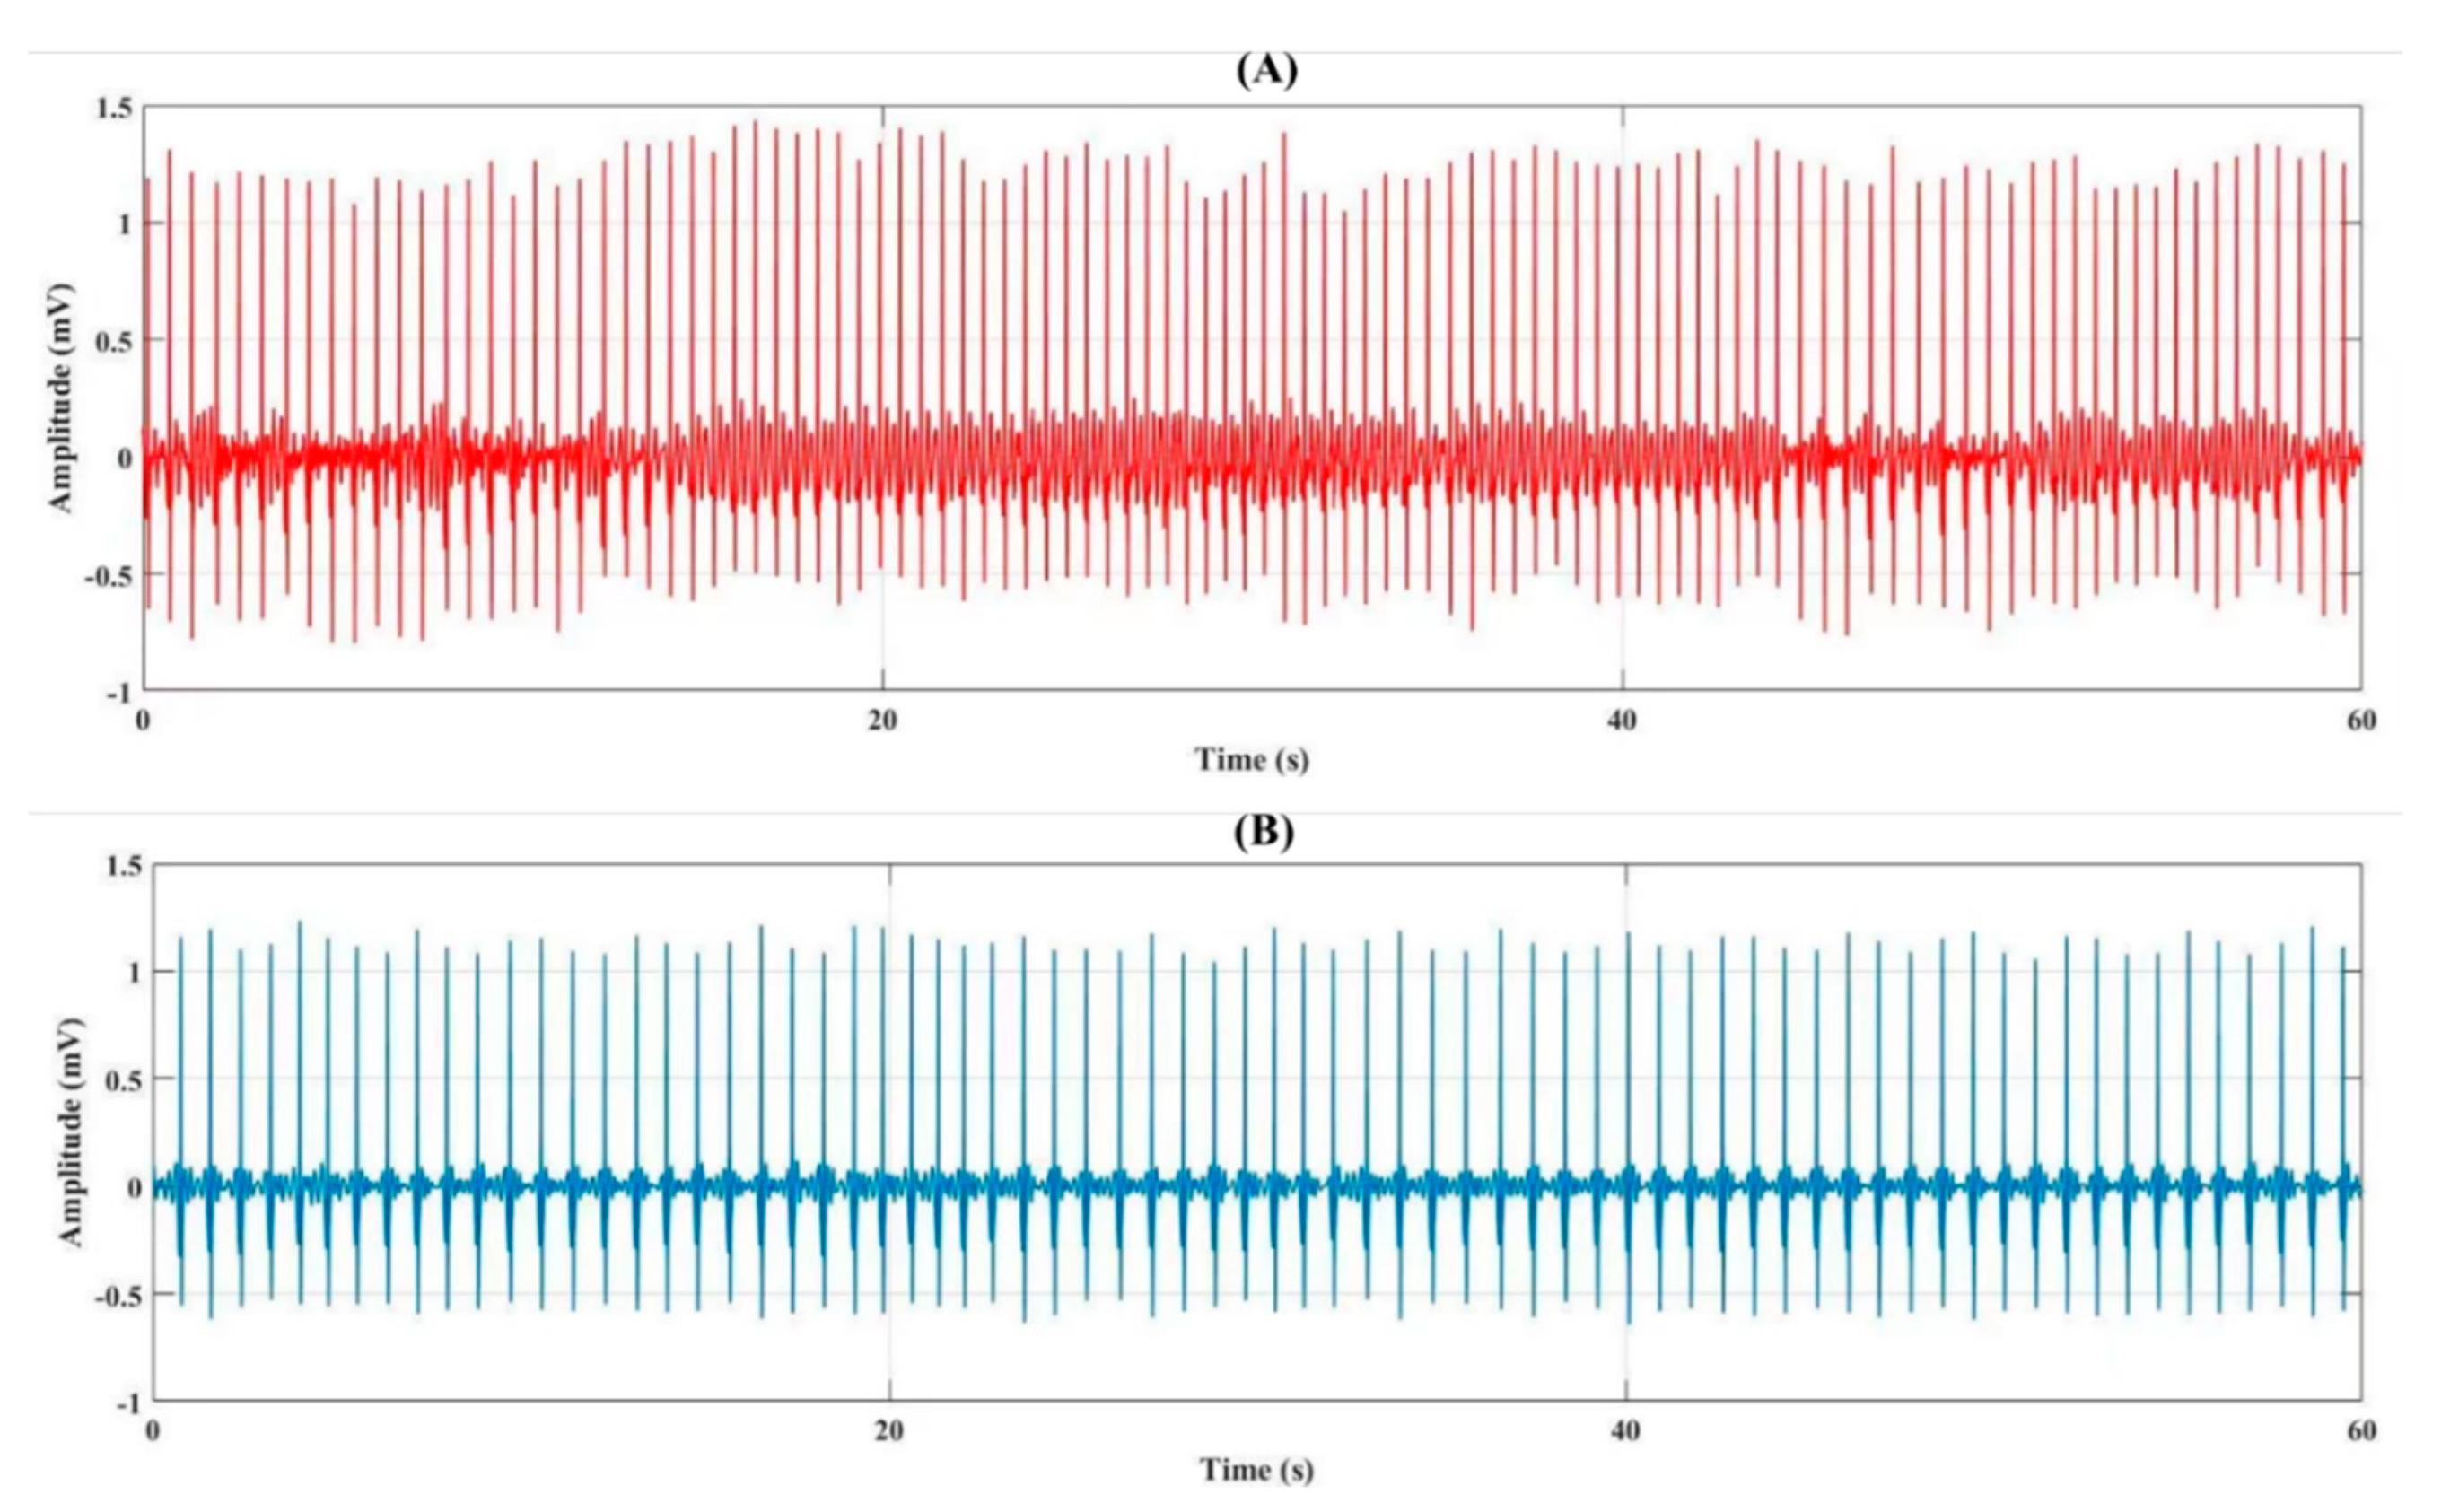
4.1. Analysis of the Signal
4.2. Intra-Subject (Mental Stress and Normal) Classification Results of the Proposed System
4.3. Performance of the Inter-Subject Classification Using DT Classifier
4.4. Comparison between Proposed and Previously Selected Methods
4.5. Applications and Limitations of the Proposed Study
5. Conclusions
Author Contributions
Funding
Institutional Review Board Statement
Informed Consent Statement
Data Availability Statement
Acknowledgments
Conflicts of Interest
References
- Kim, I.; Koo, M.J.; Lee, H.E.; Won, Y.L.; Song, J. Overwork-related disorders and recent improvement of national policy in South Korea. J. Occup. Health 2019, 61, 288–296. [Google Scholar] [CrossRef] [PubMed] [Green Version]
- Yamauchi, T.; Yoshikawa, T.; Takamoto, M.; Sasaki, T.; Matsumoto, S.; Kayashima, K.; Takeshima, T.; Takahashi, M. Overwork-related disorders in Japan: Recent trends and development of a national policy to promote preventive measures. Ind. Health 2017, 55, 293–302. [Google Scholar] [CrossRef] [PubMed] [Green Version]
- Asgari, B. Karoshi and Karou-jisatsu in Japan: Causes, statistics and prevention mechanisms. Asia Pacific Bus. Econ. Perspect. 2016, 4, 49–72. [Google Scholar]
- Ke, D.S. Overwork, stroke, and karoshi-death from overwork. Acta Neurol Taiwan 2012, 21, 54–59. [Google Scholar] [PubMed]
- Chaudhuri, A.; Behan, P.O. Fatigue in neurological disorders. Lancet 2004, 363, 978–988. [Google Scholar] [CrossRef]
- Kroemer, K.H.E.; Grandjean, E. Fitting the Task to the Human: A Textbook of Occupational Ergonomics; CRC Press: Boca Raton, FL, USA, 1997; ISBN 020348391X. [Google Scholar]
- Lampert, R. ECG signatures of psychological stress. J. Electrocardiol. 2015, 48, 1000–1005. [Google Scholar] [CrossRef] [Green Version]
- Von Rosenberg, W.; Chanwimalueang, T.; Adjei, T.; Jaffer, U.; Goverdovsky, V.; Mandic, D.P. Resolving Ambiguities in the LF/HF Ratio: LF-HF Scatter Plots for the Categorization of Mental and Physical Stress from HRV. Front. Physiol. 2017, 8, 360. [Google Scholar] [CrossRef] [Green Version]
- Ishaque, S.; Khan, N.; Krishnan, S. Trends in Heart-Rate Variability Signal Analysis. Front. Digit. Health 2021, 3, 639444. [Google Scholar] [CrossRef]
- Giordano, F.J. Oxygen, oxidative stress, hypoxia, and heart failure. J. Clin. Investig. 2005, 115, 500–508. [Google Scholar] [CrossRef]
- Zhou, L.; Solhjoo, S.; Millare, B.; Plank, G.; Abraham, M.R.; Cortassa, S.; Trayanova, N.; O’Rourke, B. Effects of regional mitochondrial depolarization on electrical propagation: Implications for arrhythmogenesis. Circ. Arrhythmia Electrophysiol. 2014, 7, 143–151. [Google Scholar] [CrossRef] [Green Version]
- Terman, A.; Brunk, U.T. The Aging Myocardium: Roles of Mitochondrial Damage and Lysosomal Degradation. Heart Lung Circ. 2005, 14, 107–114. [Google Scholar] [CrossRef] [PubMed]
- Saadeh, K.; Fazmin, I.T. Mitochondrial Dysfunction Increases Arrhythmic Triggers and Substrates; Potential Anti-arrhythmic Pharmacological Targets. Front. Cardiovasc. Med. 2021, 8, 646932. [Google Scholar] [CrossRef] [PubMed]
- Balsam, P.; Lodziński, P.; Tymińska, A.; Ozierański, K.; Januszkiewicz, Ł.; Główczyńska, R.; Wesołowska, K.; Peller, M.; Pietrzak, R.; Książczyk, T.; et al. Study design and rationale for biomedical shirt-based electrocardiography monitoring in relevant clinical situations: ECG-shirt study. Cardiol. J. 2018, 25, 52–59. [Google Scholar] [CrossRef] [Green Version]
- Desai, C.S.; Ning, H.; Soliman, E.Z.; Burke, G.L.; Shea, S.; Nazarian, S.; Lloyd-Jones, D.M.; Greenland, P. Electrocardiographic abnormalities and coronary artery calcium for coronary heart disease prediction and reclassification: The Multi-Ethnic Study of Atherosclerosis (MESA). Am. Heart J. 2014, 168, 391–397. [Google Scholar] [CrossRef] [PubMed]
- Pei, D.; Burns, M.; Chandramouli, R.; Vinjamuri, R. Neural Decoding of Upper Limb Movements Using Electroencephalography; Springer: Cham, Switzerland, 2020. [Google Scholar]
- Bin Heyat, B.; Hasan, Y.M.; Siddiqui, M.M. EEG signals and wireless transfer of EEG Signals. Int. J. Adv. Res. Comput. Commun. Eng. 2015, 4, 10–12. [Google Scholar] [CrossRef]
- Pal, R.; Bin Heyat, M.B.; You, Z.; Pardhan, B.; Akhtar, F.; Jafar Abbas, S.; Guragai, B.; Acharya, K. Effect of Maha Mrityunjaya HYMN Recitation on Human Brain for the Analysis of Single EEG Channel C4-A1 Using Machine Learning Classifiers on Yoga Practitioner. In Proceedings of the 2020 17th International Computer Conference on Wavelet Active Media Technology and Information Processing (ICCWAMTIP), Chengdu, China, 18–21 December 2020; IEEE: Piscataway, NJ, USA, 2020; pp. 89–92. [Google Scholar]
- Fifer, M.S.; Milsap, G.W.; Greenwald, E.; McMullen, D.P.; Anderson, W.S.; Thakor, N.V.; Crone, N.E.; Vinjamuri, R. Design and implementation of a human ECoG simulator for testing brain-machine interfaces. In Proceedings of the 2013 6th International IEEE/EMBS Conference on Neural Engineering (NER), San Diego, CA, USA, 6–8 November 2013. [Google Scholar]
- Lai, D.; Zhang, Y.; Zhang, X.; Su, Y.; Bin Heyat, M.B. An Automated Strategy for Early Risk Identification of Sudden Cardiac Death by Using Machine Learning Approach on Measurable Arrhythmic Risk Markers. IEEE Access 2019, 7, 94701–94716. [Google Scholar] [CrossRef]
- Zhang, W.; Wang, F.; Wu, S.; Xu, Z.; Ping, J.; Jiang, Y. Partial directed coherence based graph convolutional neural networks for driving fatigue detection. Rev. Sci. Instrum. 2020, 91, 074713. [Google Scholar] [CrossRef]
- Wu, E.Q.; Deng, P.Y.; Qu, X.Y.; Tang, Z.; Zhang, W.M.; Zhu, L.M.; Ren, H.; Zhou, G.R.; Sheng, R.S.F. Detecting Fatigue Status of Pilots Based on Deep Learning Network Using EEG Signals. IEEE Trans. Cogn. Dev. Syst. 2020, 13, 575–585. [Google Scholar] [CrossRef]
- Ahmadi, A.; Bazregarzadeh, H.; Kazemi, K. Automated detection of driver fatigue from electroencephalography through wavelet-based connectivity. Biocybern. Biomed. Eng. 2020, 41, 316–332. [Google Scholar] [CrossRef]
- Chen, C.; Li, K.; Wu, Q.; Wang, H.; Qian, Z.; Sudlow, G. EEG-based detection and evaluation of fatigue caused by watching 3DTV. Displays 2013, 34, 81–88. [Google Scholar] [CrossRef]
- Monteiro, T.G.; Li, G.; Skourup, C.; Zhang, H. Investigating an integrated sensor fusion system for mental fatigue assessment for demanding maritime operations. Sensors 2020, 20, 2588. [Google Scholar] [CrossRef] [PubMed]
- Zhang, Z.; Xu, F.; Yang, H.; Jiang, J.; Cao, Y.; Jiao, X. Mental fatigue detection based on the functional near infrared spectroscopy. In Proceedings of the International Conference on Optical and Photonics Engineering (icOPEN 2016), Chengdu, Sichuan, 26–30 September 2016. [Google Scholar]
- Pang, Y.Y.; Li, X.P.; Shen, K.Q.; Zheng, H.; Zhou, W.; Wilder-Smith, E.P.V. An auditory vigilance task for mental fatigue detection. In Proceedings of the 2005 IEEE Engineering in Medicine and Biology 27th Annual Conference, Shanghai, China, 31 August–3 September 2005. [Google Scholar]
- Chang, K.M.; Xu, H.C.; Ching, C.T.S.; Liu, S.H. Wireless Patrol Sign-In System with Mental Fatigue Detection. J. Healthc. Eng. 2018, 2018, 6419064. [Google Scholar] [CrossRef] [PubMed]
- Li, P.; Jiang, W.; Su, F. Single-channel EEG-based mental fatigue detection based on deep belief network. In Proceedings of the 2016 38th Annual International Conference of the IEEE Engineering in Medicine and Biology Society (EMBC), Orlando, FL, USA, 16–20 August 2016. [Google Scholar]
- Laurent, F.; Valderrama, M.; Besserve, M.; Guillard, M.; Lachaux, J.P.; Martinerie, J.; Florence, G. Multimodal information improves the rapid detection of mental fatigue. Biomed. Signal Process. Control 2013, 8, 400–408. [Google Scholar] [CrossRef]
- Xiao, H.; Duan, Y.; Zhang, Z.; Li, M. Detection and estimation of mental fatigue in manual assembly process of complex products. Assem. Autom. 2017, 38, 239–247. [Google Scholar] [CrossRef]
- Le, N.Q.K.; Kha, Q.H.; Nguyen, V.H.; Chen, Y.-C.; Cheng, S.-J.; Chen, C.-Y. Machine Learning-Based Radiomics Signatures for EGFR and KRAS Mutations Prediction in Non-Small-Cell Lung Cancer. Int. J. Mol. Sci. 2021, 22, 9254. [Google Scholar] [CrossRef]
- Ahamed, M.; Akhtar, M.J.; Khan, M.A.M.; Alhadlaq, H.A. A Novel Green Preparation of Ag/RGO Nanocomposites with Highly Effective Anticancer Performance. Polymers 2021, 13, 3350. [Google Scholar] [CrossRef]
- Ahamed, M.; Akhtar, M.J.; Khan, M.A.M.; Alaizeri, Z.M.; Alhadlaq, H. Facile Synthesis of Zn-Doped Bi2O3 Nanoparticles and Their Selective Cytotoxicity toward Cancer Cells. ACS Omega 2021, 6, 17353–17361. [Google Scholar] [CrossRef]
- Teelhawod, B.N.; Akhtar, F.; Bin Heyat, M.B.; Tripathi, P.; Mehrotra, R.; Asfaw, A.B.; Al Shorman, O.; Masadeh, M. Machine Learning in E-health: A Comprehensive Survey of Anxiety. In Proceedings of the 2021 International Conference on Data Analytics for Business and Industry (ICDABI), Sakheer, Bahrain, 25–26 October 2021; IEEE: Piscataway, NJ, USA, 2021; pp. 167–172. [Google Scholar]
- AlShorman, O.; Masadeh, M.; Alzyoud, A.; Bin Heyat, M.B.; Akhtar, F. The Effects of Emotional Stress on Learning and Memory Cognitive Functions: An EEG Review Study in Education. In Proceedings of the 2020 Sixth International Conference on e-Learning (econf), Sakheer, Bahrain, 6–7 December 2020; IEEE: Piscataway, NJ, USA, 2020; pp. 177–182. [Google Scholar]
- Akhtar, F.; Bin Heyat, M.B.; Li, J.P.; Patel, P.K.; Rishipal; Guragai, B. Role of Machine Learning in Human Stress: A Review. In Proceedings of the 2020 17th International Computer Conference on Wavelet Active Media Technology and Information Processing (ICCWAMTIP), Chengdu, China, 17–19 December 2021; IEEE: Piscataway, NJ, USA, 2020; pp. 170–174. [Google Scholar]
- AlShorman, O.; Masadeh, M.; Bin Heyat, M.B.; Akhtar, F.; Almahasneh, H.; Ashraf, G.M.; Alexiou, A. Frontal lobe real-time EEG analysis using machine learning techniques for mental stress detection. J. Integr. Neurosci. 2022, 21, 20. [Google Scholar] [CrossRef]
- Guragai, B.; AlShorman, O.; Masadeh, M.; Heyat, M.B. Bin A Survey on Deep Learning Classification Algorithms for Motor Imagery. In Proceedings of the 2020 32nd International Conference on Microelectronics (ICM), Aqaba, Jordan, 14–17 December 2020; IEEE: Piscataway, NJ, USA, 2020; pp. 1–4. [Google Scholar]
- Bin Heyat, M.B.; Lai, D.; Khan, F.I.; Zhang, Y. Sleep Bruxism Detection Using Decision Tree Method by the Combination of C4-P4 and C4-A1 Channels of Scalp EEG. IEEE Access 2019, 7, 102542–102553. [Google Scholar] [CrossRef]
- Bin Heyat, M.B.; Lai, D.; Akhtar, F.; Ammar, M.; Hayat, B.; Azad, S.; Azad, S.; Azad, S. Bruxism Detection Using Single-Channel C4-A1 on Human Sleep S2 Stage Recording. In Intelligent Data Analysis: From Data Gathering to Data Comprehension; Gupta, D., Bhattacharyya, S., Khanna, A., Eds.; John Wiley & Sons: Hoboken, NJ, USA, 2020; pp. 347–367. [Google Scholar]
- Bin Heyat, M.B.; Akhtar, F.; Khan, M.H.; Ullah, N.; Gul, I.; Khan, H.; Lai, D. Detection, Treatment Planning, and Genetic Predisposition of Bruxism: A Systematic Mapping Process and Network Visualization Technique. CNS Neurol. Disord. Drug Targets 2021, 20, 755–775. [Google Scholar] [CrossRef]
- Bin Heyat, M.B.; Akhtar, F.; Ansari, M.A.; Khan, A.; Alkahtani, F.; Khan, H.; Lai, D. Progress in Detection of Insomnia Sleep Disorder: A Comprehensive Review. Curr. Drug Targets 2021, 22, 672–684. [Google Scholar] [CrossRef] [PubMed]
- Lai, D.; Bin Heyat, M.B.; Khan, F.I.; Zhang, Y. Prognosis of Sleep Bruxism Using Power Spectral Density Approach Applied on EEG Signal of both EMG1-EMG2 and ECG1-ECG2 Channels. IEEE Access 2019, 7, 82553–82562. [Google Scholar] [CrossRef]
- Bin Heyat, M.B.; Akhtar, F.; Khan, A.; Noor, A.; Benjdira, B.; Qamar, Y.; Abbas, S.J.; Lai, D. A Novel Hybrid Machine Learning Classification for the Detection of Bruxism Patients Using Physiological Signals. Appl. Sci. 2020, 10, 7410. [Google Scholar] [CrossRef]
- Bin Heyat, M.B.; Lai, D.; Akhtar, F.; Bin Hayat, M.A.; Azad, S. Short Time Frequency Analysis of Theta Activity for the Diagnosis of Bruxism on EEG Sleep Record. In Advanced Computational Intelligence Techniques for Virtual Reality in Healthcare. Studies in Computational Intelligence; Gupta, D., Hassanien, A.K., Eds.; Springer: Berlin/Heidelberg, Germany, 2020; pp. 63–83. [Google Scholar]
- Bin Heyat, B.; Akhtar, F.; Singh, S.K.; Siddiqui, M.M. Hamming Window are used in the Prognostic of Insomnia. In Proceedings of the International Seminar on Present Scenario & Future Prospectives of Research in Engineering & Sciences (ISPSFPRES-17), Lucknow, Uttar Pradesh, India, 21 January 2017; pp. 65–71. [Google Scholar]
- Bin Heyat, M.B.; Akhtar, F.; Bin Hayat, M.A.; Azad, S. Power Spectral Density are used in the Investigation of insomnia neurological disorder. In Proceedings of the XL-Pre Congress Symposium, Lucknow, Uttar Pradesh, India, 15–18 August 2016; pp. 45–50. [Google Scholar]
- MBB, H.; Akhtar, F.; Mehdi, A.; Azad, S.; Azad, S.; Azad, S. Normalized Power are used in the Diagnosis of Insomnia Medical Sleep Syndrome through EMG1-EMG2 Channel. Austin J. Sleep Disord. 2017, 4, 2–4. [Google Scholar]
- Bin Heyat, M.B. Insomnia: Medical Sleep Disorder & Diagnosis, 1st ed.; Anchor Academic Publishing: Hamburg, Germany, 2016. [Google Scholar]
- Mishra, T.; Wang, M.; Metwally, A.A.; Bogu, G.K.; Brooks, A.W.; Bahmani, A.; Alavi, A.; Celli, A.; Higgs, E.; Dagan-Rosenfeld, O.; et al. Pre-symptomatic detection of COVID-19 from smartwatch data. Nat. Biomed. Eng. 2020, 4, 1208–1220. [Google Scholar] [CrossRef]
- Witt, D.R.; Kellogg, R.A.; Snyder, M.P.; Dunn, J. Windows into human health through wearables data analytics. Curr. Opin. Biomed. Eng. 2019, 9, 28–46. [Google Scholar] [CrossRef]
- Tipparaju, V.V.; Mallires, K.R.; Wang, D.; Tsow, F.; Xian, X. Mitigation of Data Packet Loss in Bluetooth Low Energy-Based Wearable Healthcare Ecosystem. Biosensors 2021, 11, 350. [Google Scholar] [CrossRef]
- Randell, C. Wearable Computing: A Review; University of Bristol: Bristol, UK, 2005; Available online: https://research-information.bris.ac.uk/en/publications/wearable-computing-a-review (accessed on 20 November 2021).
- Chan, M.; Estève, D.; Fourniols, J.Y.; Escriba, C.; Campo, E. Smart wearable systems: Current status and future challenges. Artif. Intell. Med. 2012, 56, 137–156. [Google Scholar] [CrossRef]
- Bu, Y.; Hassan, M.F.U.; Lai, D. The Embedding of Flexible Conductive Silver-Coated Electrodes into ECG Monitoring Garment for Minimizing Motion Artefacts. IEEE Sens. J. 2020, 21, 14454–14465. [Google Scholar] [CrossRef]
- Ul Hassan, M.F.; Lai, D.; Bu, Y. Characterization of single lead continuous ECG recording with various dry electrodes. In Proceedings of the 2019 3rd International Conference on Computational Biology and Bioinformatics, Nagoya, Japan, 17–19 October 2019. [Google Scholar]
- Chalder, T.; Berelowitz, G.; Pawlikowska, T.; Watts, L.; Wessely, S.; Wright, D.; Wallace, E.P. Development of a fatigue scale. J. Psychosom. Res. 1993, 37, 147–153. [Google Scholar] [CrossRef] [Green Version]
- Al-Shair, K.; Kolsum, U.; Berry, P.; Smith, J.; Caress, A.; Singh, D.; Vestbo, J. Development, dimensions, reliability and validity of the novel Manchester COPD fatigue scale. Thorax 2009, 64, 950–955. [Google Scholar] [CrossRef] [PubMed] [Green Version]
- McCarthy, L.; Fuller, J.; Davidson, G.; Crump, A.; Positano, S.; Alderman, C. Assessment of yoga as an adjuvant treatment for combat-related posttraumatic stress disorder. Australas. Psychiatry 2017, 25, 354–357. [Google Scholar] [CrossRef] [PubMed]
- Chin, E.G.; Buchanan, E.M.; Ebesutani, C.; Young, J. Depression, Anxiety, and Stress: How Should Clinicians Interpret the Total and Subscale Scores of the 21-Item Depression, Anxiety, and Stress Scales? Psychol. Rep. 2019, 122, 1550–1575. [Google Scholar] [CrossRef] [PubMed]
- Marx, P. How useful are the cold pressor test and sustained isometric handgrip exercise with radionuclide ventriculography in the evaluation of patients with coronary artery disease? Heart 1987, 58, 678–679. [Google Scholar] [CrossRef] [PubMed] [Green Version]
- Wirch, J.L.; Wolfe, L.A.; Weissgerber, T.L.; Davies, G.A.L. Cold presser test protocol to evaluate cardiac autonomic function. Appl. Physiol. Nutr. Metab. 2006, 31, 235–243. [Google Scholar] [CrossRef] [PubMed]
- Wirch, J.L.; Wolfe, L.A.; Weissgerber, T.L.; Davies, G.A.L. Development of a Cold Pressor Test Protocol to Evaluate Cardiac Autonomic Function. Med. Sci. Sport. Exerc. 2005, 37, S232. [Google Scholar] [CrossRef]
- Silverthorn, D.U.; Michael, J. Cold stress and the cold pressor test. Am. J. Physiol. Adv. Physiol. Educ. 2013, 37, 93–96. [Google Scholar] [CrossRef]
- Schwabe, L.; Haddad, L.; Schachinger, H. HPA axis activation by a socially evaluated cold-pressor test. Psychoneuroendocrinology 2008, 33, 890–895. [Google Scholar] [CrossRef]
- Al-shargie, F.M.; Tang, T.B.; Badruddin, N.; Kiguchi, M. Mental Stress Quantification Using EEG Signals. In Proceedings of the International Conference for Innovation in Biomedical Engineering and Life Sciences, Putrajaya, Malaysia, 6–8 December 2015; pp. 15–19. [Google Scholar]
- Folle, A.M.; Kitano, E.S.; Lima, A.; Gil, M.; Cucher, M.; Mourglia-Ettlin, G.; Iwai, L.K.; Rosenzvit, M.; Batthyány, C.; Ferreira, A.M. The Montreal Imaging Stress Task: Using functional imaging to investigate the effects of perceiving and processing psychosocial stress in the human brain Katarina. PLoS Negl. Trop. Dis. 2017. [Google Scholar]
- Mulder, L.J.M. Measurement and analysis methods of heart rate and respiration for use in applied environments. Biol. Psychol. 1992, 34, 205–236. [Google Scholar] [CrossRef]
- Schwerdtfeger, A.R.; Schwarz, G.; Pfurtscheller, K.; Thayer, J.F.; Jarczok, M.N.; Pfurtscheller, G. Heart rate variability (HRV): From brain death to resonance breathing at 6 breaths per minute. Clin. Neurophysiol. 2019, 131, 676–693. [Google Scholar] [CrossRef] [PubMed]
- Thayer, J.F.; Åhs, F.; Fredrikson, M.; Sollers, J.J.; Wager, T.D. A meta-analysis of heart rate variability and neuroimaging studies: Implications for heart rate variability as a marker of stress and health. Neurosci. Biobehav. Rev. 2012, 36, 747–756. [Google Scholar] [CrossRef] [PubMed]
- Momeny, M.; Jahanbakhshi, A.; Jafarnezhad, K.; Zhang, Y.-D. Accurate classification of cherry fruit using deep CNN based on hybrid pooling approach. Postharvest Biol. Technol. 2020, 166, 111204. [Google Scholar] [CrossRef]
- Ahmed, F.S.; Ali, L.; Joseph, B.A.; Ikram, A.; Ul Mustafa, R.; Bukhari, S.A.C. A statistically rigorous deep neural network approach to predict mortality in trauma patients admitted to the intensive care unit. J. Trauma Acute Care Surg. 2020, 89, 736–742. [Google Scholar] [CrossRef] [PubMed]
- Ali, L.; He, Z.; Cao, W.; Rauf, H.T.; Imrana, Y.; Bin Heyat, M.B. MMDD-Ensemble: A Multimodal Data-Driven Ensemble Approach for Parkinson’s Disease Detection. Front. Neurosci. 2021, 15, 1–11. [Google Scholar] [CrossRef]
- Ho, T.K. The random subspace method for constructing decision forests. IEEE Trans. Pattern Anal. Mach. Intell. 1998, 20, 832–844. [Google Scholar] [CrossRef] [Green Version]
- Ho, T.K. A data complexity analysis of comparative advantages of decision forest constructors. Pattern Anal. Appl. 2002, 5, 102–112. [Google Scholar] [CrossRef]
- Yan, X.; Su, X. Linear Regression Analysis: Theory and Computing; World Scientific: Singapore, 2009; ISBN 9789812834119. [Google Scholar]
- Ukwuoma, C.C.; Zhiguang, Q.; Heyat, M.B.B.; Ali, L.; Almaspoor, Z.; Monday, H.N. Recent Advancements in Fruit Detection and Classification Using Deep Learning Techniques. Math. Probl. Eng. 2022, 2022, 9210947. [Google Scholar] [CrossRef]
- Nawabi, A.K.; Jinfang, S.; Abbasi, R.; Iqbal, M.S.; Bin Heyat, M.B.; Akhtar, F.; Wu, K.; Twumasi, B.A. Segmentation of Drug-Treated Cell Image and Mitochondrial-Oxidative Stress Using Deep Convolutional Neural Network. Oxid. Med. Cell. Longev. 2022, 2022, 5641727. [Google Scholar] [CrossRef]
- Vest, A.N.; Da Poian, G.; Li, Q.; Liu, C.; Nemati, S.; Shah, A.J.; Clifford, G.D. An open source benchmarked toolbox for cardiovascular waveform and interval analysis. Physiol. Meas. 2018, 39, 105004. [Google Scholar] [CrossRef]
- Zulfiqar, H.; Yuan, S.S.; Huang, Q.L.; Sun, Z.J.; Dao, F.Y.; Yu, X.L.; Lin, H. Identification of cyclin protein using gradient boost decision tree algorithm. Comput. Struct. Biotechnol. J. 2021, 19, 4123–4131. [Google Scholar] [CrossRef] [PubMed]
- Zulfiqar, H.; Sun, Z.-J.; Huang, Q.-L.; Yuan, S.-S.; Lv, H.; Dao, F.-Y.; Lin, H.; Li, Y.-W. Deep-4mCW2V: A sequence-based predictor to identify N4-methylcytosine sites in Escherichia coli. Methods 2021, 203, 558–563. [Google Scholar] [CrossRef] [PubMed]
- Zulfiqar, H.; Khan, R.S.; Hassan, F.; Hippe, K.; Hunt, C.; Ding, H.; Song, X.M.; Cao, R. Computational identification of N4-methylcytosine sites in the mouse genome with machine-learning method. Math. Biosci. Eng. 2021, 18, 3348–3363. [Google Scholar] [CrossRef] [PubMed]
- Zulfiqar, H.; Huang, Q.-L.; Lv, H.; Sun, Z.-J.; Dao, F.-Y.; Lin, H. Deep-4mCGP: A Deep Learning Approach to Predict 4mC Sites in Geobacter pickeringii by Using Correlation-Based Feature Selection Technique. Int. J. Mol. Sci. 2022, 23, 1251. [Google Scholar] [CrossRef] [PubMed]
- Zulfiqar, H.; Ahmed, Z.; Ma, C.-Y.; Khan, R.S.; Grace-Mercure, B.K.; Yu, X.-L.; Zhang, Z.-Y. Comprehensive Prediction of Lipocalin Proteins Using Artificial Intelligence Strategy. Front. Biosci. 2022, 27, 84. [Google Scholar] [CrossRef]
- Du, Y.T.; Pasupathy, S.; Neil, C.; Beltrame, J.F. A comparison of ECG scores for area at risk. Heart 2012, 98, 1257–1258. [Google Scholar] [CrossRef]
- Bin Heyat, M.; Siddiqui, M.M. Recording of EEG, ECG, EMG Signal. Int. J. Adv. Res. Comput. Sci. Softw. Eng. 2015, 5, 813–815. [Google Scholar]
- Lai, D.; Zhang, X.; Zhang, Y.; Bin Heyat, M.B. Convolutional Neural Network Based Detection of Atrial Fibrillation Combing R-R intervals and F-wave Frequency Spectrum. In Proceedings of the 2019 41st Annual International Conference of the IEEE Engineering in Medicine and Biology Society (EMBC), Berlin, Germany, 23–27 July 2019; IEEE: Piscataway, NJ, USA, 2019; pp. 4897–4900. [Google Scholar]
- Schouten, E.G.; Dekker, J.M.; Meppelink, P.; Kok, F.J.; Vandenbroucke, J.P.; Pool, J. QT interval prolongation predicts cardiovascular mortality in an apparently healthy population. Circulation 1991, 84, 1516–1523. [Google Scholar] [CrossRef] [Green Version]
- Salles, G.F.; Bloch, K.V.; Cardoso, C.R.L. Mortality and Predictors of Mortality in a Cohort of Brazilian Type 2 Diabetic Patients. Diabetes Care 2004, 27, 1299–1305. [Google Scholar] [CrossRef] [Green Version]
- Okin, P.M.; Devereux, R.B.; Lee, E.T.; Galloway, J.M.; Howard, B.V. Electrocardiographic Repolarization Complexity and Abnormality Predict All-Cause and Cardiovascular Mortality in Diabetes. Diabetes 2004, 53, 434–440. [Google Scholar] [CrossRef] [Green Version]
- Youdim, K.A.; Shukitt-Hale, B.; MacKinnon, S.; Kalt, W.; Joseph, J.A. Polyphenolics enhance red blood cell resistance to oxidative stress: In vitro and in vivo 1 Mention of trade name, proprietary product, or specific equipment does not constitute a guarantee by the US Department of Agriculture and does not imply its approval. Biochim. Biophys. Acta Gen. Subj. 2000, 1523, 117–122. [Google Scholar] [CrossRef]
- Stehbens, W.E. Coronary heart disease, hypercholesterolemia, and atherosclerosis I. False premises. Exp. Mol. Pathol. 2001, 70, 103–119. [Google Scholar] [CrossRef] [PubMed]
- Dubois-Deruy, E.; Peugnet, V.; Turkieh, A.; Pinet, F. Oxidative Stress in Cardiovascular Diseases. Antioxidants 2020, 9, 864. [Google Scholar] [CrossRef] [PubMed]
- Puterman, E.; Epel, E. An Intricate Dance: Life Experience, Multisystem Resiliency, and Rate of Telomere Decline throughout the Lifespan. Soc. Personal. Psychol. Compass 2012, 6, 807–825. [Google Scholar] [CrossRef] [Green Version]
- Tuppen, H.A.L.; Blakely, E.L.; Turnbull, D.M.; Taylor, R.W. Mitochondrial DNA mutations and human disease. Biochim. Biophys. Acta Bioenerg. 2010, 1797, 113–128. [Google Scholar] [CrossRef] [Green Version]
- Schwartz, B.G.; French, W.J.; Mayeda, G.S.; Burstein, S.; Economides, C.; Bhandari, A.K.; Cannom, D.S.; Kloner, R.A. Emotional stressors trigger cardiovascular events. Int. J. Clin. Pract. 2012, 66, 631–639. [Google Scholar] [CrossRef]
- Yusuf, S.; Hawken, S.; Ôunpuu, S.; Dans, T.; Avezum, A.; Lanas, F.; McQueen, M.; Budaj, A.; Pais, P.; Varigos, J.; et al. Effect of potentially modifiable risk factors associated with myocardial infarction in 52 countries (the INTERHEART study): Case-control study. Lancet 2004, 364, 937–952. [Google Scholar] [CrossRef]
- De Vente, W.; Van Amsterdam, J.G.C.; Olff, M.; Kamphuis, J.H.; Emmelkamp, P.M.G. Burnout Is Associated with Reduced Parasympathetic Activity and Reduced HPA Axis Responsiveness, Predominantly in Males. Biomed. Res. Int. 2015, 2015, 431725. [Google Scholar] [CrossRef] [Green Version]
- Shen, M.J.; Zipes, D.P. Role of the autonomic nervous system in modulating cardiac arrhythmias. Circ. Res. 2014, 114, 1004–1021. [Google Scholar] [CrossRef] [Green Version]
- Zeviani, M.; Di Donato, S. Mitochondrial disorders. Brain 2004, 127, 2153–2172. [Google Scholar] [CrossRef]
- Li, G.; Li, B.; Wang, G.; Zhang, J.; Wang, J. A New Method for Human Mental Fatigue Detection with Several EEG Channels. J. Med. Biol. Eng. 2017, 37, 240–247. [Google Scholar] [CrossRef]
- Wang, F.; Wang, H.; Fu, R. Real-time ECG-based detection of fatigue driving using sample entropy. Entropy 2018, 20, 196. [Google Scholar] [CrossRef] [PubMed] [Green Version]
- Lamti, H.A.; Ben Khelifa, M.M.; Hugel, V. Mental fatigue level detection based on event related and visual evoked potentials features fusion in virtual indoor environment. Cogn. Neurodyn. 2019, 13, 271–285. [Google Scholar] [CrossRef] [PubMed]
- Huang, S.; Li, J.; Zhang, P.; Zhang, W. Detection of mental fatigue state with wearable ECG devices. Int. J. Med. Inform. 2018, 119, 39–46. [Google Scholar] [CrossRef]
- Shon, D.; Im, K.; Park, J.H.; Lim, D.S.; Jang, B.; Kim, J.M. Emotional stress state detection using genetic algorithm-based feature selection on EEG signals. Int. J. Environ. Res. Public Health 2018, 15, 2461. [Google Scholar] [CrossRef] [Green Version]
- Hasan, M.J.; Kim, J.M. A hybrid feature pool-based emotional stress state detection algorithm using EEG signals. Brain Sci. 2019, 9, 376. [Google Scholar] [CrossRef] [Green Version]
- Bsoul, M.; Minn, H.; Nourani, M.; Gupta, G.; Tamil, L. Real-time sleep quality assessment using single-lead ECG and multi-stage SVM classifier. In Proceedings of the 2010 Annual International Conference of the IEEE Engineering in Medicine and Biology Society, EMBC, Buenos Aires, Argentina, 31 August–4 September 2010. [Google Scholar]
- Song, M.H.; Cho, S.P.; Kim, W.; Lee, K.J. New real-time heartbeat detection method using the angle of a single-lead electrocardiogram. Comput. Biol. Med. 2015, 59, 73–79. [Google Scholar] [CrossRef]
- Lai, D.; Zhang, Y.; Zhang, X. Single Lead ECG-based Ventricular Repolarization Classification for Early Identification of Unexpected Ventricular Fibrillation. In Proceedings of the 2020 42nd Annual International Conference of the IEEE Engineering in Medicine & Biology Society (EMBC), Montréal, QC, Canada, 20–24 July 2020. [Google Scholar]
- Cai, Z.; Li, J.; Johnson, A.E.W.; Zhang, X.; Shen, Q.; Zhang, J.; Liu, C. Rule-based rough-refined two-step-procedure for real-time premature beat detection in single-lead ECG. Physiol. Meas. 2020, 41, 054004. [Google Scholar] [CrossRef]
- Bozkurt, F.; Uçar, M.K.; Bozkurt, M.R.; Bilgin, C. Detection of Abnormal Respiratory Events with Single Channel ECG and Hybrid Machine Learning Model in Patients with Obstructive Sleep Apnea. IRBM 2020, 41, 241–251. [Google Scholar] [CrossRef]


| Total No. of the Subjects (N) | 20 |
|---|---|
| Occupation of the Subjects | Research (Ph.D. and Research Associate) |
| Conditions of the Subjects | Mental Stress and Normal |
| Gender of the Subjects | All are Male |
| The total duration of the recordings (T) | 1800 min |
| The total duration of the mental stress recordings (TMF) | 1200 min |
| The total duration of the normal recordings (TN) | 600 min |
| Model | Classifier | Recall | Specificity | Precision | Accuracy | F1 | AUC |
|---|---|---|---|---|---|---|---|
| Leave one out | DT | 0.933 | 0.967 | 0.944 | 0.933 | 0.935 | 0.990 |
| NB | 0.733 | 0.817 | 0.807 | 0.733 | 0.741 | 0.840 | |
| RF | 0.900 | 0.800 | 0.913 | 0.900 | 0.895 | 1.000 | |
| LR | 0.800 | 0.700 | 0.795 | 0.800 | 0.794 | 0.835 | |
| 10-fold | DT | 0.567 | 0.483 | 0.577 | 0.567 | 0.571 | 0.540 |
| NB | 0.533 | 0.467 | 0.556 | 0.533 | 0.542 | 0.570 | |
| RF | 0.633 | 0.467 | 0.607 | 0.633 | 0.614 | 0.530 | |
| LR | 0.700 | 0.550 | 0.683 | 0.700 | 0.684 | 0.630 | |
| 3-fold | DT | 0.467 | 0.483 | 0.533 | 0.467 | 0.481 | 0.530 |
| NB | 0.467 | 0.333 | 0.467 | 0.467 | 0.467 | 0.410 | |
| RF | 0.633 | 0.467 | 0.607 | 0.633 | 0.614 | 0.435 | |
| LR | 0.767 | 0.683 | 0.762 | 0.767 | 0.763 | 0.815 | |
| 2-fold | DT | 0.667 | 0.433 | 0.628 | 0.667 | 0.617 | 0.680 |
| NB | 0.500 | 0.550 | 0.579 | 0.500 | 0.512 | 0.633 | |
| RF | 0.633 | 0.667 | 0.689 | 0.633 | 0.644 | 0.692 | |
| LR | 0.700 | 0.700 | 0.729 | 0.700 | 0.707 | 0.700 | |
| Average | 0.664 | 0.597 | 0.679 | 0.664 | 0.661 | 0.676 | |
| ±Standard Deviation | 0.136 | 0.165 | 0.132 | 0.136 | 0.134 | 0.173 | |
| Model | Classifier | Recall | Specificity | Precision | Accuracy | F1 | AUC |
|---|---|---|---|---|---|---|---|
| Leave one out | DT | 0.933 | 0.967 | 0.944 | 0.933 | 0.935 | 0.990 |
| NB | 0.733 | 0.817 | 0.807 | 0.733 | 0.741 | 0.840 | |
| RF | 0.867 | 0.733 | 0.889 | 0.867 | 0.856 | 1.000 | |
| LR | 0.867 | 0.833 | 0.867 | 0.867 | 0.867 | 0.880 | |
| 10-fold | DT | 0.567 | 0.483 | 0.577 | 0.567 | 0.571 | 0.550 |
| NB | 0.467 | 0.433 | 0.512 | 0.467 | 0.481 | 0.495 | |
| RF | 0.633 | 0.467 | 0.607 | 0.633 | 0.614 | 0.573 | |
| LR | 0.733 | 0.617 | 0.723 | 0.733 | 0.725 | 0.685 | |
| 3-fold | DT | 0.500 | 0.400 | 0.512 | 0.500 | 0.505 | 0.438 |
| NB | 0.400 | 0.450 | 0.481 | 0.400 | 0.411 | 0.440 | |
| RF | 0.567 | 0.433 | 0.556 | 0.567 | 0.561 | 0.418 | |
| LR | 0.733 | 0.667 | 0.733 | 0.733 | 0.733 | 0.790 | |
| 2-fold | DT | 0.667 | 0.433 | 0.628 | 0.667 | 0.617 | 0.680 |
| NB | 0.500 | 0.600 | 0.608 | 0.500 | 0.505 | 0.537 | |
| RF | 0.633 | 0.617 | 0.664 | 0.633 | 0.642 | 0.737 | |
| LR | 0.700 | 0.700 | 0.729 | 0.700 | 0.707 | 0.730 | |
| Average | 0.656 | 0.603 | 0.677 | 0.656 | 0.654 | 0.673 | |
| ±Standard Deviation | 0.148 | 0.166 | 0.138 | 0.148 | 0.145 | 0.185 | |
| Subject | Recall | Specificity | Precision | Accuracy | F1 | AUC |
|---|---|---|---|---|---|---|
| Normal 1 | 0.966 | 0.984 | 0.969 | 0.966 | 0.966 | 0.997 |
| Normal 2 | 0.966 | 0.984 | 0.969 | 0.966 | 0.966 | 0.994 |
| Normal 3 | 0.931 | 0.969 | 0.944 | 0.931 | 0.933 | 0.989 |
| Normal 4 | 0.931 | 0.969 | 0.944 | 0.931 | 0.933 | 0.989 |
| Normal 5 | 0.931 | 0.969 | 0.944 | 0.931 | 0.933 | 0.989 |
| Normal 6 | 0.931 | 0.969 | 0.944 | 0.931 | 0.933 | 0.989 |
| Normal 7 | 0.931 | 0.969 | 0.944 | 0.931 | 0.933 | 0.989 |
| Normal 8 | 0.966 | 0.984 | 0.969 | 0.966 | 0.966 | 0.994 |
| Normal 9 | 0.931 | 0.969 | 0.944 | 0.931 | 0.933 | 0.989 |
| Normal 10 | 0.931 | 0.969 | 0.944 | 0.931 | 0.933 | 0.989 |
| Mental Stress 1 | 0.964 | 0.980 | 0.968 | 0.964 | 0.965 | 0.997 |
| Mental Stress 2 | 0.929 | 0.960 | 0.940 | 0.989 | 0.930 | 0.989 |
| Mental Stress 3 | 0.929 | 0.916 | 0.929 | 0.929 | 0.929 | 0.986 |
| Mental Stress 4 | 0.929 | 0.960 | 0.940 | 0.929 | 0.930 | 0.989 |
| Mental Stress 5 | 0.929 | 0.916 | 0.929 | 0.929 | 0.929 | 0.986 |
| Mental Stress 6 | 0.929 | 0.960 | 0.940 | 0.929 | 0.930 | 0.989 |
| Mental Stress 7 | 0.929 | 0.960 | 0.940 | 0.929 | 0.930 | 0.989 |
| Mental Stress 8 | 0.929 | 0.960 | 0.940 | 0.929 | 0.930 | 0.986 |
| Mental Stress 9 | 0.929 | 0.960 | 0.940 | 0.929 | 0.930 | 0.989 |
| Mental Stress 10 | 0.964 | 0.980 | 0.968 | 0.964 | 0.965 | 0.997 |
| Average | 0.938 | 0.964 | 0.947 | 0.941 | 0.939 | 0.990 |
| ±Standard Deviation | 0.015 | 0.018 | 0.012 | 0.018 | 0.014 | 0.003 |
| Reference | Year | Subject | Recording Device | Signal | Accuracy |
|---|---|---|---|---|---|
| Huang et al. [105] | 2018 | 35 | ADS1292R | ECG | 75.50 |
| Xiao et al. [31] | 2018 | 5 | Emotiv EPOC | EEG | 77.12 |
| Son et al. [106] | 2018 | 32 | AgCl Electrodes | EEG, EOG, EMG | 72.00 |
| Hasan et al. [107] | 2019 | EEG | 73.00 | ||
| Proposed (Intra-subject) | 20 | Smart T-Shirt | ECG | 93.30 | |
| Proposed (Inter-subject) | 94.10 | ||||
Publisher’s Note: MDPI stays neutral with regard to jurisdictional claims in published maps and institutional affiliations. |
© 2022 by the authors. Licensee MDPI, Basel, Switzerland. This article is an open access article distributed under the terms and conditions of the Creative Commons Attribution (CC BY) license (https://creativecommons.org/licenses/by/4.0/).
Share and Cite
Bin Heyat, M.B.; Akhtar, F.; Abbas, S.J.; Al-Sarem, M.; Alqarafi, A.; Stalin, A.; Abbasi, R.; Muaad, A.Y.; Lai, D.; Wu, K. Wearable Flexible Electronics Based Cardiac Electrode for Researcher Mental Stress Detection System Using Machine Learning Models on Single Lead Electrocardiogram Signal. Biosensors 2022, 12, 427. https://doi.org/10.3390/bios12060427
Bin Heyat MB, Akhtar F, Abbas SJ, Al-Sarem M, Alqarafi A, Stalin A, Abbasi R, Muaad AY, Lai D, Wu K. Wearable Flexible Electronics Based Cardiac Electrode for Researcher Mental Stress Detection System Using Machine Learning Models on Single Lead Electrocardiogram Signal. Biosensors. 2022; 12(6):427. https://doi.org/10.3390/bios12060427
Chicago/Turabian StyleBin Heyat, Md Belal, Faijan Akhtar, Syed Jafar Abbas, Mohammed Al-Sarem, Abdulrahman Alqarafi, Antony Stalin, Rashid Abbasi, Abdullah Y. Muaad, Dakun Lai, and Kaishun Wu. 2022. "Wearable Flexible Electronics Based Cardiac Electrode for Researcher Mental Stress Detection System Using Machine Learning Models on Single Lead Electrocardiogram Signal" Biosensors 12, no. 6: 427. https://doi.org/10.3390/bios12060427