Strongly Improving the Sensitivity of Phosphorescence-Based Optical Oxygen Sensors by Exploiting Nano-Porous Substrates

 ,
,
Abstract
:
1. Introduction
2. Experimental Procedure
2.1. Materials
2.2. Preparation of Optical Oxygen Sensor
2.3. Instrumentation
2.4. Theory
3. Results
3.1. Characterization of AAO Membrane
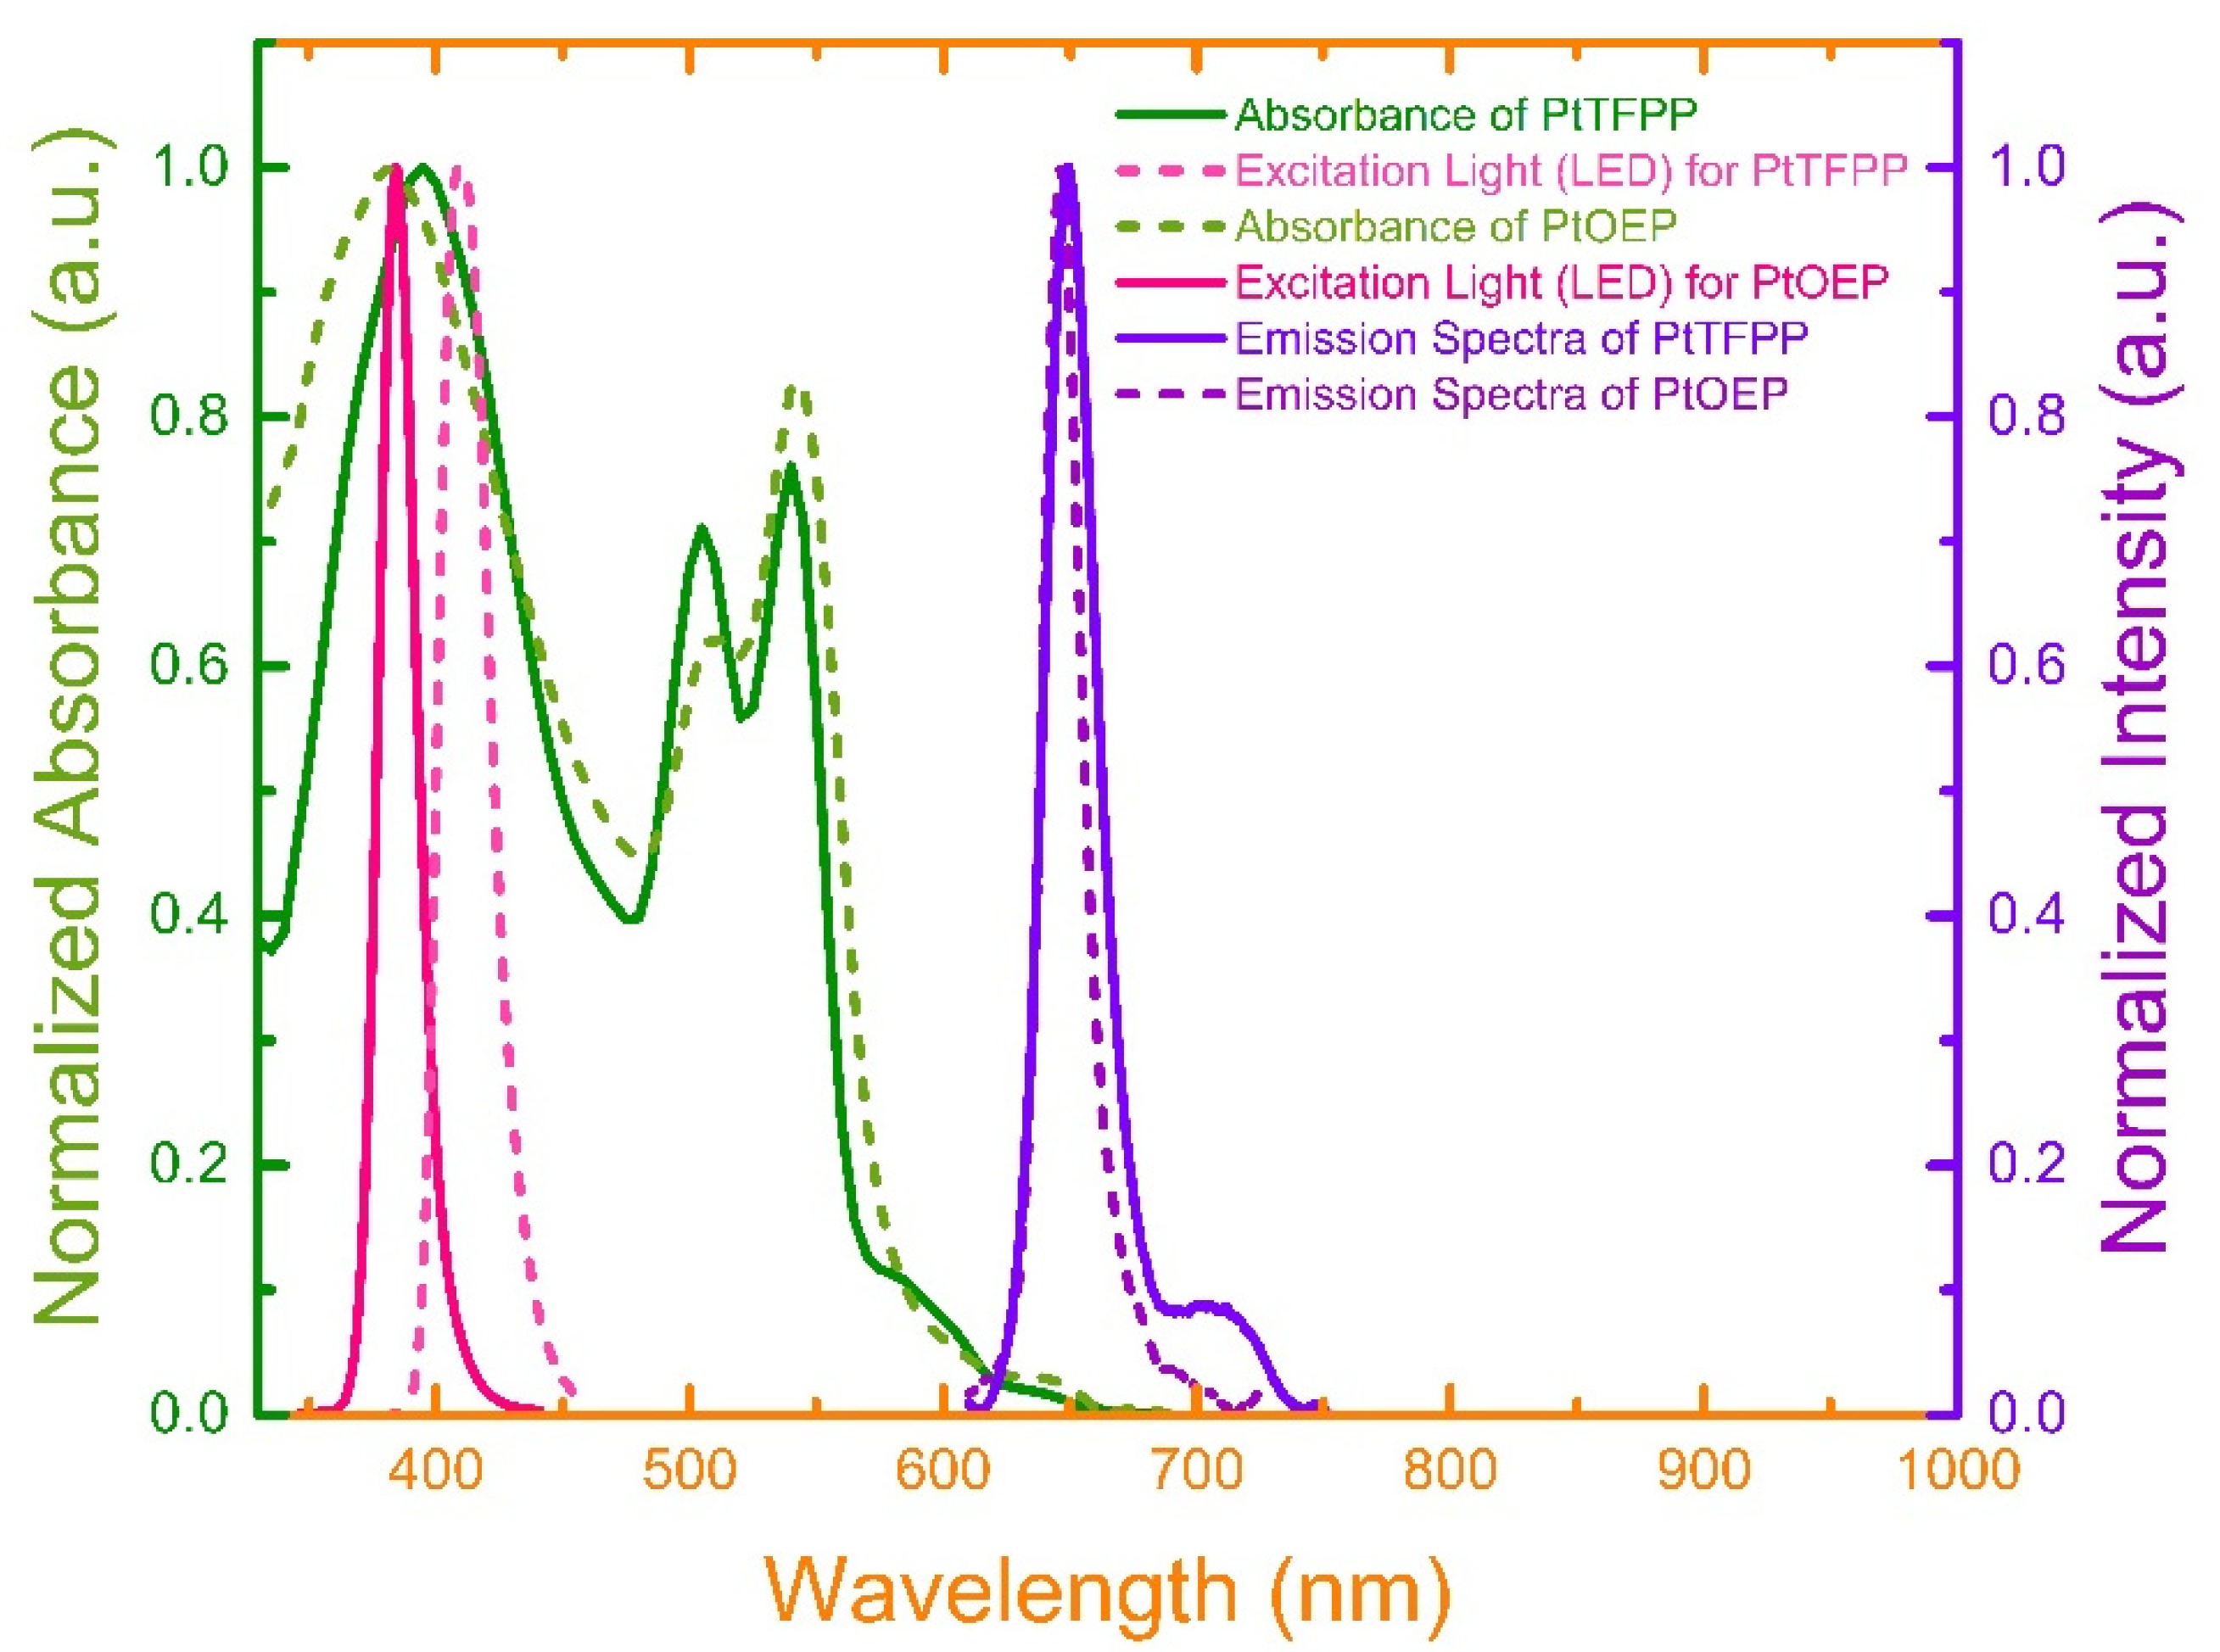
3.2. Optical Characterizations of the Sensing Material
3.3. Optical Characterizations of the Sensing Material
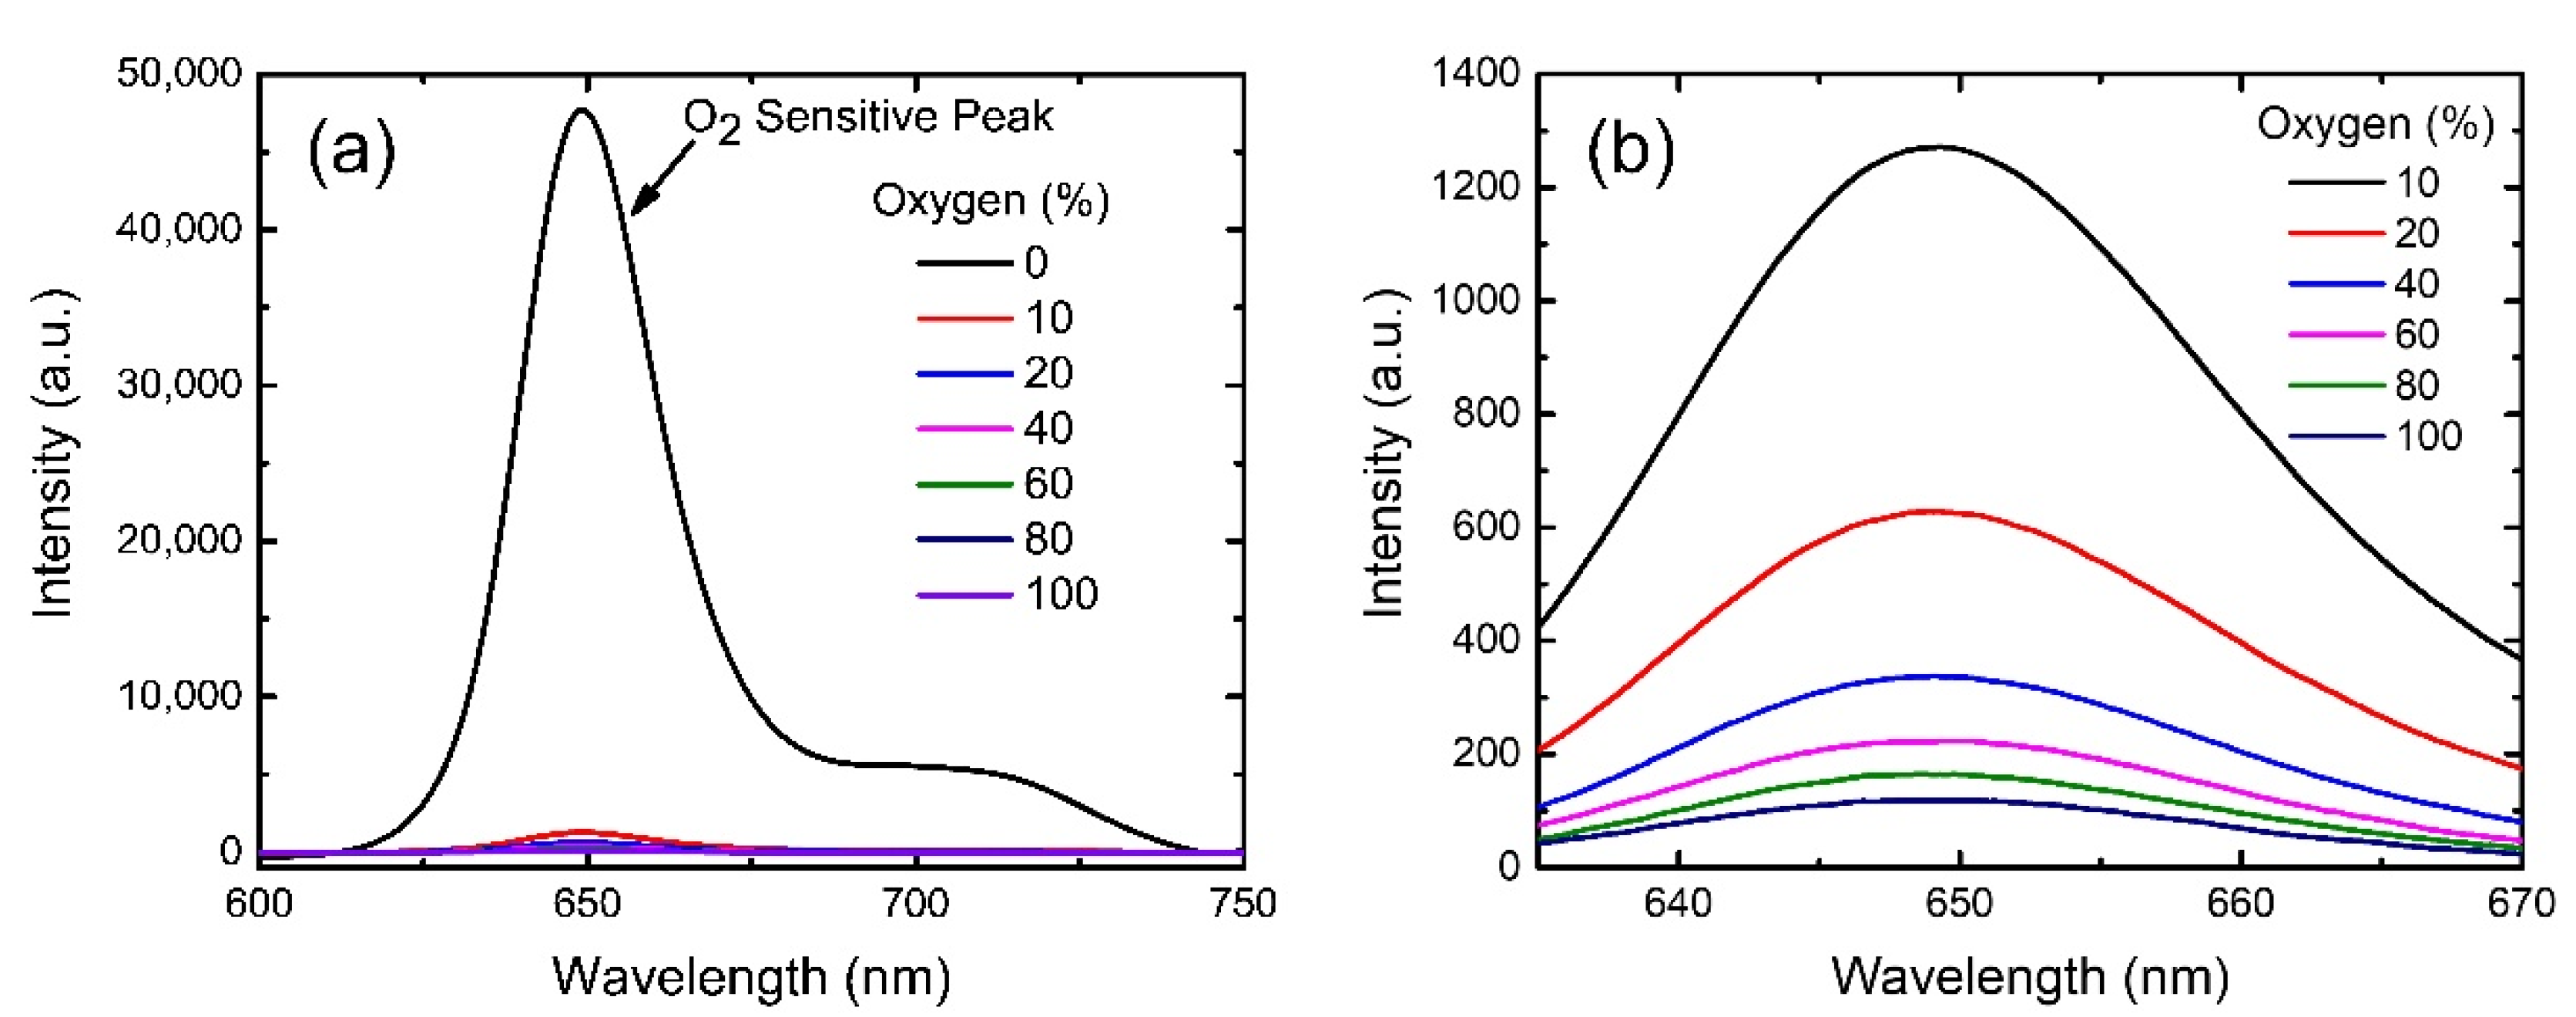
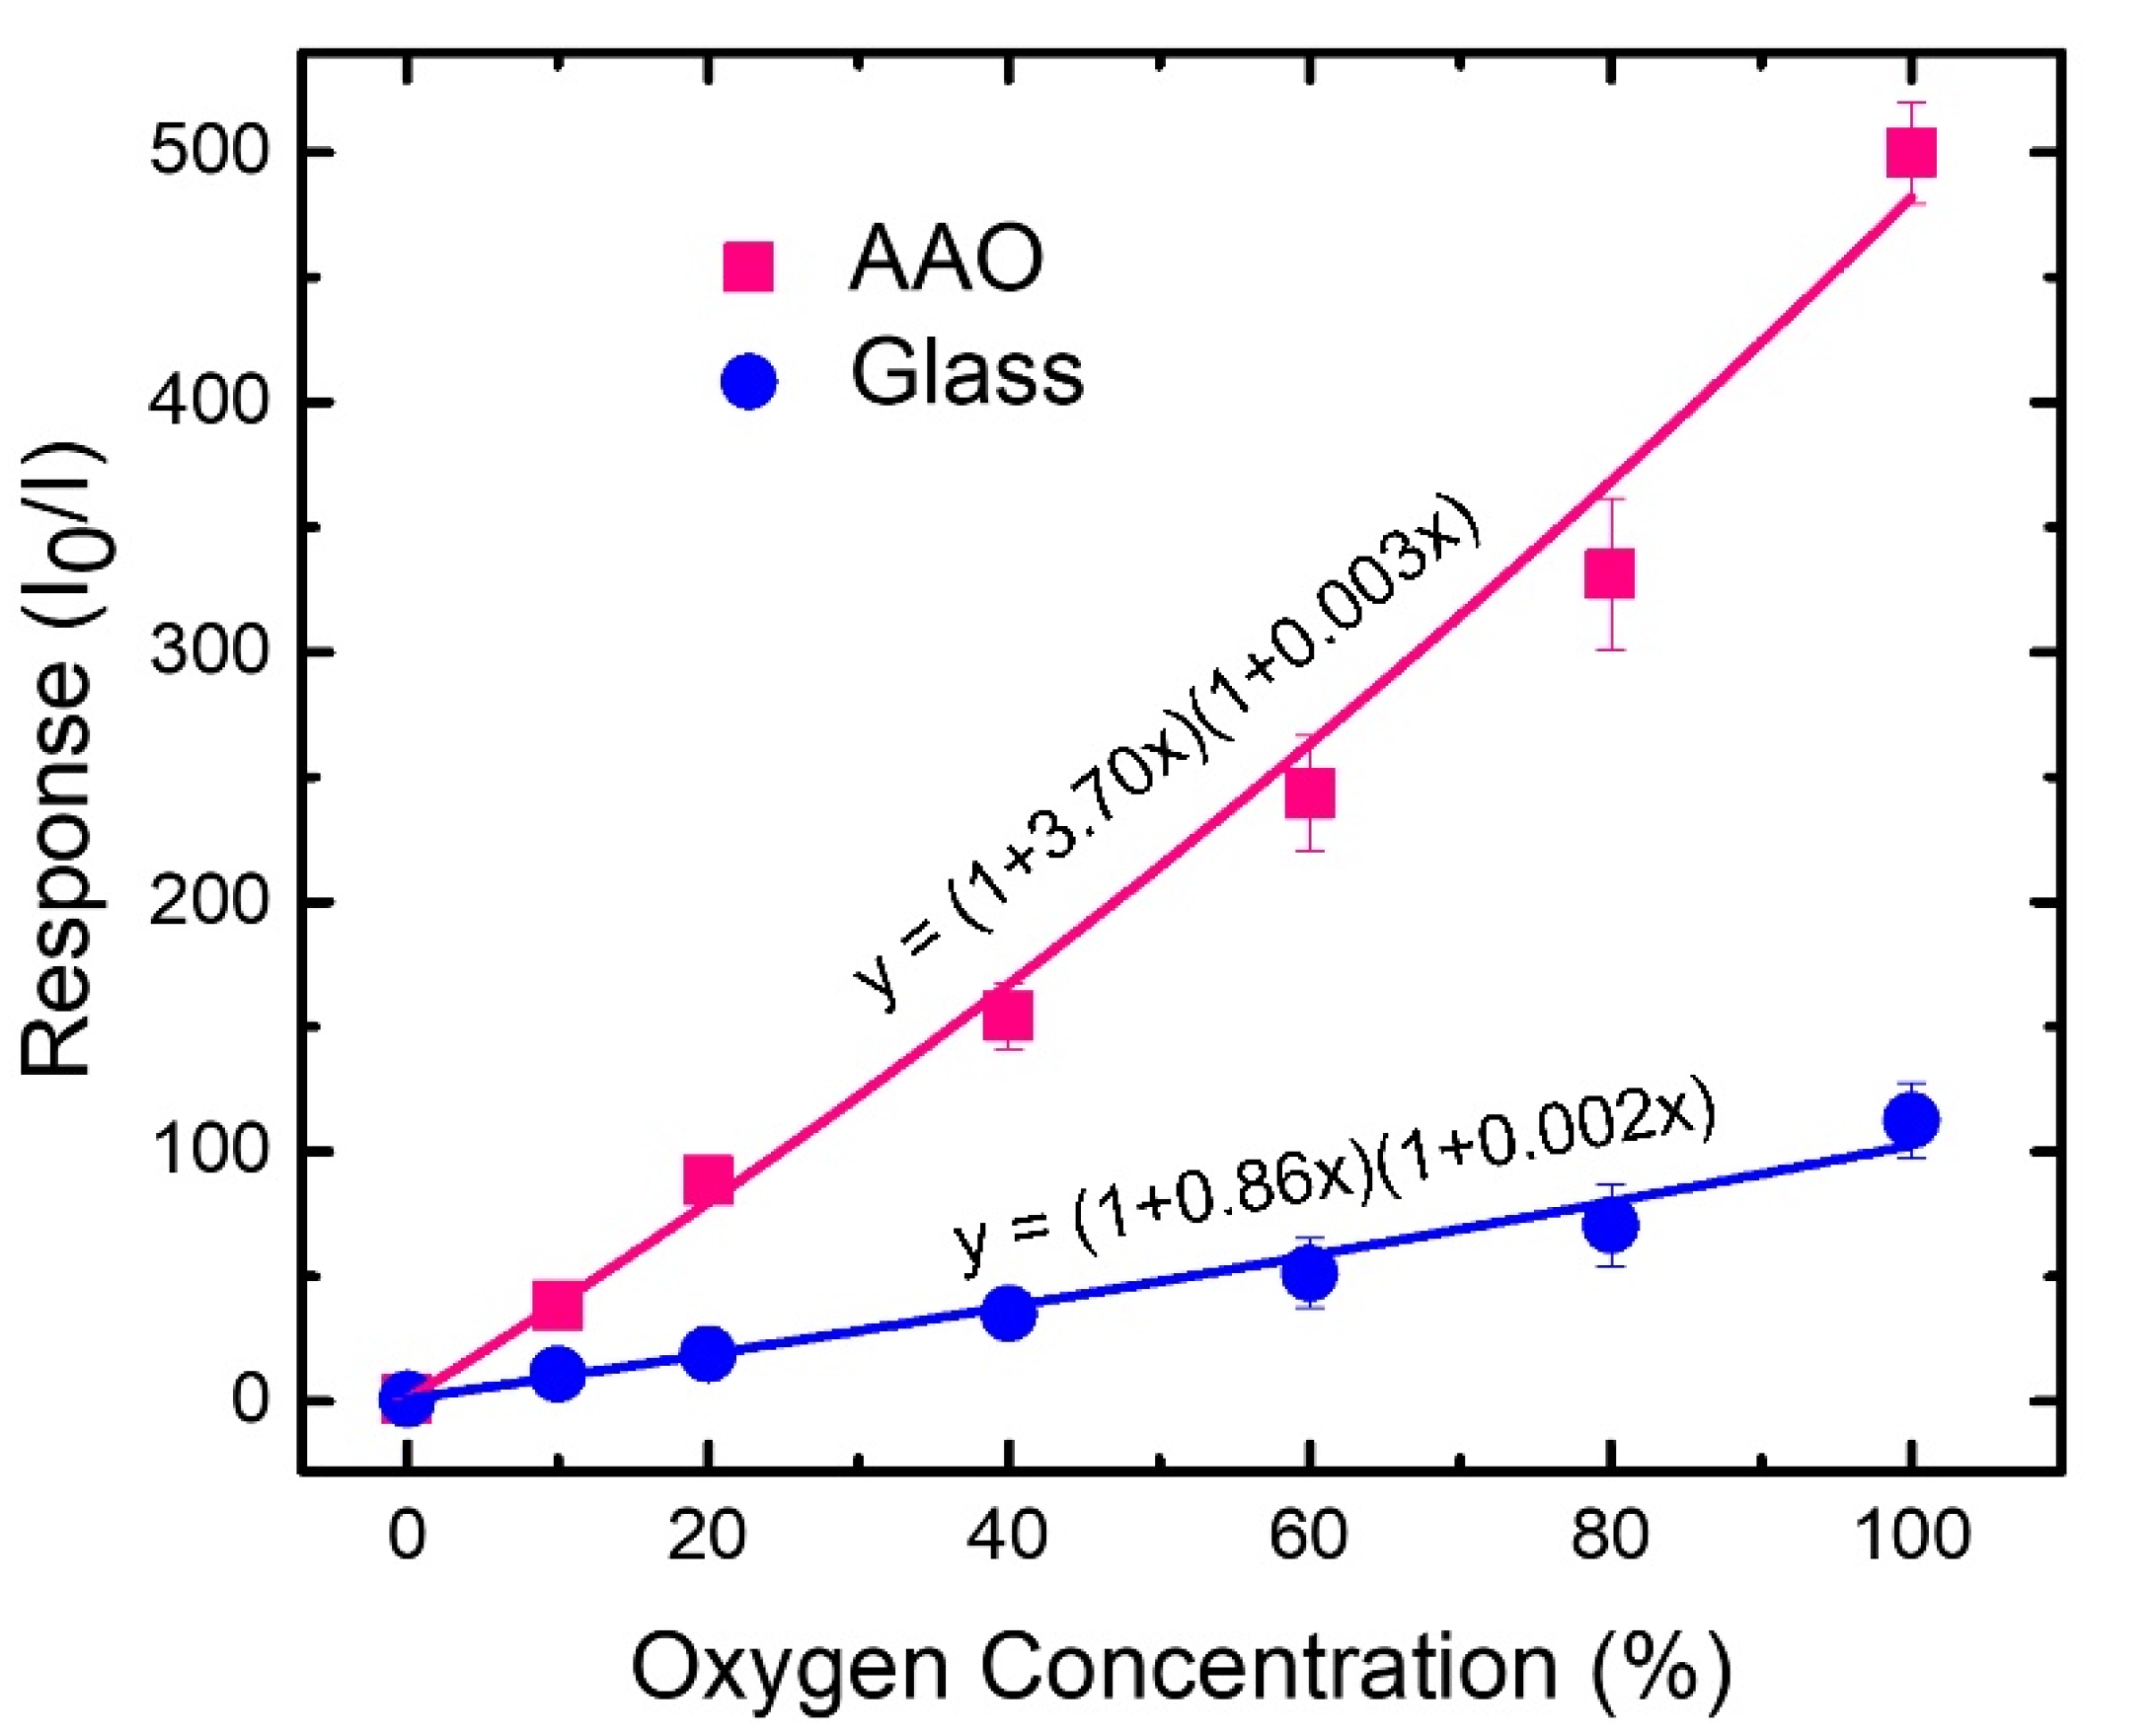
3.3.1. O2 Sensing Properties of PtTFPP Oxygen Sensor
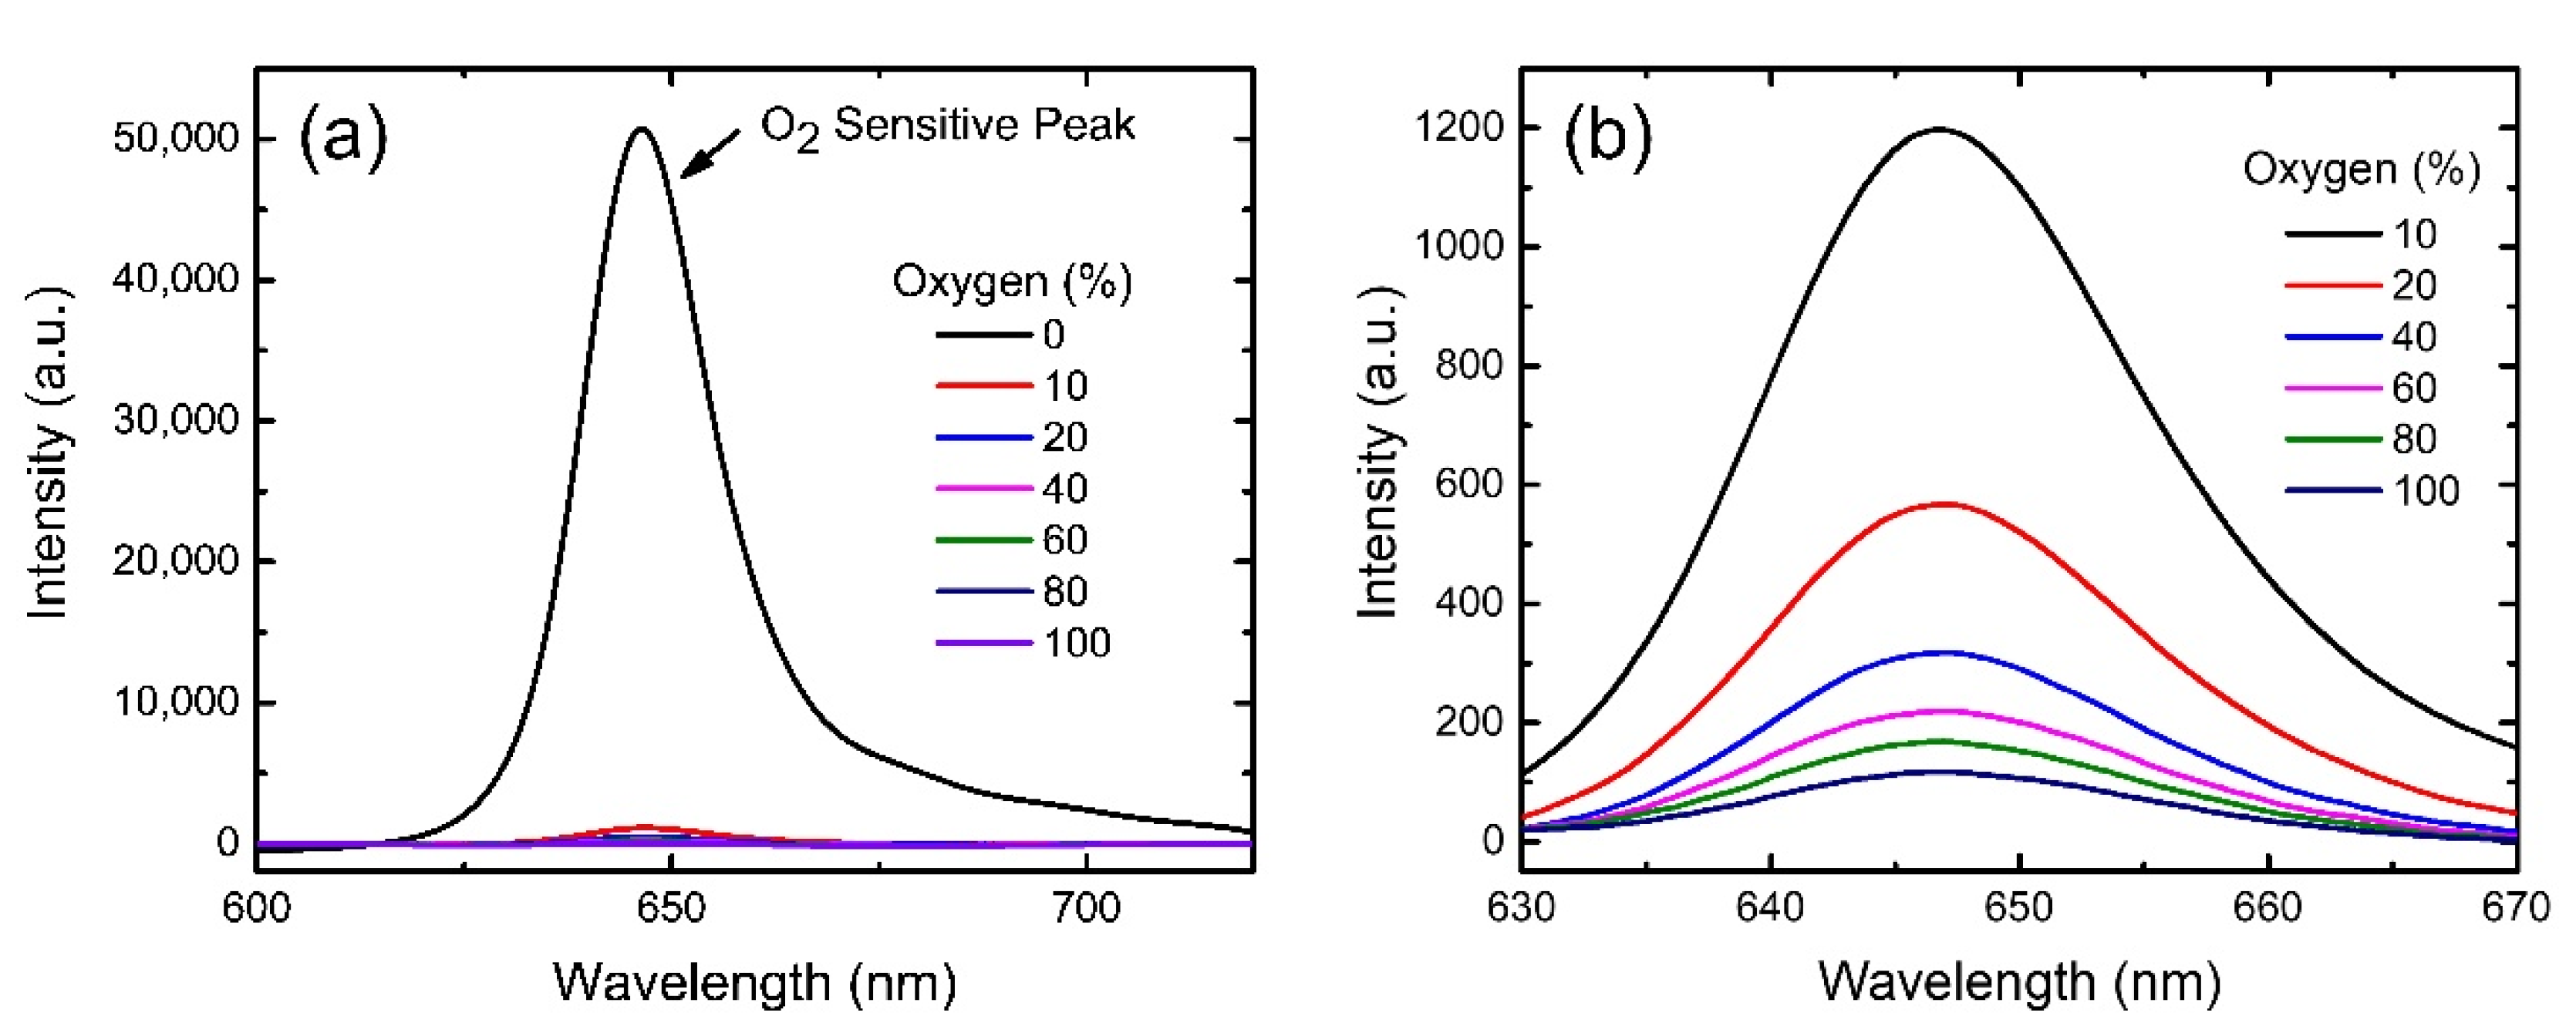
3.3.2. O2 Sensing Properties of PtOEP Oxygen Sensor
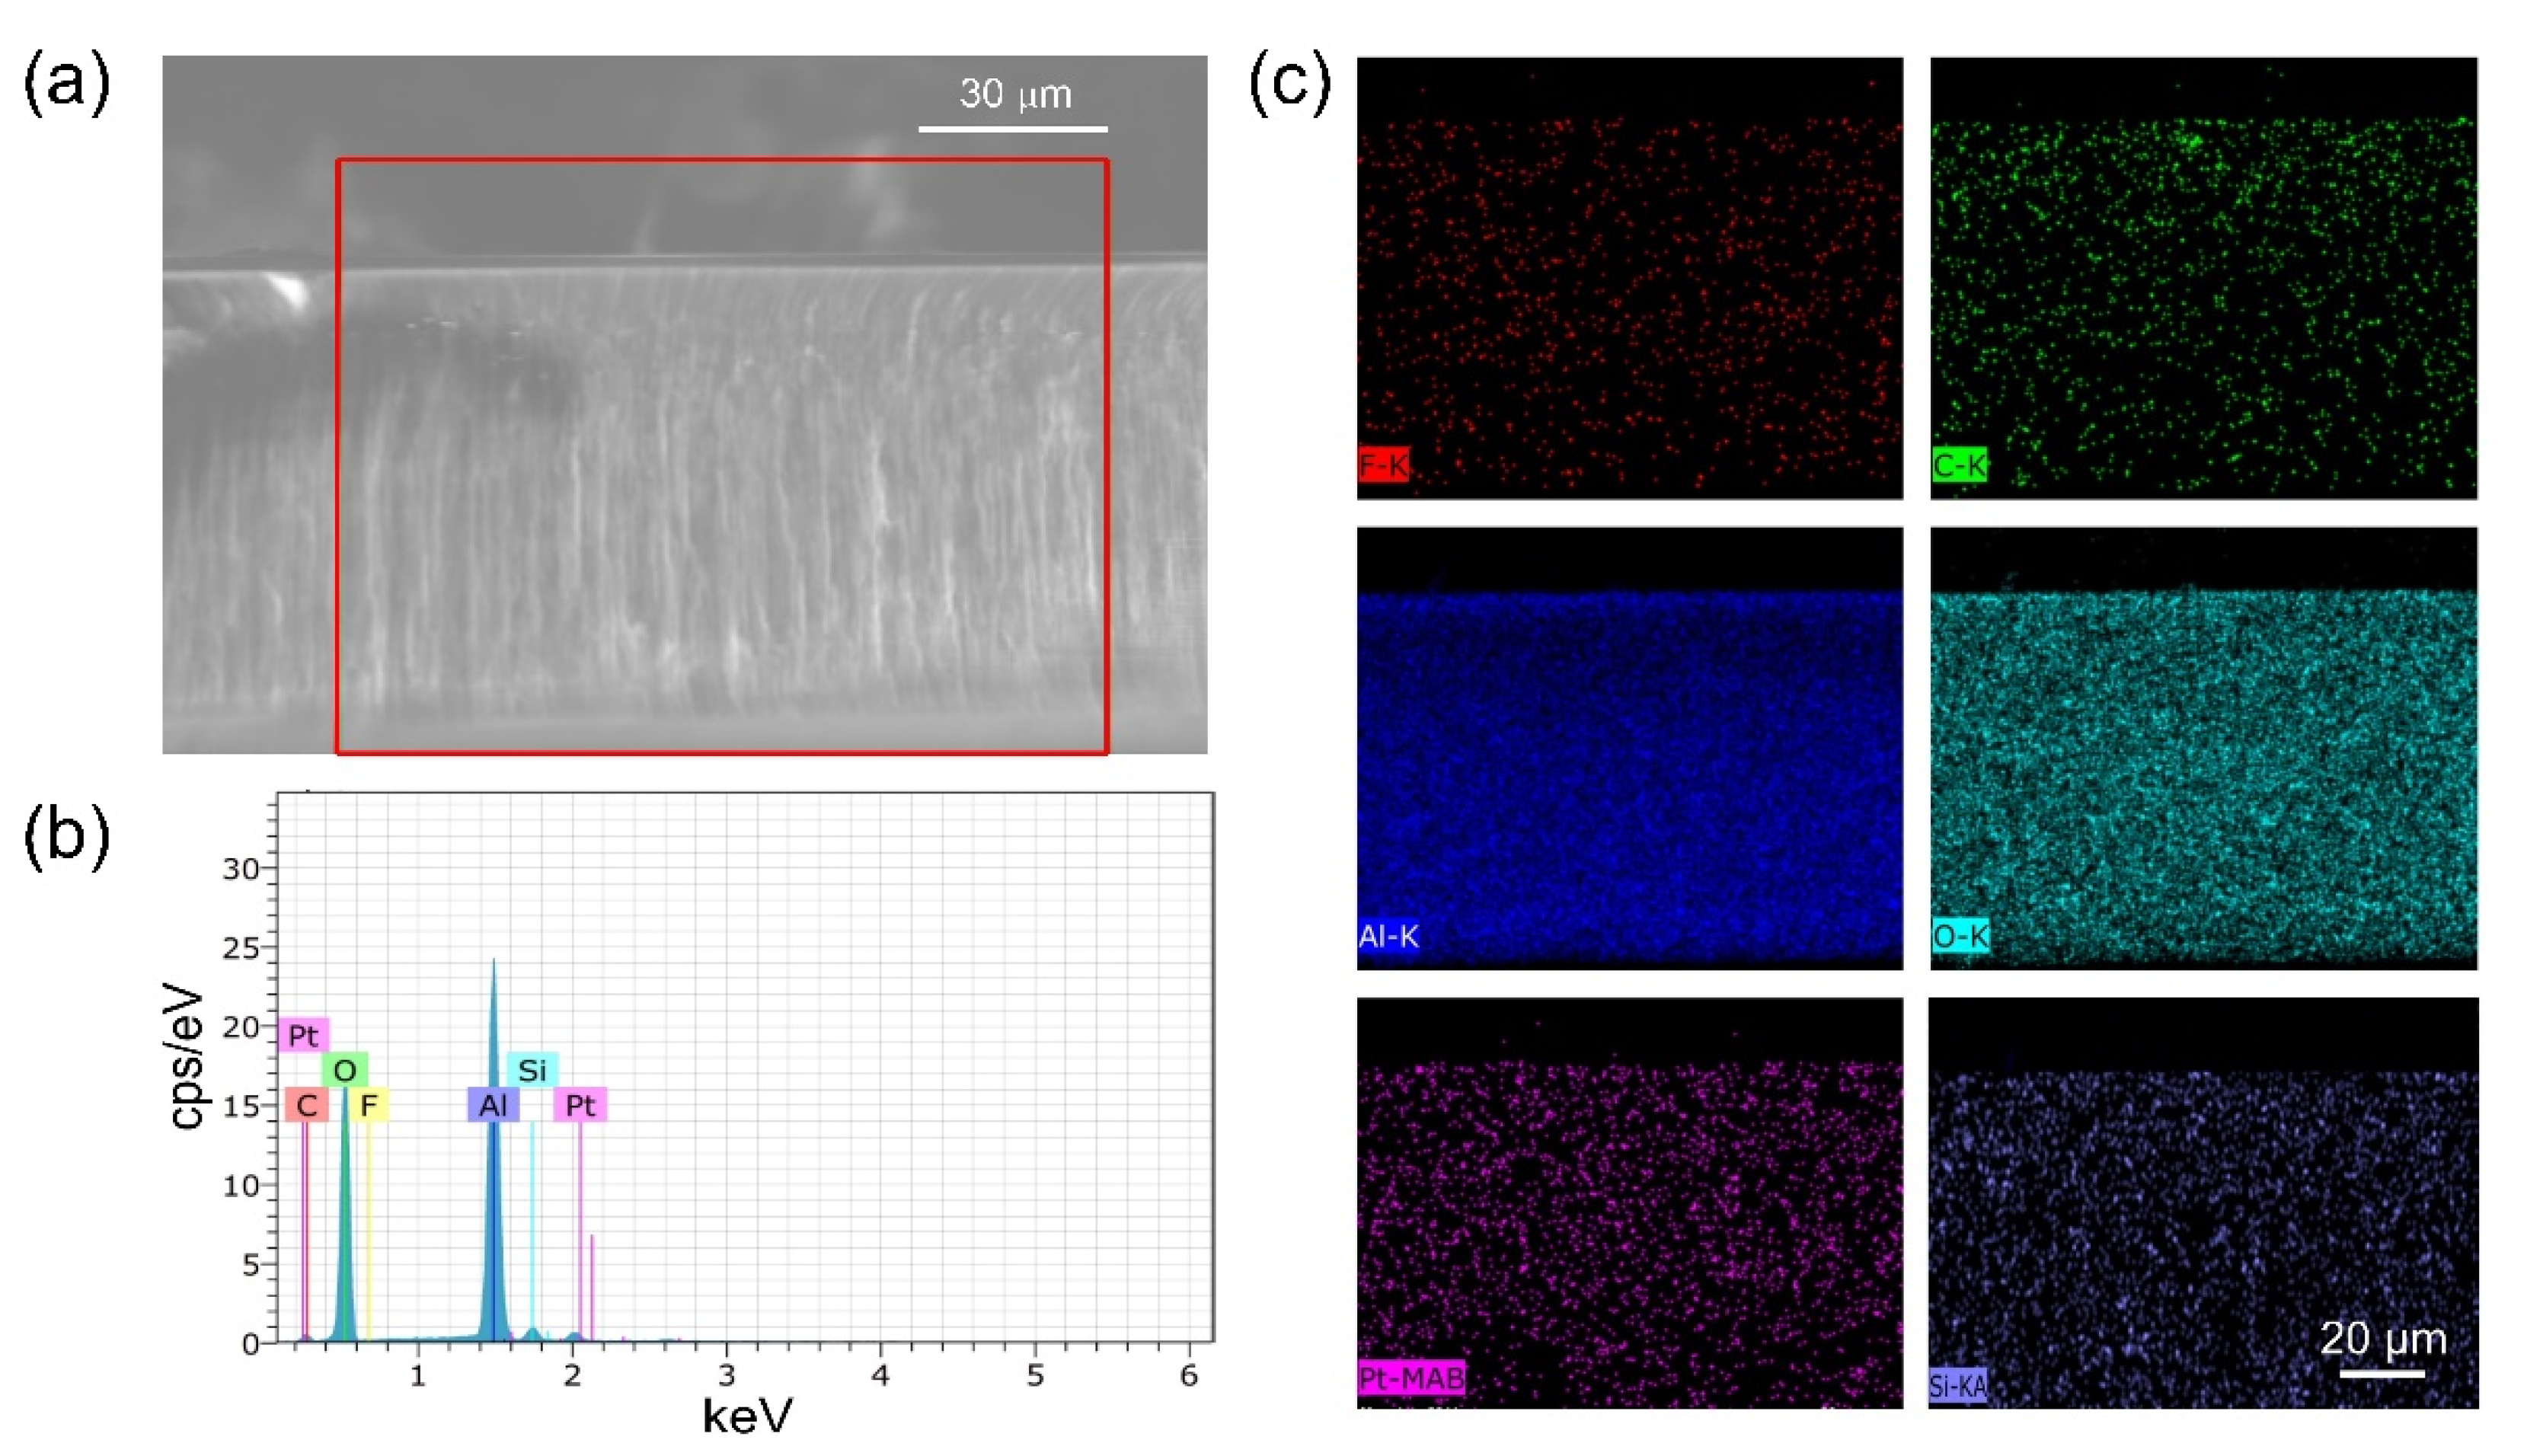
3.4. Cross-Sectional and Elemental Analysis of AAO Nano-Channels
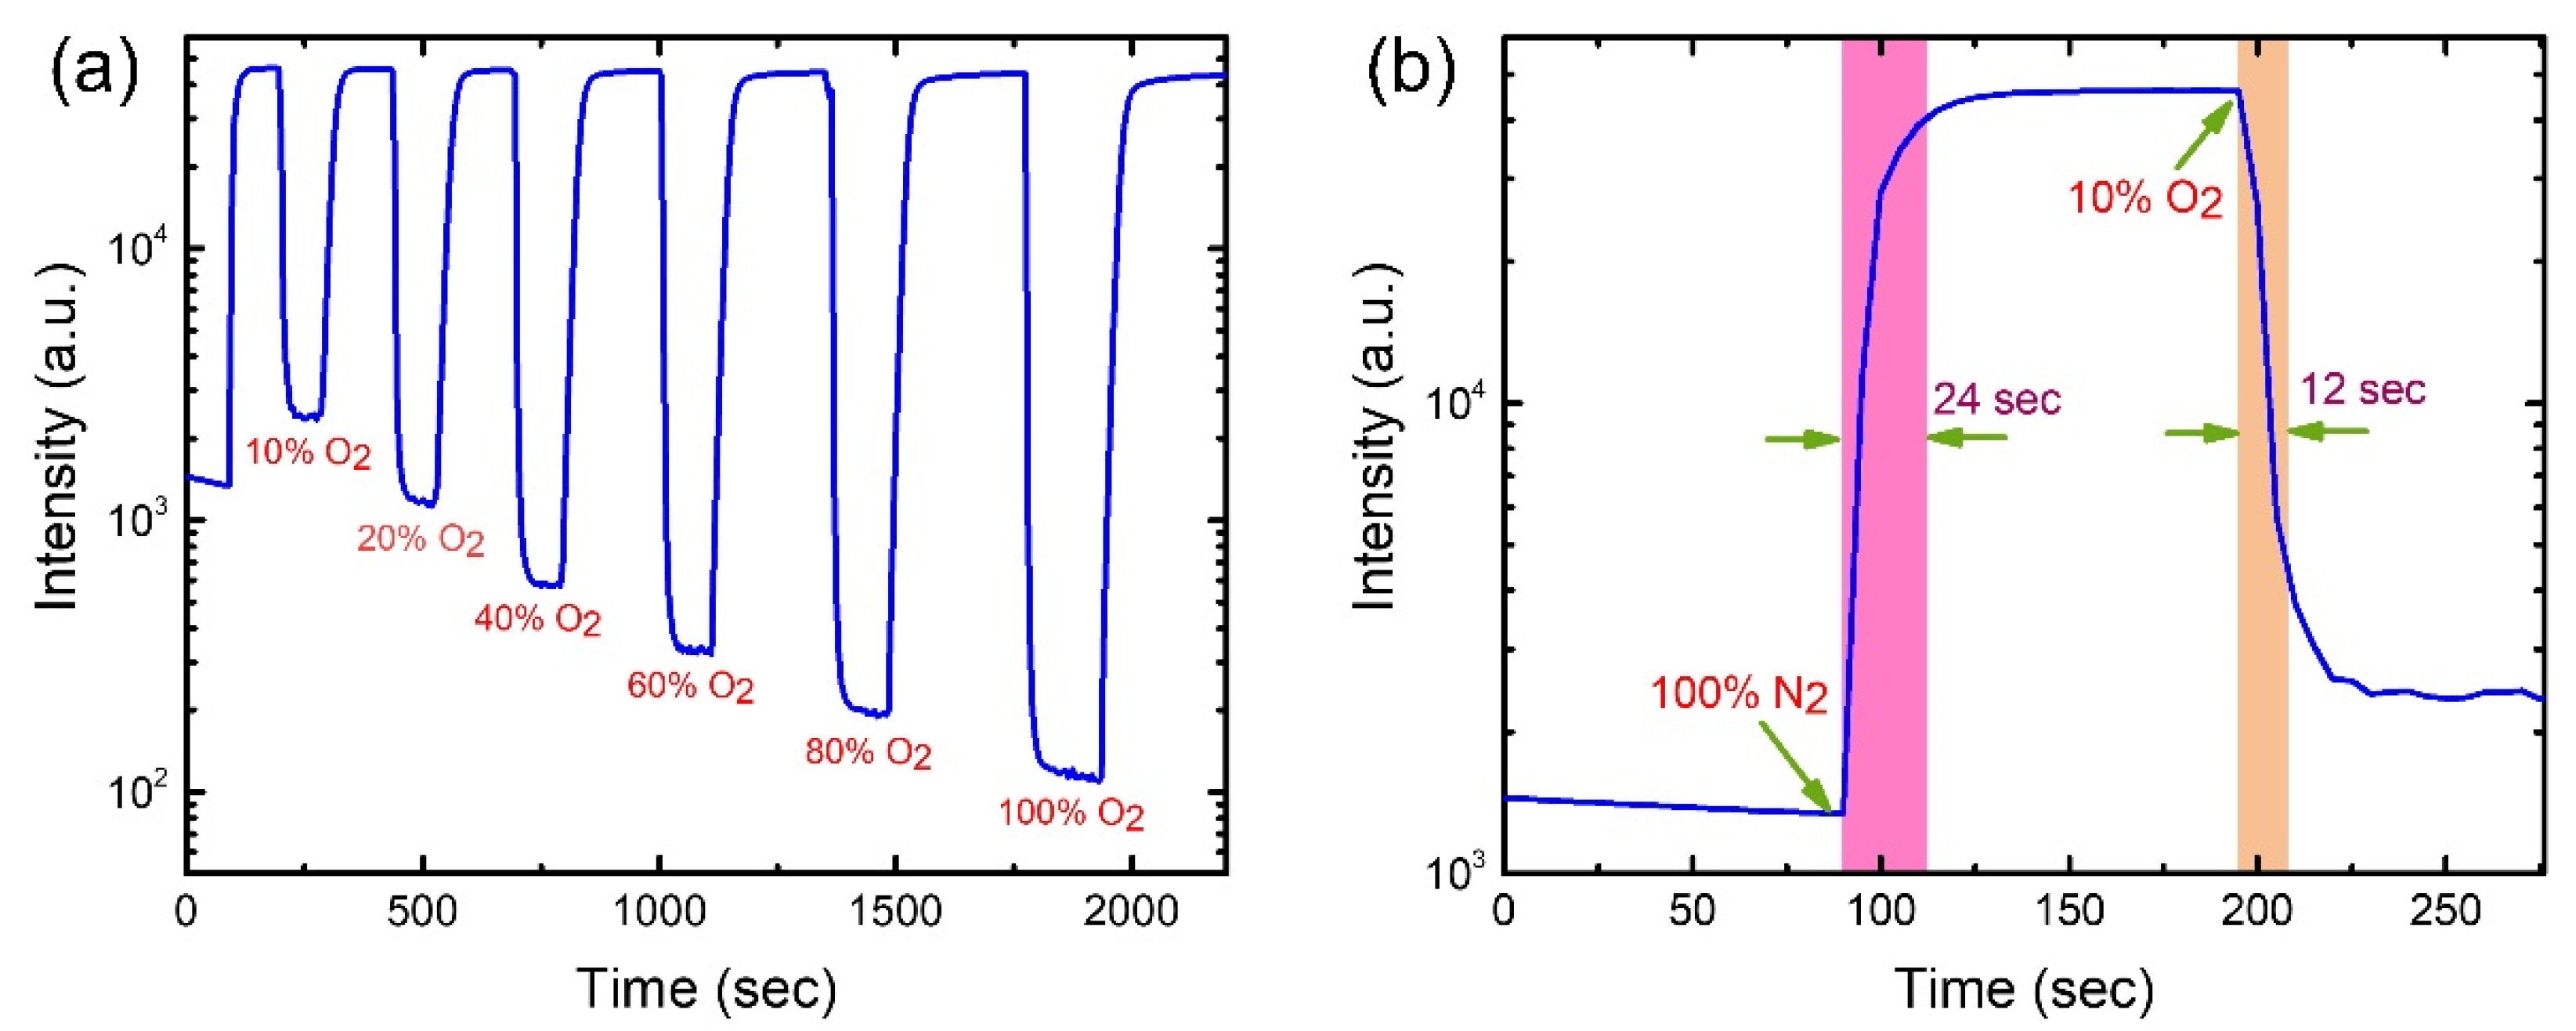
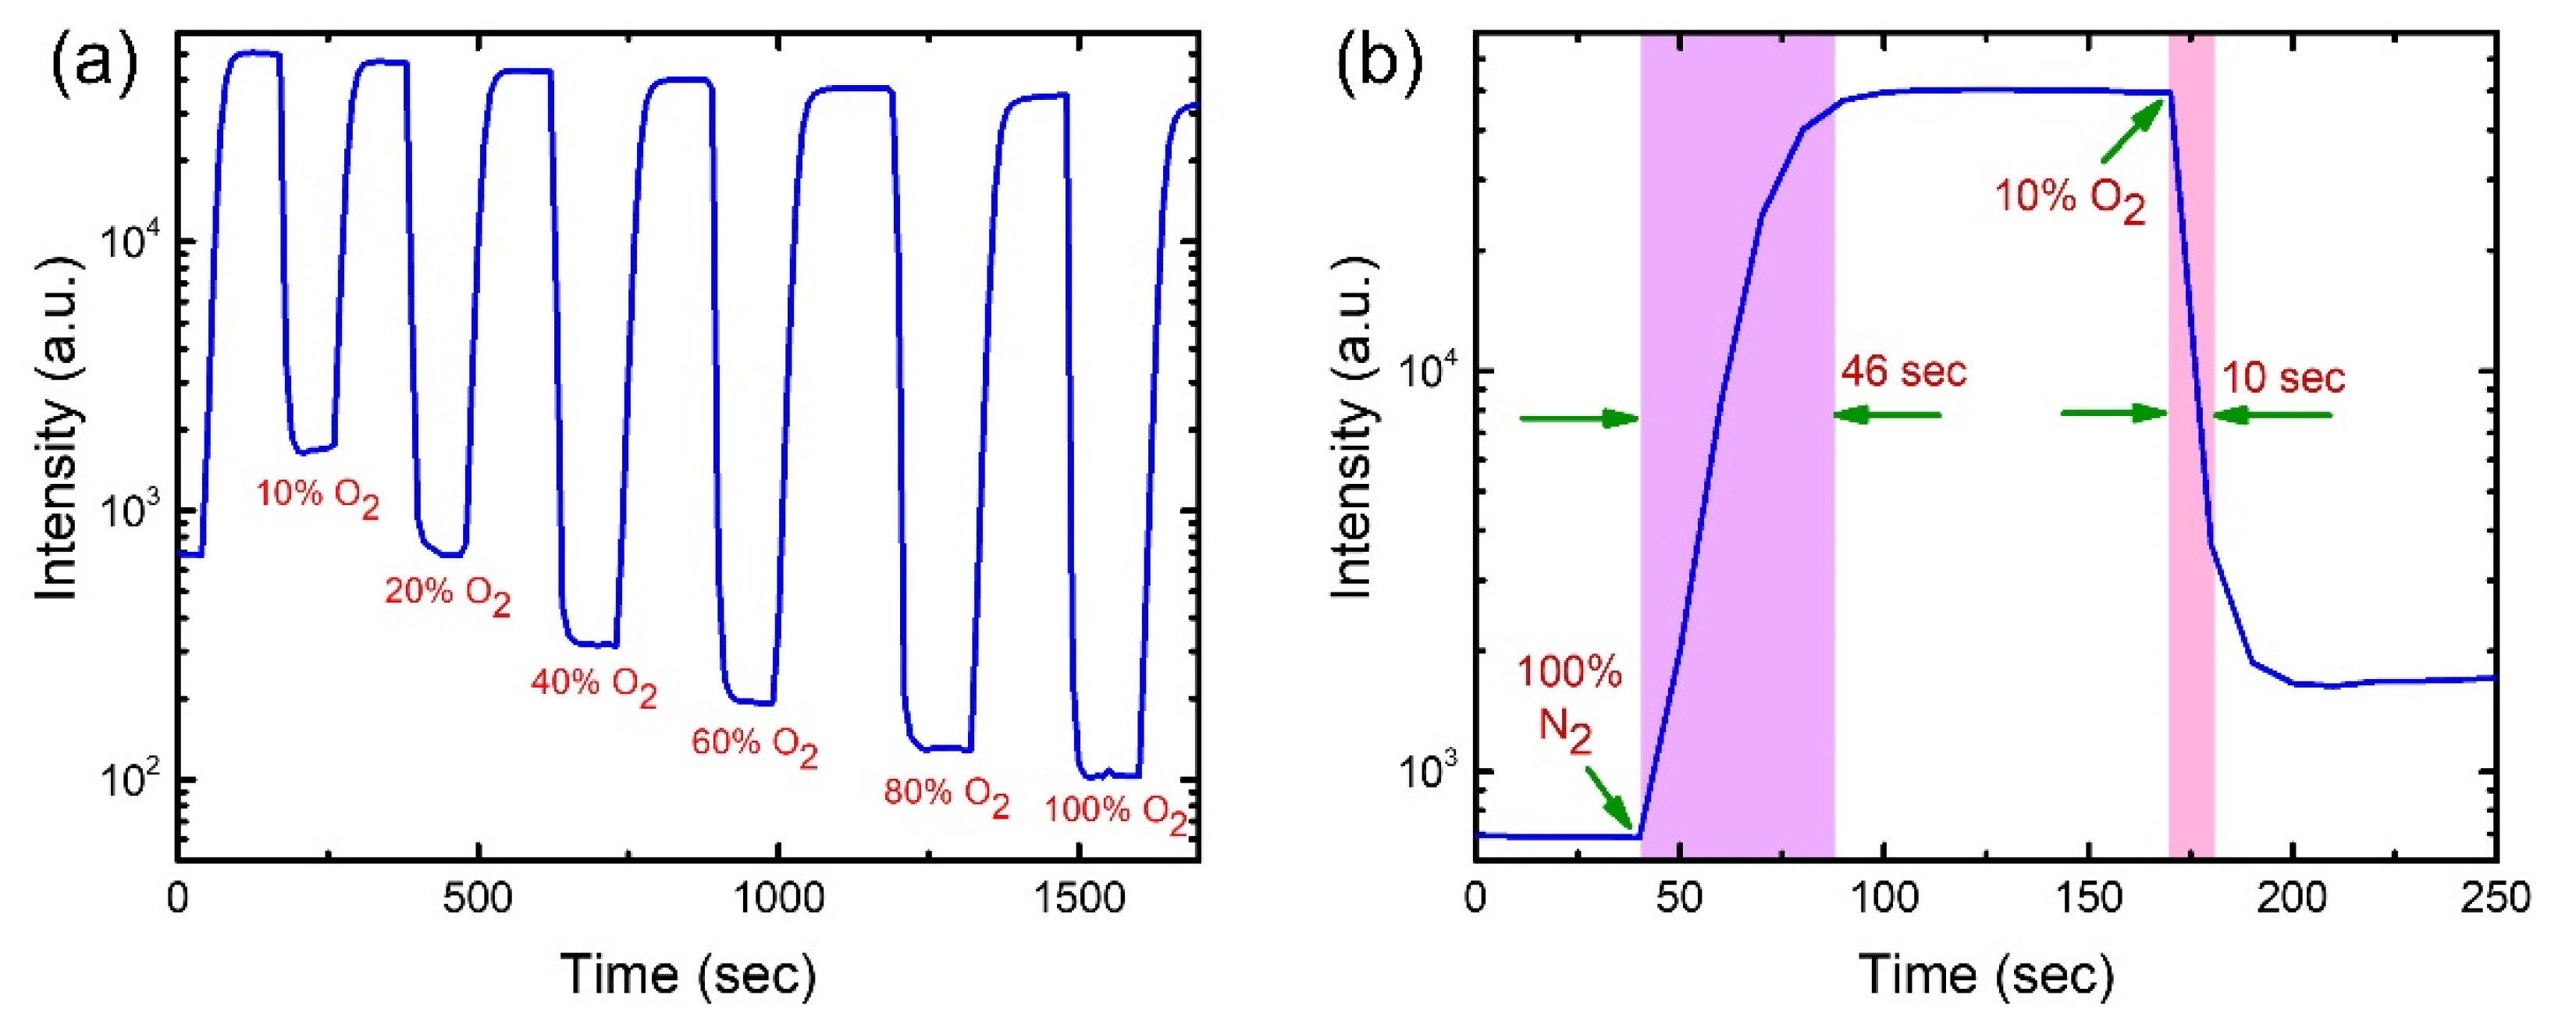
3.5. Dynamic Response and Recovery of the Optical Oxygen Sensor
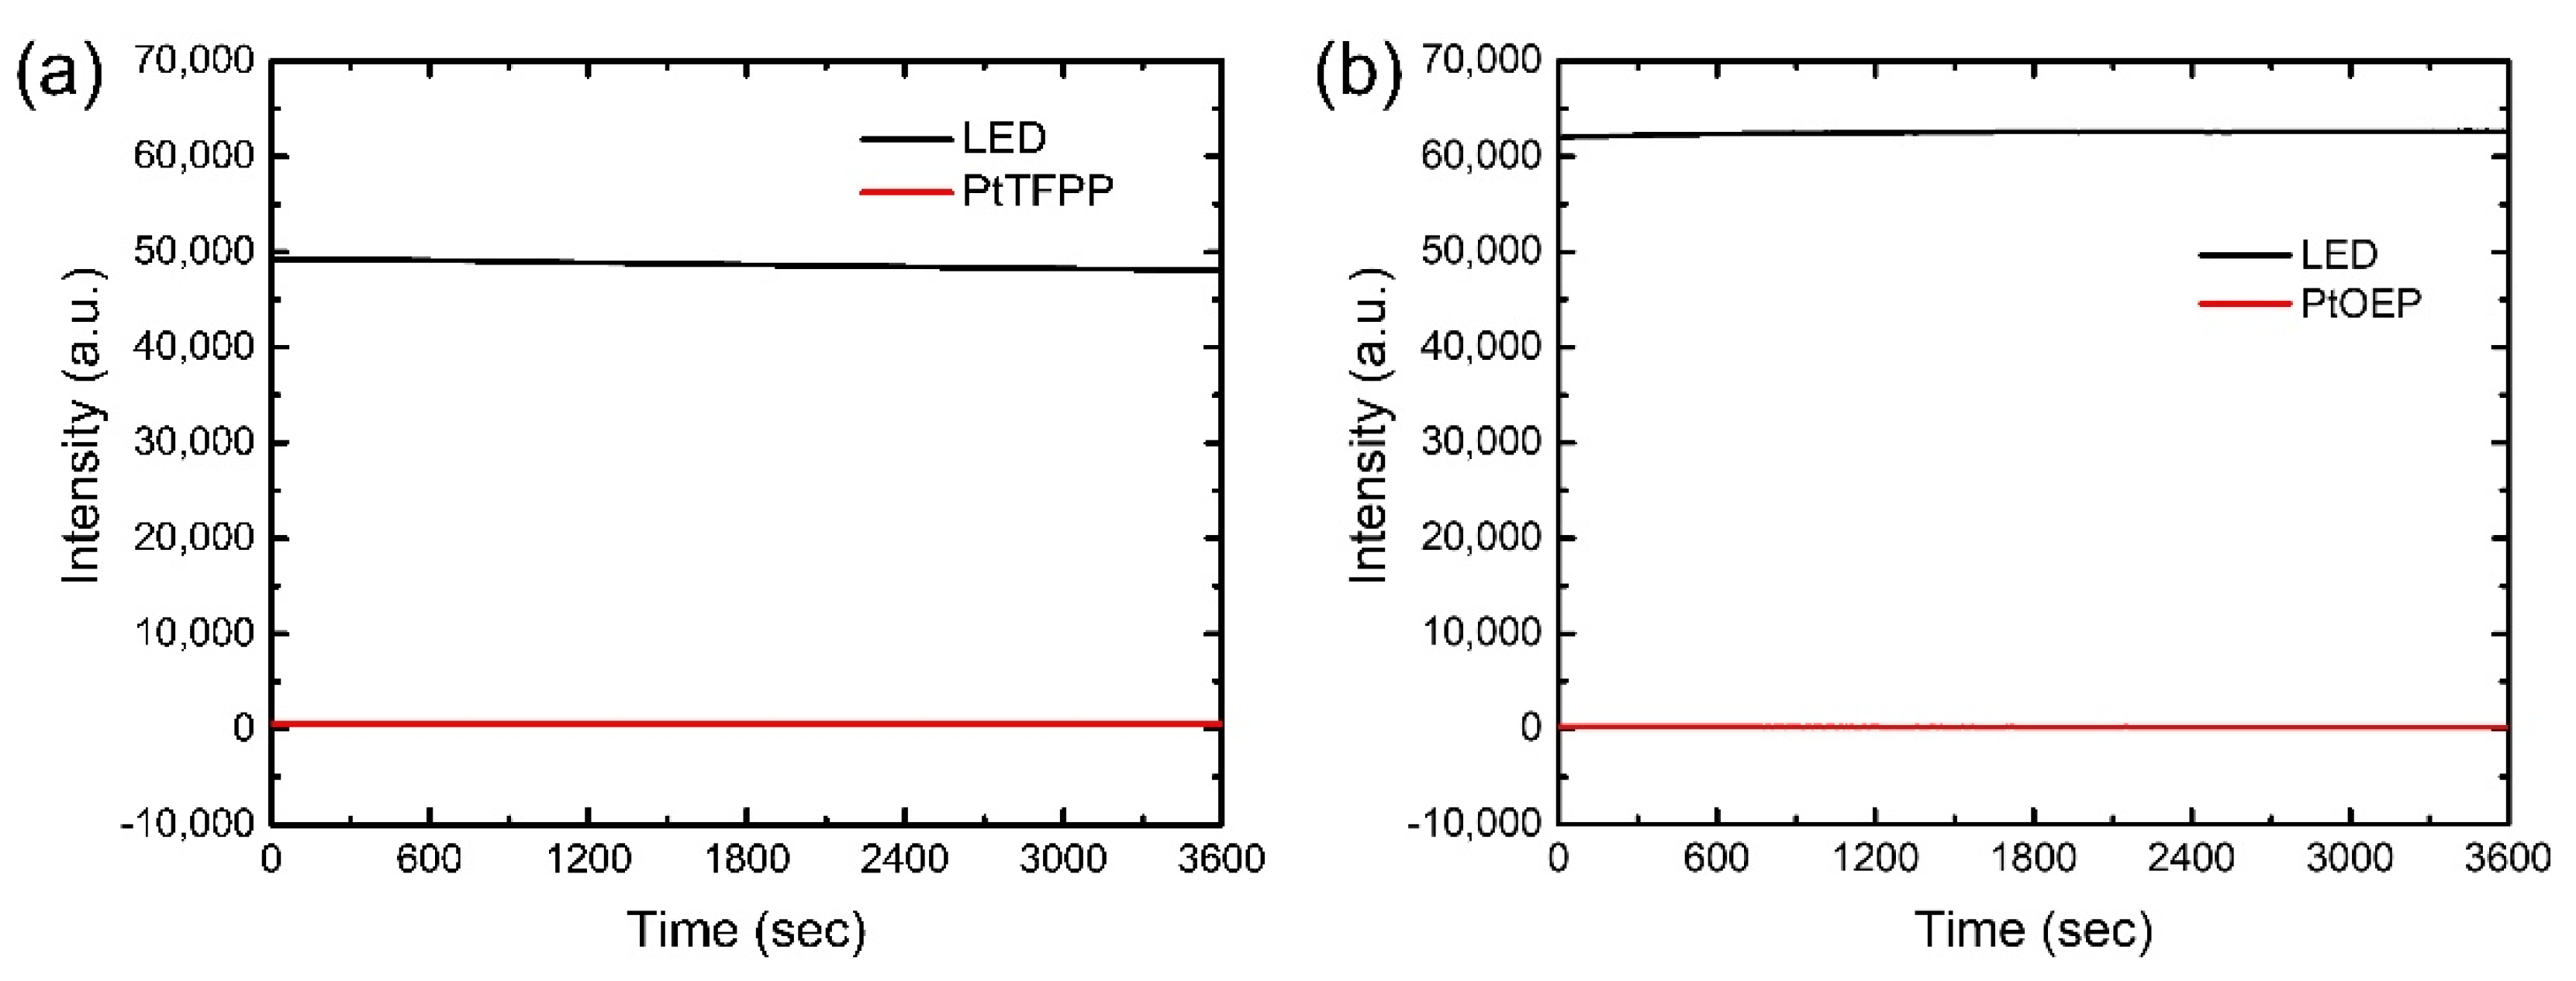
3.6. Photostability of Optical Oxygen Sensor
4. Conclusions
Supplementary Materials
Author Contributions
Funding
Institutional Review Board Statement
Informed Consent Statement
Conflicts of Interest
References
- Wolfbeis, O.S. Materials for fluorescence-based optical chemical sensors. J. Mater. Chem. 2005, 15, 2657–2669. [Google Scholar] [CrossRef]
- Chu, C.S.; Lo, Y.L.; Sung, T.W. Enhanced oxygen sensing properties of Pt (II) complex and dye entrapped core–shell silica nanoparticles embedded in sol–gel matrix. Talanta 2010, 82, 1044–1051. [Google Scholar] [CrossRef]
- Majumdar, P.; Nomula, R.; Zhao, J. Activatable triplet photosensitizers: Magic bullets for targeted photodynamic therapy. J. Mater. Chem. C 2014, 2, 5982–5997. [Google Scholar] [CrossRef]
- Wang, X.D.; Wolfbeis, O.S. Optical methods for sensing and imaging oxygen: Materials spectroscopies and applications. Chem. Soc. Rev. 2014, 43, 3666–3761. [Google Scholar] [CrossRef]
- Donald, K.W. Oxygen poisoning in man: Part II. Br. Med. J. 1947, 1, 712. [Google Scholar] [CrossRef]
- Clark, J.M. Pulmonary limits of oxygen tolerance in man. Exp. Lung Res. 1988, 14, 897–910. [Google Scholar] [CrossRef]
- Xing, Y.; Liu, C.; Song, X.; Li, J. Photostable trifluoromethyl-substituted platinum (II) emitters for continuous monitoring of molecular oxygen. J. Mater. Chem. C 2015, 3, 2166–2174. [Google Scholar] [CrossRef]
- Hutter, L.H.; Müller, B.J.; Koren, K.; Borisov, S.M.; Klimant, I. Robust optical oxygen sensors based on polymer-bound NIR-emitting platinum (II)–benzoporphyrins. J. Mater. Chem. C 2014, 2, 7589–7598. [Google Scholar] [CrossRef]
- Yao, L.; Ou, G.; Liu, W.; Zhao, X.; Nishijima, H.; Pan, W. Fabrication of high performance oxygen sensors using multilayer oxides with high interfacial conductivity. J. Mater. Chem. A 2016, 4, 11422–11429. [Google Scholar] [CrossRef]
- Wu, C.C.; Yasukawa, T.; Shiku, H.; Matsue, T. Fabrication of miniature Clark oxygen sensor integrated with microstructure. Sens. Actuator B-Chem. 2005, 110, 342–349. [Google Scholar] [CrossRef]
- Meixner, H.; Lampe, U. Metal oxide sensors. Sens. Actuator B-Chem. 1996, 33, 198–202. [Google Scholar] [CrossRef]
- Donckt, E.V.; Camerman, B.; Herne, R.; Vandeloise, R. Fibre-optic oxygen sensor based on luminescence quenching of a Pt (II) complex embedded in polymer matrices. Sens. Actuator B-Chem. 1996, 32, 121–127. [Google Scholar] [CrossRef]
- Healey, B.G.; Walt, D.R. Improved fiber-optic chemical sensor for penicillin. Anal. Chem. 1995, 67, 4471–4476. [Google Scholar] [CrossRef]
- Tsukada, K.; Sakai, S.; Hase, K.; Minamitani, H. Development of catheter-type optical oxygen sensor and applications to bioinstrumentation. Biosens. Bioelectron. 2003, 18, 1439–1445. [Google Scholar] [CrossRef]
- Papkovsky, D.B. Luminescent porphyrins as probes for optical (bio) sensors. Sens. Actuator B-Chem. 1993, 11, 293–300. [Google Scholar] [CrossRef]
- Demas, J.N.; DeGraff, B.A.; Coleman, P.B. Peer Reviewed: Oxygen Sensors Based on Luminescence Quenching. Anal. Chem. 1999, 71, 793A–800A. [Google Scholar] [CrossRef]
- Amao, Y. Probes and polymers for optical sensing of oxygen. Microchim. Acta 2003, 143, 1–12. [Google Scholar] [CrossRef]
- Liu, C.Y.; Deb, M.; Sadhu, A.S.; Karmakar, R.; Huang, P.T.; Lin, Y.N.; Chu, C.S.; Pal, B.N.; Chang, S.H.; Biring, S. Resolving cross-sensitivity effect in fluorescence quenching for simultaneously sensing oxygen and ammonia concentrations by an optical dual gas sensor. Sensors 2021, 21, 6940. [Google Scholar] [CrossRef]
- Yeh, T.S.; Chu, C.S.; Lo, Y.L. Highly sensitive optical fiber oxygen sensor using Pt (II) complex embedded in sol–gel matrices. Sens. Actuator B-Chem. 2006, 119, 701–707. [Google Scholar] [CrossRef]
- Chu, C.S.; Lo, Y.L. High-performance fiber-optic oxygen sensors based on fluorinated xerogels doped with Pt (II) complexes. Sens. Actuator B-Chem. 2007, 124, 376–382. [Google Scholar] [CrossRef]
- Chu, C.S.; Syu, J.J. Optical sensor for dual sensing of oxygen and carbon dioxide based on sensing films coated on filter paper. Appl. Opt. 2017, 56, 1225–1231. [Google Scholar] [CrossRef]
- Lee, S.K.; Okura, I. Photostable optical oxygen sensing material: Platinumtetrakis (pentafluorophenyl) porphyrin immobilized in polystyrene. Anal. Commun. 1997, 34, 185–188. [Google Scholar] [CrossRef]
- Lee, S.K.; Okura, I. Photoluminescent determination of oxygen using metalloporphyrin-polymer sensing systems. Spectrochim. Acta A 1998, 54, 91–100. [Google Scholar] [CrossRef]
- Lin, J.; Brown, C.W. Sol-gel glass as a matrix for chemical and biochemical sensing. Trends Anal. Chem. 1997, 16, 200–211. [Google Scholar] [CrossRef]
- MacCraith, D.; McDonagh, C.M.; O’Keeffe, G.; Keyes, E.T.; Vos, J.G.; O’Kelly, B.; McGilp, J.F. Fibre optic oxygen sensor based on fluorescence quenching of evanescent-wave excited ruthenium complexes in sol–gel derived porous coatings. Analyst 1993, 118, 385–388. [Google Scholar] [CrossRef]
- McDonagh, C.; MacCraith, B.D.; McEvoy, A.K. Tailoring of sol− gel films for optical sensing of oxygen in gas and aqueous phase. Anal. Chem. 1998, 70, 45–50. [Google Scholar] [CrossRef]
- Gao, Y.; Chen, T.; Yamamoto, S.; Miyashita, T.; Mitsuishi, M. Superhydrophobic porous surfaces: Dissolved oxygen sensing. ACS Appl. Mater. Interfaces 2015, 7, 3468–3472. [Google Scholar] [CrossRef]
- Zhou, X.; Zhu, Y.; Luo, W.; Ren, Y.; Xu, P.; Elzatahry, A.A.; Cheng, X.; Alghamdi, A.; Deng, Y.; Zhao, D. Chelation-assisted soft-template synthesis of ordered mesoporous zinc oxides for low concentration gas sensing. J. Mater. Chem. A 2016, 4, 15064–15071. [Google Scholar] [CrossRef]
- Huang, X.J.; Choi, Y.K. Chemical sensors based on nanostructured materials. Sens. Actuator B-Chem. 2007, 122, 659–671. [Google Scholar] [CrossRef]
- Lee, S.; Park, J.W. Luminescent oxygen sensors with highly improved sensitivity based on a porous sensing film with increased oxygen accessibility and photoluminescence. Sens. Actuator B-Chem. 2017, 249, 364–377. [Google Scholar] [CrossRef]
- Mao, Y.; Gao, Y.; Wu, S.; Wu, S.; Shi, J.; Zhou, B.; Tian, Y. Highly enhanced sensitivity of optical oxygen sensors using microstructured PtTFPP/PDMS-pillar arrays sensing layer. Sens. Actuator B-Chem. 2017, 251, 495–502. [Google Scholar] [CrossRef]
- Mao, Y.; Mei, Z.; Wen, J.; Li, G.; Tian, Y.; Zhou, B.; Tian, Y. Honeycomb structured porous films from a platinum porphyrin-grafted poly (styrene-co-4-vinylpyridine) copolymer as an optical oxygen sensor. Sens. Actuator B-Chem. 2018, 257, 944–953. [Google Scholar] [CrossRef]
- Tian, Y.; Shumway, B.R.; Gao, W.; Youngbull, C.; Holl, M.R.; Johnson, R.H.; Meldrum, D.R. Influence of matrices on oxygen sensing of three sensing films with chemically conjugated platinum porphyrin probes and preliminary application for monitoring of oxygen consumption of Escherichia coli (E coli). Sens. Actuator B-Chem. 2010, 150, 579–587. [Google Scholar] [CrossRef]
- Borisov, S.M.; Lehner, P.; Klimant, I. Novel optical trace oxygen sensors based on platinum(II) and palladium(II) complexes with5,10,15,20-meso-tetrakis-(2,3,4,5,6-pentafluorphenyl)-porphyrin covalently immobilized on silica-gel particles. Anal. Chim. Acta 2011, 690, 108–115. [Google Scholar] [CrossRef] [PubMed]
- Chu, C.S. Optical oxygen sensing properties of Ru (II) complex and porous silica nanoparticles embedded in solgel matrix. Appl. Opt. 2011, 50, E145–E151. [Google Scholar] [CrossRef]
- Chu, C.S.; Lo, Y.L. Highly sensitive and linear calibration optical fiber oxygen sensor based on Pt (II) complex embedded in sol–gel matrix. Sens. Actuator B-Chem. 2011, 155, 53–57. [Google Scholar] [CrossRef]
- Chu, C.S. Optical fiber oxygen sensor based on Pd (II) complex embedded in sol–gel matrix. J. Lumin. 2013, 135, 5–9. [Google Scholar] [CrossRef]
- Chu, C.S.; Sung, T.W.; Lo, Y.L. Enhanced optical oxygen sensing property based on Pt (II) complex and metal-coated silica nanoparticles embedded in sol–gel matrix. Sens. Actuator B-Chem. 2013, 185, 287–292. [Google Scholar] [CrossRef]
- Chu, C.S.; Chuang, C.Y. Highly sensitive fiber-optic oxygen sensor based on palladium tetrakis (4-carboxyphenyl) porphyrin doped in ormosil. J. Lumin. 2014, 154, 475–478. [Google Scholar] [CrossRef]
- Xue, R.; Ge, C.; Richardson, K.; Palmer, A.; Viapiano, M.; Lannutti, J.J. Microscale sensing of oxygen via encapsulated porphyrin nanofibers: Effect of indicator and polymer “core” permeability. ACS Appl. Mater. Interfaces 2015, 7, 8606–8614. [Google Scholar] [CrossRef]
- Chu, C.S.; Syu, J.J. The Development of a Highly Sensitive Fiber-Optic Oxygen Sensor. Inventions 2016, 1, 9. [Google Scholar] [CrossRef]
- Biring, S.; Sadhu, A.S.; Deb, M. An effective optical dual gas sensor for simultaneous detection of oxygen and ammonia. Sensors 2019, 19, 5124. [Google Scholar] [CrossRef]
- Liu, C.Y.; Datta, A.; Wang, Y.L. Ordered anodic alumina nanochannels on focused-ion-beam-prepatterned aluminum surfaces. Appl. Phys. Lett. 2001, 78, 120–122. [Google Scholar] [CrossRef]
- Liu, C.Y.; Wang, Y.L. Creating anodic alumina nanochannel arrays with custom-made geometry. J. Chin. Chem. Soc. 2020, 67, 11–24. [Google Scholar] [CrossRef]
- Liu, C.Y.; Biring, S. Nanoplatform based on ideally ordered arrays of short straight and long beer bottle-shaped nanochannels. Micropor. Mesopor. Mat. 2019, 287, 71–76. [Google Scholar] [CrossRef]
- Shi, W.; Shen, Y.; Ge, D.; Xue, M.; Cao, H.; Huang, S.; Wang, J.; Zhang, G.; Zhang, F. Functionalized anodic aluminum oxide (AAO) membranes for affinity protein separation. J. Membr. Sci. 2008, 325, 801–808. [Google Scholar] [CrossRef]
- Hoess, A.; Teuscher, N.; Thormann, A.; Aurich, H.; Heilmann, A. Cultivation of hepatoma cell line HepG2 on nanoporous aluminum oxide membranes. Acta Biomater. 2007, 3, 43–50. [Google Scholar] [CrossRef]
- Zhao, J.; Gao, Q.Y.; Gu, C.; Yang, Y. Preparation of multi-walled carbon nanotube array electrodes and its electrochemical intercalation behavior of Li ions. Chem. Phys. Lett. 2002, 358, 77–82. [Google Scholar] [CrossRef]
- Losic, D.; Simovic, S. Self-ordered nanopore and nanotube platforms for drug delivery applications. Expert Opin. Drug Deliv. 2009, 6, 1363–1381. [Google Scholar] [CrossRef]
- Heilmann, A.; Teuscher, N.; Kiesow, A.; Janasek, D.; Spohn, U. Nanoporous aluminum oxide as a novel support material for enzyme biosensors. J. Nanosci. Nanotechnol. 2003, 3, 375–379. [Google Scholar] [CrossRef]
- Gerlitz, R.A.; Benkstein, K.D.; Lahr, D.L.; Hertz, J.L.; Montgomery, C.B.; Bonevich, J.E.; Semancik, S.; Tarlov, M.J. Fabrication and gas sensing performance of parallel assemblies of metal oxide nanotubes supported by porous aluminum oxide membranes. Sens. Actuator B-Chem. 2009, 136, 257–264. [Google Scholar] [CrossRef]
- John, N.; Thomas, P.; Divya, K.V.; Abraham, K.E. Enhanced room temperature gas sensing of aligned Mn3O4 nanorod assemblies functionalized by aluminum anodic membranes. Nanotechnology 2018, 29, 335503. [Google Scholar] [CrossRef]
- Kumar, N.; Srivastava, A.K.; Nath, R.; Gupta, B.K.; Varma, G.D. Probing the highly efficient room temperature ammonia gas sensing properties of a luminescent ZnO nanowire array prepared via an AAO-assisted template route. Dalton Trans. 2014, 43, 5713–5720. [Google Scholar] [CrossRef]
- Kumeria, T.; Parkinson, L.; Losic, D. A nanoporous interferometric micro-sensor for biomedical detection of volatile sulphur compounds. Nanoscale Res. Lett. 2011, 6, 634. [Google Scholar] [CrossRef]
- Markovics, Á.; Kovács, B. Fabrication of optical chemical ammonia sensors using anodized alumina supports and sol-gel method. Talanta 2013, 109, 101–106. [Google Scholar] [CrossRef]
- Wang, M.; Meng, G.; Huang, Q.; Li, M.; Li, Z.; Tang, C. Fluorescence detection of trace PCB101 based on PITC immobilized on porous AAO membrane. Analyst 2011, 136, 278–281. [Google Scholar] [CrossRef] [PubMed]
- Cui, M.; Wang, F.; Miao, Z.; Xia, Y.; Yan, L.; Ma, Y.; Yao, H.; Ling, H.; Qi, Z. Self-assembly oxygen sensing thin film based on a Ru (ii) complex covalently grafted to porous anodized alumina oxide (AAO) templates. RSC Adv. 2015, 5, 65627–65634. [Google Scholar] [CrossRef]
- Borisov, S.M. Chapter 1: Fundamentals of Quenched Phosphorescence O2 Sensing and Rational Design of Sensor Materials. In Quenched-Phosphorescence Detection of Molecular Oxygen: Applications in Life Sciences; Royal Society of Chemistry: London, UK, 2018; pp. 1–18. [Google Scholar]
- Gehlen, M.H. The centenary of the Stern-Volmer equation of fluorescence quenching: From the single line plot to the SV quenching map. J. Photochem. Photobiol. C 2020, 42, 100338. [Google Scholar] [CrossRef]
- Lakowicz, J.R. Principles of Fluorescence Spectroscopy, 3rd ed.; Springer: New York, NY, USA, 2006. [Google Scholar]
- Chu, C.S.; Lin, K.Z.; Tang, Y.H. A new optical sensor for sensing oxygen based on phase shift detection. Sens. Actuator B-Chem. 2016, 223, 606–612. [Google Scholar] [CrossRef]
- Lo, Y.L.; Chu, C.S.; Yur, J.P.; Chang, Y.C. Temperature compensation of fluorescence intensity-based fiber-optic oxygen sensors using modified Stern–Volmer model. Sens. Actuator B-Chem. 2008, 131, 479–488. [Google Scholar] [CrossRef]


| Substrate | Indicator/Matrix | Response (I0/I100)/ Characteristics | Year/Ref. |
|---|---|---|---|
| Optical fiber | PtOEP/n-propyl TriMOS/TFP-TriMOS | 82.5/Linear SVPs | 2007/[20] |
| Quartz glass | PtTFPP/Silica-gel | 70/Linear SVPs | 2010/[33] |
| Microscope glass | PtTFPP/Silica gel beads | 1.4/Linear SVPs | 2011/[34] |
| Optical fiber | [Ru(dpp)3]2+/Octyl-triEOS/TEOS and porous silica nanoparticles | 26/Linear SVPs | 2011/[35] |
| Optical fiber | PtTFPP/n-propyl-TriMOS/TEOS/Octyl-tri-EOS | 155/Linear SVPs | 2011/[36] |
| Optical fiber | PdTFPP/n-propyl-TriMOS/TEOS/Octyl-tri-EOS | 263/Linear SVPs | 2013/[37] |
| Optical fiber | PtTFPP/Octyl-triEOS/TEOS and metal-coated silica nanoparticles | 167/Non-linear SVPs | 2013/[38] |
| Optical fiber | PdTCPP/TEOS/Octyl-triEOS | 153/Linear SVPs | 2014/[39] |
| Aluminium foil or glass coverslips | PtTFPP/PSU-PCL | 8.9/Linear SVPs | 2015/[40] |
| Aluminium foil or glass coverslips | PtTFPP/PES-PCL | 6.7/Linear SVPs | 2015/[40] |
| Optical fiber | PdTFPP/TEOS/Octyl-triEOS and core–shell silica nanoparticles | 386/Linear SVPs | 2016/[41] |
| PDMS support layer | PtTFPP/PDMS pillar arrays | 288/Linear SVPs from 0 to 1010 hPa O2 | 2017/[31] |
| Glass | PtTFPP/Ethyl cellulose | 60 (Dual Sensor)/Non-linear SVPs | 2019/[42] |
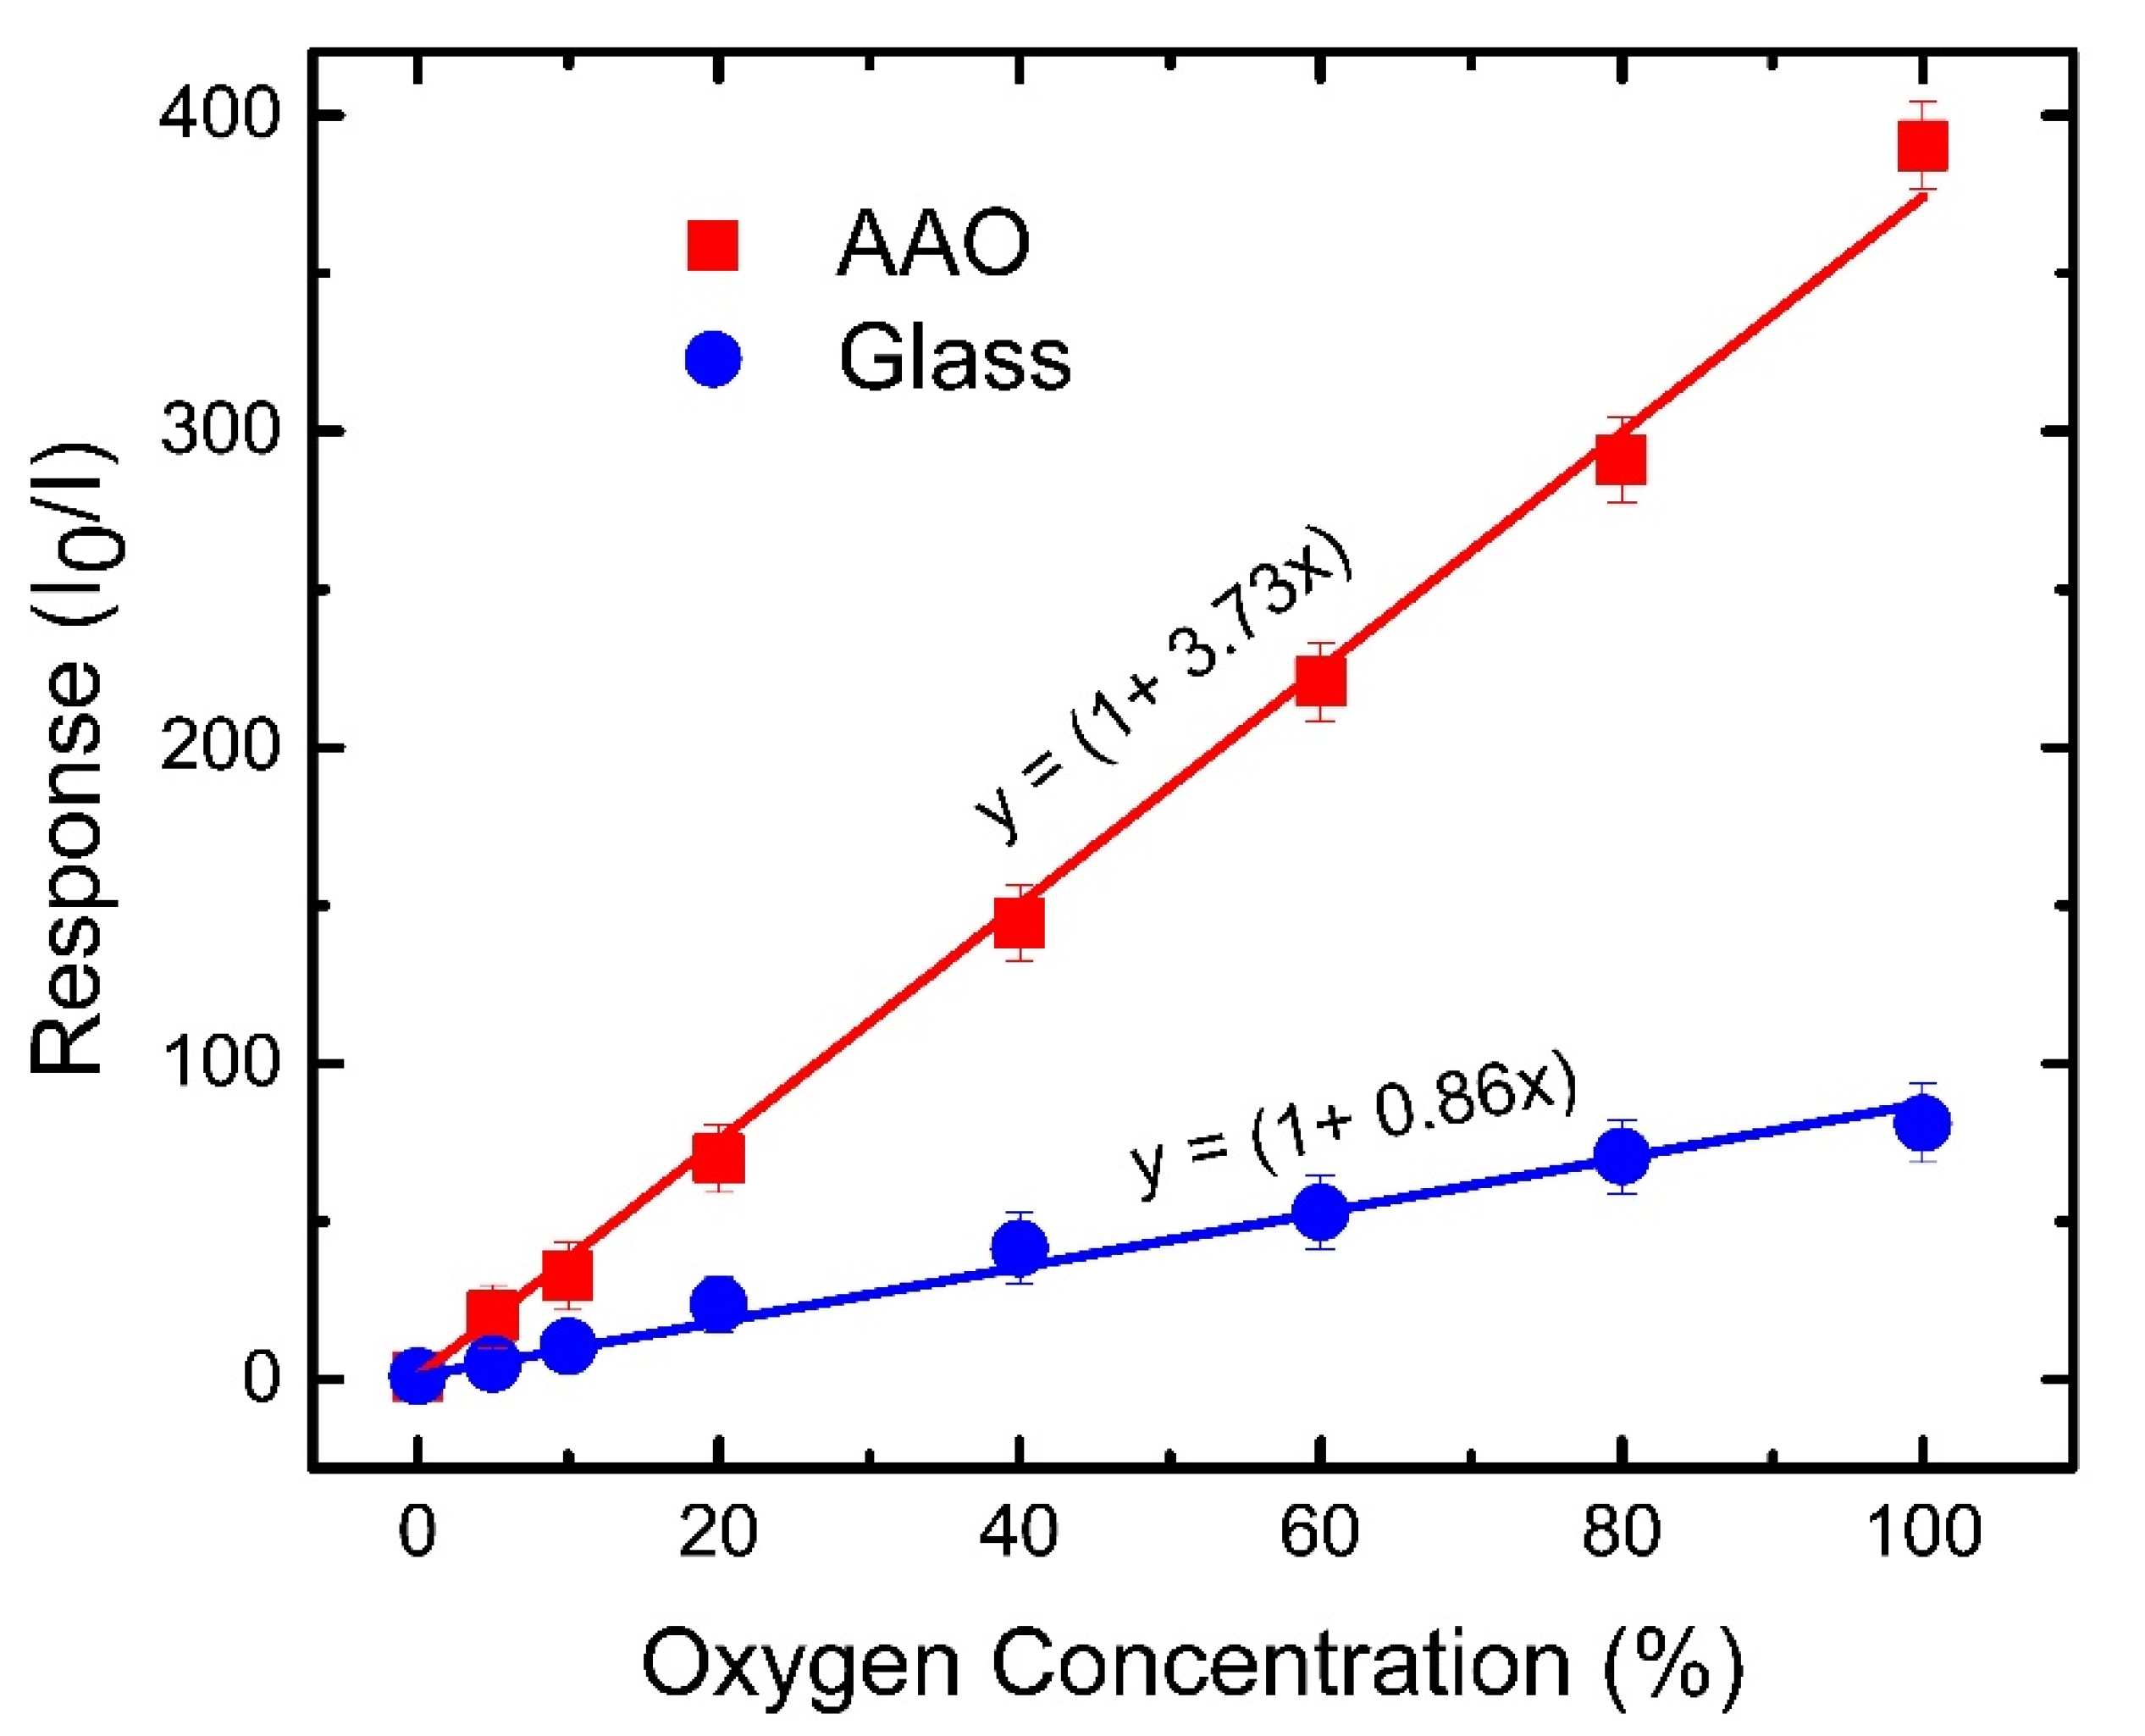
| AAO membrane | PtTFPP/TEOS/Octyl-triEOS | ~400/Linear SVPs | This study |
| AAO membrane | PtOEP/TEOS/Octyl-triEOS | ~500/Non-linear SVPs | This study |
Publisher’s Note: MDPI stays neutral with regard to jurisdictional claims in published maps and institutional affiliations. |
© 2022 by the authors. Licensee MDPI, Basel, Switzerland. This article is an open access article distributed under the terms and conditions of the Creative Commons Attribution (CC BY) license (https://creativecommons.org/licenses/by/4.0/).
Share and Cite
Liu, C.-Y.; Sadhu, A.S.; Karmakar, R.; Chu, C.-S.; Lin, Y.-N.; Chang, S.-H.; Dalapati, G.K.; Biring, S. Strongly Improving the Sensitivity of Phosphorescence-Based Optical Oxygen Sensors by Exploiting Nano-Porous Substrates. Biosensors 2022, 12, 774. https://doi.org/10.3390/bios12100774
Liu C-Y, Sadhu AS, Karmakar R, Chu C-S, Lin Y-N, Chang S-H, Dalapati GK, Biring S. Strongly Improving the Sensitivity of Phosphorescence-Based Optical Oxygen Sensors by Exploiting Nano-Porous Substrates. Biosensors. 2022; 12(10):774. https://doi.org/10.3390/bios12100774
Chicago/Turabian StyleLiu, Chih-Yi, Annada Sankar Sadhu, Riya Karmakar, Cheng-Shane Chu, Yi-Nan Lin, Shih-Hsin Chang, Goutam Kumar Dalapati, and Sajal Biring. 2022. "Strongly Improving the Sensitivity of Phosphorescence-Based Optical Oxygen Sensors by Exploiting Nano-Porous Substrates" Biosensors 12, no. 10: 774. https://doi.org/10.3390/bios12100774