Sources of Inaccuracy in Photoplethysmography for Continuous Cardiovascular Monitoring


Abstract
:1. Introduction
2. Individual Variations in the Human Population
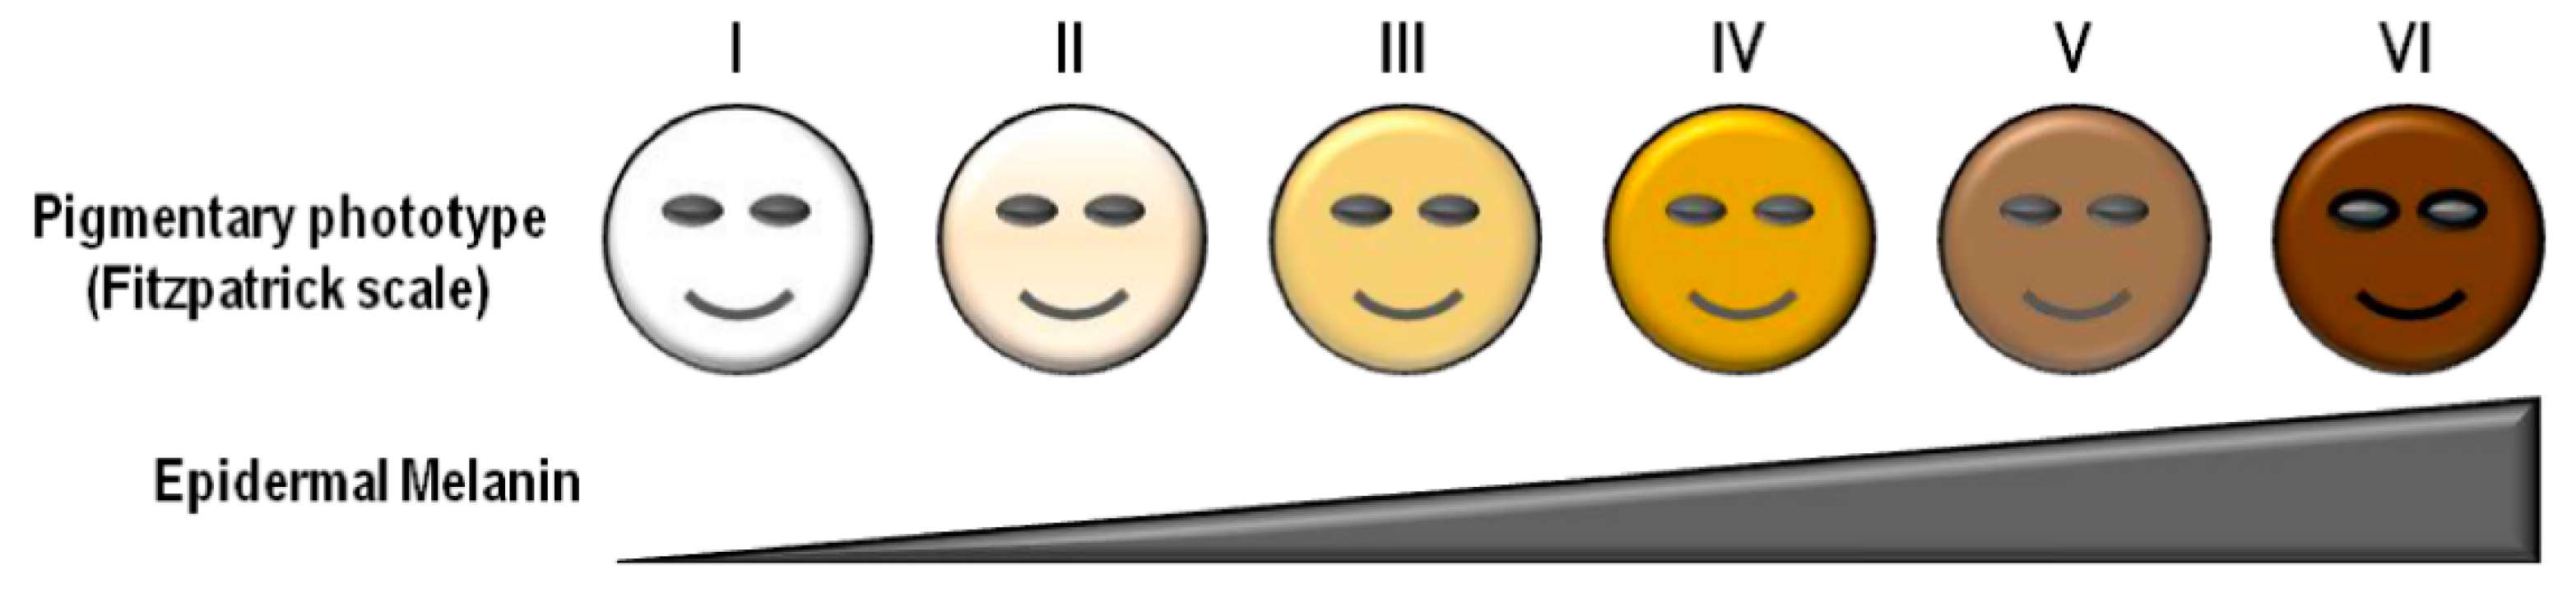
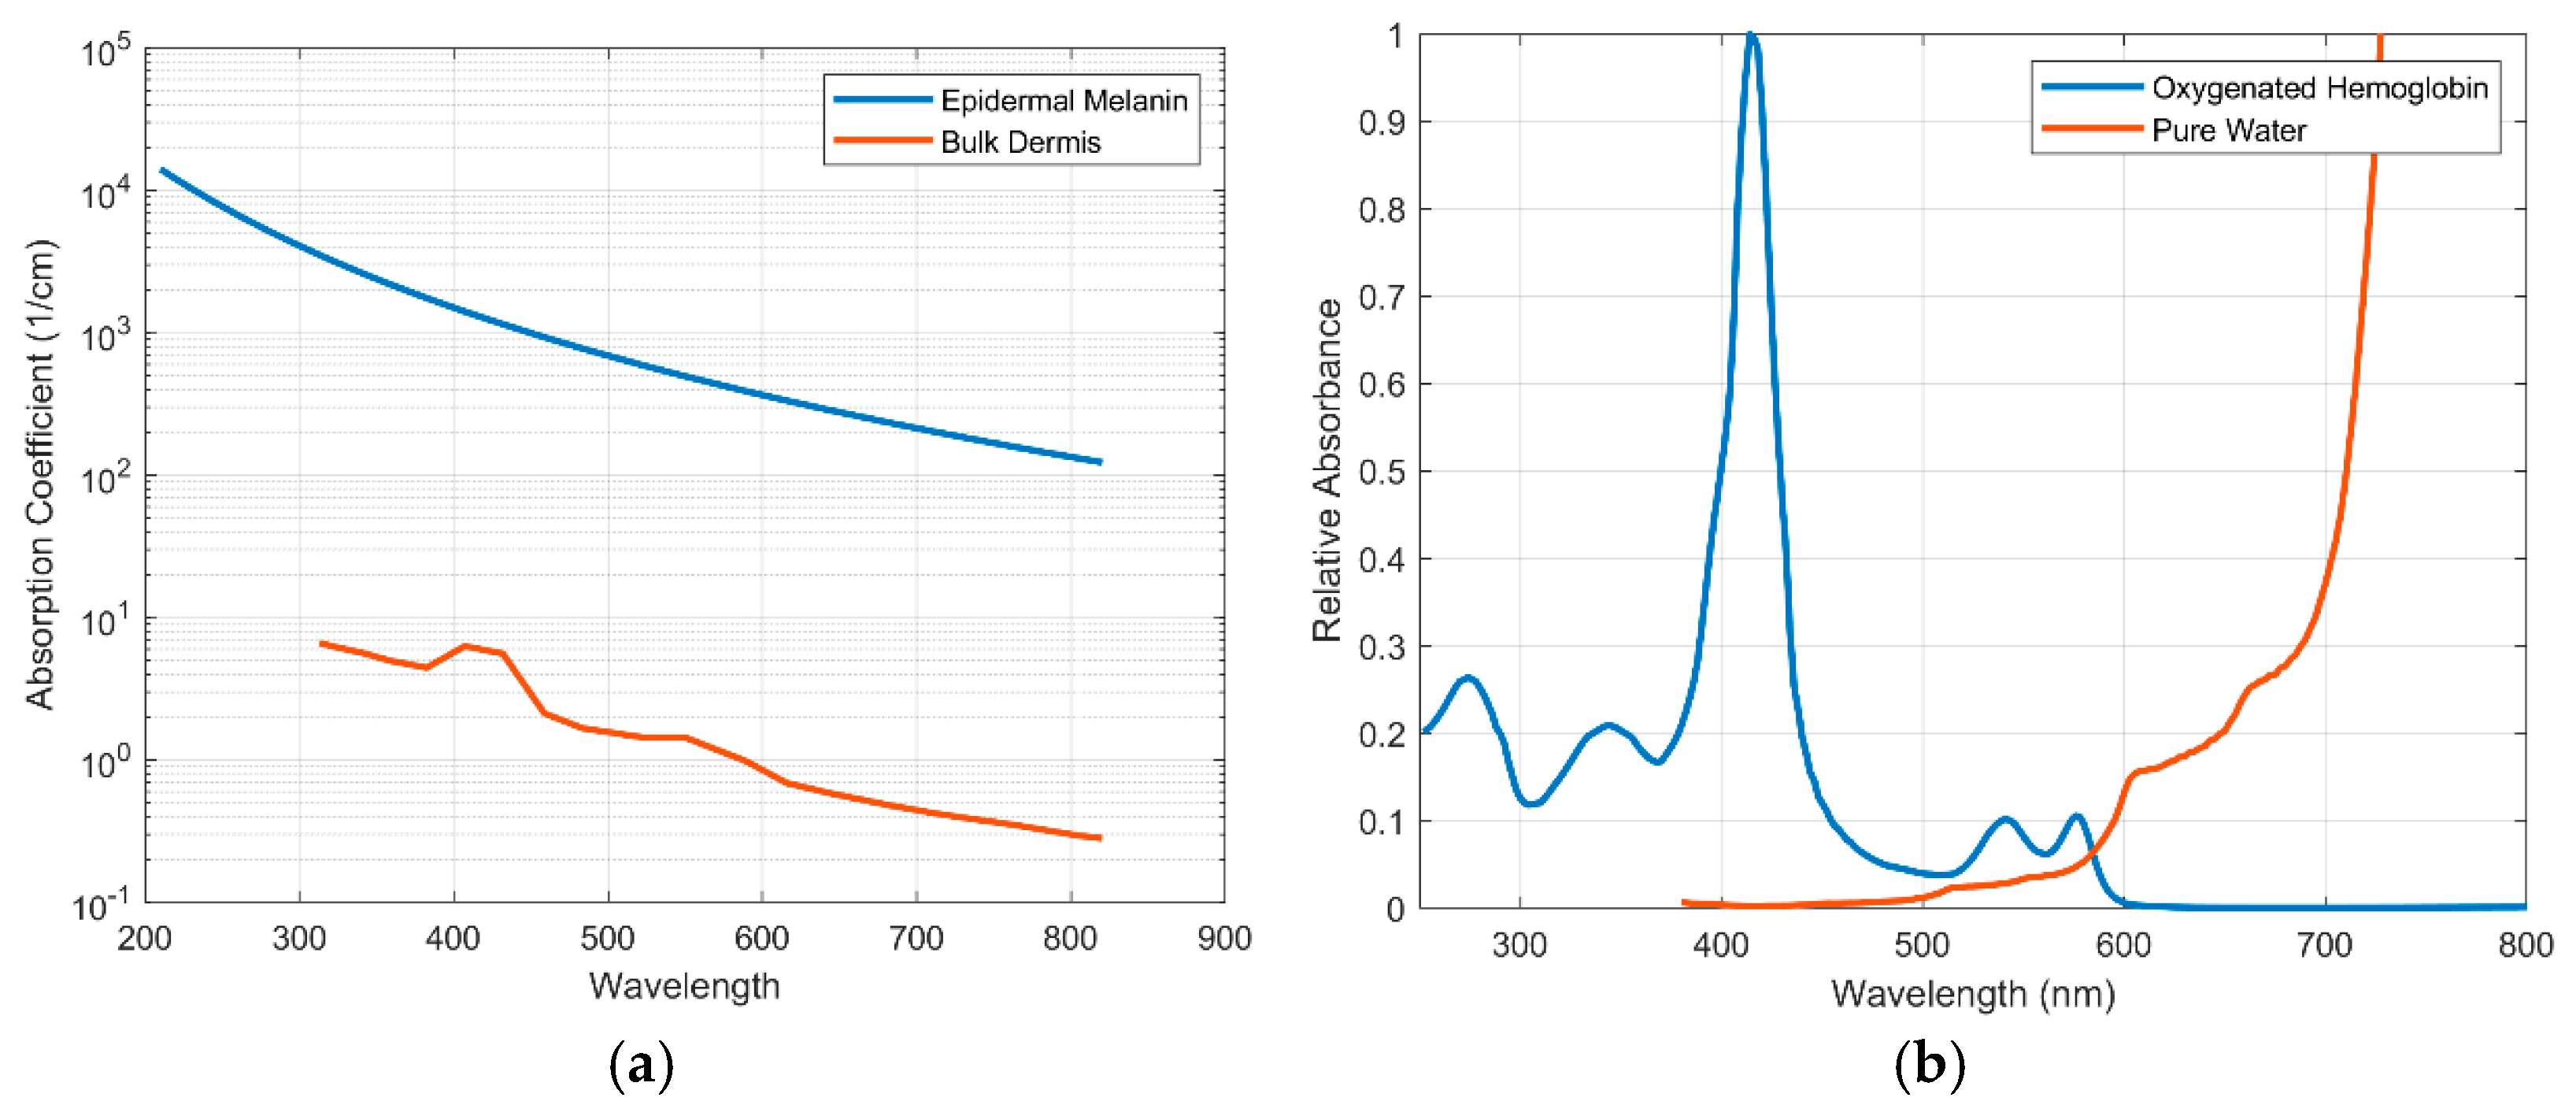
2.1. Skin Tone

2.2. Obesity
2.3. Age

| Parameter | Change as Age Increases | Relevant Work | Reference |
|---|---|---|---|
| Tissue Changes | |||
| Skin thickness | Decrease | Derraik et al., 2014 Van Mulder et al., 2017 Farage et al., 2013 | [70,80,93] |
| Artery compliance | Decrease | Knight et al., 2017 Allen et al., 2002 | [78,90] |
| Capillary Recruitment | Decrease | Leveque et al., 1984 | [94]. |
| PPG Changes | |||
| PWV | Increase | Cáceres et al., 2015 | [89] |
| PTT | Decrease | Allen et al., 2002 Monte-Moreno, 2011 | [91,92] |
| Systolic rising edge slope | Decrease | Allen et al., 2003 | [90] |
| Dicrotic notch shape | Decrease | Allen et al., 2003 | [90] |
| Systolic time | Decrease | Ahn et al., 2017 | [83] |
| Diastolic peak amplitude | Decrease | Ahn et al., 2017 | [83] |
| Inflection point area | Decrease | Ahn et al., 2017 | [83] |
| Reflection index | Increase | Ahn et al., 2017 | [83] |
| First Derivative Changes | |||
| TTW | Decrease | Cáceres et al., 2015 | [89] |
| Second Derivative Changes | |||
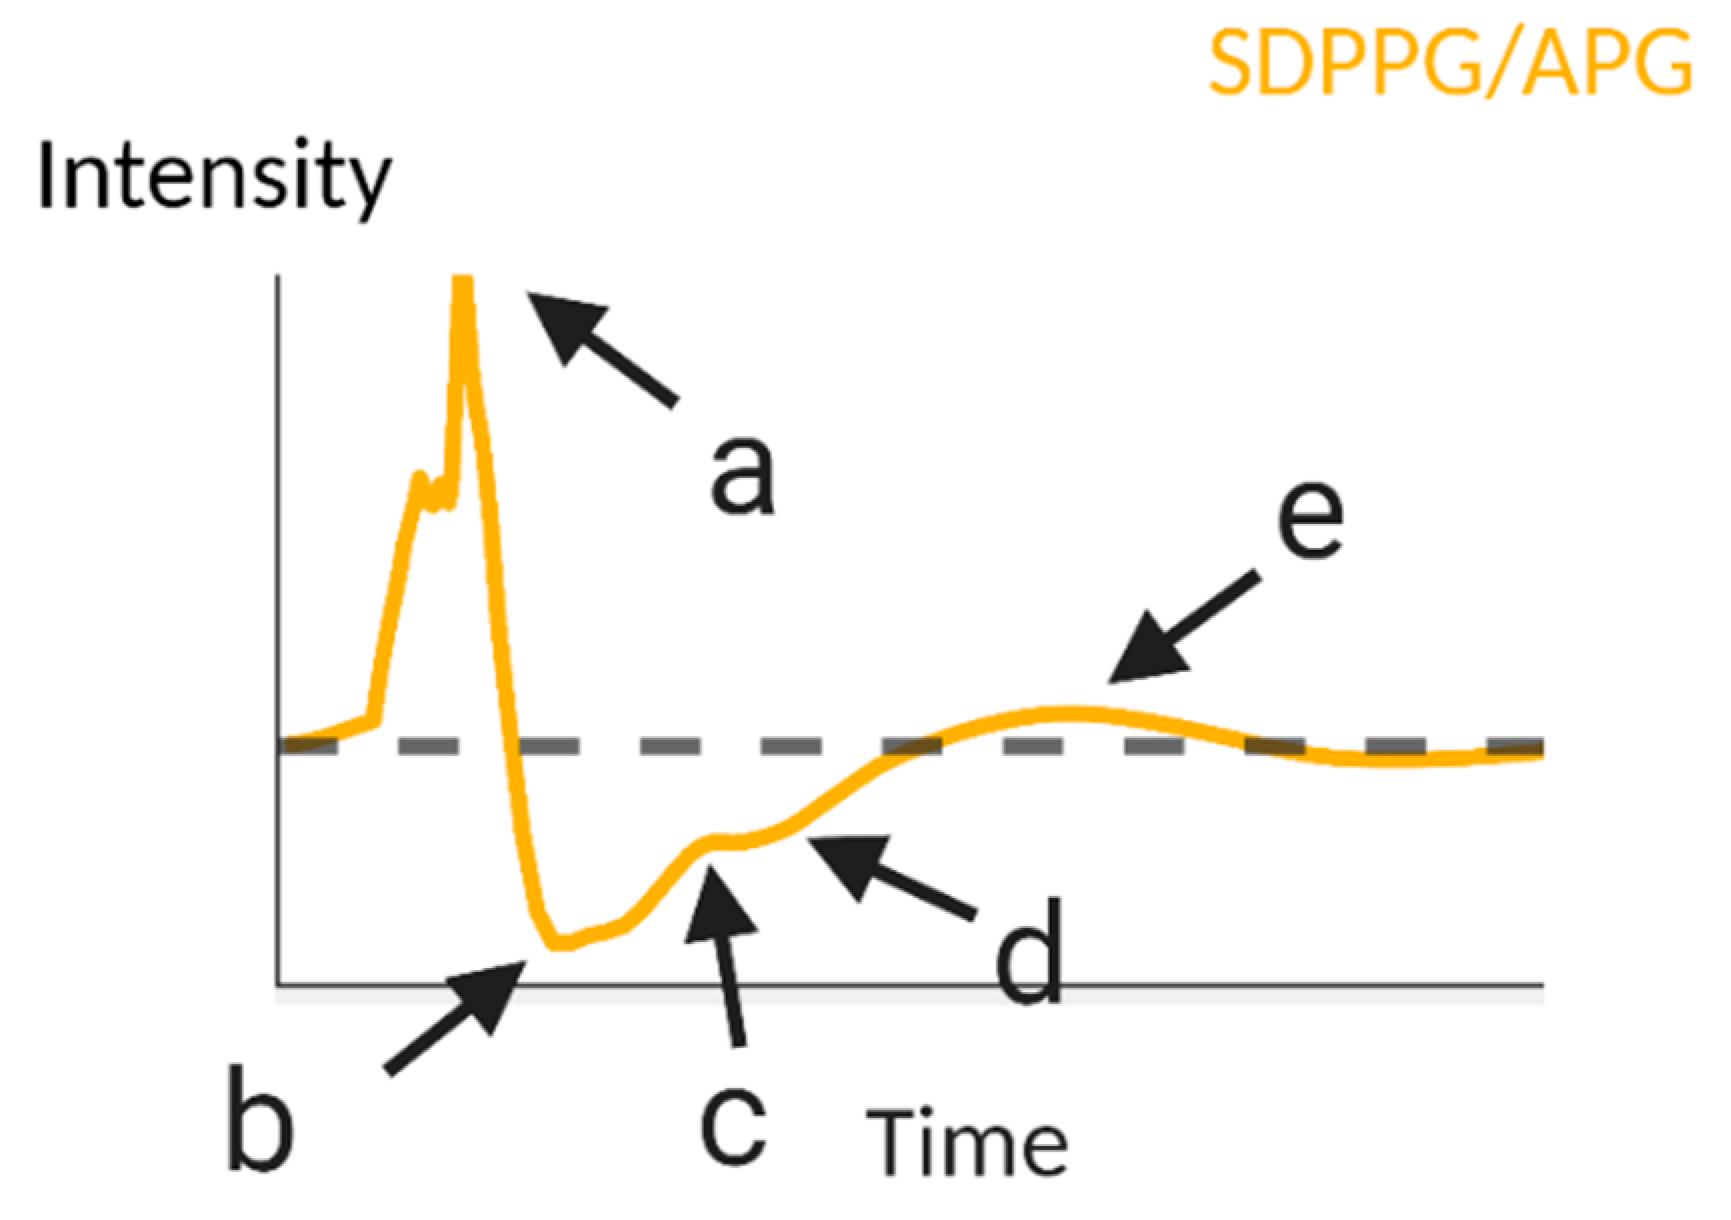
| Magnitude of c | Increase | Ahn et al., 2017 | [83] |
| Magnitude of d | Decrease | Ahn et al., 2017 | [83] |
| Slope of line between b and d | Increase | Ahn et al., 2017 | [83] |
| b/a | Increase | Ahn et al., 2017 | [83] |
| c/a | Decrease | Takazawa et al., 1998 Elgendi et al., 2012 | [29,59] |
| d/a | Decrease | Takazawa et al., 1998 Elgendi et al., 2012 | [29,59] |
| e/a | Decrease | Takazawa et al., 1998 Elgendi et al., 2012 | [29,59] |
2.4. Gender
3. Physiology
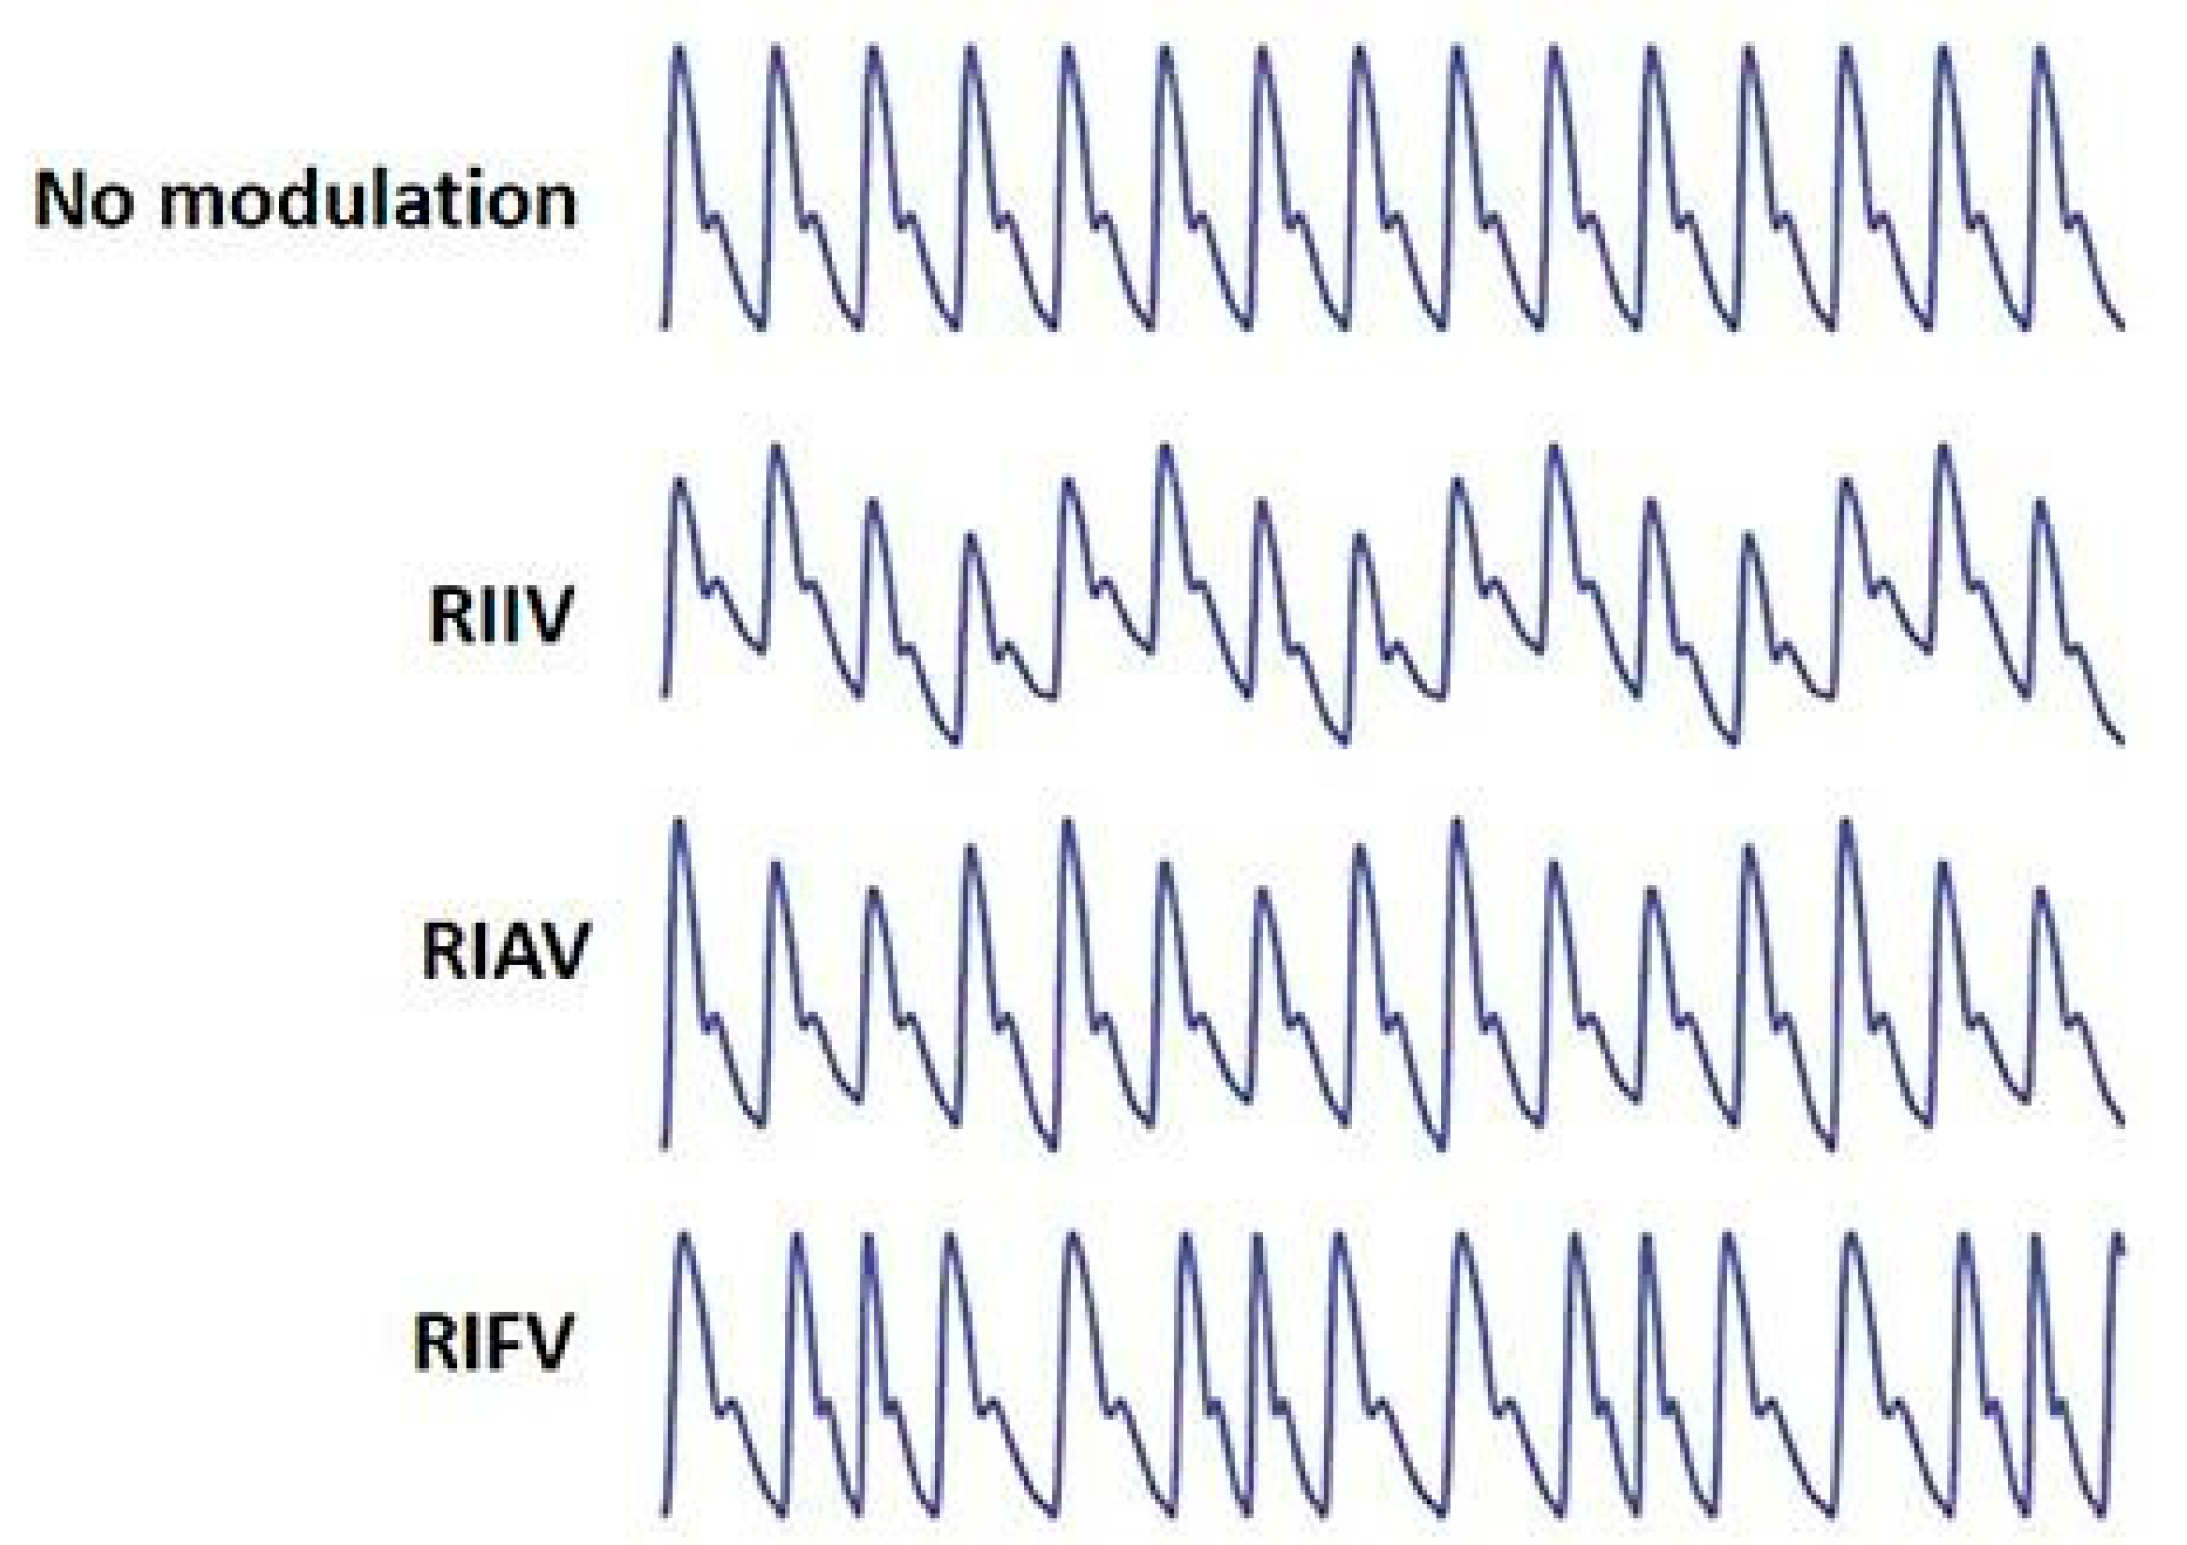
3.1. Respiration
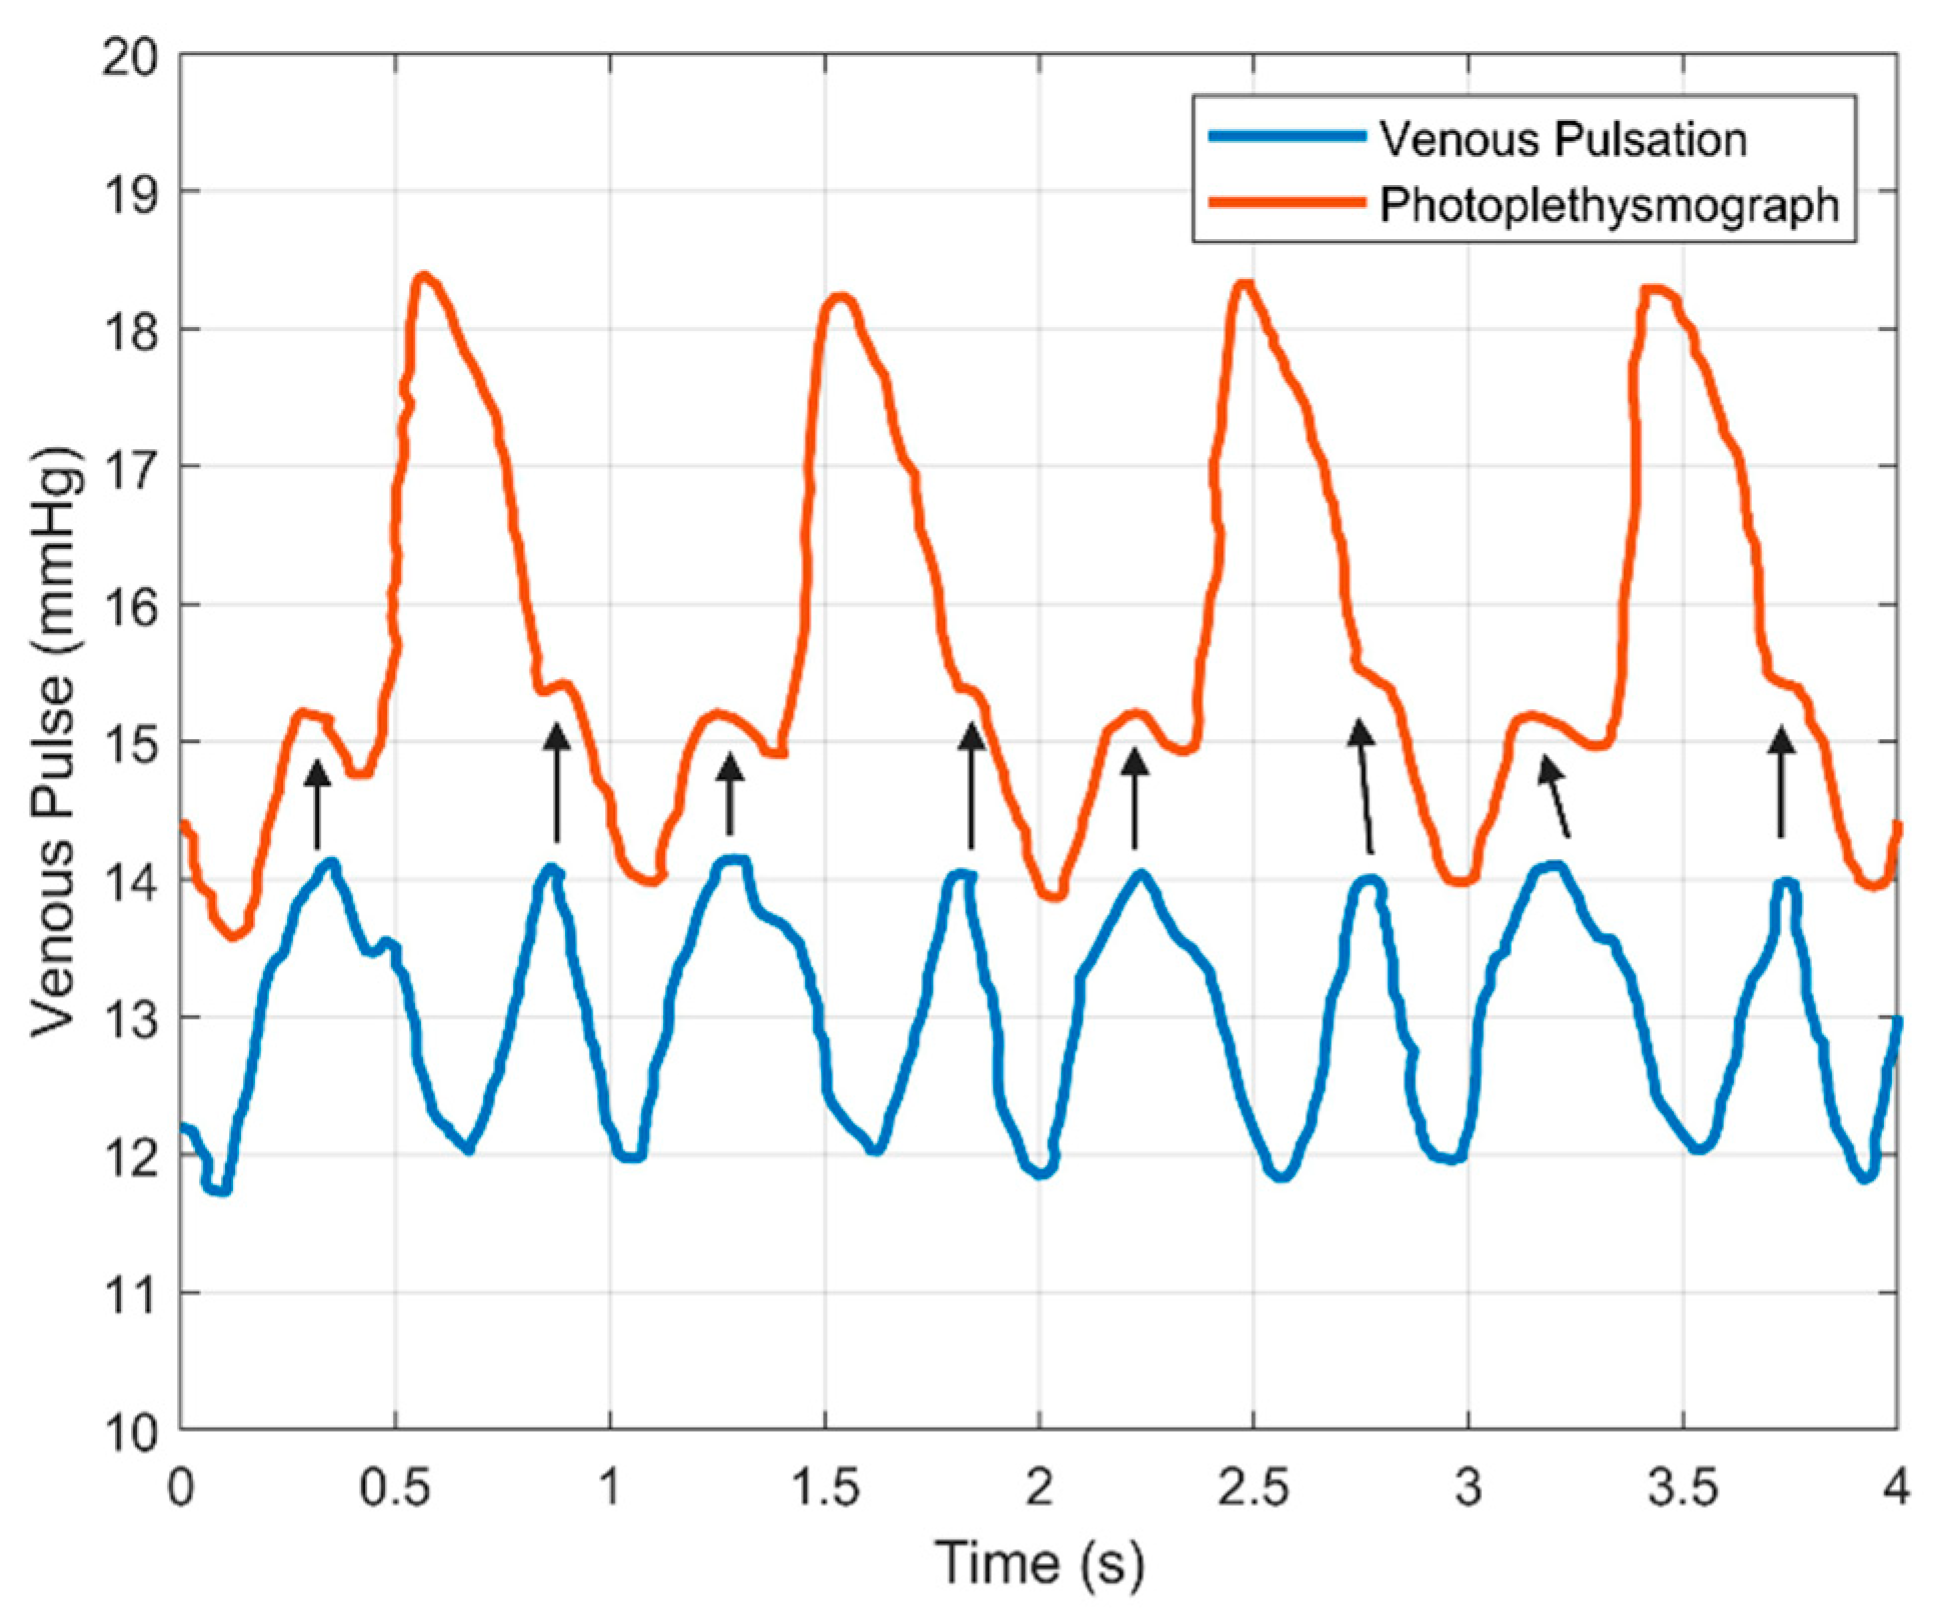
3.2. Venous Pulsations
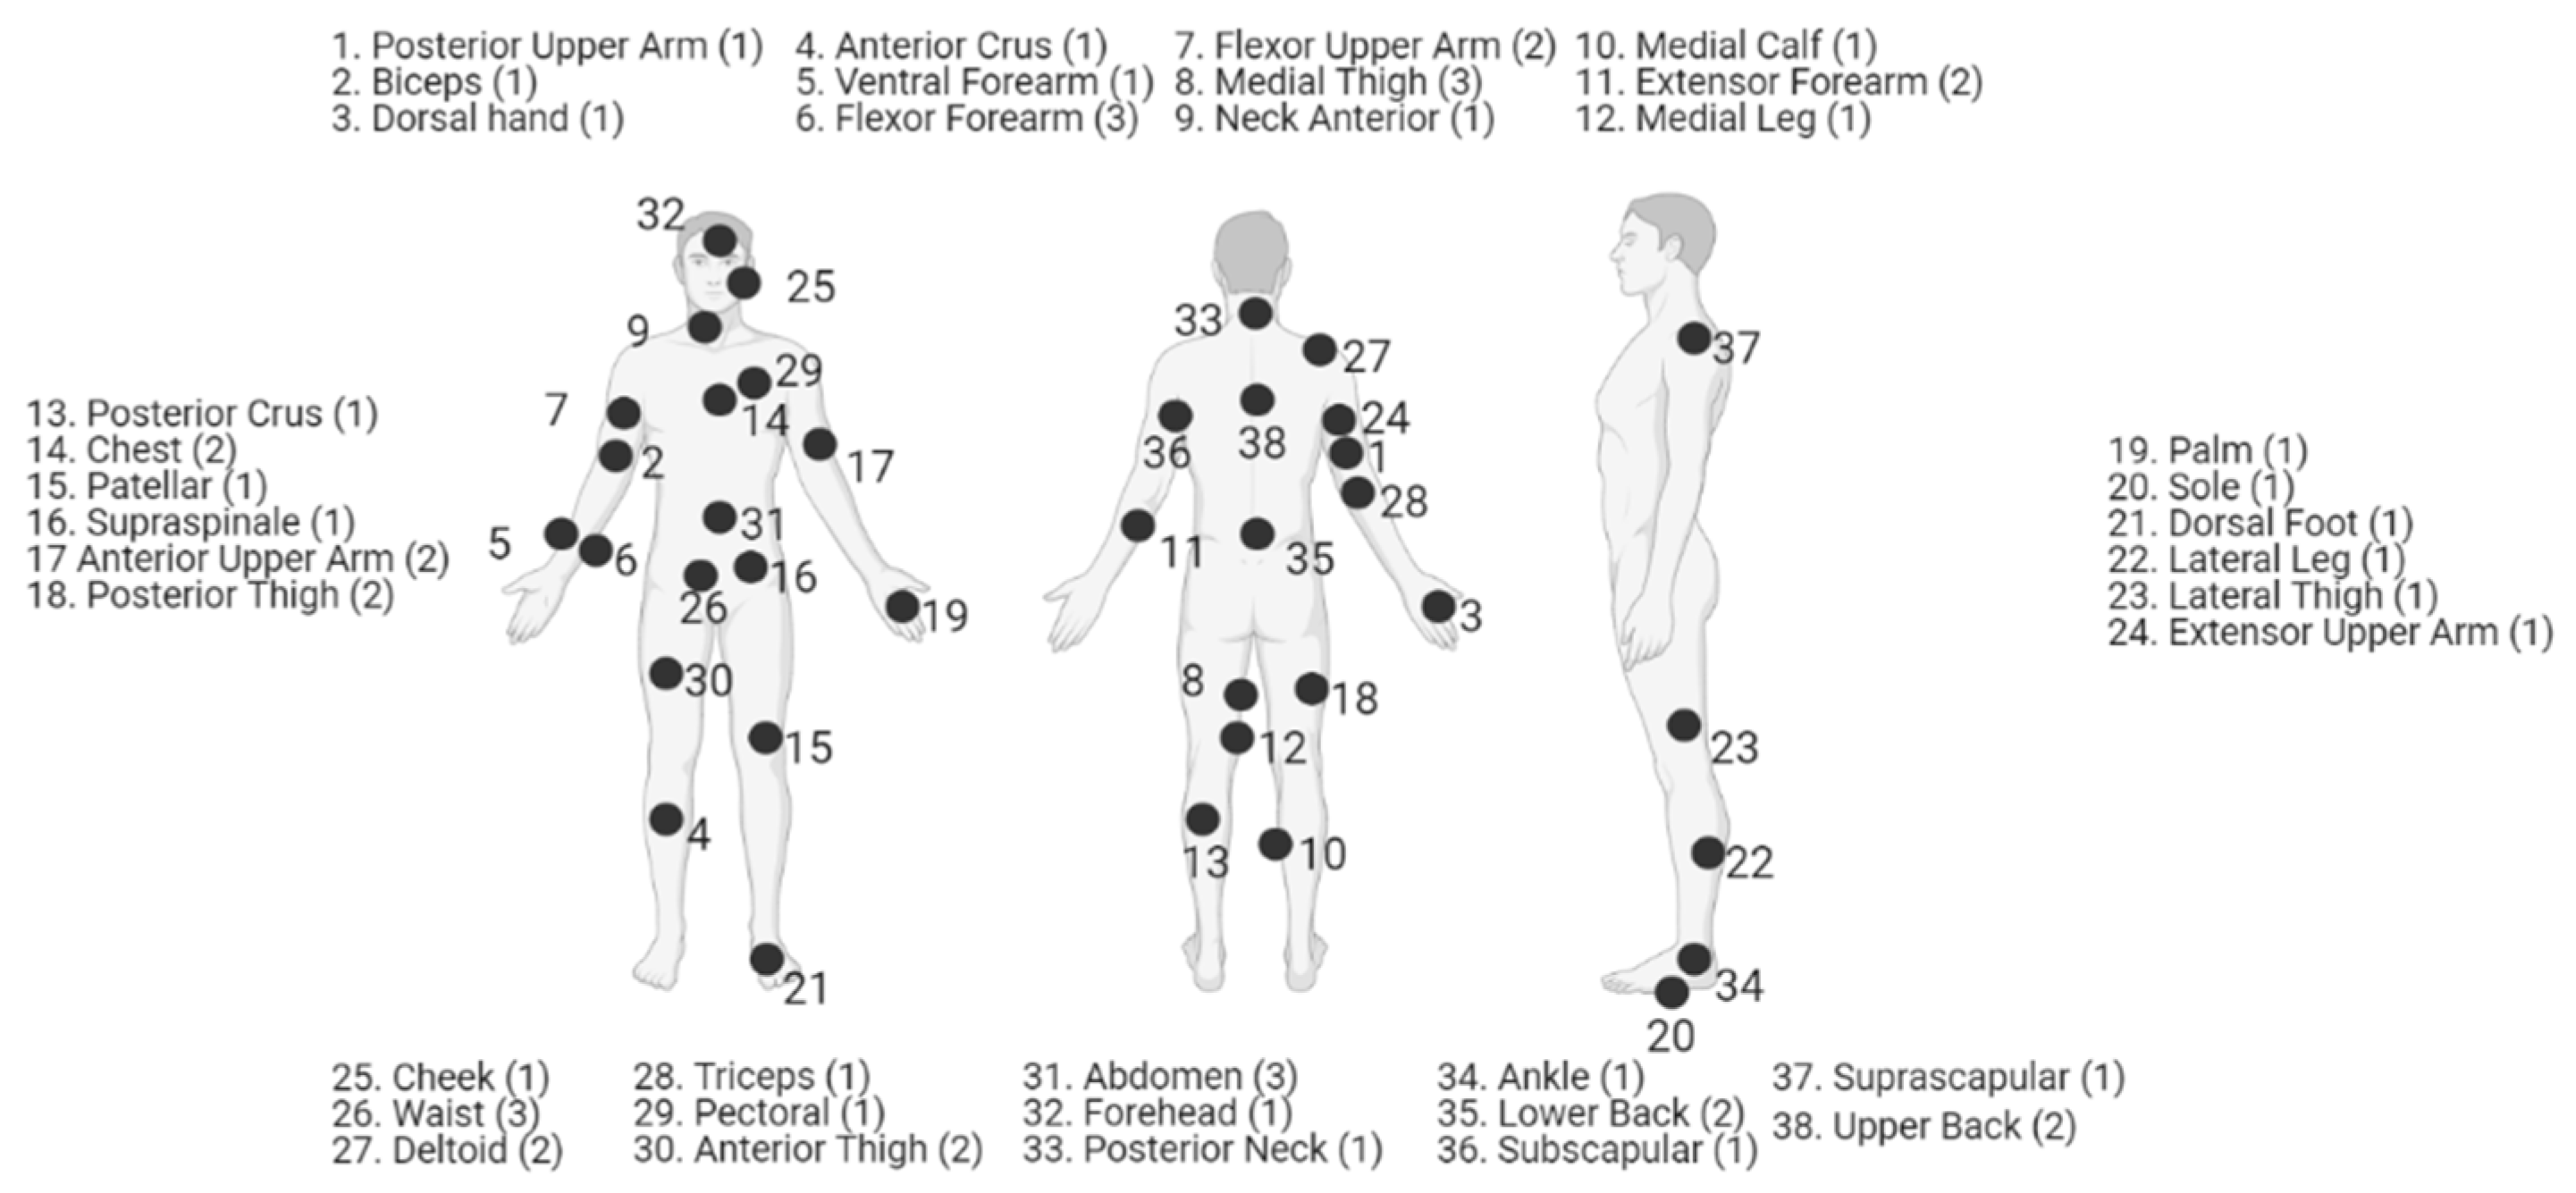
3.3. Body Site of Measurement
3.4. Local Body Temperature
4. External Factors
4.1. Motion Artifacts
4.2. Ambient Light
4.3. Applied Pressure to Measurement Site
5. Summary
Author Contributions
Funding
Institutional Review Board Statement
Informed Consent Statement
Conflicts of Interest
References
- Wilkoff, B.L.; Auricchio, A.; Brugada, J.; Cowie, M.; Ellenbogen, K.A.; Gillis, A.M.; Hayes, D.L.; Howlett, J.G.; Kautzner, J.; Love, C.J. HRS/EHRA expert consensus on the monitoring of cardiovascular implantable electronic devices (CIEDs): Description of techniques, indications, personnel, frequency and ethical considerations: Developed in partnership with the Heart Rhythm Society (HRS) and the European Heart Rhythm Association (EHRA); and in collaboration with the American College of Cardiology (ACC), the American Heart Association (AHA), the European Society of Cardiology (ESC), the Heart Failure Association of ESC (HFA), and the Heart Failure Society of America (HFSA). Endorsed by the Heart Rhythm Society, the European Heart Rhythm Association (a registered branch of the ESC), the American College of Cardiology, the American Heart Association. Europace 2008, 10, 707–725. [Google Scholar] [PubMed]
- Roger, V.L.; Go, A.S.; Lloyd-Jones, D.M.; Adams, R.J.; Berry, J.D.; Brown, T.M.; Carnethon, M.R.; Dai, S.; de Simone, G.; Ford, E.S. Heart disease and stroke statistics—2011 update: A report from the American Heart Association. Circulation 2011, 123, e18–e209. [Google Scholar] [CrossRef] [Green Version]
- Jencks, S.F.; Williams, M.V.; Coleman, E.A. Rehospitalizations among patients in the Medicare fee-for-service program. N. Engl. J. Med. 2009, 360, 1418–1428. [Google Scholar] [CrossRef]
- Burton, A.C.; Taylor, R. A study of the adjustment of peripheral vascular tone to the requirements of the regulation of body temperature. Am. J. Physiol. Leg. Content 1940, 129, 565–577. [Google Scholar] [CrossRef]
- Burton, A. The range and variability of the blood flow in the human fingers and the vasomotor regulation of body temperature. Am. J. Physiol. Leg. Content 1939, 127, 437–453. [Google Scholar] [CrossRef]
- Hertzman, A.B.; Roth, L.W. The vasomotor components in the vascular reactions in the finger to cold. Am. J. Physiol. Leg. Content 1942, 136, 669–679. [Google Scholar] [CrossRef]
- Hertzman, A.B.; Roth, L.W. The reactions of the digital artery and minute pad arteries to local cold. Am. J. Physiol. Leg. Content 1942, 136, 680–691. [Google Scholar] [CrossRef] [Green Version]
- Hertzman, A.B.; Flath, F. Continuous Simultaneous Registration of Sweating and Blood Flow in a Small Skin Area; Saint Louis University: St. Louis, MO, USA, 1963. [Google Scholar]
- Hertzman, A.B.; Dillon, J.B. Applications of photoelectric plethysmography in peripheral vascular disease. Am. Heart J. 1940, 20, 750–761. [Google Scholar] [CrossRef]
- Hertzman, A.B.; Roth, L.W. The absence of vasoconstrictor reflexes in the forehead circulation. Effects of cold. Am. J. Physiol. Leg. Content 1942, 136, 692–697. [Google Scholar] [CrossRef]
- Hyndman, B.; Kitney, R.; Sayers, B.M. Spontaneous rhythms in physiological control systems. Nature 1971, 233, 339–341. [Google Scholar] [CrossRef] [PubMed]
- Penáz, J.; Honzíková, N.; Fiser, B. Spectral analysis of resting variability of some circulatory parameters in man. Physiol. Bohemoslov. 1978, 27, 349–357. [Google Scholar] [PubMed]
- Harness, J.; Marjanovic, D. Low-frequency photoplethysmograph signals. Clin. Phys. Physiol. Meas. 1989, 10, 365. [Google Scholar] [CrossRef] [PubMed]
- Schultz-Ehrenburg, U.; Blazek, V. Value of quantitative photoplethysmography for functional vascular diagnostics. Skin Pharmacol. Physiol. 2001, 14, 316–323. [Google Scholar] [CrossRef] [PubMed]
- Lindberg, L.-G.; Oberg, P.A. Optical properties of blood in motion. Opt. Eng. 1993, 32, 253–257. [Google Scholar] [CrossRef]
- Kochanek, K.D.; Murphy, S.L.; Xu, J.; Arias, E. Deaths: Final data for 2017. Natl. Vital Stat. Rep. 2019, 68, 1–77. [Google Scholar]
- Elgendi, M.; Fletcher, R.; Liang, Y.; Howard, N.; Lovell, N.H.; Abbott, D.; Lim, K.; Ward, R. The use of photoplethysmography for assessing hypertension. NPJ Digit. Med. 2019, 2, 1–11. [Google Scholar] [CrossRef] [Green Version]
- Vakily, A.; Parsaei, H.; Movahhedi, M.; Sahmeddini, M. A system for continuous estimating and monitoring cardiac output via arterial waveform analysis. J. Biomed. Phys. Eng. 2017, 7, 181. [Google Scholar]
- Everything You Need to Know about Heart Disease. Available online: https://www.medicalnewstoday.com/articles/237191 (accessed on 6 August 2020).
- WHO. Cardiovascular Diseases (CVDs). Available online: https://www.who.int/news-room/fact-sheets/detail/cardiovascular-diseases-(cvds) (accessed on 6 August 2020).
- Heart Disease. Available online: https://www.mayoclinic.org/diseases-conditions/heart-disease/diagnosis-treatment/drc-20353124 (accessed on 6 August 2020).
- Castaneda, D.; Esparza, A.; Ghamari, M.; Soltanpur, C.; Nazeran, H. A review on wearable photoplethysmography sensors and their potential future applications in health care. Int. J. Biosens. Bioelectron. 2018, 4, 195–202. [Google Scholar] [PubMed] [Green Version]
- Nikolaou, K.; Alkadhi, H.; Bamberg, F.; Leschka, S.; Wintersperger, B.J. MRI and CT in the diagnosis of coronary artery disease: Indications and applications. Insights Imaging 2011, 2, 9–24. [Google Scholar] [CrossRef] [Green Version]
- Bansal, A.; Joshi, R. Portable out-of-hospital electrocardiography: A review of current technologies. J. Arrhythmia 2018, 34, 129–138. [Google Scholar] [CrossRef]
- Fujita, D.; Suzuki, A. Evaluation of the possible use of PPG waveform features measured at low sampling rate. IEEE Access 2019, 7, 58361–58367. [Google Scholar] [CrossRef]
- Rajala, S.; Lindholm, H.; Taipalus, T. Comparison of photoplethysmogram measured from wrist and finger and the effect of measurement location on pulse arrival time. Physiol. Meas. 2018, 39, 075010. [Google Scholar] [CrossRef] [PubMed]
- Uçar, M.K.; Bozkurt, M.R.; Bilgin, C.; Polat, K. Automatic sleep staging in obstructive sleep apnea patients using photoplethysmography, heart rate variability signal and machine learning techniques. Neural Comput. Appl. 2018, 29, 1–16. [Google Scholar] [CrossRef]
- Liang, Y.; Chen, Z.; Ward, R.; Elgendi, M. Hypertension assessment via ECG and PPG signals: An evaluation using MIMIC database. Diagnostics 2018, 8, 65. [Google Scholar] [CrossRef] [PubMed] [Green Version]
- Takazawa, K.; Tanaka, N.; Fujita, M.; Matsuoka, O.; Saiki, T.; Aikawa, M.; Tamura, S.; Ibukiyama, C. Assessment of vasoactive agents and vascular aging by the second derivative of photoplethysmogram waveform. Hypertension 1998, 32, 365–370. [Google Scholar] [CrossRef] [Green Version]
- Elgendi, M.; Liang, Y.; Ward, R. Toward generating more diagnostic features from photoplethysmogram waveforms. Diseases 2018, 6, 20. [Google Scholar] [CrossRef] [Green Version]
- Nabeel, P.; Karthik, S.; Joseph, J.; Sivaprakasam, M. Arterial blood pressure estimation from local pulse wave velocity using dual-element photoplethysmograph probe. IEEE Trans. Instrum. Meas. 2018, 67, 1399–1408. [Google Scholar] [CrossRef]
- Nabeel, P.; Karthik, S.; Joseph, J.; Sivaprakasam, M. Experimental validation of dual PPG local pulse wave velocity probe. In Proceedings of the 2017 IEEE International Symposium on Medical Measurements and Applications (MeMeA), Rochester, MN, USA, 8–10 May 2017; pp. 408–413. [Google Scholar]
- Ramella-Roman, J.C. Design of wearable devices for diverse populations (Conference Presentation). In Proceedings of the Optics and Biophotonics in Low-Resource Settings VI, San Francisco, CA, USA, 1–6 February 2020; p. 112300O. [Google Scholar]
- Colvonen, P.J.; DeYoung, P.N.; Bosompra, N.-O.A.; Owens, R.L. Limiting Racial Disparities and Bias for Wearable Devices in Health Science Research; Oxford University Press US: New York, NY, USA, 2020. [Google Scholar]
- Hidalgo, D.C.; Olusanya, O.; Harlan, E. Critical care trainees call for pulse oximetry reform. Lancet Respir. Med. 2021, 9, e37. [Google Scholar] [CrossRef]
- Boonya-Ananta, T.; Rodriguez, A.J.; Ajmal, A.; Du Le, V.N.; Hansen, A.K.; Hutcheson, J.D.; Ramella-Roman, J.C. Synthetic Photoplethysmography (PPG) of the radial artery through parallelized Monte Carlo and its correlation to Body Mass Index (BMI). Sci. Rep. 2021, 11, 2570. [Google Scholar] [CrossRef]
- Fitzpatrick, T.B. The validity and practicality of sun-reactive skin types I through VI. Arch. Dermatol. 1988, 124, 869–871. [Google Scholar] [CrossRef]
- Thody, A.J.; Higgins, E.M.; Wakamatsu, K.; Ito, S.; Burchill, S.A.; Marks, J.M. Pheomelanin as well as eumelanin is present in human epidermis. J. Investig. Dermatol. 1991, 97, 340–344. [Google Scholar] [CrossRef] [Green Version]
- D’Orazio, J.; Jarrett, S.; Amaro-Ortiz, A.; Scott, T. UV radiation and the skin. Int. J. Mol. Sci. 2013, 14, 12222–12248. [Google Scholar] [CrossRef] [PubMed] [Green Version]
- Preejith, S.; Alex, A.; Joseph, J.; Sivaprakasam, M. Design, development and clinical validation of a wrist-based optical heart rate monitor. In Proceedings of the 2016 IEEE International Symposium on Medical Measurements and Applications (MeMeA), Benevento, Italy, 12–14 May 2016; pp. 1–6. [Google Scholar]
- Hermand, E.; Cassirame, J.; Ennequin, G.; Hue, O. Validation of a photoplethysmographic heart rate monitor: Polar OH1. Int. J. Sports Med. 2019, 40, 462–467. [Google Scholar] [CrossRef] [PubMed]
- Wang, W.; den Brinker, A.C.; Stuijk, S.; de Haan, G. Algorithmic principles of remote PPG. IEEE Trans. Biomed. Eng. 2016, 64, 1479–1491. [Google Scholar] [CrossRef] [Green Version]
- De Haan, G.; Jeanne, V. Robust pulse rate from chrominance-based rPPG. IEEE Trans. Biomed. Eng. 2013, 60, 2878–2886. [Google Scholar] [CrossRef]
- Shao, D.; Tsow, F.; Liu, C.; Yang, Y.; Tao, N. Simultaneous monitoring of ballistocardiogram and photoplethysmogram using a camera. IEEE Trans. Biomed. Eng. 2016, 64, 1003–1010. [Google Scholar] [CrossRef] [Green Version]
- Addison, P.S.; Jacquel, D.; Foo, D.M.; Borg, U.R. Video-based heart rate monitoring across a range of skin pigmentations during an acute hypoxic challenge. J. Clin. Monit. Comput. 2018, 32, 871–880. [Google Scholar] [CrossRef] [PubMed] [Green Version]
- Bent, B.; Goldstein, B.A.; Kibbe, W.A.; Dunn, J.P. Investigating sources of inaccuracy in wearable optical heart rate sensors. NPJ Digit. Med. 2020, 3, 1–9. [Google Scholar] [CrossRef] [Green Version]
- Jacques, S.L. Skin Optics. Available online: https://omlc.org/news/jan98/skinoptics.html#:~:text=2.-,Dermis,volume%20fraction%20of%20blood%20(f (accessed on 6 August 2020).
- Jacques, S.L. Optical properties of biological tissues: A review. Phys. Med. Biol. 2013, 58, R37. [Google Scholar] [CrossRef]
- Prahl, S. Optical Absorption of Hemoglobin. 1999. Available online: http://omlc.ogi.edu/spectra/hemoglobin (accessed on 6 August 2020).
- Pope, R.M.; Fry, E.S. Absorption spectrum (380–700 nm) of pure water. II. Integrating cavity measurements. Appl. Opt. 1997, 36, 8710–8723. [Google Scholar] [CrossRef]
- Mohapatra, P.; Preejith, S.; Sivaprakasam, M. A novel sensor for wrist based optical heart rate monitor. In Proceedings of the 2017 IEEE International Instrumentation and Measurement Technology Conference (I2MTC), Torino, Italy, 22–25 May 2017; pp. 1–6. [Google Scholar]
- Fallow, B.A.; Tarumi, T.; Tanaka, H. Influence of skin type and wavelength on light wave reflectance. J. Clin. Monit. Comput. 2013, 27, 313–317. [Google Scholar] [CrossRef] [PubMed] [Green Version]
- Mendelson, Y.; Ochs, B.D. Noninvasive pulse oximetry utilizing skin reflectance photoplethysmography. IEEE Trans. Biomed. Eng. 1988, 35, 798–805. [Google Scholar] [CrossRef] [PubMed]
- Fine, J.; Boonya-ananta, T.; Rodriguez, A.; Ramella-Roman, J.C.; McShane, M.; Cote, G.L. Parallelized multi-layered Monte Carlo model for evaluation of a proximal phalanx photoplethysmograph. In Proceedings of the Optical Diagnostics and Sensing XX: Toward Point-of-Care Diagnostics, San Francisco, CA, USA, 3 February 2020; p. 1124702. [Google Scholar]
- Chatterjee, S.; Kyriacou, P.A. Monte Carlo analysis of optical interactions in reflectance and transmittance finger photoplethysmography. Sensors 2019, 19, 789. [Google Scholar] [CrossRef] [Green Version]
- Gibney, M.A.; Arce, C.H.; Byron, K.J.; Hirsch, L.J. Skin and subcutaneous adipose layer thickness in adults with diabetes at sites used for insulin injections: Implications for needle length recommendations. Curr. Med. Res. Opin. 2010, 26, 1519–1530. [Google Scholar] [CrossRef]
- Poirier, P.; Giles, T.D.; Bray, G.A.; Hong, Y.; Stern, J.S.; Pi-Sunyer, F.X.; Eckel, R.H. Obesity and cardiovascular disease: Pathophysiology, evaluation, and effect of weight loss: An update of the 1997 American Heart Association Scientific Statement on Obesity and Heart Disease from the Obesity Committee of the Council on Nutrition, Physical Activity, and Metabolism. Circulation 2006, 113, 898–918. [Google Scholar]
- Nuttall, F.Q. Body mass index: Obesity, BMI, and health: A critical review. Nutr. Today 2015, 50, 117. [Google Scholar] [CrossRef] [Green Version]
- Elgendi, M. On the analysis of fingertip photoplethysmogram signals. Curr. Cardiol. Rev. 2012, 8, 14–25. [Google Scholar] [CrossRef]
- Iacopi, E.; Riitano, N.; Dini, V.; Berta, R.; Pieruzzi, L.; Janowska, A.; Anselmino, M.; Piaggesi, A.; Romanelli, M. Using Skin Bioengineering to Highlight How Weight and Diabetes Mellitus Modify the Skin in the Lower Limbs of Super-Obese Patients. Diabetes Metab. Syndr. Obes. Targets Ther. 2020, 13, 729. [Google Scholar] [CrossRef] [Green Version]
- Chin, L.-C.; Huang, T.-Y.; Yu, C.-L.; Wu, C.-H.; Hsu, C.-C.; Yu, H.-S. Increased cutaneous blood flow but impaired post-ischemic response of nutritional flow in obese children. Atherosclerosis 1999, 146, 179–185. [Google Scholar] [CrossRef]
- Francischetti, E.A.; Tibirica, E.; da Silva, E.G.; Rodrigues, E.; Celoria, B.M.; de Abreu, V.G. Skin capillary density and microvascular reactivity in obese subjects with and without metabolic syndrome. Microvasc. Res. 2011, 81, 325–330. [Google Scholar] [CrossRef] [PubMed]
- Czernichow, S.; Greenfield, J.R.; Galan, P.; Bastard, J.-P.; Charnaux, N.; Samaras, K.; Safar, M.E.; Blacher, J.; Hercberg, S.; Levy, B.I. Microvascular dysfunction in healthy insulin-sensitive overweight individuals. J. Hypertens. 2010, 28, 325–332. [Google Scholar] [CrossRef]
- Debbabi, H.; Uzan, L.; Mourad, J.J.; Safar, M.; Levy, B.I.; Tibiriçà, E. Increased skin capillary density in treated essential hypertensive patients. Am. J. Hypertens. 2006, 19, 477–483. [Google Scholar] [CrossRef] [Green Version]
- De Jongh, R.T.; Serné, E.H.; Ijzerman, R.G.; de Vries, G.; Stehouwer, C.D. Impaired microvascular function in obesity: Implications for obesity-associated microangiopathy, hypertension, and insulin resistance. Circulation 2004, 109, 2529–2535. [Google Scholar] [CrossRef] [PubMed] [Green Version]
- Kapur, V.K.; Wilsdon, A.G.; Au, D.; Avdalovic, M.; Enright, P.; Fan, V.S.; Hansel, N.N.; Heckbert, S.R.; Jiang, R.; Krishnan, J.A. Obesity is associated with a lower resting oxygen saturation in the ambulatory elderly: Results from the cardiovascular health study. Respir. Care 2013, 58, 831–837. [Google Scholar] [CrossRef] [PubMed] [Green Version]
- Petrofsky, J.S.; Laymon, M.S.; Khowailed, I.A.; Fisher, S.; Mills, A. The effect of BMI on oxygen saturation at rest and during mild walking. J. Appl. Med. Sci. 2015, 4, 1–8. [Google Scholar]
- Tamura, T. Current progress of photoplethysmography and SPO 2 for health monitoring. Biomed. Eng. Lett. 2019, 9, 21–36. [Google Scholar] [CrossRef] [PubMed]
- Rodrigues, L.M.M.; Palma, L.; Santos, O.; Almeida, M.A.; Bujan, J.; Tavares, L. Excessive weight favours skin physiology-up to a point: Another expression of the obesity paradox. Skin Pharmacol. Physiol. 2017, 30, 94–101. [Google Scholar] [CrossRef]
- Derraik, J.G.; Rademaker, M.; Cutfield, W.S.; Pinto, T.E.; Tregurtha, S.; Faherty, A.; Peart, J.M.; Drury, P.L.; Hofman, P.L. Effects of age, gender, BMI, and anatomical site on skin thickness in children and adults with diabetes. PLoS ONE 2014, 9, e86637. [Google Scholar] [CrossRef]
- Limberg, J.K.; Morgan, B.J.; Schrage, W.G. Peripheral Blood Flow Regulation in Human Obesity and Metabolic Syndrome. Exerc. Sport Sci. Rev. 2016, 44, 116–122. [Google Scholar] [CrossRef]
- Altintas, A.A.; Aust, M.C.; Krämer, R.; Vogt, P.M.; Altintas, M.A. In vivo reflectance-mode confocal microscopy assessments: Impact of overweight on human skin microcirculation and histomorphology. J. Biomed. Opt. 2016, 21, 036009. [Google Scholar] [CrossRef] [Green Version]
- Littleton, S.W.; Tulaimat, A. The effects of obesity on lung volumes and oxygenation. Respir. Med. 2017, 124, 15–20. [Google Scholar] [CrossRef] [Green Version]
- Hirt, P.A.; Castillo, D.E.; Yosipovitch, G.; Keri, J.E. Skin changes in the obese patient. J. Am. Acad. Dermatol. 2019, 81, 1037–1057. [Google Scholar] [CrossRef]
- Liang, Y.; Chen, Z.; Liu, G.; Elgendi, M. A new, short-recorded photoplethysmogram dataset for blood pressure monitoring in China. Sci. Data 2018, 5, 1–7. [Google Scholar] [CrossRef] [Green Version]
- Ferdinando, H.; Huotari, M.; Myllylä, T. Photoplethysmography signal analysis to assess obesity, age group and hypertension. In Proceedings of the 2019 41st Annual International Conference of the IEEE Engineering in Medicine and Biology Society (EMBC), Berlin, Germany, 23–27 July 2019; pp. 5572–5575. [Google Scholar]
- Black, M.M.; Bottoms, E.; Shuster, S. Skin collagen and thickness in simple obesity. Br. Med. J. 1971, 4, 149–150. [Google Scholar] [CrossRef] [PubMed] [Green Version]
- Knight, J.; Nigam, Y. Anatomy and physiology of ageing 1: The cardiovascular system. Nurs. Times 2017, 113, 22–24. [Google Scholar]
- Bolton, E.; Rajkumar, C. The ageing cardiovascular system. Rev. Clin. Gerontol. 2011, 21, 99. [Google Scholar] [CrossRef]
- Van Mulder, T.; de Koeijer, M.; Theeten, H.; Willems, D.; van Damme, P.; Demolder, M.; de Meyer, G.; Beyers, K.; Vankerckhoven, V. High frequency ultrasound to assess skin thickness in healthy adults. Vaccine 2017, 35, 1810–1815. [Google Scholar] [CrossRef] [PubMed]
- Laurent, A.; Mistretta, F.; Bottigioli, D.; Dahel, K.; Goujon, C.; Nicolas, J.F.; Hennino, A.; Laurent, P.E. Echographic measurement of skin thickness in adults by high frequency ultrasound to assess the appropriate microneedle length for intradermal delivery of vaccines. Vaccine 2007, 25, 6423–6430. [Google Scholar] [CrossRef]
- Firooz, A.; Rajabi-Estarabadi, A.; Zartab, H.; Pazhohi, N.; Fanian, F.; Janani, L. The influence of gender and age on the thickness and echo-density of skin. Skin Res. Technol. 2017, 23, 13–20. [Google Scholar] [CrossRef]
- Ahn, J.M. New aging index using signal features of both photoplethysmograms and acceleration plethysmograms. Healthc. Inform. Res. 2017, 23, 53–59. [Google Scholar] [CrossRef] [PubMed] [Green Version]
- Benjamin, E.J.; Wolf, P.A.; D’Agostino, R.B.; Silbershatz, H.; Kannel, W.B.; Levy, D. Impact of atrial fibrillation on the risk of death: The Framingham Heart Study. Circulation 1998, 98, 946–952. [Google Scholar] [CrossRef] [Green Version]
- D’agostino, R.B.; Vasan, R.S.; Pencina, M.J.; Wolf, P.A.; Cobain, M.; Massaro, J.M.; Kannel, W.B. General cardiovascular risk profile for use in primary care. Circulation 2008, 117, 743–753. [Google Scholar] [CrossRef] [PubMed] [Green Version]
- Dutt, D.N.; Shruthi, S. Digital processing of ECG and PPG signals for study of arterial parameters for cardiovascular risk assessment. In Proceedings of the 2015 International Conference on Communications and Signal Processing (ICCSP), Chengdu, China, 10–11 October 2015; pp. 1506–1510. [Google Scholar]
- Jayasree, V.; Sandhya, T.; Radhakrishnan, P. Non-invasive studies on age related parameters using a blood volume pulse sensor. Meas. Sci. Rev. 2008, 8, 82–86. [Google Scholar] [CrossRef] [Green Version]
- Yousef, Q.; Reaz, M.; Ali, M.A.M. The analysis of PPG morphology: Investigating the effects of aging on arterial compliance. Meas. Sci. Rev. 2012, 12, 266–271. [Google Scholar] [CrossRef] [Green Version]
- Cáceres, J.L.H.; Hasan, E.S. A New First-Derivative Related Index to Assess Pulse Wave Transit Time from a Photoplethysmographic Waveform: Age Dependence and Agreement with Normative Data. Int. J. Bioinform. Biomed. Eng. 2015, 1, 276–283. [Google Scholar]
- Allen, J.; Murray, A. Age-related changes in the characteristics of the photoplethysmographic pulse shape at various body sites. Physiol. Meas. 2003, 24, 297. [Google Scholar] [CrossRef]
- Allen, J.; Murray, A. Age-related changes in peripheral pulse timing characteristics at the ears, fingers and toes. J. Hum. Hypertens. 2002, 16, 711–717. [Google Scholar] [CrossRef] [Green Version]
- Monte-Moreno, E. Non-invasive estimate of blood glucose and blood pressure from a photoplethysmograph by means of machine learning techniques. Artif. Intell. Med. 2011, 53, 127–138. [Google Scholar] [CrossRef]
- Farage, M.A.; Miller, K.W.; Elsner, P.; Maibach, H.I. Characteristics of the aging skin. Adv. Wound Care 2013, 2, 5–10. [Google Scholar] [CrossRef] [Green Version]
- Leveque, J.; Corcuff, P.; de Rigal, J.; Agache, P. In vivo studies of the evolution of physical properties of the human skin with age. Int. J. Dermatol. 1984, 23, 322. [Google Scholar] [CrossRef]
- Hartmann, V.; Liu, H.; Chen, F.; Qiu, Q.; Hughes, S.; Zheng, D. Quantitative comparison of photoplethysmographic waveform characteristics: Effect of measurement site. Front. Physiol. 2019, 10, 198. [Google Scholar] [CrossRef]
- Suzuki, S.; Oguri, K. Cuffless blood pressure estimation by error-correcting output coding method based on an aggregation of adaboost with a photoplethysmograph sensor. In Proceedings of the 2009 Annual International Conference of the IEEE Engineering in Medicine and Biology Society, Hilton Minneapolis, MI, USA, 2–6 September 2009; pp. 6765–6768. [Google Scholar]
- Dao, H., Jr.; Kazin, R.A. Gender differences in skin: A review of the literature. Gend. Med. 2007, 4, 308–328. [Google Scholar] [CrossRef]
- Phuong, C.; Maibach, H.I. Gender differences in skin. J. Textb. Aging Skin 2016, 1729–1755. [Google Scholar] [CrossRef]
- Proctor, D.N.; Beck, K.C.; Shen, P.H.; Eickhoff, T.J.; Halliwill, J.R.; Joyner, M.J. Influence of age and gender on cardiac output-V o 2 relationships during submaximal cycle ergometry. J. Appl. Physiol. 1998. [Google Scholar] [CrossRef] [Green Version]
- Prabhavathi, K.; Selvi, K.T.; Poornima, K.; Sarvanan, A. Role of biological sex in normal cardiac function and in its disease outcome—A review. J. Clin. Diagn. Res. JCDR 2014, 8, BE01. [Google Scholar] [CrossRef] [PubMed]
- Reckelhoff, J.F. Gender differences in the regulation of blood pressure. Hypertension 2001, 37, 1199–1208. [Google Scholar] [CrossRef] [Green Version]
- Joannides, R.; Costentin, A.; Iacob, M.; Compagnon, P.; Lahary, A.S.; Thuillez, C. Influence of vascular dimension on gender difference in flow-dependent dilatation of peripheral conduit arteries. Am. J. Physiol. Heart Circ. Physiol. 2002, 282, H1262–H1269. [Google Scholar] [CrossRef] [PubMed] [Green Version]
- Shuster, S.; Black, M.M.; McVitie, E. The influence of age and sex on skin thickness, skin collagen and density. Br. J. Dermatol. 1975, 93, 639–643. [Google Scholar] [CrossRef]
- Ahimastos, A.A.; Formosa, M.; Dart, A.M.; Kingwell, B.A. Gender differences in large artery stiffness pre-and post puberty. J. Clin. Endocrinol. Metab. 2003, 88, 5375–5380. [Google Scholar] [CrossRef]
- Dehghanojamahalleh, S.; Kaya, M. Sex-Related Differences in Photoplethysmography Signals Measured From Finger and Toe. IEEE J. Transl. Eng. Health Med. 2019, 7, 1–7. [Google Scholar] [CrossRef]
- Mukkamala, R.; Hahn, J.-O.; Inan, O.T.; Mestha, L.K.; Kim, C.-S.; Töreyin, H.; Kyal, S. Toward ubiquitous blood pressure monitoring via pulse transit time: Theory and practice. IEEE Trans. Biomed. Eng. 2015, 62, 1879–1901. [Google Scholar] [CrossRef] [Green Version]
- Guajardo, I.; Ayer, A.; Johnson, A.D.; Ganz, P.; Mills, C.; Donovan, C.; Scherzer, R.; Shah, S.J.; Peralta, C.A.; Dubin, R.F. Sex differences in vascular dysfunction and cardiovascular outcomes: The cardiac, endothelial function, and arterial stiffness in ESRD (CERES) study. Hemodial. Int. 2018, 22, 93–102. [Google Scholar] [CrossRef] [Green Version]
- Antelmi, I.; de Paula, R.S.; Shinzato, A.R.; Peres, C.A.; Mansur, A.J.; Grupi, C.J. Influence of age, gender, body mass index, and functional capacity on heart rate variability in a cohort of subjects without heart disease. Am. J. Cardiol. 2004, 93, 381–385. [Google Scholar] [CrossRef]
- Shcherbina, A.; Mattsson, C.M.; Waggott, D.; Salisbury, H.; Christle, J.W.; Hastie, T.; Wheeler, M.T.; Ashley, E.A. Accuracy in wrist-worn, sensor-based measurements of heart rate and energy expenditure in a diverse cohort. J. Pers. Med. 2017, 7, 3. [Google Scholar] [CrossRef]
- Azam, S.N.A.M.; Sidek, K.A.; Ismail, A.F. Photoplethysmogram based biometric identification incorporating different age and gender group. J. Telecommun. Electron. Comput. Eng. 2018, 10, 101–108. [Google Scholar]
- Nilsson, L.; Goscinski, T.; Johansson, A.; Lindberg, L.-G.; Kalman, S. Age and gender do not influence the ability to detect respiration by photoplethysmography. J. Clin. Monit. Comput. 2006, 20, 431–436. [Google Scholar] [CrossRef] [PubMed]
- Nowara, E.M.; McDuff, D.; Veeraraghavan, A. A Meta-Analysis of the Impact of Skin Tone and Gender on Non-Contact Photoplethysmography Measurements. In Proceedings of the IEEE/CVF Conference on Computer Vision and Pattern Recognition Workshops, Seattle, WA, USA, 14–19 June 2020; pp. 284–285. [Google Scholar]
- Nye, E. The effect of blood pressure alteration on the pulse wave velocity. Br. Heart J. 1964, 26, 261. [Google Scholar] [CrossRef] [PubMed] [Green Version]
- von Wowern, E.; Östling, G.; Nilsson, P.M.; Olofsson, P. Digital photoplethysmography for assessment of arterial stiffness: Repeatability and comparison with applanation tonometry. PLoS ONE 2015, 10, e0135659. [Google Scholar] [CrossRef] [PubMed] [Green Version]
- Dehkordi, P.; Garde, A.; Molavi, B.; Ansermino, J.M.; Dumont, G.A. Extracting instantaneous respiratory rate from multiple photoplethysmogram respiratory-induced variations. Front. Physiol. 2018, 9, 948. [Google Scholar] [CrossRef]
- Shelley, K.H.; Dickstein, M.; Shulman, S.M. The detection of peripheral venous pulsation using the pulse oximeter as a plethysmograph. J. Clin. Monit. 1993, 9, 283–287. [Google Scholar] [CrossRef]
- Charlton, P.H.; Bonnici, T.; Tarassenko, L.; Clifton, D.A.; Beale, R.; Watkinson, P.J. An assessment of algorithms to estimate respiratory rate from the electrocardiogram and photoplethysmogram. Physiol. Meas. 2016, 37, 610. [Google Scholar] [CrossRef]
- Meredith, D.J.; Clifton, D.; Charlton, P.; Brooks, J.; Pugh, C.; Tarassenko, L. Photoplethysmographic derivation of respiratory rate: A review of relevant physiology. J. Med. Eng. Technol. 2012, 36, 1–7. [Google Scholar] [CrossRef] [Green Version]
- Alian, A.A.; Shelley, K.H. Photoplethysmography. Best Pract. Res. Clin. Anaesthesiol. 2014, 28, 395–406. [Google Scholar] [CrossRef] [PubMed]
- Ysehak Abay, T.; Shafqat, K.; Kyriacou, P.A. Perfusion Changes at the Forehead Measured by Photoplethysmography during a Head-Down Tilt Protocol. Biosensors 2019, 9, 71. [Google Scholar] [CrossRef] [Green Version]
- Addison, P.S.; Watson, J.N.; Mestek, M.L.; Mecca, R.S. Developing an algorithm for pulse oximetry derived respiratory rate (RR oxi): A healthy volunteer study. J. Clin. Monit. Comput. 2012, 26, 45–51. [Google Scholar] [CrossRef] [Green Version]
- Li, J.; Jin, J.; Chen, X.; Sun, W.; Guo, P. Comparison of respiratory-induced variations in photoplethysmographic signals. Physiol. Meas. 2010, 31, 415. [Google Scholar] [CrossRef]
- Clifford, G.D.; Azuaje, F.; McSharry, P. Advanced Methods and Tools for ECG Data Analysis; Artech House Boston: Boston, MA, USA, 2006. [Google Scholar]
- Johansson, A. Neural network for photoplethysmographic respiratory rate monitoring. Med. Biol. Eng. Comput. 2003, 41, 242–248. [Google Scholar] [CrossRef] [PubMed]
- Shelley, K.H.; Tamai, D.; Jablonka, D.; Gesquiere, M.; Stout, R.G.; Silverman, D.G. The effect of venous pulsation on the forehead pulse oximeter wave form as a possible source of error in Spo2 calculation. Anesth. Analg. 2005, 100, 743–747. [Google Scholar] [CrossRef]
- Guyton, A.; Hall, J. Vascular distensibility and functions of the arterial and venous systems. In Textbook of Medical Physiology; Elsevier Inc.: Amsterdam, The Netherlands, 2006; pp. 171–180. [Google Scholar]
- Sami, H.M.; Kleinman, B.S.; Lonchyna, V.A. Central venous pulsations associated with a falsely low oxygen saturation measured by pulse oximetry. J. Clin. Monit. 1991, 7, 309–312. [Google Scholar] [CrossRef] [PubMed]
- Nijland, R.; Jongsma, H.W.; Verbruggen, I.M.; Nijhuis, J.G. Reflectance pulse oximetry in fetal lambs: Subcutaneous vessels and vasoconstriction affect its reliability. J. Clin. Monit. 1996, 12, 225–230. [Google Scholar] [CrossRef] [PubMed] [Green Version]
- Walton, Z.D.; Kyriacou, P.A.; Silverman, D.G.; Shelley, K.H. Measuring venous oxygenation using the photoplethysmograph waveform. J. Clin. Monit. Comput. 2010, 24, 295–303. [Google Scholar] [CrossRef]
- Nilsson, L.; Goscinski, T.; Kalman, S.; Lindberg, L.G.; Johansson, A. Combined photoplethysmographic monitoring of respiration rate and pulse: A comparison between different measurement sites in spontaneously breathing subjects. Acta Anaesthesiol. Scand. 2007, 51, 1250–1257. [Google Scholar] [CrossRef] [PubMed]
- Nilsson, L.; Johansson, A.; Kalman, S. Macrocirculation is not the sole determinant of respiratory induced variations in the reflection mode photoplethysmographic signal. Physiol. Meas. 2003, 24, 925. [Google Scholar] [CrossRef]
- Grabovskis, A.; Marcinkevics, Z.; Rubins, U.; Kviesis-Kipge, E. Effect of probe contact pressure on the photoplethysmographic assessment of conduit artery stiffness. J. Biomed. Opt. 2013, 18, 027004. [Google Scholar] [CrossRef] [PubMed]
- Ram, M.R.; Madhav, K.V.; Krishna, E.H.; Komalla, N.R.; Reddy, K.A. A novel approach for motion artifact reduction in PPG signals based on AS-LMS adaptive filter. IEEE Trans. Instrum. Meas. 2011, 61, 1445–1457. [Google Scholar] [CrossRef]
- Sandby-Moller, J.; Poulsen, T.; Wulf, H.C. Epidermal thickness at different body sites: Relationship to age, gender, pigmentation, blood content, skin type and smoking habits. Acta Derm. Venereol. 2003, 83, 410–413. [Google Scholar] [CrossRef]
- Robertson, K.; Rees, J.L. Variation in epidermal morphology in human skin at different body sites as measured by reflectance confocal microscopy. Acta Derm. Venereol. 2010, 90, 368–373. [Google Scholar] [PubMed] [Green Version]
- Smalls, L.K.; Randall Wickett, R.; Visscher, M.O. Effect of dermal thickness, tissue composition, and body site on skin biomechanical properties. Skin Res. Technol. 2006, 12, 43–49. [Google Scholar] [CrossRef] [PubMed]
- Whitton, J.T.; Everall, J. The thickness of the epidermis. Br. J. Dermatol. 1973, 89, 467–476. [Google Scholar] [CrossRef] [PubMed]
- Oltulu, P.; Ince, B.; Kokbudak, N.; Findik, S.; Kilinc, F. Measurement of epidermis, dermis, and total skin thicknesses from six different body regions with a new ethical histometric technique. Turk. J. Plast. Surg. 2018, 26, 56. [Google Scholar] [CrossRef]
- Lundström, R.; Dahlqvist, H.; Hagberg, M.; Nilsson, T. Vibrotactile and thermal perception and its relation to finger skin thickness. Clin. Neurophysiol. Pract. 2018, 3, 33–39. [Google Scholar] [CrossRef]
- Olsen, L.O.; Takiwaki, H.; Serup, J. High-frequency ultrasound characterization of normal skin. Skin thickness and echographic density of 22 anatomical sites. Skin Res. Technol. 1995, 1, 74–80. [Google Scholar] [CrossRef]
- Martin, A.; Drinkwater, D.; Clarys, J.; Daniel, M.; Ross, W. Effects of skin thickness and skinfold compressibility on skinfold thickness measurement. Am. J. Hum. Biol. 1992, 4, 453–460. [Google Scholar] [CrossRef] [PubMed]
- Tan, C.; Statham, B.; Marks, R.; Payne, P. Skin thickness measurement by pulsed ultrasound; its reproducibility, validation and variability. Br. J. Dermatol. 1982, 106, 657–667. [Google Scholar] [PubMed]
- Tamura, T.; Maeda, Y.; Sekine, M.; Yoshida, M. Wearable photoplethysmographic sensors—Past and present. Electronics 2014, 3, 282–302. [Google Scholar] [CrossRef]
- Tur, E.; Tur, M.; Maibach, H.I.; Guy, R.H. Basal perfusion of the cutaneous microcirculation: Measurements as a function of anatomic position. J. Investig. Dermatol. 1983, 81, 442–446. [Google Scholar] [CrossRef] [Green Version]
- Lee, Y.; Han, H.; Kim, J. Influence of motion artifacts on photoplethysmographic signals for measuring pulse rates. In Proceedings of the 2008 International Conference on Control, Automation and Systems, Seoul, Korea, 14–17 October 2008; pp. 962–965. [Google Scholar]
- Fallet, S.; Moser, V.; Braun, F.; Vesin, J.-M. Imaging photoplethysmography: What are the best locations on the face to estimate heart rate? In Proceedings of the 2016 Computing in Cardiology Conference (CinC), Vancouver, BC, Canada, 11–14 September 2016; pp. 341–344. [Google Scholar]
- Goepfert, L.; Petersen, C.L.; Ansermino, J.M.; Gorges, M. Evaluation of a Combined PPG/MPG Sensor in Healthy Volunteers. In Proceedings of the Anesthesia and Analgesia, Miami, FL, USA, 10–13 January 2018; pp. 50–51. [Google Scholar]
- Rauh, R.; Posfay, A.; Mück-Weymann, M. Quantification of inspiratory-induced vasoconstrictive episodes: A comparison of laser Doppler fluxmetry and photoplethysmography. Clin. Physiol. Funct. Imaging 2003, 23, 344–348. [Google Scholar] [CrossRef]
- Alty, S.R.; Angarita-Jaimes, N.; Millasseau, S.C.; Chowienczyk, P.J. Predicting arterial stiffness from the digital volume pulse waveform. IEEE Trans. Biomed. Eng. 2007, 54, 2268–2275. [Google Scholar] [CrossRef]
- Allen, J.; Frame, J.R.; Murray, A. Microvascular blood flow and skin temperature changes in the fingers following a deep inspiratory gasp. Physiol. Meas. 2002, 23, 365. [Google Scholar] [CrossRef]
- Allen, J. Photoplethysmography and its application in clinical physiological measurement. Physiol. Meas. 2007, 28, R1. [Google Scholar] [CrossRef] [Green Version]
- Carter, S.A.; Tate, R.B. Value of toe pulse waves in addition to systolic pressures in the assessment of the severity of peripheral arterial disease and critical limb ischemia. J. Vasc. Surg. 1996, 24, 258–265. [Google Scholar] [CrossRef] [Green Version]
- Lindberg, L.; Tamura, T.; Öberg, P. Photoplethysmography. Med. Biol. Eng. Comput. 1991, 29, 40–47. [Google Scholar] [CrossRef] [PubMed]
- Khan, M.; Pretty, C.G.; Amies, A.C.; Elliott, R.; Shaw, G.M.; Chase, J.G. Investigating the effects of temperature on photoplethysmography. IFAC Pap. Online 2015, 48, 360–365. [Google Scholar] [CrossRef]
- Khan, M.; Pretty, C.G.; Amies, A.C.; Elliott, R.; Chiew, Y.S.; Shaw, G.M.; Chase, J.G. Analysing the effects of cold, normal, and warm digits on transmittance pulse oximetry. Biomed. Signal Process. Control 2016, 26, 34–41. [Google Scholar] [CrossRef]
- Hahn, M.; Hahn, C.; Jünger, M.; Steins, A.; Zuder, D.; Klyscz, T.; Büchtemann, A.; Rassner, G.; Blazek, V. Local cold exposure test with a new arterial photoplethysmographic sensor in healthy controls and patients with secondary Raynaud’s phenomenon. Microvasc. Res. 1999, 57, 187–198. [Google Scholar] [CrossRef] [PubMed]
- Askarian, B.; Jung, K.; Chong, J.W. Monitoring of Heart Rate from Photoplethysmographic Signals Using a Samsung Galaxy Note8 in Underwater Environments. Sensors 2019, 19, 2846. [Google Scholar] [CrossRef] [Green Version]
- Jeong, I.C.; Yoon, H.; Kang, H.; Yeom, H. Effects of skin surface temperature on photoplethysmograph. J. Healthc. Eng. 2014, 5, 429–438. [Google Scholar] [CrossRef] [PubMed] [Green Version]
- Zhang, X.-Y.; Zhang, Y.-T. The effect of local mild cold exposure on pulse transit time. Physiol. Meas. 2006, 27, 649. [Google Scholar] [CrossRef]
- Wijshoff, R.W.; Mischi, M.; Veen, J.; van der Lee, A.M.; Aarts, R.M. Reducing motion artifacts in photoplethysmograms by using relative sensor motion: Phantom study. J. Biomed. Opt. 2012, 17, 117007. [Google Scholar] [CrossRef] [Green Version]
- Optoelectronics, O. Temperature and Bias Effects. Available online: http://www.osioptoelectronics.com/technology-corner/frequently-asked-questions/temperature-bias-effects.aspx (accessed on 6 August 2020).
- Maeda, Y.; Sekine, M.; Tamura, T. Relationship between measurement site and motion artifacts in wearable reflected photoplethysmography. J. Med. Syst. 2011, 35, 969–976. [Google Scholar] [CrossRef]
- Zong, C.; Jafari, R. Robust heart rate estimation using wrist-based PPG signals in the presence of intense physical activities. In Proceedings of the 2015 37th Annual International Conference of the IEEE Engineering in Medicine and Biology Society (EMBC), Milan, Italy, 25–29 August 2015; pp. 8078–8082. [Google Scholar]
- Lee, J.; Matsumura, K.; Yamakoshi, K.-I.; Rolfe, P.; Tanaka, S.; Yamakoshi, T. Comparison between red, green and blue light reflection photoplethysmography for heart rate monitoring during motion. In Proceedings of the 2013 35th Annual International Conference of the IEEE Engineering in Medicine and Biology Society (EMBC), Osaka, Japan, 3–7 July 2013; pp. 1724–1727. [Google Scholar]
- Jo, E.; Lewis, K.; Directo, D.; Kim, M.J.; Dolezal, B.A. Validation of biofeedback wearables for photoplethysmographic heart rate tracking. J. Sports Sci. Med. 2016, 15, 540. [Google Scholar]
- Stahl, S.E.; An, H.-S.; Dinkel, D.M.; Noble, J.M.; Lee, J.-M. How accurate are the wrist-based heart rate monitors during walking and running activities? Are they accurate enough? BMJ Open Sport Exerc. Med. 2016, 2, e000106. [Google Scholar] [CrossRef] [PubMed] [Green Version]
- Dooley, E.E.; Golaszewski, N.M.; Bartholomew, J.B. Estimating accuracy at exercise intensities: A comparative study of self-monitoring heart rate and physical activity wearable devices. JMIR mHealth uHealth 2017, 5, e34. [Google Scholar] [CrossRef]
- Karlen, W.; Kobayashi, K.; Ansermino, J.M.; Dumont, G. Photoplethysmogram signal quality estimation using repeated Gaussian filters and cross-correlation. Physiol. Meas. 2012, 33, 1617. [Google Scholar] [CrossRef] [PubMed]
- Sukor, J.A.; Redmond, S.; Lovell, N. Signal quality measures for pulse oximetry through waveform morphology analysis. Physiol. Meas. 2011, 32, 369. [Google Scholar] [CrossRef] [PubMed]
- Chong, J.W.; Dao, D.K.; Salehizadeh, S.; McManus, D.D.; Darling, C.E.; Chon, K.H.; Mendelson, Y. Photoplethysmograph signal reconstruction based on a novel hybrid motion artifact detection–reduction approach. Part I: Motion and noise artifact detection. Ann. Biomed. Eng. 2014, 42, 2238–2250. [Google Scholar] [CrossRef]
- Karlen, W.; Ansermino, J.M.; Dumont, G. Adaptive pulse segmentation and artifact detection in photoplethysmography for mobile applications. In Proceedings of the 2012 Annual International Conference of the IEEE Engineering in Medicine and Biology Society, San Diego, CA, USA, 28 August–1 September 2012; pp. 3131–3134. [Google Scholar]
- Couceiro, R.; Carvalho, P.; Paiva, R.P.; Henriques, J.; Muehlsteff, J. Detection of motion artifacts in photoplethysmographic signals based on time and period domain analysis. In Proceedings of the 2012 Annual International Conference of the IEEE Engineering in Medicine and Biology Society, San Diego, CA, USA, 28 August–1 September 2012; pp. 2603–2606. [Google Scholar]
- Krishnan, R.; Natarajan, B.; Warren, S. Analysis and detection of motion artifact in photoplethysmographic data using higher order statistics. In Proceedings of the 2008 IEEE International Conference on Acoustics, Speech and Signal Processing, Las Vegas, NV, USA, 31 March–4 April 2008; pp. 613–616. [Google Scholar]
- Selvaraj, N.; Mendelson, Y.; Shelley, K.H.; Silverman, D.G.; Chon, K.H. Statistical approach for the detection of motion/noise artifacts in Photoplethysmogram. In Proceedings of the 2011 Annual International Conference of the IEEE Engineering in Medicine and Biology Society, Boston, MA, USA, 30 August–3 September 2011; pp. 4972–4975. [Google Scholar]
- Gibbs, P.; Asada, H.H. Reducing motion artifact in wearable bio-sensors using MEMS accelerometers for active noise cancellation. In Proceedings of the 2005 American Control Conference, Portland, OR, USA, 8–10 June 2005; pp. 1581–1586. [Google Scholar]
- Khan, E.; Al Hossain, F.; Uddin, S.Z.; Alam, S.K.; Hasan, M.K. A robust heart rate monitoring scheme using photoplethysmographic signals corrupted by intense motion artifacts. IEEE Trans. Biomed. Eng. 2015, 63, 550–562. [Google Scholar] [CrossRef]
- Han, H.; Kim, M.-J.; Kim, J. Development of real-time motion artifact reduction algorithm for a wearable photoplethysmography. In Proceedings of the 2007 29th Annual International Conference of the IEEE Engineering in Medicine and Biology Society, Lyon, France, 23–26 August 2007; pp. 1538–1541. [Google Scholar]
- Zhang, Z. Photoplethysmography-based heart rate monitoring in physical activities via joint sparse spectrum reconstruction. IEEE Trans. Biomed. Eng. 2015, 62, 1902–1910. [Google Scholar] [CrossRef] [Green Version]
- Casson, A.J.; Galvez, A.V.; Jarchi, D. Gyroscope vs. accelerometer measurements of motion from wrist PPG during physical exercise. ICT Express 2016, 2, 175–179. [Google Scholar] [CrossRef]
- Lee, H.; Chung, H.; Lee, J. Motion artifact cancellation in wearable photoplethysmography using gyroscope. IEEE Sens. J. 2018, 19, 1166–1175. [Google Scholar] [CrossRef]
- Lee, H.; Chung, H.; Kim, J.-W.; Lee, J. Motion artifact identification and removal from wearable reflectance photoplethysmography using piezoelectric transducer. IEEE Sens. J. 2019, 19, 3861–3870. [Google Scholar] [CrossRef]
- Zhang, Y.; Song, S.; Vullings, R.; Biswas, D.; Simões-Capela, N.; van Helleputte, N.; van Hoof, C.; Groenendaal, W. Motion artifact reduction for wrist-worn photoplethysmograph sensors based on different wavelengths. Sensors 2019, 19, 673. [Google Scholar] [CrossRef] [PubMed] [Green Version]
- Lee, J.; Kim, M.; Park, H.-K.; Kim, I.Y. Motion Artifact Reduction in Wearable Photoplethysmography Based on Multi-Channel Sensors with Multiple Wavelengths. Sensors 2020, 20, 1493. [Google Scholar] [CrossRef] [PubMed] [Green Version]
- Chan, K.; Zhang, Y. Adaptive reduction of motion artifact from photoplethysmographic recordings using a variable step-size LMS filter. In Proceedings of the 2002 IEEE Sensors, Orlando, FL, USA, 12–14 June 2012; pp. 1343–1346. [Google Scholar]
- Lee, B.; Han, J.; Baek, H.J.; Shin, J.H.; Park, K.S.; Yi, W.J. Improved elimination of motion artifacts from a photoplethysmographic signal using a Kalman smoother with simultaneous accelerometry. Physiol. Meas. 2010, 31, 1585. [Google Scholar] [CrossRef]
- Yousefi, R.; Nourani, M.; Ostadabbas, S.; Panahi, I. A motion-tolerant adaptive algorithm for wearable photoplethysmographic biosensors. IEEE J. Biomed. Health Inform. 2013, 18, 670–681. [Google Scholar] [CrossRef]
- Zhang, Y.; Liu, B.; Zhang, Z. Combining ensemble empirical mode decomposition with spectrum subtraction technique for heart rate monitoring using wrist-type photoplethysmography. Biomed. Signal Process. Control 2015, 21, 119–125. [Google Scholar] [CrossRef]
- Bousefsaf, F.; Maaoui, C.; Pruski, A. Continuous wavelet filtering on webcam photoplethysmographic signals to remotely assess the instantaneous heart rate. Biomed. Signal Process. Control 2013, 8, 568–574. [Google Scholar] [CrossRef]
- Teng, X.; Zhang, Y. Continuous and noninvasive estimation of arterial blood pressure using a photoplethysmographic approach. In Proceedings of the 25th Annual International Conference of the IEEE Engineering in Medicine and Biology Society (IEEE Cat. No. 03CH37439), Cancun, Mexico, 17–21 September 2003; pp. 3153–3156. [Google Scholar]
- Krishnan, R.; Natarajan, B.; Warren, S. Two-stage approach for detection and reduction of motion artifacts in photoplethysmographic data. IEEE Trans. Biomed. Eng. 2010, 57, 1867–1876. [Google Scholar] [CrossRef] [Green Version]
- Kim, B.S.; Yoo, S.K. Motion artifact reduction in photoplethysmography using independent component analysis. IEEE Trans. Biomed. Eng. 2006, 53, 566–568. [Google Scholar] [CrossRef]
- Holton, B.D.; Mannapperuma, K.; Lesniewski, P.J.; Thomas, J.C. Signal recovery in imaging photoplethysmography. Physiol. Meas. 2013, 34, 1499. [Google Scholar] [CrossRef]
- Motin, M.A.; Karmakar, C.K.; Palaniswami, M. Ensemble empirical mode decomposition with principal component analysis: A novel approach for extracting respiratory rate and heart rate from photoplethysmographic signal. IEEE J. Biomed. Health Inform. 2017, 22, 766–774. [Google Scholar] [CrossRef]
- Reddy, K.A.; Kumar, V.J. Motion artifact reduction in photoplethysmographic signals using singular value decomposition. In Proceedings of the 2007 IEEE Instrumentation & Measurement Technology Conference IMTC, Warsaw, Poland, 1–3 May 2007; pp. 1–4. [Google Scholar]
- Wong, A.; Pun, K.-P.; Zhang, Y.-T.; Hung, K. A near-infrared heart rate measurement IC with very low cutoff frequency using current steering technique. IEEE Trans. Circuits Syst. I Regul. Pap. 2005, 52, 2642–2647. [Google Scholar] [CrossRef]
- Moraes, J.L.; Rocha, M.X.; Vasconcelos, G.G.; Vasconcelos Filho, J.E.; de Albuquerque, V.H.C.; Alexandria, A.R. Advances in photopletysmography signal analysis for biomedical applications. Sensors 2018, 18, 1894. [Google Scholar] [CrossRef] [Green Version]
- Sazonov, E. Wearable Sensors: Fundamentals, Implementation and Applications; Elsevier: Amsterdam, The Netherlands, 2014. [Google Scholar]
- Kim, J.; Lee, T.; Kim, J.; Ko, H. Ambient light cancellation in photoplethysmogram application using alternating sampling and charge redistribution technique. In Proceedings of the 2015 37th Annual International Conference of the IEEE Engineering in Medicine and Biology Society (EMBC), Milan, Italy, 25–29 August 2015; pp. 6441–6444. [Google Scholar]
- Ralston, A.; Webb, R.; Runciman, W. Potential errors in pulse oximetry: I. Pulse oximeter evaluation. Anaesthesia 1991, 46, 202–206. [Google Scholar] [CrossRef]
- Wang, L.; Lo, B.P.; Yang, G.-Z. Multichannel reflective PPG earpiece sensor with passive motion cancellation. IEEE Trans. Biomed. Circuits Syst. 2007, 1, 235–241. [Google Scholar] [CrossRef]
- Patterson, J.A.; McIlwraith, D.C.; Yang, G.-Z. A flexible, low noise reflective PPG sensor platform for ear-worn heart rate monitoring. In Proceedings of the 2009 Sixth International Workshop on Wearable and Implantable Body Sensor Networks, Berkeley, CA, USA, 3–5 June 2009; pp. 286–291. [Google Scholar]
- Wong, A.K.; Leung, K.N.; Pun, K.-P.; Zhang, Y.-T. A 0.5-Hz high-pass cutoff dual-loop transimpedance amplifier for wearable NIR sensing device. IEEE Trans. Circuits Syst. II Express Briefs 2010, 57, 531–535. [Google Scholar] [CrossRef]
- Teng, X.-F.; Zhang, Y.-T. Theoretical study on the effect of sensor contact force on pulse transit time. IEEE Trans. Biomed. Eng. 2007, 54, 1490–1498. [Google Scholar] [CrossRef] [PubMed]
- Yamakoshi, K.; Shimazu, H.; Shibata, M.; Kamiya, A. New oscillometric method for indirect measurement of systolic and mean arterial pressure in the human finger. Part 1: Model experiment. Med. Biol. Eng. Comput. 1982, 20, 307–313. [Google Scholar] [CrossRef] [PubMed]
- Forster, F.K.; Turney, D. Oscillometric determination of diastolic, mean and systolic blood pressure—A numerical model. J. Biomech. Eng. 1986, 108, 359–364. [Google Scholar] [CrossRef]
- Teng, X.; Zhang, Y.-T. The effect of contacting force on photoplethysmographic signals. Physiol. Meas. 2004, 25, 1323. [Google Scholar] [CrossRef]
- Hsiu, H.; Hsu, C.; Wu, T. Effects of different contacting pressure on the transfer function between finger photoplethysmographic and radial blood pressure waveforms. Proc. Inst. Mech. Eng. Part H J. Eng. Med. 2011, 225, 575–583. [Google Scholar] [CrossRef] [PubMed]
- Teng, X.; Zhang, Y.-T. The effect of applied sensor contact force on pulse transit time. Physiol. Meas. 2006, 27, 675. [Google Scholar] [CrossRef]
- Grabovskis, A.; Marcinkevics, Z.; Rubenis, O.; Rubins, U.; Lusa, V. Photoplethysmography system for blood pulsation detection in unloaded artery conditions. In Proceedings of the Biophotonics: Photonic Solutions for Better Health Care III, Brussels, Belgium, 16–19 April 2012; p. 84270L. [Google Scholar]
- Spigulis, J.; Gailite, L.; Erts, R.; Lihachev, A. Contact probe pressure effects in skin multi-spectral photoplethysmography. In Proceedings of the European Conference on Biomedical Optics, Munich, Germany, 17–19 June 2007; pp. 6628–6655. [Google Scholar]
- Nogami, H.; Inoute, R.; Hayashida, Y.; Sawada, R. Integrated micro-displacement sensor and its application to photoplethysmographic sensor. In Proceedings of the 2017 International Symposium on Micro-NanoMechatronics and Human Science (MHS), Nagoya, Japan, 3–6 December 2017; pp. 1–5. [Google Scholar]
- Sim, J.K.; Ahn, B.; Doh, I. A contact-force regulated photoplethysmography (PPG) platform. AIP Adv. 2018, 8, 045210. [Google Scholar] [CrossRef] [Green Version]
- Rhee, S.; Yang, B.-H.; Asada, H.H. Artifact-resistant power-efficient design of finger-ring plethysmographic sensors. IEEE Trans. Biomed. Eng. 2001, 48, 795–805. [Google Scholar] [CrossRef] [PubMed]
- Santos, P.; Almeida, V.; Cardoso, J.; Correia, C. Photoplethysmographic logger with contact force and hydrostatic pressure monitoring. In Proceedings of the 2013 IEEE 3rd Portuguese Meeting in Bioengineering (ENBENG), Braga, Portugal, 20–23 February 2013; pp. 1–6. [Google Scholar]
- Liu, C.; Correia, R.; Ballaji, H.K.; Korposh, S.; Hayes-Gill, B.R.; Morgan, S.P. Optical fibre-based pulse oximetry sensor with contact force detection. Sensors 2018, 18, 3632. [Google Scholar] [CrossRef] [PubMed] [Green Version]


| Device | Company | FDA Status | PPG-Derived Parameters | Release Year | Notes |
|---|---|---|---|---|---|
| Devices with FDA Status | |||||
| Samsung Gear S2/LIVMOR Halo™ | Samsung/LIVMOR | Cleared | Heart rate variability | 2020 | Samsung Gear S2 is FDA approved to assess heart variability only with the LIVMOR Halo™ Detection System |
| BB-613 | BioBeat | Cleared | Oxygen saturation of arterial hemoglobin (SpO2), pulse rate, and changes in blood pressure | 2019 | Available as a wristwatch or patch |
| Loop | Spry Health | Cleared | Heart rate, respiration, pulse oximetry | 2019 | -Wristwatch designed for individuals with chronic obstructive pulmonary disease |
| Wearable | Current Health | Cleared | Pulse rate, SpO2 | 2019 | -Upper arm patch -Part of the Current Health Full-Service Remote Healthcare Platform |
| EQO2 Lifemonitor | Equivital | Cleared | SpO2 | 2013 | -Worn as an insert in a chest harness -Works with ECG and other measurements |
| Everion | Biofourmis | Exempt | SpO2, Heart Rate | 2017 | -Biofourmis is currently performing clinical validation for Heart Rate Variability and Respiration Rate |
| Popular Fitness Devices | |||||
| Fēnix 6 Series | Garmin | None | SpO2, Heart rate | 2019 | -Heart rate variability available with chest heart rate monitor |
| Xiaomi Mi Band 5 | Xiaomi | None | Heart rate, Heart rate variability | 2020 | -Also measures “respiration information” |
| Suunto 9 | Suunto | None | Heart rate, Heart rate variability | 2018 | -Heart rate variability for sleep quality |
| Apple Watch Series 6 | Apple | Cleared (ECG only) | SpO2, Heart rate, Heart rate variability | 2020 | ECG clearance is for irregular rhythm notification |
| Versa 3 | Fitbit | Pending (ECG only) | SpO2, Heart rate, Heart rate variability | 2020 | Heart rate measurement is for rest conditions only |
| Parameter | BMI-Induced Changes | Presumed Effect on PPG | Relevant Work | Reference |
|---|---|---|---|---|
| Skin thickness | Skin thickness increases as BMI increases | Decreased signal resolution and intensity | Iacopa et al., 2020 Altintas et al., 2016 Boonya-Ananta et al., 2021 | [36,60,72,77] |
| Blood flow | Baseline cutaneous blood flow increases in obese children, dermal blood cell flow increases in overweight individuals, cutaneous blood flow increases in the nailfold of obese children | Decreased signal resolution and intensity | Chin et al., 1999 Czernichow et al., 2010 Altintas et al., 2016 | [61,63,72] |
| Capillary Density | Capillary density decreases as BMI increases | Increased signal resolution and intensity | Francischetti et al., 2011 | [62] |
| Oxygen saturation | Oxygen saturation decreases as BMI increases | n/a | Petrofsky et al., 2015 | [67] |
| Trans-epidermal water loss | TEWL increases as BMI increases | Increase PPG intensity and resolution (NIR and IR only) | Rodrigues et al., 2017 | [69] |
| Physiological Characteristic | Gender Discrepancies | Effect on PPG Signal | Relevant Work | Reference |
|---|---|---|---|---|
| Average Heart Rate | Higher average heart rate in females | Higher average heart rate yields higher average frequency content of the signal | Proctor et al., 1998 | [99] |
| Heart Mass | Greater heart mass in males | Increased heart mass yields lower heart rate which yields lower frequency content of the signal | Prabhavathi et al., 2014 | [100] |
| Blood Pressure | Higher mean blood pressure in males | Increased blood pressure increases PWV | Reckelhoff et al., 2001 Nye et al., 1964 | [101,113] |
| Radial Artery Diameter | Larger average radial artery in males | Increased diameter increases flow rate which is an increase in PWV | Joannides et al., 2002 | [102] |
| Arterial Stiffness | Greater arterial stiffness in pre-puberty and post-menopausal females | Increased arterial stiffness increases PWV and increases b/a ratio | Joannides et al., 2002 Ahimastos et al., 2003 Von Wowern et al., 2015 | [102,104,114] |
| Temperature Increase/Decrease | Effect on PPG Signal | Relevant Work | Reference |
|---|---|---|---|
| Increase | Increase PPG amplitude and total signal | Allen et al., 2002 | [150,153,154,155] |
| Decrease | Decrease in PPG waveform amplitude, decrease PTT | Lindberg et al., 1991 Hahn et al., 1999 Askarian et al., 2019 Zhang et al., 2006 | [152,156,157,159] |
| Filter | Relevant Work | Reference |
|---|---|---|
| Least Mean Square | Chan et al., 2002 | [184] |
| Recursive Least Squares | Gibbs et al., 2005 Khan et al., 2015 Lee et al., 2010 | [175,176,185] |
| Normalized Least Mean Squares | Han et al., 2007 Casson et al., 2016 Lee et al., 2010 Yousefi, 2013 | [177,179,185,186] |
| Kalman Smoother | Lee et al., 2010 | [185] |
| Spectrum Subtraction | Zhang et al., 2015 Zhang et al., 2015 | [178,187] |
| Continuous Wavelet Transform | Zhang et al., 2019 Bousefsaf et al., 2013 Teng et al., 2003 | [182,188,189] |
| Independent Component Analysis | Lee et al., 2020 Krishnan et al., 2010 Kim et al., 2006 Holton et al., 2013 | [183,190,191,192] |
| Principal Component Analysis | Holton et al., 2013 Motin et al., 2017 | [192,193] |
| Singular Value Decomposition | Lee et al., 2020 Reddy et al., 2007 | [183,194] |
| Empirical Mode Decomposition | Yousef et al., 2012 Zhang et al., 2015 Motin et al., 2017 | [88,187,193] |
| Section | Sources of Noise | Impact | Mitigation Technique | |
|---|---|---|---|---|
| Individual Variation | Skin Tone | Melanin absorption | Decreased signal intensity | PPG Wavelength Selection |
| Obesity | Blood flow, skin thickness, capillary recruitment, trans epidermal water loss, oxygen saturation | Decreased signal intensity, modified PPG waveform | None found in literature | |
| Age | Skin thickness, vessel compliance, capillary recruitment | Change in signal intensity, modified PPG waveform | Calibration | |
| Gender | Cardiovascular baseline differences, skin thickness, vessel size | Change in signal intensity | Calibration | |
| Physiology | Respiratory Rate | Low frequency noise | Modified PPG waveform | High pass filter |
| Venous Pulsations | Reduction in overall signal, low frequency noise | Modified PPG waveform | High pass filter, apply pressure | |
| Local Body Temperature | Cold temperatures diminish PPG amplitude | Change in signal intensity | Calibration | |
| Body Site | Signal amplitude and PPG waveform shape | Change in signal intensity, modified PPG waveform | Calibration | |
| External Factors | Motion Artifacts | High and low frequency noise | Change in signal SNR | Filters and secondary sensors |
| Ambient Light | Increased Noise | Change in signal SNR | Optical shielding and selective filtering | |
| Applied Pressure | Reduction in PPG amplitude and SNR | Change in signal SNR, modified PPG waveform | Apply optimal pressure for high SNR, without affecting waveform features |
Publisher’s Note: MDPI stays neutral with regard to jurisdictional claims in published maps and institutional affiliations. |
© 2021 by the authors. Licensee MDPI, Basel, Switzerland. This article is an open access article distributed under the terms and conditions of the Creative Commons Attribution (CC BY) license (https://creativecommons.org/licenses/by/4.0/).
Share and Cite
Fine, J.; Branan, K.L.; Rodriguez, A.J.; Boonya-ananta, T.; Ajmal; Ramella-Roman, J.C.; McShane, M.J.; Coté, G.L. Sources of Inaccuracy in Photoplethysmography for Continuous Cardiovascular Monitoring. Biosensors 2021, 11, 126. https://doi.org/10.3390/bios11040126
Fine J, Branan KL, Rodriguez AJ, Boonya-ananta T, Ajmal, Ramella-Roman JC, McShane MJ, Coté GL. Sources of Inaccuracy in Photoplethysmography for Continuous Cardiovascular Monitoring. Biosensors. 2021; 11(4):126. https://doi.org/10.3390/bios11040126
Chicago/Turabian StyleFine, Jesse, Kimberly L. Branan, Andres J. Rodriguez, Tananant Boonya-ananta, Ajmal, Jessica C. Ramella-Roman, Michael J. McShane, and Gerard L. Coté. 2021. "Sources of Inaccuracy in Photoplethysmography for Continuous Cardiovascular Monitoring" Biosensors 11, no. 4: 126. https://doi.org/10.3390/bios11040126