Sandwich ELISA-Based Electrochemical Biosensor for Leptin in Control and Diet-Induced Obesity Mouse Model

Abstract
:1. Introduction
2. Materials and Methods
2.1. Apparatus and Electrodes
2.2. Reagents
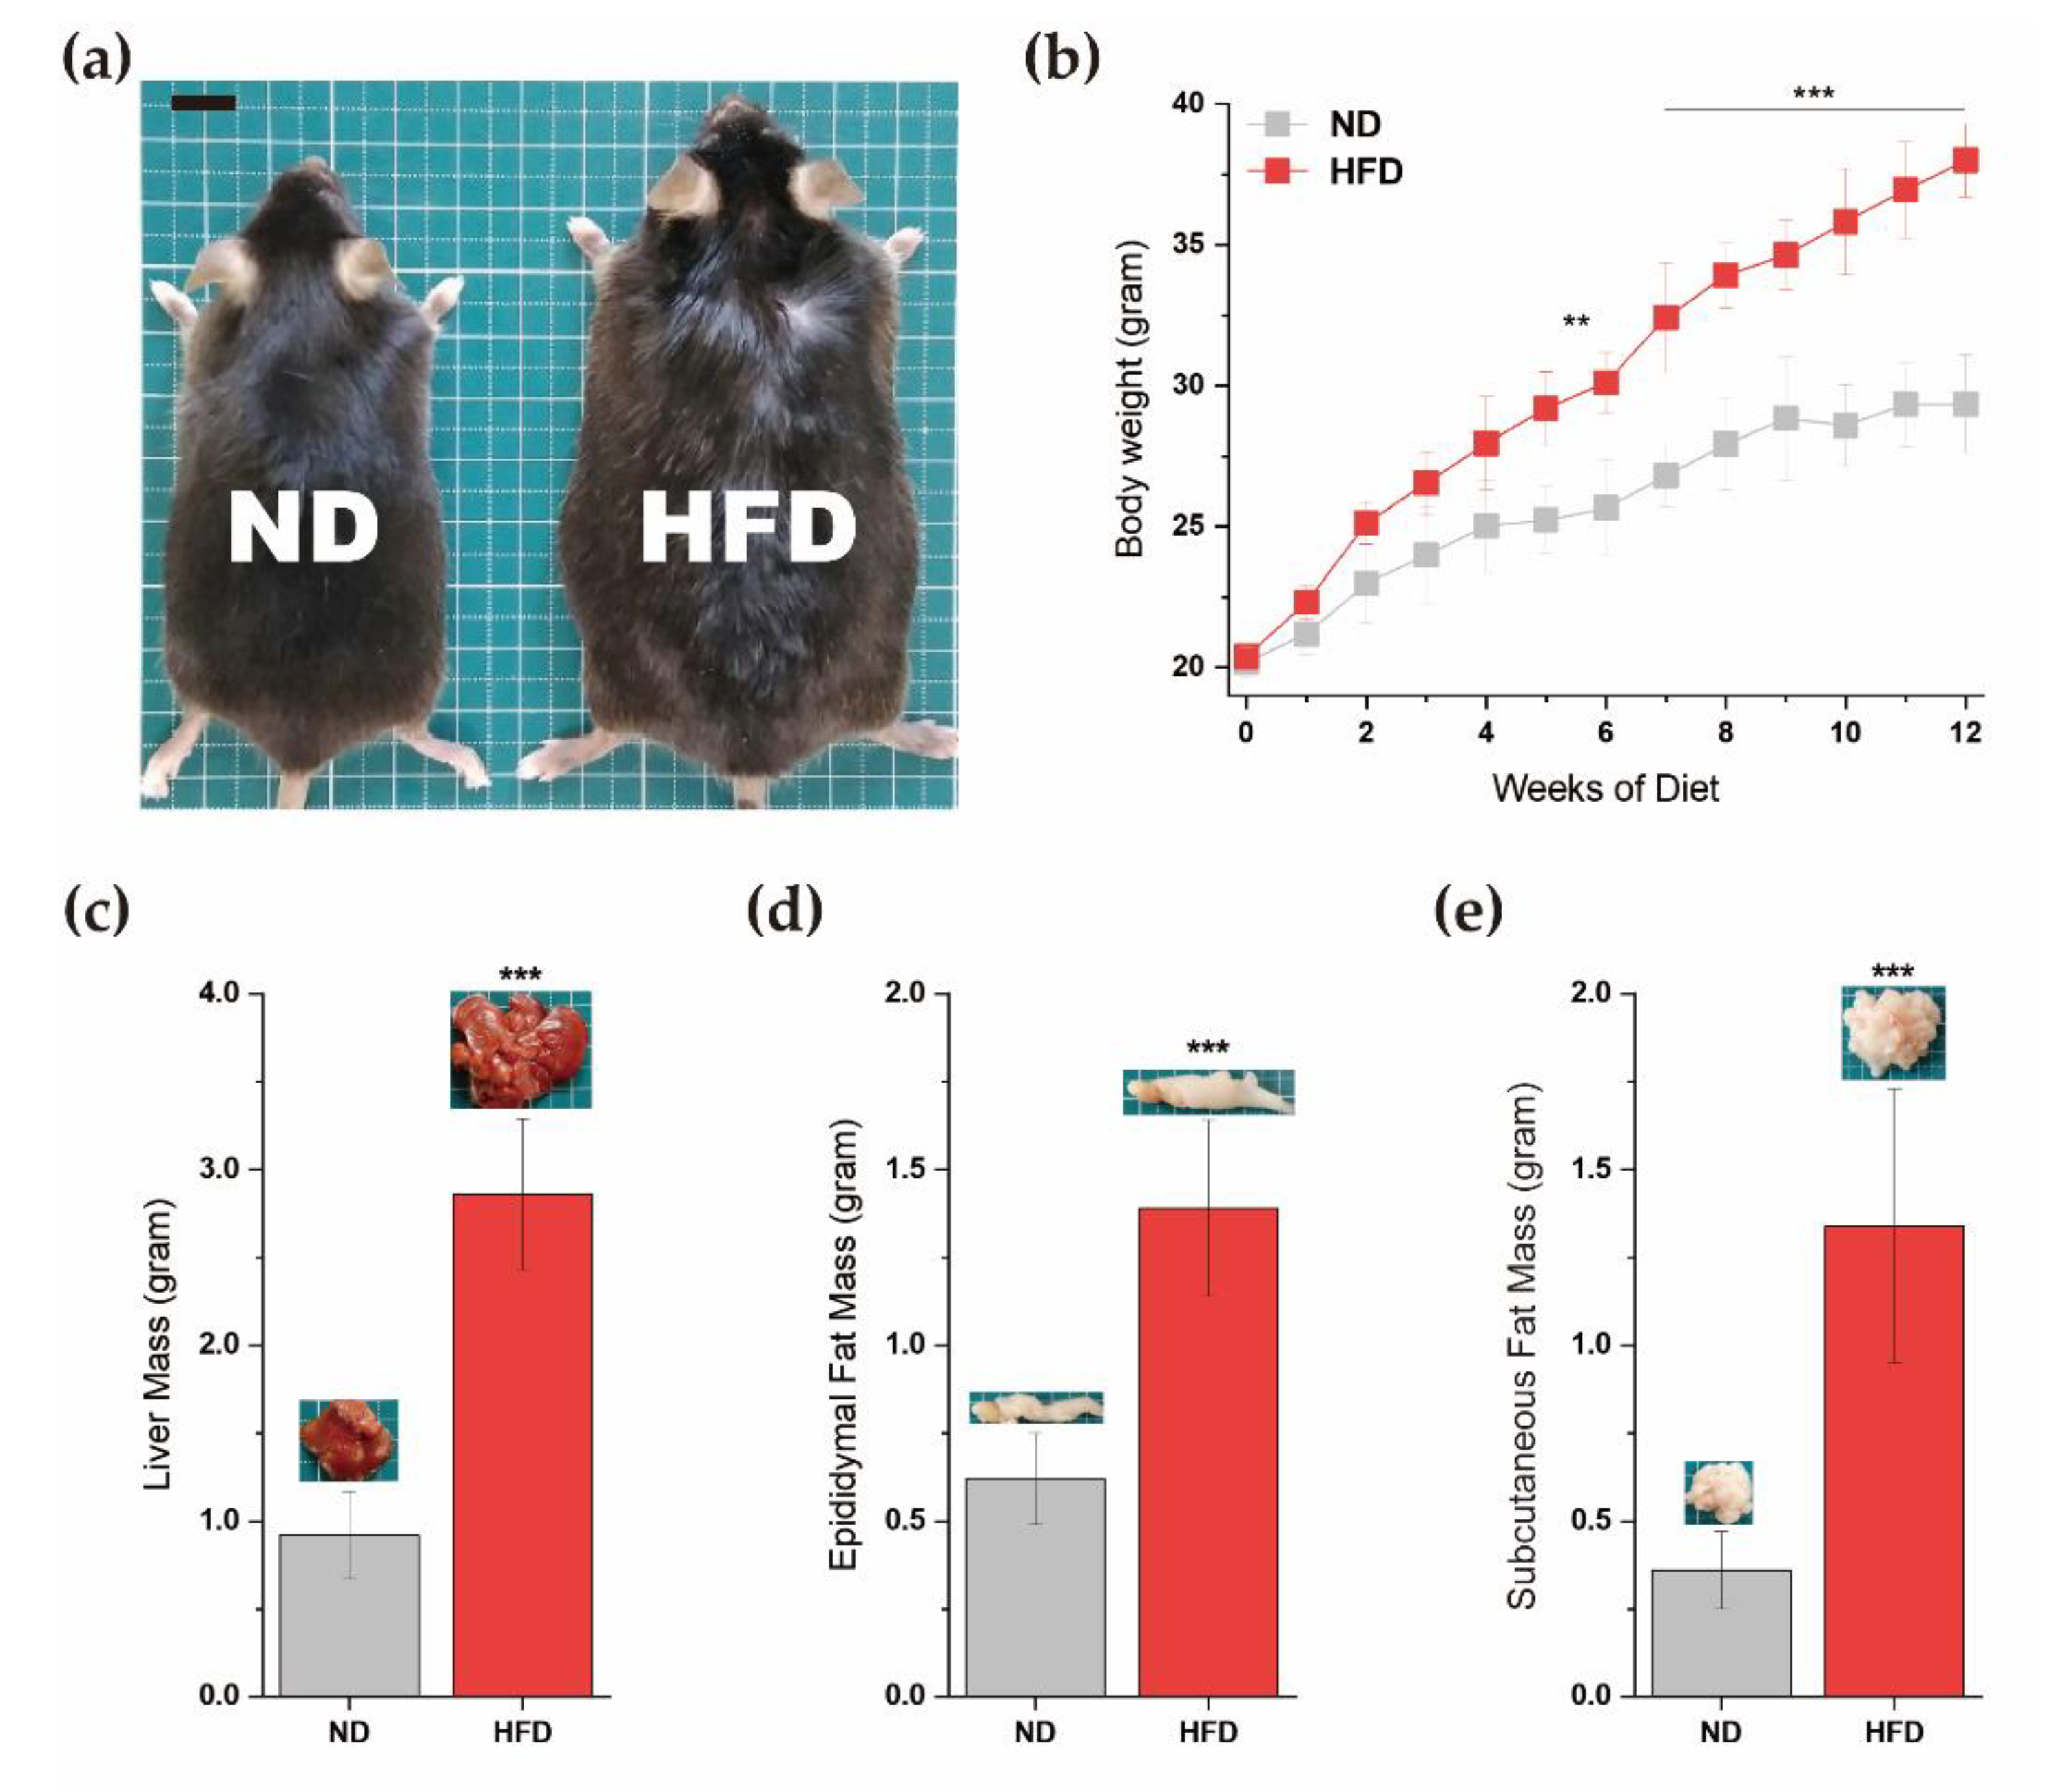
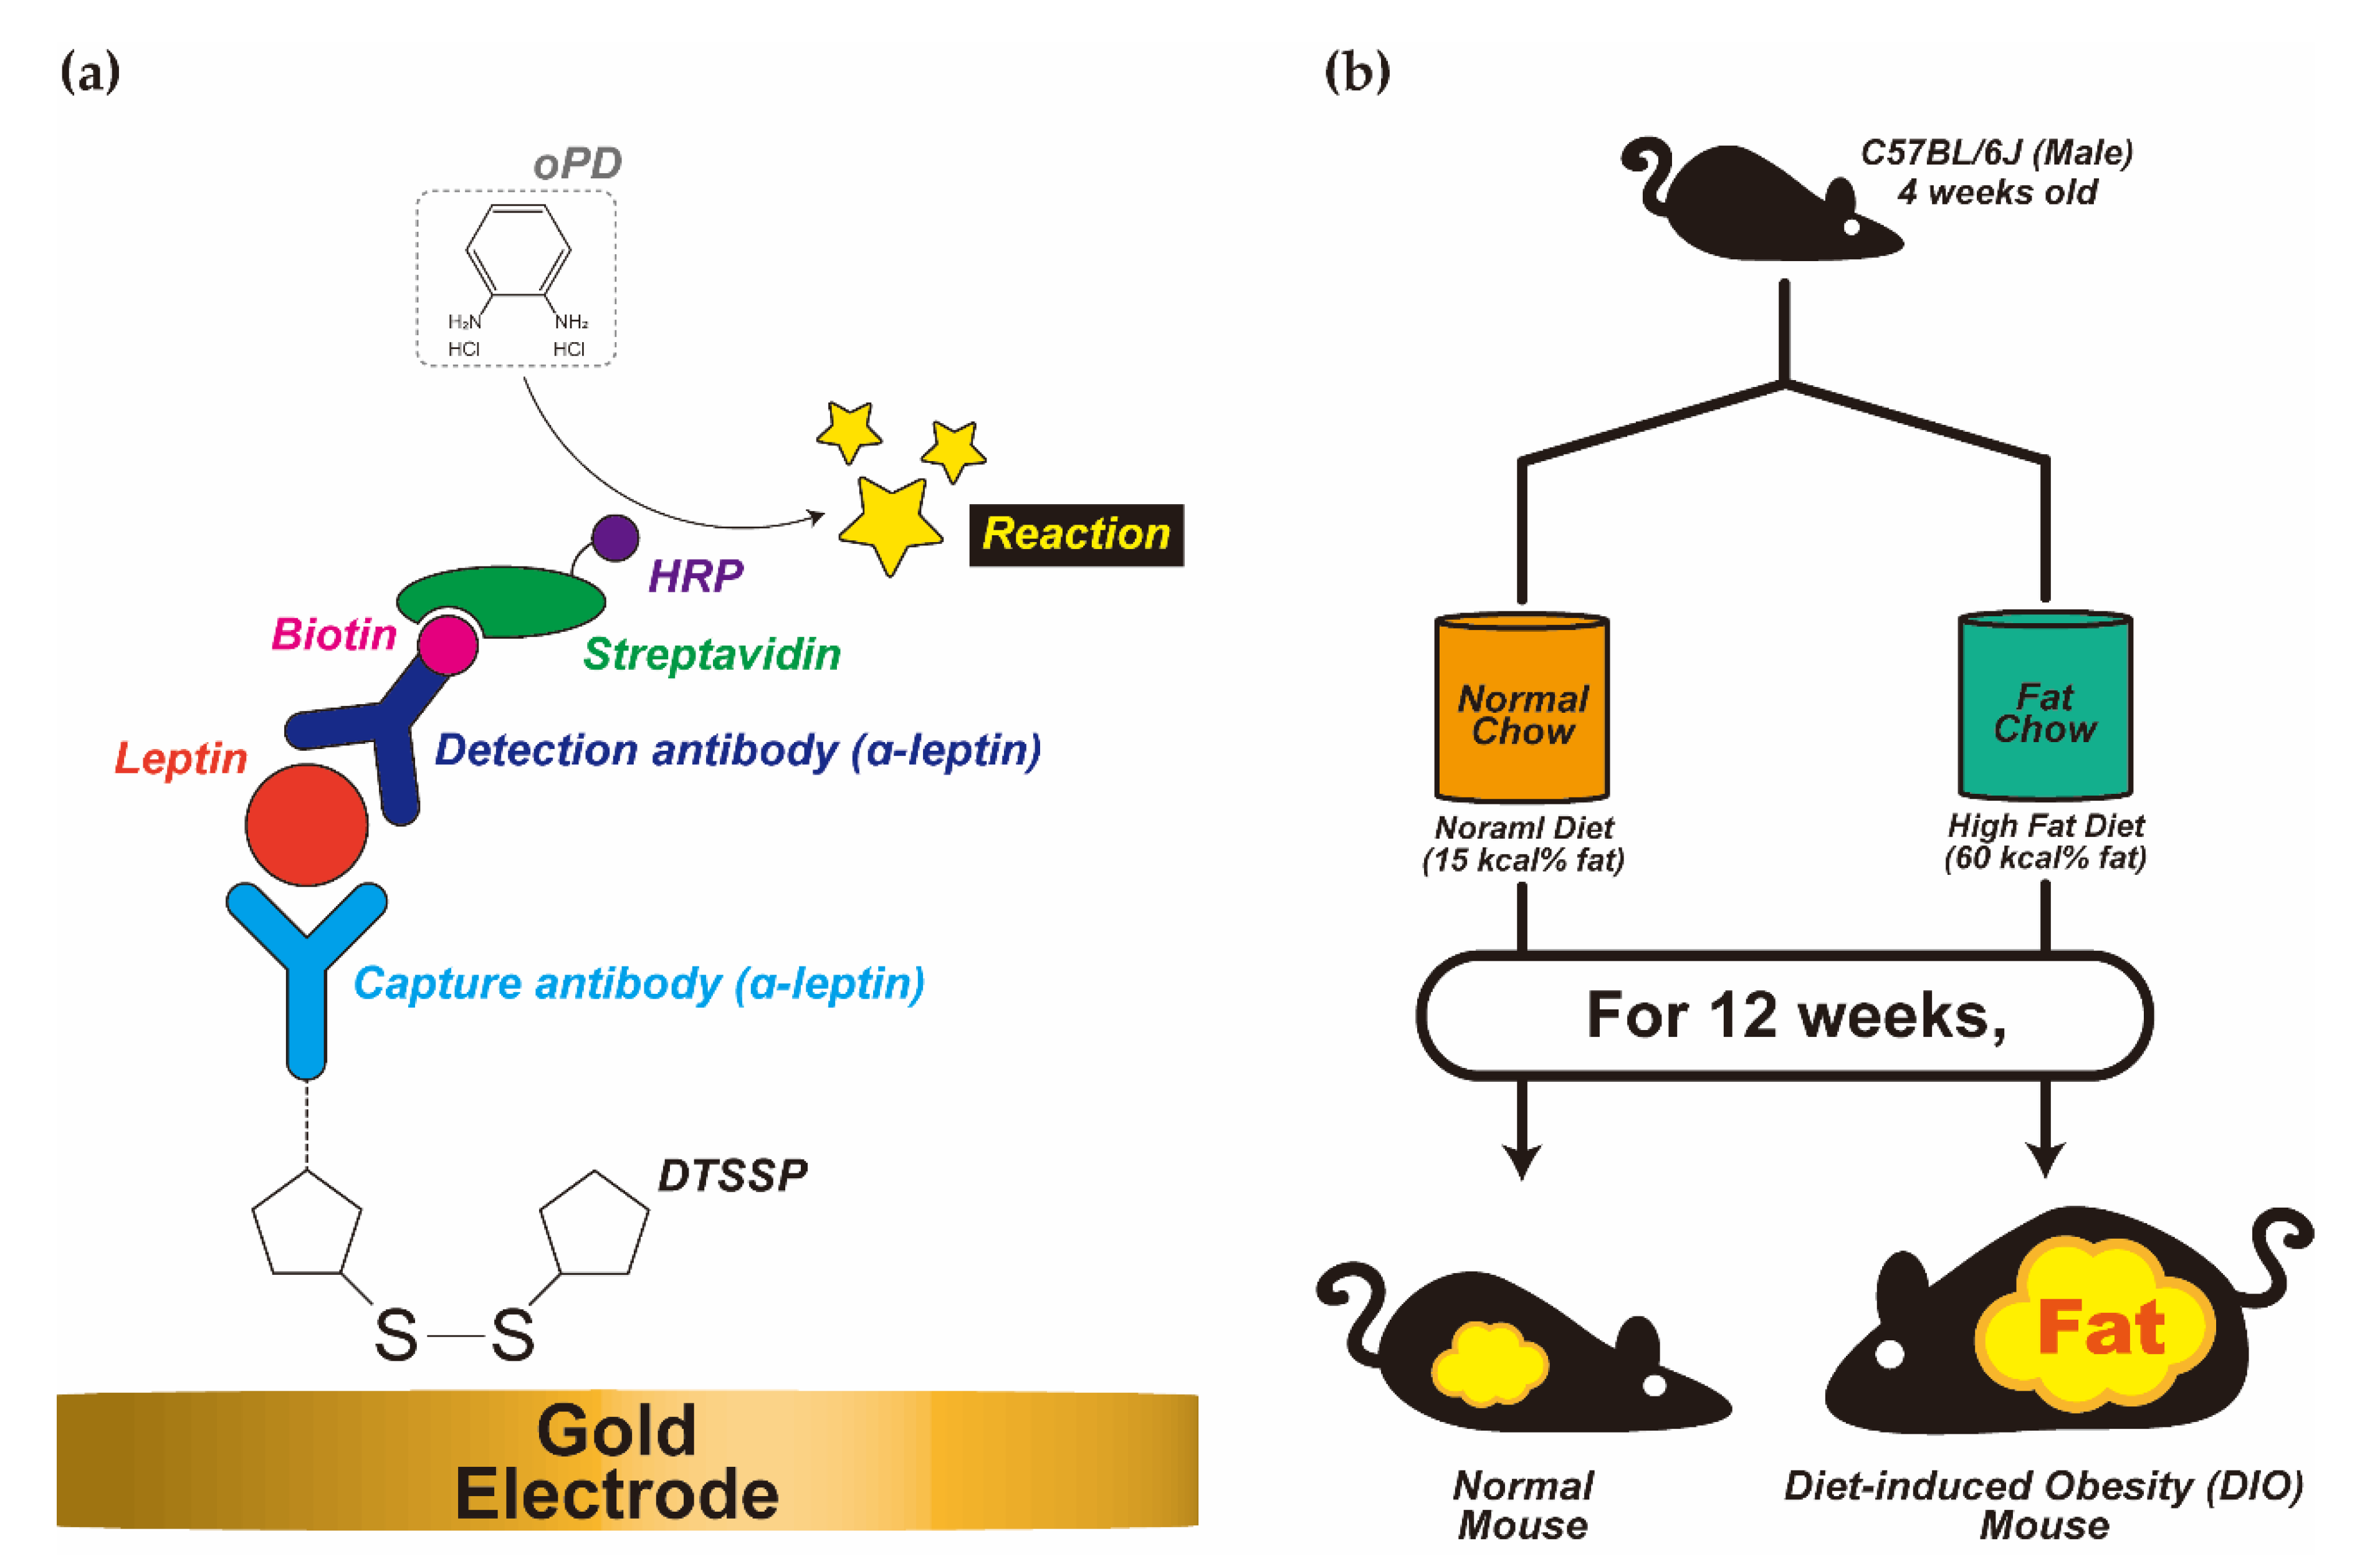
2.3. Diet-Induced Obesity Mice Model
2.4. Leptin Biosensor Modification (SPGE/DTSSP/a-Leptin/Leptin/Biotinylated a-Leptin/Streptavidin-HRP/oPD)
2.5. Electrochemical Measurement
2.6. Statistics
3. Results and Discussion
3.1. Diet-Induced Obesity Mice Model
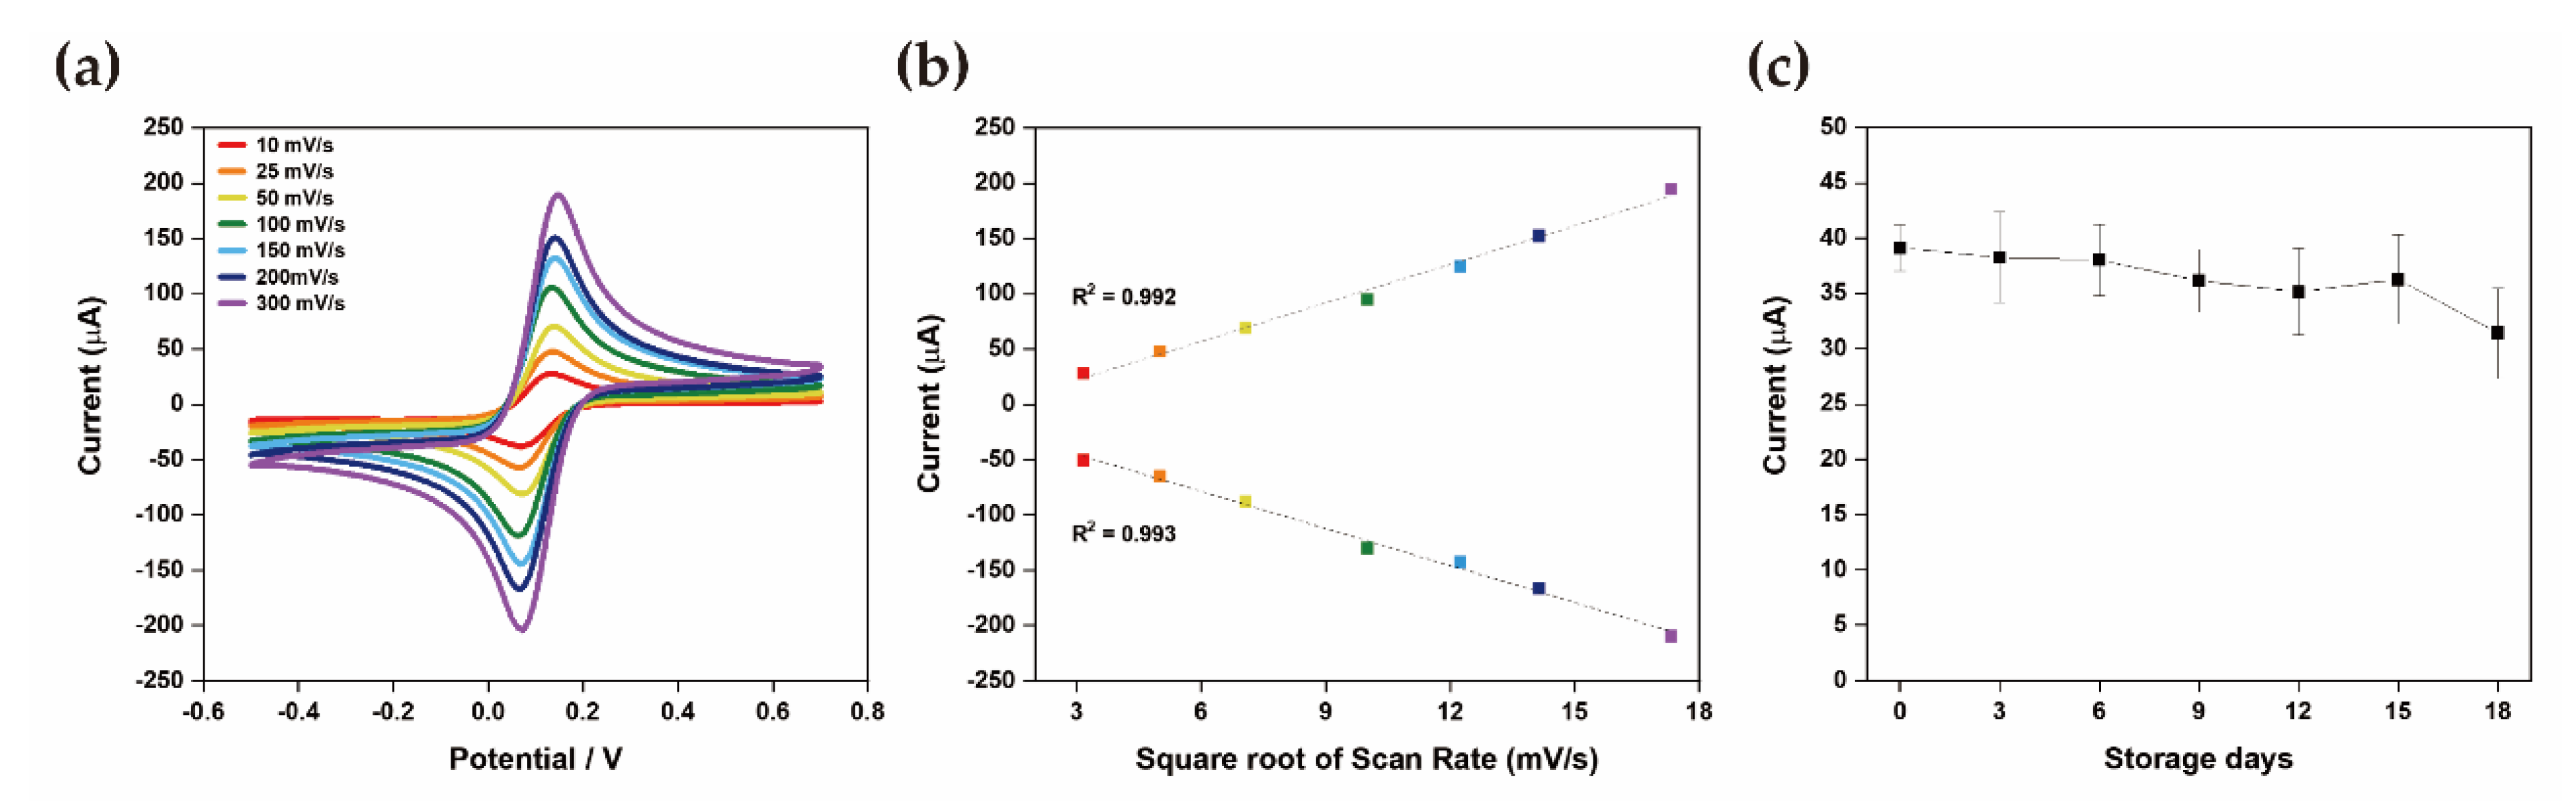
3.2. Stability
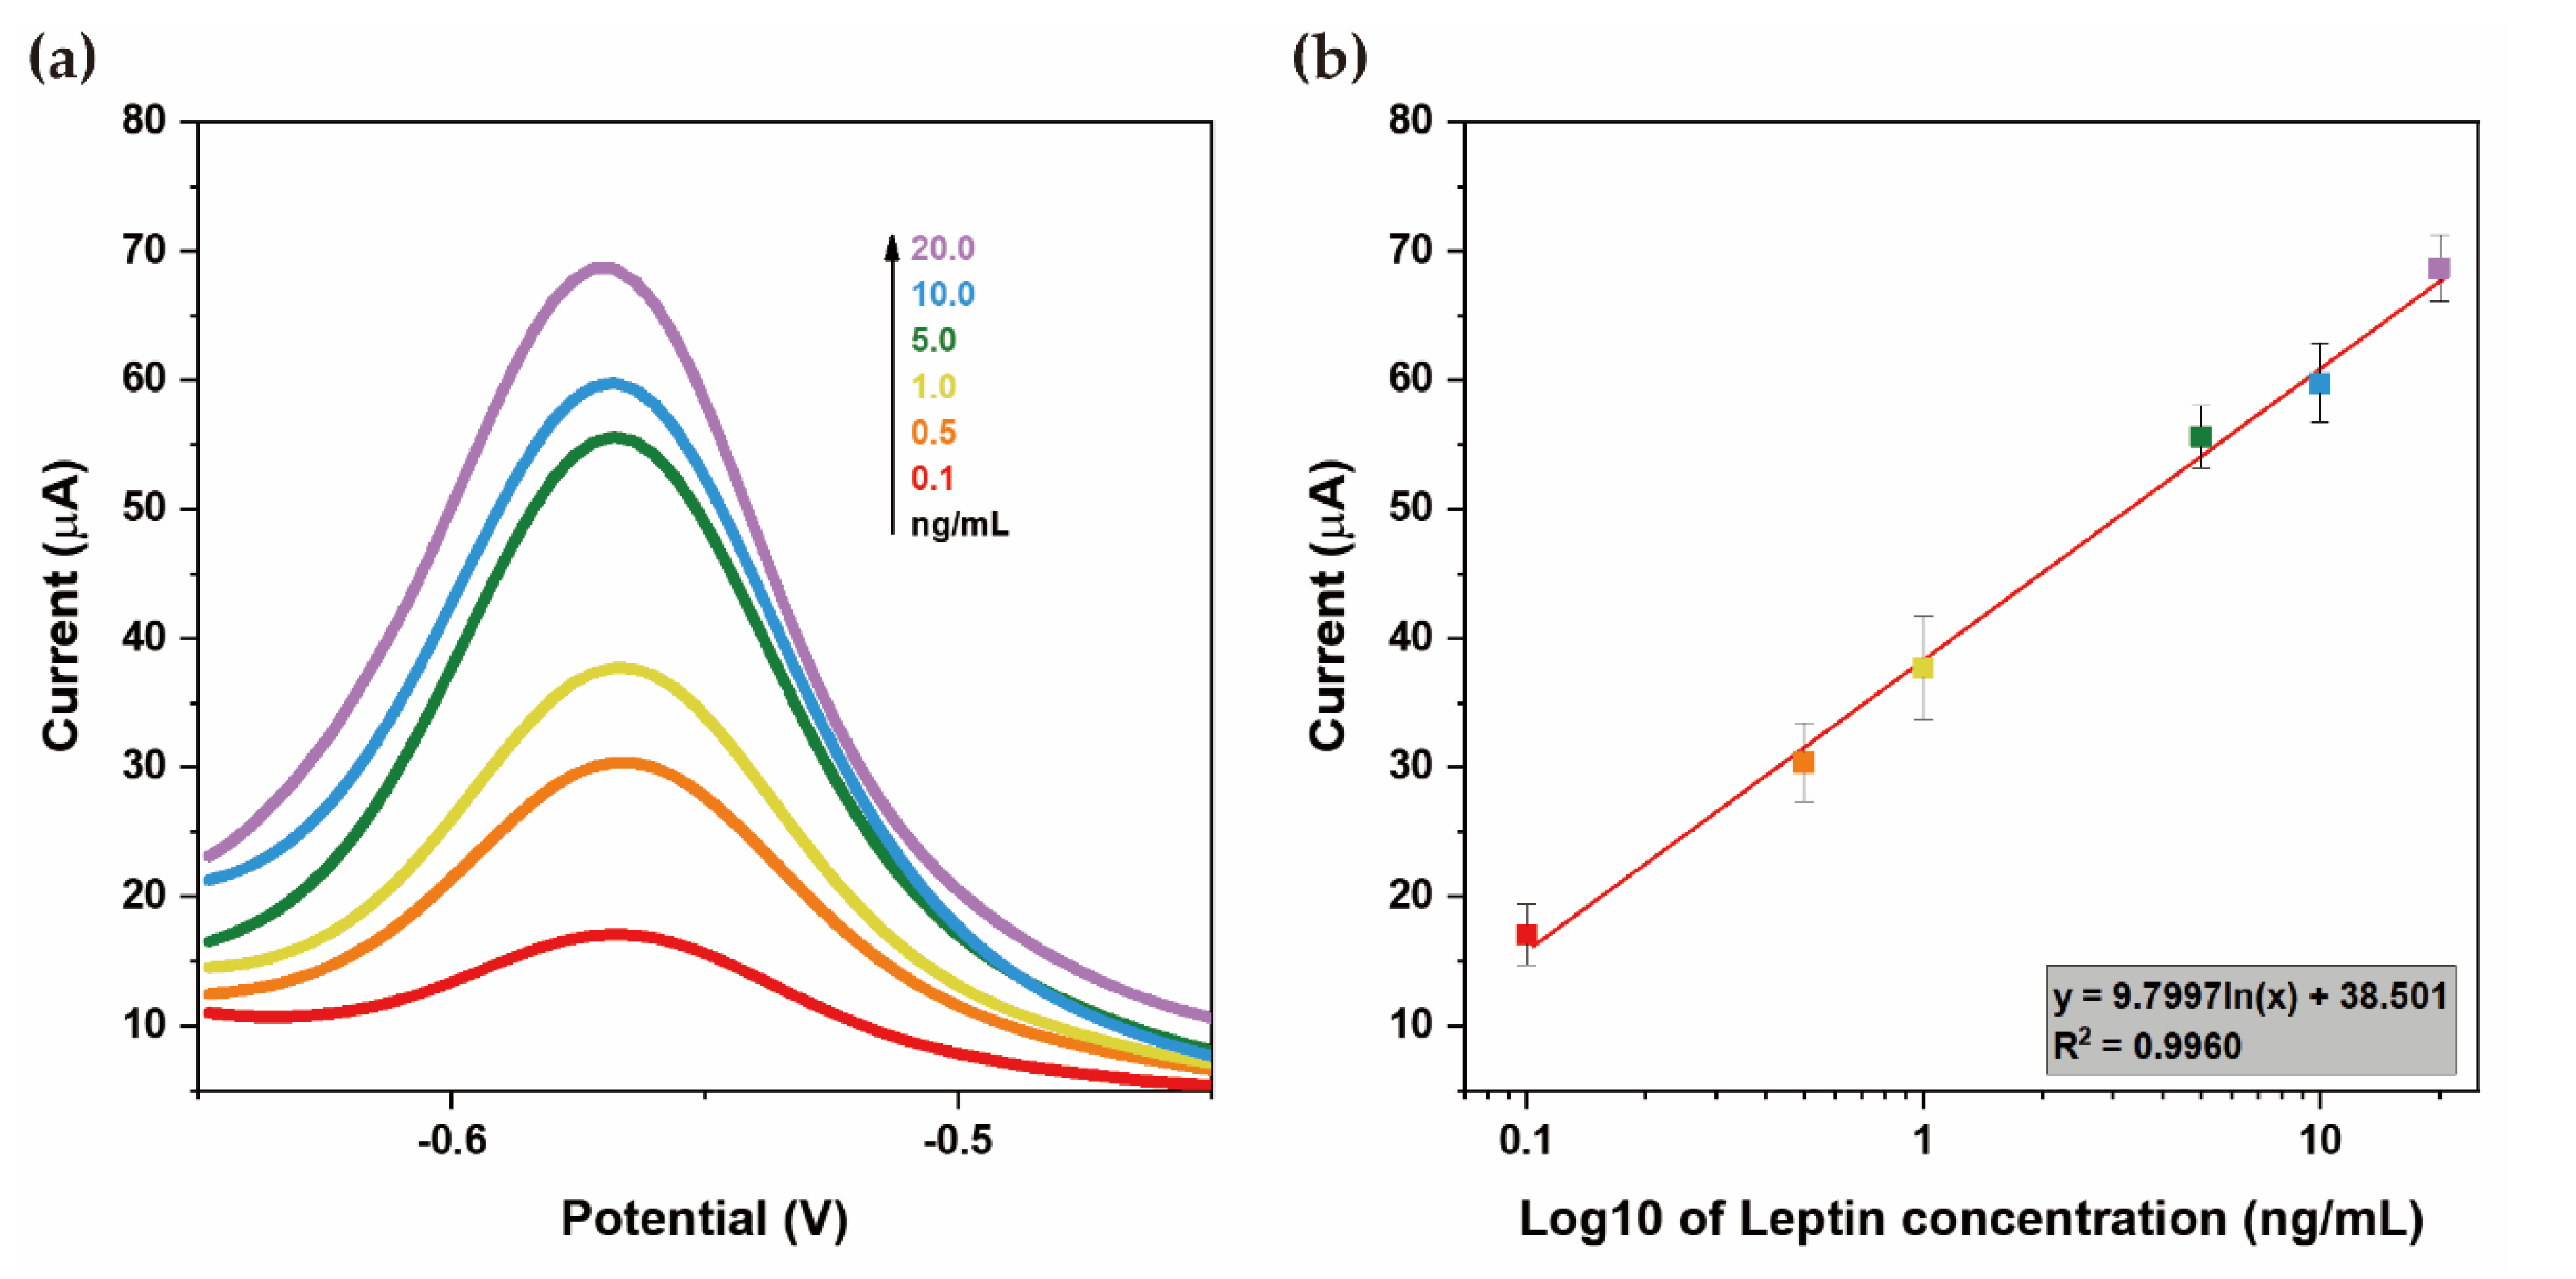
3.3. Sensitivity
3.4. Selectivity
3.5. Effectivity
4. Conclusions
Author Contributions
Funding
Institutional Review Board Statement
Acknowledgments
Conflicts of Interest
References
- Tremmel, M.; Gerdtham, U.G.; Nilsson, P.M.; Saha, S. Economic Burden of Obesity: A Systematic Literature Review. Int. J. Environ. Res. Public Health 2017, 14, 435. [Google Scholar] [CrossRef] [PubMed]
- James, P.T. Obesity: The worldwide epidemic. Clin. Derm. 2004, 22, 276–280. [Google Scholar] [CrossRef] [PubMed]
- la Cuesta-Zuluaga, D.; Mueller, N.T.; Álvarez-Quintero, R.; Velásquez-Mejía, E.P.; Sierra, J.A.; Corrales-Agudelo, V.; Carmona, J.A.; Abad, J.M.; Escobar, J.S. Higher fecal short-chain fatty acid levels are associated with gut microbiome dysbiosis, obesity, hypertension and cardiometabolic disease risk factors. Nutrients 2019, 11, 51. [Google Scholar] [CrossRef] [PubMed] [Green Version]
- De Pergola, G.; Silvestris, F. Obesity as a major risk factor for cancer. J. Obes. 2013, 2013, 1–11. [Google Scholar] [CrossRef] [Green Version]
- Rice, J.R.; Larrabure-Torrealva, G.T.; Fernandez, M.A.L.; Grande, M.; Motta, V.; Barrios, Y.V.; Sanchez, S.; Gelaye, B.; Williams, M.A. High risk for obstructive sleep apnea and other sleep disorders among overweight and obese pregnant women. BMC Pregnancy Childbirth 2015, 15, 198. [Google Scholar] [CrossRef] [Green Version]
- Daneshgari, F.; Liu, G.; Hanna-Mitchell, A.T. Path of translational discovery of urological complications of obesity and diabetes. Am. J. Physiol. Ren. Physiol. 2017, 312, F887–F896. [Google Scholar] [CrossRef] [Green Version]
- Davy, K.P.; Hall, J.E. Obesity and hypertension: Two epidemics or one? Am. J. Physiol. Regul. Integr. Comp. Physiol. 2004, 286, R803–R813. [Google Scholar] [CrossRef]
- Minocci, A.; Savia, G.; Lucantoni, R.; Berselli, M.; Tagliaferri, M.; Calo, G.; Petroni, M.; De Medici, C.; Viberti, G.; Liuzzi, A. Leptin plasma concentrations are dependent on body fat distribution in obese patients. Int. J. Obes. 2000, 24, 1139–1144. [Google Scholar] [CrossRef] [Green Version]
- Otero, M.; Lago, R.o.; Lago, F.; Casanueva, F.F.; Dieguez, C.; Gómez-Reino, J.J.; Gualillo, O. Leptin, from fat to inflammation: Old questions and new insights. FEBS Lett. 2005, 579, 295–301. [Google Scholar] [CrossRef] [Green Version]
- Houseknecht, K.L.; Baile, C.A.; Matteri, R.L.; Spurlock, M.E. The biology of leptin: A review. Anim. Sci. J. 1998, 76, 1405–1420. [Google Scholar] [CrossRef] [Green Version]
- Rosenbaum, M.; Nicolson, M.; Hirsch, J.; Heymsfield, S.B.; Gallagher, D.; Chu, F.; Leibel, R.L. Effects of gender, body composition, and menopause on plasma concentrations of leptin. J. Clin. Endocrinol. Metab. 1996, 81, 3424–3427. [Google Scholar]
- Vadacca, M.; Margiotta, D.P.; Navarini, L.; Afeltra, A. Leptin in immuno-rheumatological diseases. Cell. Mol. Immunol. 2011, 8, 203–212. [Google Scholar] [CrossRef] [PubMed] [Green Version]
- Landecho, M.F.; Tuero, C.; Valentí, V.; Bilbao, I.; de la Higuera, M.; Frühbeck, G. Relevance of leptin and other adipokines in obesity-associated cardiovascular risk. Nutrients 2019, 11, 2664. [Google Scholar] [CrossRef] [Green Version]
- McGregor, G.; Harvey, J. Regulation of hippocampal synaptic function by the metabolic hormone, leptin: Implications for health and neurodegenerative disease. Front. Cell. Neurosci. 2018, 12, 340. [Google Scholar] [CrossRef]
- Procaccini, C.; Pucino, V.; Mantzoros, C.S.; Matarese, G. Leptin in autoimmune diseases. Metabolism 2015, 64, 92–104. [Google Scholar] [CrossRef] [PubMed]
- McGregor, G.P.; Desaga, J.F.; Ehlenz, K.; Fischer, A.; Heese, F.; Hegele, A.; Lammer, C.; Peiser, C.; Lang, R. Radiommunological measurement of leptin in plasma of obese and diabetic human subjects. Endocrinology 1996, 137, 1501–1504. [Google Scholar] [CrossRef] [PubMed]
- Chow, V.T.; Phoon, M. Measurement of serum leptin concentrations in university undergraduates by competitive ELISA reveals correlations with body mass index and sex. AJP 2003, 27, 70–77. [Google Scholar] [CrossRef] [PubMed]
- Maffei, Á.; Halaas, J.; Ravussin, E.; Pratley, R.; Lee, G.; Zhang, Y.; Fei, H.; Kim, S.; Lallone, R.; Ranganathan, S. Leptin levels in human and rodent: Measurement of plasma leptin and ob RNA in obese and weight-reduced subjects. Nat. Med. 1995, 1, 1155–1161. [Google Scholar] [CrossRef]
- Uniyal, S.; Sharma, R.K. Technological advancement in electrochemical biosensor based detection of Organophosphate pesticide chlorpyrifos in the environment: A review of status and prospects. Biosens. Bioelectron. 2018, 116, 37–50. [Google Scholar] [CrossRef]
- Morrin, A.; Killard, A.J.; Smyth, M.R. Electrochemical characterization of commercial and home-made screen-printed carbon electrodes. Anal. Lett. 2003, 36, 2021–2039. [Google Scholar] [CrossRef] [Green Version]
- Ul Hassan Alvi, N.; Gómez, V.J.; Soto Rodriguez, P.E.; Kumar, P.; Zaman, S.; Willander, M.; Nötzel, R. An InN/InGaN quantum dot electrochemical biosensor for clinical diagnosis. Sensors 2013, 13, 13917. [Google Scholar] [CrossRef]
- Hosseini, S.; Vázquez-Villegas, P.; Rito-Palomares, M.; Martinez-Chapa, S.O. Advantages, disadvantages and modifications of conventional ELISA. In Enzyme-Linked Immunosorbent Assay (ELISA); Springer: Berlin/Heidelberg, Germany, 2018; pp. 67–115. [Google Scholar]
- Strable, M.S.; Ntambi, J.M. Genetic control of de novo lipogenesis: Role in diet-induced obesity. Crit. Rev. Biochem. Mol. Biol. 2010, 45, 199–214. [Google Scholar] [CrossRef] [PubMed] [Green Version]
- Hariri, N.; Thibault, L. High-fat diet-induced obesity in animal models. Nutr. Res. Rev. 2010, 23, 270–299. [Google Scholar] [CrossRef] [PubMed] [Green Version]
- Loos, R.J.; Bouchard, C. Obesity–is it a genetic disorder? J. Intern. Med. 2003, 254, 401–425. [Google Scholar] [CrossRef] [PubMed]
- Hwang, L.L.; Wang, C.H.; Li, T.L.; Chang, S.D.; Lin, L.C.; Chen, C.P.; Chen, C.T.; Liang, K.C.; Ho, I.K.; Yang, W.S.; et al. Sex differences in high-fat diet-induced obesity, metabolic alterations and learning, and synaptic plasticity deficits in mice. Obesity 2010, 18, 463–469. [Google Scholar] [CrossRef] [PubMed]
- Lo, K.A.; Sun, L. Turning WAT into BAT: A review on regulators controlling the browning of white adipocytes. Biosci. Rep. 2013, 33, e00065. [Google Scholar] [CrossRef] [PubMed]
- Rodriguez, A.; Becerril, S.; Ezquerro, S.; Mendez-Gimenez, L.; Frühbeck, G. Crosstalk between adipokines and myokines in fat browning. Acta Physiol. 2017, 219, 362–381. [Google Scholar] [CrossRef] [PubMed]
- Blundell, J.E.; Dulloo, A.G.; Salvador, J.; Frühbeck, G. Beyond BMI-phenotyping the obesities. Obes. Facts 2014, 7, 322–328. [Google Scholar] [CrossRef]


| Sample (ng/mL) | Added (ng/mL) | Found * (ng/mL) | Recovery (%) |
|---|---|---|---|
| Leptin | 5.0 (Leptin) | 4.69 ± 0.36 | 93.8 |
| Leptin + Insulin | 5.0 (Leptin) + 5.0 (Insulin) | 5.40 ± 0.34 | 108 |
| Leptin + Glucose | 5.0 (Leptin) + 5.0 (Glucose) | 4.96 ± 0.55 | 99.2 |
| Leptin + Urea | 5.0 (Leptin) + 5.0 (Urea) | 4.71 ± 0.76 | 94.2 |
| Leptin + Insulin + Glucose | 5.0 (Leptin) + 5.0 (Insulin) + 5.0 (Glucose) | 5.51 ± 0.61 | 110 |
| Samples (Plasma) | Commercial Leptin ELISA Kit (Absorbance) (ng/mL) | Sandwich ELISA-Based Leptin Biosensor * (ng/mL) | Difference (%) |
|---|---|---|---|
| ND S1 | 04.25 | 04.64 ± 0.26 | 8.40 |
| ND S2 | 05.27 | 05.02 ± 0.37 | 4.98 |
| ND S3 | 03.21 | 03.08 ± 0.49 | 4.22 |
| ND S4 | 03.11 | 03.42 ± 0.22 | 9.06 |
| ND S5 | 06.18 | 05.86 ± 0.39 | 5.46 |
| HFD S1 | 12.69 | 11.58 ± 0.41 | 9.59 |
| HFD S2 | 17.25 | 18.58 ± 0.55 | 7.16 |
| HFD S3 | 15.58 | 15.02 ± 0.49 | 3.73 |
| HFD S4 | 11.08 | 12.20 ± 0.71 | 9.18 |
| HFD S5 | 16.93 | 15.82 ± 0.65 | 7.02 |
Publisher’s Note: MDPI stays neutral with regard to jurisdictional claims in published maps and institutional affiliations. |
© 2020 by the authors. Licensee MDPI, Basel, Switzerland. This article is an open access article distributed under the terms and conditions of the Creative Commons Attribution (CC BY) license (http://creativecommons.org/licenses/by/4.0/).
Share and Cite
Sung, R.; Heo, Y.S. Sandwich ELISA-Based Electrochemical Biosensor for Leptin in Control and Diet-Induced Obesity Mouse Model. Biosensors 2021, 11, 7. https://doi.org/10.3390/bios11010007
Sung R, Heo YS. Sandwich ELISA-Based Electrochemical Biosensor for Leptin in Control and Diet-Induced Obesity Mouse Model. Biosensors. 2021; 11(1):7. https://doi.org/10.3390/bios11010007
Chicago/Turabian StyleSung, Ryong, and Yun Seok Heo. 2021. "Sandwich ELISA-Based Electrochemical Biosensor for Leptin in Control and Diet-Induced Obesity Mouse Model" Biosensors 11, no. 1: 7. https://doi.org/10.3390/bios11010007