Thermocatalytic Behavior of Manganese (IV) Oxide as Nanoporous Material on the Dissociation of a Gas Mixture Containing Hydrogen Peroxide

 ,
, 
Abstract
:
1. Introduction
2. Calorimetric HO Sensor
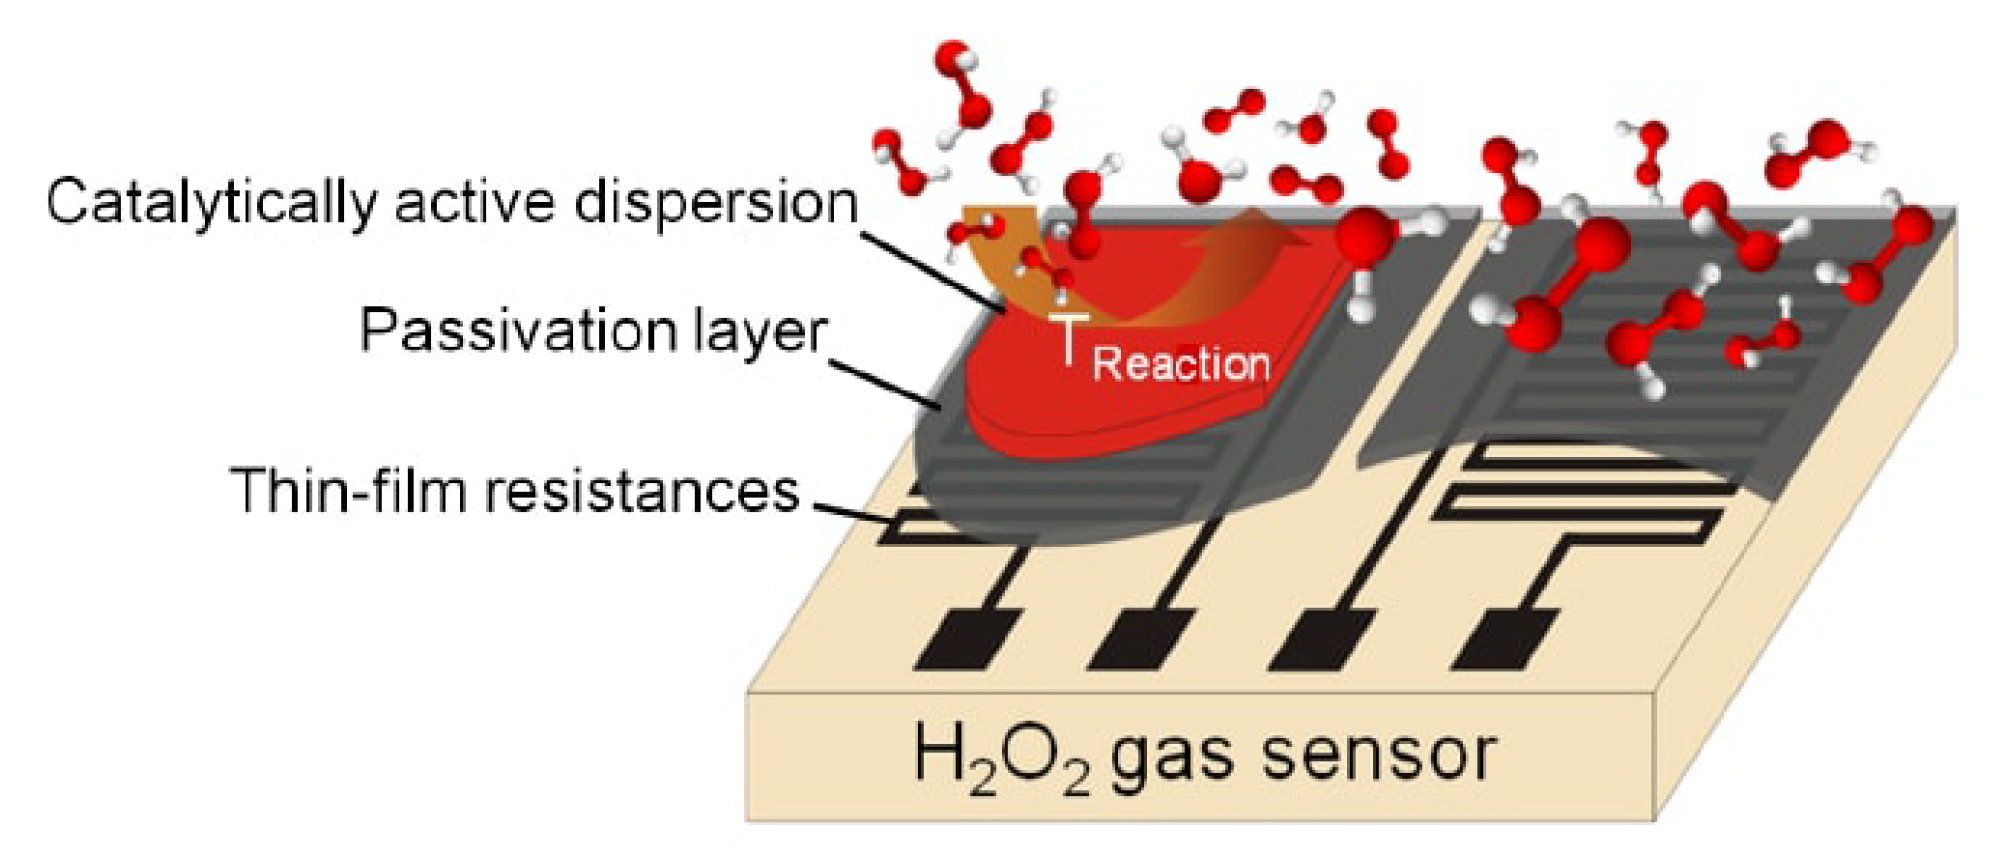
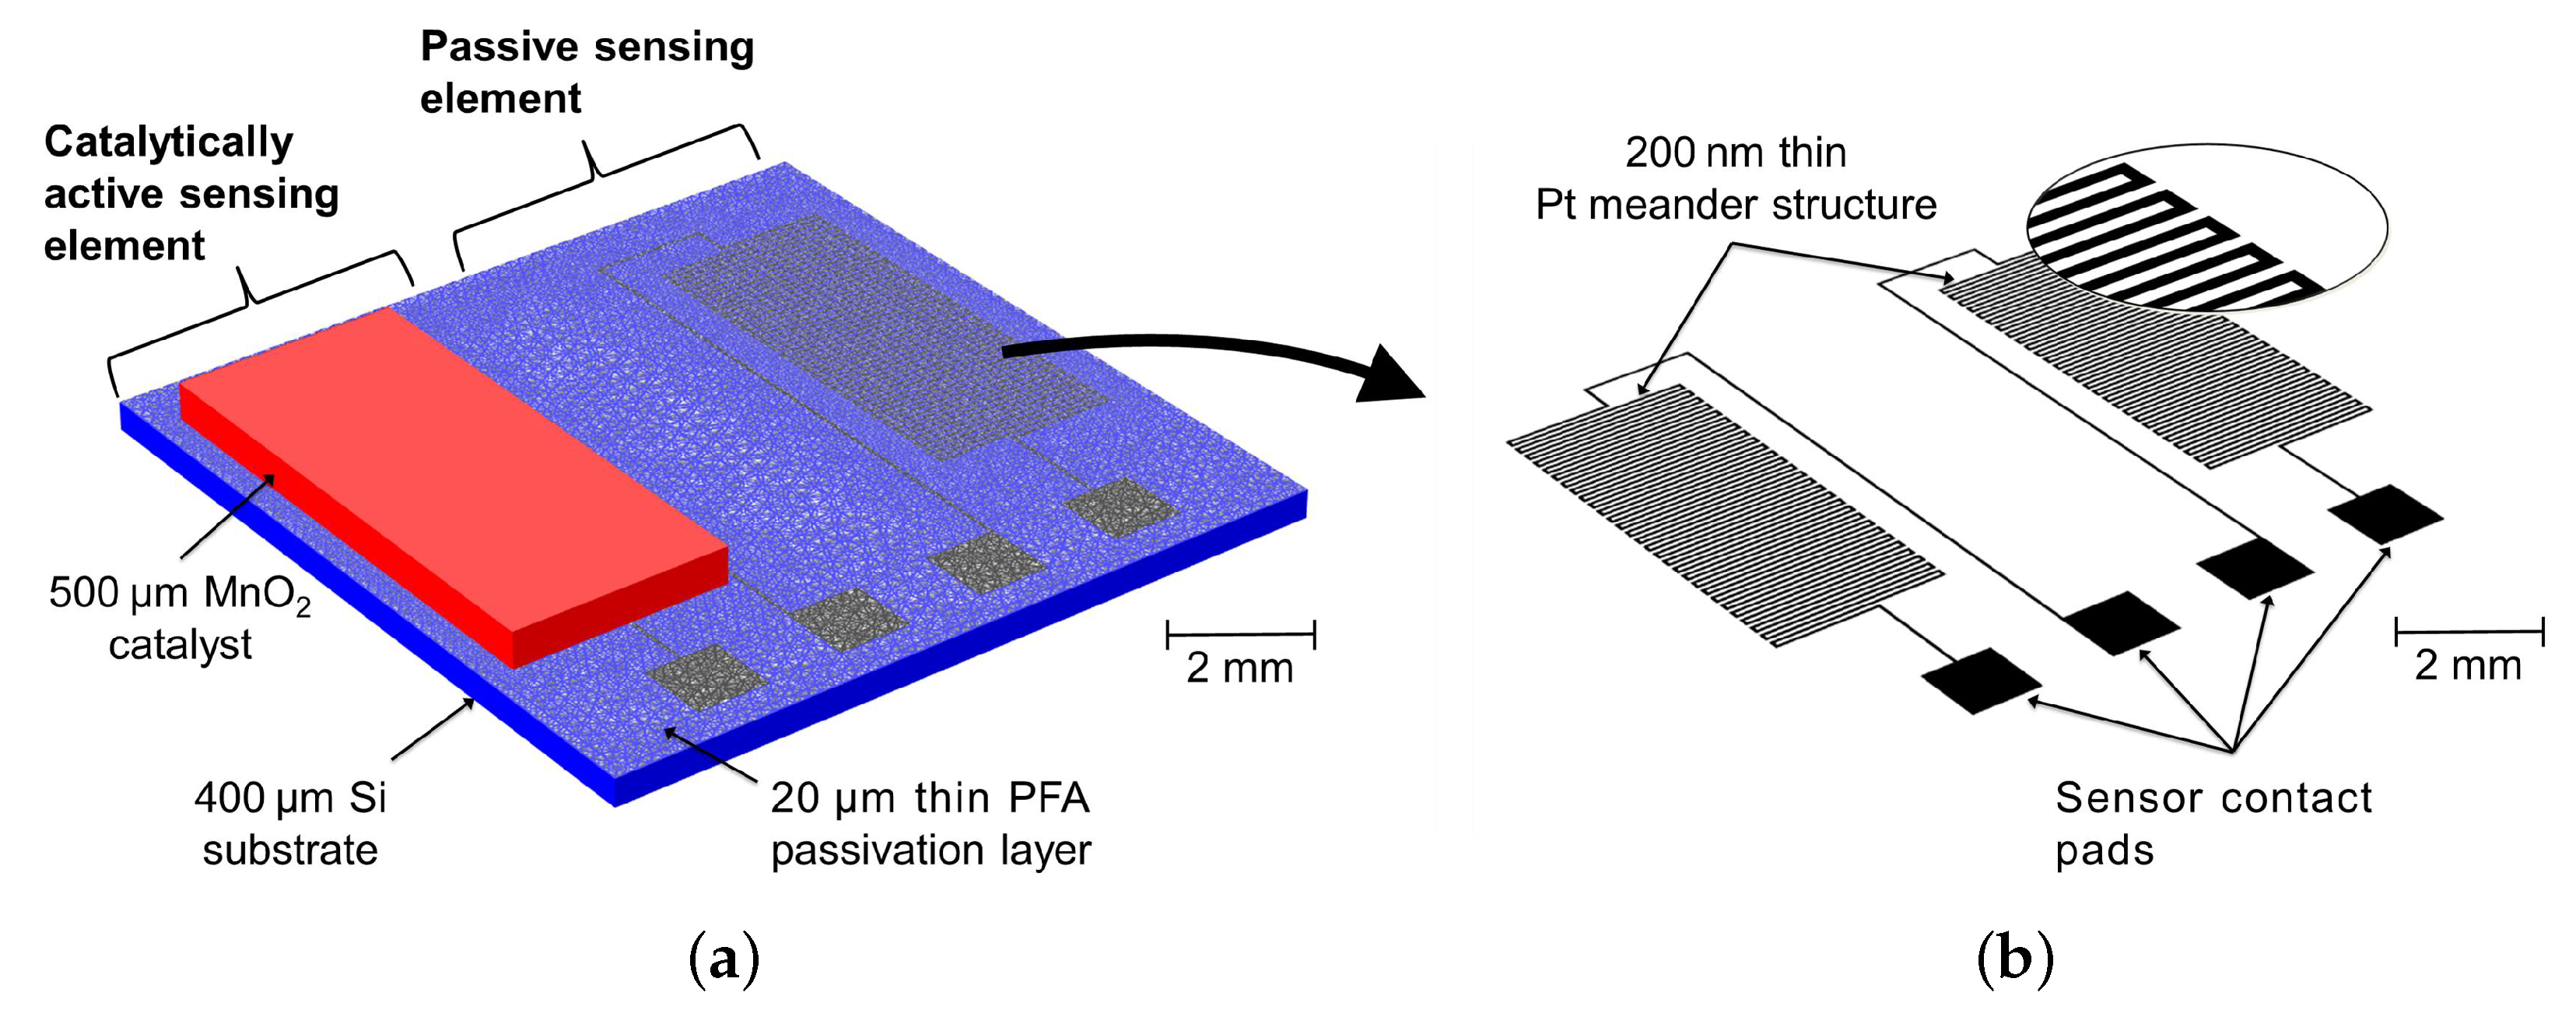
2.1. Design
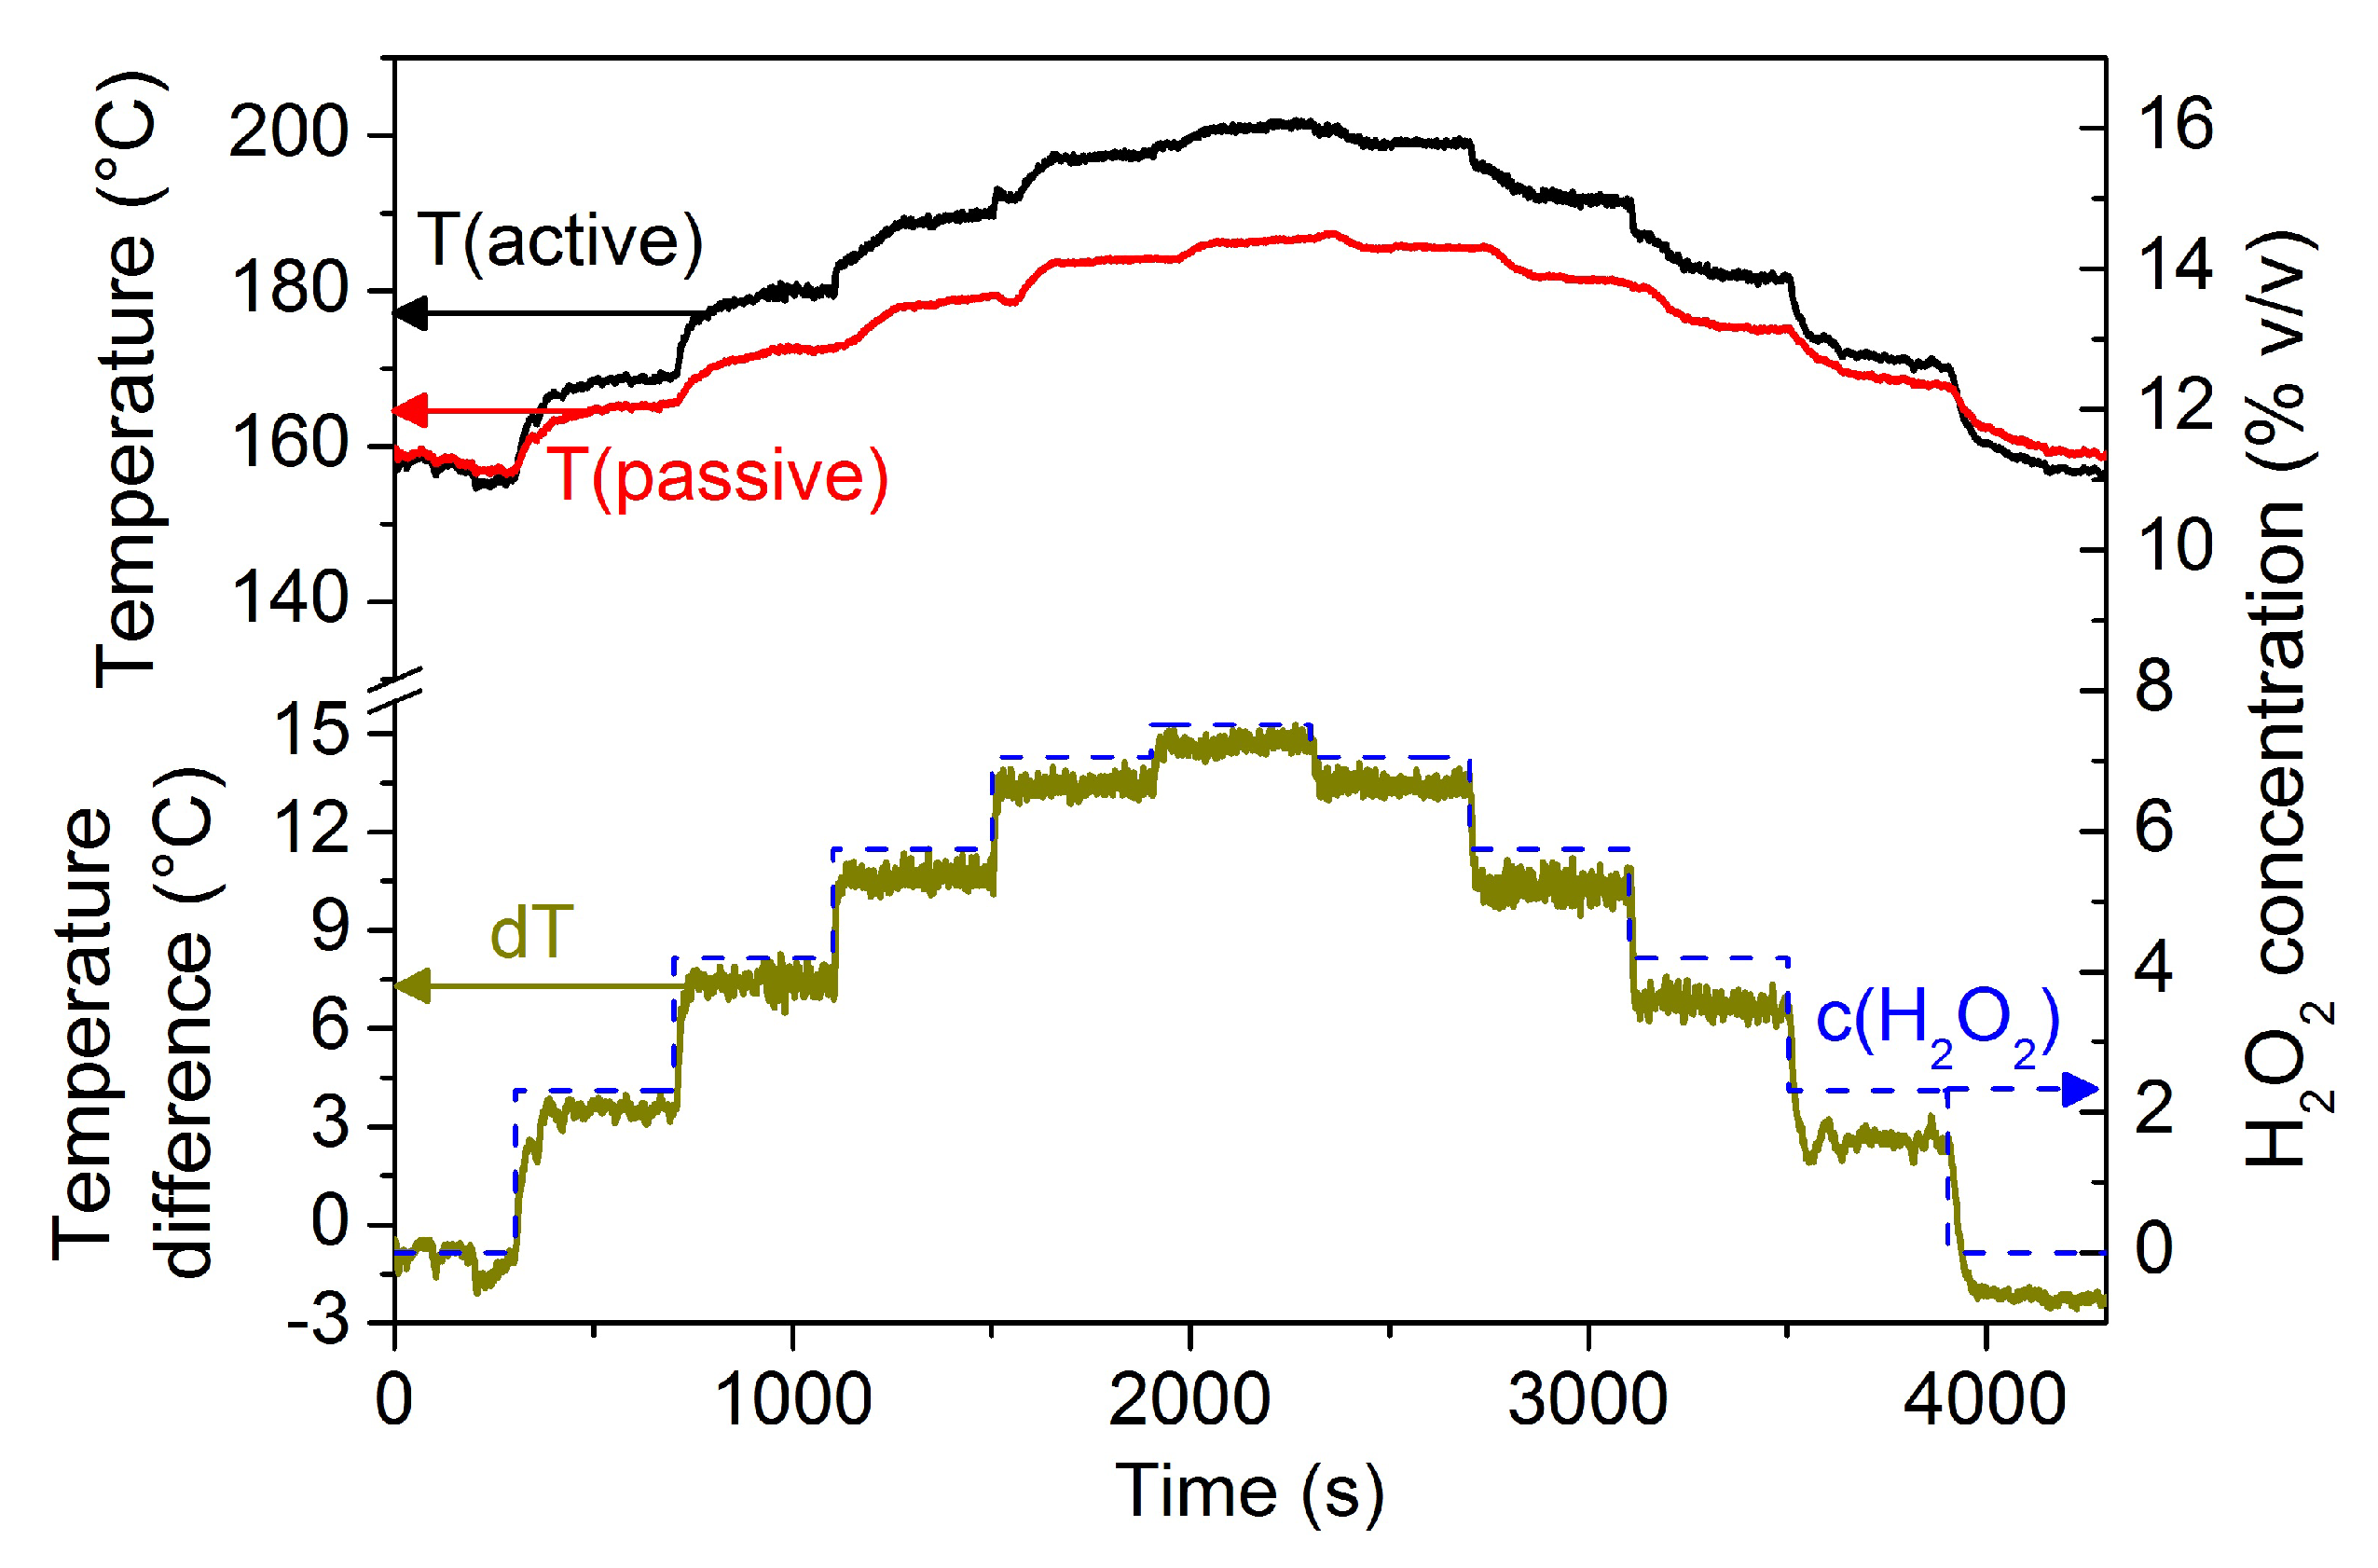
2.2. Sensor Measurements
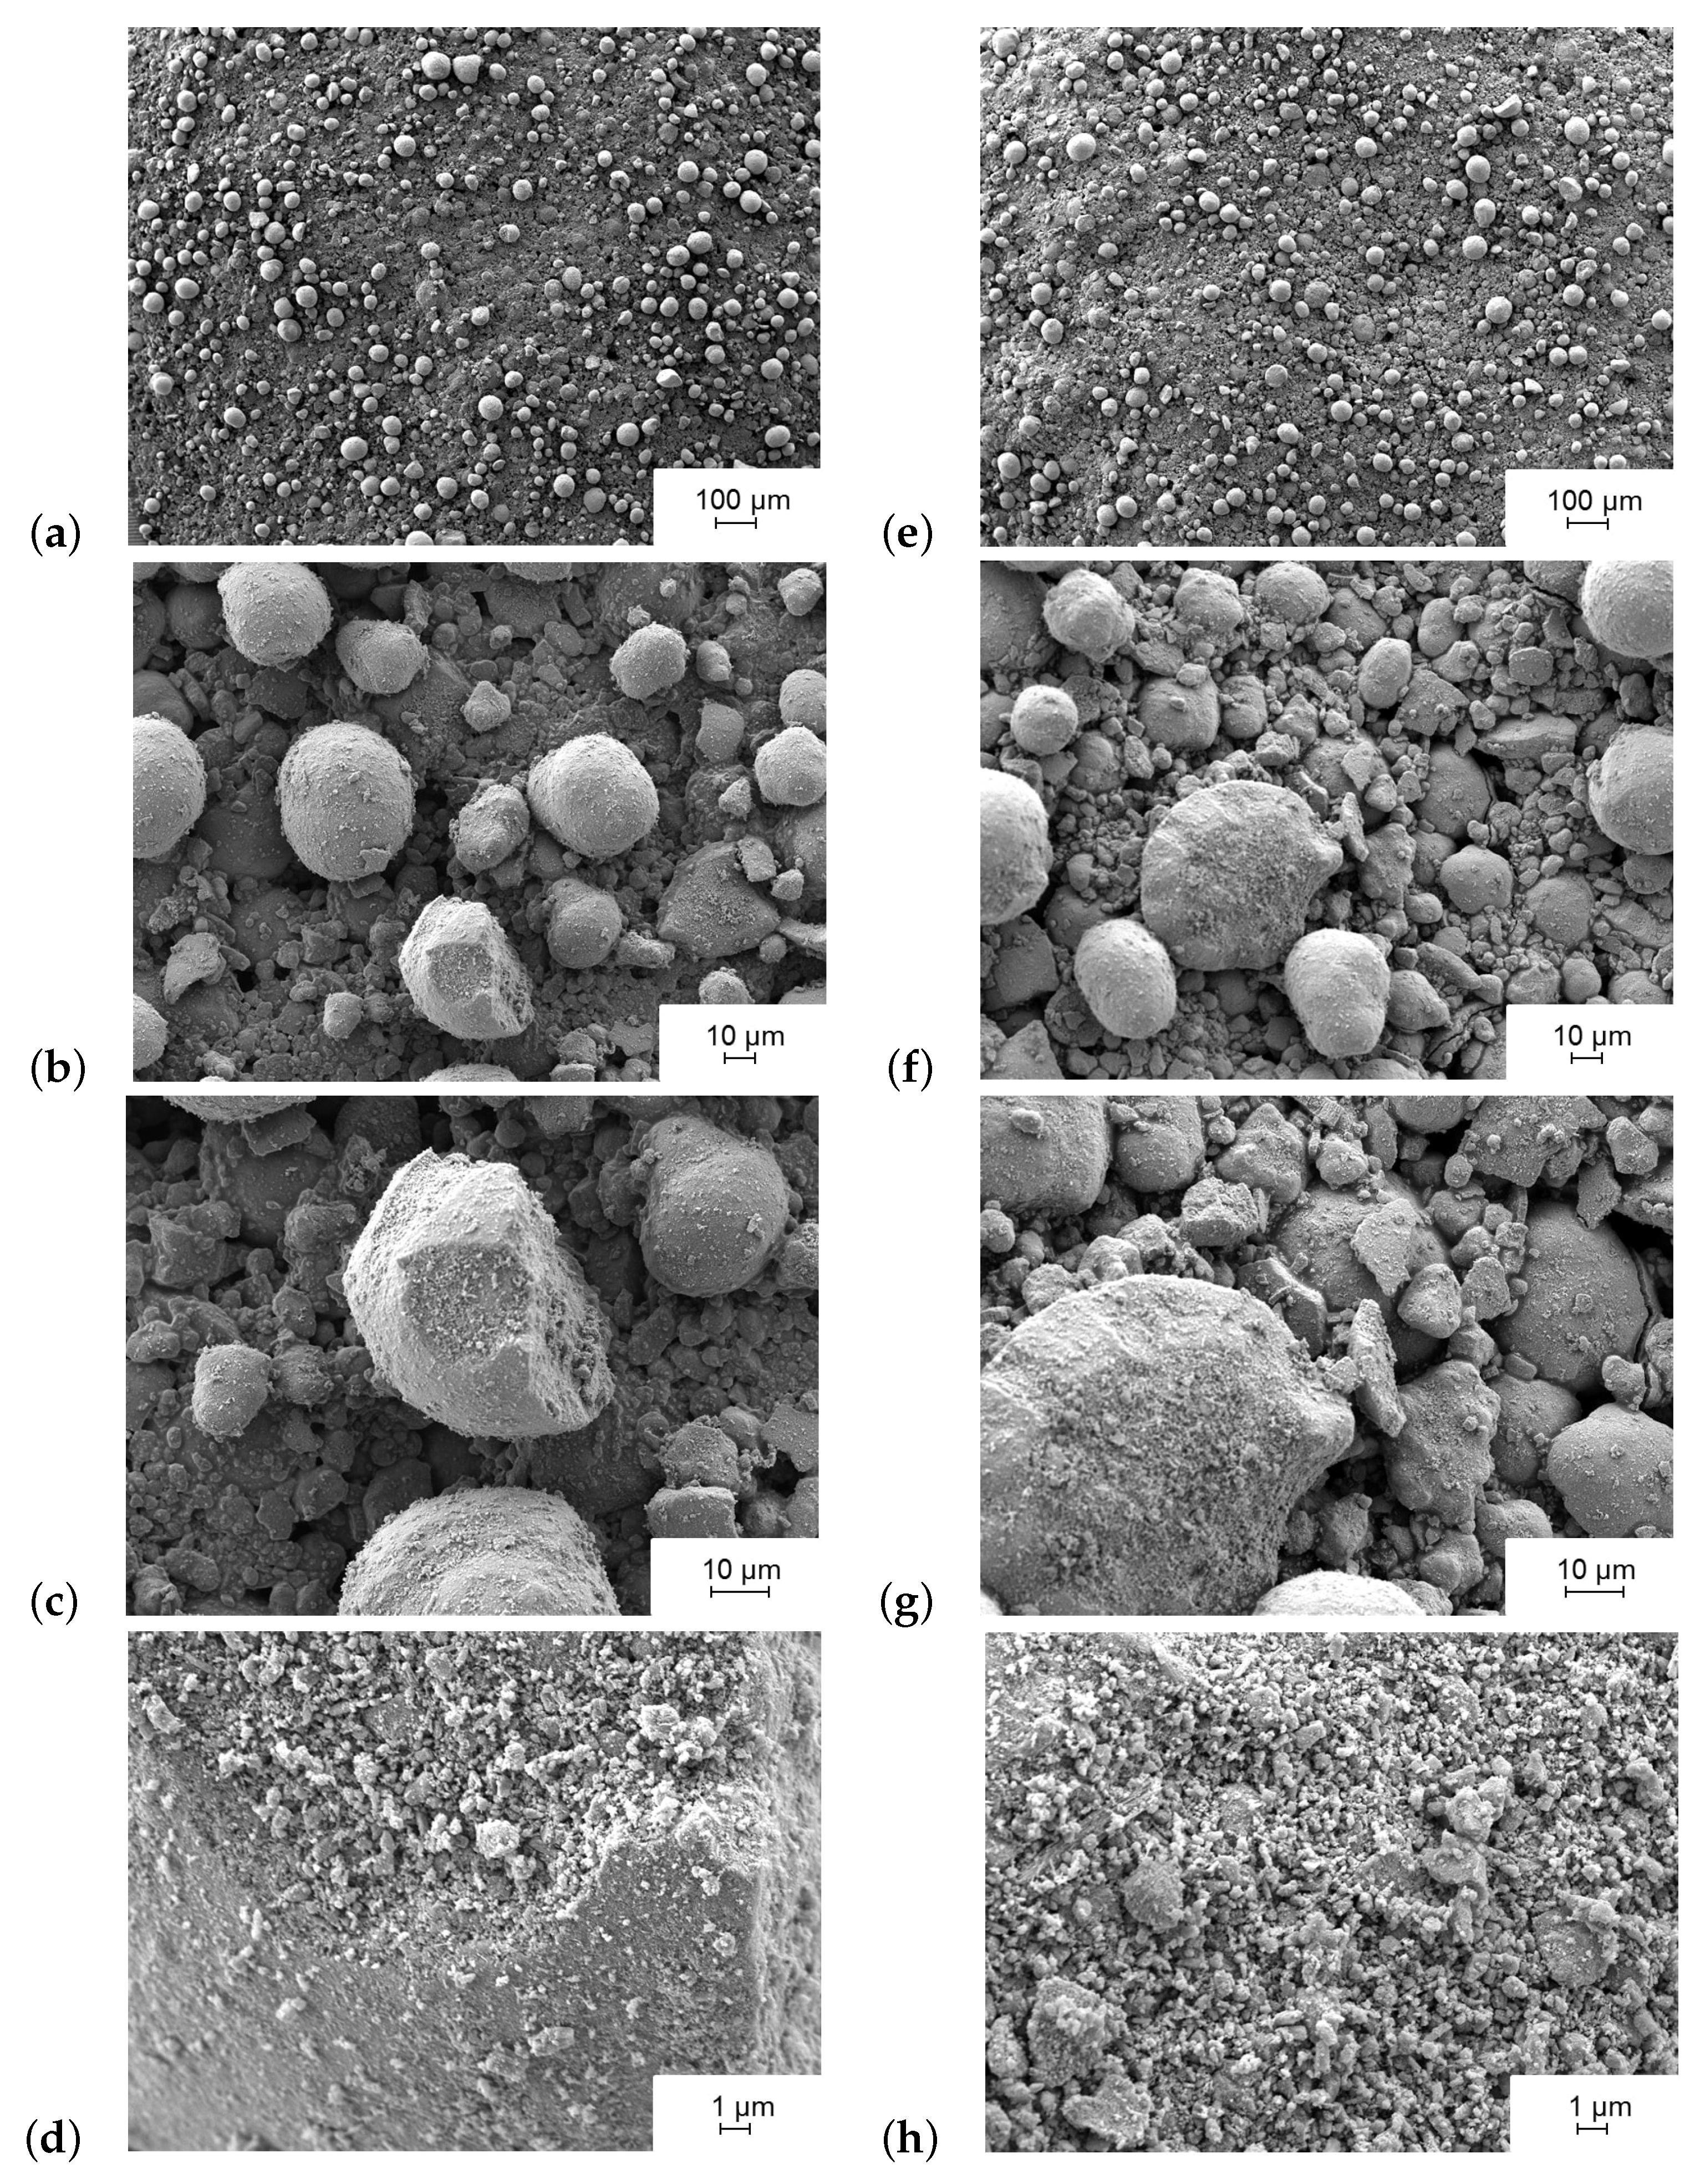
2.3. Scanning Electron Microscopy (SEM)
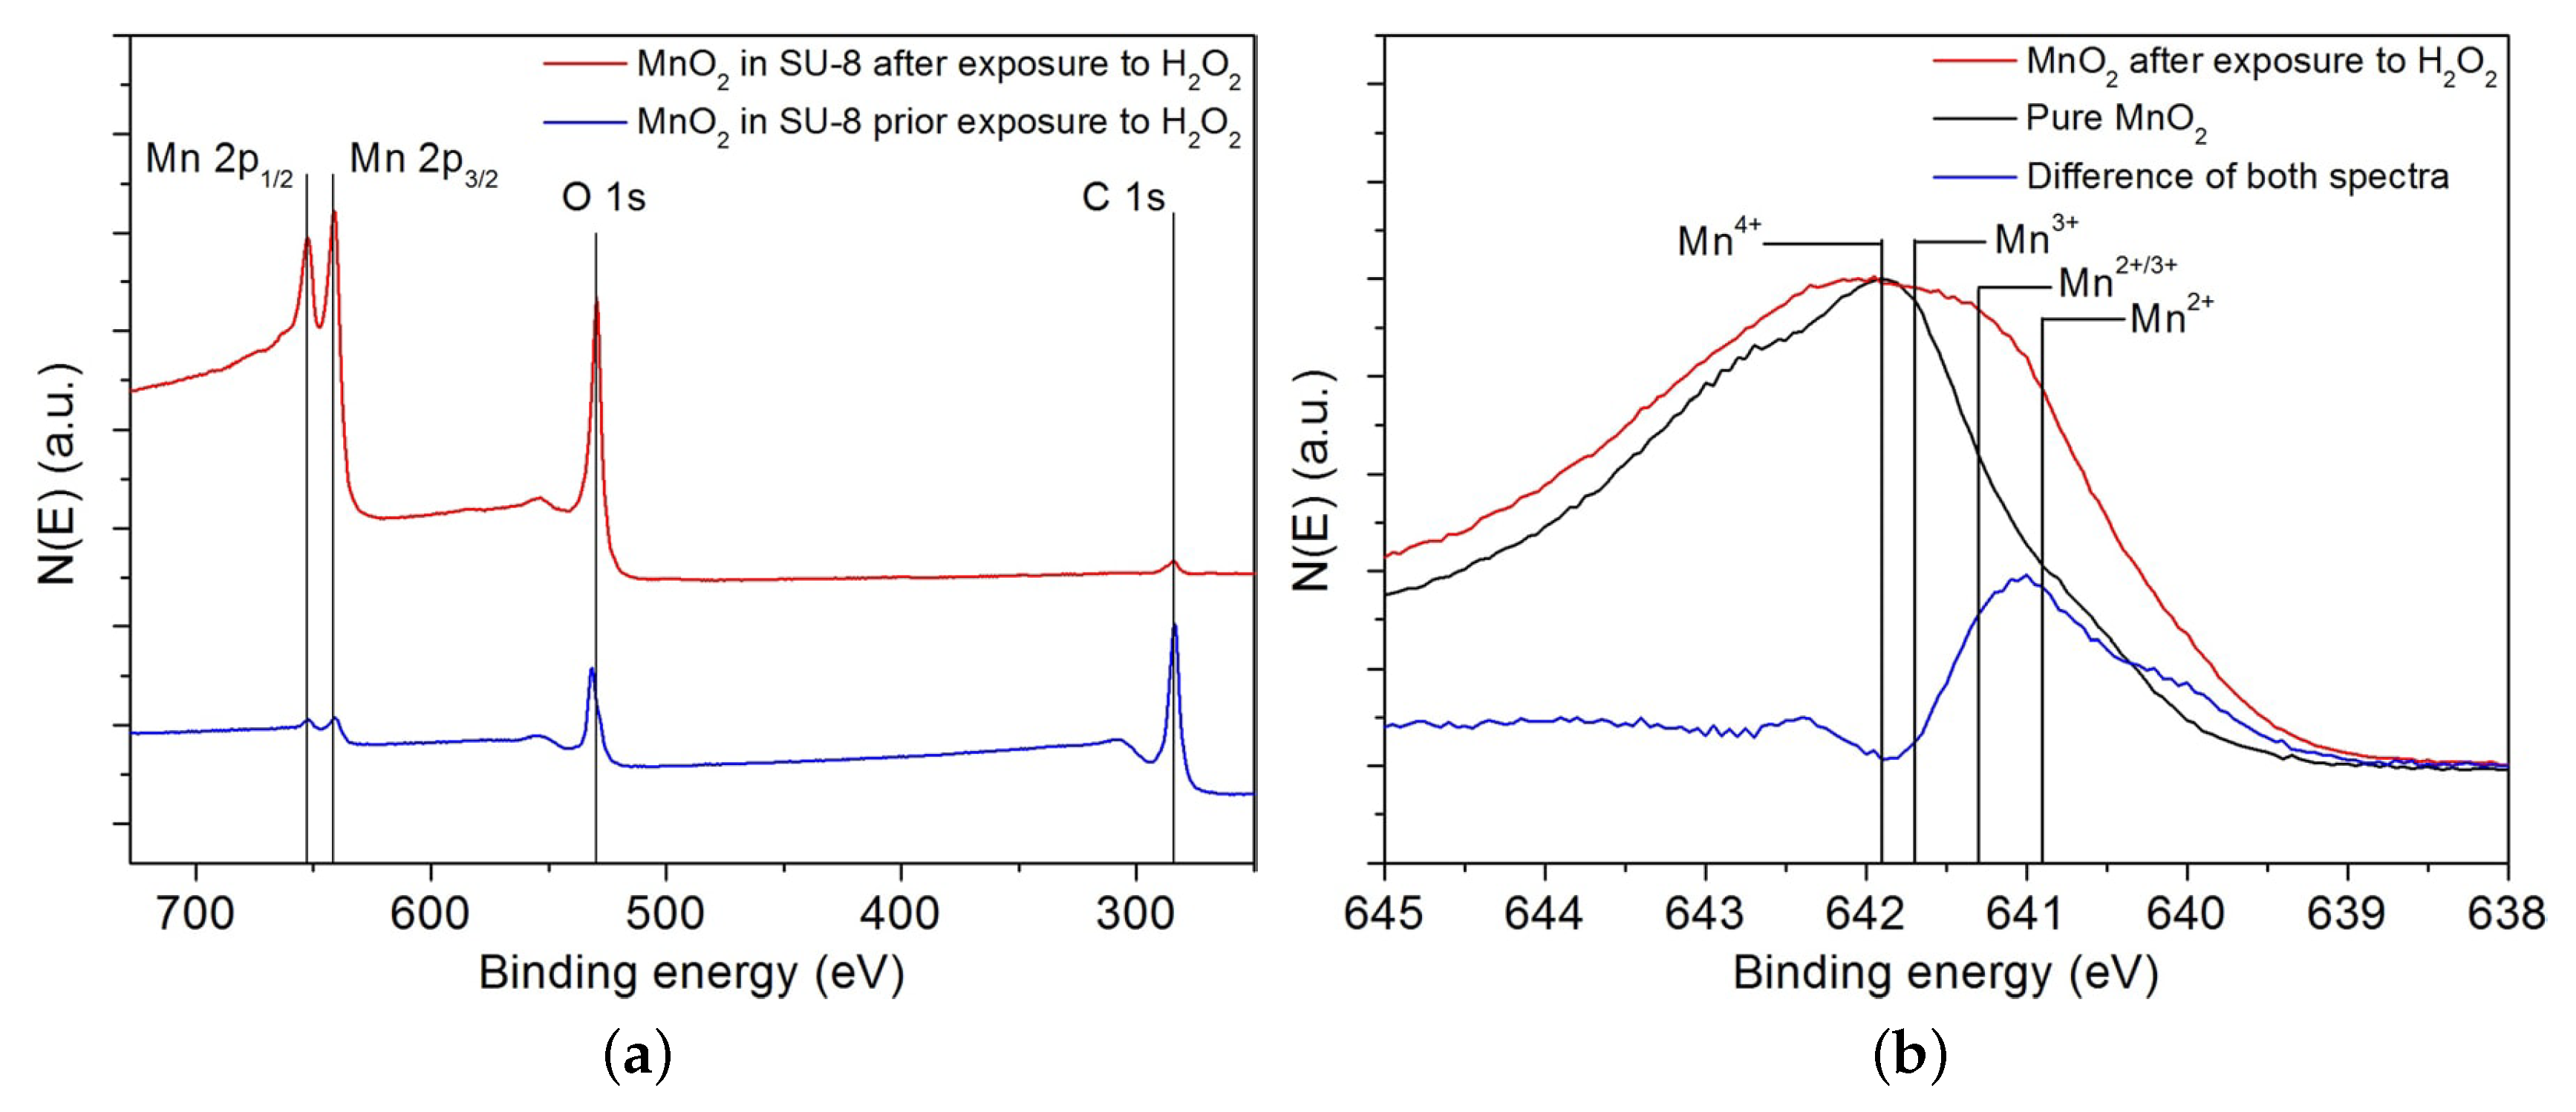
2.4. X-ray Photoelectron Spectroscopy (XPS)
3. Numerical Models
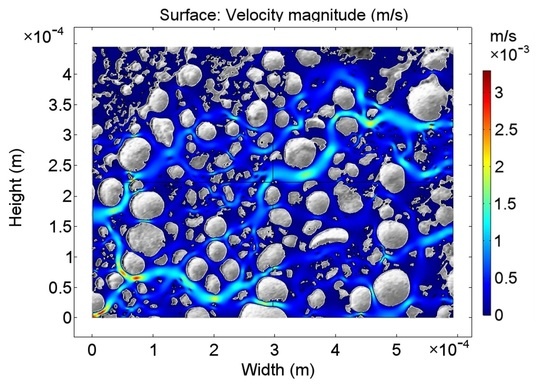
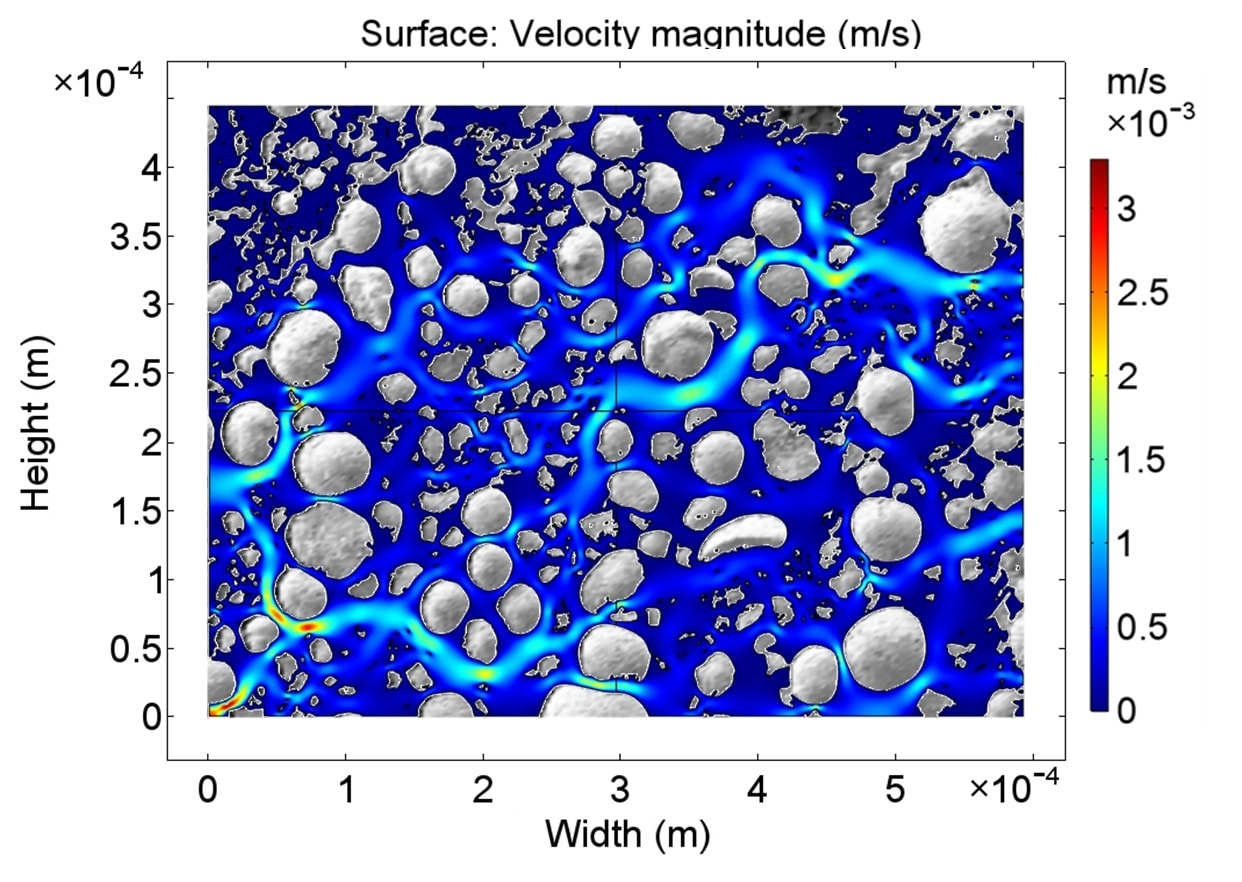
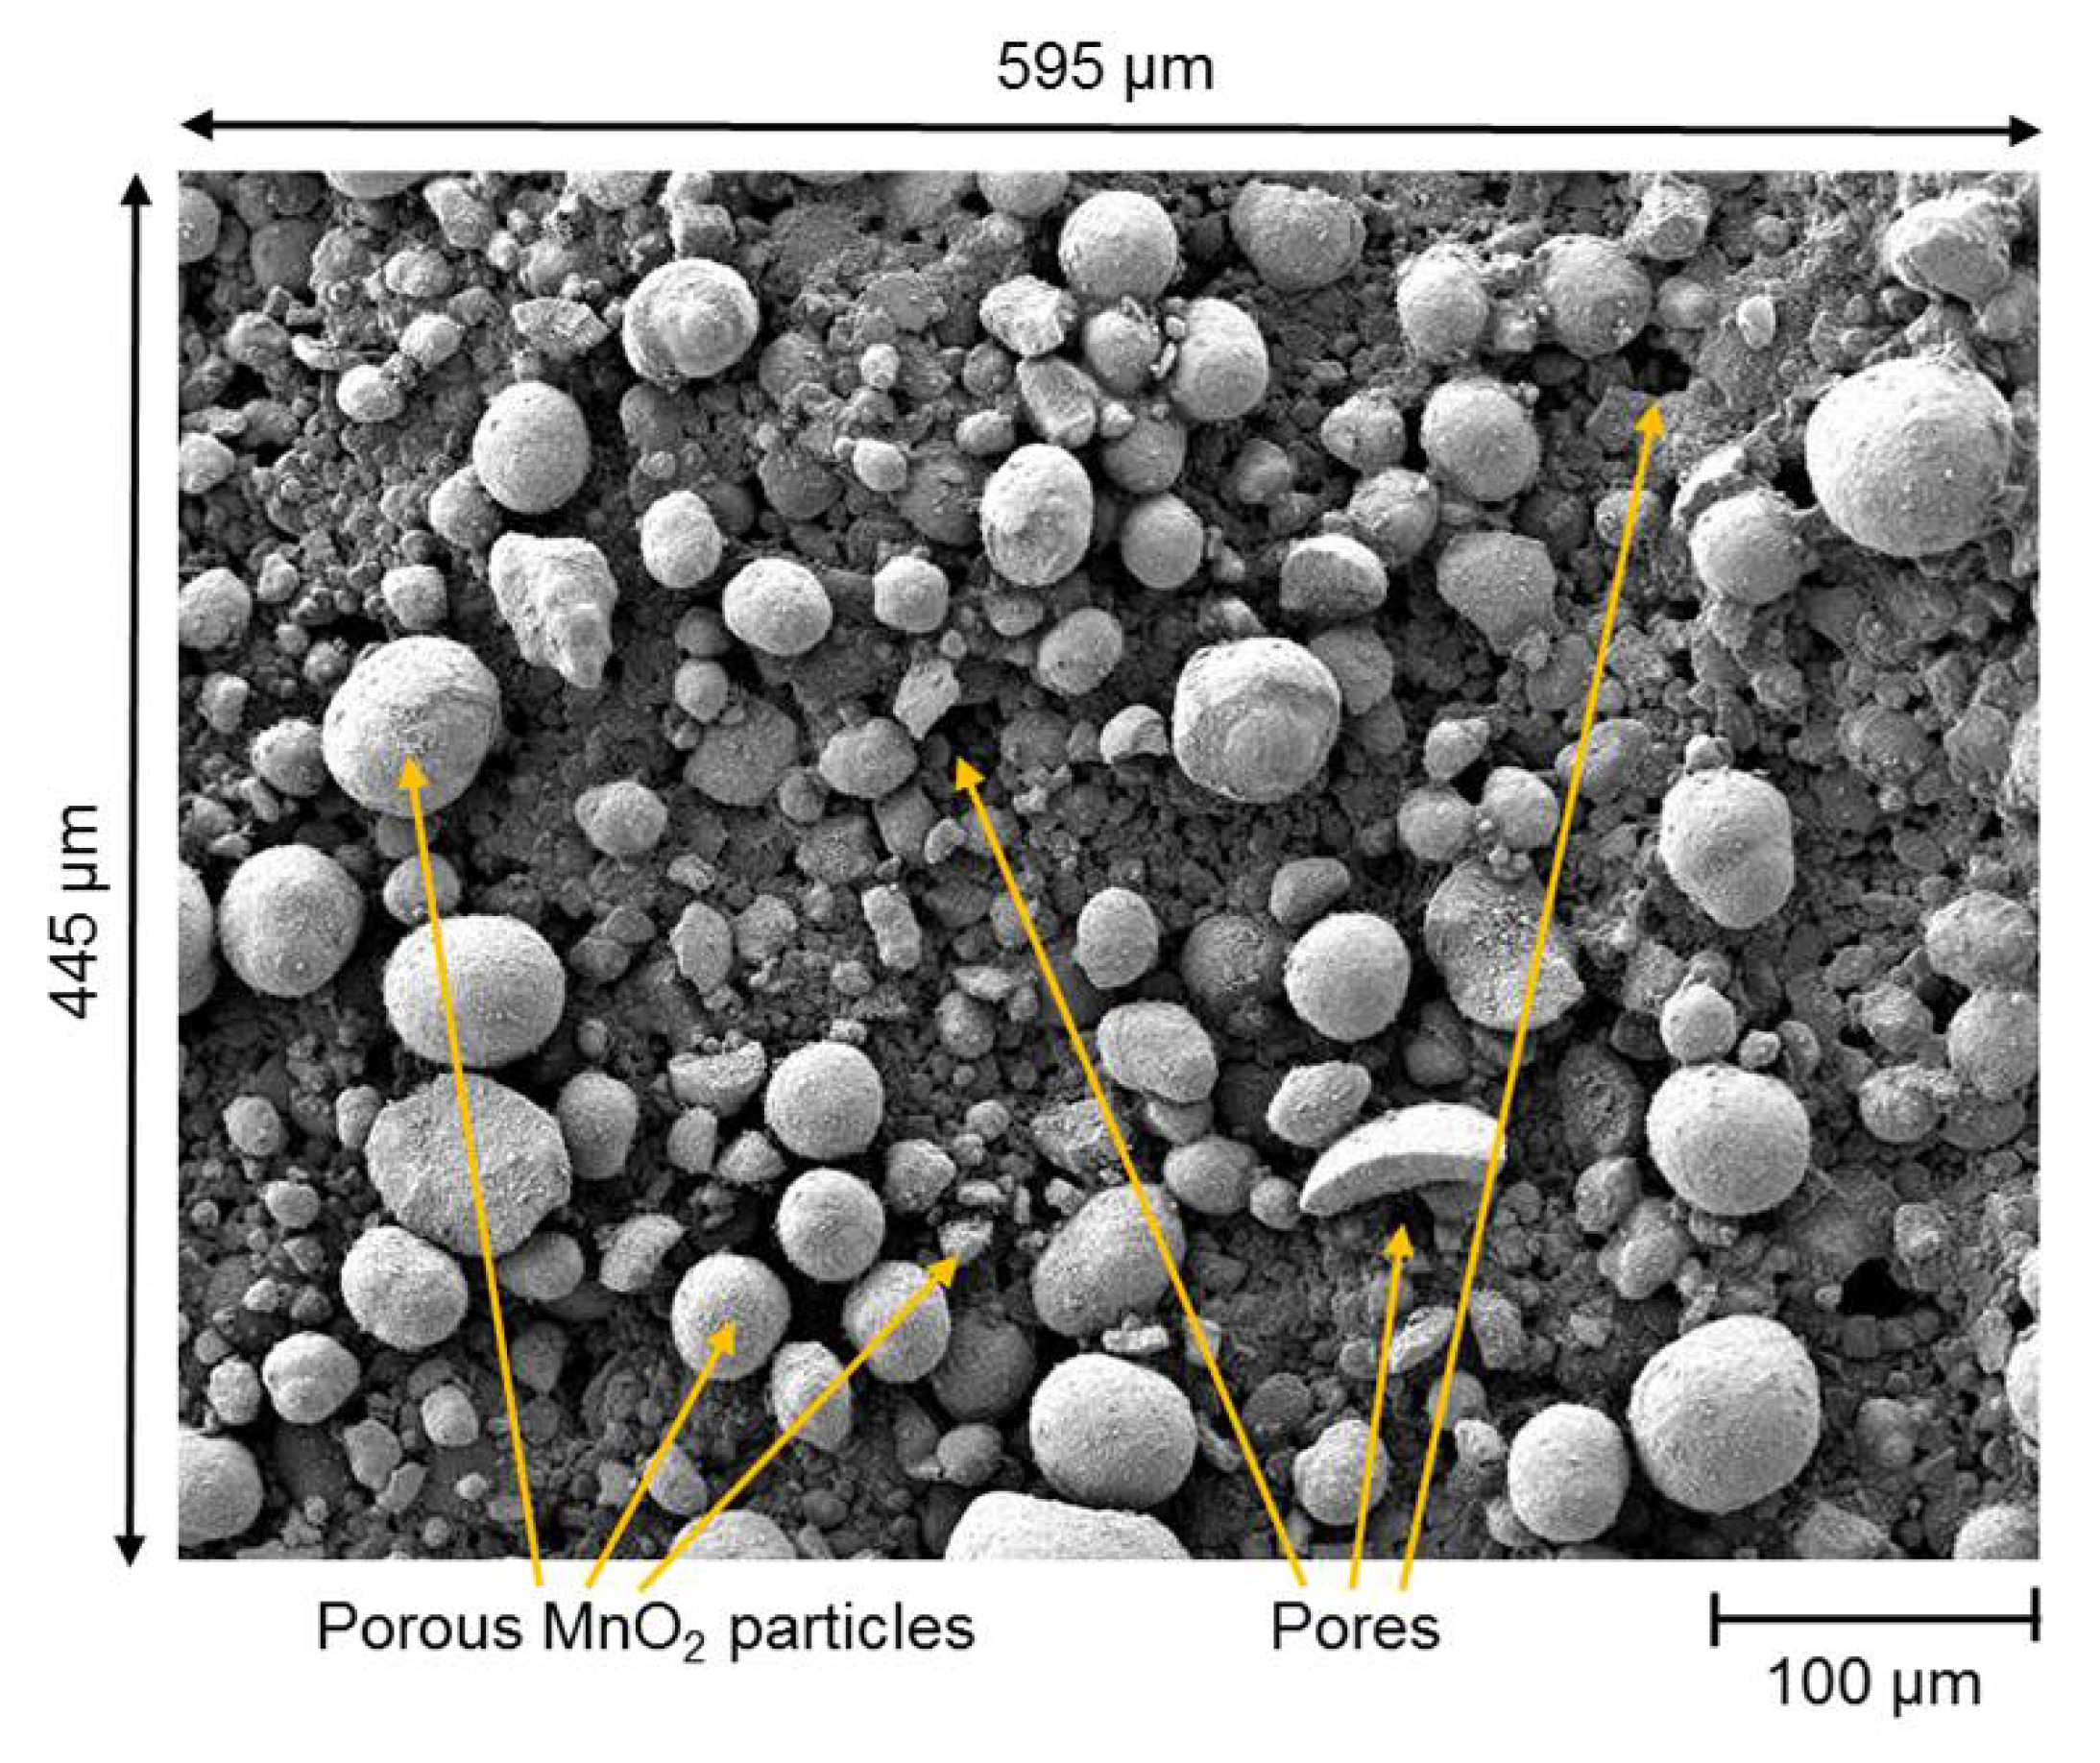
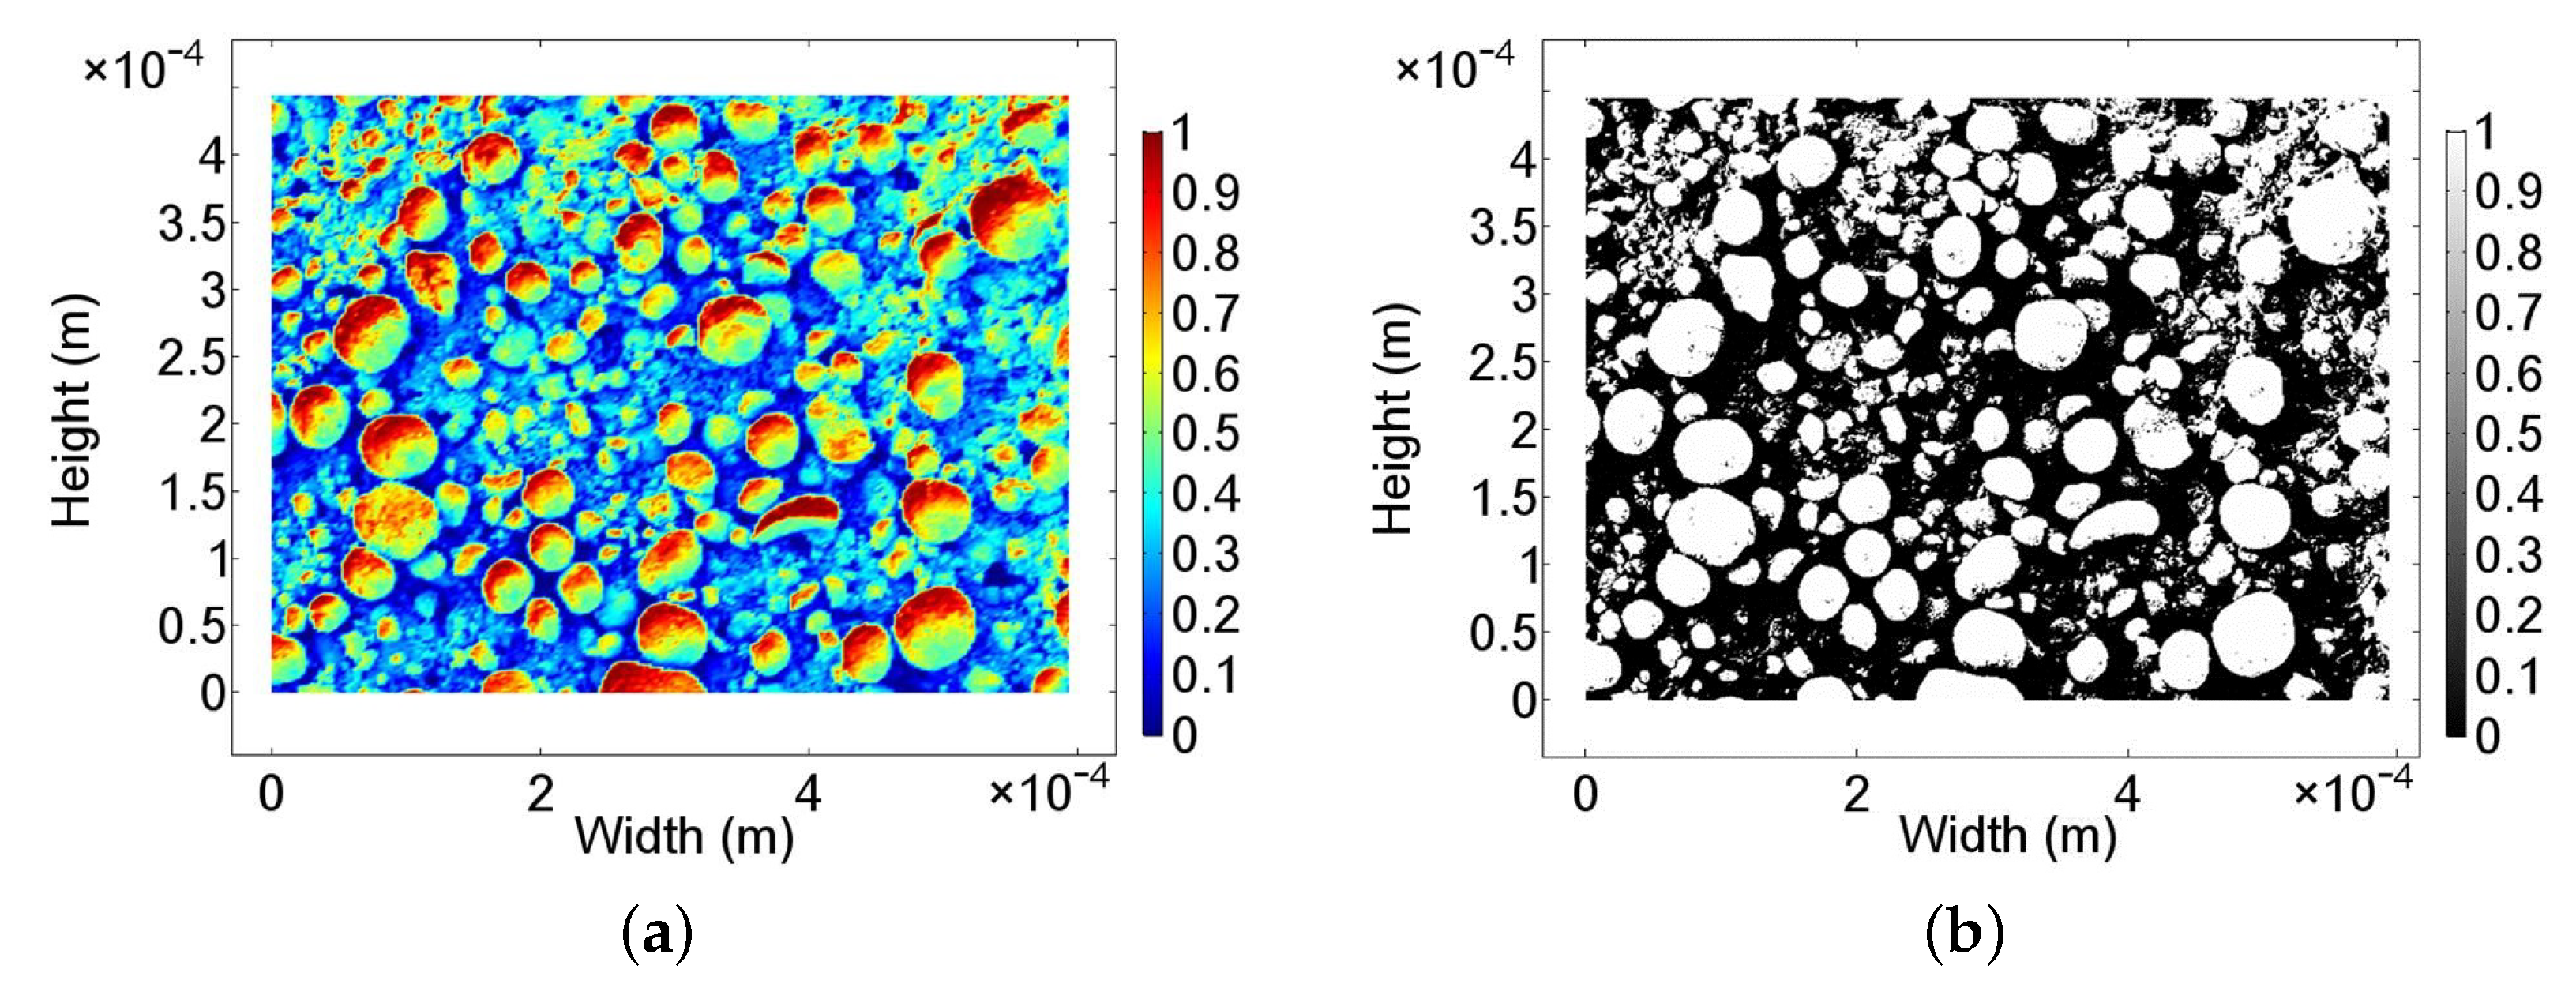
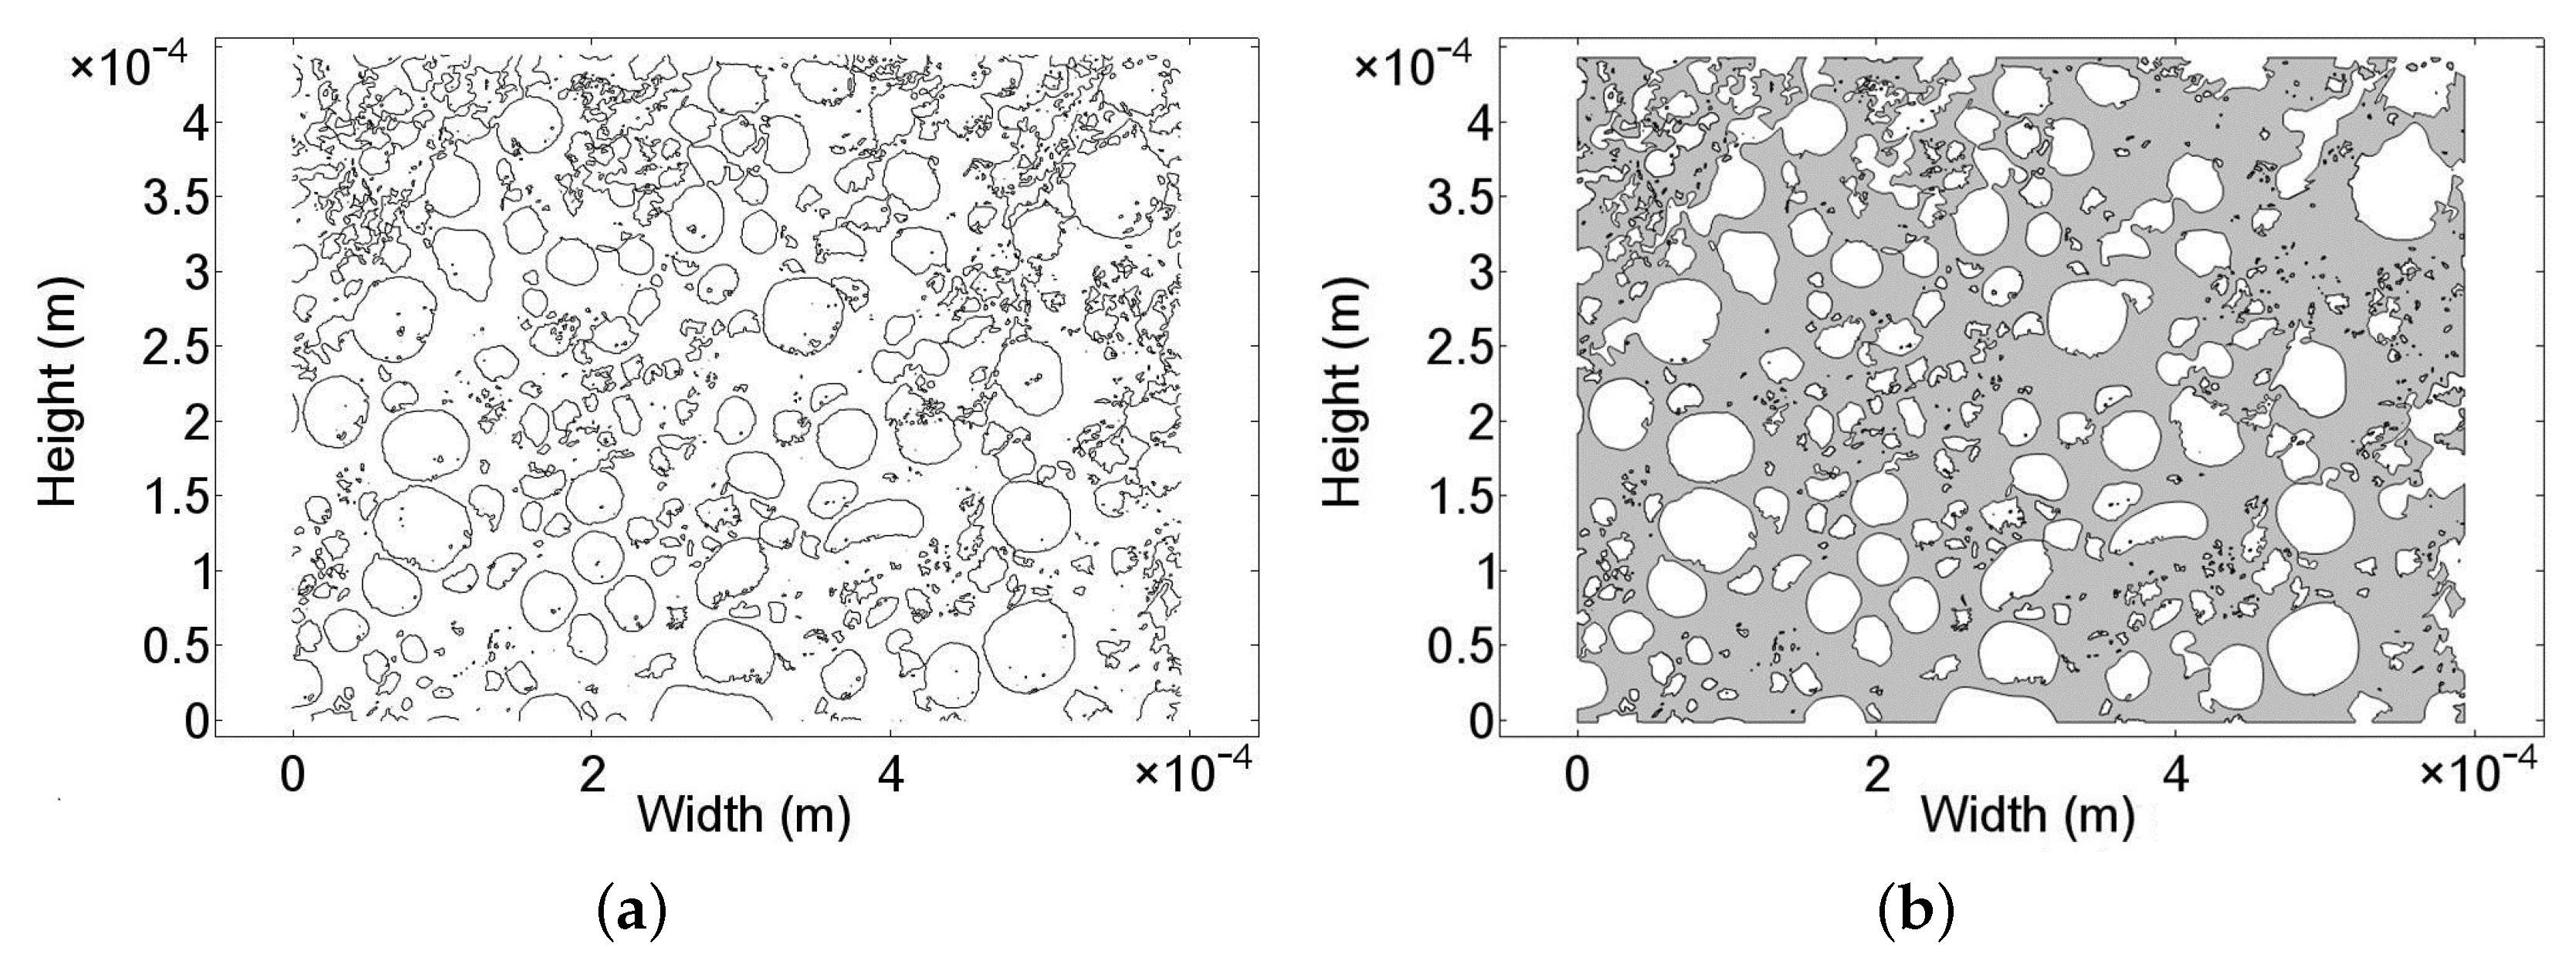
3.1. Surface Characteristics of the Nanoporous Catalyst
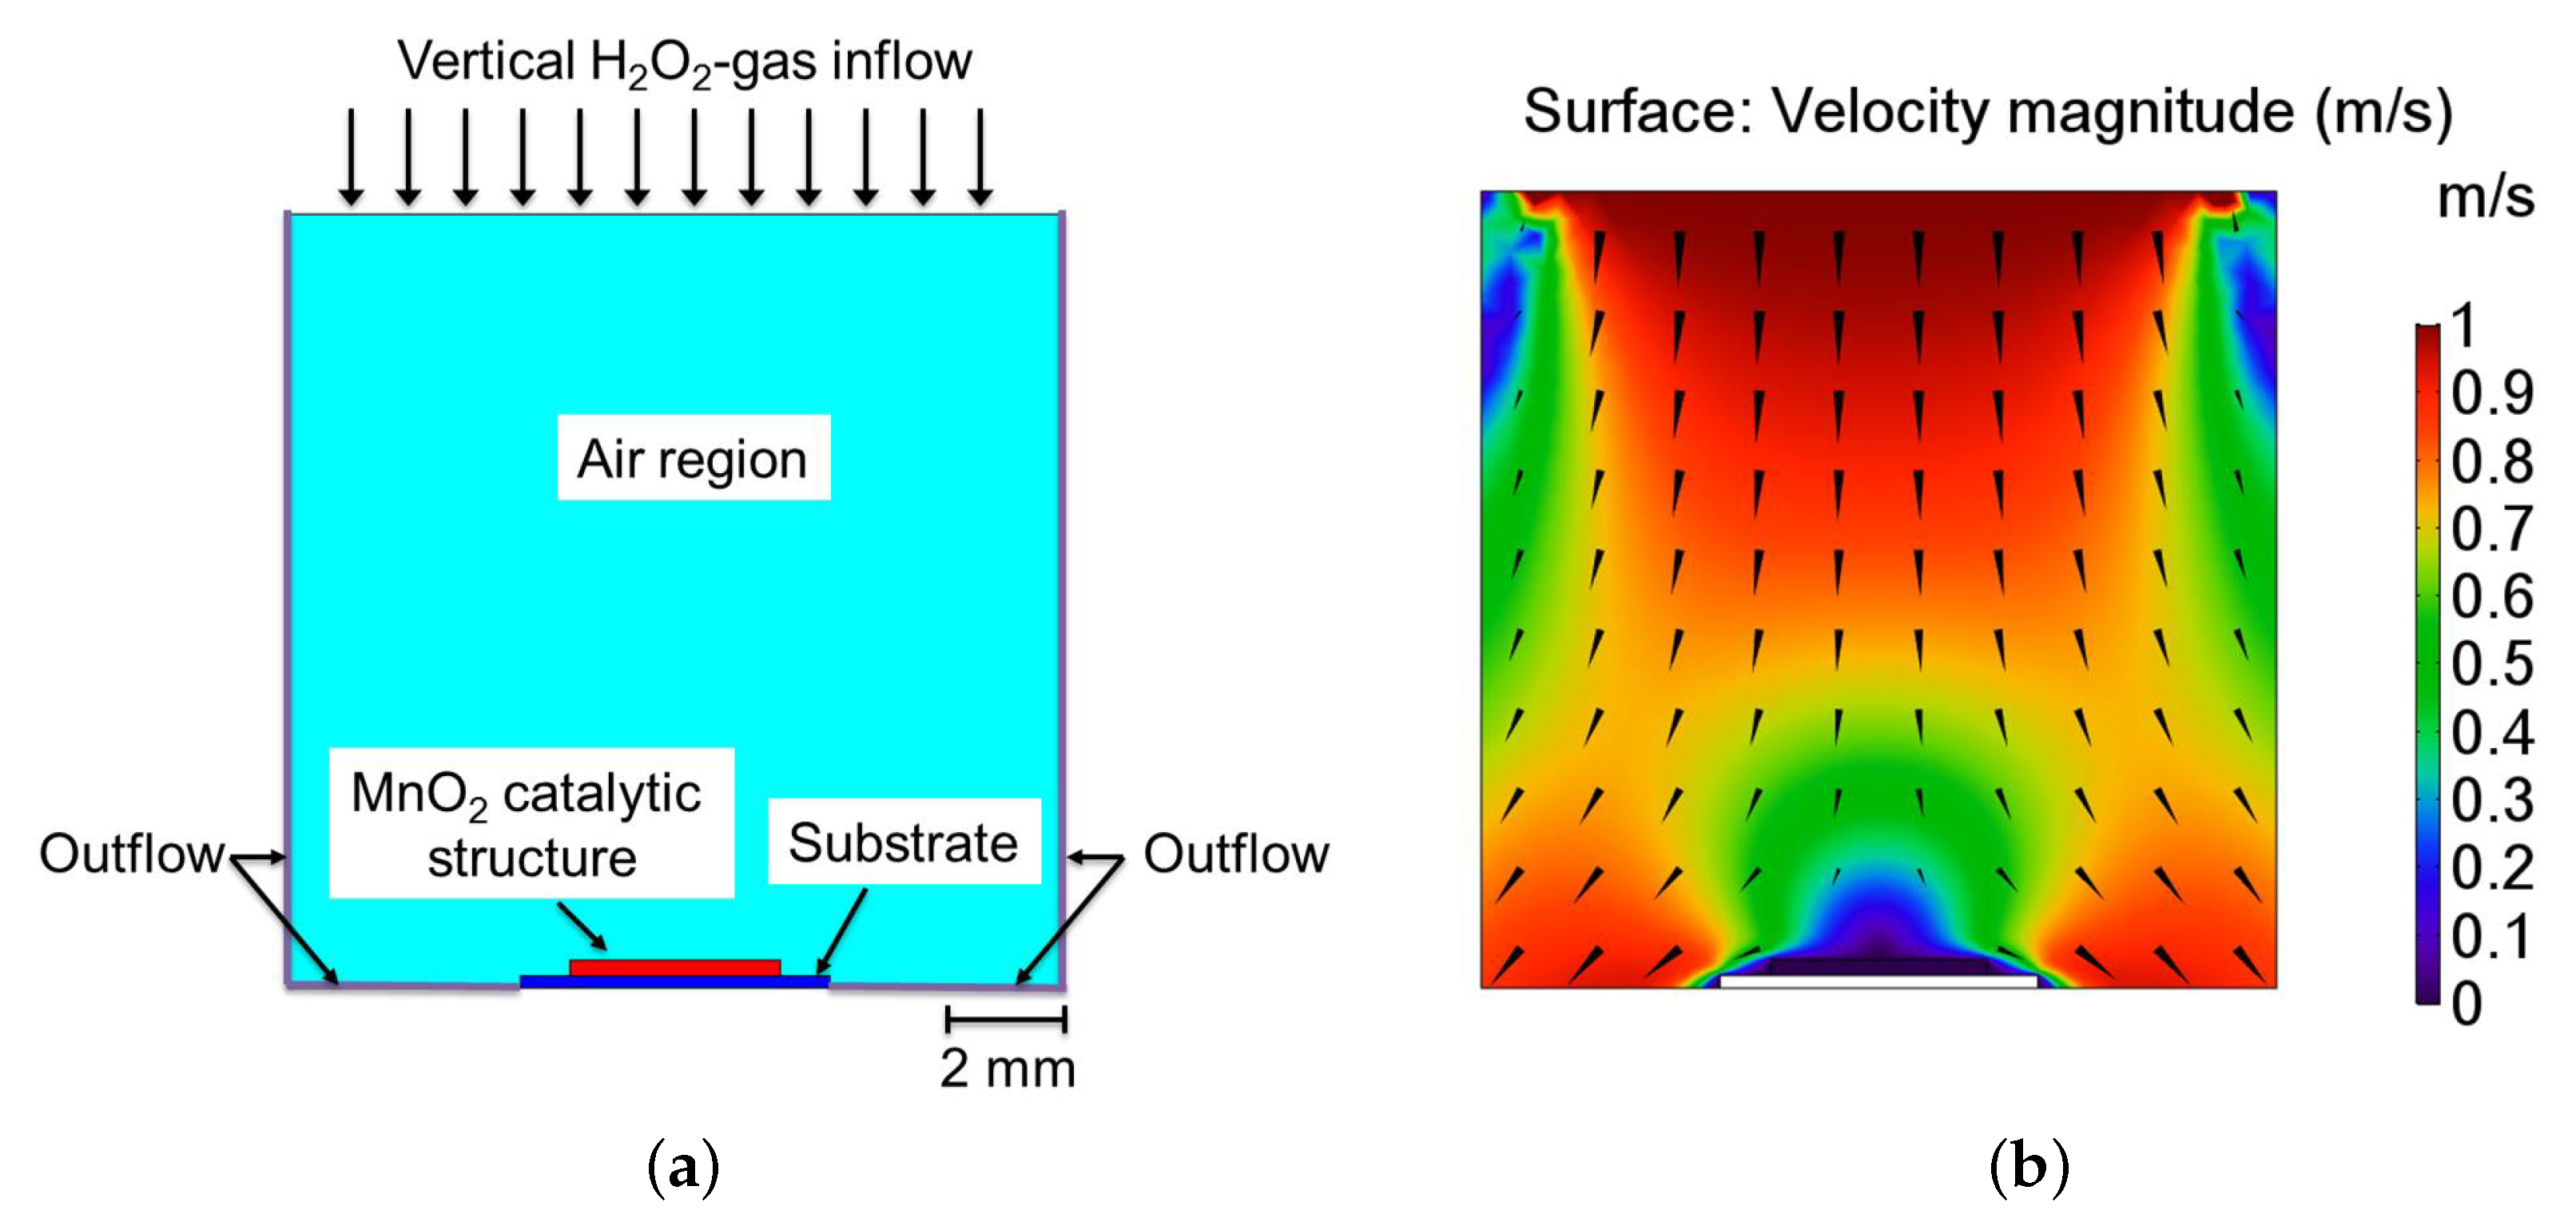
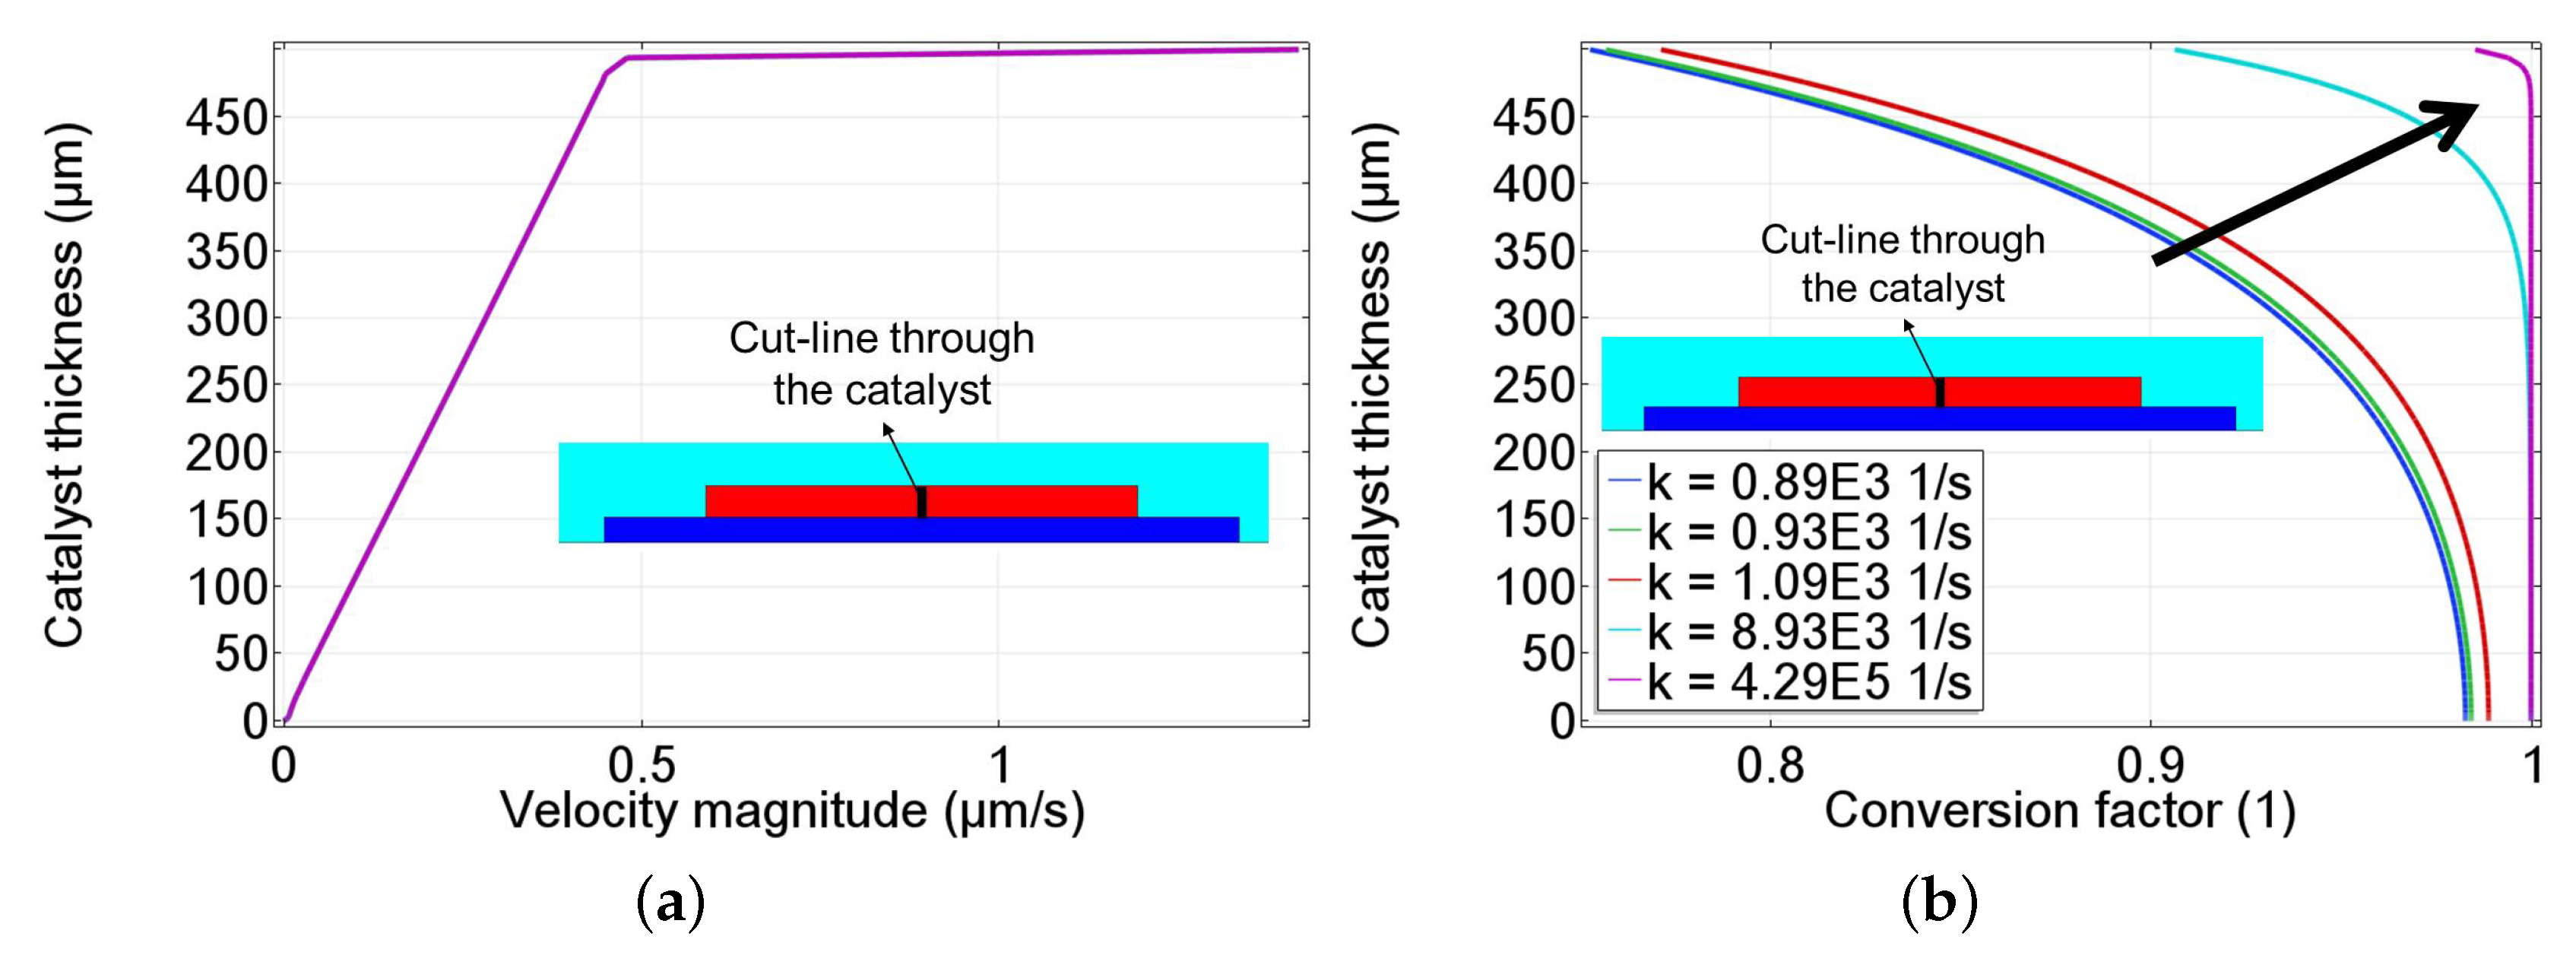
3.2. Decomposition of HO with Porous MnO Catalyst
4. Conclusions
Acknowledgments
Author Contributions
Conflicts of Interest
References
- Pisarczyk, K. Manganese compounds. In Kirk-Othmer Encyclopedia of Chemical Technology; Kroschwitz, J.I., Seidel, A., Kirk, R.E., Othmer, D.F., Eds.; Wiley-Interscience: Hoboken, NJ, USA, 2005. [Google Scholar]
- Kappenstein, C.; Zaki, M.I. X-ray photoelectron spectroscopy and diffractometry of MnOx catalysts: Surface to bulk composition relationships. Zeitschrift für Physikalische Chemie 1992, 176, 97–116. [Google Scholar]
- Garwig, P.L. Heterogeneous decomposition of H2O2 by inorganic catalysts: Technical report AFRPL-TR-66-136, 1966.
- Koopmans, R.J.; Shrimpton, J.S.; Roberts, G.T. Validation and design optimizaton for a hydrogen peroxide thruster. In Proceedings of the 47th AIAA/ASME/SAE/ASEE Joint Propulsion Conference and Exhibit, San Diego, CA, USA, 31 July–03 August 2011; American Institute of Aeronautics and Astronautics: Reston, VA, USA, 2011. [Google Scholar]
- Broughton, D.B.; Wentworth, R.L. Mechanism of decomposition of hydrogen peroxide solutions with manganese dioxide. I. J. Am. Chem. Soc. 1947, 69, 741–744. [Google Scholar] [CrossRef] [PubMed]
- Lee, Y.N.; Lago, R.M.; Fierro, J.L.G.; González, J. Hydrogen peroxide decomposition over Ln1−xAxMnO3 (Ln = La or Nd and A = K or Sr) perovskites. Appl. Catal. A Gen. 2001, 215, 245–256. [Google Scholar] [CrossRef]
- Do, S.H.; Batchelor, B.; Lee, H.K.; Kong, S.H. Hydrogen peroxide decomposition on manganese oxide (pyrolusite): Kinetics, intermediates, and mechanism. Chemosphere 2009, 75, 8–12. [Google Scholar] [CrossRef] [PubMed]
- Hasan, M.A.; Zaki, M.I.; Pasupulety, L.; Kumari, K. Promotion of the hydrogen peroxide decomposition activity of manganese oxide catalysts. Appl. Catal. A Gen. 1999, 181, 171–179. [Google Scholar] [CrossRef]
- Hart, A.B.; McFadyen, J.; Ross, R.A. Solid-oxide-catalyzed decomposition of hydrogen peroxide vapor. Trans. Faraday Soc. 1963, 59, 1458–1469. [Google Scholar] [CrossRef]
- Kirchner, P.; Li, B.; Spelthahn, H.; Henkel, H.; Schneider, A.; Friedrich, P.; Kolstad, J.; Keusgen, M.; Schöning, M.J. Thin-film calorimetric H2O2 gas sensor for the validation of germicidal effectivity in aseptic filling processes. Sens. Actuators B Chem. 2011, 154, 257–263. [Google Scholar] [CrossRef]
- Micoli, L.; Bagnasco, G.; Turco, M.; Trifuoggi, M.; Russo Sorge, A.; Fanelli, E.; Pernice, P.; Aronne, A. Vapor phase H2O2 decomposition on Mn based monolithic catalysts synthesized by innovative procedures. Appl. Catal. B Environ. 2013, 140–141, 516–522. [Google Scholar] [CrossRef]
- Oberländer, J.; Kirchner, P.; Boyen, H.G.; Schöning, M.J. Detection of hydrogen peroxide vapor by use of manganese(IV) oxide as catalyst for calorimetric gas sensors. Phys. Status Solidi A 2014, 211, 1372–1376. [Google Scholar] [CrossRef]
- Agalloco, J.P.; Akers, J.E. (Eds.) Advanced Aseptic Processing Technology; Drugs and the Pharmaceutical Sciences; CRC Press: Boca Raton, FL, USA, 2010. [Google Scholar]
- Petri, B.G.; Watts, R.J.; Teel, A.L.; Huling, S.G.; Brown, R.A. Fundamentals of ISCO using hydrogen peroxide. In In Situ Chemical Oxidation for Groundwater Remediation; Siegrist, R.L., Crimi, M., Simpkin, T.J., Eds.; SERDP/ESTCP Environmental Remediation Technology; Springer: New York, NY, USA, 2011; Volume 3, pp. 33–88. [Google Scholar]
- Kačer, P.; Švrček, J.; Syslová, K.; Václavík, J.; Pavlík, D.; Červený, J.; Kuzma, M. Vapor phase hydrogen peroxide—method for decontamination of surfaces and working areas from organic pollutants. In Organic Pollutants Ten Years after the Stockholm Convention: Environmental and Analytical Update; Puzyn, T., Ed.; InTech: Rijeka, Croatia, 2012. [Google Scholar]
- Heckert, R.A.; Best, M.; Jordan, L.T.; Dulac, G.C.; Eddington, D.L.; Sterritt, W.G. Efficacy of vaporized hydrogen peroxide against exotic animal viruses. Appl. Environ. Microbiol. 1997, 63, 3916–3918. [Google Scholar] [PubMed]
- Ansari, I.A.; Datta, A.K. An overview of sterilization methods for packaging materials used in aseptic packaging systems. Food Bioprod. Process. 2003, 81, 57–65. [Google Scholar] [CrossRef]
- Kirchner, P.; Oberländer, J.; Suso, H.P.; Rysstad, G.; Keusgen, M.; Schöning, M.J. Monitoring the microbicidal effectiveness of gaseous hydrogen peroxide in sterilization processes by means of a calorimetric gas sensor. Food Control 2013, 31, 530–538. [Google Scholar] [CrossRef]
- Näther, N.; Juárez, L.M.; Emmerich, R.; Berger, J.; Friedrich, P.; Schöning, M.J. Detection of hydrogen peroxide (H2O2) at exposed temperatures for industrial processes. Sensors 2006, 6, 308–317. [Google Scholar] [CrossRef]
- Satterfield, C.N.; Stein, T. Decomposition of hydrogen peroxide vapor on relatively inert surfaces. Ind. Eng. Chem. 1957, 49, 1173–1180. [Google Scholar] [CrossRef]
- Fraise, A.P.; Maillard, J.Y.; Sattar, S.A. (Eds.) Principles and Practice of Disinfection, Preservation, and Sterilization, 5th ed.; John Wiley & Sons: Chichester, UK, 2012. [Google Scholar]
- Kirk, R.E.; Othmer, D.F. (Eds.) Encyclopedia of Chemical Technology; Wiley: New York, NY, USA, 2003; Volume 13. [Google Scholar]
- USP United States Pharmacopeial Convention. Food Chemicals Codex, 9th ed.; USP United States Pharmacopeial Convention: Rockville, MD, USA, 2014. [Google Scholar]
- Giguère, P.A. The thermal decomposition of hydrogen peroxide vapor. II. Can. J. Res. 1947, 25b, 135–150. [Google Scholar] [CrossRef]
- Satterfield, C.N.; Stein, T.W. Homogeneous decomposition of hydrogen peroxide vapor. J. Phys. Chem. 1957, 61, 537–540. [Google Scholar] [CrossRef]
- Bársony, I.; Dücso, C.; Fürjes, P. Thermometric gas sensing. In Solid State Gas Sensing; Comini, E., Faglia, G., Sberveglieri, G., Eds.; Springer US: Boston, MA, USA, 2009; pp. 1–24. [Google Scholar]
- Oberländer, J.; Kirchner, P.; Keusgen, M.; Schöning, M.J. Strategies in developing thin-film sensors for monitoring aseptic food processes: Theoretical considerations and investigations of passivation materials. Electrochim. Acta 2015, 183, 130–136. [Google Scholar] [CrossRef]
- Jildeh, Z.B.; Kirchner, P.; Oberländer, J.; Kremers, A.; Wagner, T.; Wagner, P.H.; Schöning, M.J. FEM-based modeling of a calorimetric gas sensor for hydrogen peroxide monitoring. Phys. Status Solidi A 2017, 214. [Google Scholar] [CrossRef]
- McDonnell, G.E.; Sheard, D. A Practical Guide to Decontamination in Healthcare; John Wiley & Sons, Ltd.: Hoboken, NJ, USA, 2012. [Google Scholar]
- Tian, R.; Sun, J.; Qi, Y.; Zhang, B.; Guo, S.; Zhao, M. Influence of VO2 nanoparticle morphology on the colorimetric assay of H2O2 and glucose. Nanomaterials 2017, 7, 347. [Google Scholar] [CrossRef] [PubMed]
- Li, Y.; Su, Z.; Wei, G.; Xie, G.; Zhang, M.; Zhang, X. Nanoporous carbon nanofibers decorated with platinum nanoparticles for non-enzymatic electrochemical sensing of H2O2. Nanomaterials 2015, 5, 1891–1905. [Google Scholar] [CrossRef] [PubMed]
- Kirchner, P.; Ng, Y.A.; Spelthahn, H.; Schneider, A.; Henkel, H.; Friedrich, P.; Kolstad, J.; Berger, J.; Keusgen, M.; Schöning, M.J. Gas sensor investigation based on a catalytically activated thin-film thermopile for H2O2 detection. Phys. Status Solidi A 2010, 207, 787–792. [Google Scholar] [CrossRef]
- Kirchner, P.; Oberländer, J.; Friedrich, P.; Berger, J.; Suso, H.P.; Kupyna, A.; Keusgen, M.; Schöning, M.J. Optimization and fabrication of a calorimetric gas sensor built up on a polyimide substrate for H2O2 monitoring. Phys. Status Solidi A 2011, 208, 1235–1240. [Google Scholar] [CrossRef]
- Kirchner, P.; Oberländer, J.; Friedrich, P.; Berger, J.; Rysstad, G.; Keusgen, M.; Schöning, M.J. Realization of a calorimetric gas sensor on polyimide foil for applications in aseptic food industry. Sens. Actuators B Chem. 2012, 170, 60–66. [Google Scholar] [CrossRef]
- Kirchner, P.; Reisert, S.; Pütz, P.; Keusgen, M.; Schöning, M.J. Characterization of polymeric materials as passivation layer for calorimetric H2O2 gas sensors. Phys. Status Solidi A 2012, 209, 859–863. [Google Scholar] [CrossRef]
- Kirchner, P. Calorimetric Gas Sensors for Hydrogen Peroxide Monitoring in Aseptic Food Processes. Ph.D. Thesis, Fachbereich Pharmazie, Phillips-Universität Marburg, Marburg/Lahn, Germany, 2013. [Google Scholar]
- McKee, D. Catalytic decomposition of hydrogen peroxide by metals and alloys of the platinum group. J. Catal. 1969, 14, 355–364. [Google Scholar] [CrossRef]
- Ono, Y.; Matsumura, T.; Kitajima, N.; Fukuzumi, S. Formation of superoxide ion during the decomposition of hydrogen peroxide on supported metals. J. Phys. Chem. 1977, 81, 1307–1311. [Google Scholar] [CrossRef]
- Sorge, A.R.; Turco, M.; Pilone, G.; Bagnasco, G. Decomposition of hydrogen peroxide on MnO2/TiO2 catalysts. J. Propuls. Power 2004, 20, 1069–1075. [Google Scholar] [CrossRef]
- Nakayama, M.; Sato, A.; Yamaguchi, R. Decomposition and detection of hydrogen peroxide using sigma-MnO2 thin film electrode with self-healing property. Electroanalysis 2013, 26, 2283–2288. [Google Scholar]
- Lin, S.S.; Gurol, M.D. Catalytic decomposition of hydrogen peroxide on iron oxide: Kinetics, mechanism, and implications. Environ. Sci. Technol. 1998, 32, 1417–1423. [Google Scholar] [CrossRef]
- Zaki, M.I.; Hasan, M.A.; Pasupulety, L.; Kumari, K. Bulk and surface characteristics of pure and alkalized Mn2O3: TG, IR, XRD, XPS, specific adsorption and redox catalytic studies. N. J. Chem. 1998, 22, 875–882. [Google Scholar] [CrossRef]
- Krejci, D.; Woschnak, A. Hydrogen peroxide decomposition for micro propulsion: Simulation and experimental verification. In Proceedings of the 47th AIAA/ASME/SAE/ASEE Joint Propulsion Conference and Exhibit, San Diego, CA, USA, 31 July–3 August 2011; American Institute of Aeronautics and Astronautics: Reston, VA, USA, 2011. [Google Scholar]
- Jang, D.; Kwon, S.; Jo, S. Effect of phosphate stabilizers in hydrogen peroxide decomposition on manganese-based catalysts. J. Propuls. Power 2015, 31, 904–911. [Google Scholar] [CrossRef]
- Zhou, X.; Hitt, D.L. One-dimensional modeling of catalyzed H2O2 decomposition in microchannel flows. In Proceedings of the 33rd AIAA Fluid Dynamics Conference and Exhibit, Orlando, FL, USA, 23–26 June 2003; American Institute of Aeronautics and Astronautics: Reston, VA, USA, 2003. [Google Scholar]
- Koopmans, R.J.; Shrimpton, J.S.; Roberts, G.T. Parametric studies for a hydrogen peroxide rocket engine. In Proceedings of the 4th European Conference for Aerospace Sciences EUCASS, Saint Petersburg, Russia, 4–8 July 2011. [Google Scholar]
- Widdis, S.J.; Hitt, D.L.; Asante, K.; Cross, M.W.; Varhue, W.J.; McDevitt, M.R. Computational and experimental studies of catalytic H2O2 decomposition in microscale reactors. In Proceedings of the 43rd AIAA Thermophysics Conference, New Orleans, LA, USA, 25–28 June 2012; American Institute of Aeronautics and Astronautics: Reston, VA, USA, 2012. [Google Scholar]
- Widdis, S.J.; Asante, K.; Hitt, D.L.; Cross, M.W.; Varhue, W.J.; McDevitt, M.R. A MEMS-based catalytic microreactor for a H2O2 monopropellant micropropulsion system. IEEE/ASME Trans. Mechatron. 2013, 18, 1250–1258. [Google Scholar] [CrossRef]
- Koopmans, R.J. Modelling of Multiphase Multicomponent Chemically Reacting Flows through Packed Beds. Ph.D. Thesis, University of Southampton, Southampton, UK, 2013. [Google Scholar]
- Martinez-Duarte, R.; Madou, M. SU-8 photolithography and its impact on microfluidics. In Microfluidics and Nanofluidics Handbook; Mitra, S.K., Chakraborty, S., Eds.; CRC Press: Roca Raton, FL, USA, 2012; pp. 231–268. [Google Scholar]
- Lewis, R.W.; Nithiarasu, P.; Seetharamu, K.N. Fundamentals of the Finite Element Method for Heat and Fluid Flow; John Wiley & Sons, Ltd.: Chichester, UK, 2004. [Google Scholar]
- Cahela, D.R.; Tatarchuk, B.J. Permeability of sintered microfibrous composites for heterogeneous catalysis and other chemical processing opportunities. Catal. Today 2001, 69, 33–39. [Google Scholar] [CrossRef]
- Costa, A. Permeability-porosity relationship: A reexamination of the Kozeny-Carman equation based on a fractal pore-space geometry assumption. Geophys. Res. Lett. 2006, 33, 1–5. [Google Scholar] [CrossRef]
- Foumeny, E.A.; Pahlevanzadeh, H. Evaluation of plug flow assumption in packed beds. Chem. Eng. Technol. 1990, 13, 161–171. [Google Scholar] [CrossRef]


| Parameter | Specification |
|---|---|
| Phosphate | ≤0.005% w/w |
| Iron | ≤0.5 mg/kg |
| Tin | ≤10 mg/kg |
| Lead | ≤4 mg/kg |
| Residue on evaporation | ≤0.006% w/w |
© 2018 by the authors. Licensee MDPI, Basel, Switzerland. This article is an open access article distributed under the terms and conditions of the Creative Commons Attribution (CC BY) license (http://creativecommons.org/licenses/by/4.0/).
Share and Cite
Jildeh, Z.B.; Oberländer, J.; Kirchner, P.; Wagner, P.H.; Schöning, M.J. Thermocatalytic Behavior of Manganese (IV) Oxide as Nanoporous Material on the Dissociation of a Gas Mixture Containing Hydrogen Peroxide. Nanomaterials 2018, 8, 262. https://doi.org/10.3390/nano8040262
Jildeh ZB, Oberländer J, Kirchner P, Wagner PH, Schöning MJ. Thermocatalytic Behavior of Manganese (IV) Oxide as Nanoporous Material on the Dissociation of a Gas Mixture Containing Hydrogen Peroxide. Nanomaterials. 2018; 8(4):262. https://doi.org/10.3390/nano8040262
Chicago/Turabian StyleJildeh, Zaid B., Jan Oberländer, Patrick Kirchner, Patrick H. Wagner, and Michael J. Schöning. 2018. "Thermocatalytic Behavior of Manganese (IV) Oxide as Nanoporous Material on the Dissociation of a Gas Mixture Containing Hydrogen Peroxide" Nanomaterials 8, no. 4: 262. https://doi.org/10.3390/nano8040262