
Non-Noble FeCrOx Bimetallic Nanoparticles for Efficient NH3 Decomposition
 and
and
Abstract
:1. Introduction
2. Experimental
2.1. Catalyst Synthesis
2.2. Characterizations
2.3. Catalytic Tests
3. Result and Discussion
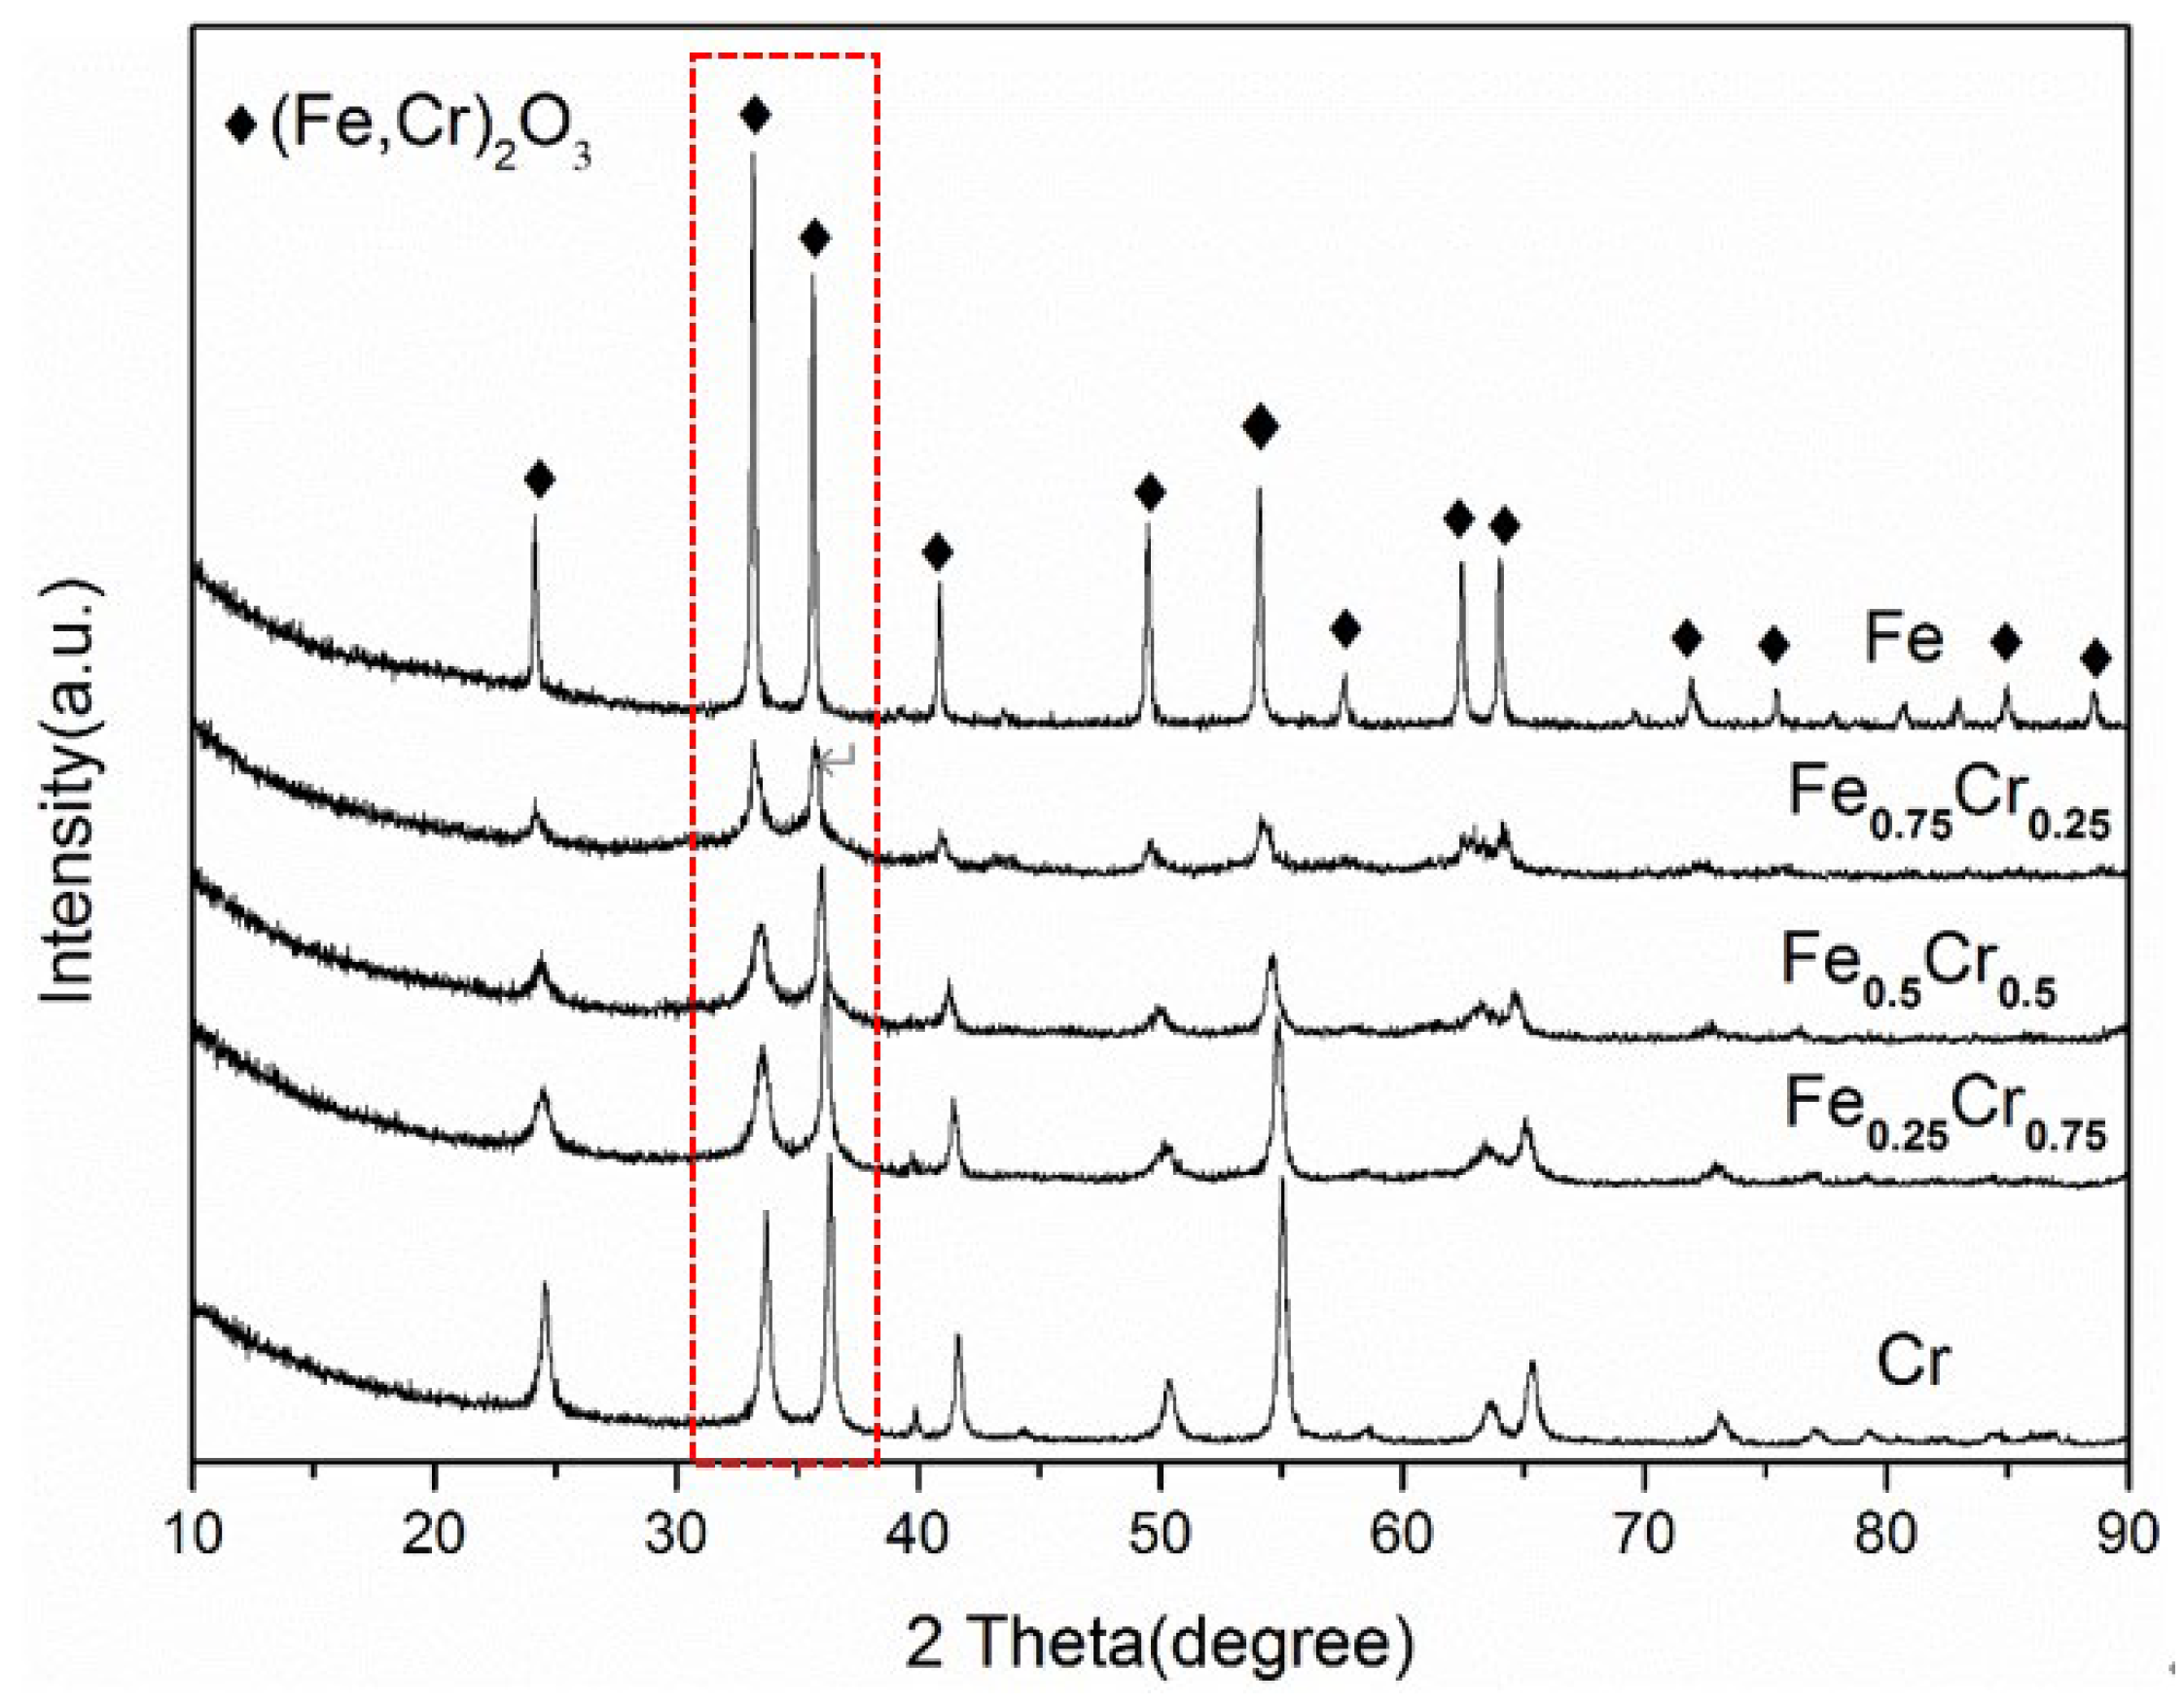
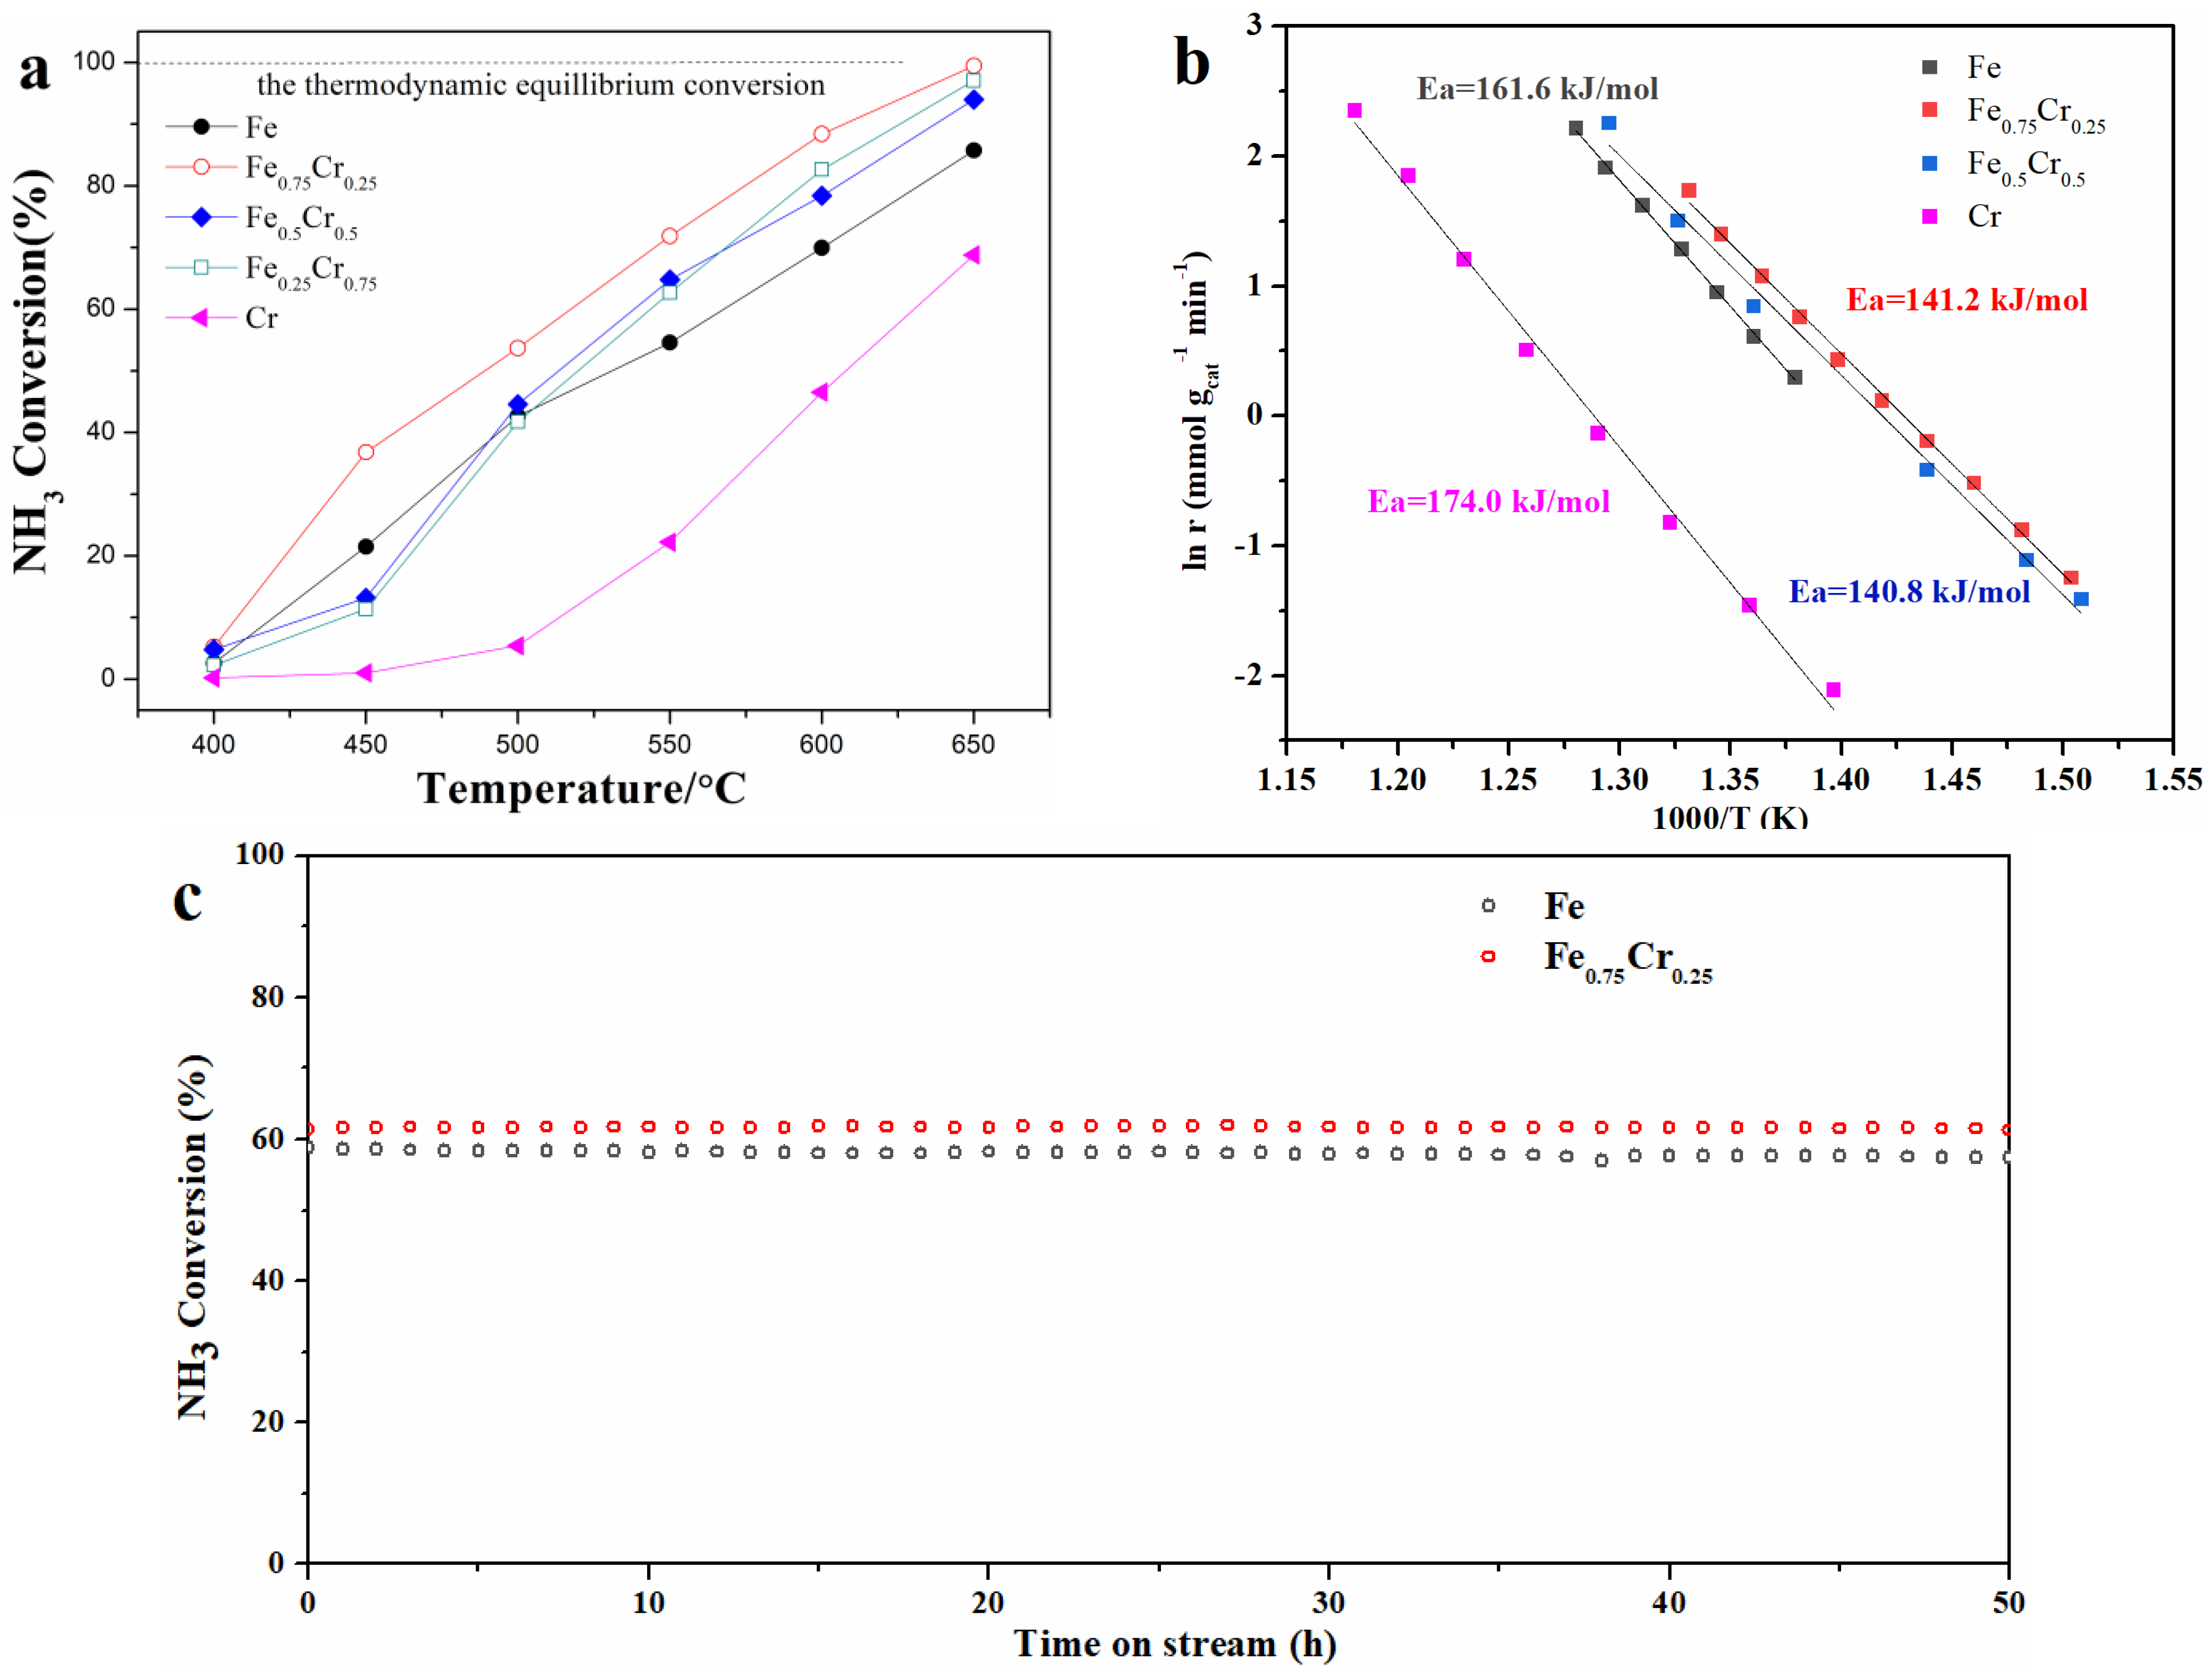
3.1. Catalyst Structure and Ammonia Decomposition Reactivity


| Catalyst | Temperature | GHSV (NH3 cm3 h−1) | Conversion (%) | Reference |
|---|---|---|---|---|
| Fe0.75Cr0.25 | 600 | 22,000 | 88.4 | This work |
| Fe0.75Cr0.25 | 650 | 22,000 | 99.5 | This work |
| Fe-Al2O3 | 600 | 36,000 | 86 | [40] |
| Fe/SiO2 | 600 | 15,000 | 65 | [44] |
| Fe/CMK-5 | 600 | 7500 | 96 | [45] |
| Fe-CNTs | 700 | 5000 | 75 | [46] |
| CoFe5/CNTs | 600 | 36,000 | 50 | [47] |
| Fe/SiO2-Cs | 600 | 30,000 | 90 | [48] |
| Fe-Mo | 550 | 46,000 | 16 | [49] |
| Fe-Co | 550 | 6000 | 77 | [50] |
| Fe-Mg | 550 | 6000 | 86 | [50] |
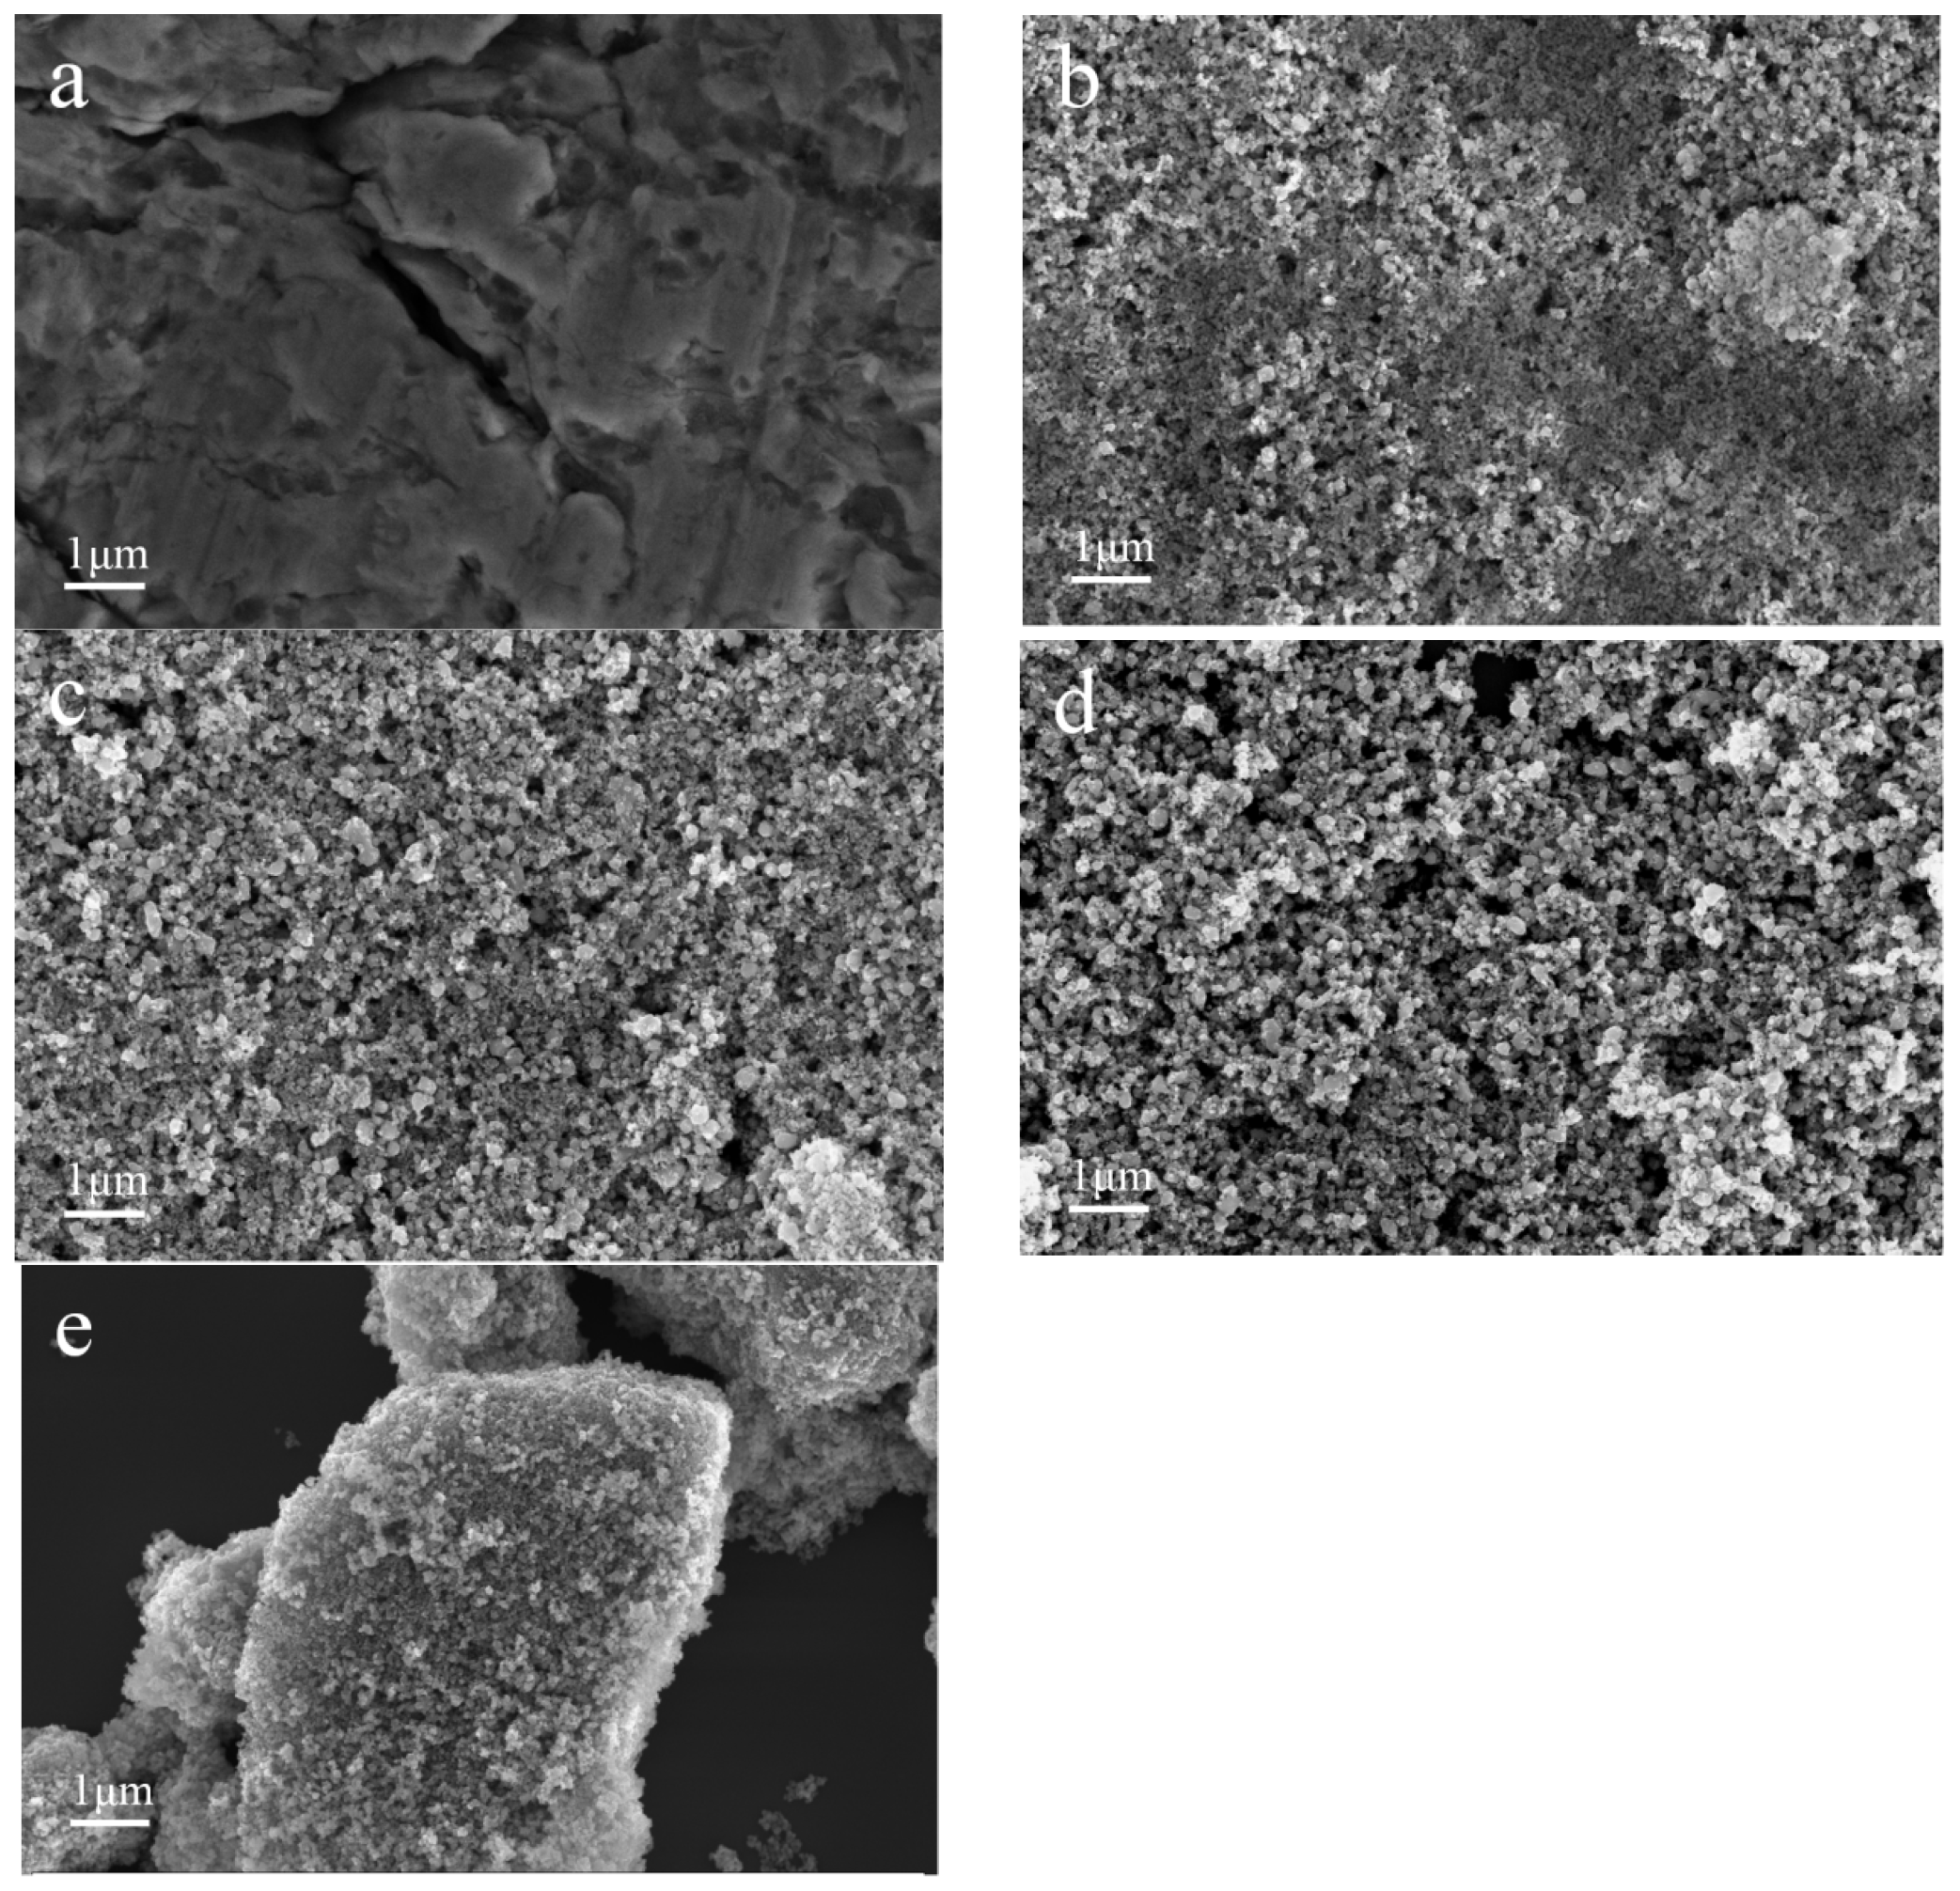
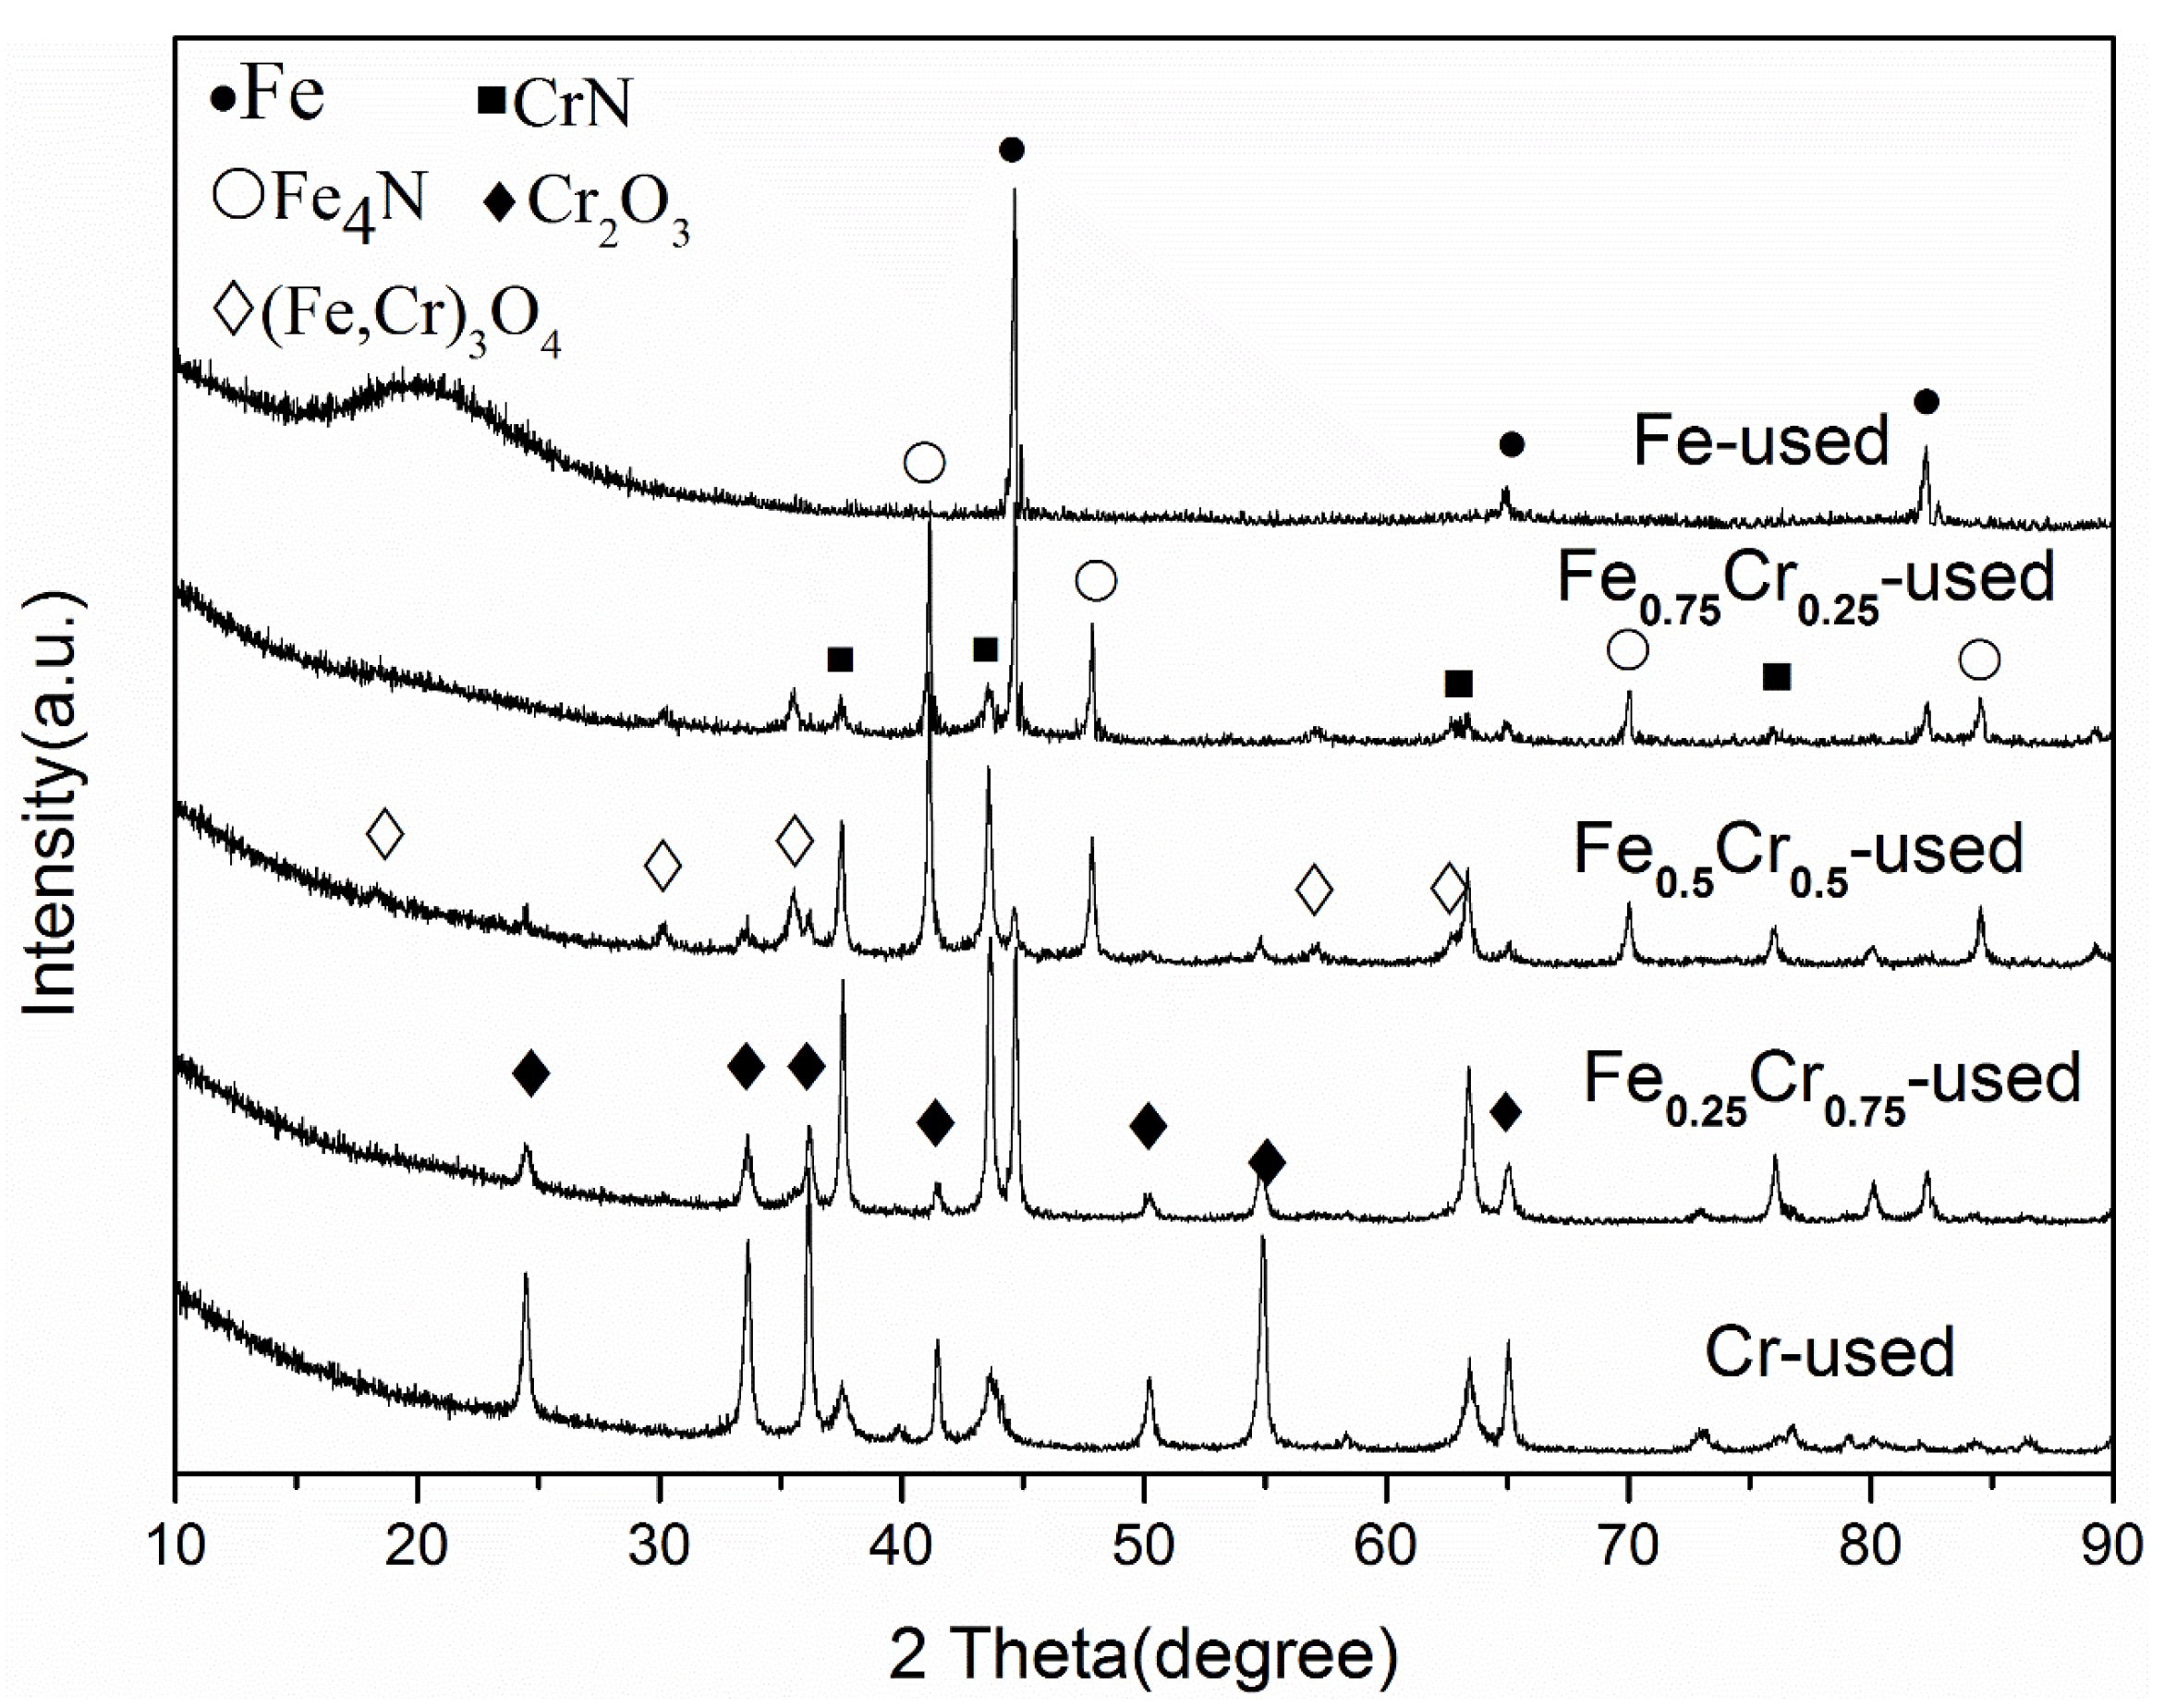
3.2. The Morphology and Crystal Structure of Used FeCrOx Catalysts
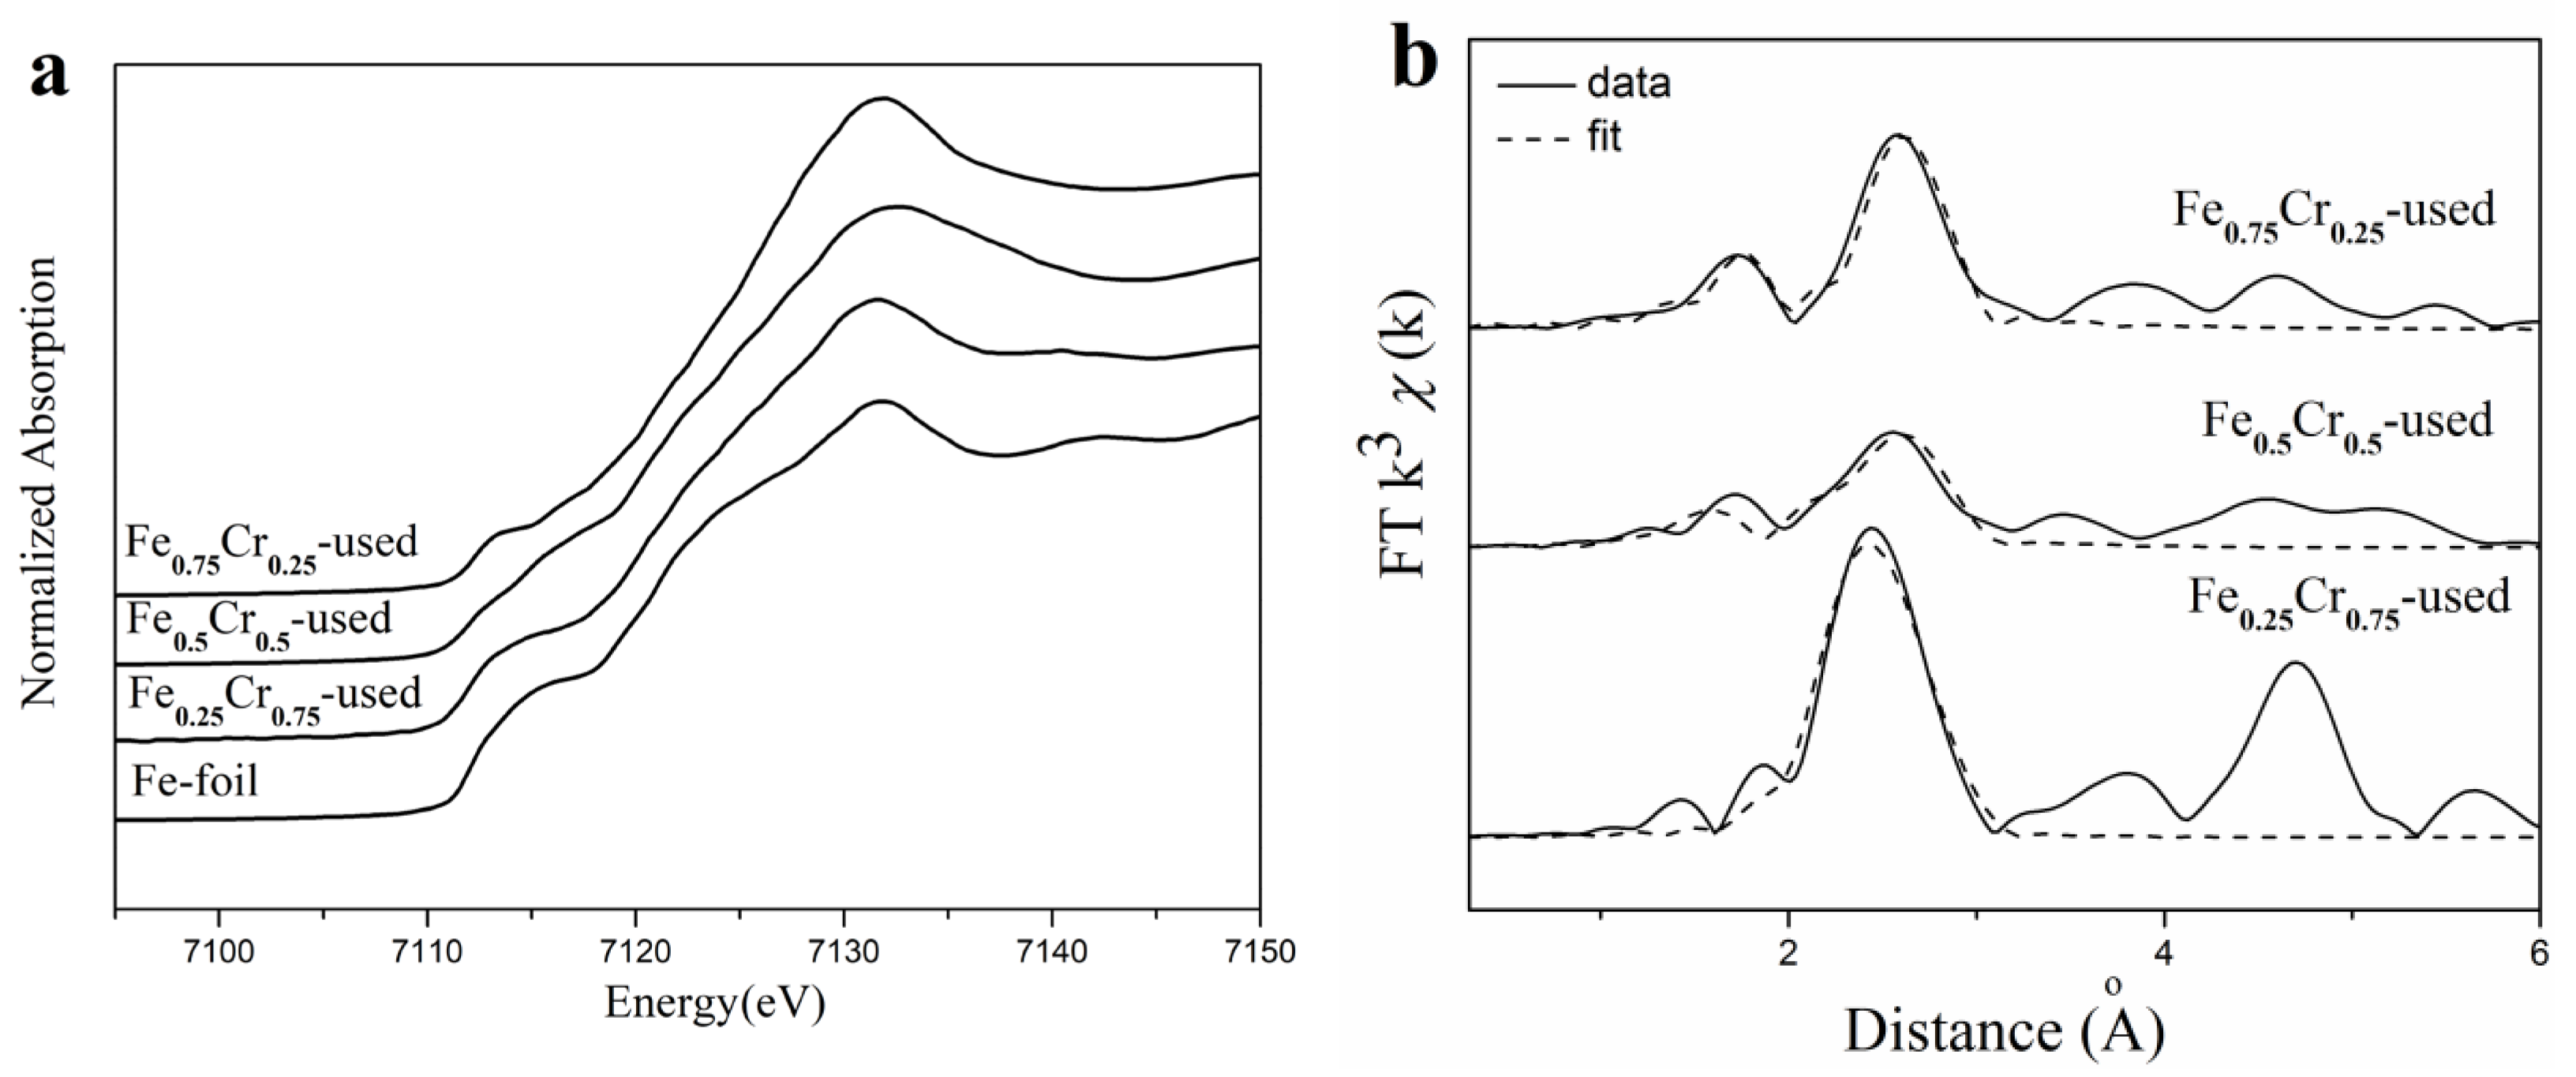
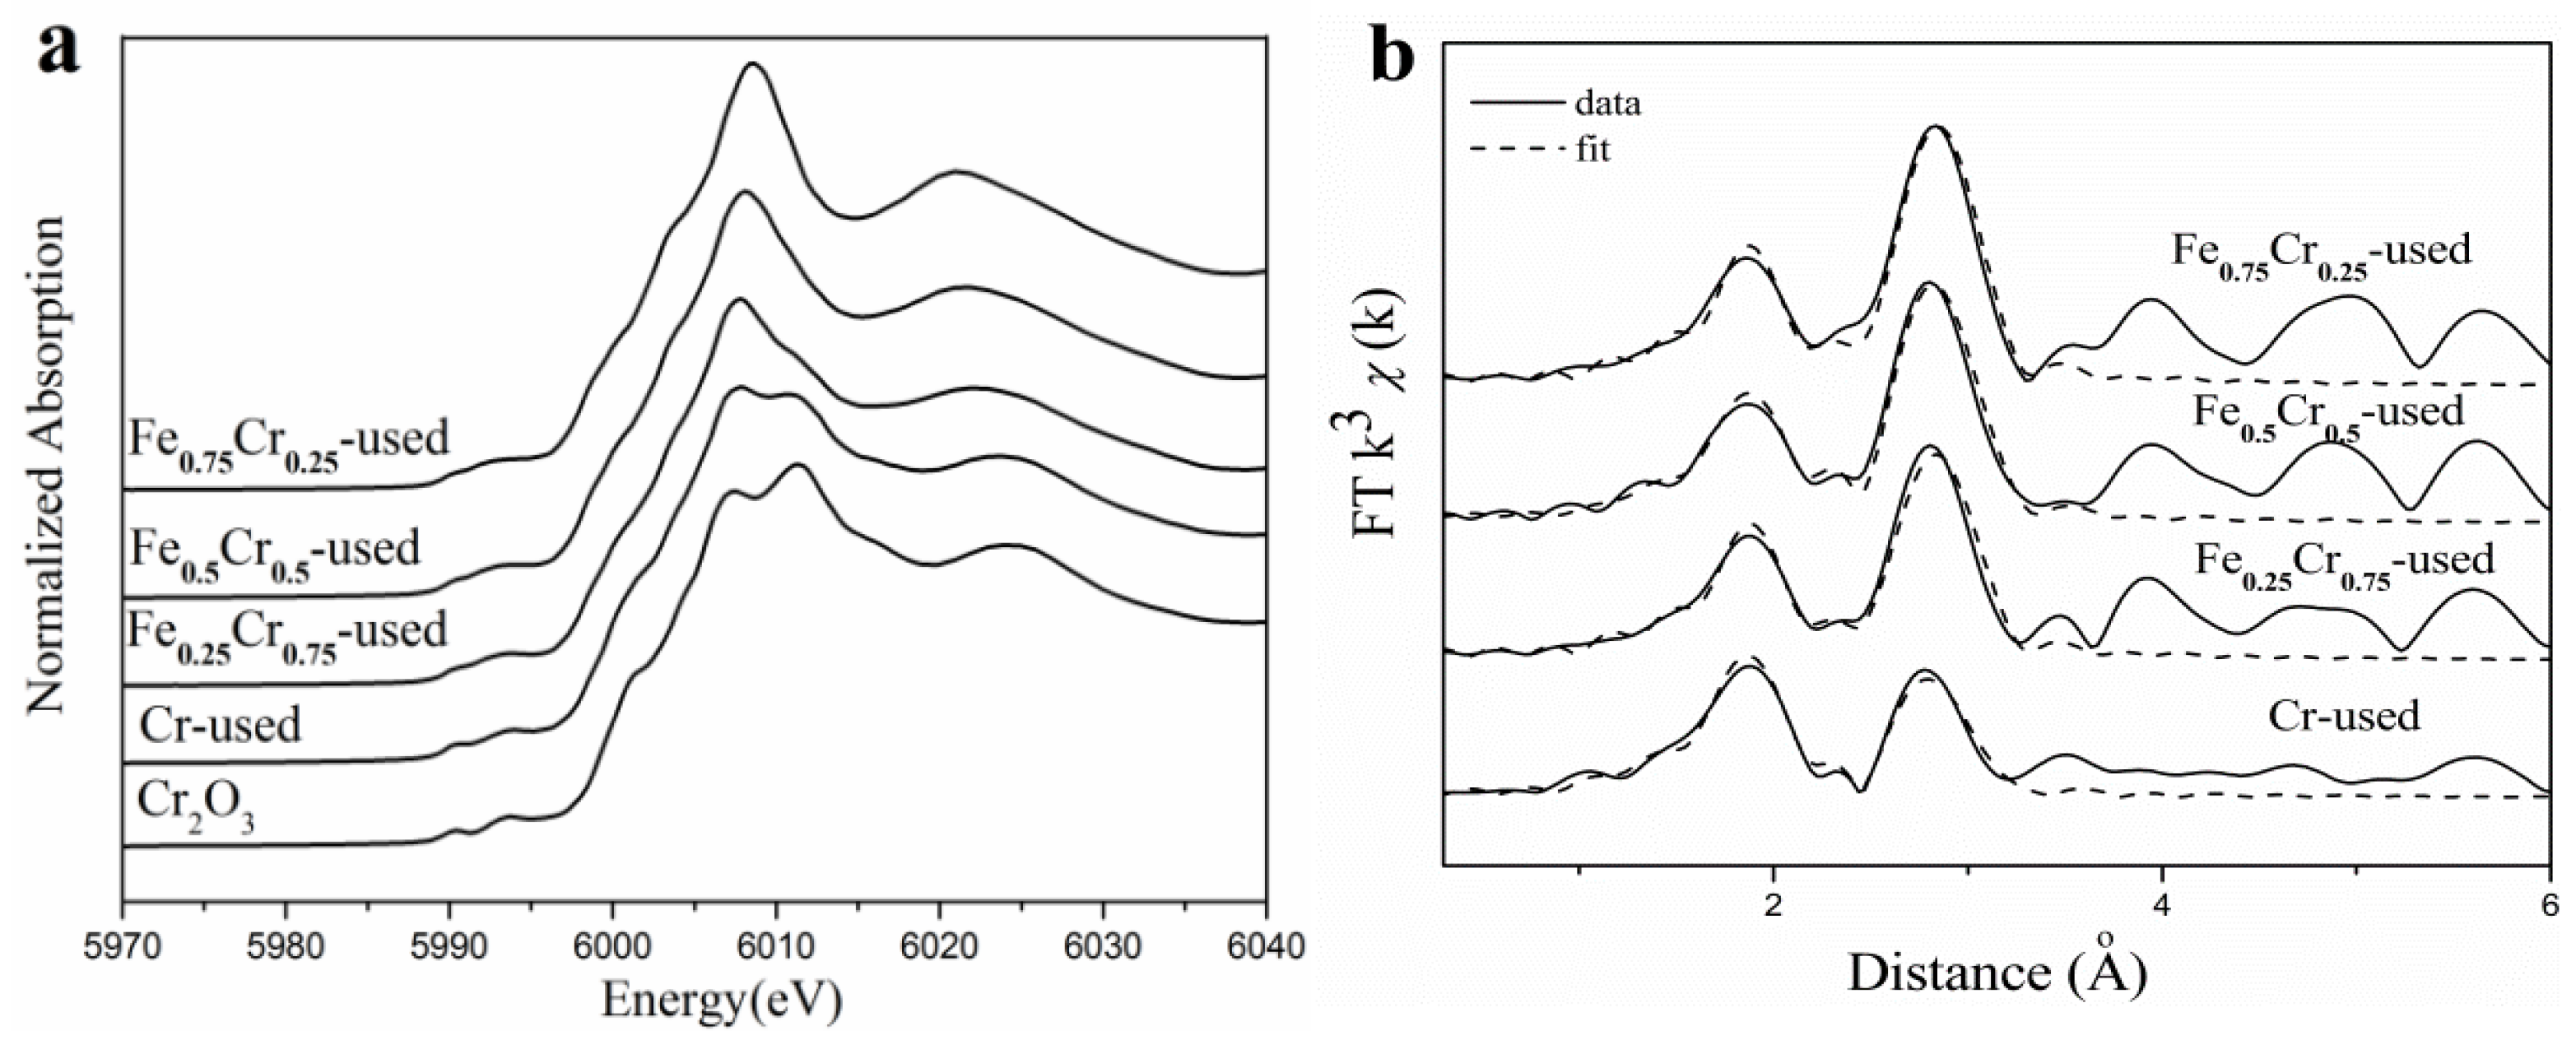
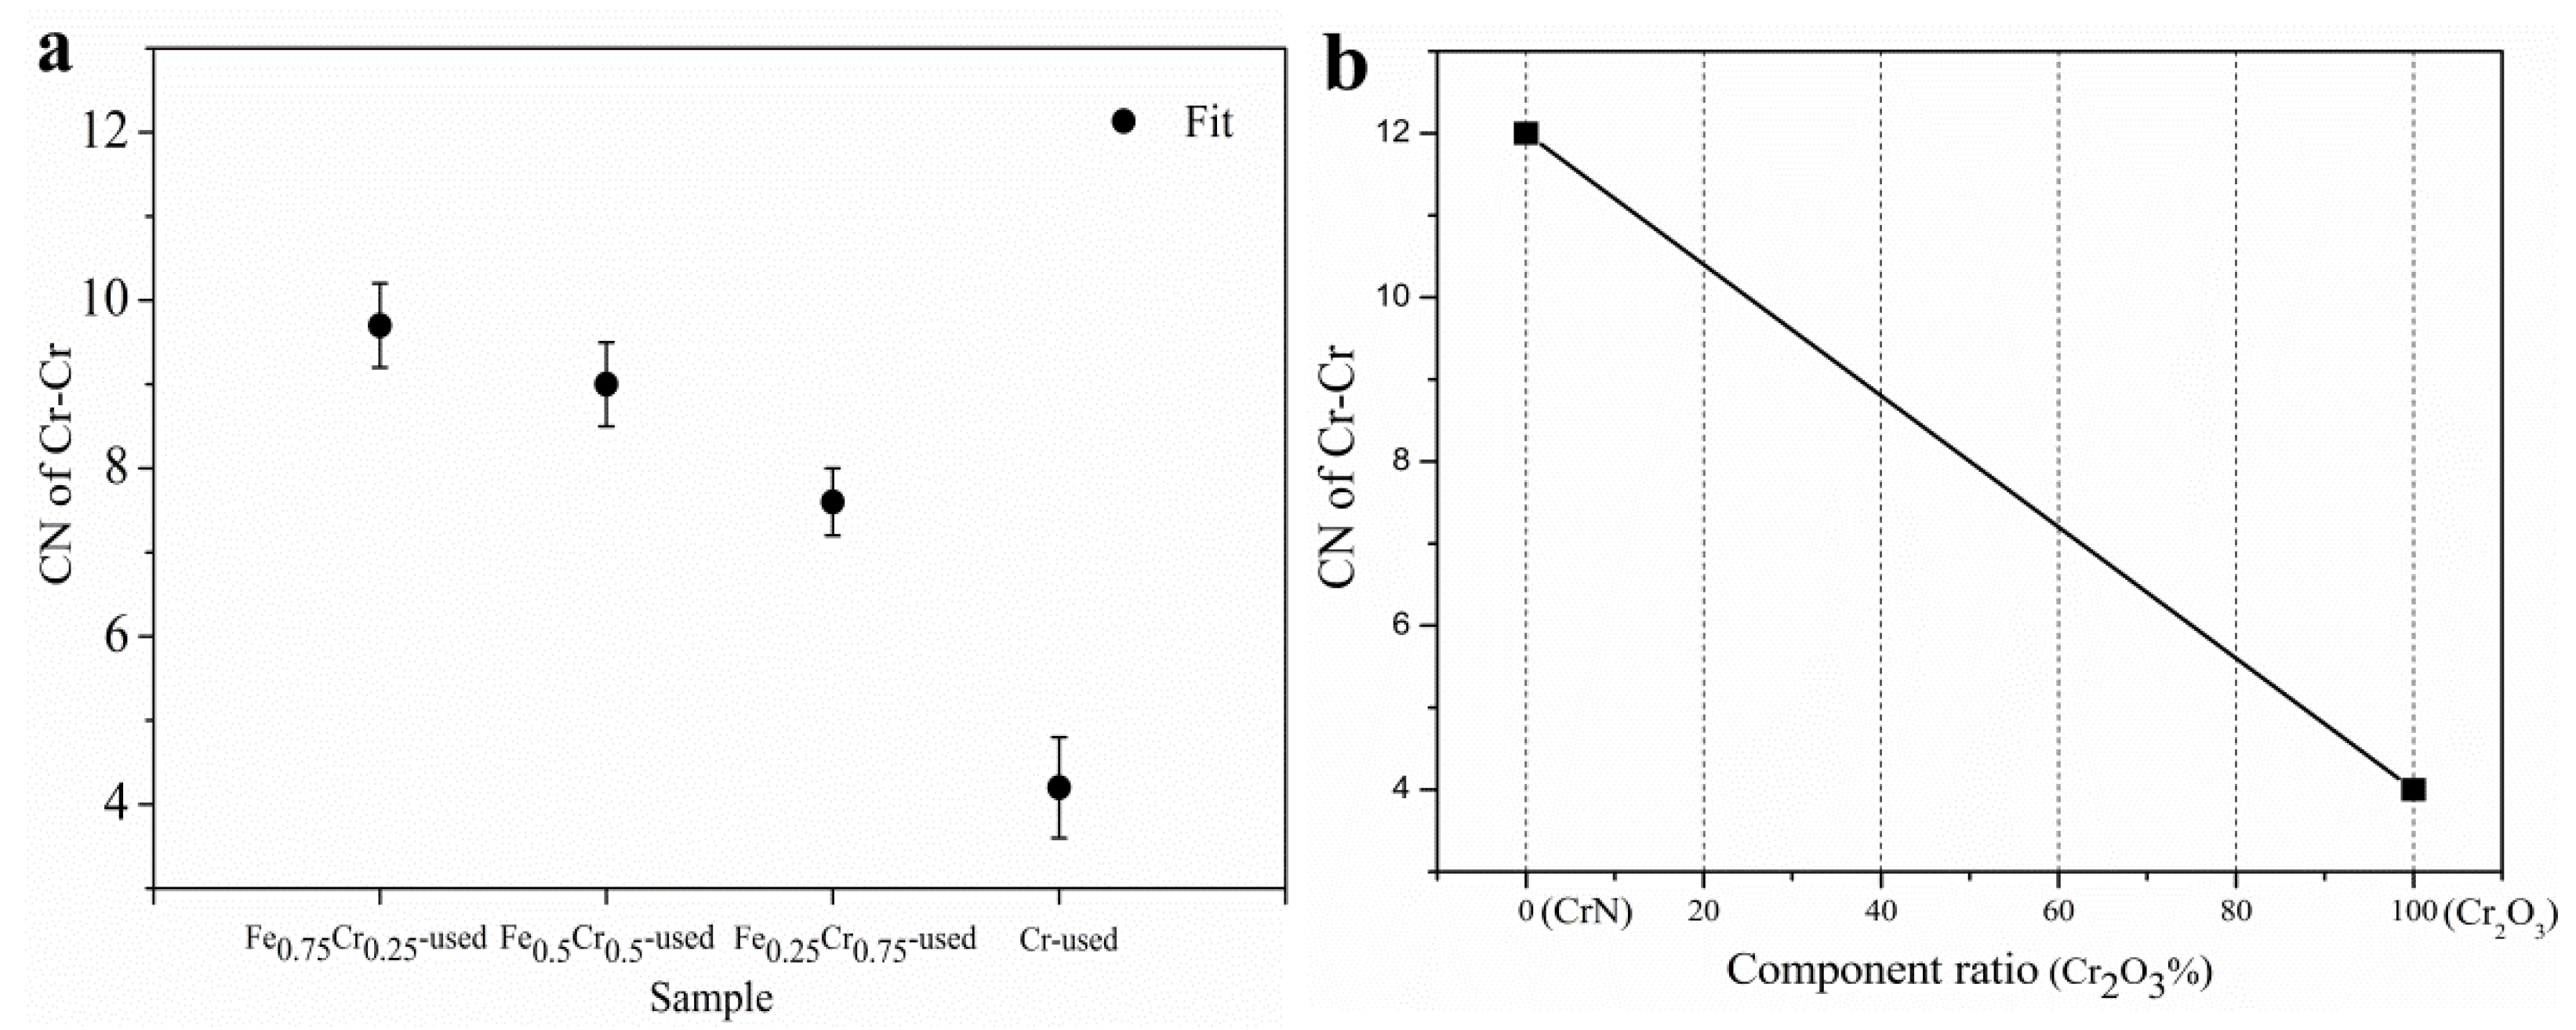
3.3. Identification of Catalytic Active Components
4. Conclusions
Author Contributions
Funding
Data Availability Statement
Acknowledgments
Conflicts of Interest
References
- Yin, S.F.; Xu, B.Q.; Zhou, X.P.; Au, C.T. A mini-review on ammonia decomposition catalysts for on-site generation of hydrogen for fuel cell applications. Appl. Catal. A Gen. 2004, 277, 1–9. [Google Scholar] [CrossRef]
- Schüth, F.; Palkovits, R.; Schlögl, R.; Su, D.S. Ammonia as a possible element in an energy infrastructure: Catalysts for ammonia decomposition. Energy Environ. Sci. 2012, 5, 6278–6289. [Google Scholar] [CrossRef] [Green Version]
- Metkemeijer, R.; Achard, P. Ammonia as a feed stock for a hydrogen fuel cell; reformer and fuel cell behaviour. J. Power Sources 1994, 49, 271–282. [Google Scholar] [CrossRef]
- Choudhary, T.V.; Goodman, D.W. CO-free production of hydrogen via stepwise steam reforming of methane. J. Catal. 2000, 192, 316–321. [Google Scholar] [CrossRef] [Green Version]
- Dongil, A.B. Recent progress on transition metal nitrides nanoparticles as heterogeneous catalysts. Nanomaterials 2019, 9, 1111. [Google Scholar] [CrossRef] [Green Version]
- Mukherjee, S.; Devaguptapu, S.V.; Sviripa, A.; Lund, C.; Wu, G. Low-temperature ammonia decomposition catalysts for hydrogen generation. Appl. Catal. B Environ. 2018, 226, 162–181. [Google Scholar] [CrossRef]
- Lucentini, I.; Garcia, X.; Vendrell, X.; Llorca, J. Review of the decomposition of ammonia to generate hydrogen. Ind. Eng. Chem. Res. 2021, 60, 18560–18611. [Google Scholar] [CrossRef]
- Le, T.A.; Kim, Y.; Kim, H.W.; Lee, S.U.; Kim, J.R.; Kim, T.W.; Lee, Y.G.; Chae, H.J. Ru-supported lanthania-ceria composite as an efficient catalyst for COx-free H2 production from ammonia decomposition. Appl. Catal. B Environ. 2021, 285, 119831. [Google Scholar] [CrossRef]
- Hu, X.C.; Fu, X.P.; Wang, W.W.; Wang, X.; Wu, K.; Si, R.; Ma, C.; Jia, C.J.; Yan, C.H. Ceria-supported ruthenium clusters transforming from isolated single atoms for hydrogen production via decomposition of ammonia. Appl. Catal. B Environ. 2020, 268, 118424. [Google Scholar] [CrossRef]
- Zheng, W. Nanomaterials for Ammonia Decomposition. Ph.D. Thesis, Universitat Berlin, Berlin, Germany, 2011. [Google Scholar]
- Arabczyk, W.; Pelka, R. Studies of the kinetics of two parallel reactions: Ammonia decomposition and nitriding of iron catalys. J. Phys. Chem. A 2008, 113, 411–416. [Google Scholar] [CrossRef] [PubMed]
- Pelka, R.; Moszynska, I.; Arabczyk, W. Catalytic ammonia decomposition over Fe/Fe4N. Catal. Lett. 2009, 128, 72–76. [Google Scholar] [CrossRef]
- Ohtsuka, Y.; Xu, C.; Kong, D.; Tsubouchi, N. Decomposition of ammonia with iron and calcium catalysts supported on coal chars. Fuel 2004, 83, 685–692. [Google Scholar] [CrossRef]
- Othman, N.E.F.; Salleh, H.M.; Purwanto, H. Utilization of low-grade iron ore in ammonia decomposition. Procedia Chem. 2016, 19, 119–124. [Google Scholar] [CrossRef] [Green Version]
- Takezawa, N.; Toyoshima, I. The change of the rate-determining step of the ammonia decomposition over an ammonia synthetic iron catalyst. J. Phys. Chem. 1966, 70, 594–595. [Google Scholar] [CrossRef]
- Lanzani, G.; Laasonen, K. NH3 adsorption and dissociation on a nanosized iron cluster. Int. J. Hydrogy Energy 2010, 35, 6571–6577. [Google Scholar] [CrossRef]
- Hu, X.C.; Wang, W.W.; Gu, Y.Q.; Jin, Z.; Song, Q.S.; Jia, C.J. Co-SiO2 nanocomposite catalysts for COx-free hydrogen production by ammonia decomposition. ChemPlusChem 2017, 82, 368–375. [Google Scholar] [CrossRef] [PubMed]
- Xie, P.; Yao, Y.; Huang, Z.; Liu, Z.; Zhang, J.; Li, T.; Wang, G.; Shahbazian-Yassar, R.; Hu, L.; Wang, C. Highly efficient decomposition of ammonia using high-entropy alloy catalysts. Nat. Commun. 2019, 10, 4011. [Google Scholar] [CrossRef] [Green Version]
- Srifa, A.; Okura, K.; Okanishi, T.; Muroyama, H.; Matsui, T.; Eguchi, K. COx-free hydrogen production via ammonia decomposition over molybdenum nitride-based catalysts. Catal. Sci. Tech. 2016, 6, 7495–7504. [Google Scholar] [CrossRef]
- Cui, H.Z.; Gu, Y.Q.; He, X.X.; Wei, S.; Jin, Z.; Jia, C.J.; Song, Q.S. Iron-based composite nanostructure catalysts used to produce COx-free hydrogen from ammonia. Sci. Bull. 2016, 61, 220–226. [Google Scholar] [CrossRef] [Green Version]
- Cao, J.L.; Yan, Z.L.; Deng, Q.F.; Yuan, Z.Y.; Wang, Y.; Sun, G.; Wang, X.D.; Hari, B.; Zhang, Z.Y. Homogeneous precipitation method preparation of modified red mud supported Ni mesoporous catalysts for ammonia decomposition. Catal. Sci. Tech. 2014, 4, 361–368. [Google Scholar] [CrossRef]
- Ji, J.; Duan, X.Z.; Qian, G.; Zhou, X.G.; Chen, D.; Yuan, W.K. In situ production of Ni catalysts at the tips of carbon nanofibers and application in catalytic ammonia decomposition. Ind. Eng. Chem. Res. 2013, 52, 1854–1858. [Google Scholar] [CrossRef]
- Muroyama, H.; Saburi, C.; Matsui, T.; Eguchi, K. Ammonia decomposition over Ni/La2O3 catalyst for on-site generation of hydrogen. Appl. Catal. A Gen. 2012, 443, 119–124. [Google Scholar] [CrossRef]
- Do, Q.C.; Kim, Y.; Le, T.A.; Kim, G.J.; Kim, J.-R.; Kim, T.-W.; Lee, Y.-J.; Chae, H.-J. Facile one-pot synthesis of Ni-based catalysts by cation-anion double hydrolysis method as highly active Ru-free catalysts for green H2 production via NH3 decomposition. Appl. Catal. B Environ. 2022, 307, 121167. [Google Scholar] [CrossRef]
- Gu, Y.; Ma, Y.; Long, Z.; Zhao, S.; Wang, Y.; Zhang, W. One-pot synthesis of supported Ni@Al2O3 catalysts with uniform small-sized Ni for hydrogen generation via ammonia decomposition. Int. J. Hydrog. Energy 2021, 46, 4045–4054. [Google Scholar] [CrossRef]
- Zhou, C.; Wu, K.; Huang, H.; Cao, C.-F.; Luo, Y.; Chen, C.-Q.; Lin, L.; Au, C.; Jiang, L. Spatial confinement of electron-rich Ni nanoparticles for efficient ammonia decomposition to hydrogen production. ACS Catal. 2021, 11, 10345–10350. [Google Scholar] [CrossRef]
- Wang, L.; Yi, Y.; Zhao, Y.; Zhang, R.; Zhang, J.; Guo, H. NH3 decomposition for H2 generation: Effects of cheap metals and supports on plasma-catalyst synergy. ACS Catal. 2015, 5, 4167–4174. [Google Scholar] [CrossRef]
- Duan, X.; Ji, J.; Qian, G.; Fan, C.; Zhu, Y.; Zhou, X.; Chen, D.; Yuan, W. Ammonia decomposition on Fe(110), Co(111), and Ni(111) surfaces: A density functional theory study. J. Mol. Catal. A Chem. 2012, 357, 81–86. [Google Scholar] [CrossRef]
- Somorjai, G.A.; Li, Y. Impact of surface chemistry. Proc. Natl. Acad. Sci. USA 2011, 108, 917–924. [Google Scholar] [CrossRef] [PubMed] [Green Version]
- Strongin, D.R.; Carrazza, J.; Bare, S.R.; Somorjai, G.A. The importance of C7 sites and surface roughness in the ammonia synthesis reaction over iron. J. Catal. 1987, 103, 213–215. [Google Scholar] [CrossRef] [Green Version]
- Boudjemaa, A.; Bouarab, R.; Saadi, S.; Bouguelia, A.; Trari, M. Photoelectrochemical H2-generation over spinel FeCr2O4 in X2- solutions (X2- = S2- and SO32-). Appl. Energy 2009, 86, 1080–1086. [Google Scholar] [CrossRef]
- Maroño, M.; Dufour, J.; Ruiz, A. Synthesis of Fe3O4-based catalysts for the high-temperature water gas shift reaction. Int. J. Hydrog. Energy 2009, 34, 4475–4481. [Google Scholar] [CrossRef]
- Maroño, M.; Ruiz, E.; Sánchez, J.M.; Martos, C.; Dufour, J.; Ruiz, A. Performance of Fe-Cr based WGS catalysts prepared by co-precipitation and oxi-precipitation methods. Int. J. Hydrog. Energy 2009, 34, 8921–8928. [Google Scholar] [CrossRef]
- Doppler, G.; Trautwein, A.X.; Ziethen, H.M. Physical and catalytic properties of high temperature water gas shift catalysts based upon iron-chromium oxides. Appl. Catal. 1988, 40, 119–130. [Google Scholar] [CrossRef]
- Li, L.; Zhu, Z.H.; Wang, S.B.; Yao, X.D.; Yan, Z.F. Chromium oxide catalysts for COx-free hydrogen generation via catalytic ammonia decomposition. J. Mol. Catal. A Chem. 2009, 304, 71–76. [Google Scholar] [CrossRef]
- Langford, J.I. Powder pattern programs. J. Appl. Cryst. 1971, 4, 259–260. [Google Scholar] [CrossRef]
- Langford, J.I. The accuracy of cell dimensions determined by Cohen’s method of least squares and the systematic indexing of powder data. J. Appl. Cryst. 1973, 6, 190–196. [Google Scholar] [CrossRef]
- Shannon, R.D. Revised effective ionic radii and systematic studies of interatomic distances in halides and chalcogenides. Acta Cryst. A 1976, 32, 751–767. [Google Scholar] [CrossRef]
- Montero-Cabrera, M.E.; Fuentes-Cobas, L.E.; Macías-Ríos, E.; Fuentes-Montero, M.E. Application of x-ray absorption fine structure(XAFS) to local-order analysis in Fe-Cr maghemite-like materials. AIP Conf. Proc. 2015, 1671, 020008. [Google Scholar]
- Gu, Y.Q.; Jin, Z.; Zhang, H.; Xu, R.J.; Zheng, M.J.; Guo, Y.M.; Song, Q.S.; Jia, C.J. Transition metal nanoparticles dispersed in an alumina matrix as active and stable catalysts for COx-free hydrogen production from ammonia. J. Mater. Chem. A 2015, 3, 17172–17180. [Google Scholar] [CrossRef]
- Bell, T.E.; Torrente-Murciano, L. H2 production via ammonia decomposition using non-noble metal catalysts: A Review. Top. Catal. 2016, 59, 1438–1457. [Google Scholar] [CrossRef] [Green Version]
- Wang, L.; Zhao, Y.; Liu, C.Y.; Gong, W.M.; Guo, H.C. Plasma driven ammonia decomposition on a Fe-catalyst: Eliminating surface nitrogen poisoning. Chem. Commun. 2013, 49, 3787–3789. [Google Scholar] [CrossRef] [PubMed]
- Opeyemi, O.A.; Zaman, S.F. Ammonia decomposition for hydrogen production: A thermodynamic study. Chem. Pap. 2020. (prepublish). [Google Scholar] [CrossRef]
- Feyen, M.; Weidenthaler, C.; Güttel, R.; Schlichte, K.; Holle, U.; Lu, A.H.; Schüth, F. High-temperature stable, iron-based core-shell catalysts for ammonia decomposition. Chem.-A Eur. J. 2011, 17, 598–605. [Google Scholar] [CrossRef]
- Lu, A.H.; Nitz, J.J.; Comotti, M.; Weidenthaler, C.; Schlichte, K.; Lehmann, C.W.; Terasaki, O.; Schuth, F. Spatially and size selective synthesis of Fe-based nanoparticles on ordered mesoporous supports as highly active and stable catalysts for ammonia decomposition. J. Am. Chem. Soc. 2010, 132, 14152–14162. [Google Scholar] [CrossRef] [PubMed]
- Zhang, J.; Comotti, M.; Schüth, F.; Schlögl, R.; Su, D.S. Commercial Fe- or Co- containing carbon nanotubes as catalysts for NH3 decomposition. Chem. Commun. 2007, 19, 1916–1918. [Google Scholar] [CrossRef] [PubMed]
- Zhang, J.; Muller, J.O.; Zheng, W.; Wang, D.; Su, D.; Schlgl, R. Individual Fe-Co alloy nanoparticles on carbon nanotubes: Structural and catalyticproperties. Nano Lett. 2008, 8, 2738–2743. [Google Scholar] [CrossRef]
- Li, Y.; Yao, L.; Liu, S.; Zhao, J.; Ji, W.; Au, C.-T. Cs-modified ironnanoparticles encapsulated in microporous and mesoporous SiO, for CO-free Hproduction via ammonia decomposition. Catal. Today 2011, 160, 79–86. [Google Scholar] [CrossRef]
- Lorenzut, B.; Montini, T.; Bevilacqua, M.; Fornasiero, P. FeMo-Based Catalysts for H2 Production by NH3 Decomposition. Appl. Catal. B 2012, 125, 409–417. [Google Scholar] [CrossRef]
- Podila, S.; Driss, H.; Zaman, S.F.; Ali, A.M.; Al-Zahrani, A.A.; Daous, M.A.; Petrov, L.A. MgFe and Mg-Co-Fe Mixed OxidesDerived from Hydrotalcites: Highly Efficient Catalysts for CO FreeHydrogen Production from NH3. Int. Hydrog. Energy 2020, 45, 873–890. [Google Scholar] [CrossRef]
- Khabouri, S.A.; Harthi, S.A.; Maekawa, T.; Yousif, A.A. Composition, Electronic and MagneticInvestigation of the Encapsulated ZnFe,O4 Nanoparticles in Multiwall Carbon NanotubesContaining Ni Residuals. Nanoscale Res. Lett. 2015, 10, 262. [Google Scholar] [CrossRef] [Green Version]
- Abidov, A.; Allabergenov, B.; Lee, J.; Jeon, H.W.; Jeong, S.W.; Kim, S. X-ray photoelectron spectroscopycharacterization of Fe doped TiO2 photocatalyst. Int. J. Mach. Mach. Mater. 2013, 1, 294–296. [Google Scholar]
- Biesinger, M.C.; Payne, B.P.; Grosvenor, A.P.; Lau, L.; Gerson, A.R.; Smart, R. Resolving surface chemical states in XPS analysis of first row transition metals, oxides and hydroxides: Cr, Mn, Fe, Co and Ni. Appl. Surf. Sci. 2011, 257, 2717–2730. [Google Scholar] [CrossRef]
- Watts, J.F.; Wolstenholme, J. An Introduction to Surface Analysis by XPS and AES[M]; John Wiley &sons Ltd.: Hoboken, NJ, USA, 2003; pp. 6–7. [Google Scholar]
- Yugo, K.; Yuichi, S.; Shigeaki, U. Changes in the chemical state of metallic Cr during deposition on a polyimide substrate: Full soft XPS and ToF-SIMS depth profiles. Appl. Surf. Sci. 2021, 553, 149437. [Google Scholar]
- Rignanese, G.M.; Pasquarello, A.; Charlier, J.C.; Gonze, X.; Car, R. Nitrogen incorporation at Si(001)-SiO2 interfaces: Relation between n 1s core-level shifts and microscopic structure. Phys. Rev. Lett. 1997, 79, 5174–5177. [Google Scholar] [CrossRef] [Green Version]
- Li, Q.Q.; Zhang, S.; Dai, L.M.; Li, L.S. Nitrogen-doped colloidal graphene quantum dots andtheir size-dependent electrocatalytic activity for the oxygen reduction reaction. J. Am. Chem. Soc. 2012, 134, 18932–18935. [Google Scholar] [CrossRef]
- Galvita, V.; Sundmacher, K. Redox behavior and reduction mechanism of Fe2O3–CeZrO2 as oxygen storage material. J Mater Sci. 2007, 42, 9300–9307. [Google Scholar] [CrossRef]
- Lin, H.Y.; Chen, Y.W.; Li, C.P. The mechanism of reduction of iron oxide by hydrogen. Thermochim. Acta 2003, 400, 61–67. [Google Scholar] [CrossRef]
- Kovalenko, V.V.; Rumyantseva, M.N.; Gaskov, A.M.; Makshina, E.V.; Yushchenko, V.V.; Ivanova, I.I.; Ponzoni, A.; Faglia, G.; Comini, E. SnO2/Fe2O3 nanocomposites: Ethanol-sensing performance and catalytic activity for oxidation of ethanol. Inorg. Mater. 2006, 42, 1088–1093. [Google Scholar] [CrossRef]
- Michorczyk, P.; Ogonowski, J.; Kusrowski, P.; Chmielarz, L. Chromium oxide supported on MCM-41 as a highly active and selective catalyst for dehydrogenation of propane with CO2. Appl. Catal. A Gen. 2008, 349, 62–69. [Google Scholar] [CrossRef]
- Ayari, F.; Mhamdi, M.; Debecker, D.P.; Gaigneaux, E.M.; Álvarez-Rodríguez, J.; Guerrero-Ruiz, A.; Delahay, G.; Ghorbel, A. Effect of the chromium precursor nature on the physicochemical and catalytic properties of Cr-ZSM-5 catalysts: Application to the ammoxidation of ethylene. J. Mol. Catal. A Chem. 2011, 339, 8–16. [Google Scholar] [CrossRef]
- Ilieva, L.I.; Andreeva, D.H. Investigation of the chromium oxide system by means of temperature-programmed reduction. Thermochim. Acta 1995, 265, 223–231. [Google Scholar] [CrossRef]
- Arabczyk, W.; Zamlynny, J. Study of the ammonia decomposition over iron catalysts. Catal. Lett. 1999, 60, 167–171. [Google Scholar] [CrossRef]
- Lendzion-Bieluń, Z.; Pelka, R.; Arabczyk, W. Study of the kinetics of ammonia synthesis and decomposition on iron and cobalt catalysts. Catal. Lett. 2009, 129, 119–123. [Google Scholar] [CrossRef]
- Tsubouchi, N.; Hashimoto, H.; Ohtsuka, Y. High catalytic performance of fine particles of metallic iron formed from limonite in the decomposition of a low concentration of ammonia. Catal. Lett. 2005, 105, 203–208. [Google Scholar] [CrossRef]


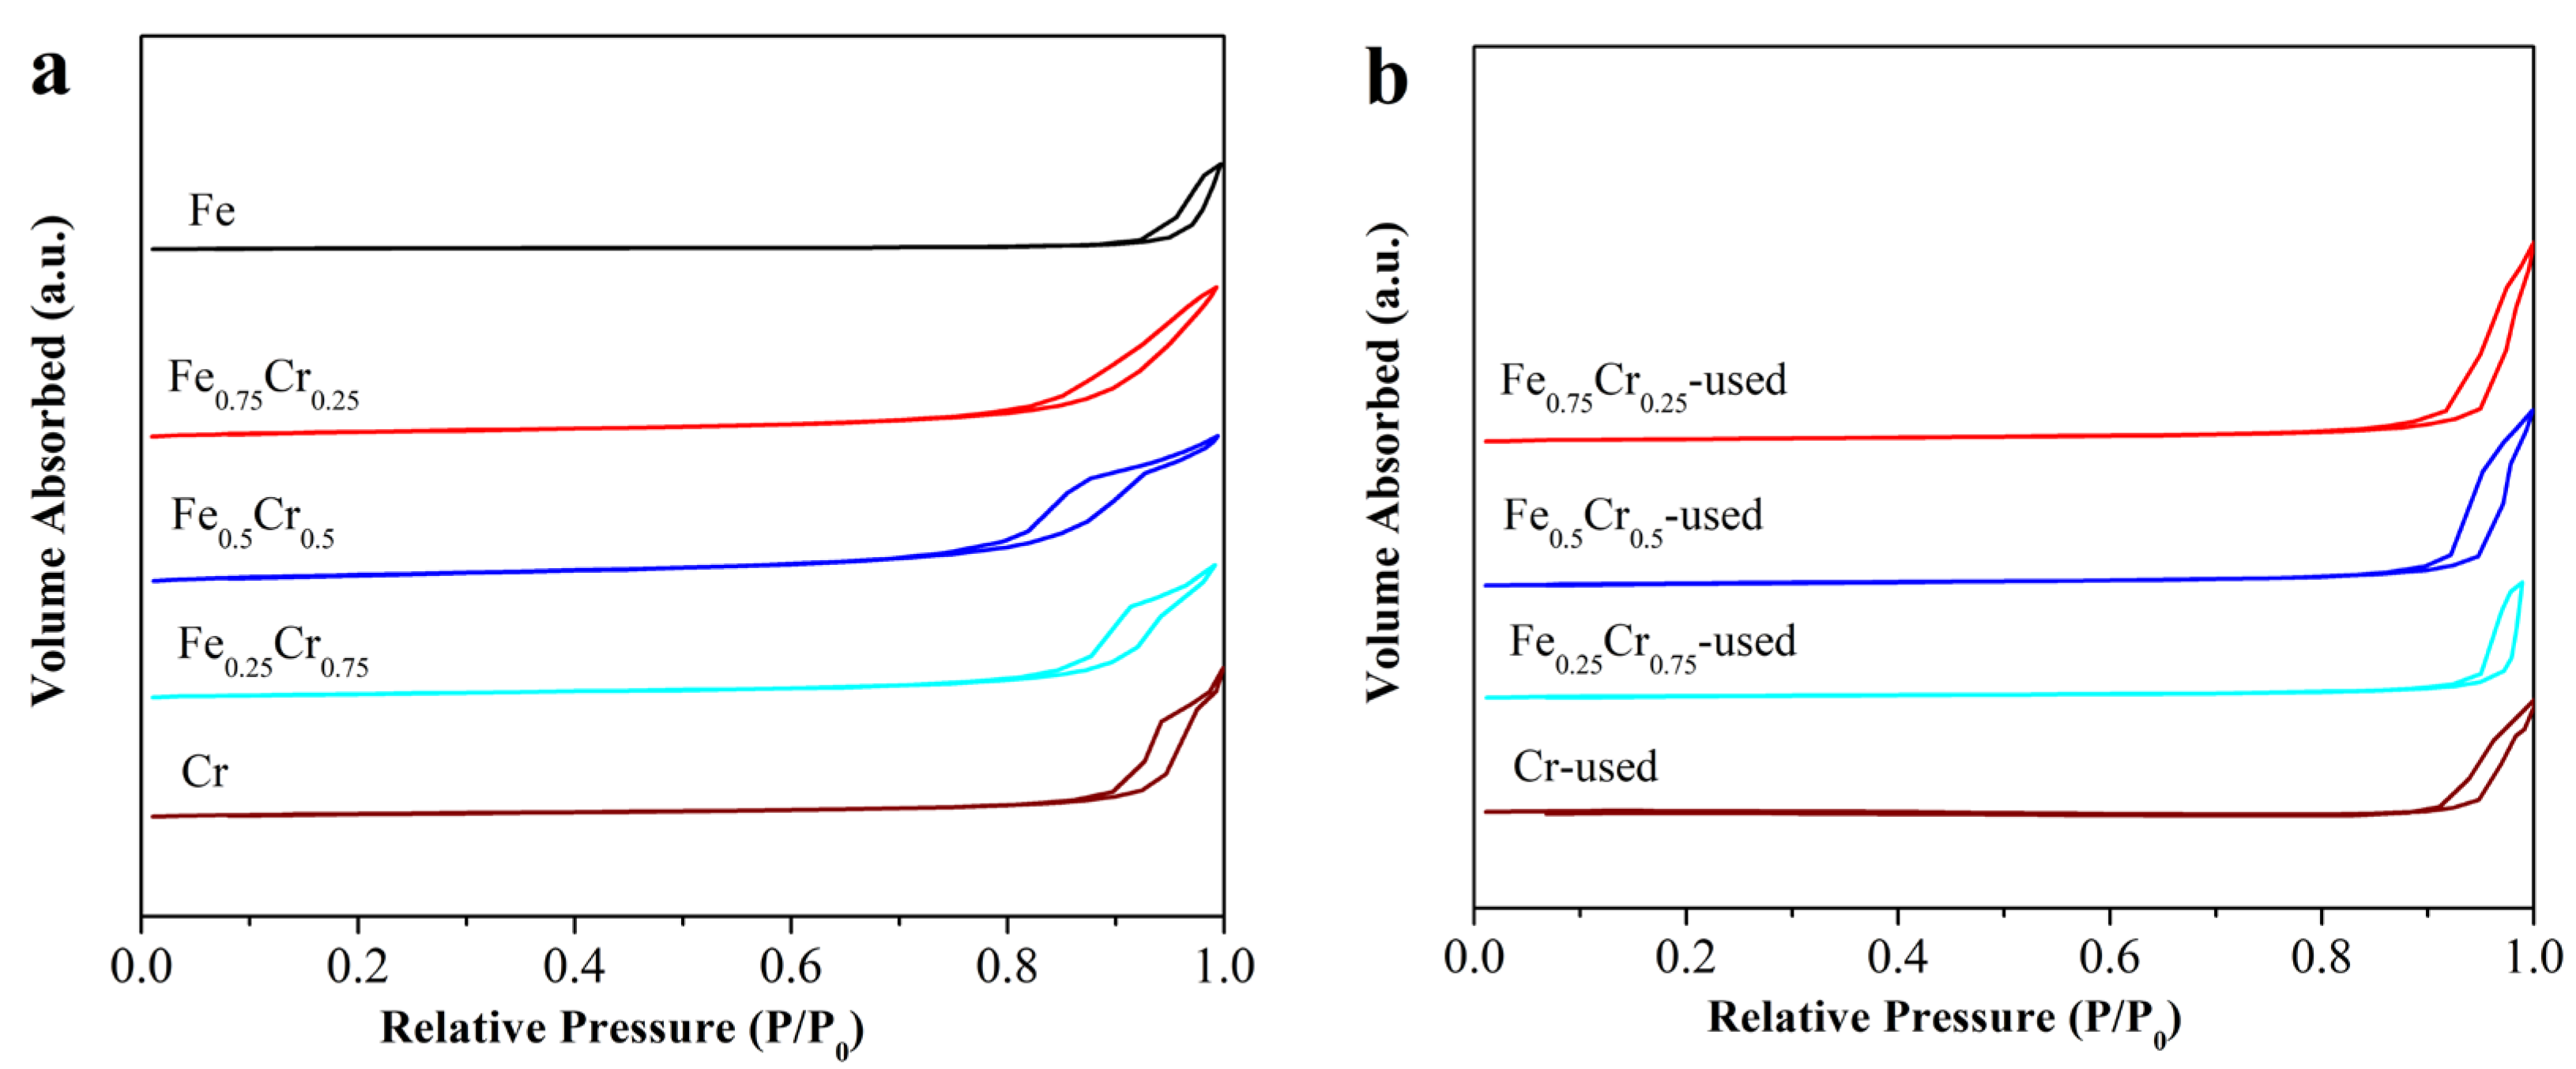
| Sample | Surface Atomic Ratio (Fe/Cr) a | Lattice Constants (Å) b | D (nm) c | SBET (m2/g) d Fresh/Uesd |
|---|---|---|---|---|
| Fe | 100/0 | a = 5.0329(1) c = 13.7462(2) | 56 | 13/- |
| Fe0.75Cr0.25 | 67.2/32.8 | a = 5.0192(4) c = 13.708(1) | 25 | 62/34 |
| Fe0.5Cr0.5 | 45.0/55.0 | a = 4.9863(3) c = 13.6357(7) | 16 | 84/34 |
| Fe0.25Cr0.75 | 30.2/69.8 | a = 4.9607(6) c = 13.587(1) | 16 | 51/23 |
| Cr | 0/100 | a = 4.9393(1) c =13.5549(1) | 27 | 39/17 |
| Sample | Phase Composition | (Fe,Cr)2O3 | (Fe,Cr)3O4 | Fe | Fe4N | CrN |
|---|---|---|---|---|---|---|
| Fe-used | lattice constants a(Å) a and crystal grain size D (nm) b | - | - | 2.8667(1) D = 46 | - | - |
| Fe0.75Cr0.25-used | - | 8.3778(1) | 2.8667(1) D = 53 | 3.7967(1) D = 47 | 4.1476(1) | |
| Fe0.5Cr0.5-used | a = 4.9671(3) c=13.5875(7) | 8.3776(2) | 2.8670(1) | 3.7984(1) D = 49 | 4.1469(2) D = 37 | |
| Fe0.25 Cr0.75-used | a = 4.9622(2) c=13.5762(5) D = 29 | - | 2.8668(2) D = 47 | - | 4.1449(1) D = 38 | |
| Cr-used | a =4.9638(1) c=13.5581(4) D = 32 | - | - | - | 4.1438(1) D = 38 |
| Sample | Fe-N | Fe-Fe | D. W. | ∆E0 (eV) | ||
|---|---|---|---|---|---|---|
| R (Å) | CN | R (Å) | CN | |||
| Fe0.75Cr0.25-used α | 1.94 ± 0.01 | 2.8 ± 1.1 | 2.74 ± 0.03 | 6.5 ± 1.1 | 0.006(Fe) 0.003(N) | 9.5 ± 3.2 |
| Fe0.5Cr0.5-used β | 1.71 ± 0.03 | −0.9 ± 0.6 | 2.55 ± 0.03 2.70 ± 0.01 | 2.7 ± 1.7 5.3 ± 1.9 | 7.6 ± 6.2 | |
| Fe0.25Cr0.75-used γ | _ | _ | 2.46 ± 0.01 2.83 ± 0.01 | 6.5 ± 0.8 5.1 ± 1.3 | 2.9 ± 3.8 | |
| Sample | Cr-N/O | Cr-Cr | D. W. | ∆E0 (eV) | ||
|---|---|---|---|---|---|---|
| R (Å) | CN | R (Å) | CN | |||
| Fe0.75Cr0.25-used | 2.02 ± 0.04 | 6.4 ± 0.6 | 2.95 ± 0.02 | 9.7 ± 0.5 | 0.005(Cr) | 9.9 ± 0.5 |
| Fe0.5Cr0.5-used | 2.02 ± 0.05 | 6.3 ± 0.5 | 2.94 ± 0.01 | 9.0 ± 0.5 | ||
| Fe0.25Cr0.75-used | 2.02 ± 0.05 | 6.2 ± 0.5 | 2.94 ± 0.01 | 7.6 ± 0.4 | ||
| Cr-used | 2.00 ± 0.07 | 6.6 ± 0.6 | 2.93 ± 0.00 | 4.2 ± 0.6 | ||
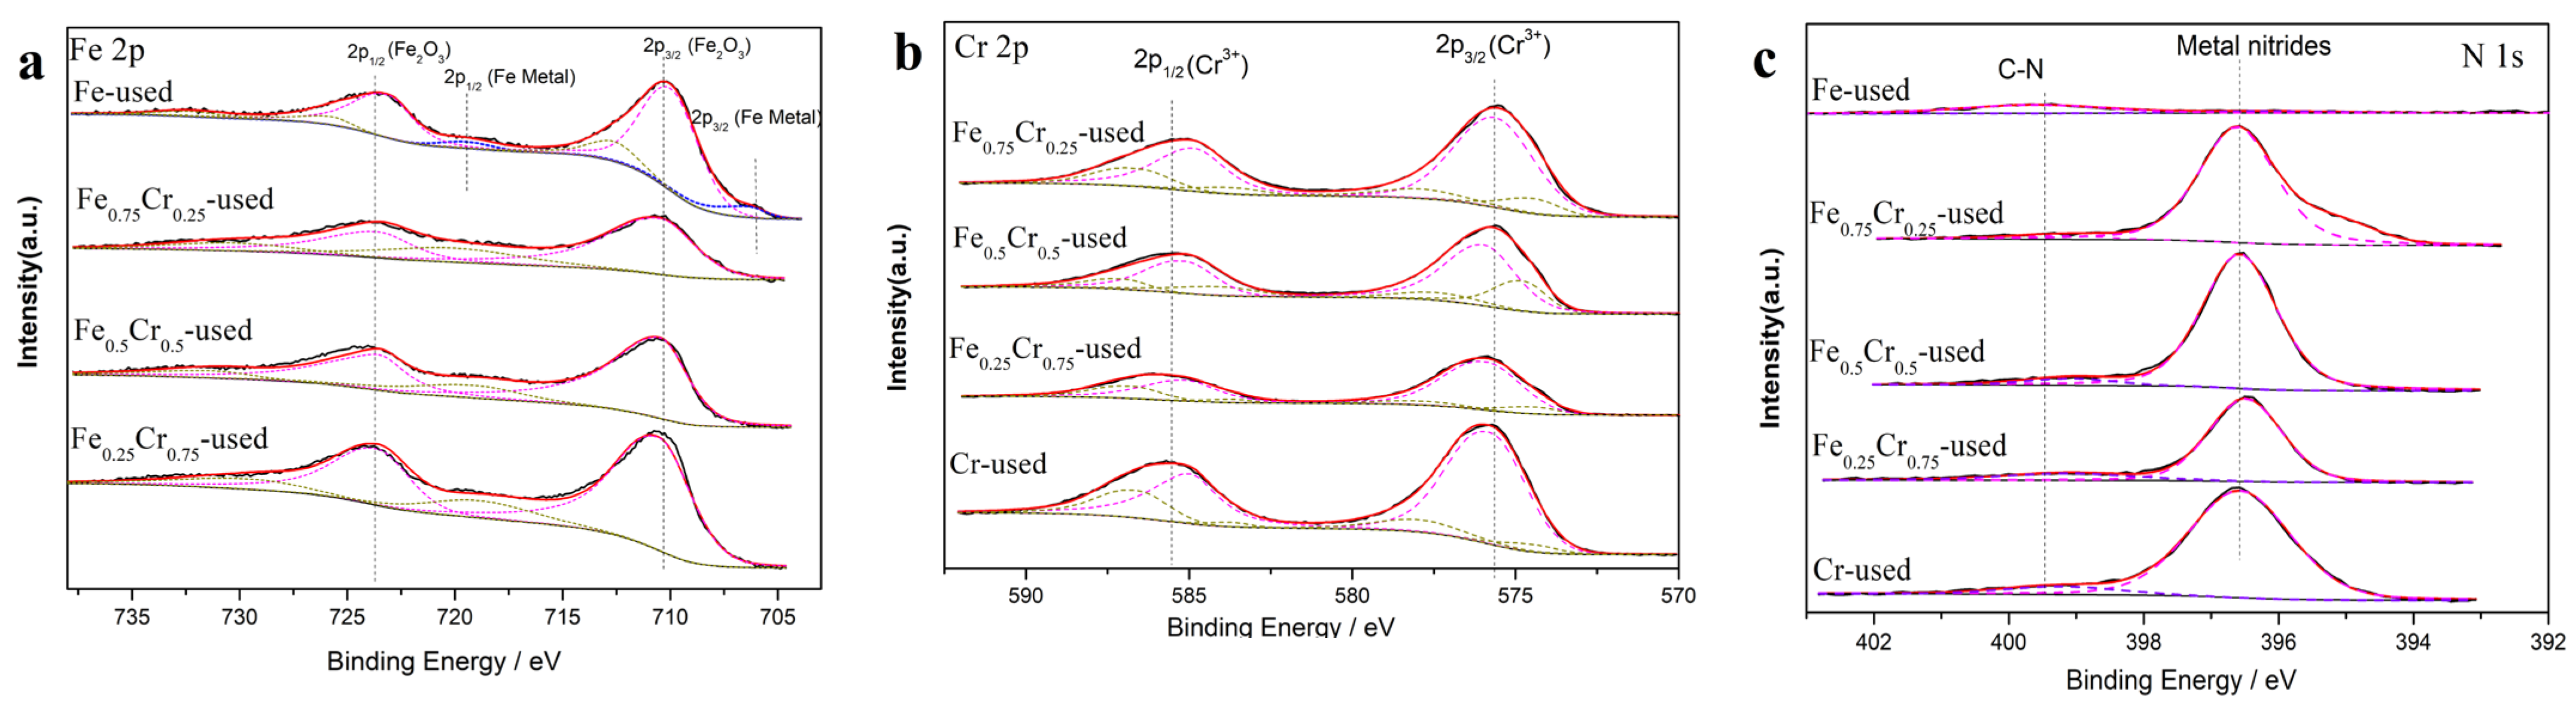
| Sample | Chemical State | ||||
|---|---|---|---|---|---|
| Fe2O3 | Fe Metal | Cr3+ | Metal Nitrides | C-N | |
| (%) | (%) | (%) | (%) | (%) | |
| Fe-used | 89.86 | 10.14 | - | - | - |
| Fe0.75Cr0.25-used | 100 | 0 | 100 | 97.22 | 2.78 |
| Fe0.5Cr0.5-used | 100 | 0 | 100 | 94.39 | 5.61 |
| Fe0.25Cr0.75-used | 100 | 0 | 100 | 85.38 | 14.62 |
| Cr-used | - | - | 100 | 92.42 | 7.58 |
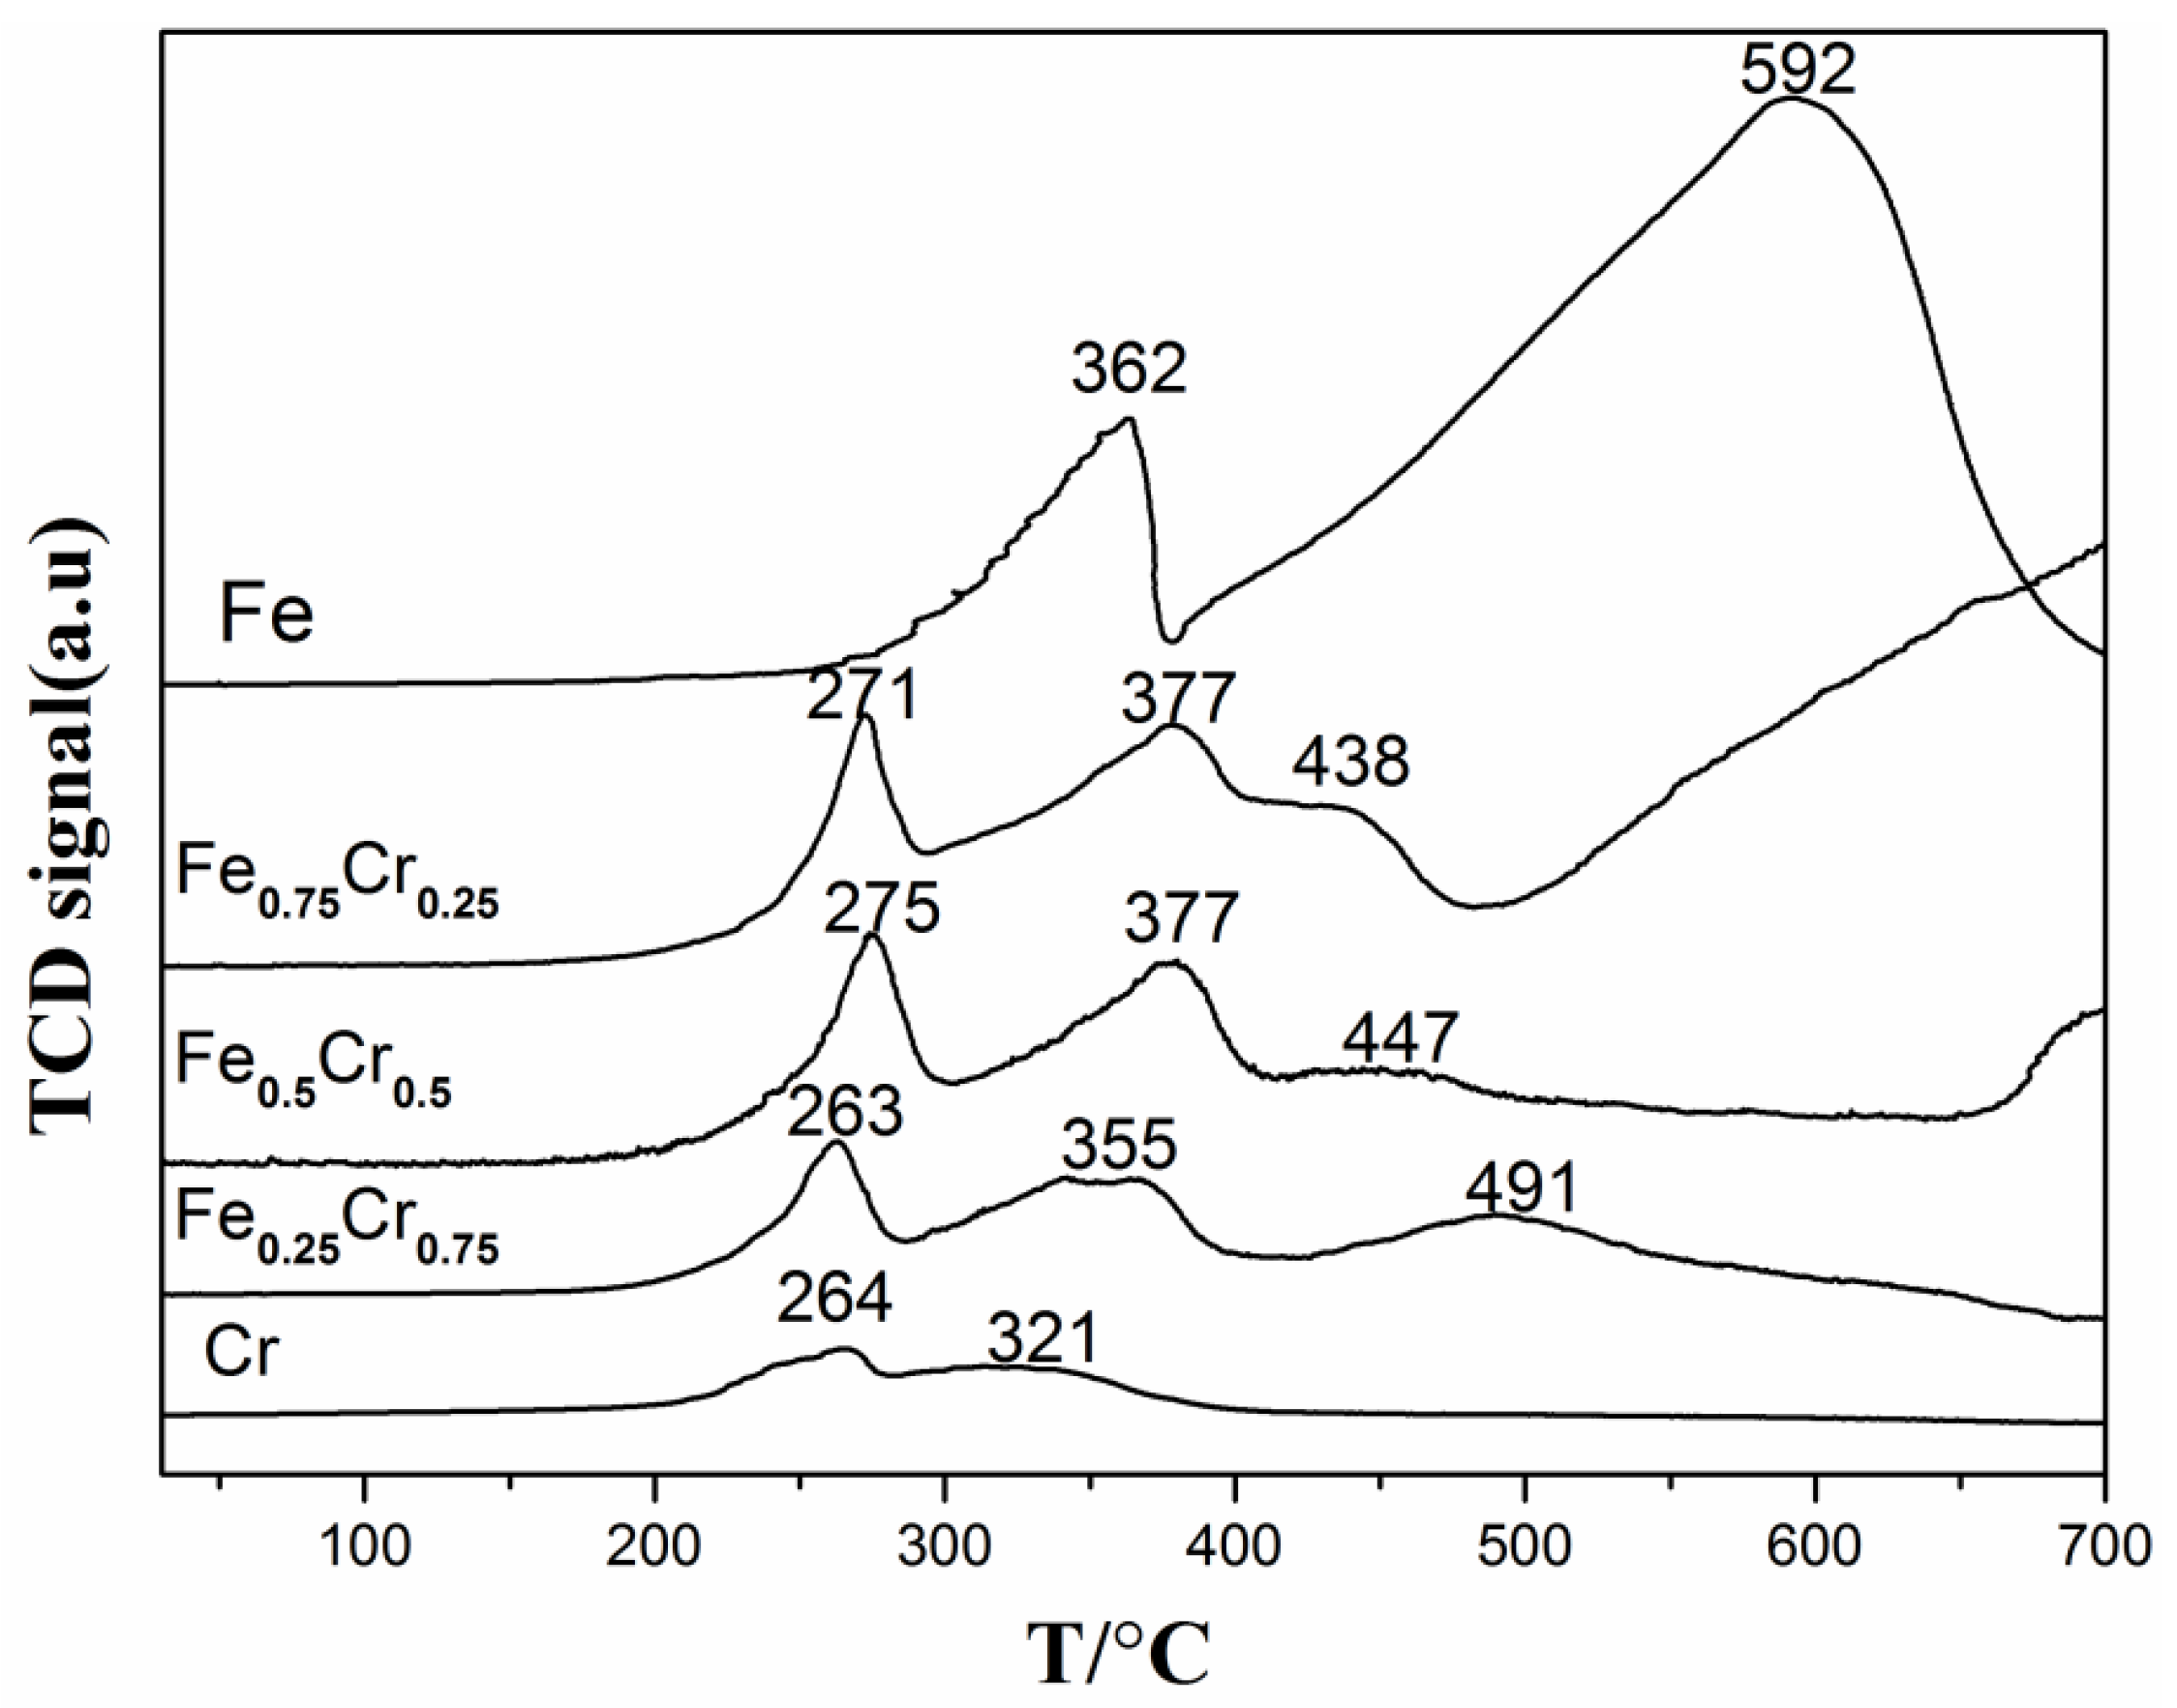
| Sample | TR (°C) a | T50 (°C) b | H2 Consumption (μmol/g) c |
|---|---|---|---|
| Fe | 362, 592 | 532 | 21,328 |
| Fe0.75Cr0.25 | 271, 377, 438 | 490 | 7498 |
| Fe0.5Cr0.5 | 275, 377, 447 | 513 | 6552 |
| Fe0.25Cr0.75 | 263, 355, 491 | 520 | 4241 |
| Cr | 264, 321 | 608 | 1563 |
Disclaimer/Publisher’s Note: The statements, opinions and data contained in all publications are solely those of the individual author(s) and contributor(s) and not of MDPI and/or the editor(s). MDPI and/or the editor(s) disclaim responsibility for any injury to people or property resulting from any ideas, methods, instructions or products referred to in the content. |
© 2023 by the authors. Licensee MDPI, Basel, Switzerland. This article is an open access article distributed under the terms and conditions of the Creative Commons Attribution (CC BY) license (https://creativecommons.org/licenses/by/4.0/).
Share and Cite
Du, M.; Guo, L.; Ren, H.; Tao, X.; Li, Y.; Nan, B.; Si, R.; Chen, C.; Li, L. Non-Noble FeCrOx Bimetallic Nanoparticles for Efficient NH3 Decomposition. Nanomaterials 2023, 13, 1280. https://doi.org/10.3390/nano13071280
Du M, Guo L, Ren H, Tao X, Li Y, Nan B, Si R, Chen C, Li L. Non-Noble FeCrOx Bimetallic Nanoparticles for Efficient NH3 Decomposition. Nanomaterials. 2023; 13(7):1280. https://doi.org/10.3390/nano13071280
Chicago/Turabian StyleDu, Meng, Lingling Guo, Hongju Ren, Xin Tao, Yunan Li, Bing Nan, Rui Si, Chongqi Chen, and Lina Li. 2023. "Non-Noble FeCrOx Bimetallic Nanoparticles for Efficient NH3 Decomposition" Nanomaterials 13, no. 7: 1280. https://doi.org/10.3390/nano13071280