
One-Pot Synthesis of Silica-Coated Gold Nanostructures Loaded with Cyanine 5.5 for Cell Imaging by SERS Spectroscopy †
 , , and
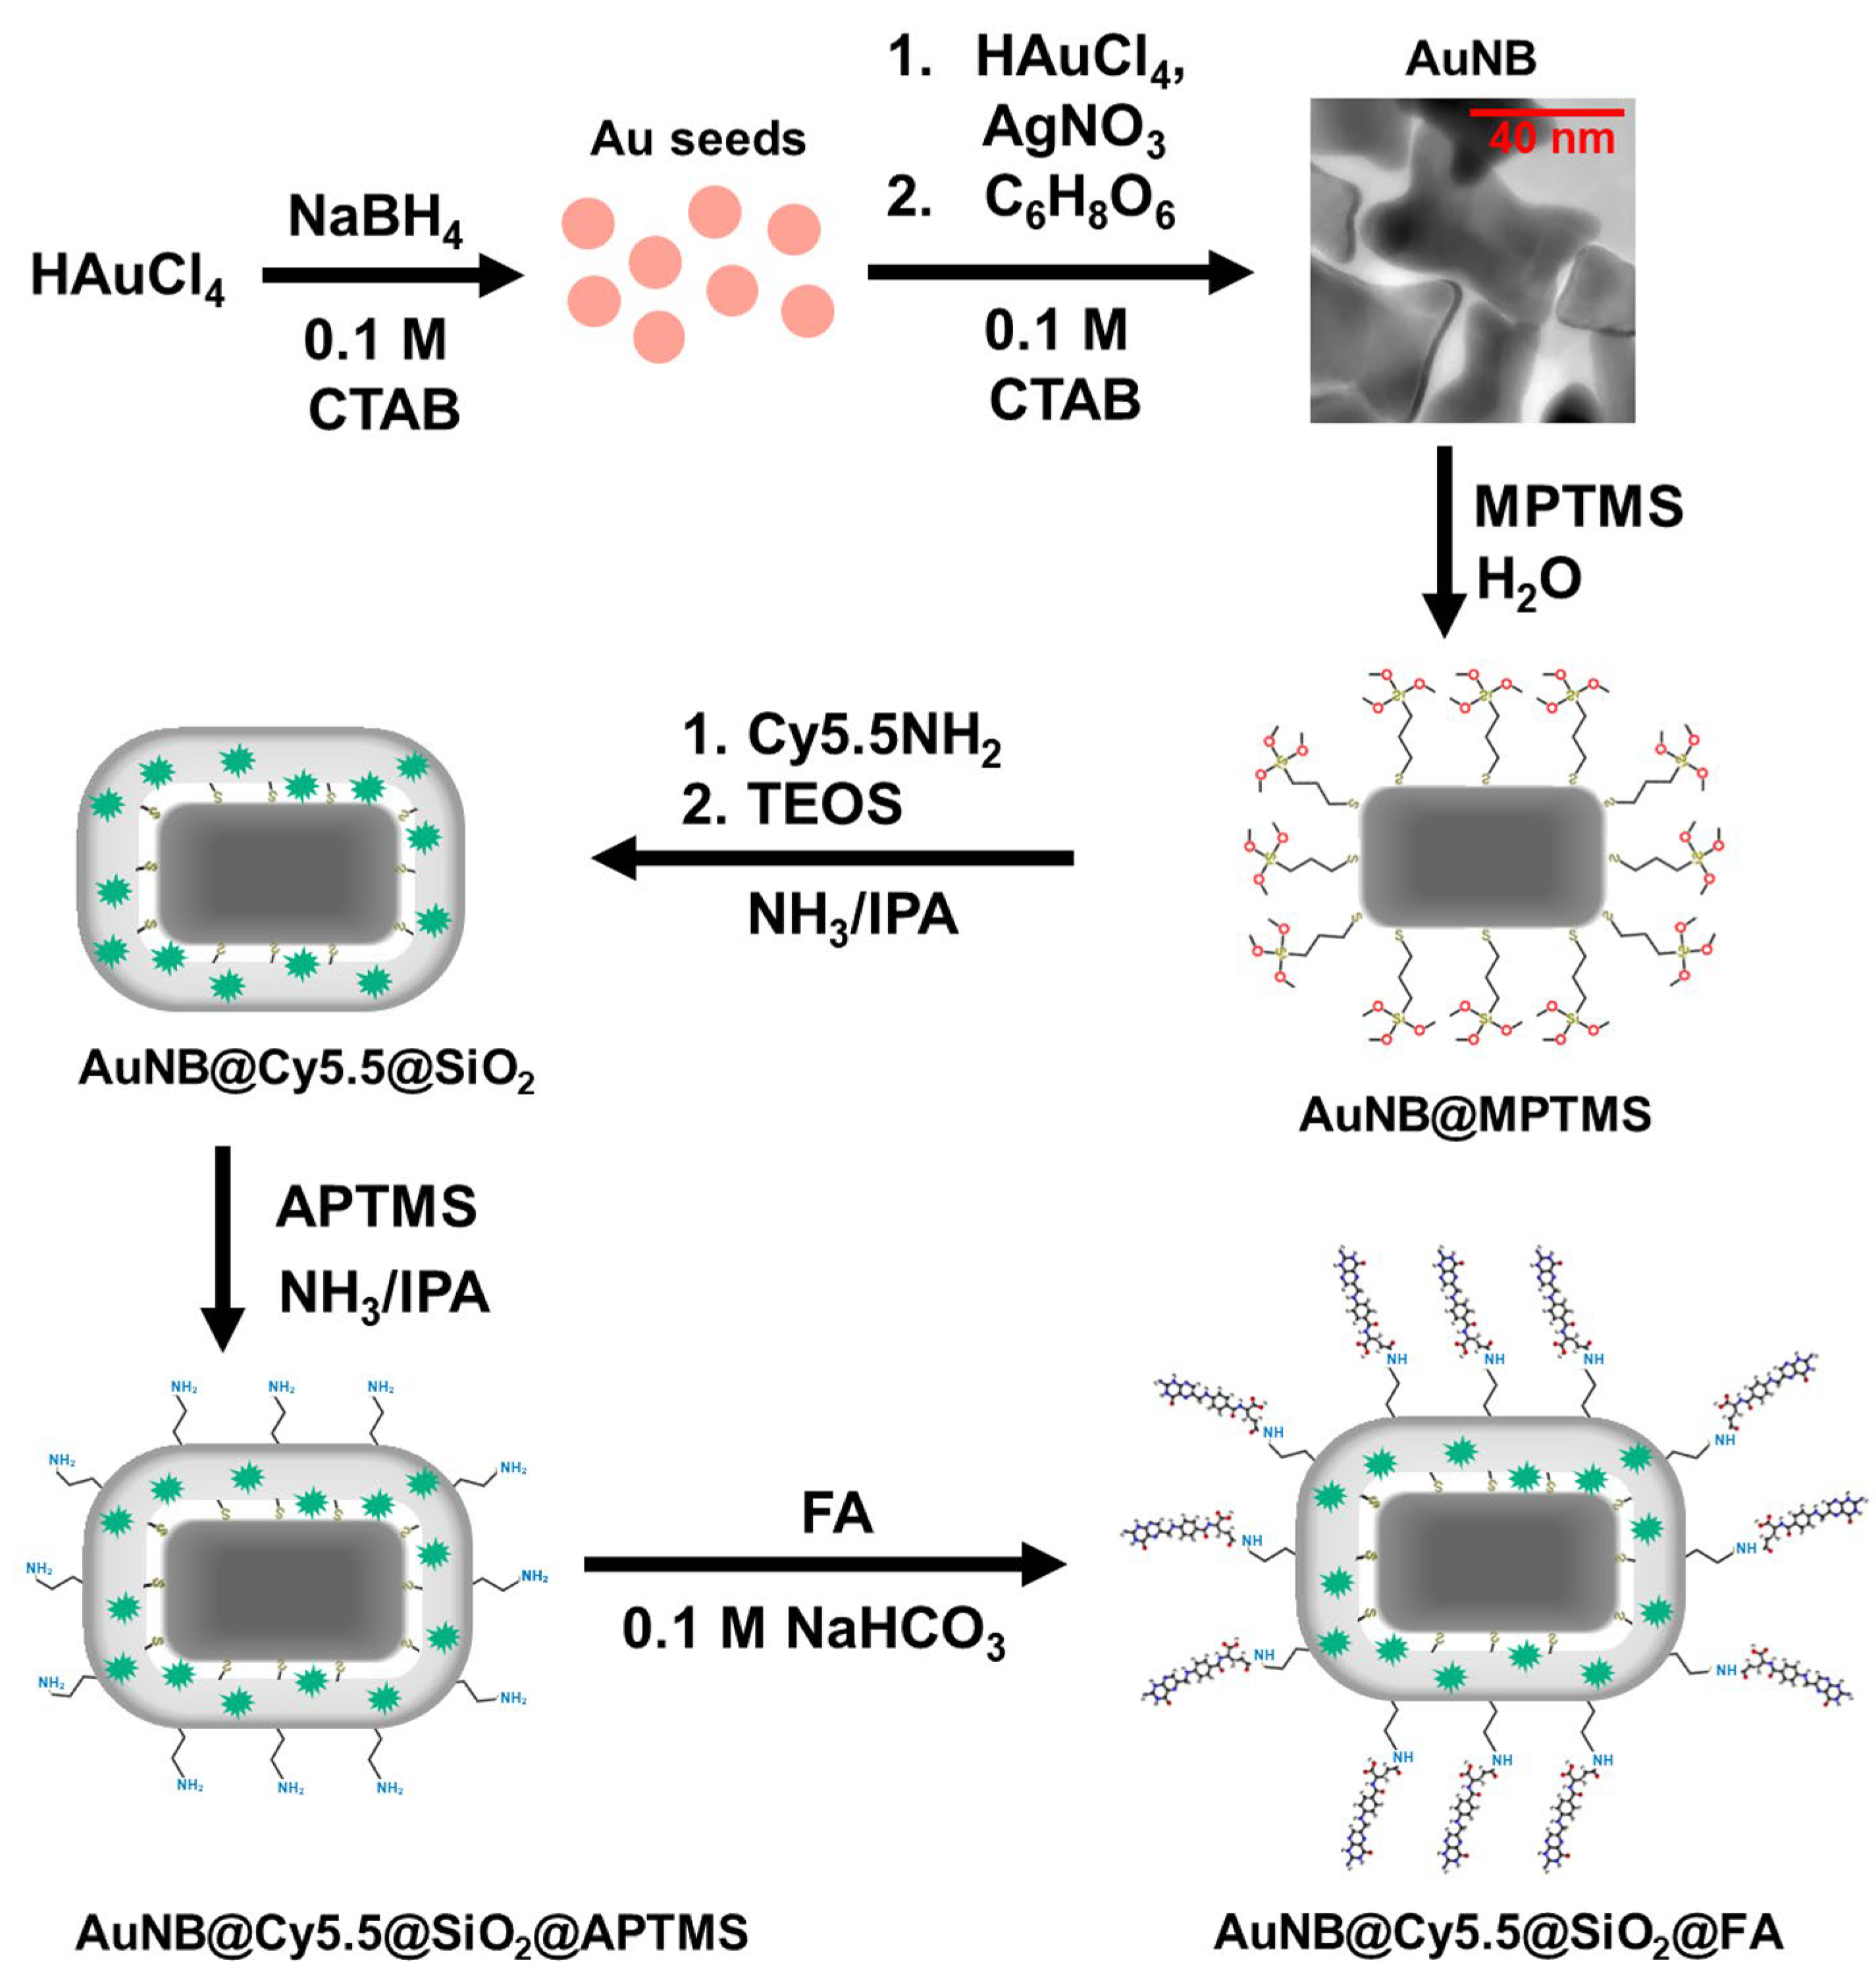
Abstract
:1. Introduction
2. Materials and Methods
2.1. Chemicals
2.2. Preparation of [email protected]@SiO2@FA Nanotags
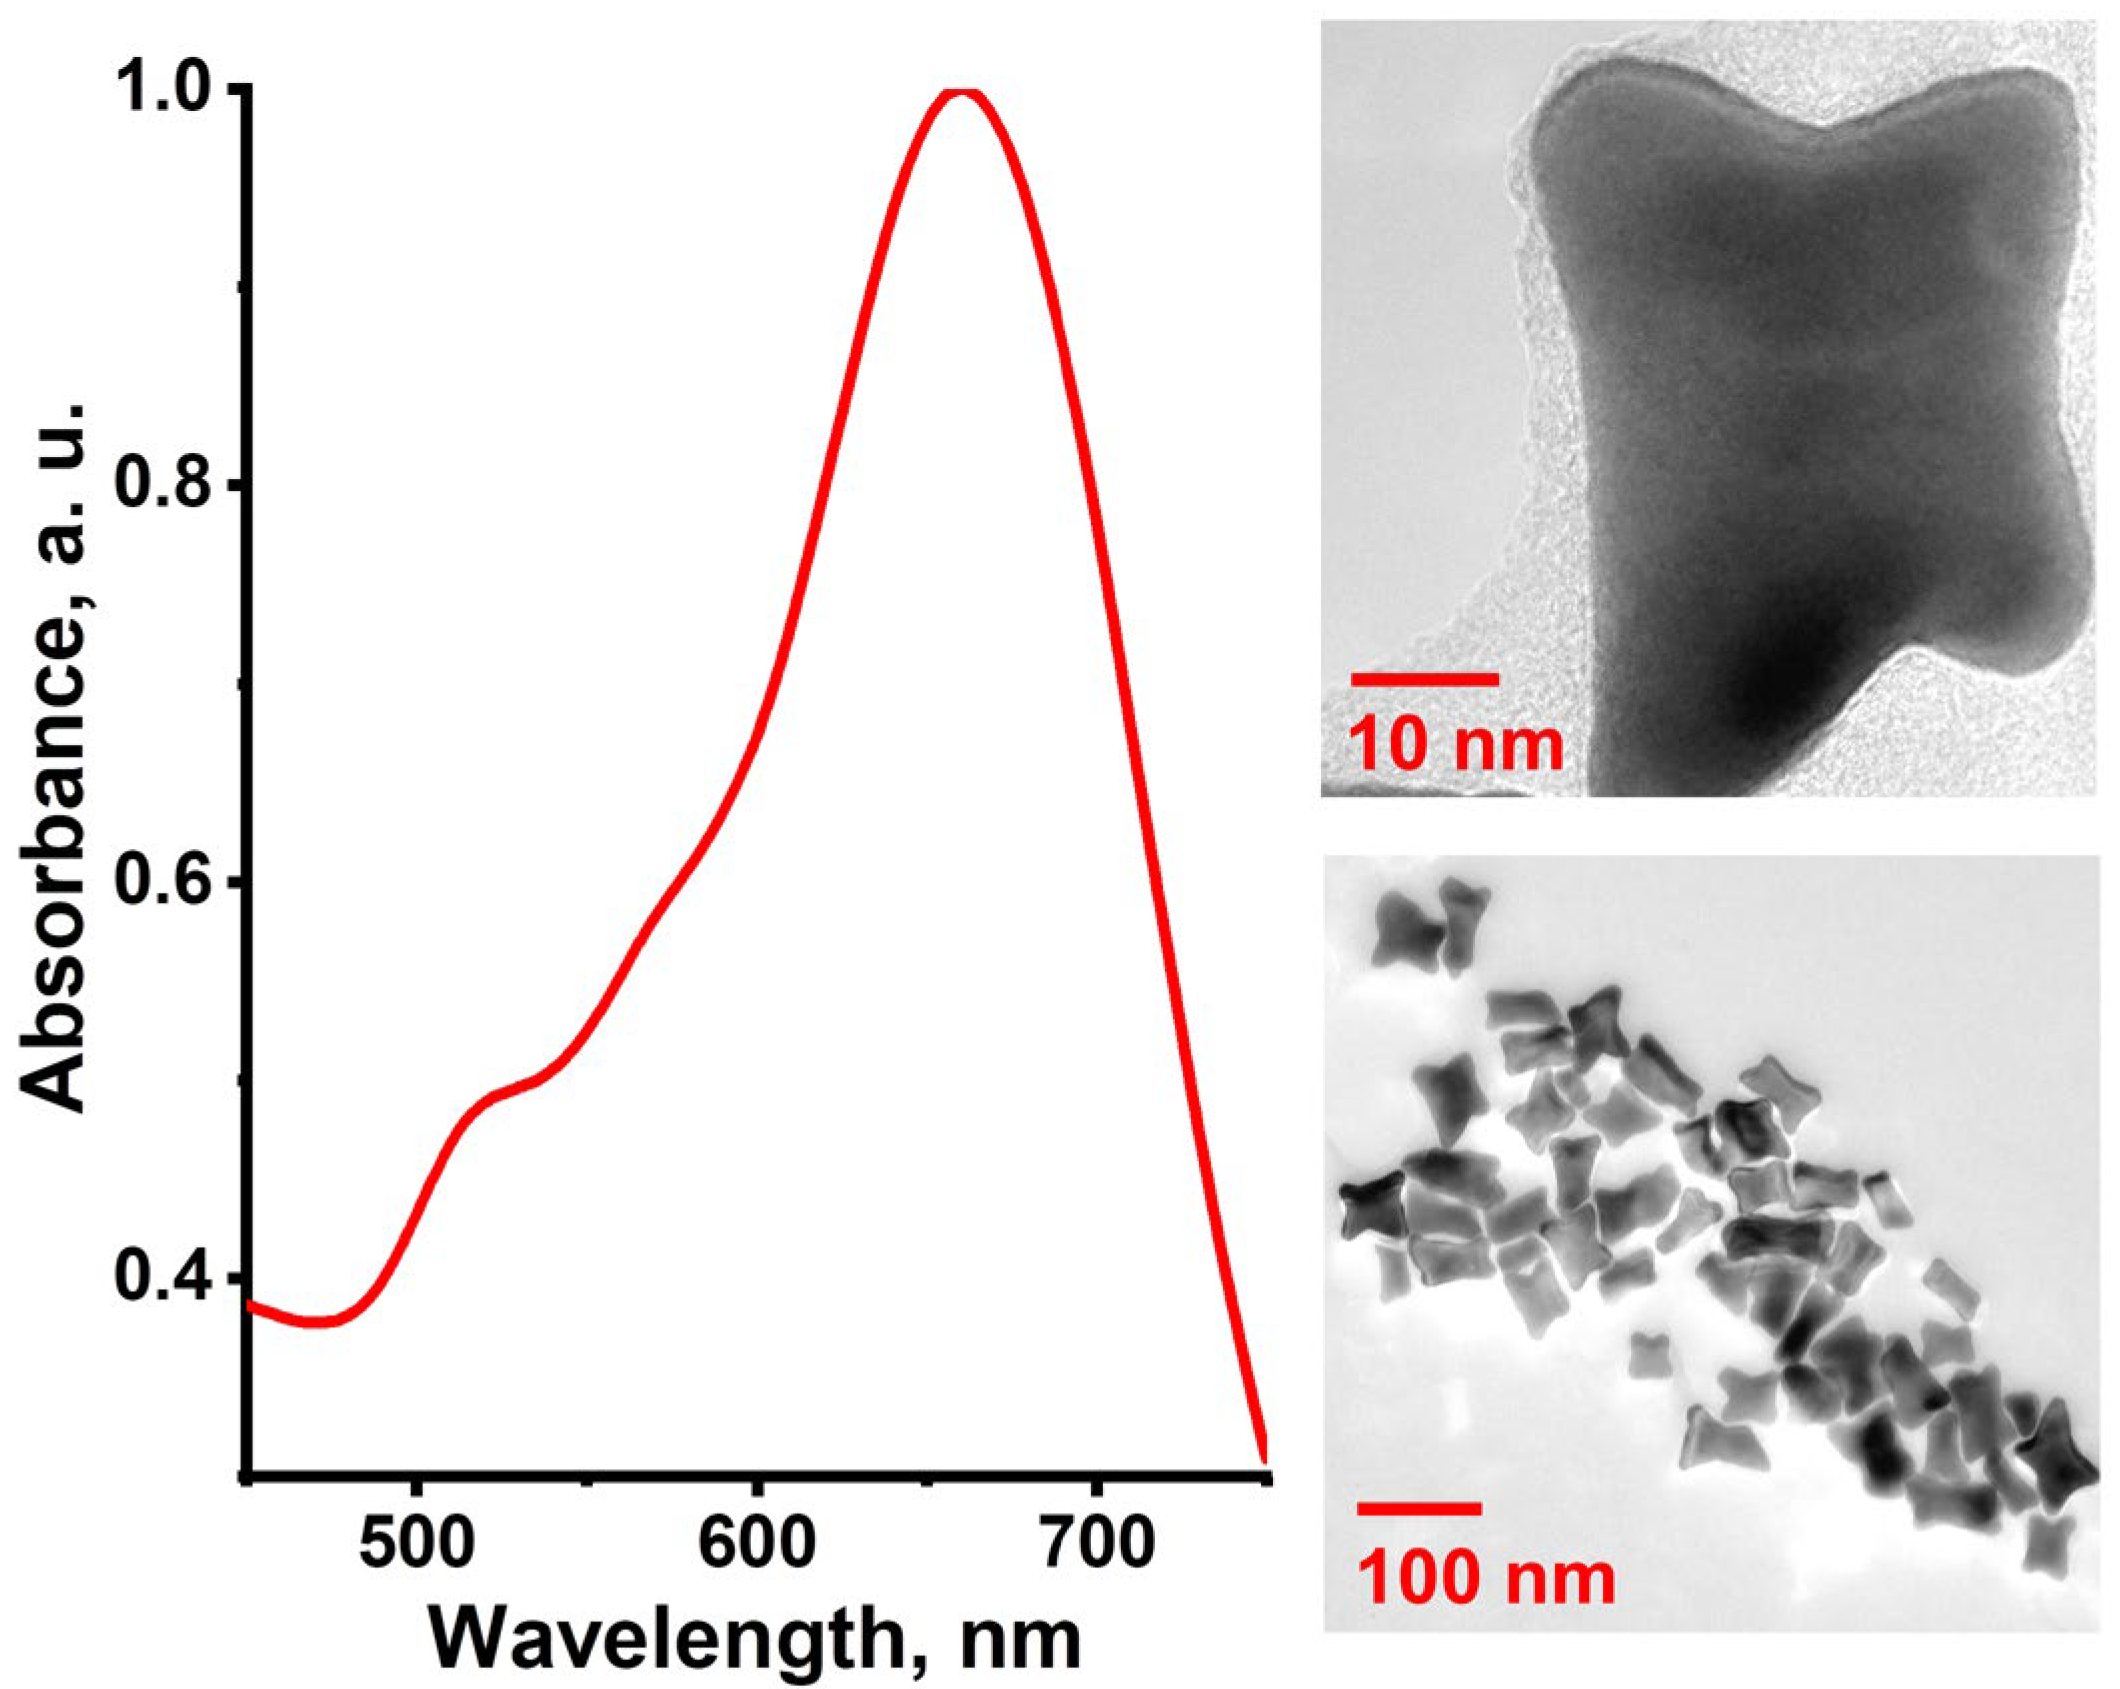
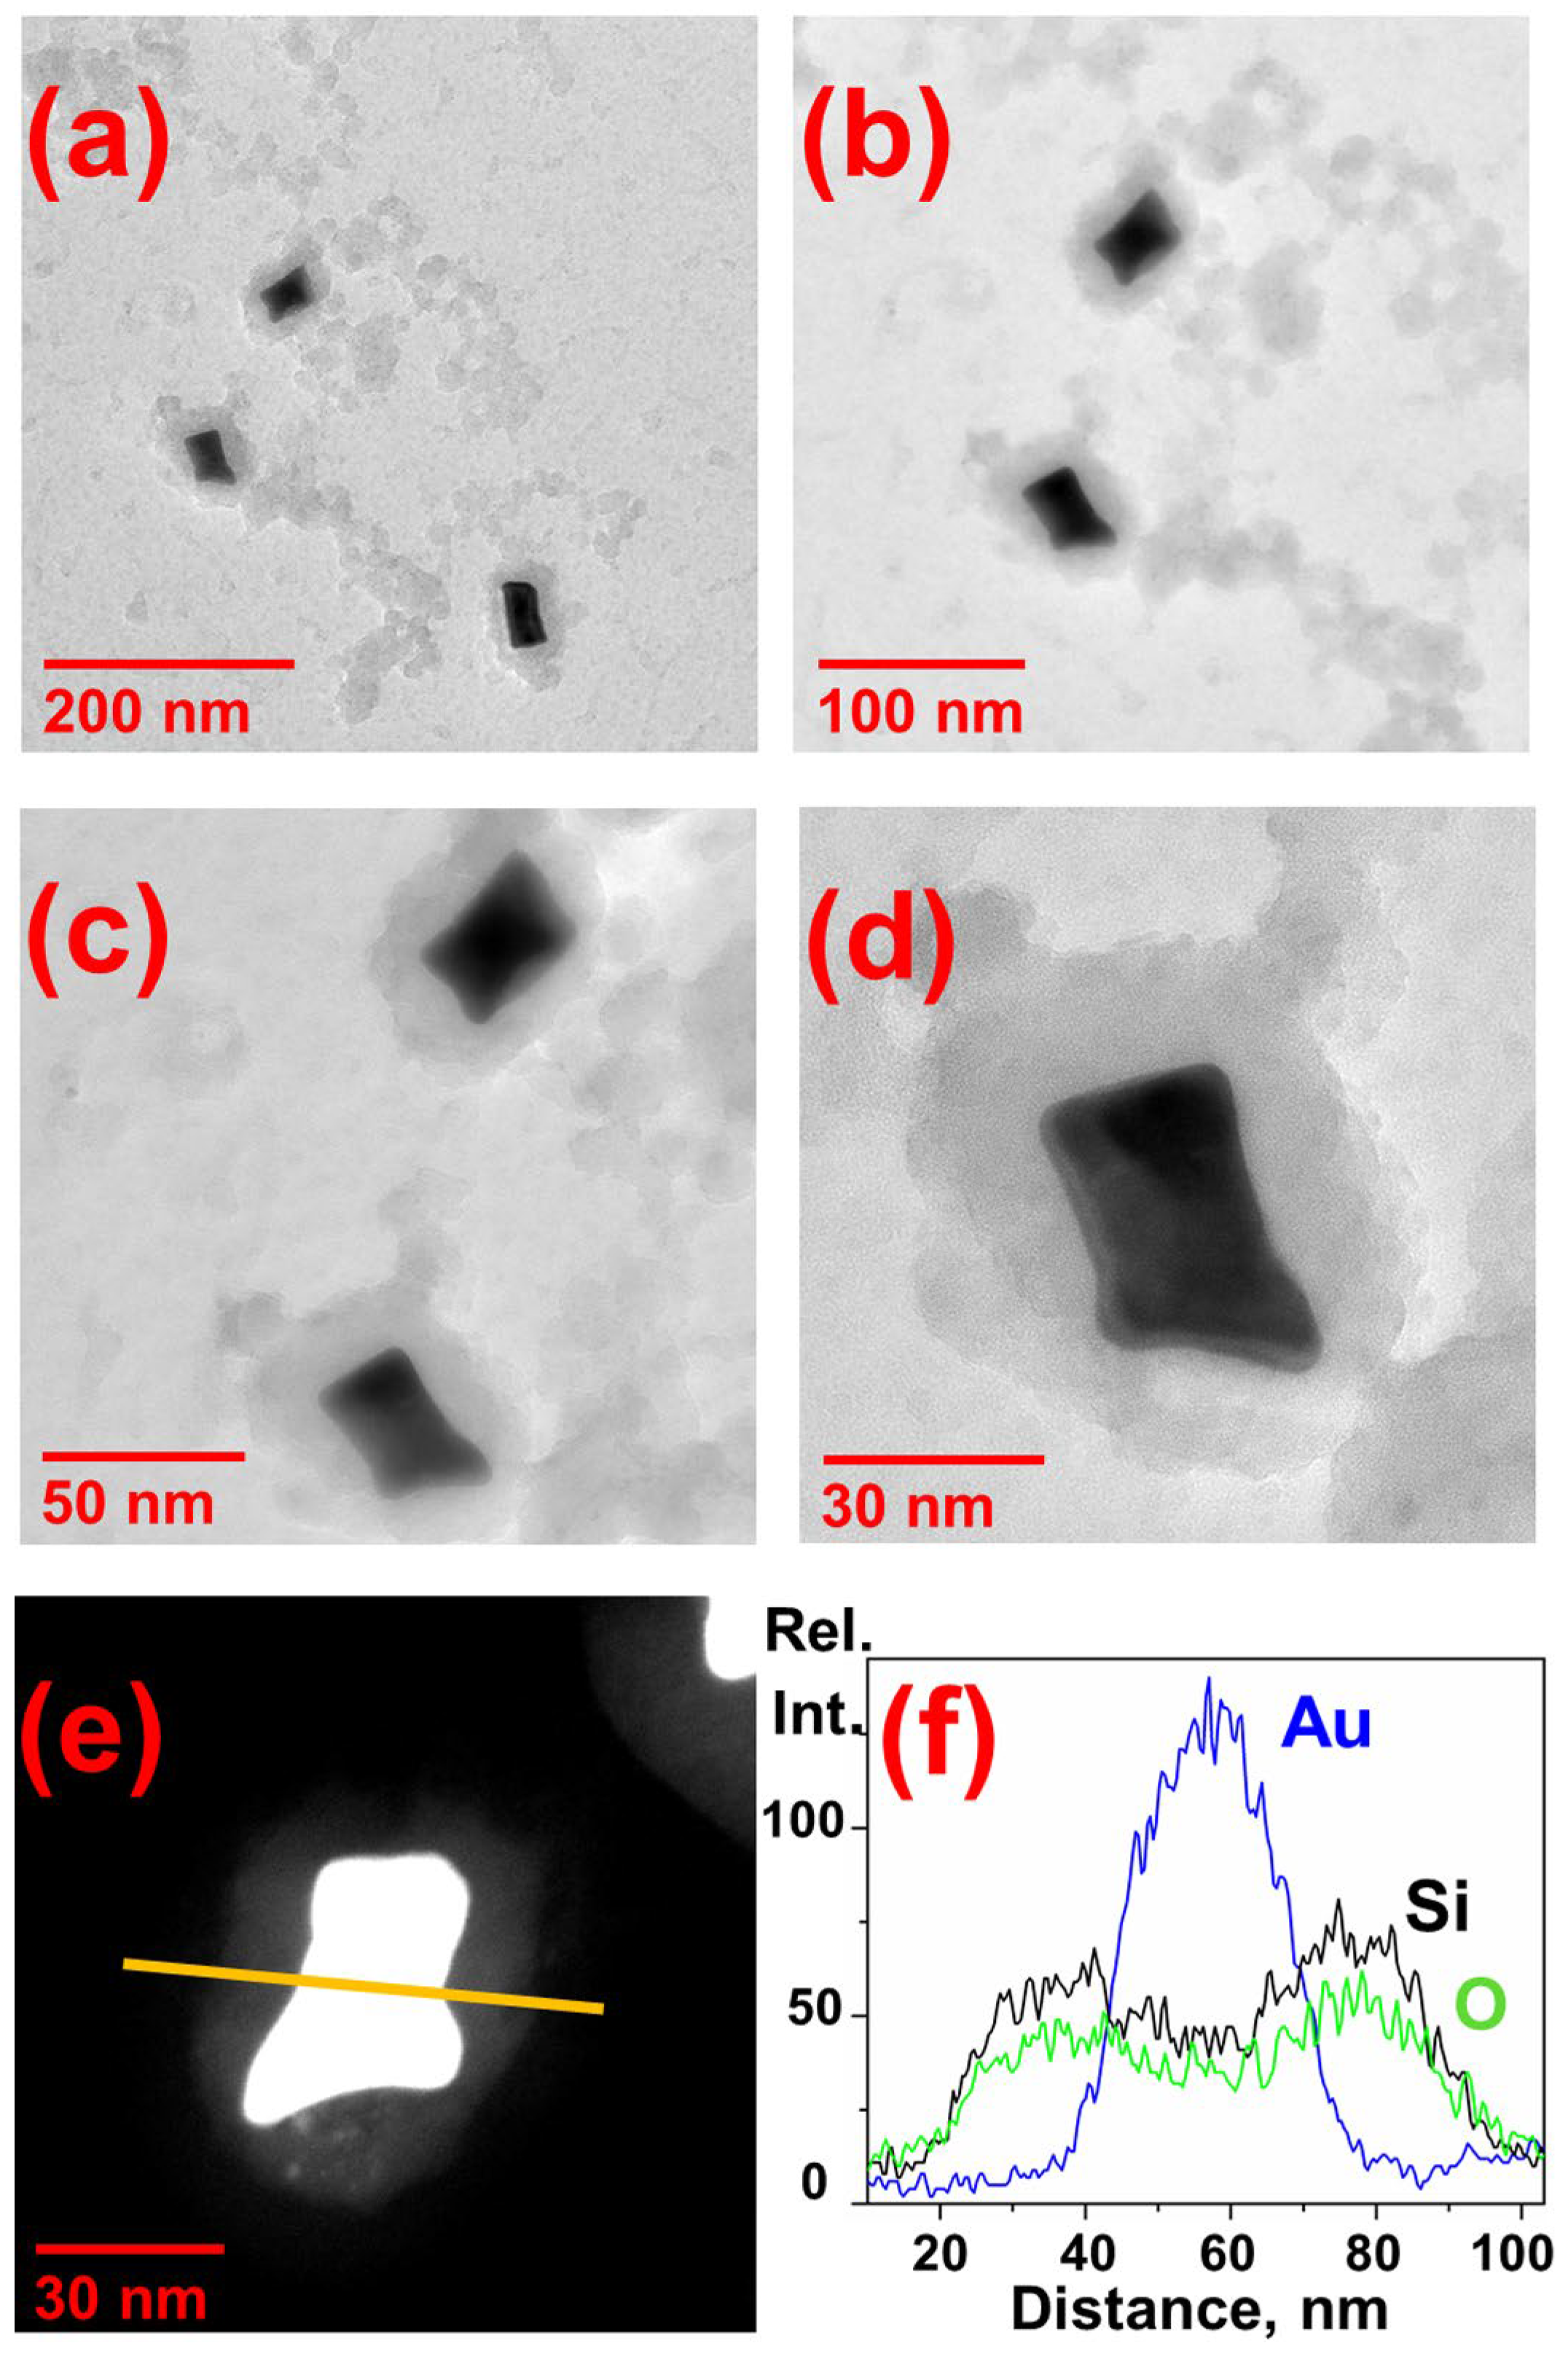
2.3. UV-Vis Absorption Spectroscopy and Transmission Electron Microscopy and Energy Dispersive X-ray Analysis
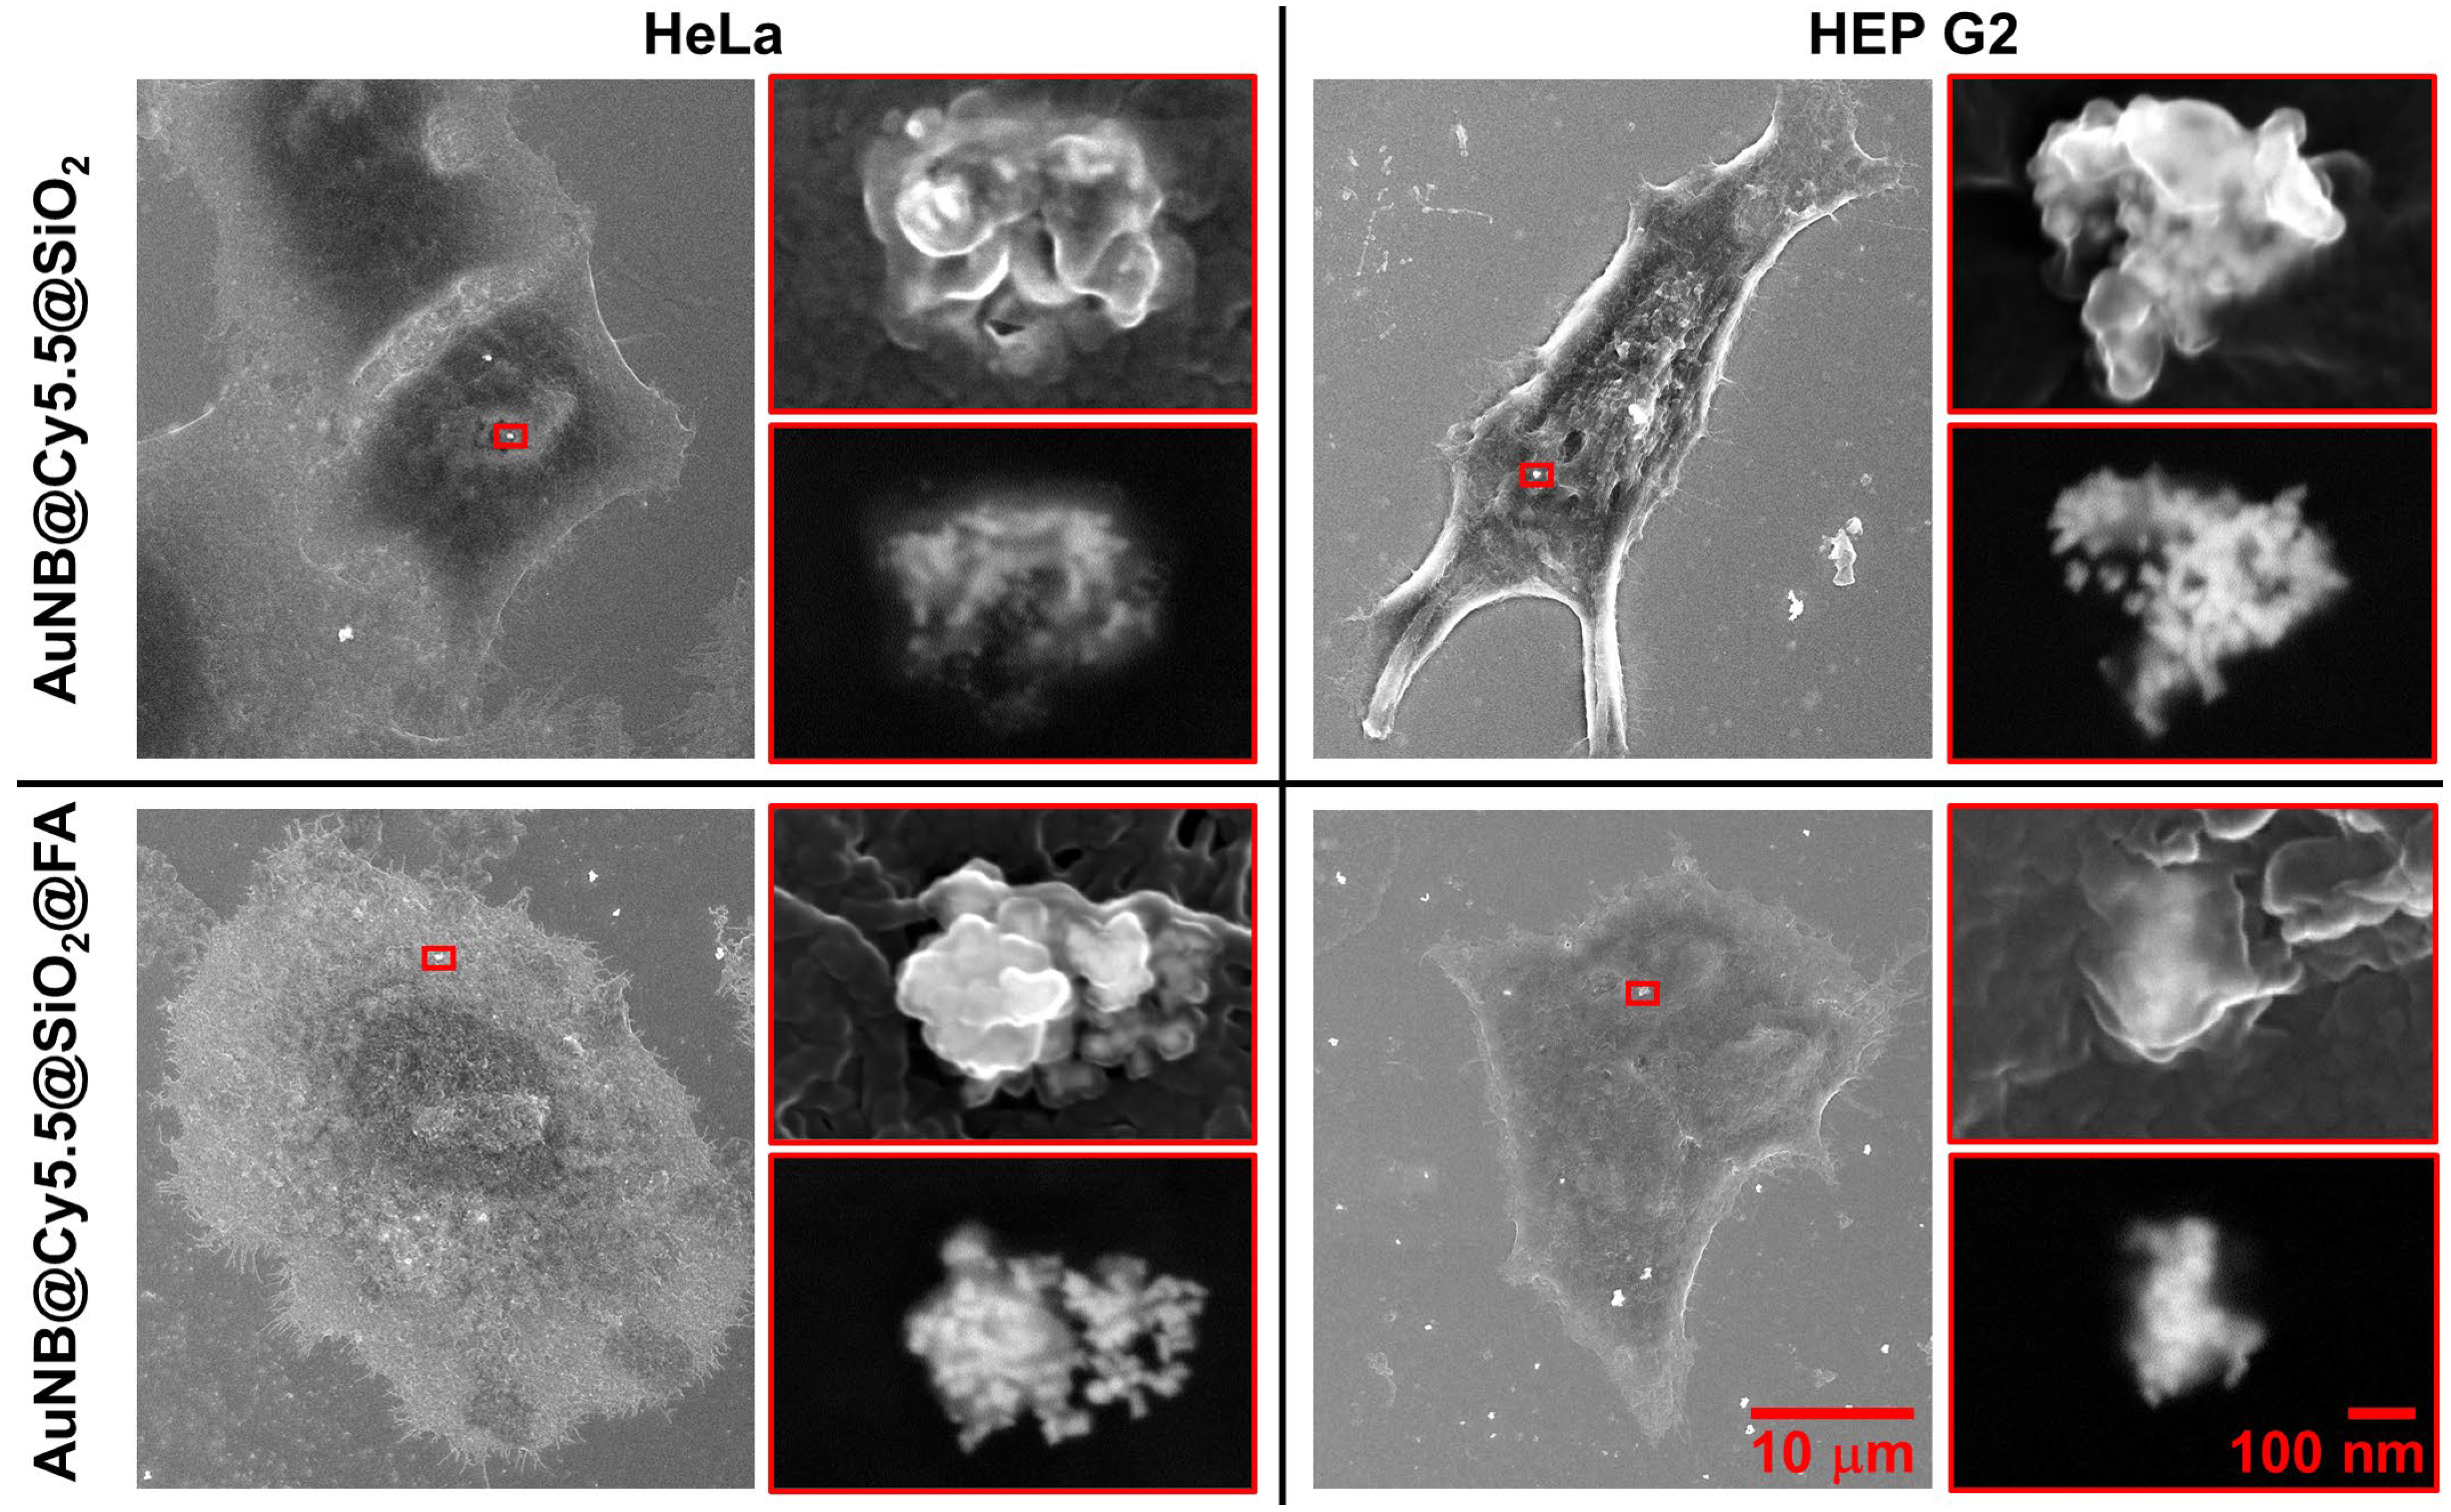
2.4. Scanning Electron Microscopy of Cell Samples
2.5. Surface-Enhanced Raman Spectroscopy of Colloids and Cell Samples
2.6. Cell Viability Assay
3. Results and Discussion
3.1. Morphology and Localized Surface Plasmon Resonance of [email protected]@SiO2@FA Nanotags
3.2. Study of Nanotag Intracellular Localization by Scanning Electron Microscopy
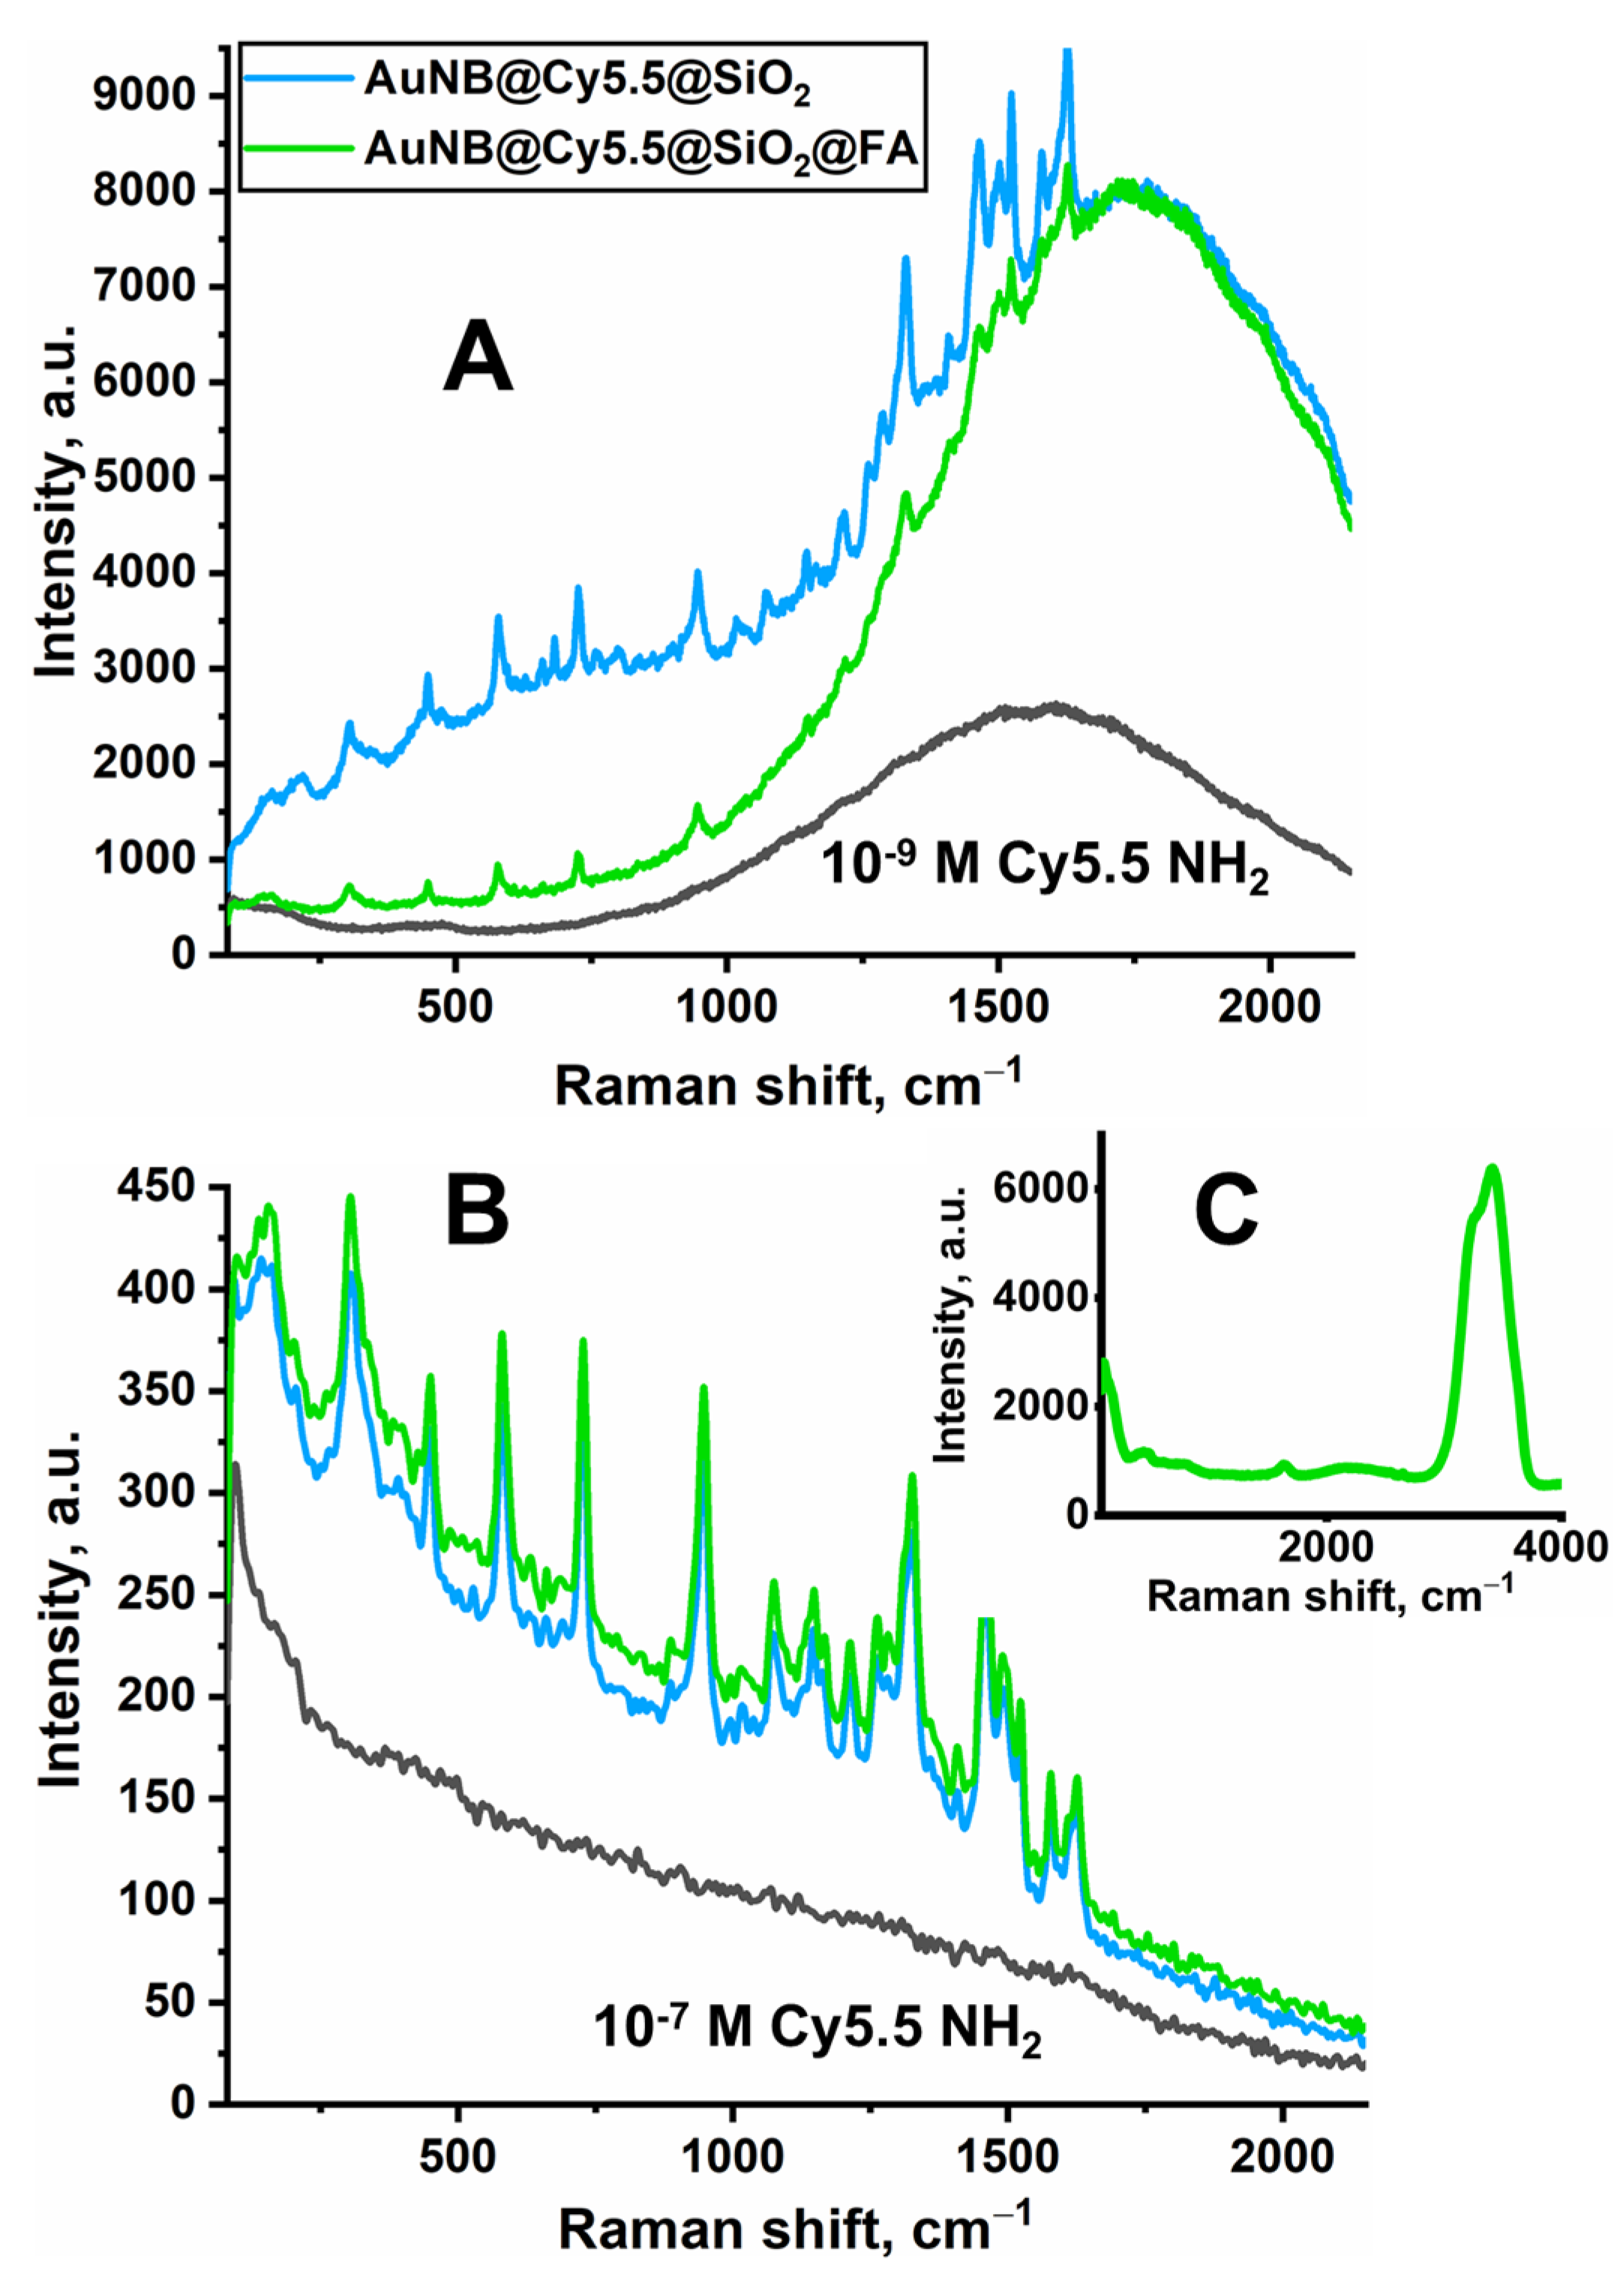
3.3. Nanotag SERS Response in the Solution Phase
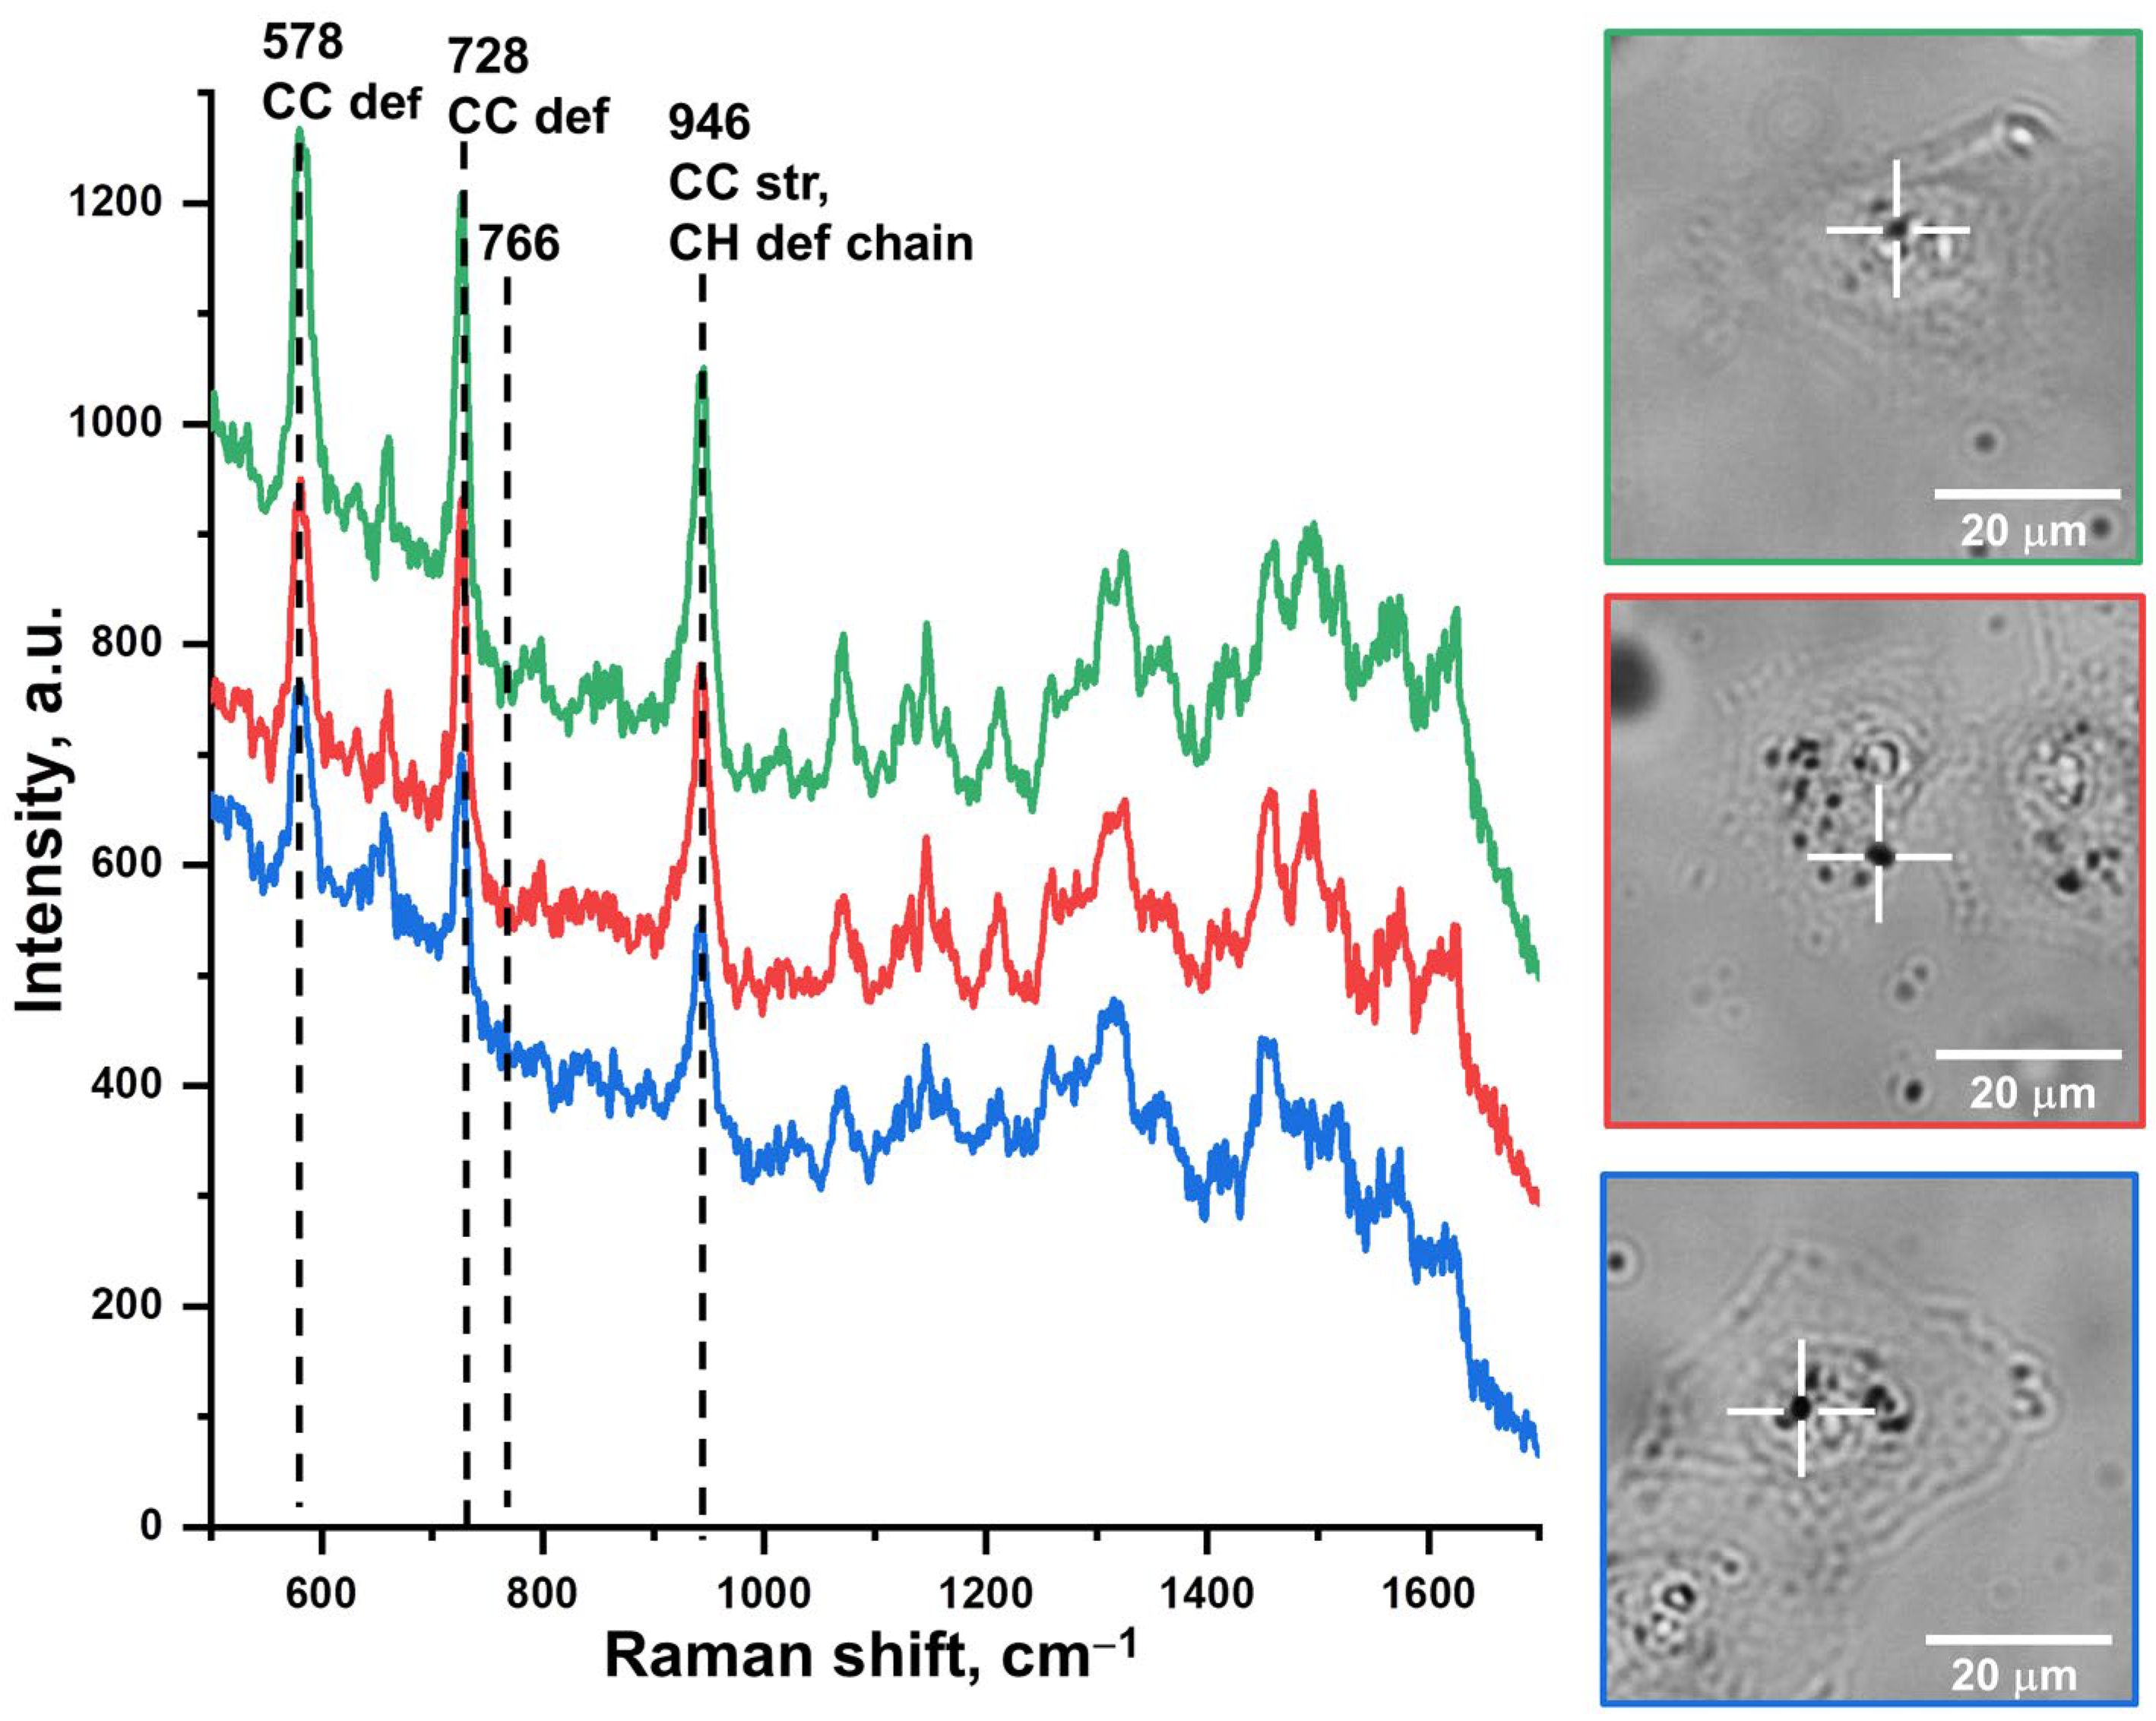
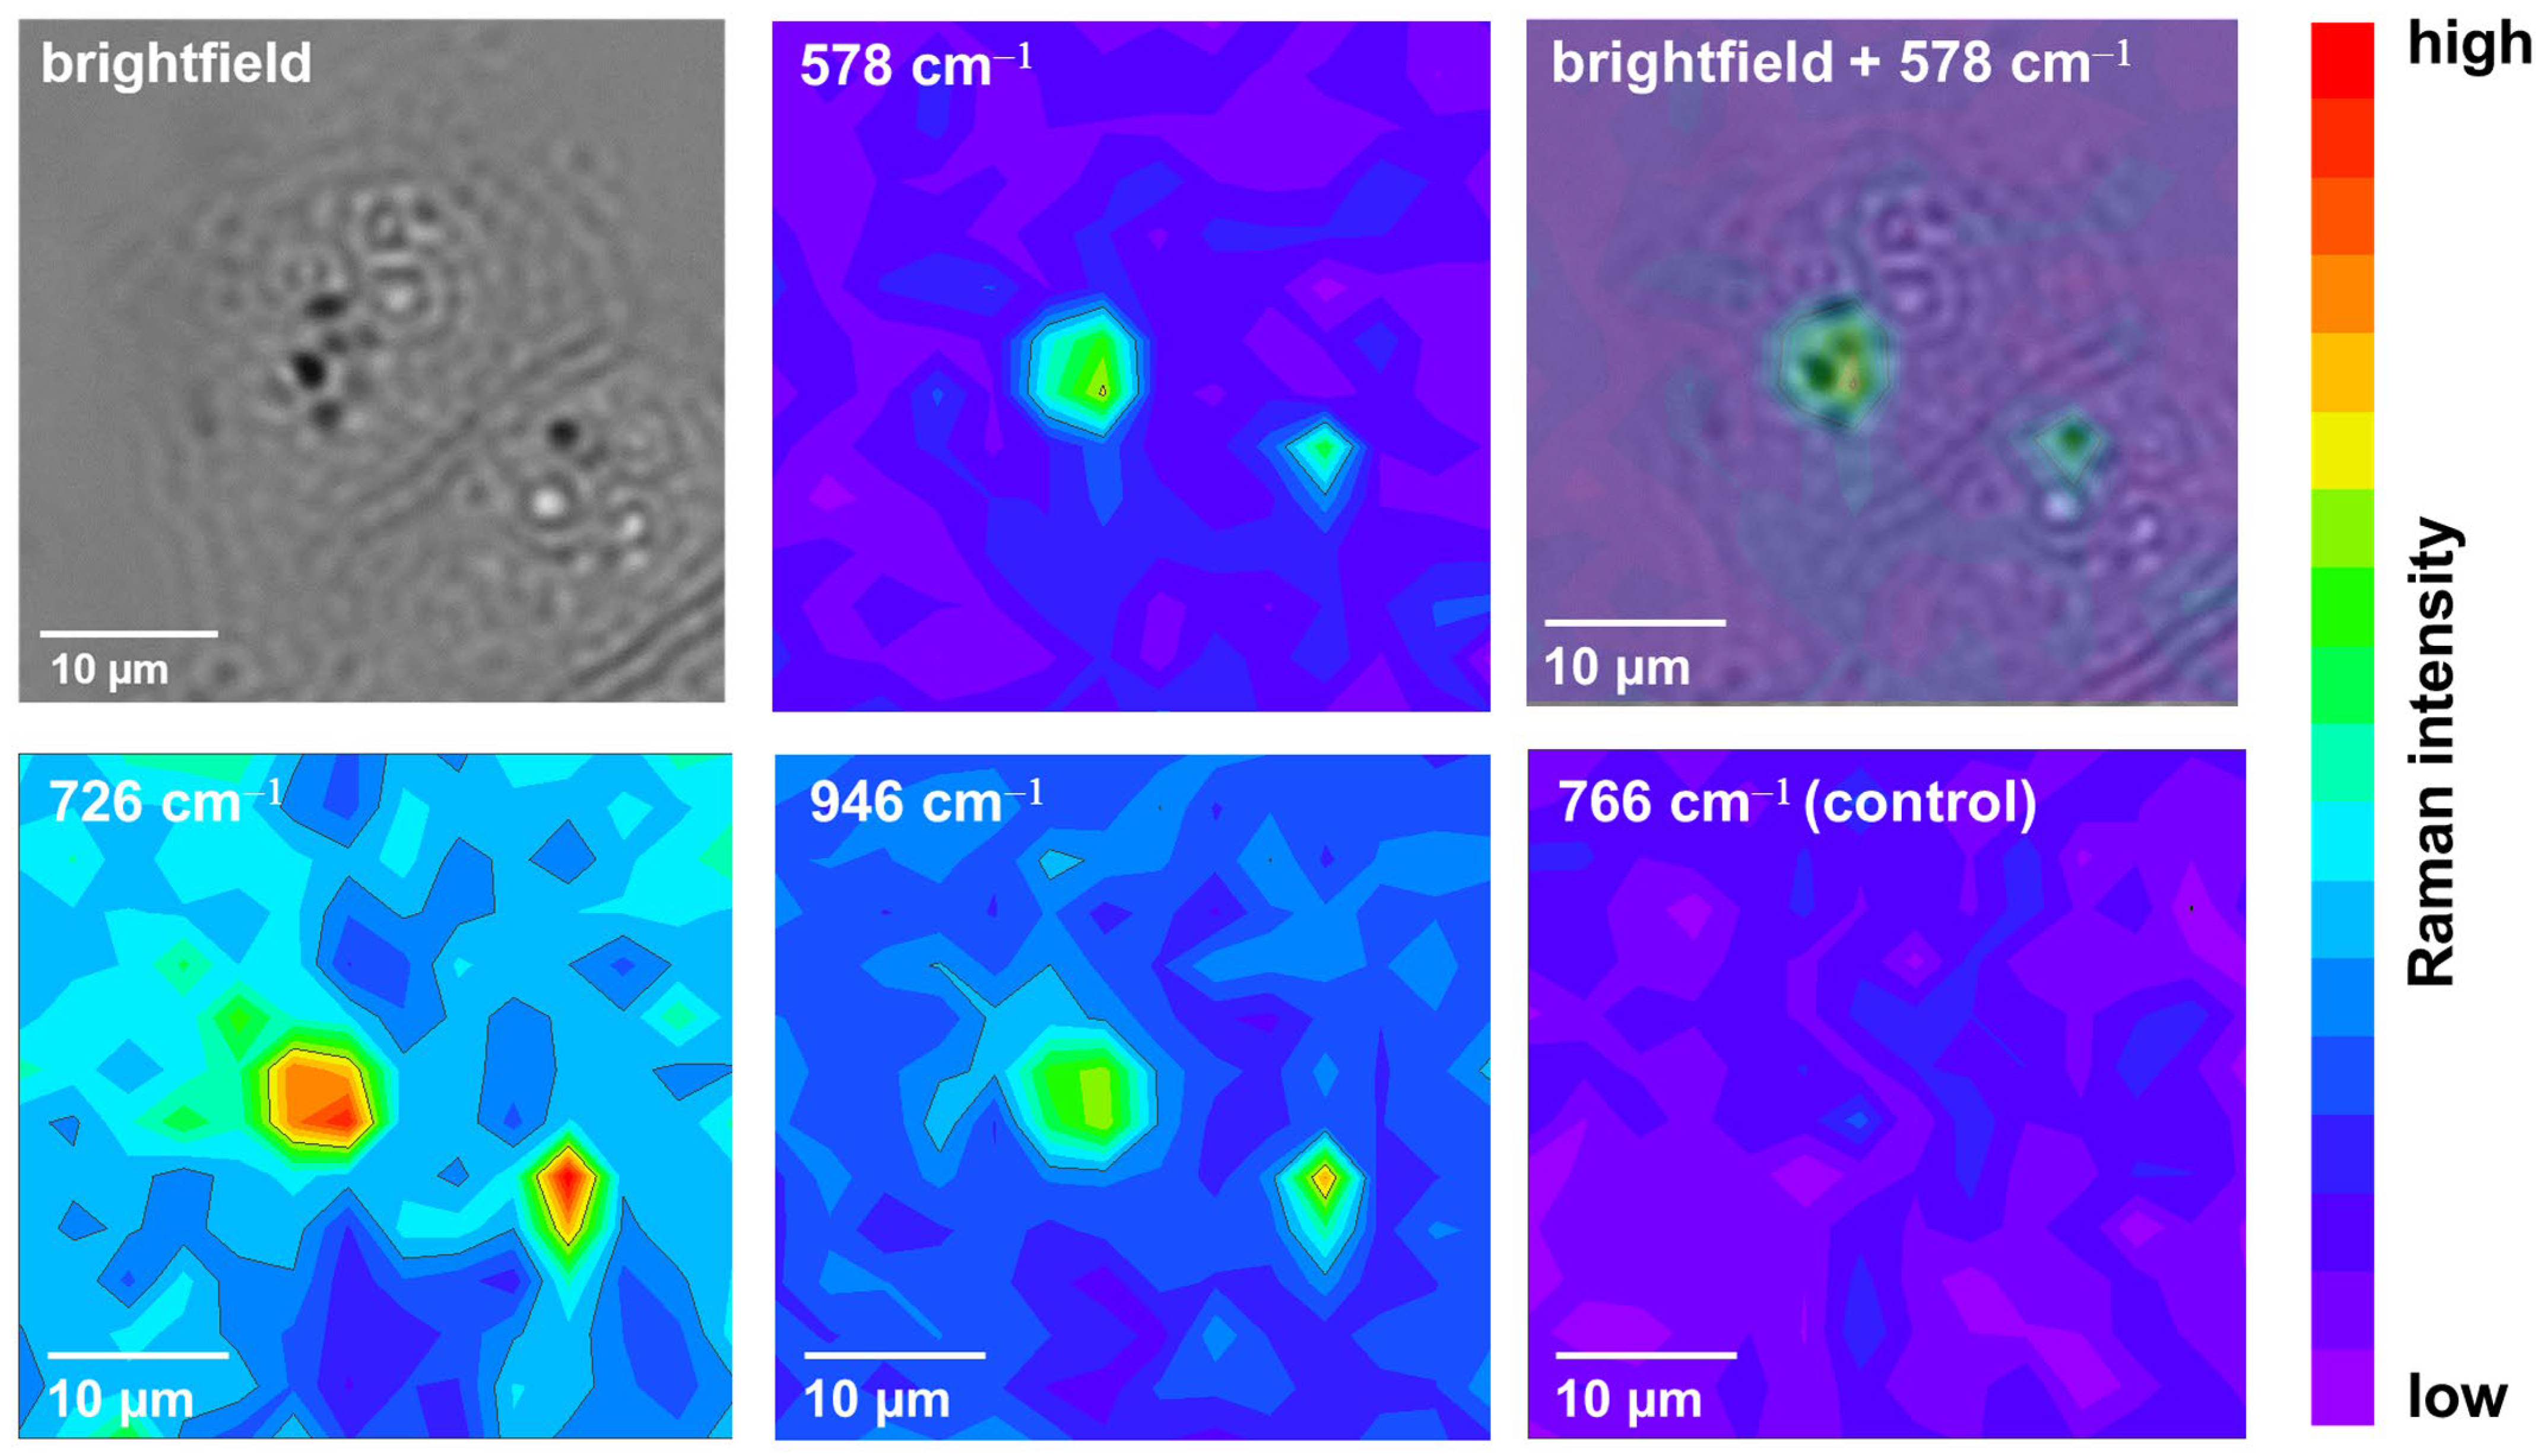
3.4. Study of Nanotag Cell Imaging Performance by Surface-Enhanced Raman Spectroscopy
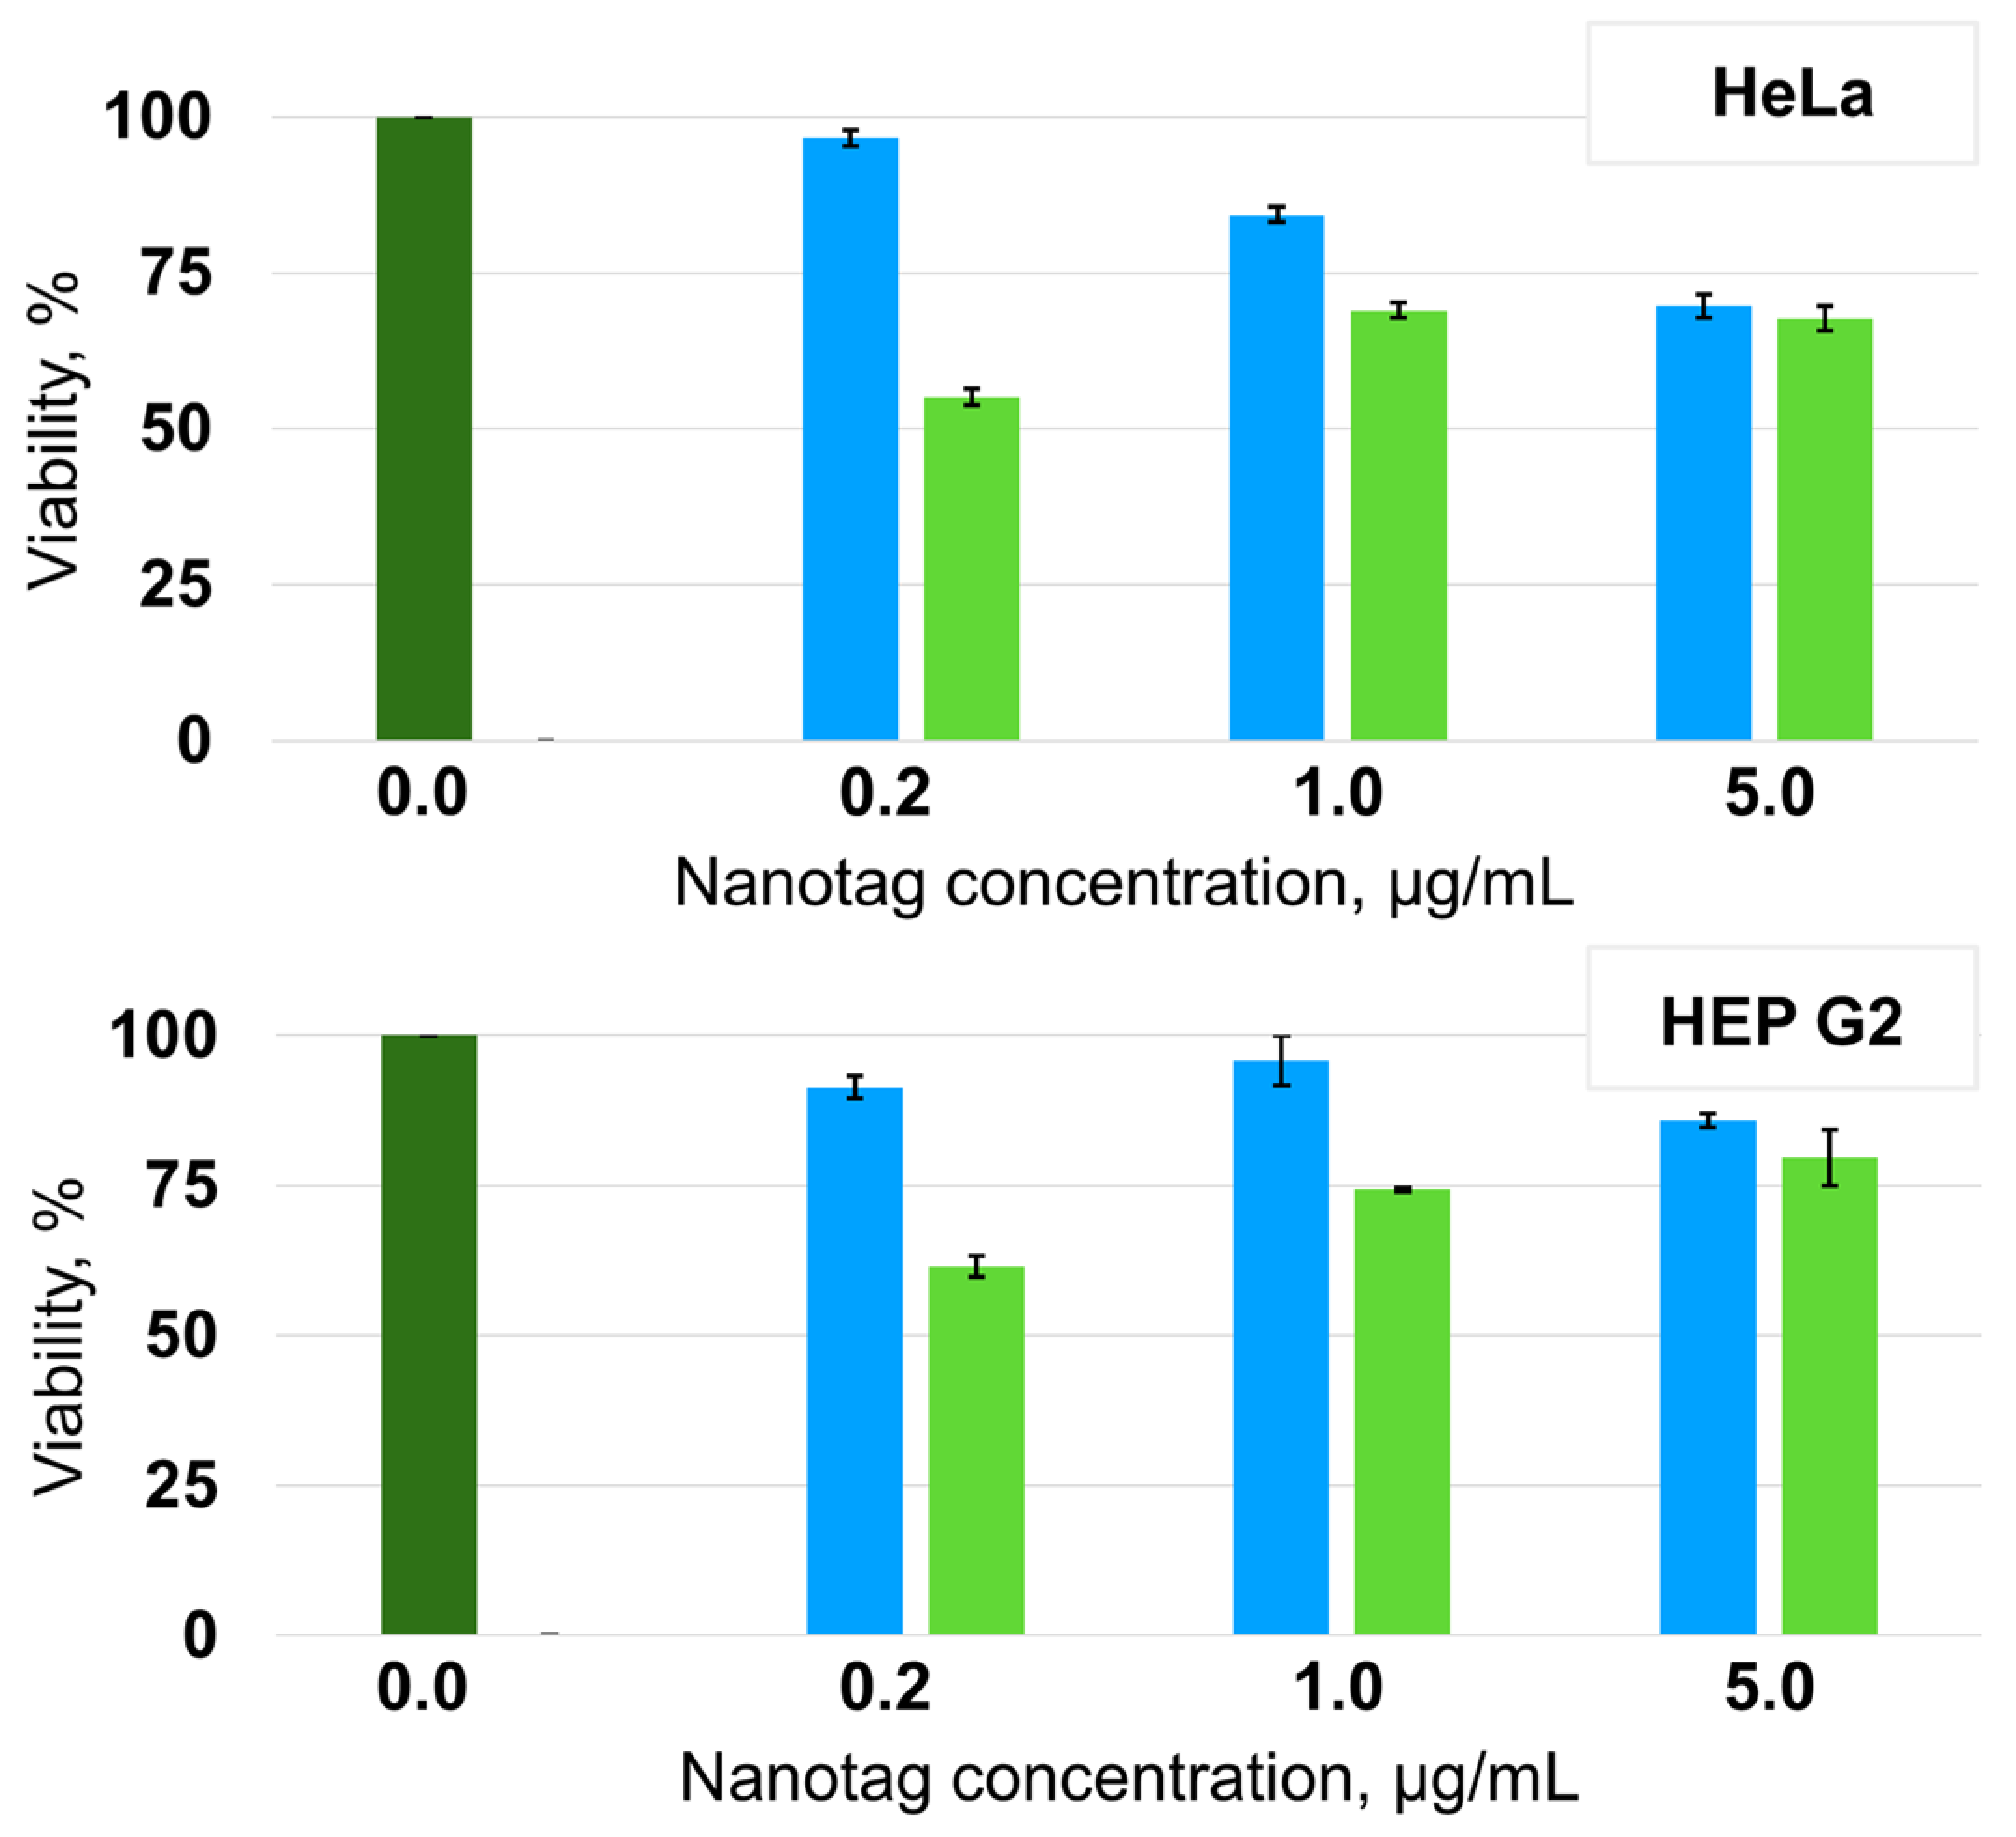
3.5. Study of Nanotag Cytotoxity by Mitochondrial Reductase Activity Assay
4. Conclusions
Author Contributions
Funding
Data Availability Statement
Acknowledgments
Conflicts of Interest
References
- Tahir, M.A.; Dina, N.E.; Cheng, H.; Valev, V.K.; Zhang, L. Surface-enhanced Raman spectroscopy for bioanalysis and diagnosis. Nanoscale 2021, 13, 11593–11634. [Google Scholar] [CrossRef] [PubMed]
- Meir, R.; Motiei, M.; Popovtzer, R. Gold nanoparticles for in vivo cell tracking. Nanomedicine 2014, 9, 2059–2069. [Google Scholar] [CrossRef] [PubMed] [Green Version]
- Xu, Y.; Wang, H.; Zhang, M.; Zhang, J.; Yan, W. Plasmon-enhanced antibacterial activity of chiral gold nanoparticles and in vivo therapeutic effect. Nanomaterials 2021, 11, 1621. [Google Scholar] [CrossRef] [PubMed]
- Bian, Y.; Liu, S.; Zhang, Y.; Liu, Y.; Yang, X.; Lou, S.; Wu, E.; Wu, B.; Zhang, X.; Jin, Q. Distance-Dependent Plasmon-Enhanced Fluorescence of Submonolayer Rhodamine 6G by Gold Nanoparticles. Nanoscale Res. Lett. 2021, 16, 1–7. [Google Scholar] [CrossRef]
- Ahamad, N.; Al-Amin, M.D.; Ianoul, A. Distance dependent surface enhanced Raman and fluorescence by supported 2D assembly of plasmonic metal nanoparticles. Asian J. Chem. 2013, 25, 9226–9232. [Google Scholar] [CrossRef]
- Kennedy, B.J.; Spaeth, S.; Dickey, M.; Carron, K.T. Determination of the Distance Dependence and Experimental Effects for Modified SERS Substrates Based on Self-Assembled Monolayers Formed Using Alkanethiols. J. Phys. Chem. B 1999, 103, 3640–3646. [Google Scholar] [CrossRef]
- Le Ru, E.C.; Blackie, E.; Meyer, M.; Etchegoint, P.G. Surface Enhanced Raman Scattering Enhancement Factors: A Comprehensive Study. J. Phys. Chem. C 2007, 111, 13794–13803. [Google Scholar] [CrossRef]
- Maher, R.C.; Cohen, L.F.; Le Ru, E.C.; Etchegoin, P.G. On the experimental estimation of Surface Enhanced Raman Scattering (SERS) cross sections by vibrational pumping. J. Phys. Chem. B 2006, 110, 19469–19478. [Google Scholar] [CrossRef] [Green Version]
- Lee, J.M.; Kim, S.O. Enhancing Organic Solar Cells with Plasmonic Materials. ChemNanoMat. 2016, 2, 19–27. [Google Scholar] [CrossRef]
- Vines, J.B.; Yoon, J.-H.; Ryu, N.-E.; Lim, D.-J.; Park, H. Gold Nanoparticles for Photothermal Cancer Therapy. Front. Chem. 2019, 7, 167. [Google Scholar] [CrossRef] [Green Version]
- Gharatepe, A.; Salehi, R. Recent progress in theranostic applications of hybrid gold nanoparticles. Eur. J. Med. Chem. 2017, 138, 221–233. [Google Scholar] [CrossRef]
- Sanchis-Gual, R.; Coronado-Puchau, M.; Mallah, T.; Coronado, E. Hybrid nanostructures based on gold nanoparticles and functional coordination polymers: Chemistry, physics and applications in biomedicine, catalysis and magnetism. Coord. Chem. Rev. 2023, 480, 215025. [Google Scholar] [CrossRef]
- Maccora, D.; Dini, V.; Battocchio, C.; Fratoddi, I.; Cartoni, A.; Rotili, D.; Castagnola, M.; Faccini, R.; Bruno, I.; Scotognella, T.; et al. Gold nanoparticles and nanorods in nuclear medicine: A mini review. Appl. Sci. 2019, 9, 3232. [Google Scholar] [CrossRef] [Green Version]
- Mohajer, F.; Ziarani, G.M.; Badiei, A. New advances on Au–magnetic organic hybrid core–shells in MRI, CT imaging, and drug deliver. RSC Adv. 2021, 11, 6517–6525. [Google Scholar] [CrossRef]
- Arsalani, S.; Arsalani, S.; Isikawa, M.; Guidelli, E.J.; Mazon, E.E.; Ramos, A.P.; Bakuzis, A.; Pavan, T.Z.; Baffa, O.; Carneiro, A.A.O. Hybrid Nanoparticles of Citrate-Coated Manganese Ferrite and Gold Nanorods in Magneto-Optical Imaging and Thermal Therapy. Nanomaterials 2023, 13, 434. [Google Scholar] [CrossRef]
- Elmi, G.R.; Saleem, K.; Baig, M.M.F.A.; Aamir, M.N.; Wang, M.; Gao, X.; Abbas, M.; Rehman, M.U. Recent Advances of Magnetic Gold Hybrids and Nanocomposites, and Their Potential Biological Applications. Magnetochemistry 2022, 8, 38. [Google Scholar] [CrossRef]
- Li, X.; Zhang, Y.; Liu, G.K.; Luo, Z.; Zhou, L.; Xue, Y.; Liu, M. Recent progress in the applications of gold-based nanoparticles towards tumor-targeted imaging and therapy. RSC Adv. 2022, 12, 7635–7651. [Google Scholar] [CrossRef]
- Fratoddi, I.; Venditti, I.; Battocchio, C.; Carlini, L.; Amatori, S.; Porchia, M.; Tisato, F.; Bondino, F.; Magnano, E.; Pellei, M.; et al. Highly hydrophilic gold nanoparticles as carrier for anticancer copper(I) complexes: Loading and release studies for biomedical applications. Nanomaterials 2019, 9, 772. [Google Scholar] [CrossRef] [Green Version]
- Bavelaar, B.M.; Song, L.; Jackson, M.R.; Able, S.; Tietz, O.; Skaripa-Koukelli, I.; Waghorn, P.A.; Gill, M.R.; Carlisle, R.C.; Tarsounas, M.; et al. Oligonucleotide-Functionalized Gold Nanoparticles for Synchronous Telomerase Inhibition, Radiosensitization, and Delivery of Theranostic Radionuclides. Mol. Pharm. 2021, 18, 3820–3831. [Google Scholar] [CrossRef]
- Kumar, S.; Mongia, A.; Gulati, S.; Singh, P.; Diwan, A.; Shukla, S. Emerging theranostic gold nanostructures to combat cancer: Novel probes for Combinatorial Immunotherapy and Photothermal Therapy. Cancer. Treat. Res. Commun. 2020, 25, 100258. [Google Scholar] [CrossRef]
- Moreira, A.F.; Rodrigues, C.F.; Reis, C.A.; Costa, E.C.; Correia, I.J. Gold-core silica shell nanoparticles application in imaging and therapy: A review. Micropor. Mesopor. Mater. 2018, 270, 168–179. [Google Scholar] [CrossRef]
- Rascol, E.; Daurat, M.; Da Silva, A.; Maynadier, M.; Dorandeu, C.; Charnay, C.; Garcia, M.; Lai-Kee-Him, J.; Bron, P.; Auffan, M.; et al. Biological fate of Fe3O4 core-shell mesoporous silica nanoparticles depending on particle surface chemistry. Nanomaterials 2017, 7, 162. [Google Scholar] [CrossRef] [PubMed]
- Ko, J.A.; Lim, H.B. Metal/dye-doped core-shell silica nanoparticles for potential use in bioassay. J. Anal. At. Spectrom. 2013, 28, 630–636. [Google Scholar] [CrossRef]
- Wang, P.; Qu, Y.; Li, C.; Yin, L.; Shen, C.; Chen, W.; Yang, S.; Bian, X.; Fang, D. Bio-functionalized dense-silica nanoparticles for MR/NIRF imaging of CD146 in gastric cancer. Int. J. Nanomed. 2015, 10, 749–763. [Google Scholar] [CrossRef] [PubMed] [Green Version]
- Badruddoza, A.Z.M.; Rahman, T.; Ghosh, S.; Hossain, Z.; Shi, J.; Hidajat, K.; Uddin, M.S. β-Cyclodextrin conjugated magnetic, fluorescent silica core-shell nanoparticles for biomedical applications. Carbohydr. Polym. 2013, 95, 449–457. [Google Scholar] [CrossRef]
- Huang, P.; Bao, L.; Zhang, C.; Lin, J.; Luo, T.; Yang, D.; He, M.; Li, Z.; Gao, G.; Gao, B.; et al. Folic acid-conjugated silica-modified gold nanorods for X-ray/CT imaging-guided dual-mode radiation and photo-thermal therapy. Biomaterials. 2011, 32, 809–9796. [Google Scholar] [CrossRef]
- Nguyen, N.H.; Tran, D.L.; Truong-Thi, N.; Nguyen, C.K.; Tran, C.T.; Nguyen, D.H. Simply and effectively control the shell thickness of hollow mesoporous silica nanoparticles by polyethylene glycol for drug delivery applications. J. Appl. Polym. Sci. 2022, 139, e53126. [Google Scholar] [CrossRef]
- Chen, B.; Chen, C.; Tao, C.; Zeng, H.; Zhang, L.; Yang, M.; Han, Z. Size and distance dependent fluorescence enhancement of nanoporous gold. Opt. Express 2017, 25, 9901–9910. [Google Scholar] [CrossRef]
- Graf, C.; Vossen, D.L.J.; Imhof, A.; van Blaaderen, A.A. General Method to Coat Colloidal Particles with Silica. Langmuir 2003, 19, 6693–6700. [Google Scholar] [CrossRef]
- Stober, W.; Fink, A.; Bohn, E. Controlled growth of monodisperse silica spheres in the micron size range. J. Colloid Interface Sci. 1968, 26, 62–69. [Google Scholar] [CrossRef]
- Rosemary, M.J.; Maclaren, I.; Pradeep, T. Carbon onions within silica nanoshells. Carbon 2004, 42, 2329–2366. [Google Scholar] [CrossRef] [Green Version]
- Lee, S.; Kwon, J.A.; Park, K.H.; Jin, C.M.; Joo, J.B.; Choi, I. Controlled drug release with surface-capped mesoporous silica nanoparticles and its label-free in situ Raman monitoring. Eur. J. Pharm. Biopharm. 2018, 131, 232–239. [Google Scholar] [CrossRef]
- Pastoriza-Santos, I.; Perez-Juste, J.; Liz-Marzan, L.M. Silica-coating and hydrophobation of ctab-stabilized gold nanorods. Chem. Mater. 2006, 18, 2465–2467. [Google Scholar] [CrossRef]
- Perez-Juste, J.; Pastoriza-Santos, I.; Liz-Marzan, L.M. Gold nanorods: Synthesis, characterization and applications. Coord. Chem. Rev. 2005, 249, 1870–1901. [Google Scholar] [CrossRef]
- Scarabelli, L.; Sánchez-Iglesias, A.; Pérez-Juste, J.; Liz-Marzán, L.M. A “Tips and Tricks” Practical Guide to the Synthesis of Gold Nanorods. J. Phys. Chem. Lett. 2015, 6, 4270–4279. [Google Scholar] [CrossRef] [Green Version]
- Yoshida, A.; Uchida, N.; Kometani, N. Synthesis and Spectroscopic Studies of Composite Gold Nanorods with a Double-Shell Structure Composed of Spacer and Cyanine Dye J-Aggregate Layers. Langmuir 2009, 25, 11802–11807. [Google Scholar] [CrossRef]
- Park, K.; Drummy, L.F.; Wadams, R.C.; Koerner, H.; Nepal, D.; Fabris, L.; Vaia, R.A. Growth mechanism of gold nanorods. Chem. Mater. 2013, 25, 555–563. [Google Scholar] [CrossRef]
- Watt, J.; Hance, B.G.; Anderson, R.S.; Huber, D.L. Effect of Seed Age on Gold Nanorod Formation: A Microfluidic, Real-Time Investigation. Chem. Mater. 2015, 27, 6442–6449. [Google Scholar] [CrossRef]
- Zhu, J.; Zhang, Q.; Zhang, C.-H.; Weng, G.-J.; Zhao, J.; Li, J.-J.; Zhao, J.-W. Synthesis of colloidal gold nanobones with tunable negative curvatures at end surface and their application in SERS. J. Nanoparticle Res. 2017, 19, 364. [Google Scholar] [CrossRef]
- Gorelikov, I.; Matsuura, N. Single-Step Coating of Mesoporous Silica on Cetyltrimethyl Ammonium Bromide-Capped Nanoparticles. Nano Lett. 2008, 8, 369–373. [Google Scholar] [CrossRef]
- Yoon, S.B.; Kim, J.-Y.; Kim, J.H.; Park, Y.J.; Yoon, K.R.; Park, S.-K.; Yu, J.-S. Synthesis of monodisperse spherical silica particles with solid core and mesoporous shell: Mesopore channels perpendicular to the surface. J. Mat. Chem. 2007, 17, 1758. [Google Scholar] [CrossRef]
- Hirn, S.; Semmler-Behnke, M.; Schleh, C.; Wenk, A.; Lipka, J.; Schäffler, M.; Takenaka, S.; Möller, W.; Schmid, G.; Simon, U.; et al. Particle size-dependent and surface charge-dependent biodistribution of gold nanoparticles after intravenous administration. Eur. J. Pharm. Biopharm. 2011, 77, 407–416. [Google Scholar] [CrossRef] [PubMed] [Green Version]
- Takeuchi, I.; Nobata, S.; Oiri, N.; Tomoda, K.; Makino, K. Biodistribution and excretion of colloidal gold nanoparticles after intravenous injection: Effects of particle size. Biomed. Mater. Eng. 2017, 28, 315–323. [Google Scholar] [CrossRef] [PubMed]
- Solovyeva, E.V.; Smirnov, A.N.; Svinko, V.O.; Strelnikov, A.S.; Shevchuk, A.I.; Kazarian, S.G. Unraveling a role of molecular linker in nanoparticles self-organization by SERS spectroscopy: Comparative study of three aromatic diamines. Colloids Surf. A Physicochem. Eng. Asp. 2022, 645, 128881. [Google Scholar] [CrossRef]
- Park, S.; Kim, H.; Lim, S.C.; Lim, K.; Lee, E.S.; Oh, K.T.; Choi, H.G.; Youn, Y.S. Gold nanocluster-loaded hybrid albumin nanoparticles with fluorescence-based optical visualization and photothermal conversion for tumor detection/ablation. J. Control. Release 2019, 304, 7–18. [Google Scholar] [CrossRef]
- Marghani, B.H.; Fehaid, A.; Ateya, A.I.; Ezz, M.A.; Saleh, R.M. Photothermal therapeutic potency of plasmonic silver nanoparticles for apoptosis and anti-angiogenesis in testosterone induced benign prostate hyperplasia in rats. Life Sci. 2022, 291, 120240. [Google Scholar] [CrossRef]
- Shiohara, A.; Wang, Y.; Liz-Marzán, L.M. Recent approaches toward creation of hot spots for SERS detection. J. Photochem. Photobiol. C Photochem. Rev. 2014, 21, 2–25. [Google Scholar] [CrossRef]
- Svinko, V.O.; Shevchuk, A.I.; Smirnov, A.N.; Makeeva, D.V.; Solovyeva, E.V. Gold nanostars-based labels for surface-enhanced Raman scattering imaging with red medical lasers. Opt. Spectrosc. 2022, 130, 1590–1595. [Google Scholar] [CrossRef]
- He, S.; Zhang, W.; Liu, L.; Huang, Y.; He, J.; Xie, W.; Wu, P.; Du, C. Baseline correction for Raman spectra using an improved asymmetric least squares method. Anal. Methods 2014, 6, 4402–4407. [Google Scholar] [CrossRef]
- Akal, Z.U.; Alpsoy, L.; Baykal, A. Superparamagnetic Iron Oxide Conjugated with Folic acid and Carboxylated Quercetin for Chemotherapy applications. Ceram. Int. 2016, 42, 9065–9072. [Google Scholar] [CrossRef]
- Sun, Q.; Kanehira, K.; Taniguchi, A. Low doses of TiO2-polyethylene glycol nanoparticles stimulate proliferation of hepatocyte cells. Sci. Technol. Adv. Mater. 2016, 17, 669–676. [Google Scholar] [CrossRef] [Green Version]


Disclaimer/Publisher’s Note: The statements, opinions and data contained in all publications are solely those of the individual author(s) and contributor(s) and not of MDPI and/or the editor(s). MDPI and/or the editor(s) disclaim responsibility for any injury to people or property resulting from any ideas, methods, instructions or products referred to in the content. |
© 2023 by the authors. Licensee MDPI, Basel, Switzerland. This article is an open access article distributed under the terms and conditions of the Creative Commons Attribution (CC BY) license (https://creativecommons.org/licenses/by/4.0/).
Share and Cite
Smirnov, A.N.; Aslanov, S.F.; Danilov, D.V.; Kurapova, O.Y.; Solovyeva, E.V. One-Pot Synthesis of Silica-Coated Gold Nanostructures Loaded with Cyanine 5.5 for Cell Imaging by SERS Spectroscopy. Nanomaterials 2023, 13, 1267. https://doi.org/10.3390/nano13071267
Smirnov AN, Aslanov SF, Danilov DV, Kurapova OY, Solovyeva EV. One-Pot Synthesis of Silica-Coated Gold Nanostructures Loaded with Cyanine 5.5 for Cell Imaging by SERS Spectroscopy. Nanomaterials. 2023; 13(7):1267. https://doi.org/10.3390/nano13071267
Chicago/Turabian StyleSmirnov, Aleksei N., Simar F. Aslanov, Denis V. Danilov, Olga Yu. Kurapova, and Elena V. Solovyeva. 2023. "One-Pot Synthesis of Silica-Coated Gold Nanostructures Loaded with Cyanine 5.5 for Cell Imaging by SERS Spectroscopy" Nanomaterials 13, no. 7: 1267. https://doi.org/10.3390/nano13071267