
The Impact of Experimental Conditions on Cell Mechanics as Measured with Nanoindentation

 , and
, and 
Abstract
:1. Introduction
2. Materials and Methods
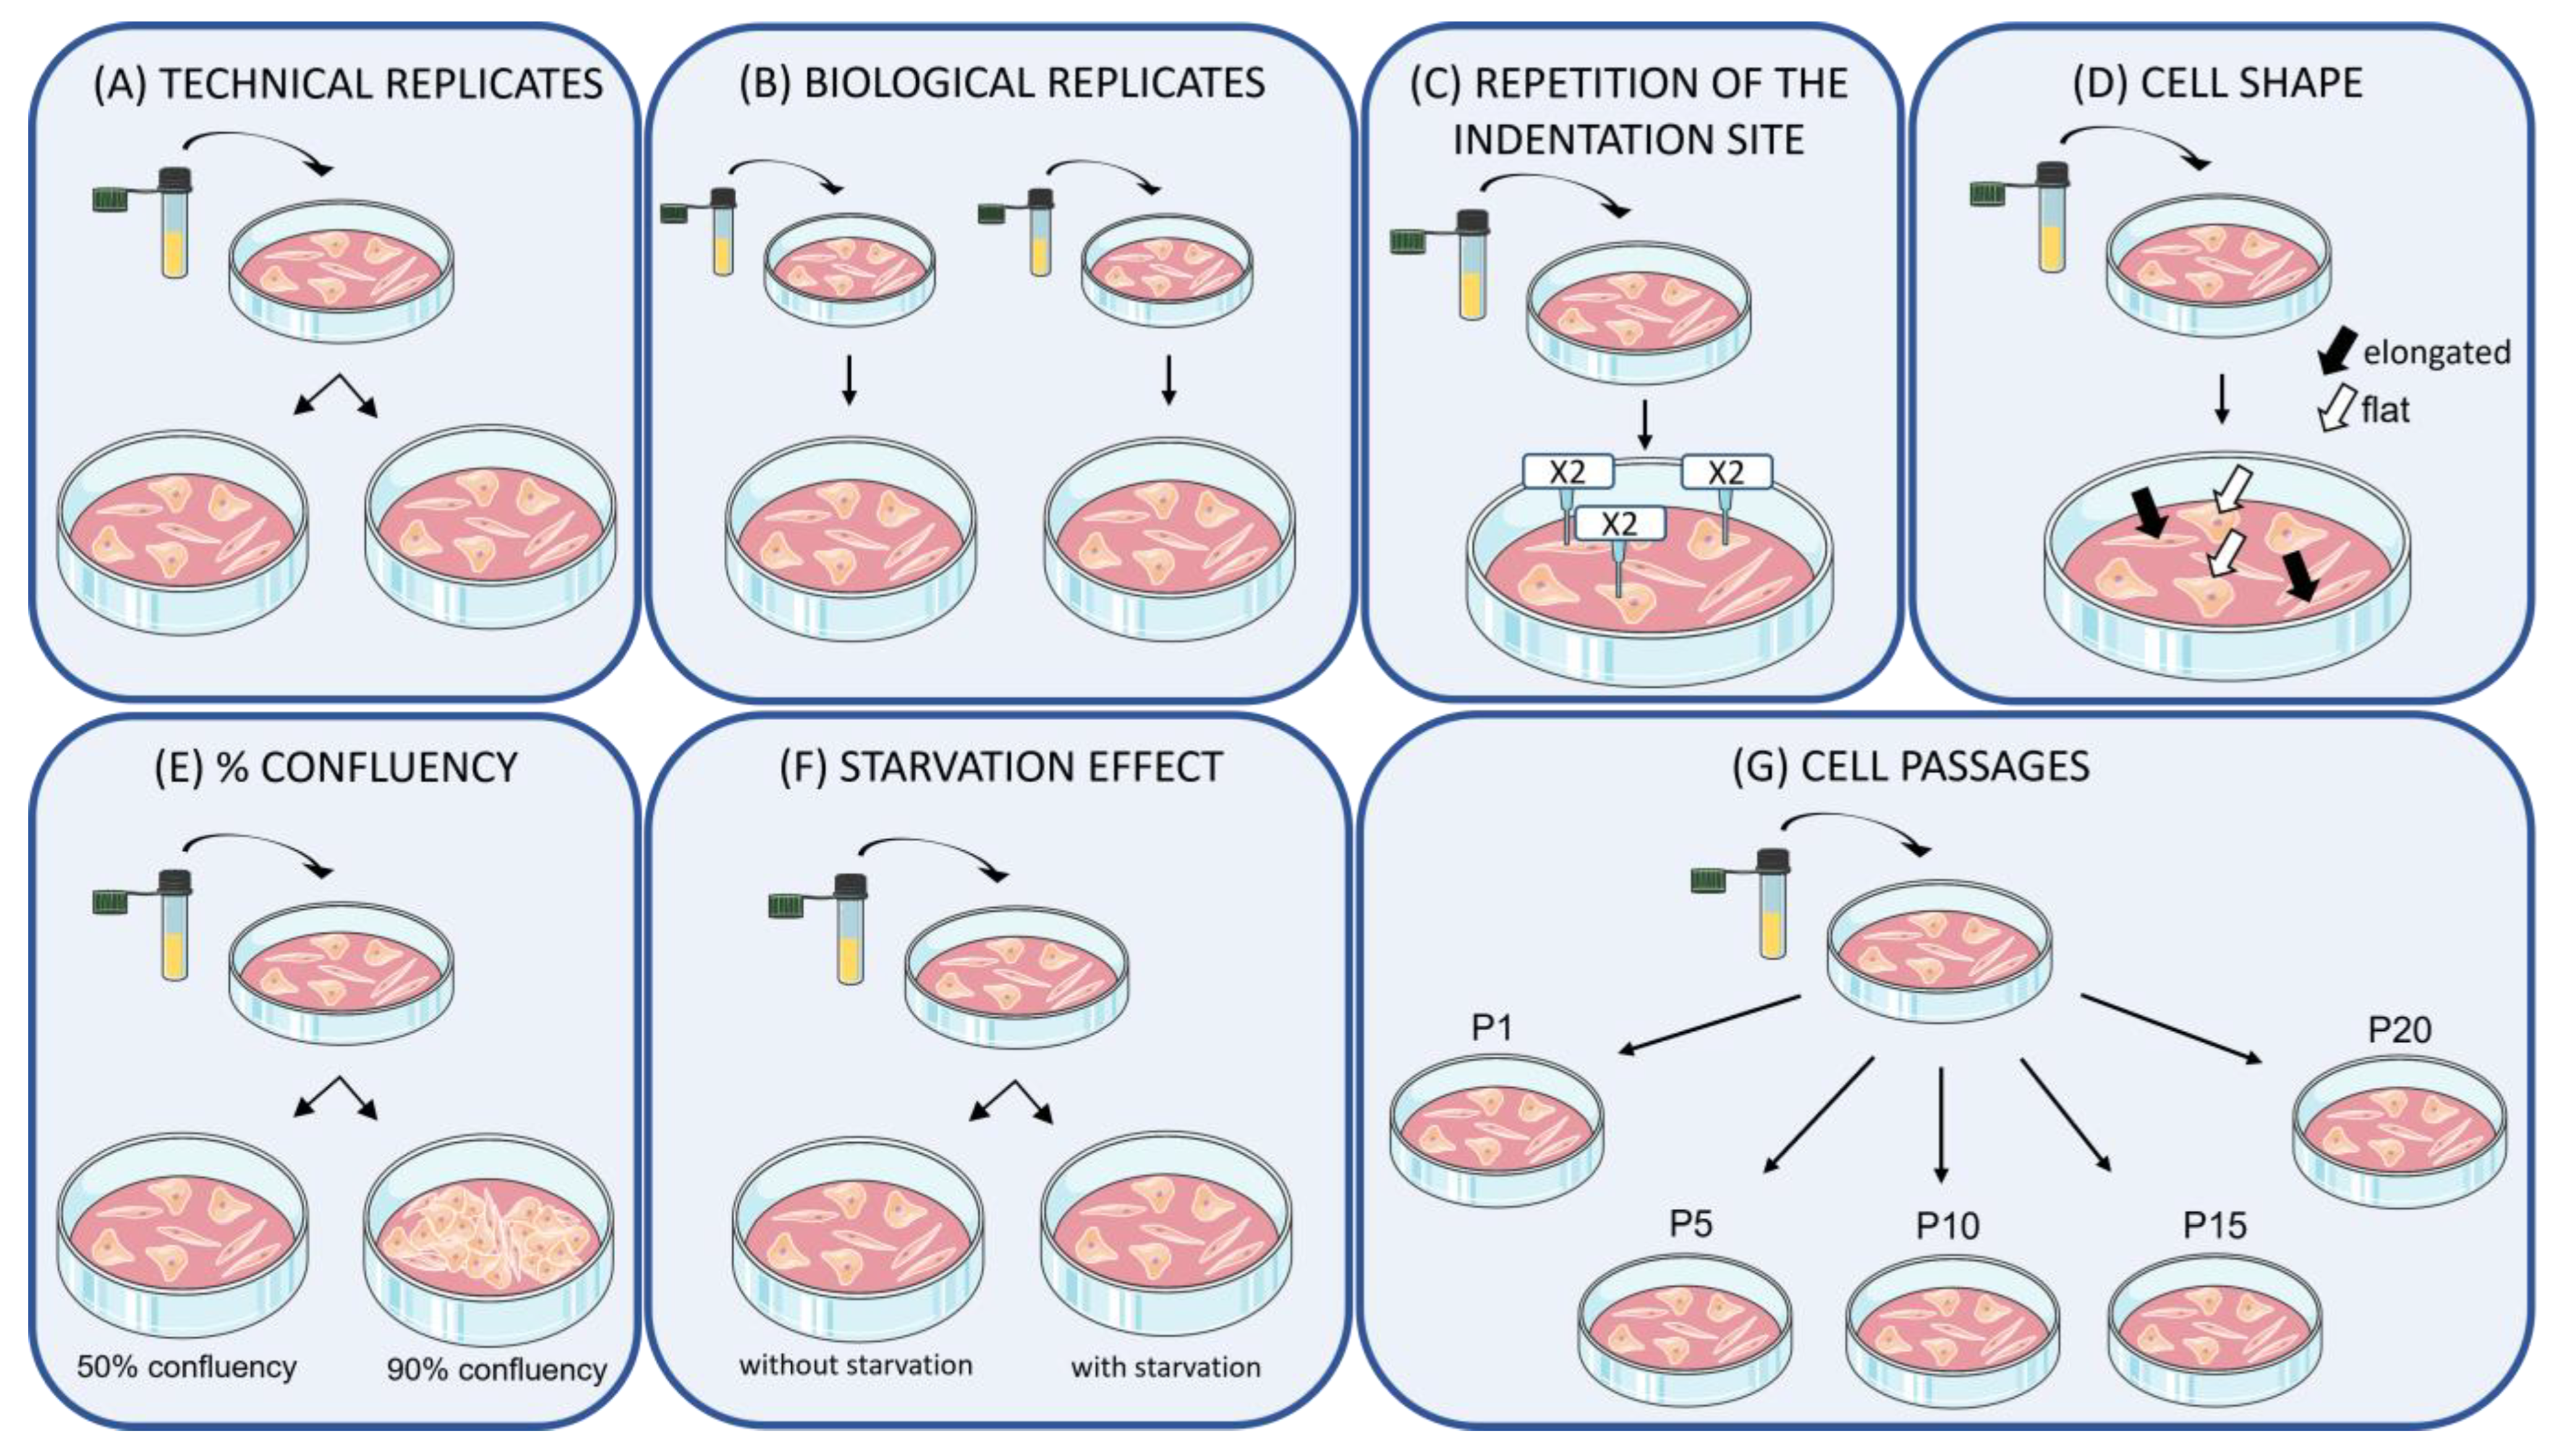
2.1. Experimental Design
2.2. Samples and Culture Treatments
2.3. Cell Indentation and Data Analysis
2.4. Cell Morphology Analysis
2.5. Statistical Approach
3. Results and Discussion
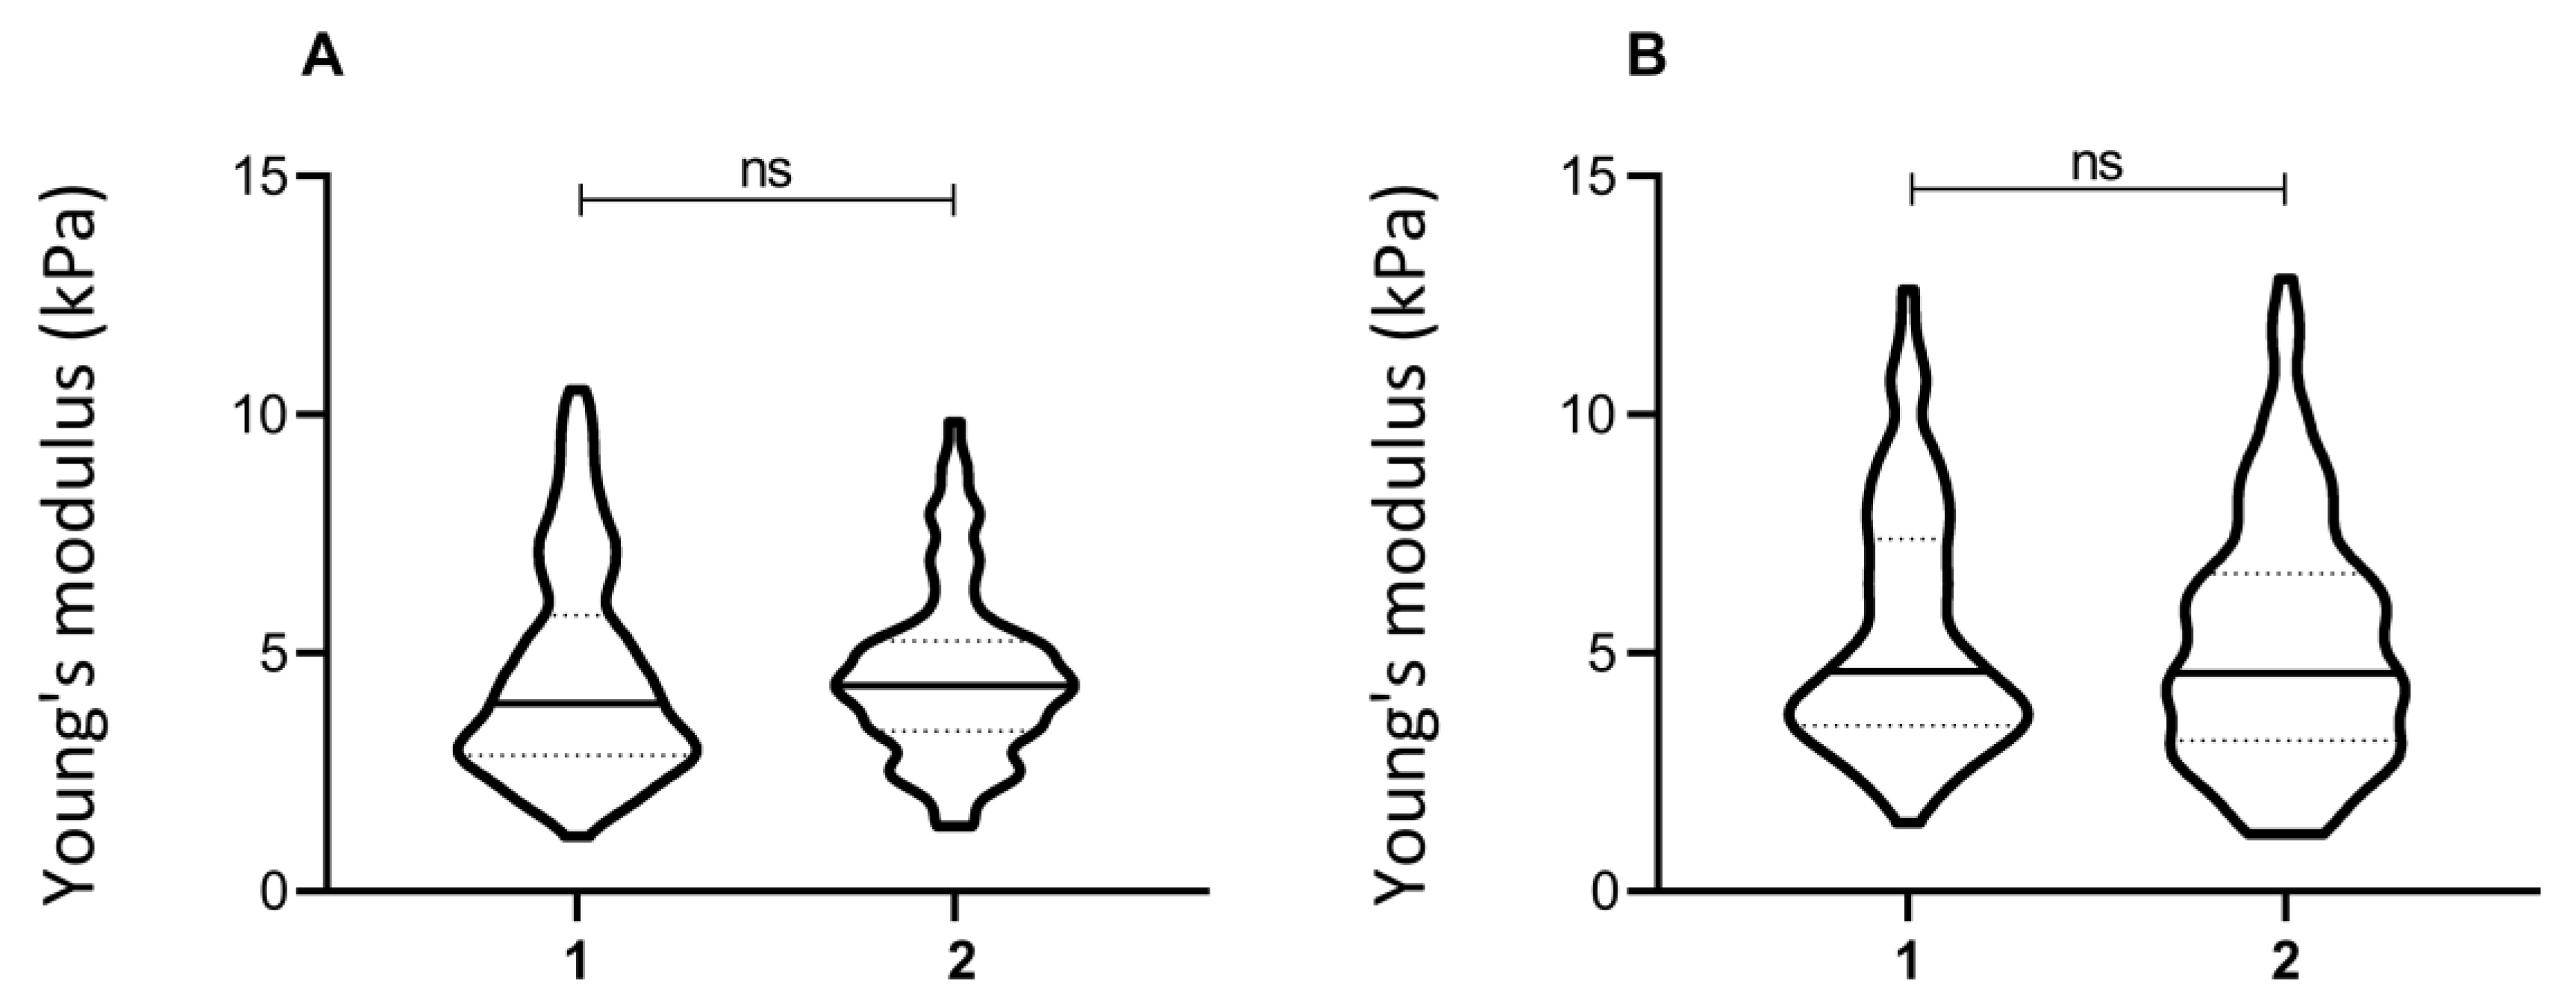
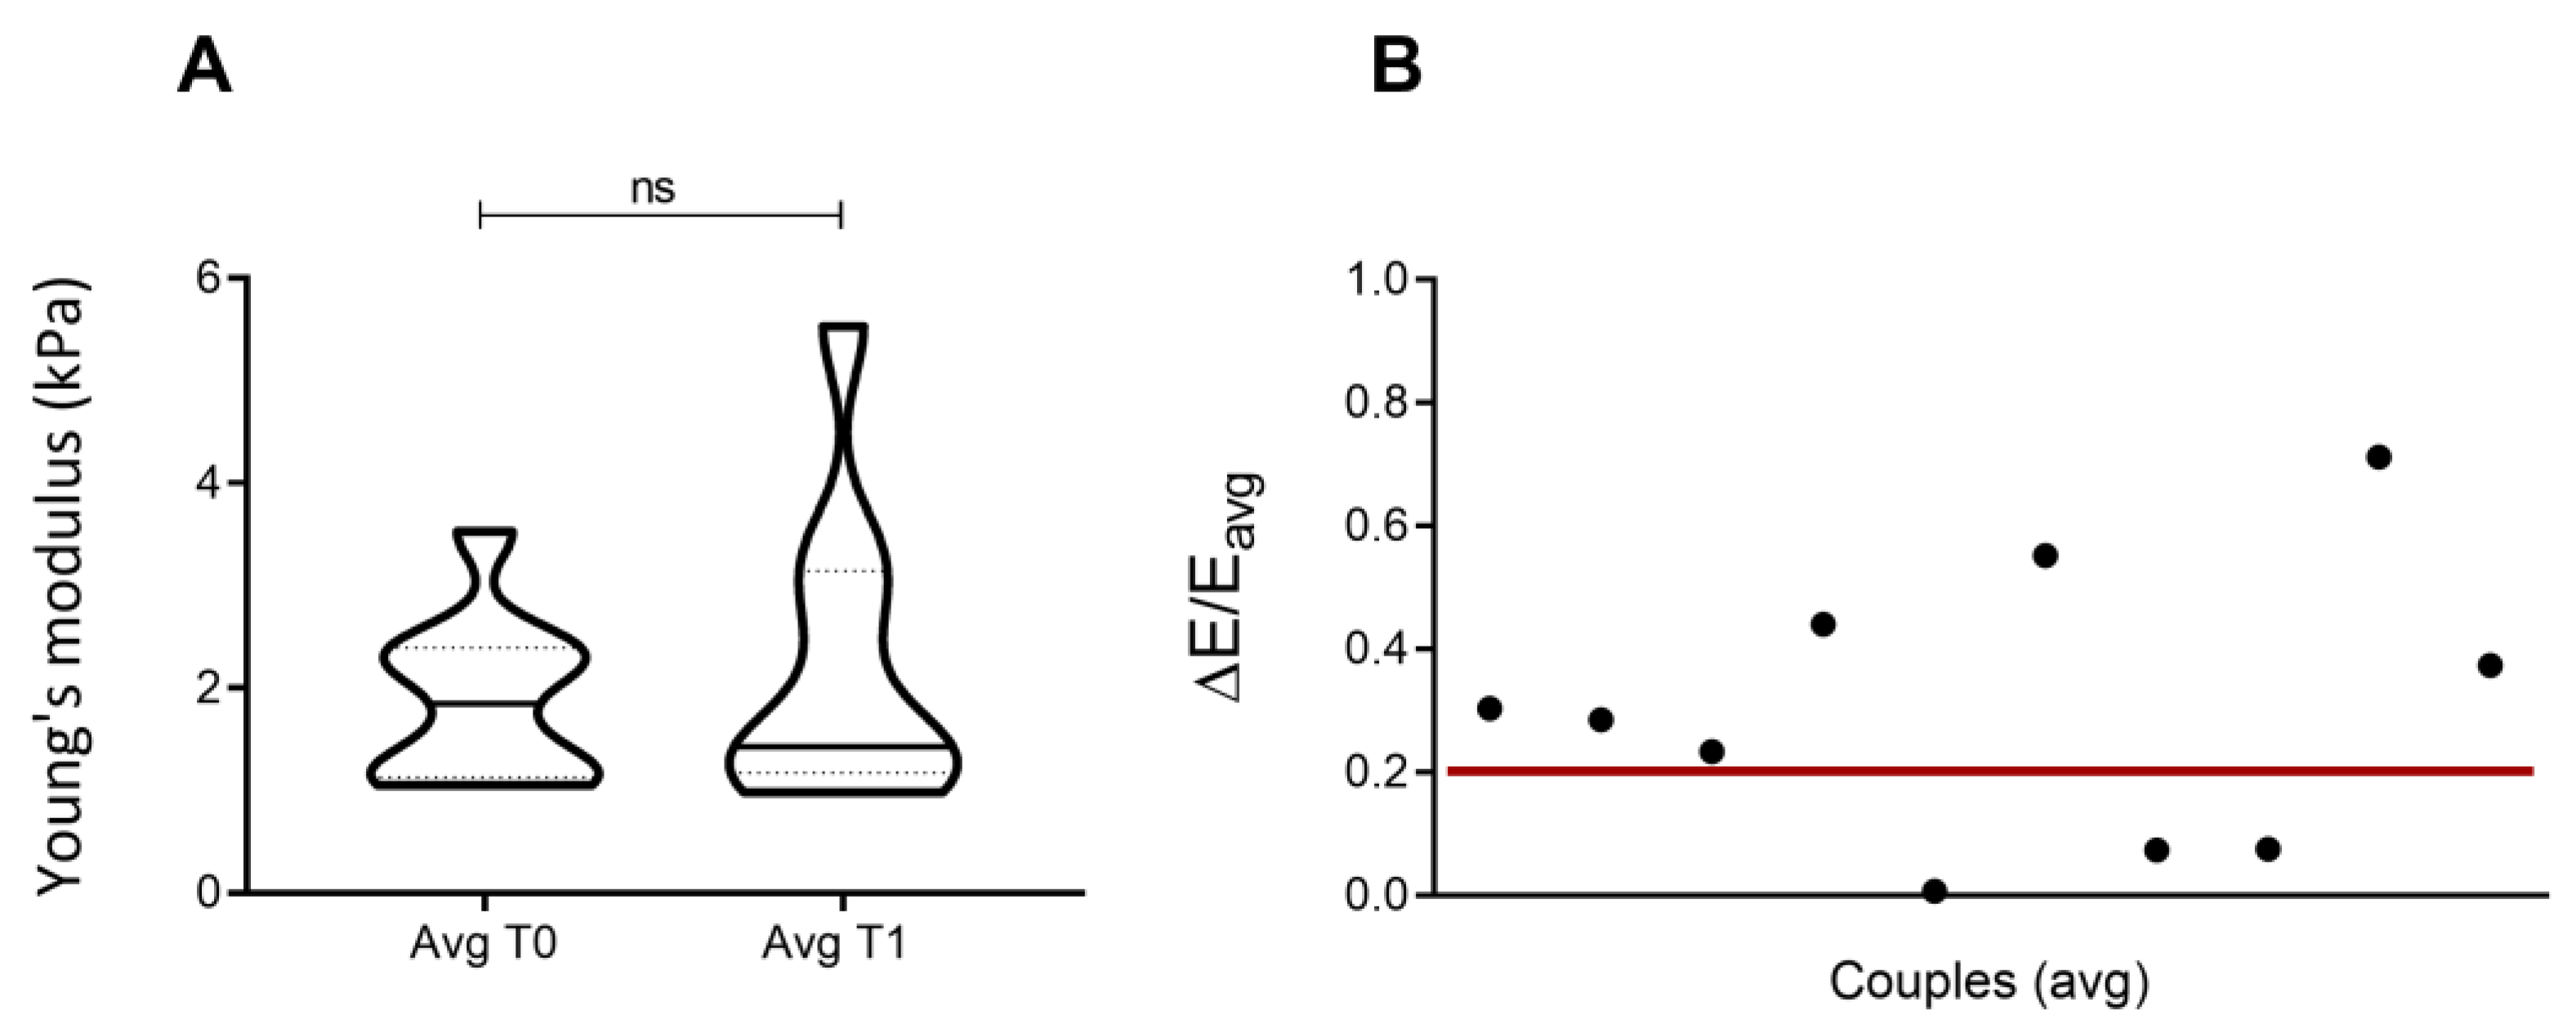
3.1. Samples Replication
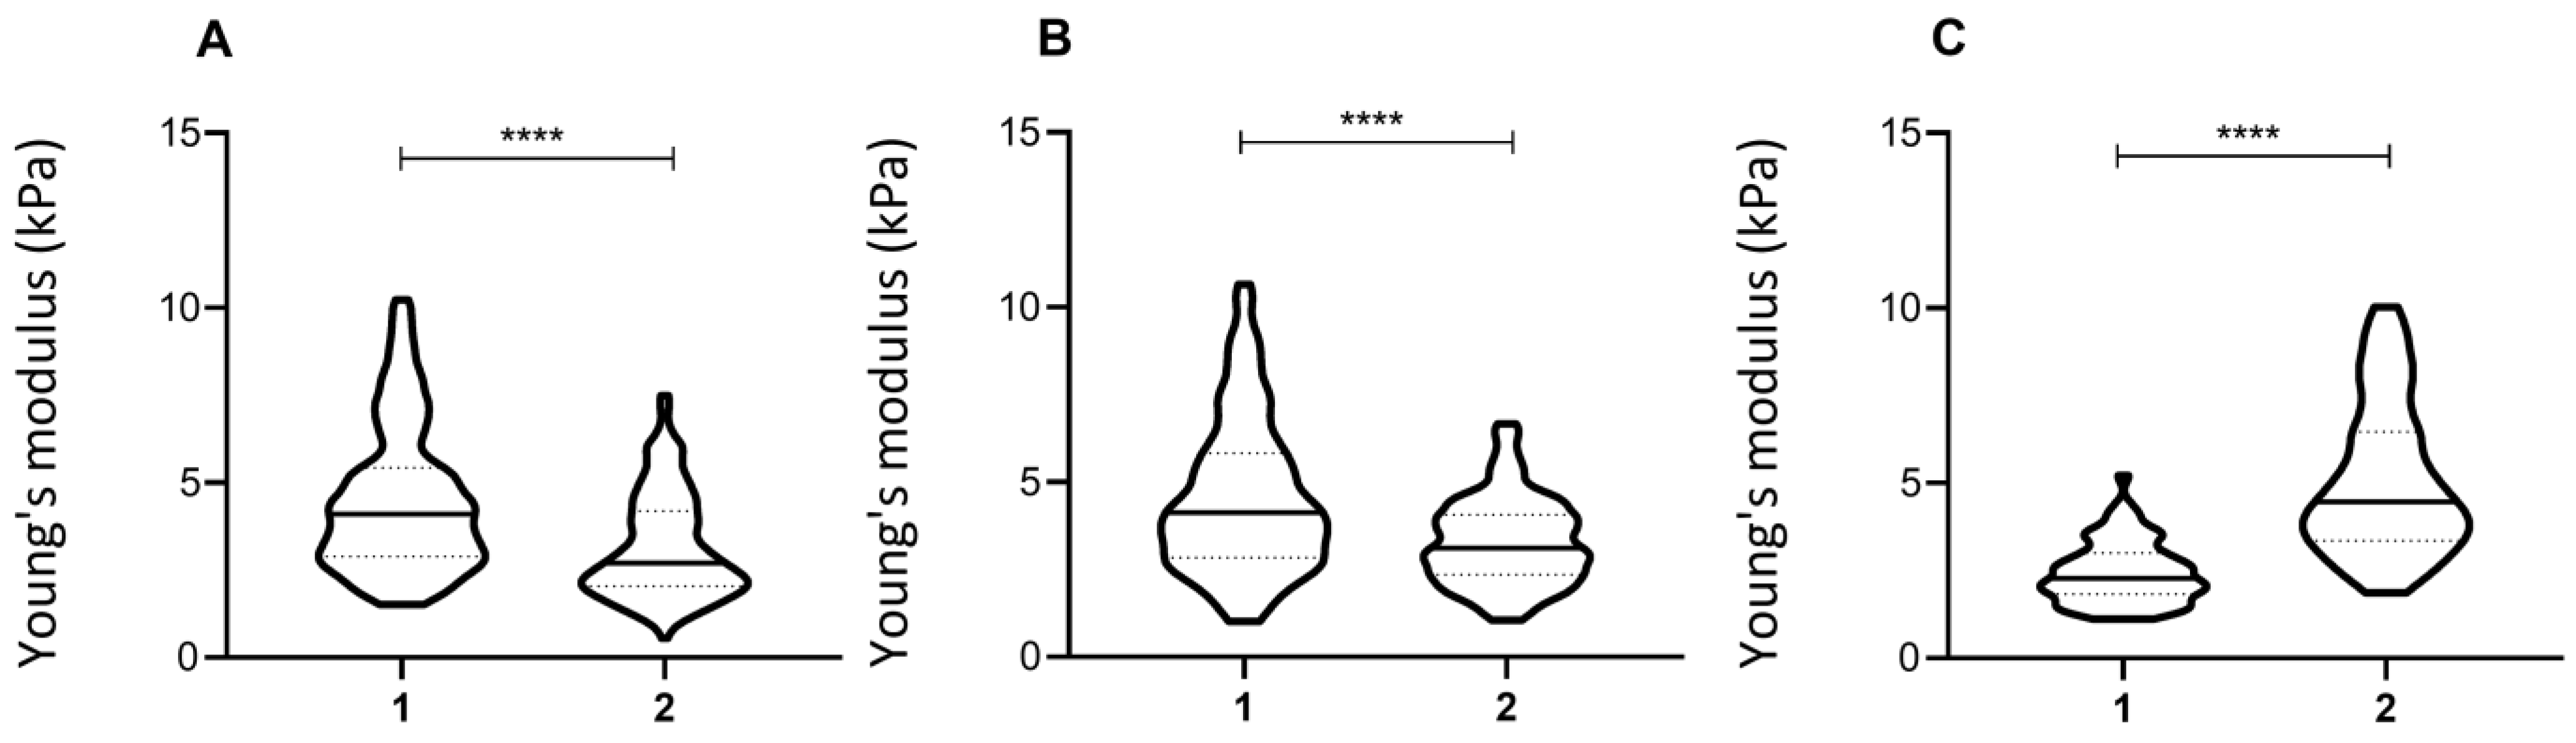
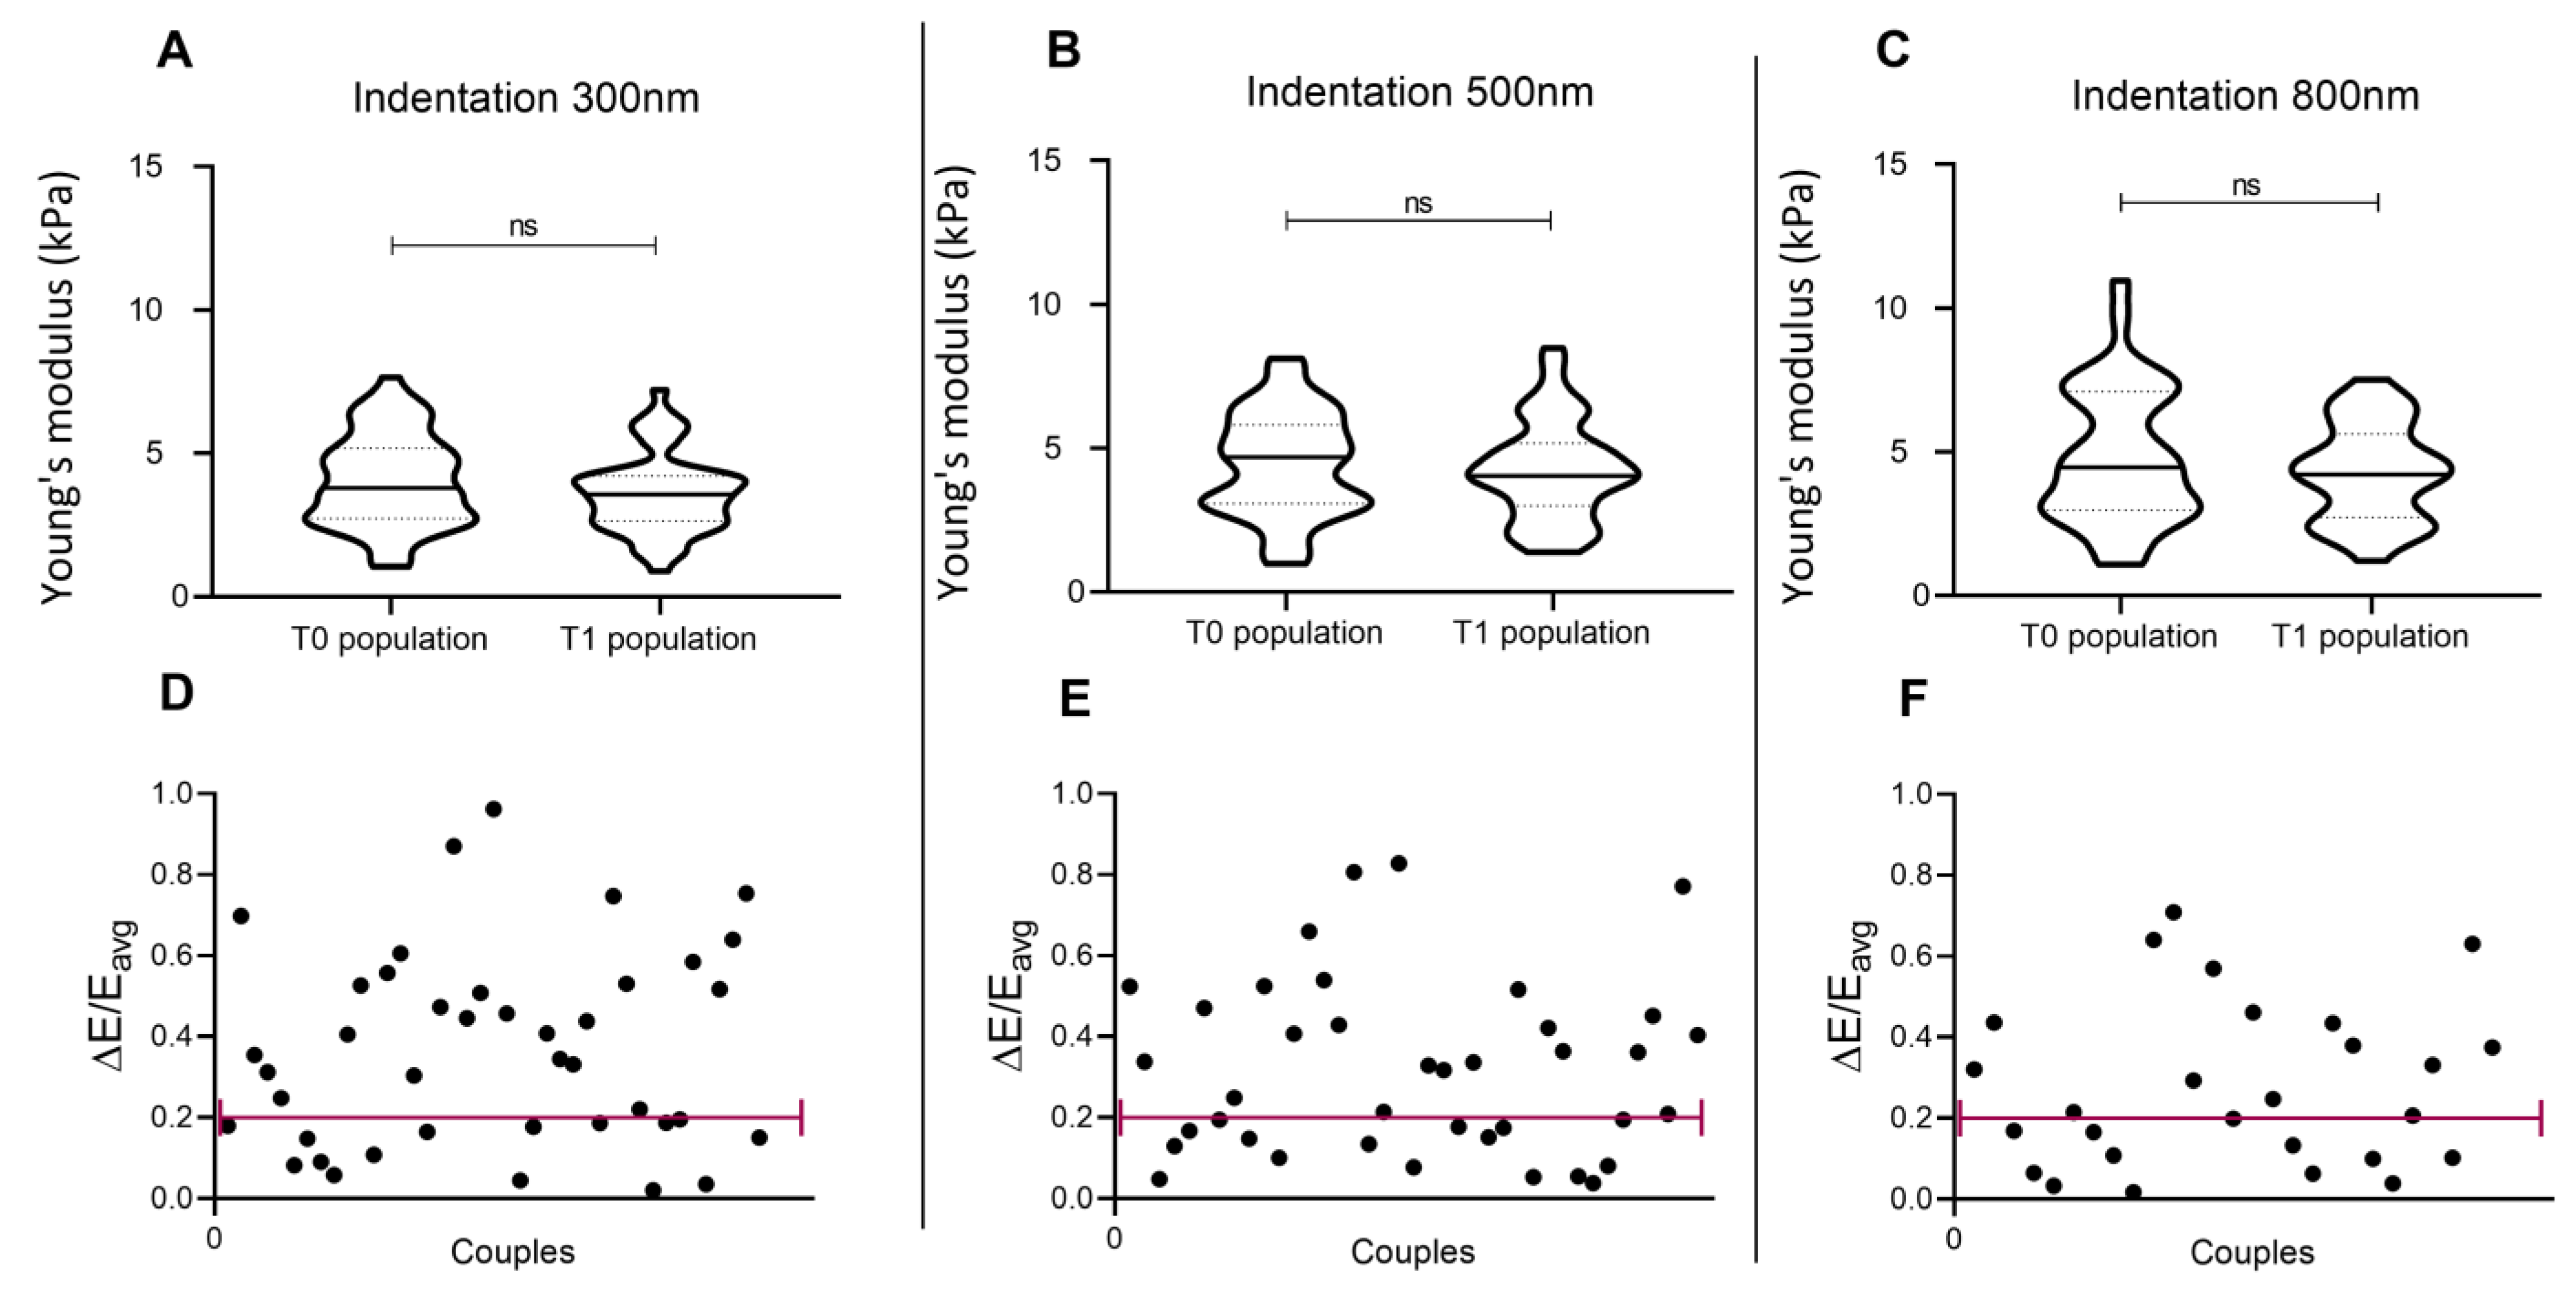
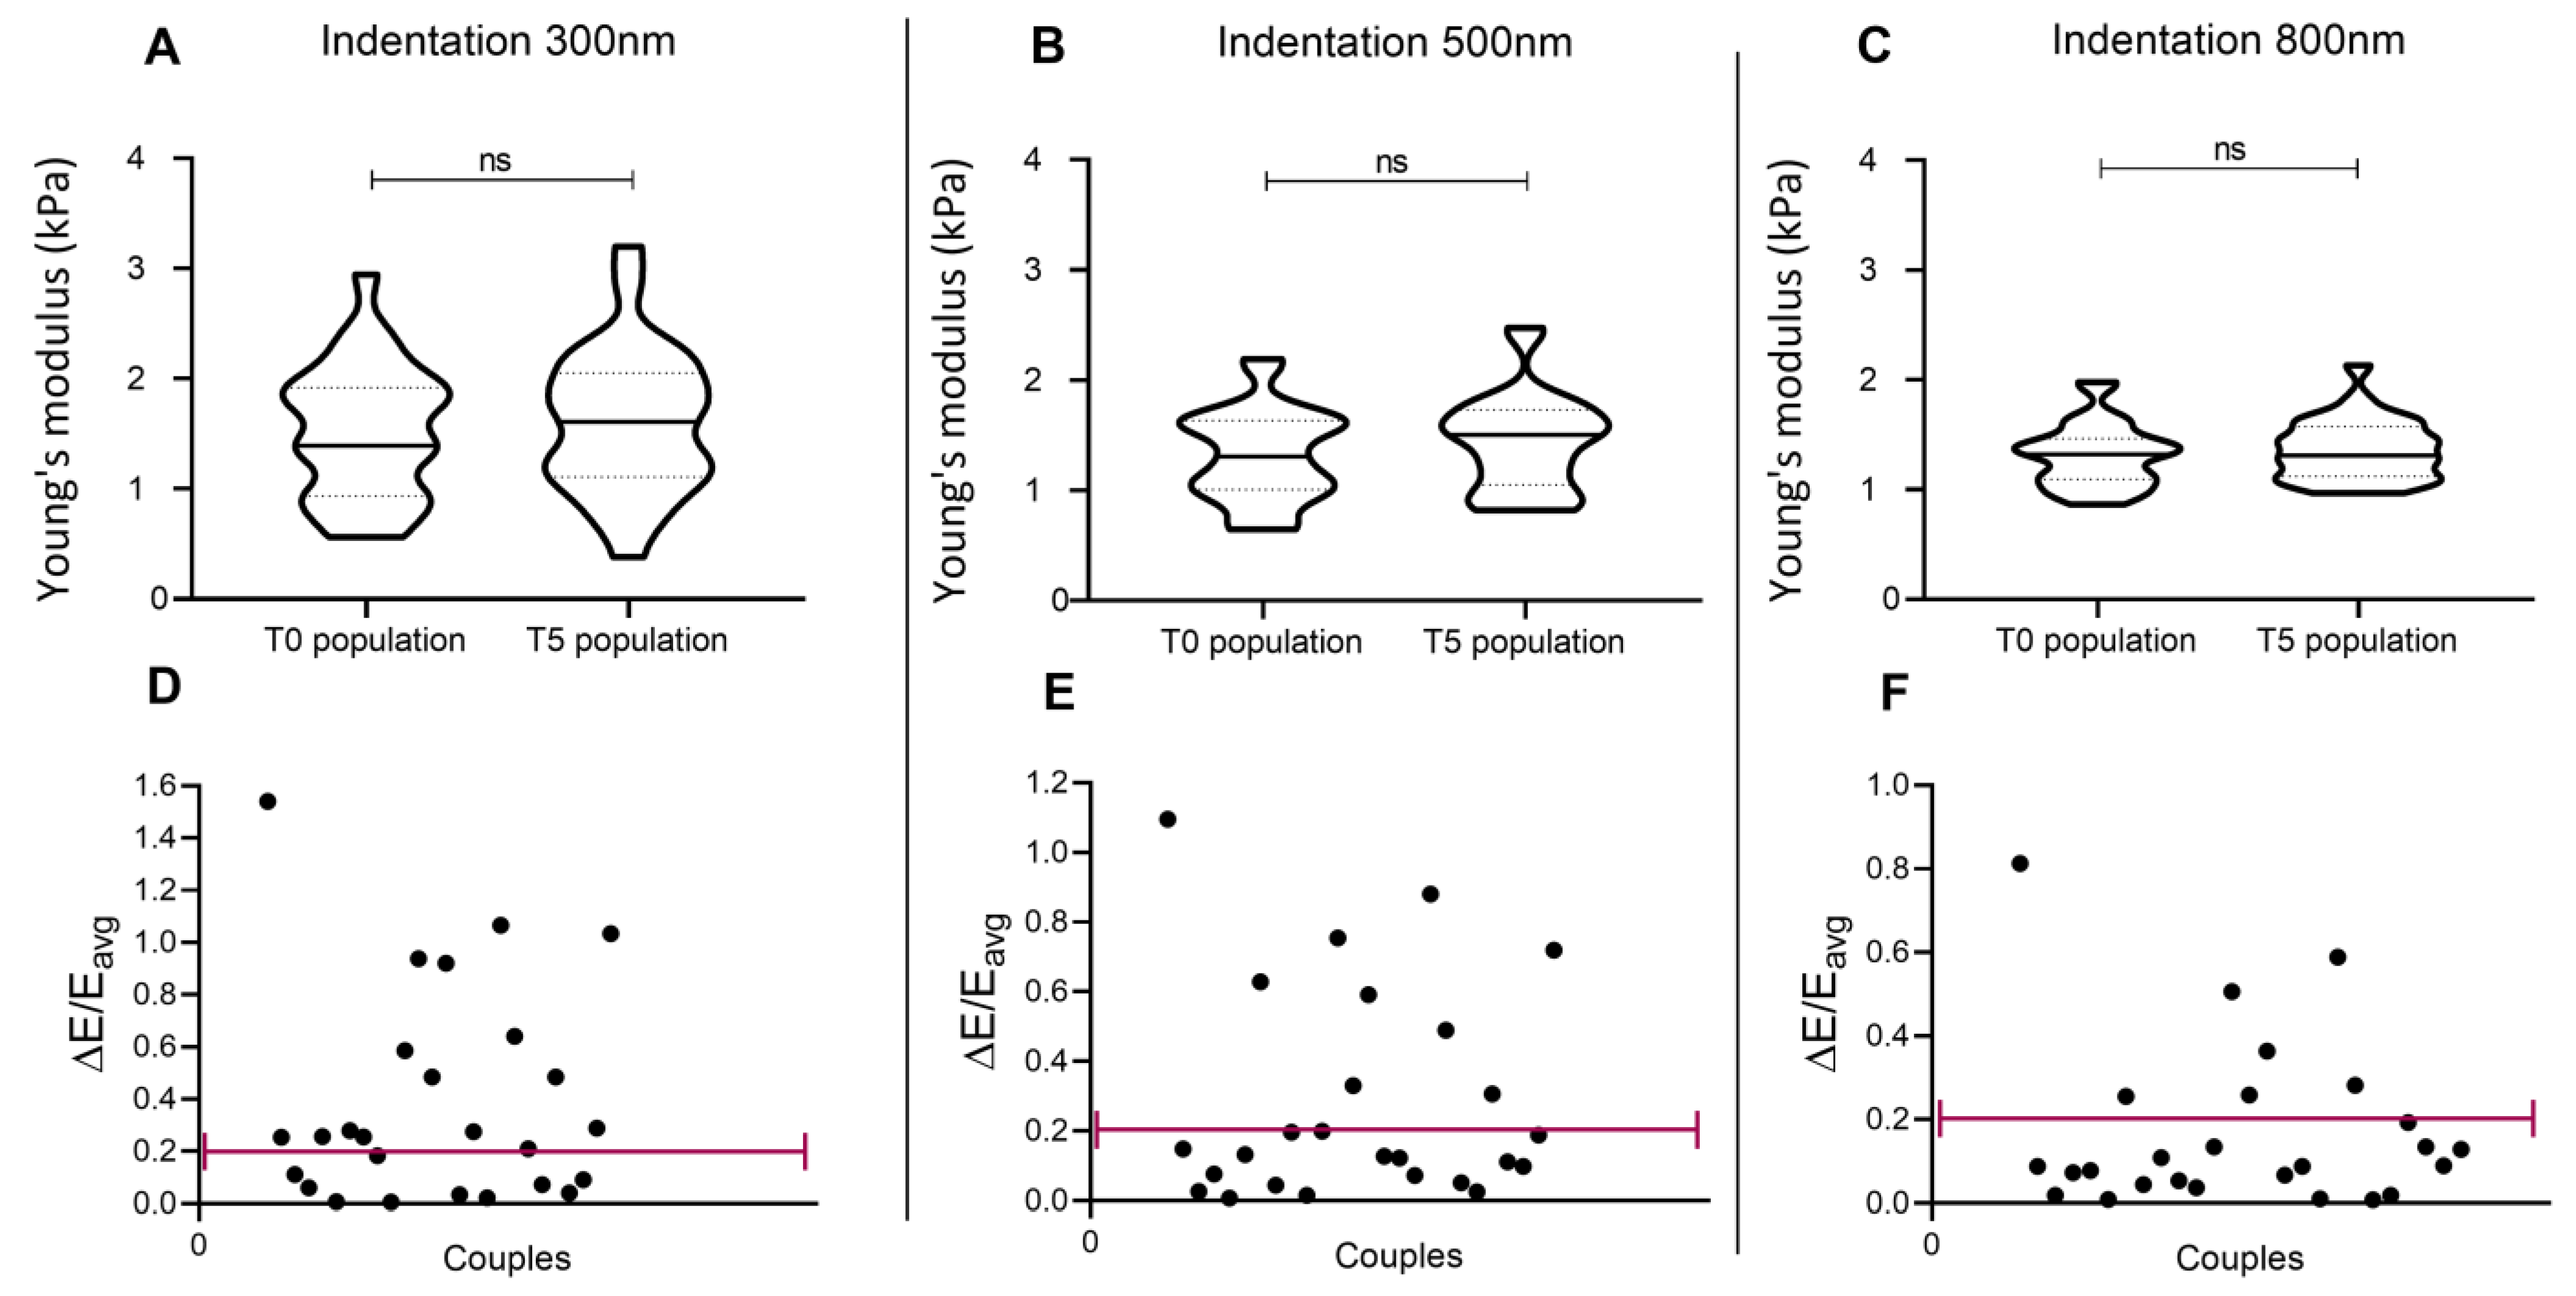
3.2. Repetition of the Indentation Site
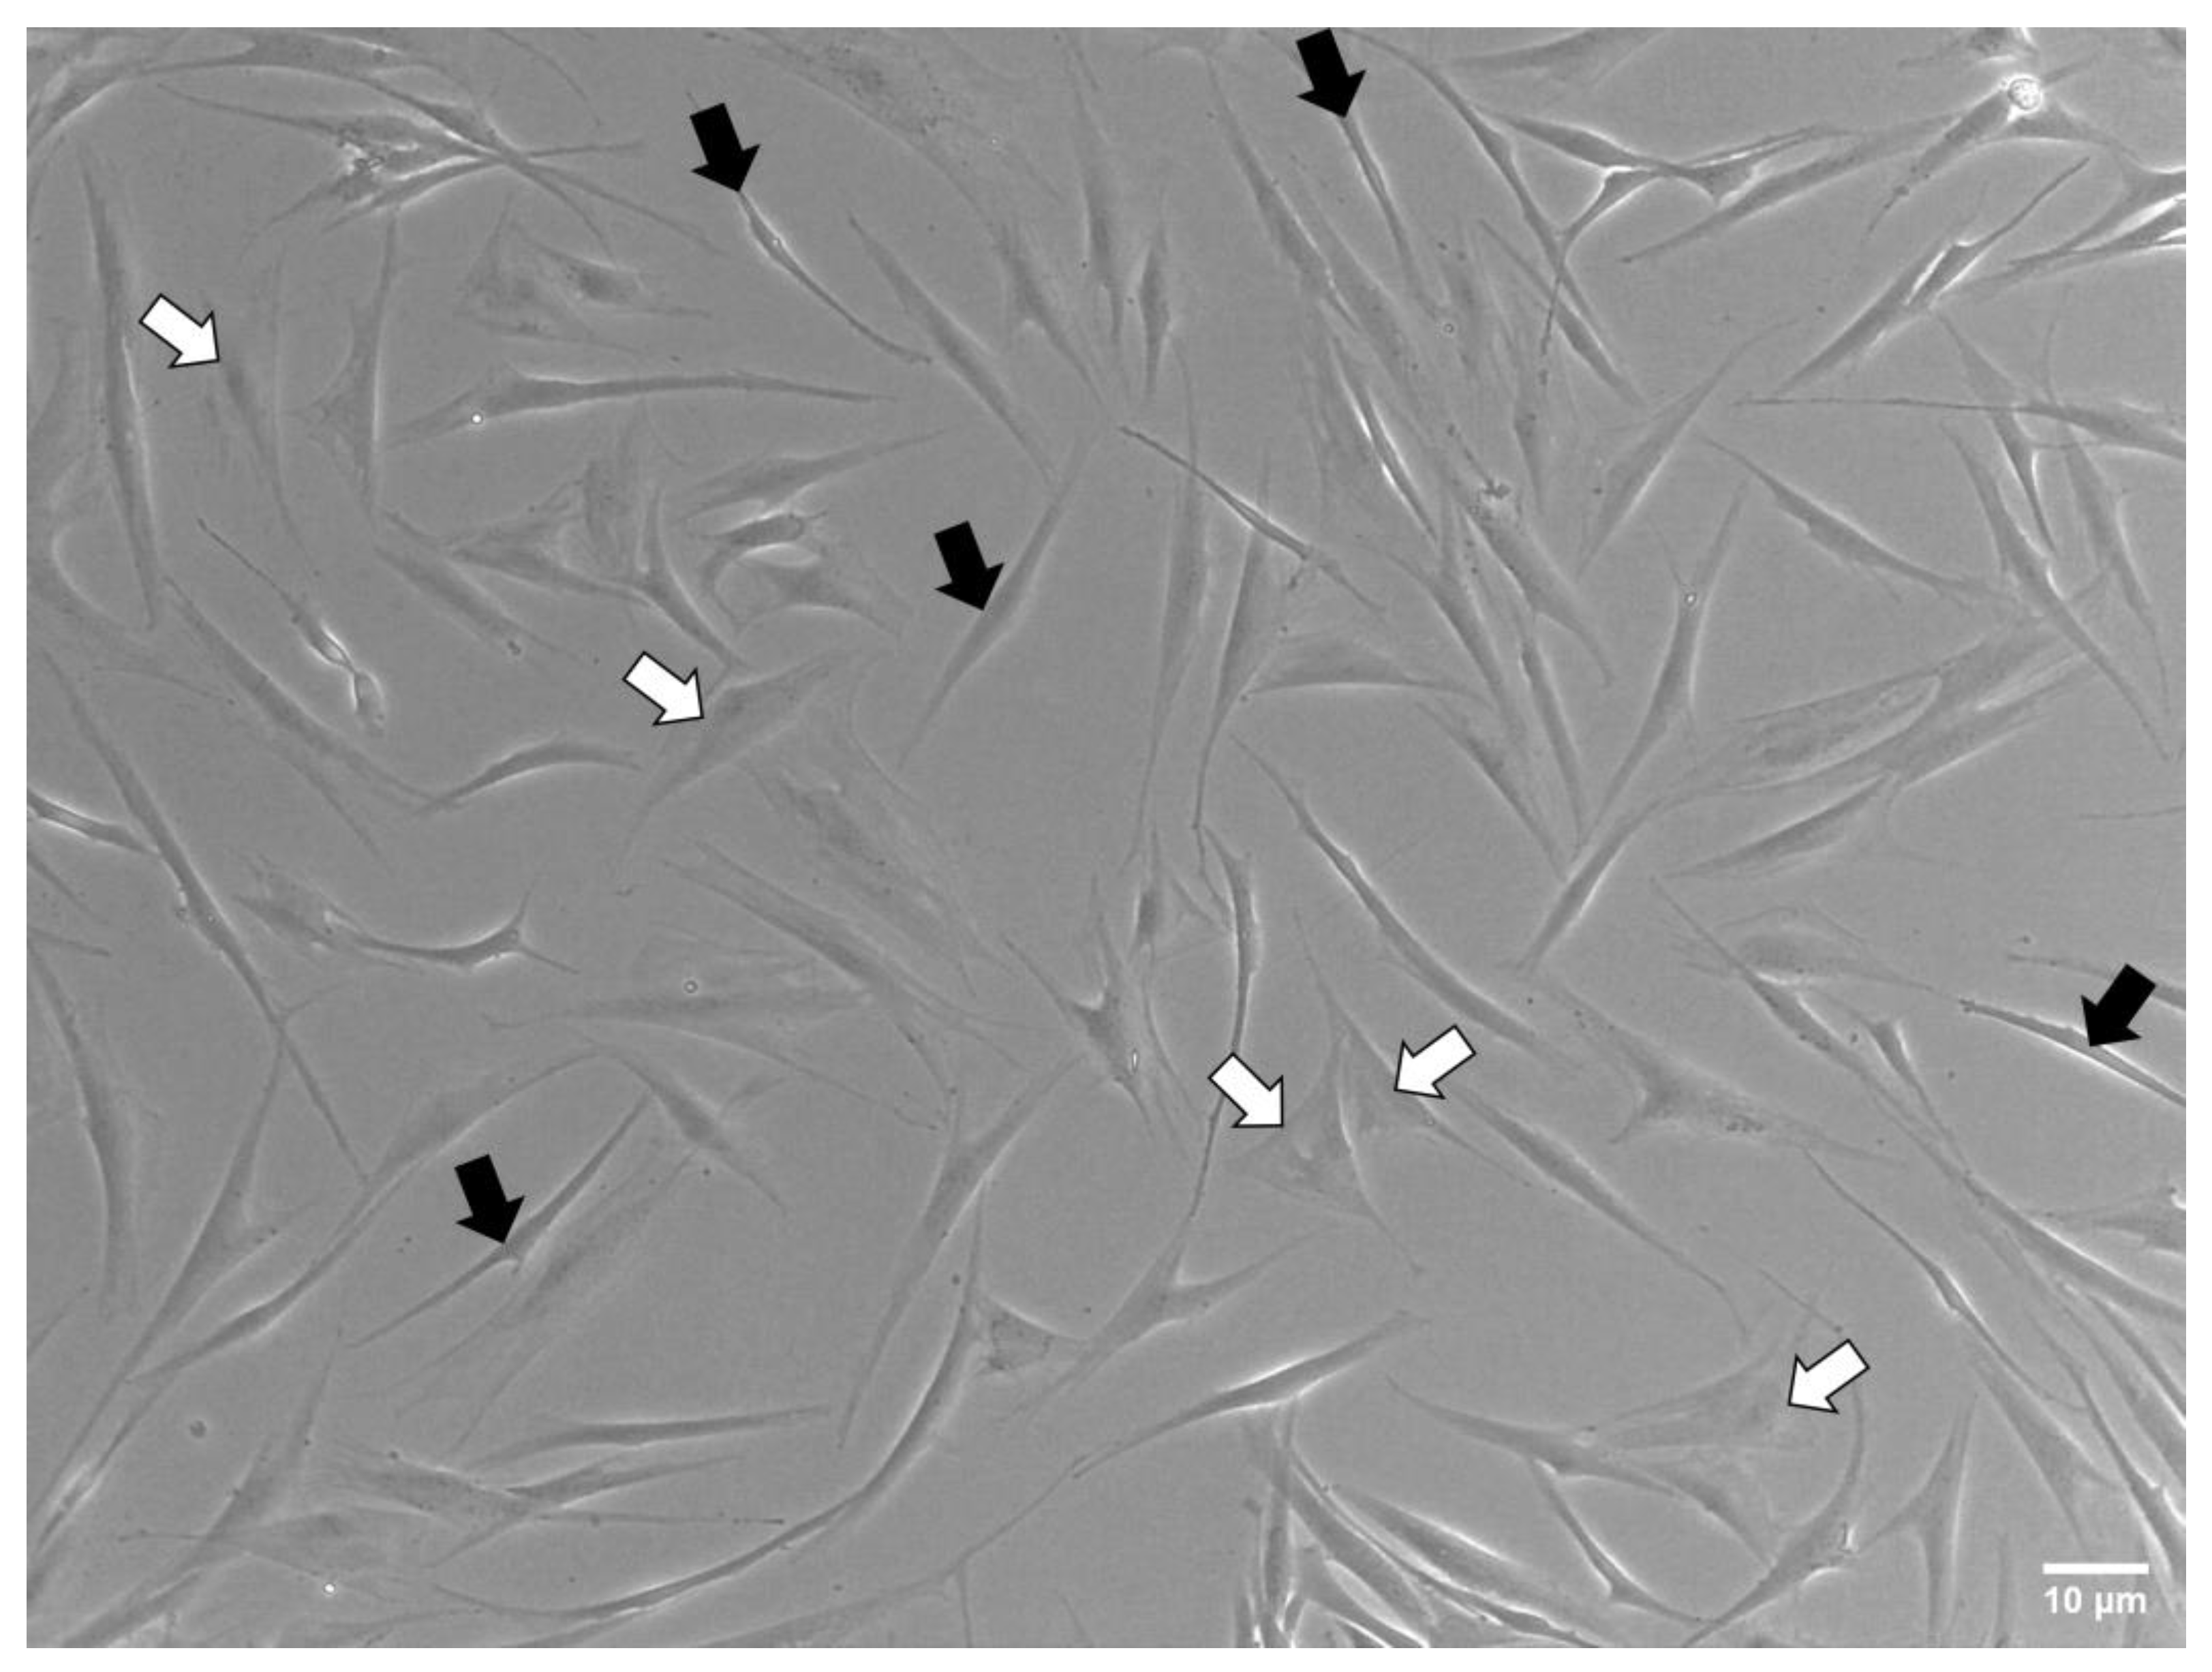
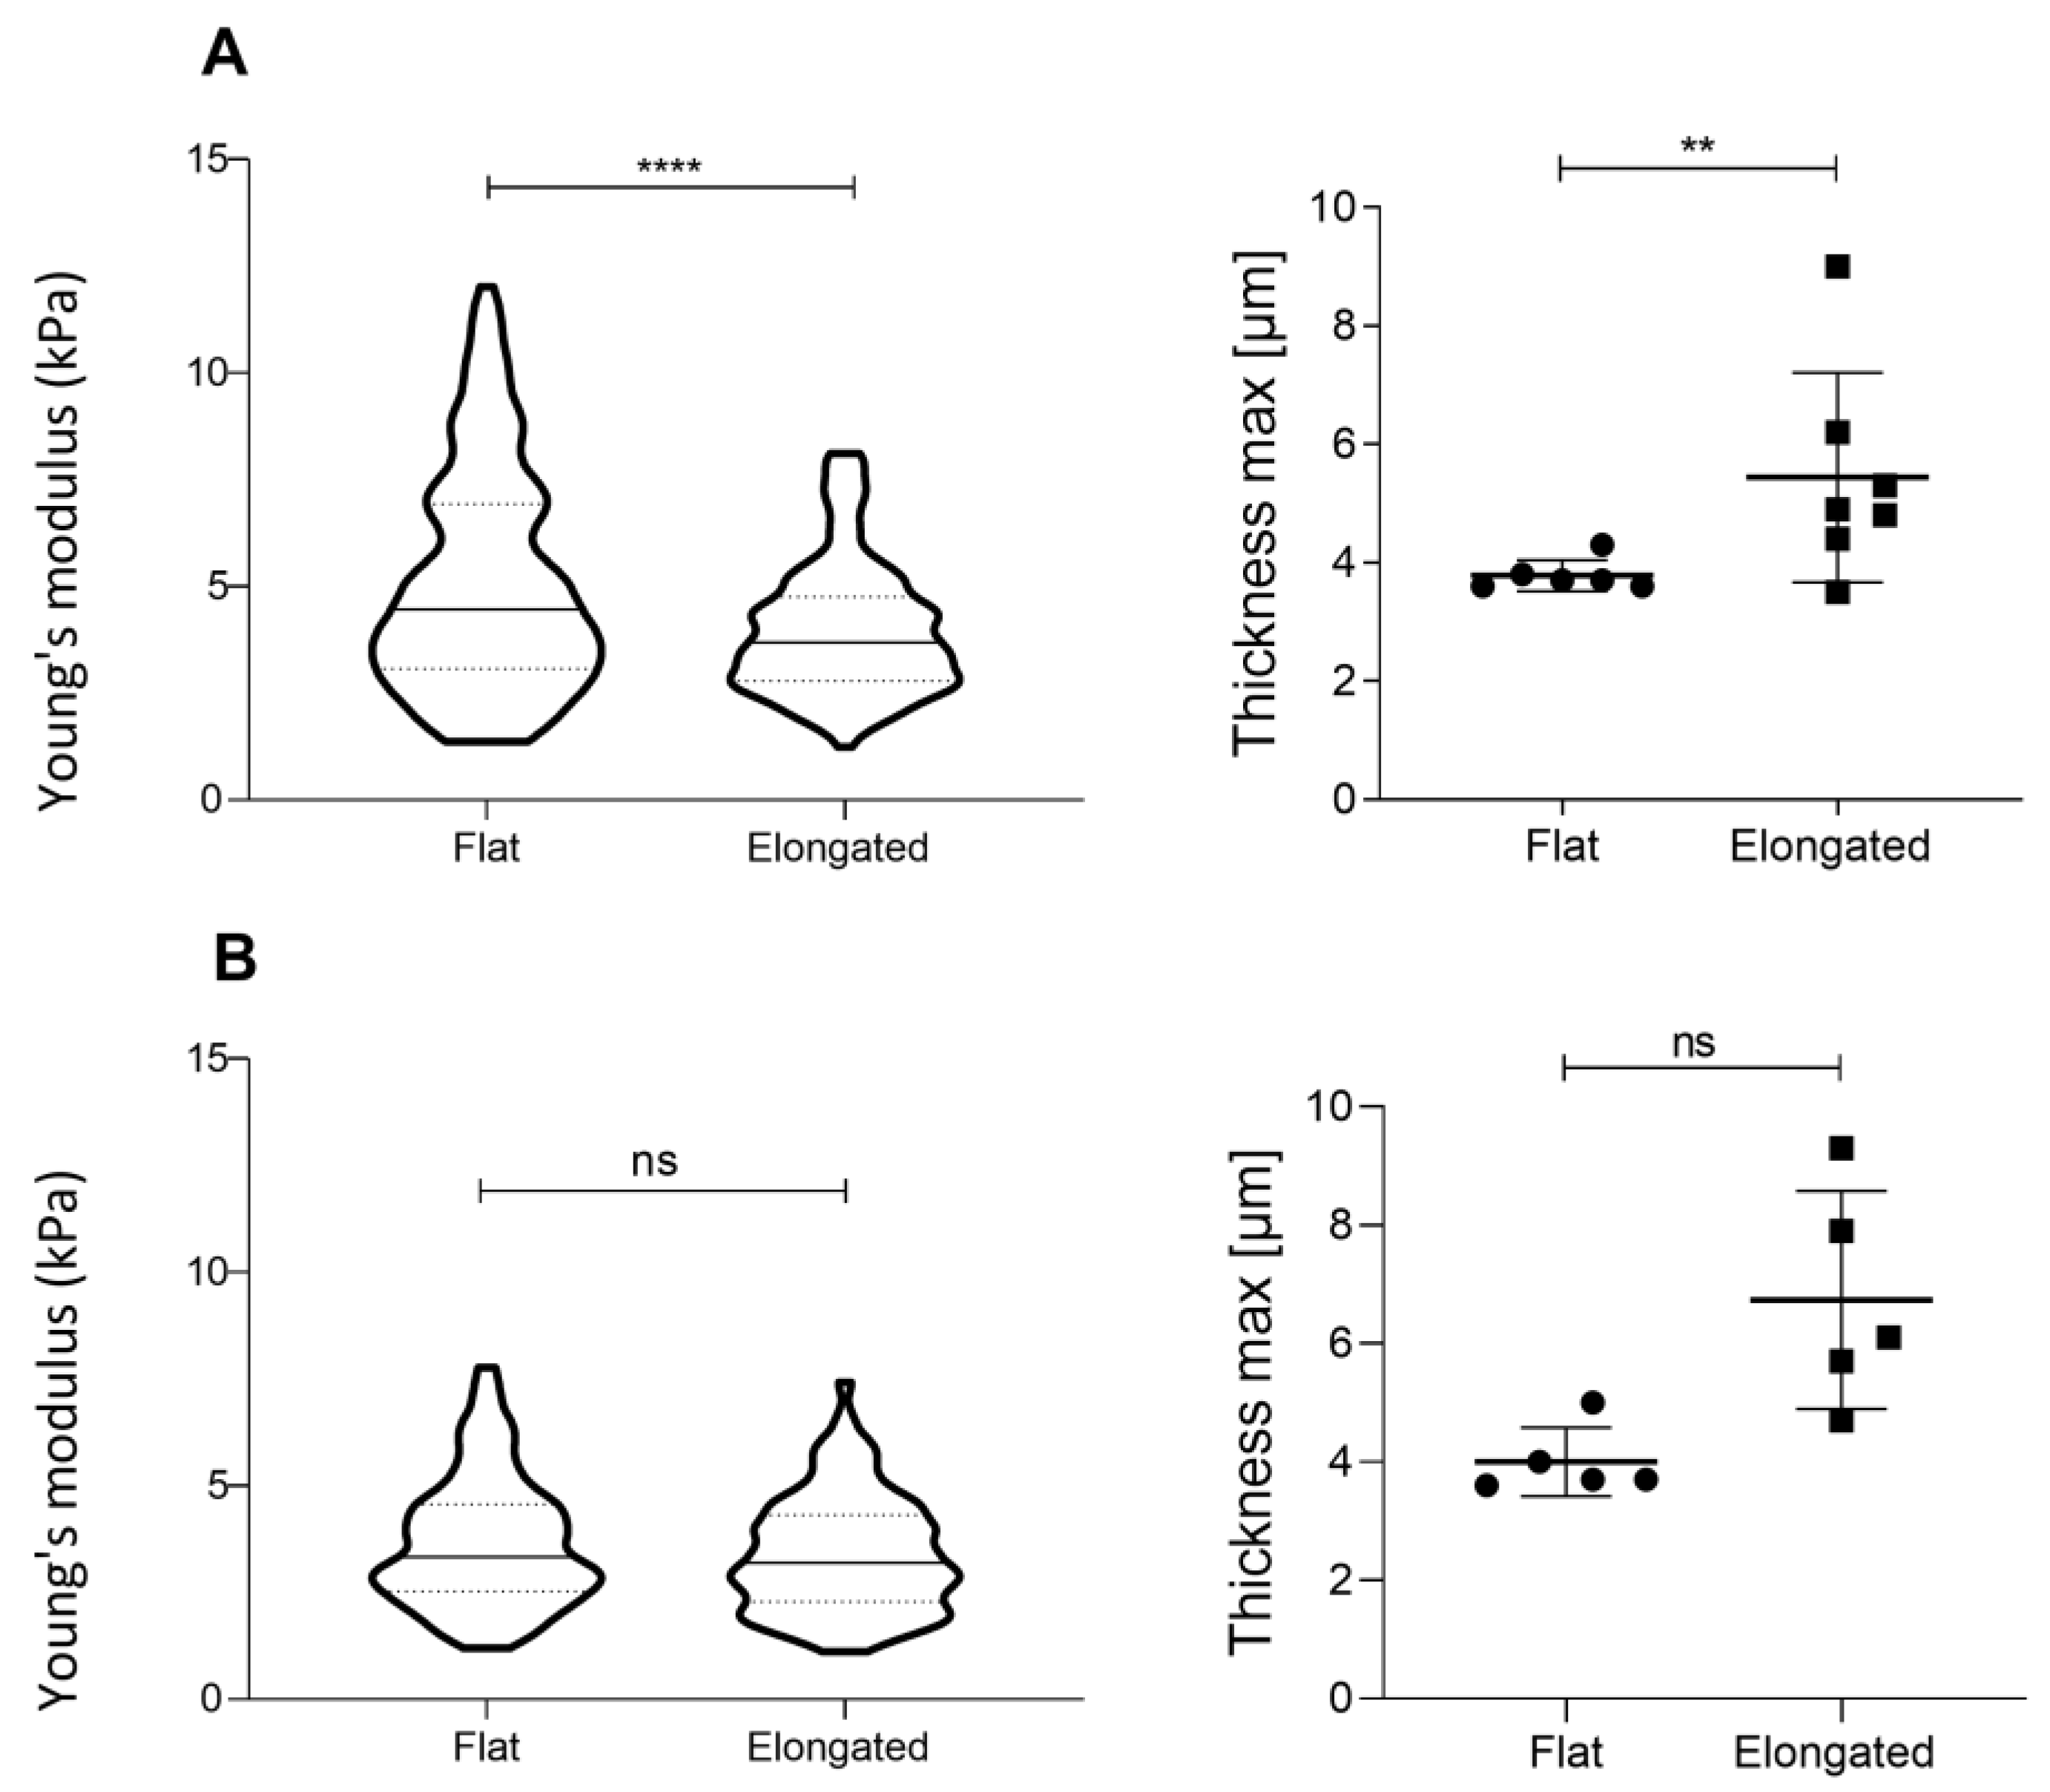
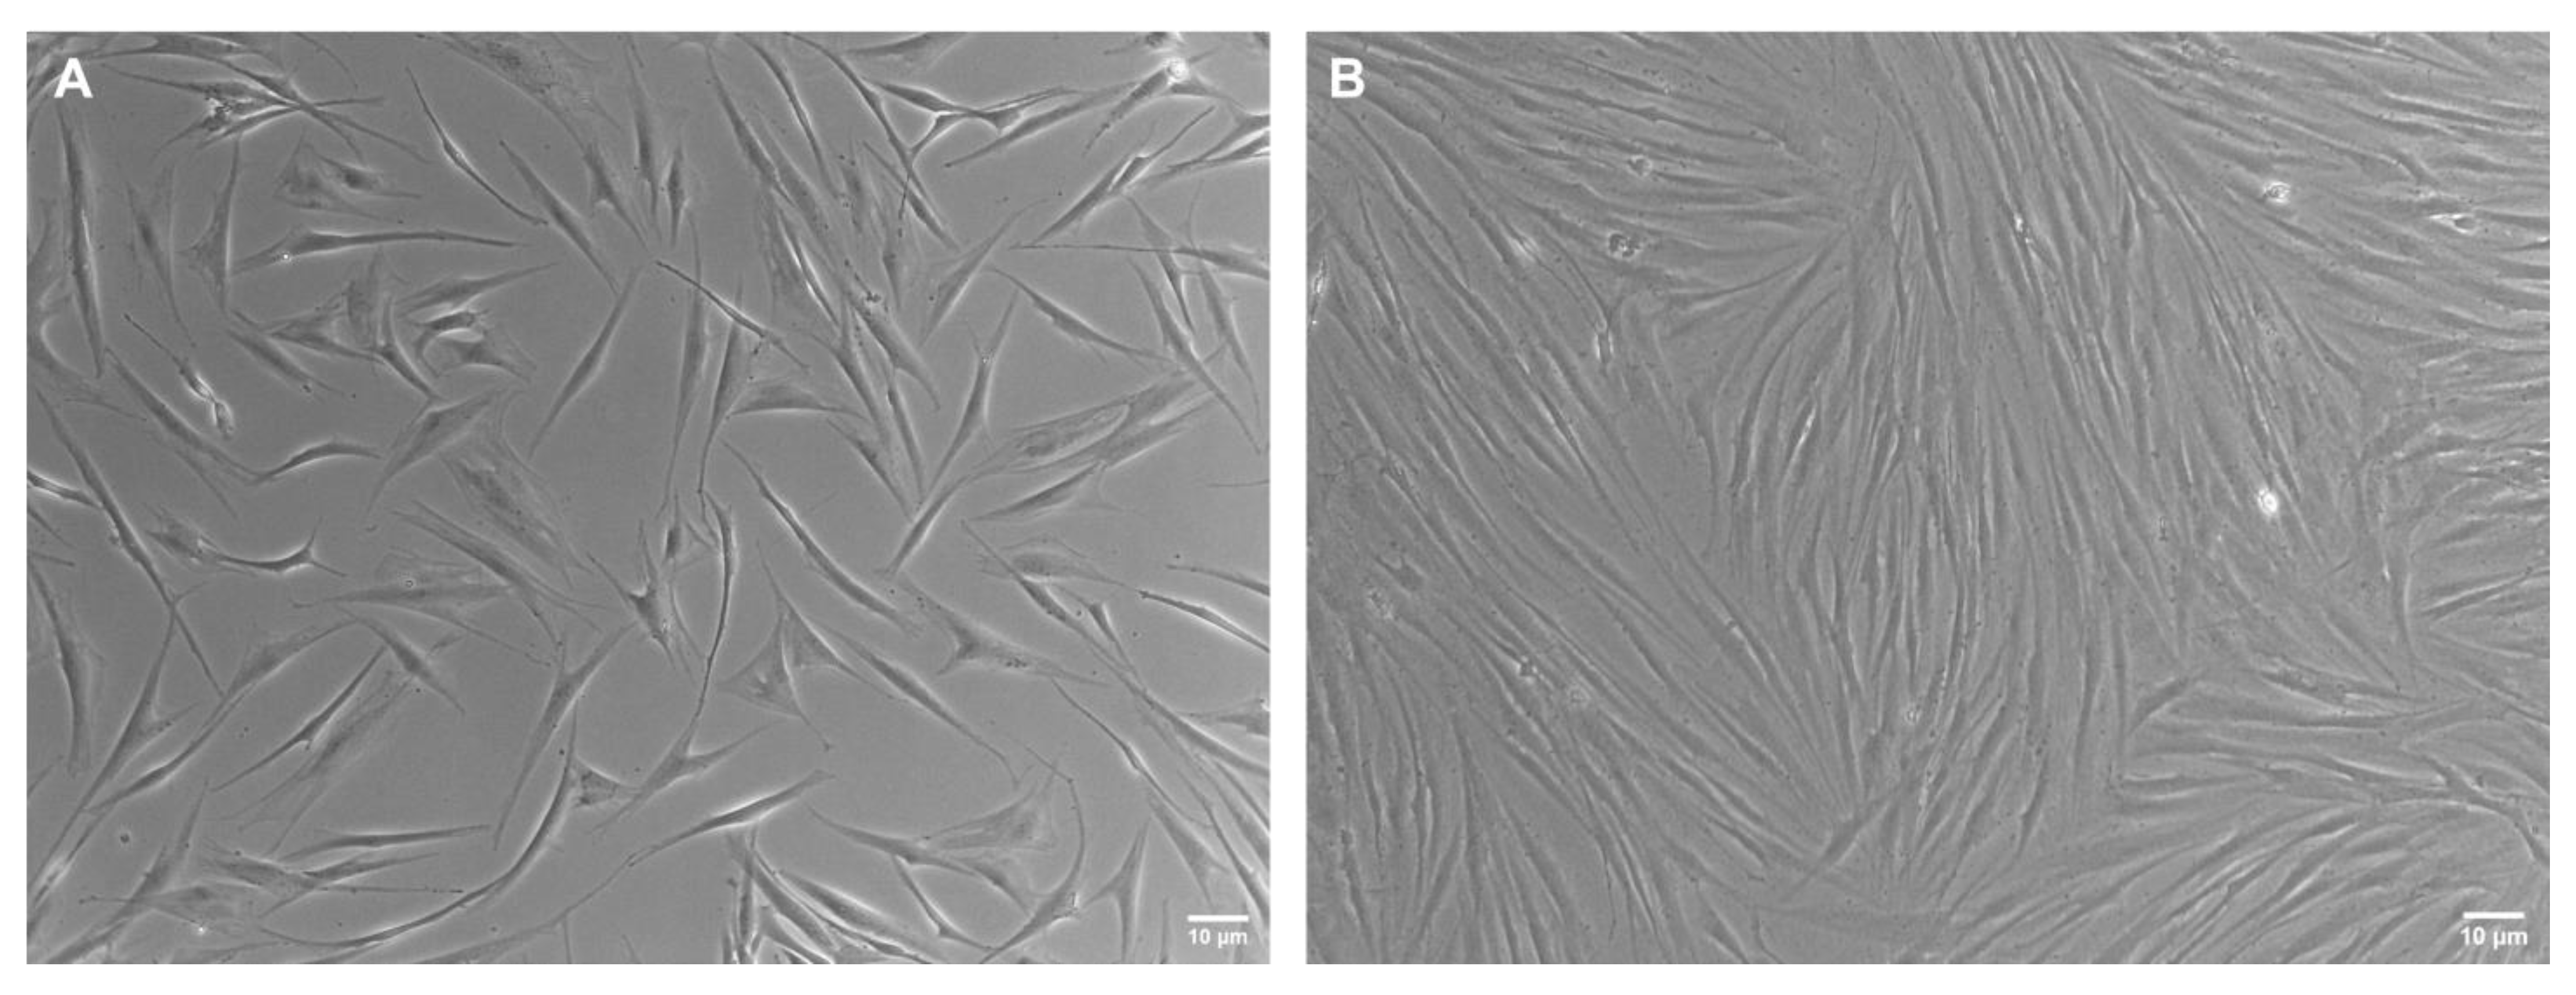
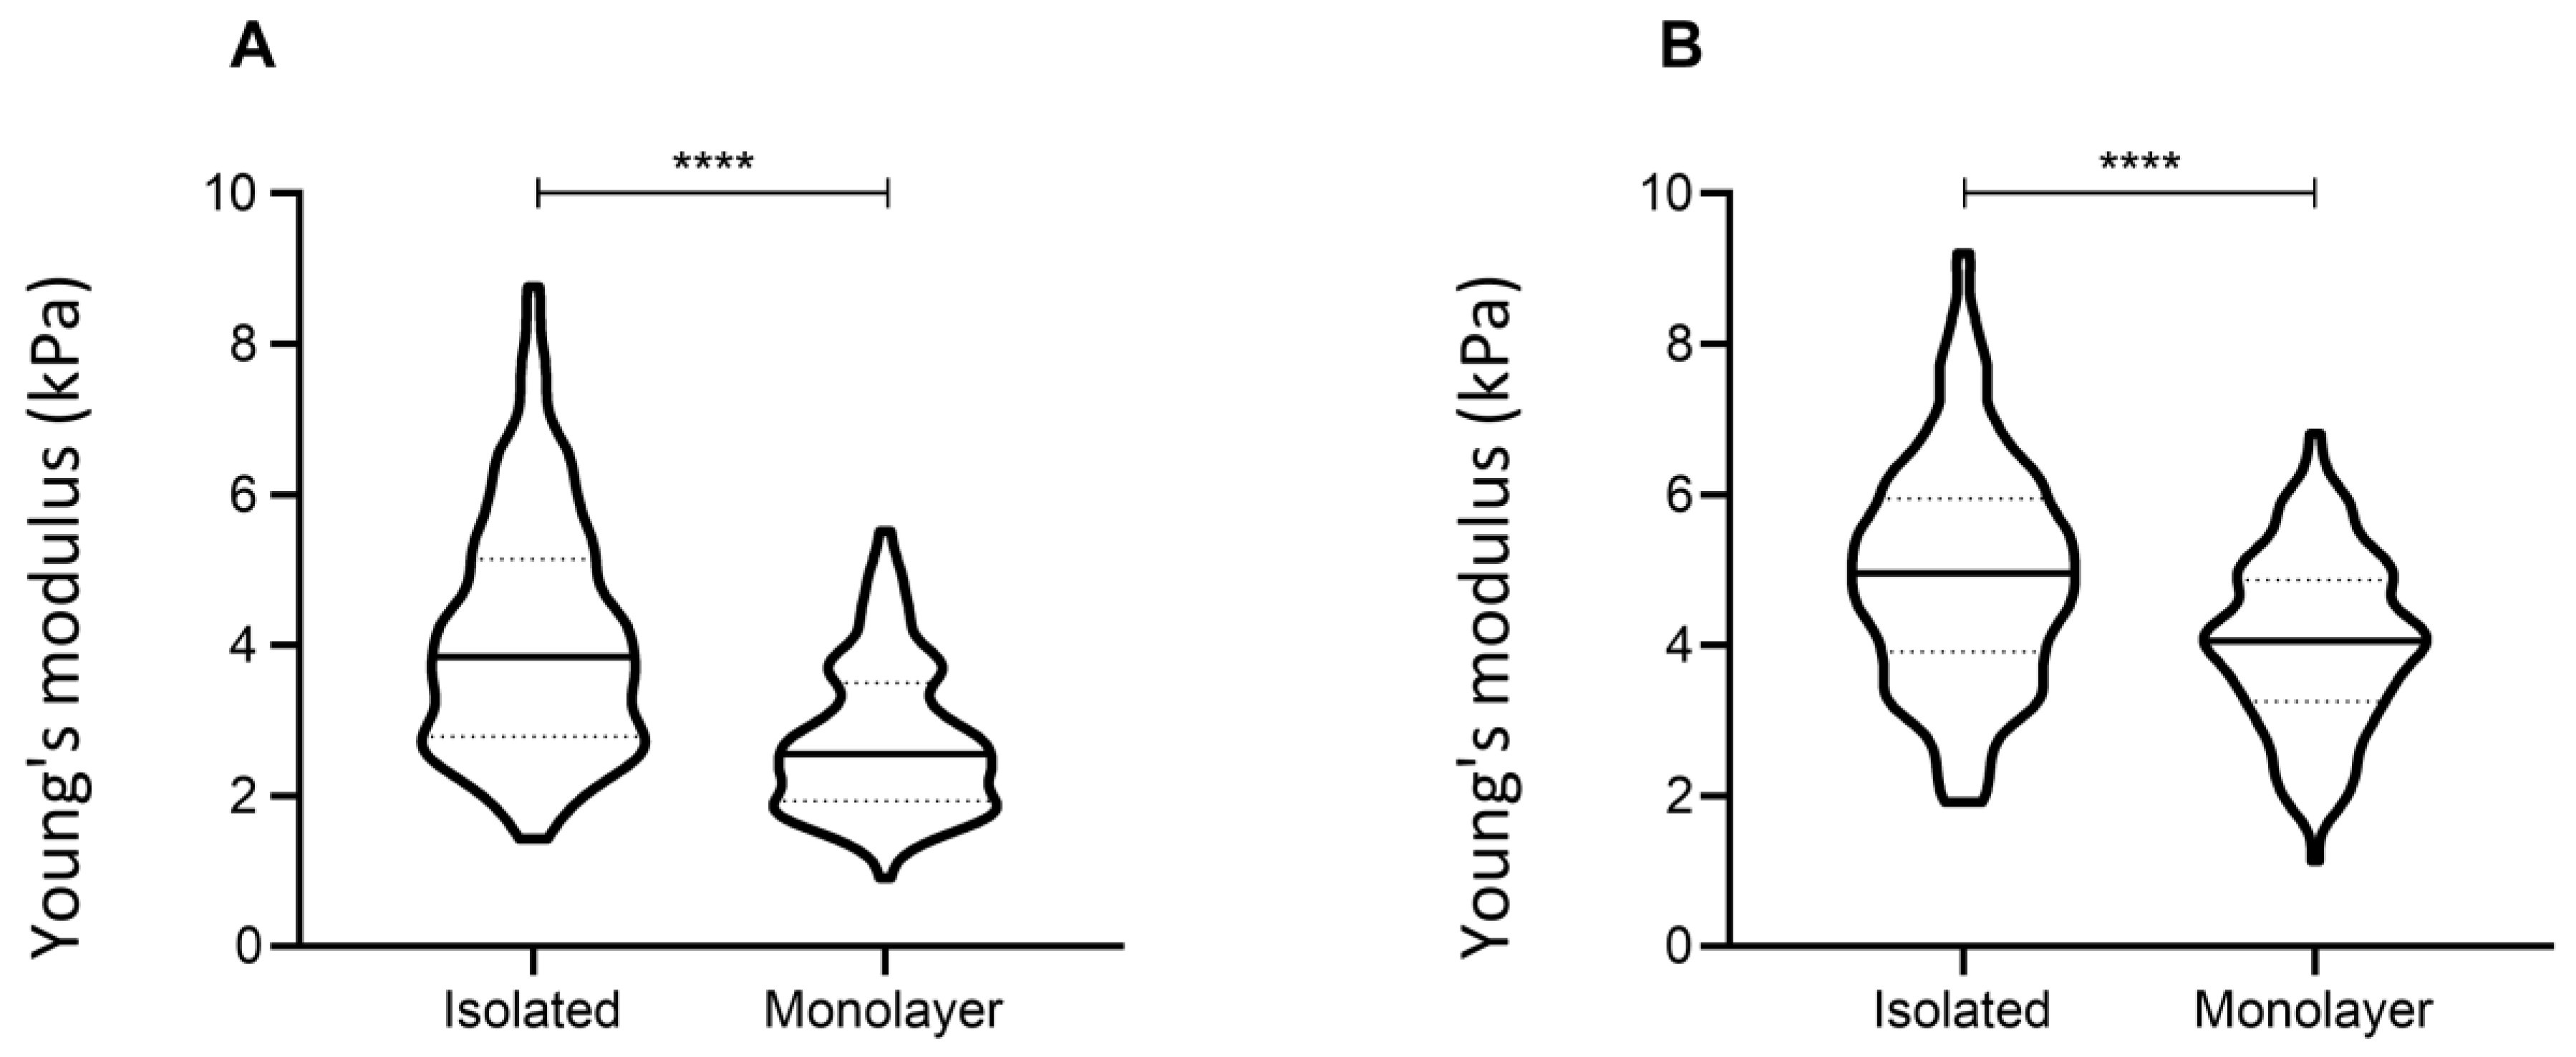
3.3. Cell Shape
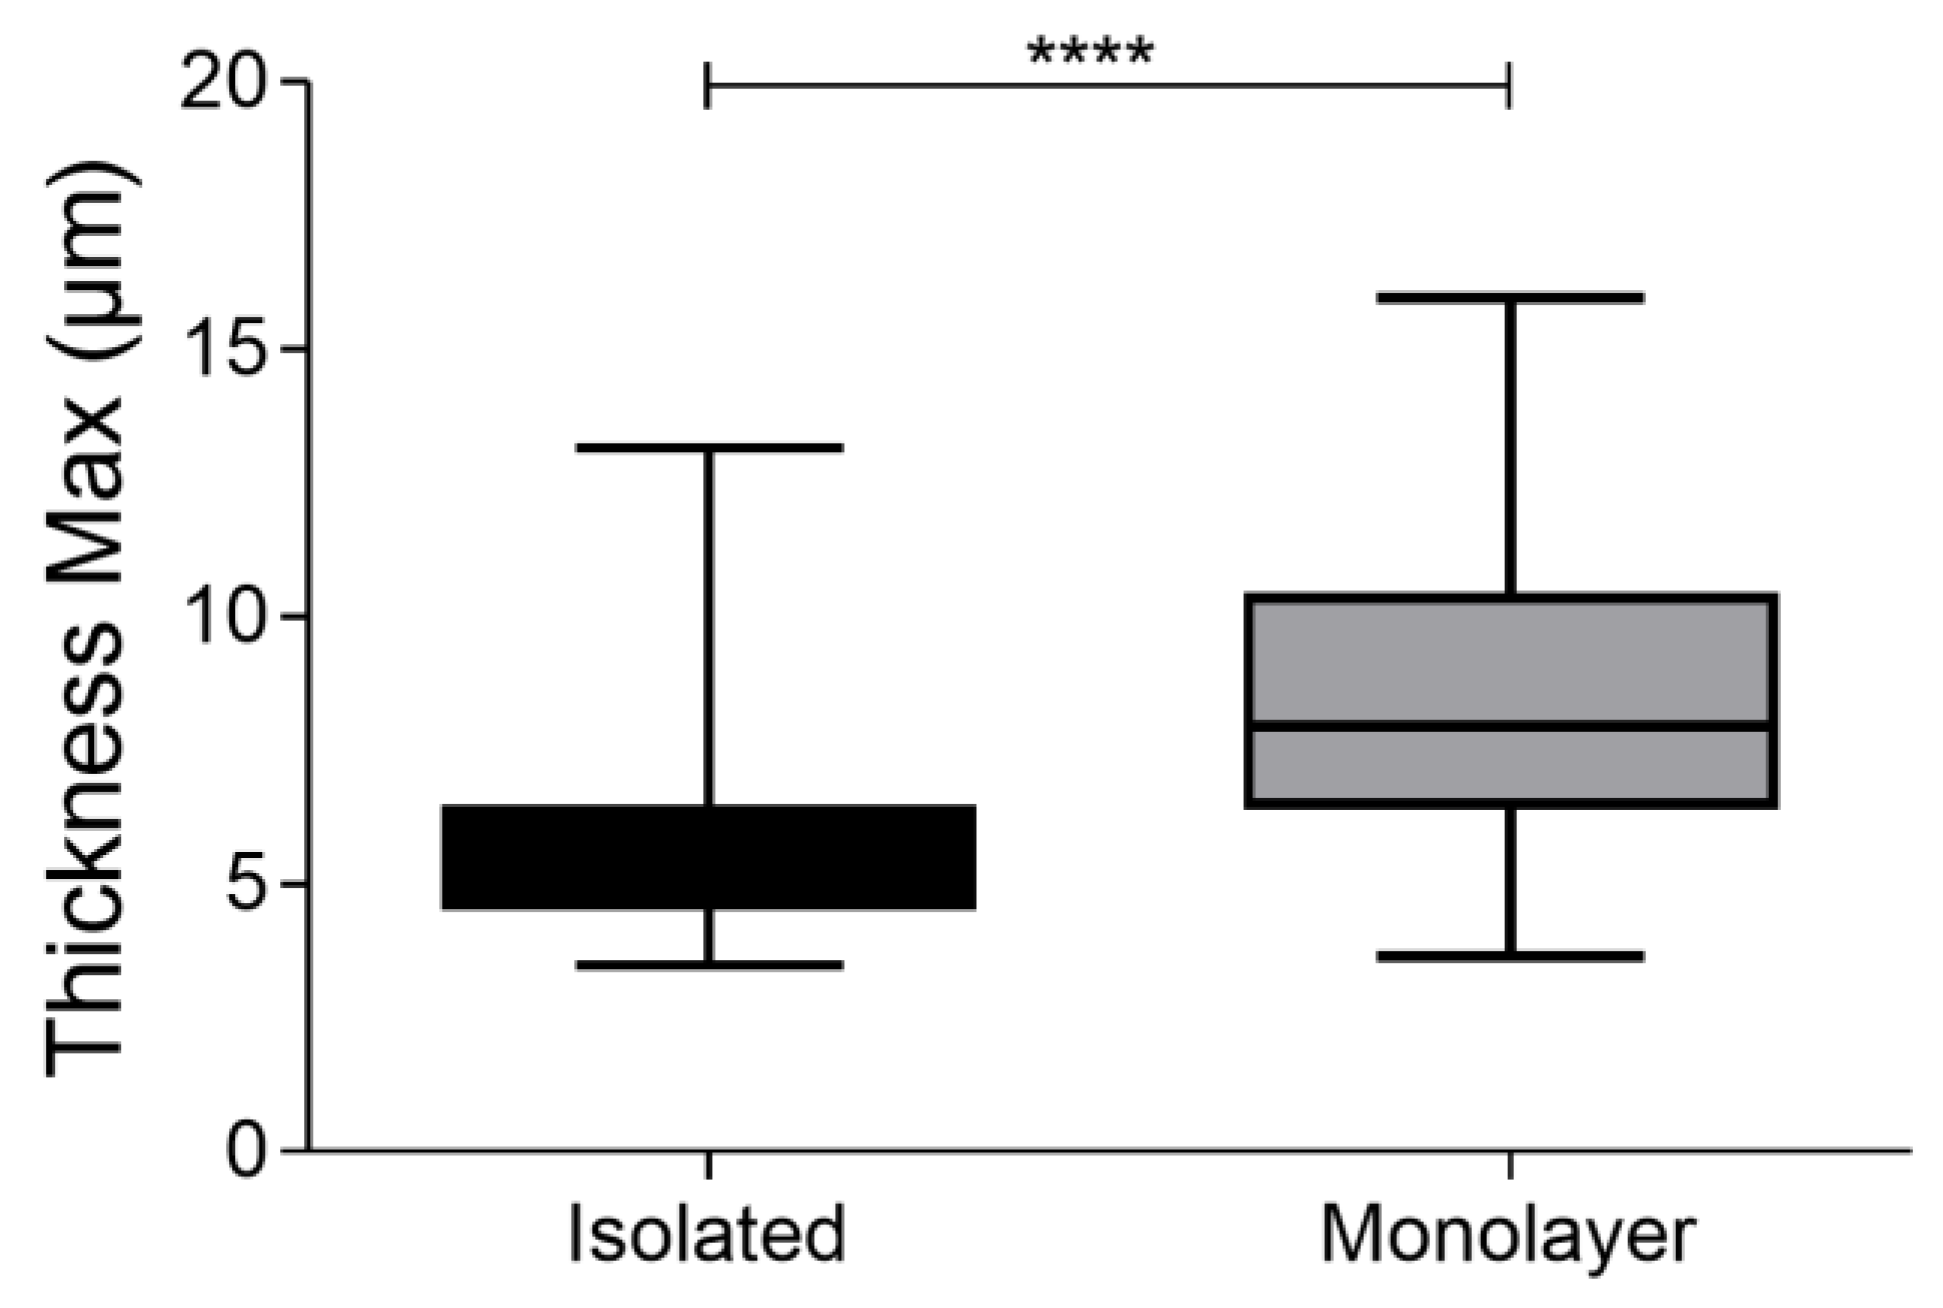
3.4. Confluency
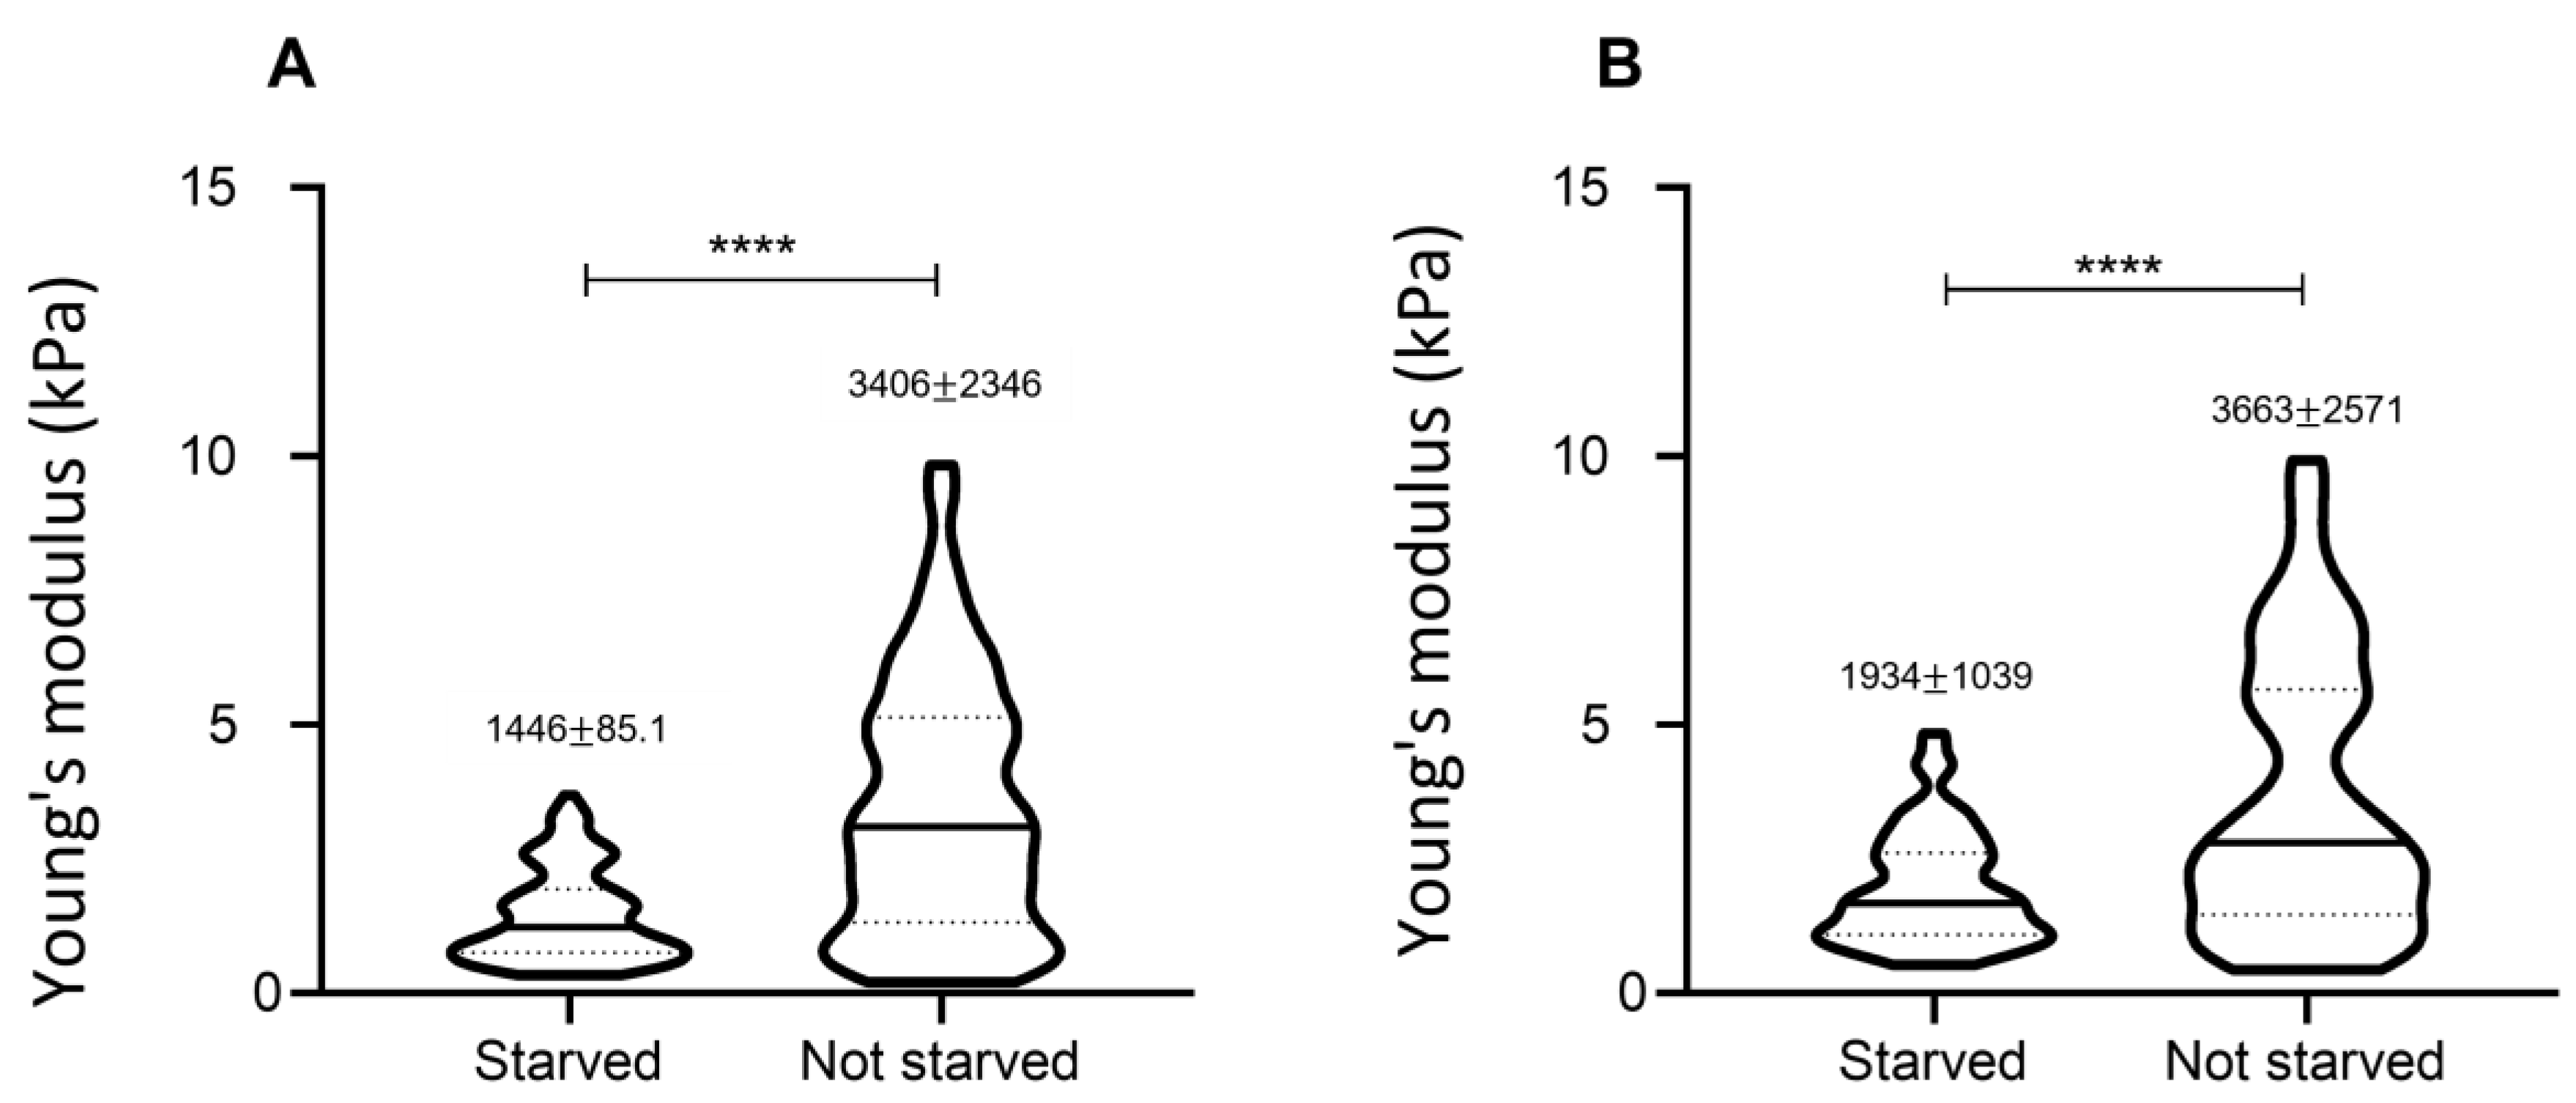
3.5. Effect of Starvation on Young’s Modulus Values
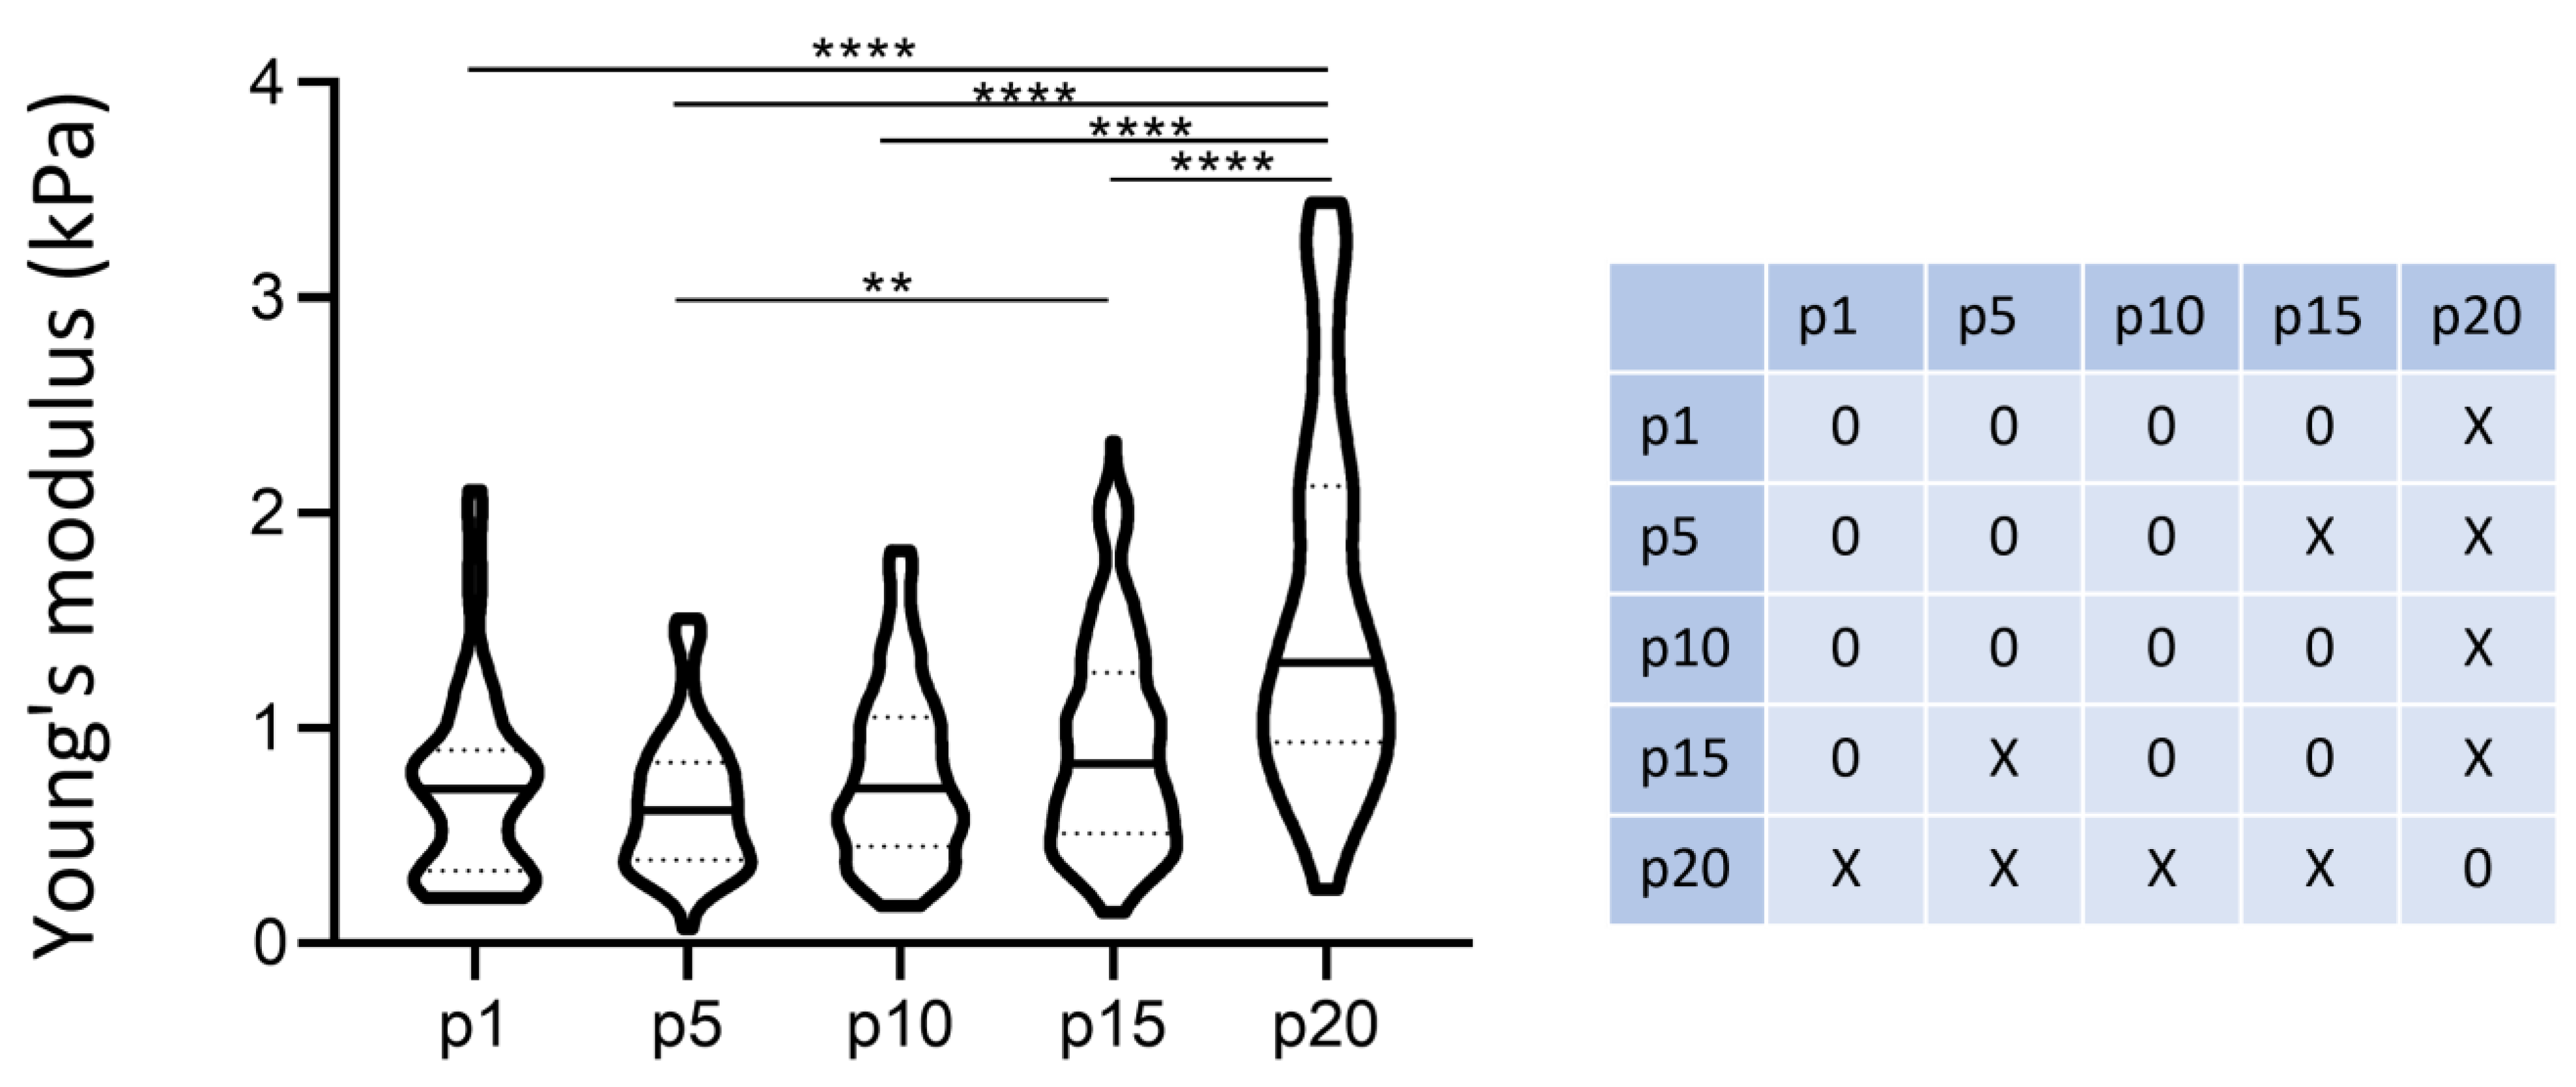
3.6. Number of Passages/Ageing
4. Conclusions
Author Contributions
Funding
Data Availability Statement
Acknowledgments
Conflicts of Interest
References
- Mao, X.; Gavara, N.; Song, G. Nuclear Mechanics and Stem Cell Differentiation. Stem Cell Rev. Rep. 2015, 11, 804–812. [Google Scholar] [CrossRef] [PubMed]
- Nelson, C.M. Mechanical Control of Cell Differentiation: Insights from the Early Embryo. Annu. Rev. Biomed. Eng. 2022, 24, 307–322. [Google Scholar] [CrossRef] [PubMed]
- Mierke, C.T. The matrix environmental and cell mechanical properties regulate cell migration and contribute to the invasive phenotype of cancer cells. Rep. Prog. Phys. 2019, 82, 064602. [Google Scholar] [CrossRef] [PubMed]
- Chala, N.; Moimas, S.; Giampietro, C.; Zhang, X.; Zambelli, T.; Exarchos, V.; Nazari-Shafti, T.Z.; Poulikakos, D.; Ferrari, A. Mechanical Fingerprint of Senescence in Endothelial Cells. Nano Lett. 2021, 21, 4911–4920. [Google Scholar] [CrossRef] [PubMed]
- Mierke, C.T. Viscoelasticity, Like Forces, Plays a Role in Mechanotransduction. Front. Cell Dev. Biol. 2022, 10, 789841. [Google Scholar] [CrossRef]
- Humphrey, J.D.; Dufresne, E.R.; Schwartz, M.A. Mechanotransduction and extracellular matrix homeostasis. Nat. Rev. Mol. Cell Biol. 2014, 15, 802–812. [Google Scholar] [CrossRef] [Green Version]
- Rianna, C.; Radmacher, M. Cell mechanics as a marker for diseases: Biomedical applications of AFM. AIP Conf. Proc. 2016, 1760, 020057. [Google Scholar] [CrossRef]
- Chen, J. Nanobiomechanics of living cells: A review. Interface Focus 2014, 4, 20130055. [Google Scholar] [CrossRef] [Green Version]
- Thomas, C.R.; Stenson, J.D.; Zhang, Z. Measuring the mechanical properties of single microbial cells. Adv. Biochem. Eng. Biotechnol. 2011, 124, 83–98. [Google Scholar] [CrossRef]
- Zemła, J.; Bobrowska, J.; Kubiak, A.; Zieliński, T.; Pabijan, J.; Pogoda, K.; Bobrowski, P.; Lekka, M. Indenting soft samples (hydrogels and cells) with cantilevers possessing various shapes of probing tip. Eur. Biophys. J. 2020, 49, 485–495. [Google Scholar] [CrossRef]
- Chavan, D.; Van De Watering, T.C.; Gruca, G.; Rector, J.H.; Heeck, K.; Slaman, M.; Iannuzzi, D. Ferrule-top nanoindenter: An optomechanical fiber sensor for nanoindentation. Rev. Sci. Instrum. 2012, 83, 115110. [Google Scholar] [CrossRef] [Green Version]
- Ciccone, G.; Gonzalez Oliva, M.A.; Antonovaite, N.; Lüchtefeld, I.; Sanchez, M.S.; Vassalli, M. Experimental and Data Analysis Workflow for Soft Matter Nanoindentation. J. Vis. Exp. 2022, 2022, e63401. [Google Scholar] [CrossRef]
- Wu, P.H.; Aroush, D.R.B.; Asnacios, A.; Chen, W.C.; Dokukin, M.E.; Doss, B.L.; Durand-Smet, P.; Ekpenyong, A.; Guck, J.; Guz, N.V.; et al. A comparison of methods to assess cell mechanical properties. Nat. Methods 2018, 15, 491–498. [Google Scholar] [CrossRef]
- Schillers, H.; Rianna, C.; Schäpe, J.; Luque, T.; Doschke, H.; Wälte, M.; Uriarte, J.J.; Campillo, N.; Michanetzis, G.P.A.; Bobrowska, J.; et al. Standardized Nanomechanical Atomic Force Microscopy Procedure (SNAP) for Measuring Soft and Biological Samples. Sci. Rep. 2017, 7, 5117. [Google Scholar] [CrossRef] [Green Version]
- Guz, N.; Dokukin, M.; Kalaparthi, V.; Sokolov, I. If Cell Mechanics Can Be Described by Elastic Modulus: Study of Different Models and Probes Used in Indentation Experiments. Biophys. J. 2014, 107, 564–575. [Google Scholar] [CrossRef] [Green Version]
- Hassan, E.; Heinz, W.F.; Antonik, M.D.; D’Costa, N.P.; Nageswaran, S.; Schoenenberger, C.A.; Hoh, J.H. Relative microelastic mapping of living cells by atomic force microscopy. Biophys. J. 1998, 74, 1564–1578. [Google Scholar] [CrossRef] [Green Version]
- Baldini, F.; Bartolozzi, A.; Ardito, M.; Voci, A.; Portincasa, P.; Vassalli, M.; Vergani, L. Biomechanics of cultured hepatic cells during different steatogenic hits. J. Mech. Behav. Biomed. Mater. 2019, 97, 296–305. [Google Scholar] [CrossRef]
- Bartolozzi, A.; Viti, F.; De Stefano, S.; Sbrana, F.; Petecchia, L.; Gavazzo, P.; Vassalli, M. Development of label-free biophysical markers in osteogenic maturation. J. Mech. Behav. Biomed. Mater. 2020, 103, 103581. [Google Scholar] [CrossRef]
- Hertz, H. Über die Berührung fester elastischer Körper. J. Für Die Reine Und Angew. Math. 1881, 92, 156–171. [Google Scholar]
- Manika, I.; Maniks, J. Effect of substrate hardness and film structure on indentation depth criteria for film hardness testing. J. Phys. D Appl. Phys. 2008, 41, 074010. [Google Scholar] [CrossRef]
- Lee, K.R.; Kim, K.; Jung, J.; Heo, J.H.; Cho, S.; Lee, S.; Chang, G.; Jo, Y.J.; Park, H.; Park, Y.K. Quantitative phase imaging techniques for the study of cell pathophysiology: From principles to applications. Sensors 2013, 13, 4170–4191. [Google Scholar] [CrossRef] [PubMed] [Green Version]
- Schürmann, M.; Scholze, J.; Müller, P.; Chan, C.J.; Ekpenyong, A.E.; Chalut, K.J.; Guck, J. Refractive index measurements of single, spherical cells using digital holographic microscopy. Methods Cell Biol. 2015, 125, 143–159. [Google Scholar] [CrossRef] [PubMed] [Green Version]
- Schakenraad, K.; Ernst, J.; Pomp, W.; Danen, E.H.J.; Merks, R.M.H.; Schmidt, T.; Giomi, L. Mechanical interplay between cell shape and actin cytoskeleton organization. Soft Matter 2020, 16, 6328–6343. [Google Scholar] [CrossRef]
- Huebner, R.J.; Malmi-Kakkada, A.N.; Sarıkaya, S.; Weng, S.; Thirumalai, D.; Wallingford, J.B. Mechanical heterogeneity along single cell-cell junctions is driven by lateral clustering of cadherins during vertebrate axis elongation. eLife 2021, 10, e65390. [Google Scholar] [CrossRef] [PubMed]
- Han, S.J.; Bielawski, K.S.; Ting, L.H.; Rodriguez, M.L.; Sniadecki, N.J. Decoupling substrate stiffness, spread area, and micropost density: A close spatial relationship between traction forces and focal adhesions. Biophys. J. 2012, 103, 640–648. [Google Scholar] [CrossRef] [Green Version]
- Gupta, V.K.; Chaudhuri, O. Mechanical regulation of cell-cycle progression and division. Trends Cell Biol. 2022, 32, 773–785. [Google Scholar] [CrossRef]
- Clark, A.G.; Paluch, E. Mechanics and regulation of cell shape during the cell cycle. Results Probl. Cell Differ. 2011, 53, 31–73. [Google Scholar] [PubMed]
- Taubenberger, A.V.; Baum, B.; Matthews, H.K. The Mechanics of Mitotic Cell Rounding. Front. Cell Dev. Biol. 2020, 8, 687. [Google Scholar] [CrossRef] [PubMed]
- Guck, J. Some thoughts on the future of cell mechanics. Biophys. Rev. 2019, 11, 667–670. [Google Scholar] [CrossRef]


Disclaimer/Publisher’s Note: The statements, opinions and data contained in all publications are solely those of the individual author(s) and contributor(s) and not of MDPI and/or the editor(s). MDPI and/or the editor(s) disclaim responsibility for any injury to people or property resulting from any ideas, methods, instructions or products referred to in the content. |
© 2023 by the authors. Licensee MDPI, Basel, Switzerland. This article is an open access article distributed under the terms and conditions of the Creative Commons Attribution (CC BY) license (https://creativecommons.org/licenses/by/4.0/).
Share and Cite
Zambito, M.; Viti, F.; Bosio, A.G.; Ceccherini, I.; Florio, T.; Vassalli, M. The Impact of Experimental Conditions on Cell Mechanics as Measured with Nanoindentation. Nanomaterials 2023, 13, 1190. https://doi.org/10.3390/nano13071190
Zambito M, Viti F, Bosio AG, Ceccherini I, Florio T, Vassalli M. The Impact of Experimental Conditions on Cell Mechanics as Measured with Nanoindentation. Nanomaterials. 2023; 13(7):1190. https://doi.org/10.3390/nano13071190
Chicago/Turabian StyleZambito, Martina, Federica Viti, Alessia G. Bosio, Isabella Ceccherini, Tullio Florio, and Massimo Vassalli. 2023. "The Impact of Experimental Conditions on Cell Mechanics as Measured with Nanoindentation" Nanomaterials 13, no. 7: 1190. https://doi.org/10.3390/nano13071190