
Determination of Hydrophobic Dispersive Surface Free Energy of Activated Carbon Fibers Measured by Inverse Gas Chromatographic Technique
Abstract
:
1. Introduction
2. Experimental
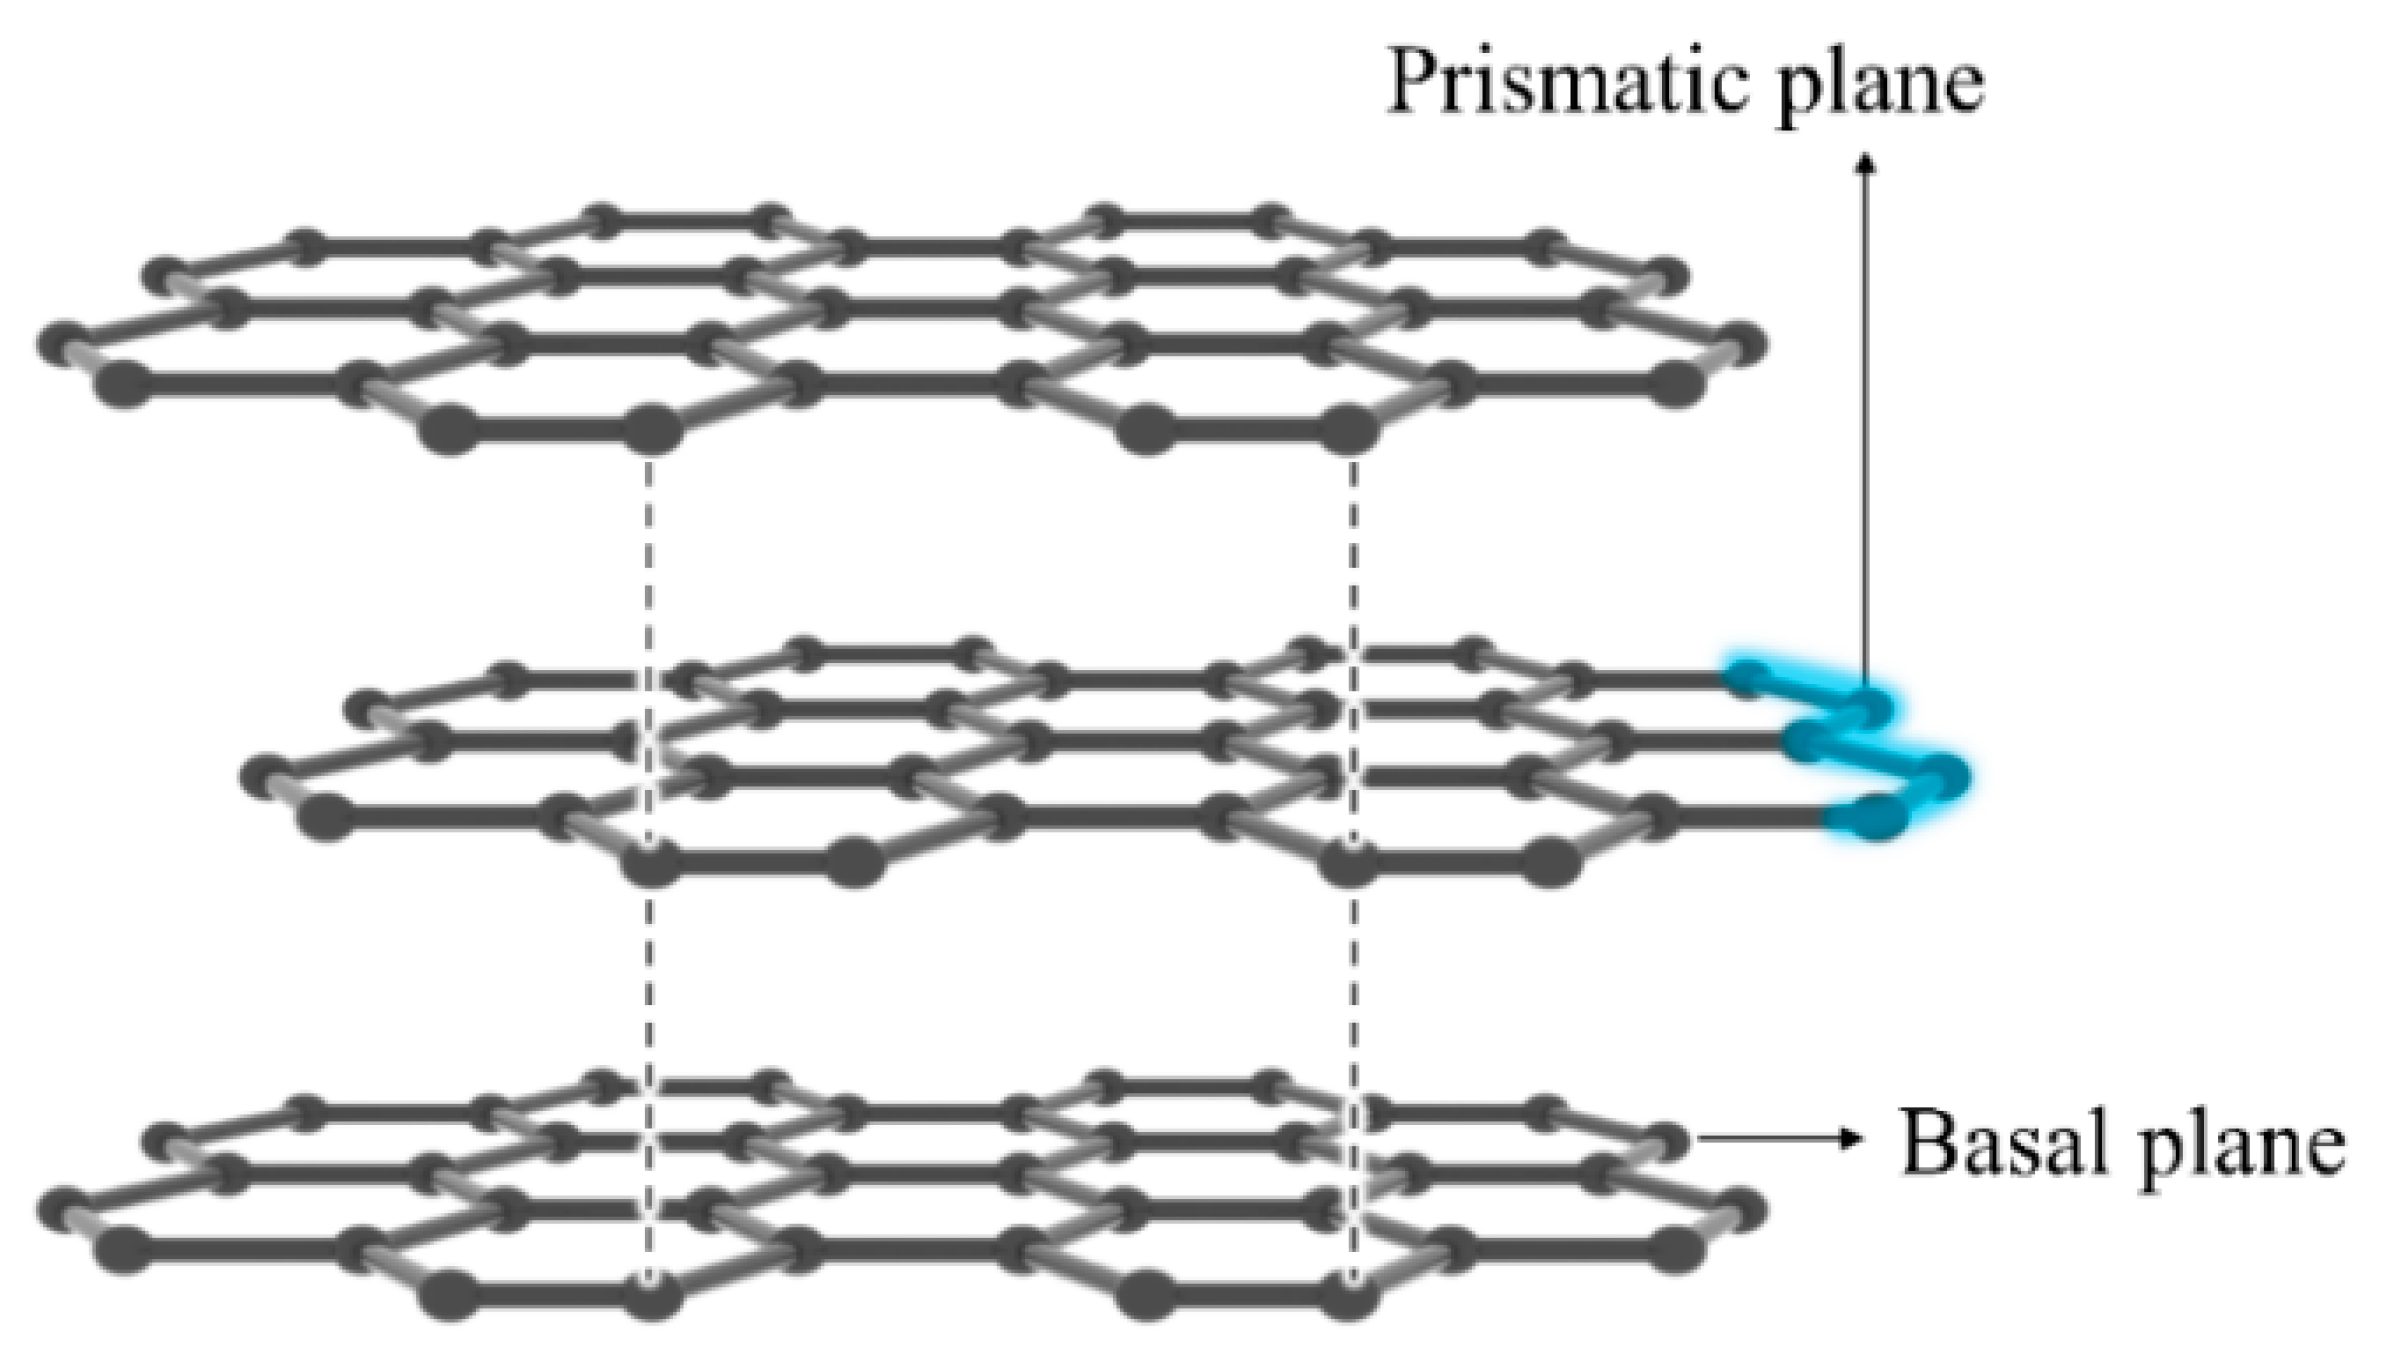
2.1. Materials
2.2. Textural Properties
2.3. IGC Measurements
3. Results and Discussions
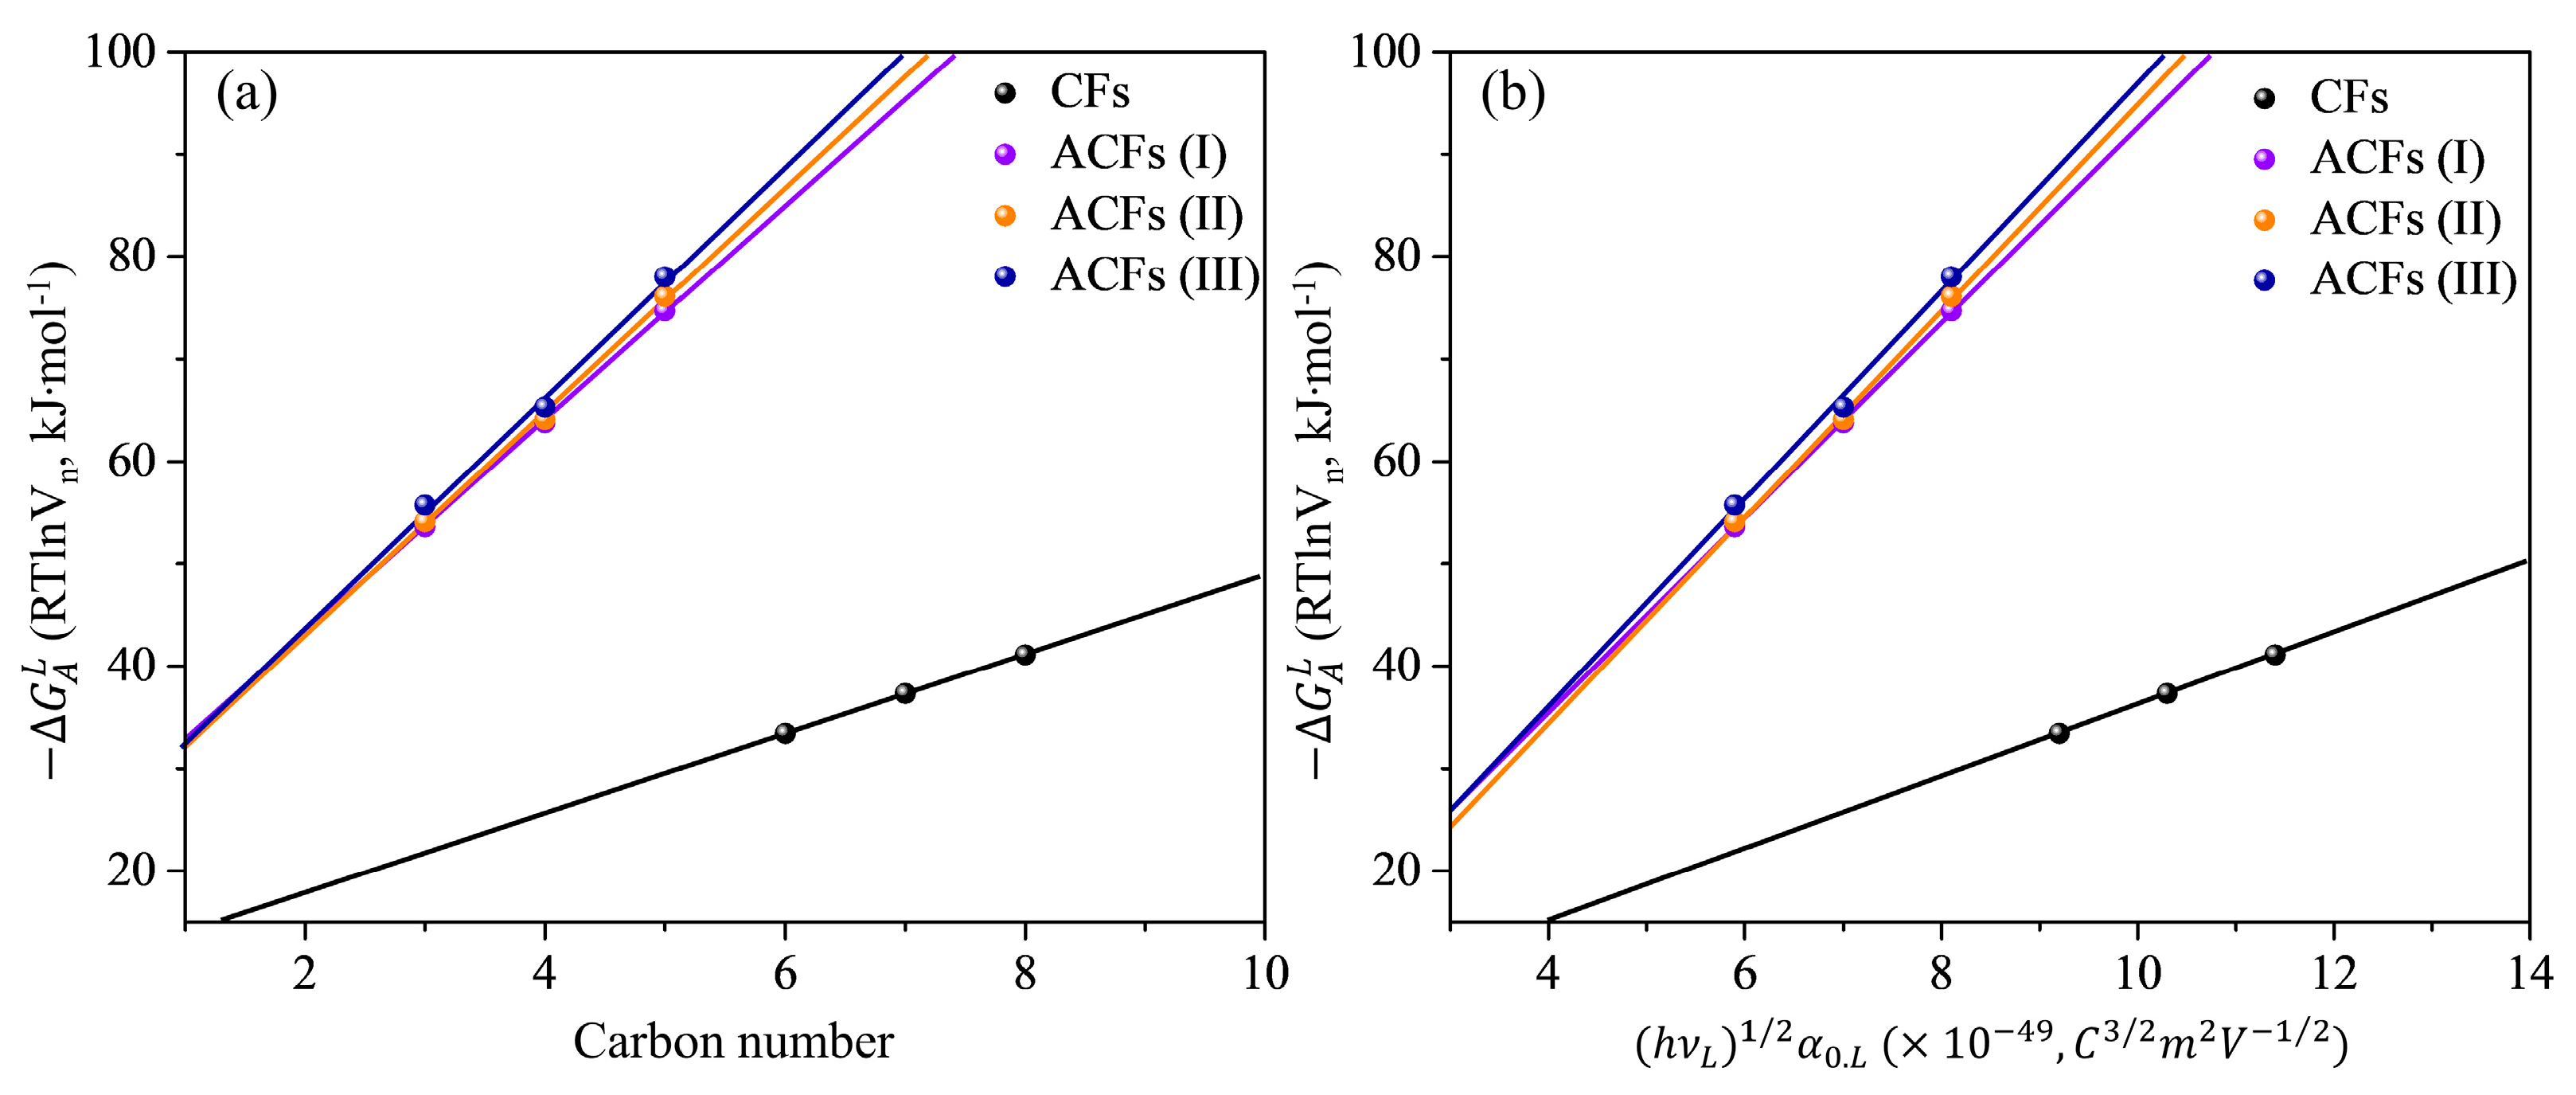
3.1. Inverse Gas Chromatography at Infinite Dilution
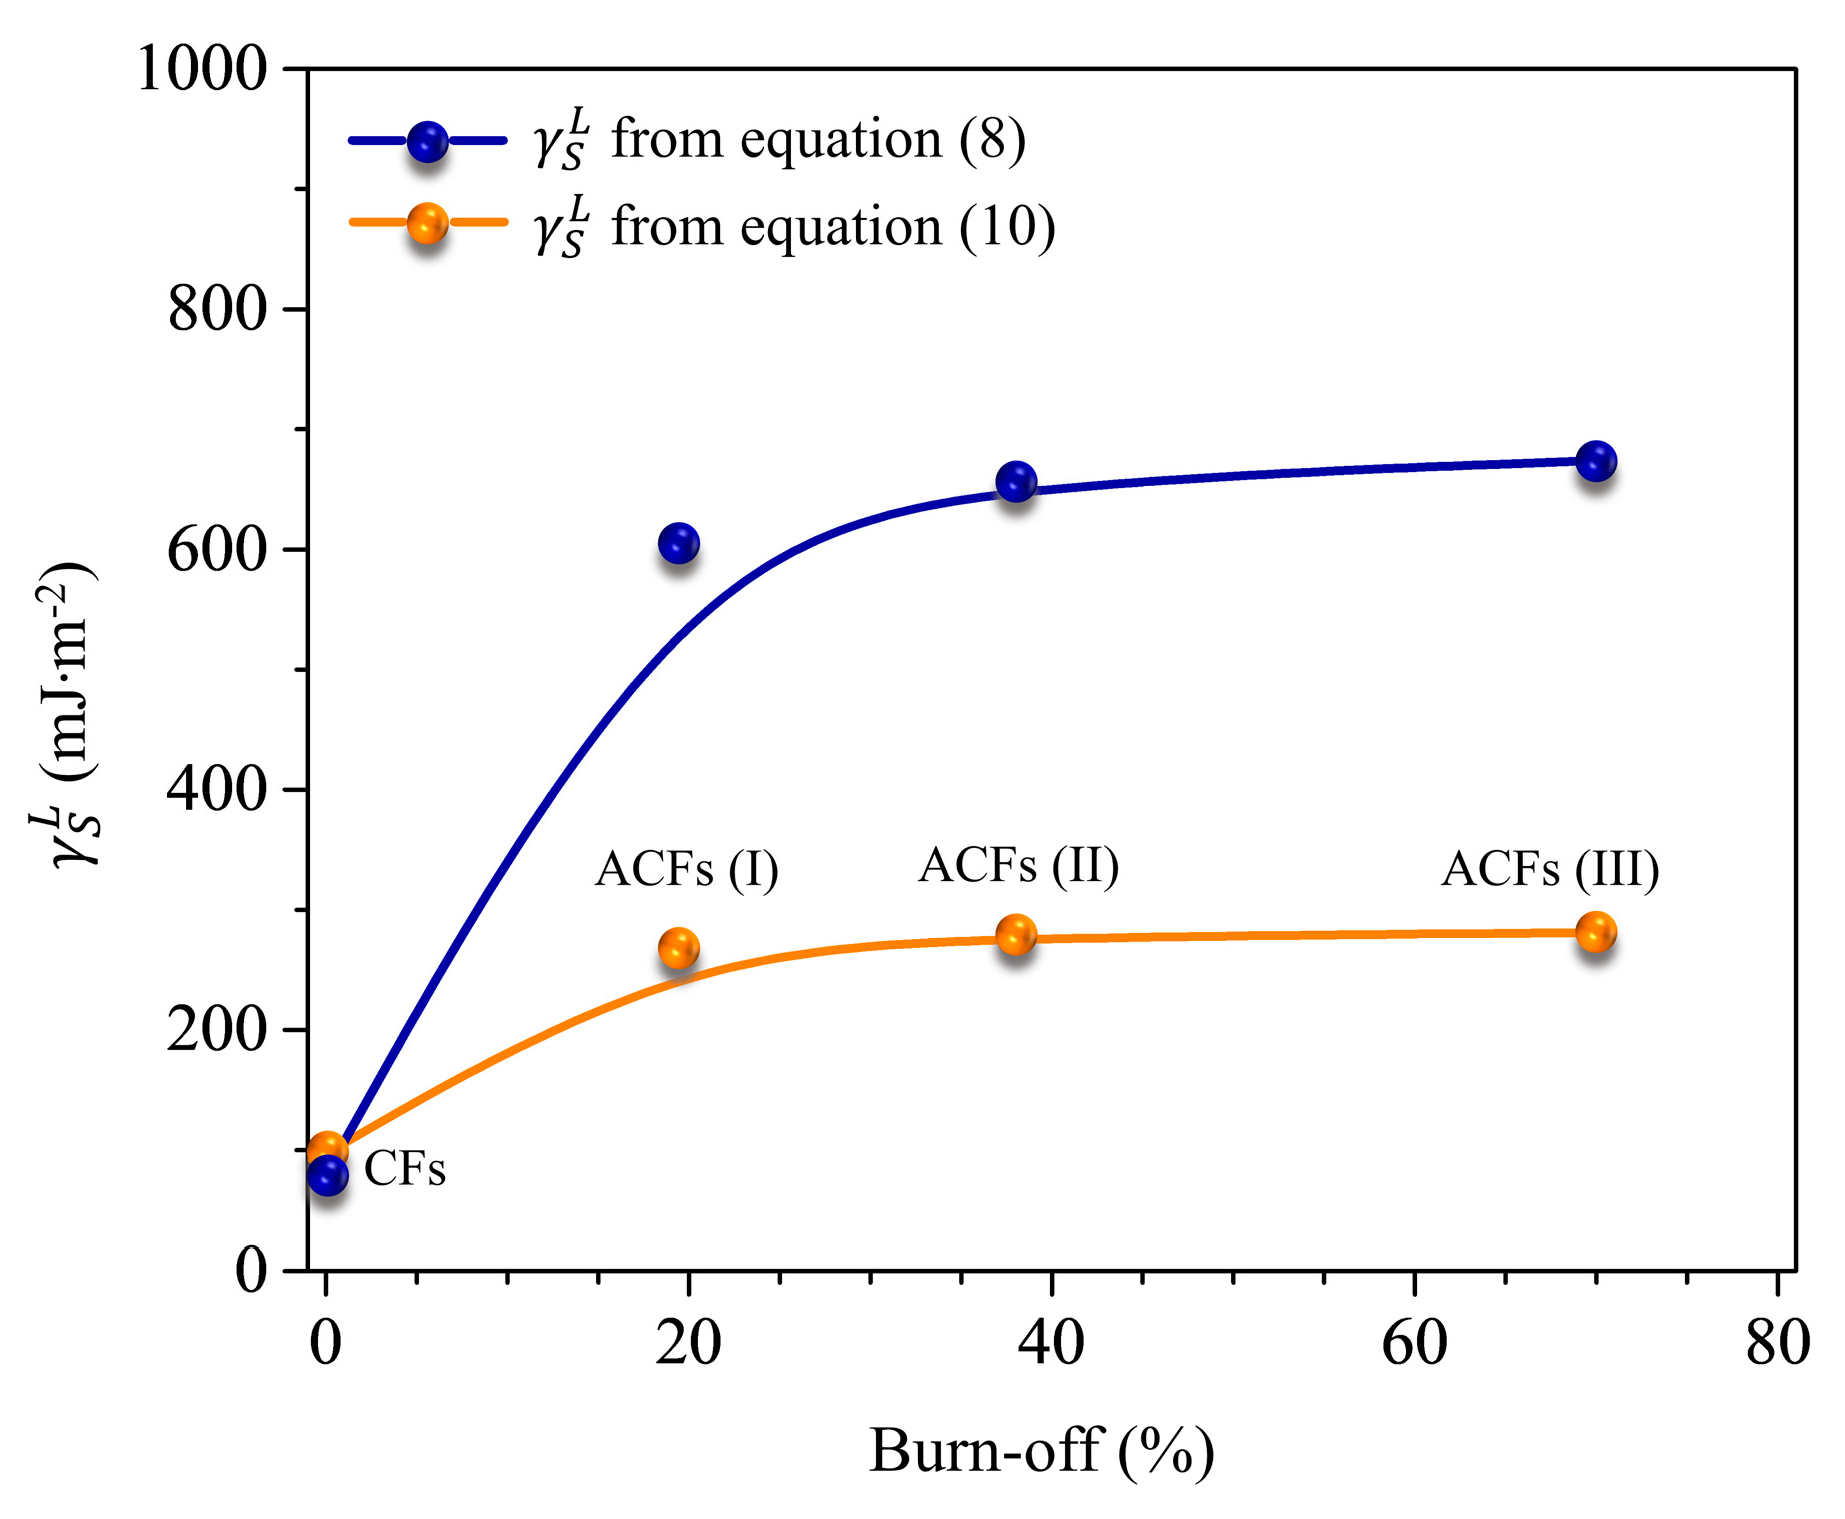
3.2. London’s Dispersive Surface Free Energy
4. Conclusions
Author Contributions
Funding
Data Availability Statement
Conflicts of Interest
References
- Fowkes, F.M. Determination of Interfacial Tensions, Contact Angles, and Dispersion Forces in Surfaces by Assuming Addirivity of Intermolecular Interactions in Surfaces. J. Phys. Chem. 1962, 66, 382. [Google Scholar] [CrossRef]
- Adamson, A.W.; Gast, A.P. Physical Chemistry of Surfaces, 6th ed.; John Wiley and Sons: New York, NY, USA, 1997. [Google Scholar]
- Hiemenz, P.C.; Rajagopalan, R. Principles of Colloid and Surface Chemistry, Revised and Expanded, 3rd ed.; CRC Press: Boca Raton, FL, USA, 1997. [Google Scholar]
- Donnet, J.; Park, S.-J.; Brendle, M. The effect of microwave plasma treatment on the surface energy of graphite as measured by inverse gas chromatography. Carbon 1992, 30, 263–268. [Google Scholar] [CrossRef]
- Kim, S.H.; Park, S.J. Effect of graphene oxide/graphitic nanofiber nanohybrids on interfacial properties and fracture toughness of carbon fibers-reinforced epoxy matrix composites. Compos. Part B-Eng. 2021, 227, 109387. [Google Scholar] [CrossRef]
- Kozbial, A.; Li, Z.T.; Conaway, C.; McGinley, R.; Dhingra, S.; Vahdat, V.; Zhou, F.; D’Urso, B.; Liu, H.T.; Li, L. Study on the Surface Energy of Graphene by Contact Angle Measurements. Langmuir 2014, 30, 8598–8606. [Google Scholar] [CrossRef] [PubMed]
- Belyaeva, L.A.; Schneider, G.F. Wettability of graphene. Surf. Sci. Rep. 2020, 75, 100482. [Google Scholar] [CrossRef]
- Lee, S.-Y.; Lee, J.-H.; Kim, Y.-H.; Mahajan, R.L.; Park, S.-J. Surface energetics of graphene oxide and reduced graphene oxide determined by inverse gas chromatographic technique at infinite dilution at room temperature. J. Colloid Interface Sci. 2022, 628, 758–768. [Google Scholar] [CrossRef] [PubMed]
- Dove, J.; Buckton, G.; Doherty, C. A comparison of two contact angle measurement methods and inverse gas chromatography to assess the surface energies of theophylline and caffeine. Int. J. Pharm. 1996, 138, 199–206. [Google Scholar] [CrossRef]
- Legras, A.; Kondor, A.; Heitzmann, M.T.; Truss, R.W. Inverse gas chromatography for natural fibre characterisation: Identification of the critical parameters to determine the Brunauer-Emmett-Teller specific surface area. J. Chromatogr. A 2015, 1425, 273–279. [Google Scholar] [CrossRef] [PubMed] [Green Version]
- Donnet, J.; Park, S.-J.; Balard, H. Evaluation of specific interactions of solid surfaces by inverse gas chromatography. Chromatographia 1991, 31, 434–440. [Google Scholar] [CrossRef]
- Dorris, G.M.; Gray, D.G. Adsorption of n-alkanes at zero surface coverage on cellulose paper and wood fibers. J. Colloid Interface Sci. 1980, 77, 353–362. [Google Scholar] [CrossRef]
- Schultz, J.A.; Lavielle, L.; Martin, C. The role of the interface in carbon fibre-epoxy composites. J. Adhes. 1987, 23, 45–60. [Google Scholar] [CrossRef]
- Shi, B.L.; Wang, Y.E.; Jia, L.N. Comparison of Dorris-Gray and Schultz methods for the calculation of surface dispersive free energy by inverse gas chromatography. J. Chromatogr. A 2011, 1218, 860–862. [Google Scholar] [CrossRef]
- Basivi, P.K.; Pasupuleti, V.R.; Seella, R.; Tukiakula, M.R.; Kalluru, S.R.; Park, S.J. Inverse Gas Chromatography Study on London Dispersive Surface Free Energy and Electron Acceptor-Donor of Fluconazole Drug. J. Chem. Eng. Data 2017, 62, 2090–2094. [Google Scholar] [CrossRef]
- Kim, J.H.; Jung, S.C.; Lee, H.M.; Kim, B.J. Comparison of Pore Structures of Cellulose-Based Activated Carbon Fibers and Their Applications for Electrode Materials. Int. J. Mol. Sci. 2022, 23, 3680. [Google Scholar] [CrossRef] [PubMed]
- Liao, H.Y.; Pan, S.Y.; You, S.W.; Hou, C.H.; Wang, C.; Deng, J.G.; Hsi, H.C. Mercury vapor adsorption and sustainable recovery using novel electrothermal swing system with gold-electrodeposited activated carbon fiber cloth. J. Hazard. Mater. 2021, 410, 124586. [Google Scholar] [CrossRef] [PubMed]
- You, S.W.; Liao, H.Y.; Tsai, C.Y.; Wang, C.; Deng, J.G.; Hsi, H.C. Using novel gold nanoparticles-deposited activated carbon fiber cloth for continuous gaseous mercury recovery by electrothermal swing system. Chem. Eng. J. 2022, 431, 134325. [Google Scholar] [CrossRef]
- Li, H.F.; Liang, J.C.; Li, H.; Zheng, X.Y.; Tao, Y.; Huang, Z.H.; Yang, Q.H. Activated carbon fibers with manganese dioxide coating for flexible fiber supercapacitors with high capacitive performance. J. Energy Chem. 2019, 31, 95–100. [Google Scholar] [CrossRef] [Green Version]
- Park, S.J.; Kim, K.D. Influence of activation temperature on adsorption characteristics of activated carbon fiber composites. Carbon 2001, 39, 1741–1746. [Google Scholar] [CrossRef]
- Zheng, R.; Lin, Q.X.; Meng, L.; Zhang, C.H.; Zhao, L.H.; Fu, M.L.; Ren, J.L. Flexible phosphorus-doped activated carbon fiber paper in-situ loading of CuO for degradation of phenol. Sep. Purif. Technol. 2022, 298, 121619. [Google Scholar] [CrossRef]
- Yue, Y.; Wang, Y.X.; Qu, C.; Xu, X.D. Modification of polyacrylonitrile-based activated carbon fibers and their p-nitrophenol adsorption and degradation properties. J. Environ. Chem. Eng. 2021, 9, 105390. [Google Scholar] [CrossRef]
- Park, S.J.; Park, B.J.; Ryu, S.K. Electrochemical treatment on activated carbon fibers for increasing the amount and rate of Cr(VI) adsorption. Carbon 1999, 37, 1223–1226. [Google Scholar] [CrossRef]
- Schultz, J.; Lavielle, L. Interfacial Properties of Carbon Fiber—Epoxy Matrix Composites; ACS Publications: Washington, DC, USA, 1989. [Google Scholar]
- Donnet, J.-B.; Park, S.-J. Surface characteristics of pitch-based carbon fibers by inverse gas chromatography method. Carbon 1991, 29, 955–961. [Google Scholar] [CrossRef]
- Park, S.; Papirer, E.; Donnet, J. Influence du traitement électrochimique sur les propriétés de surface des fibres de carbone: Caractère acido-basique et enthalpie d’adsorption. J. Chim. Phys. 1994, 91, 203–222. [Google Scholar] [CrossRef]
- Park, S.-J.; Donnet, J.-B. Evaluation of the distribution function of adsorption site energies based on the Fermi–Dirac’s law in a monolayer. J. Colloid Interface Sci. 1998, 200, 46–51. [Google Scholar] [CrossRef]
- Katz, S.; Gray, D.G. The adsorption of hydrocarbons on cellophane: I. Zero coverage limit. J. Colloid Interface Sci. 1981, 82, 318–325. [Google Scholar] [CrossRef]
- Park, S.-J.; Brendle, M. London dispersive component of the surface free energy and surface enthalpy. J. Colloid Interface Sci. 1997, 188, 336–339. [Google Scholar] [CrossRef]
- Conder, J.R.; Young, C.L. Physicochemical Measurements by Gas Chromatography; John Wiely and Sons: New York, NY, USA, 1979. [Google Scholar]
- Kemball, C.; Rideal, E.K. The adsorption of vapours on mercury. I. Non-polar substances. Proc. R. Soc. Lond. Ser. A Math. Phys. Sci. 1946, 187, 53–73. [Google Scholar] [CrossRef] [Green Version]
- De Boer, J.; Kruyer, S. Entropy and mobility of adsorbed molecules: I. Procedure; atomic gases on charcoal. Proc. K. Ned. Akad. Van Wet. 1952, 55, 451–463. [Google Scholar]
- Park, S.J.; Donnet, J.B. Anodic surface treatment on carbon fibers: Determination of acid-base interaction parameter between two unidentical solid surfaces in a composite system. J. Colloid Interface Sci. 1998, 206, 29–32. [Google Scholar] [CrossRef] [PubMed]
- Haynes, W.M.; Lide, D.R.; Bruno, T.J. CRC Handbook of Chemistry and Physics; CRC Press: Boca Raton, FL, USA, 2016. [Google Scholar]
- Bryant, P.; Gutshall, P.; Taylor, L. A study of mechanisms of graphite friction and wear. Wear 1964, 7, 118–126. [Google Scholar] [CrossRef]
- Abrahamson, J. The surface energies of graphite. Carbon 1973, 11, 337–362. [Google Scholar] [CrossRef]
- Bowden, F.P.; Bowden, F.P.; Tabor, D. The Friction and Lubrication of Solids; Oxford University Press: Oxford, UK, 2001; Volume 1. [Google Scholar]
- Vitos, L.; Ruban, A.; Skriver, H.L.; Kollár, J. The surface energy of metals. Surf. Sci. 1998, 411, 186–202. [Google Scholar] [CrossRef]


| Samples | at 298 K (kJ·mol−1) | |
|---|---|---|
| Gray | Park | |
| CFs | 3.9 | 3.5 |
| ACFs (I) | 10.6 | 9.6 |
| ACFs (II) | 11.0 | 10.0 |
| ACFs (III) | 11.2 | 10.1 |
| Samples | a Burn-off (wt.%) | b SBET (m2·g−1) |
|---|---|---|
| CFs | 0 | - |
| ACFs (I) | 19.5 | 340 |
| ACFs (II) | 38.0 | 500 |
| ACFs (III) | 70.0 | 1630 |
Disclaimer/Publisher’s Note: The statements, opinions and data contained in all publications are solely those of the individual author(s) and contributor(s) and not of MDPI and/or the editor(s). MDPI and/or the editor(s) disclaim responsibility for any injury to people or property resulting from any ideas, methods, instructions or products referred to in the content. |
© 2023 by the authors. Licensee MDPI, Basel, Switzerland. This article is an open access article distributed under the terms and conditions of the Creative Commons Attribution (CC BY) license (https://creativecommons.org/licenses/by/4.0/).
Share and Cite
Lee, S.-Y.; Kim, Y.-H.; Mahajan, R.L.; Park, S.-J. Determination of Hydrophobic Dispersive Surface Free Energy of Activated Carbon Fibers Measured by Inverse Gas Chromatographic Technique. Nanomaterials 2023, 13, 1113. https://doi.org/10.3390/nano13061113
Lee S-Y, Kim Y-H, Mahajan RL, Park S-J. Determination of Hydrophobic Dispersive Surface Free Energy of Activated Carbon Fibers Measured by Inverse Gas Chromatographic Technique. Nanomaterials. 2023; 13(6):1113. https://doi.org/10.3390/nano13061113
Chicago/Turabian StyleLee, Seul-Yi, Yeong-Hun Kim, Roop L. Mahajan, and Soo-Jin Park. 2023. "Determination of Hydrophobic Dispersive Surface Free Energy of Activated Carbon Fibers Measured by Inverse Gas Chromatographic Technique" Nanomaterials 13, no. 6: 1113. https://doi.org/10.3390/nano13061113