
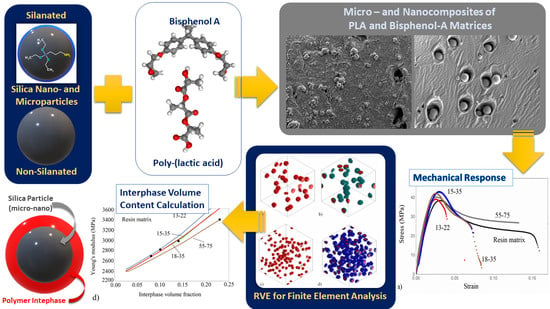
The Effect of Silica Particle Size on the Mechanical Enhancement of Polymer Nanocomposites


Abstract
:
1. Introduction
2. Materials and Methods
2.1. Materials
2.2. Tensile Testing
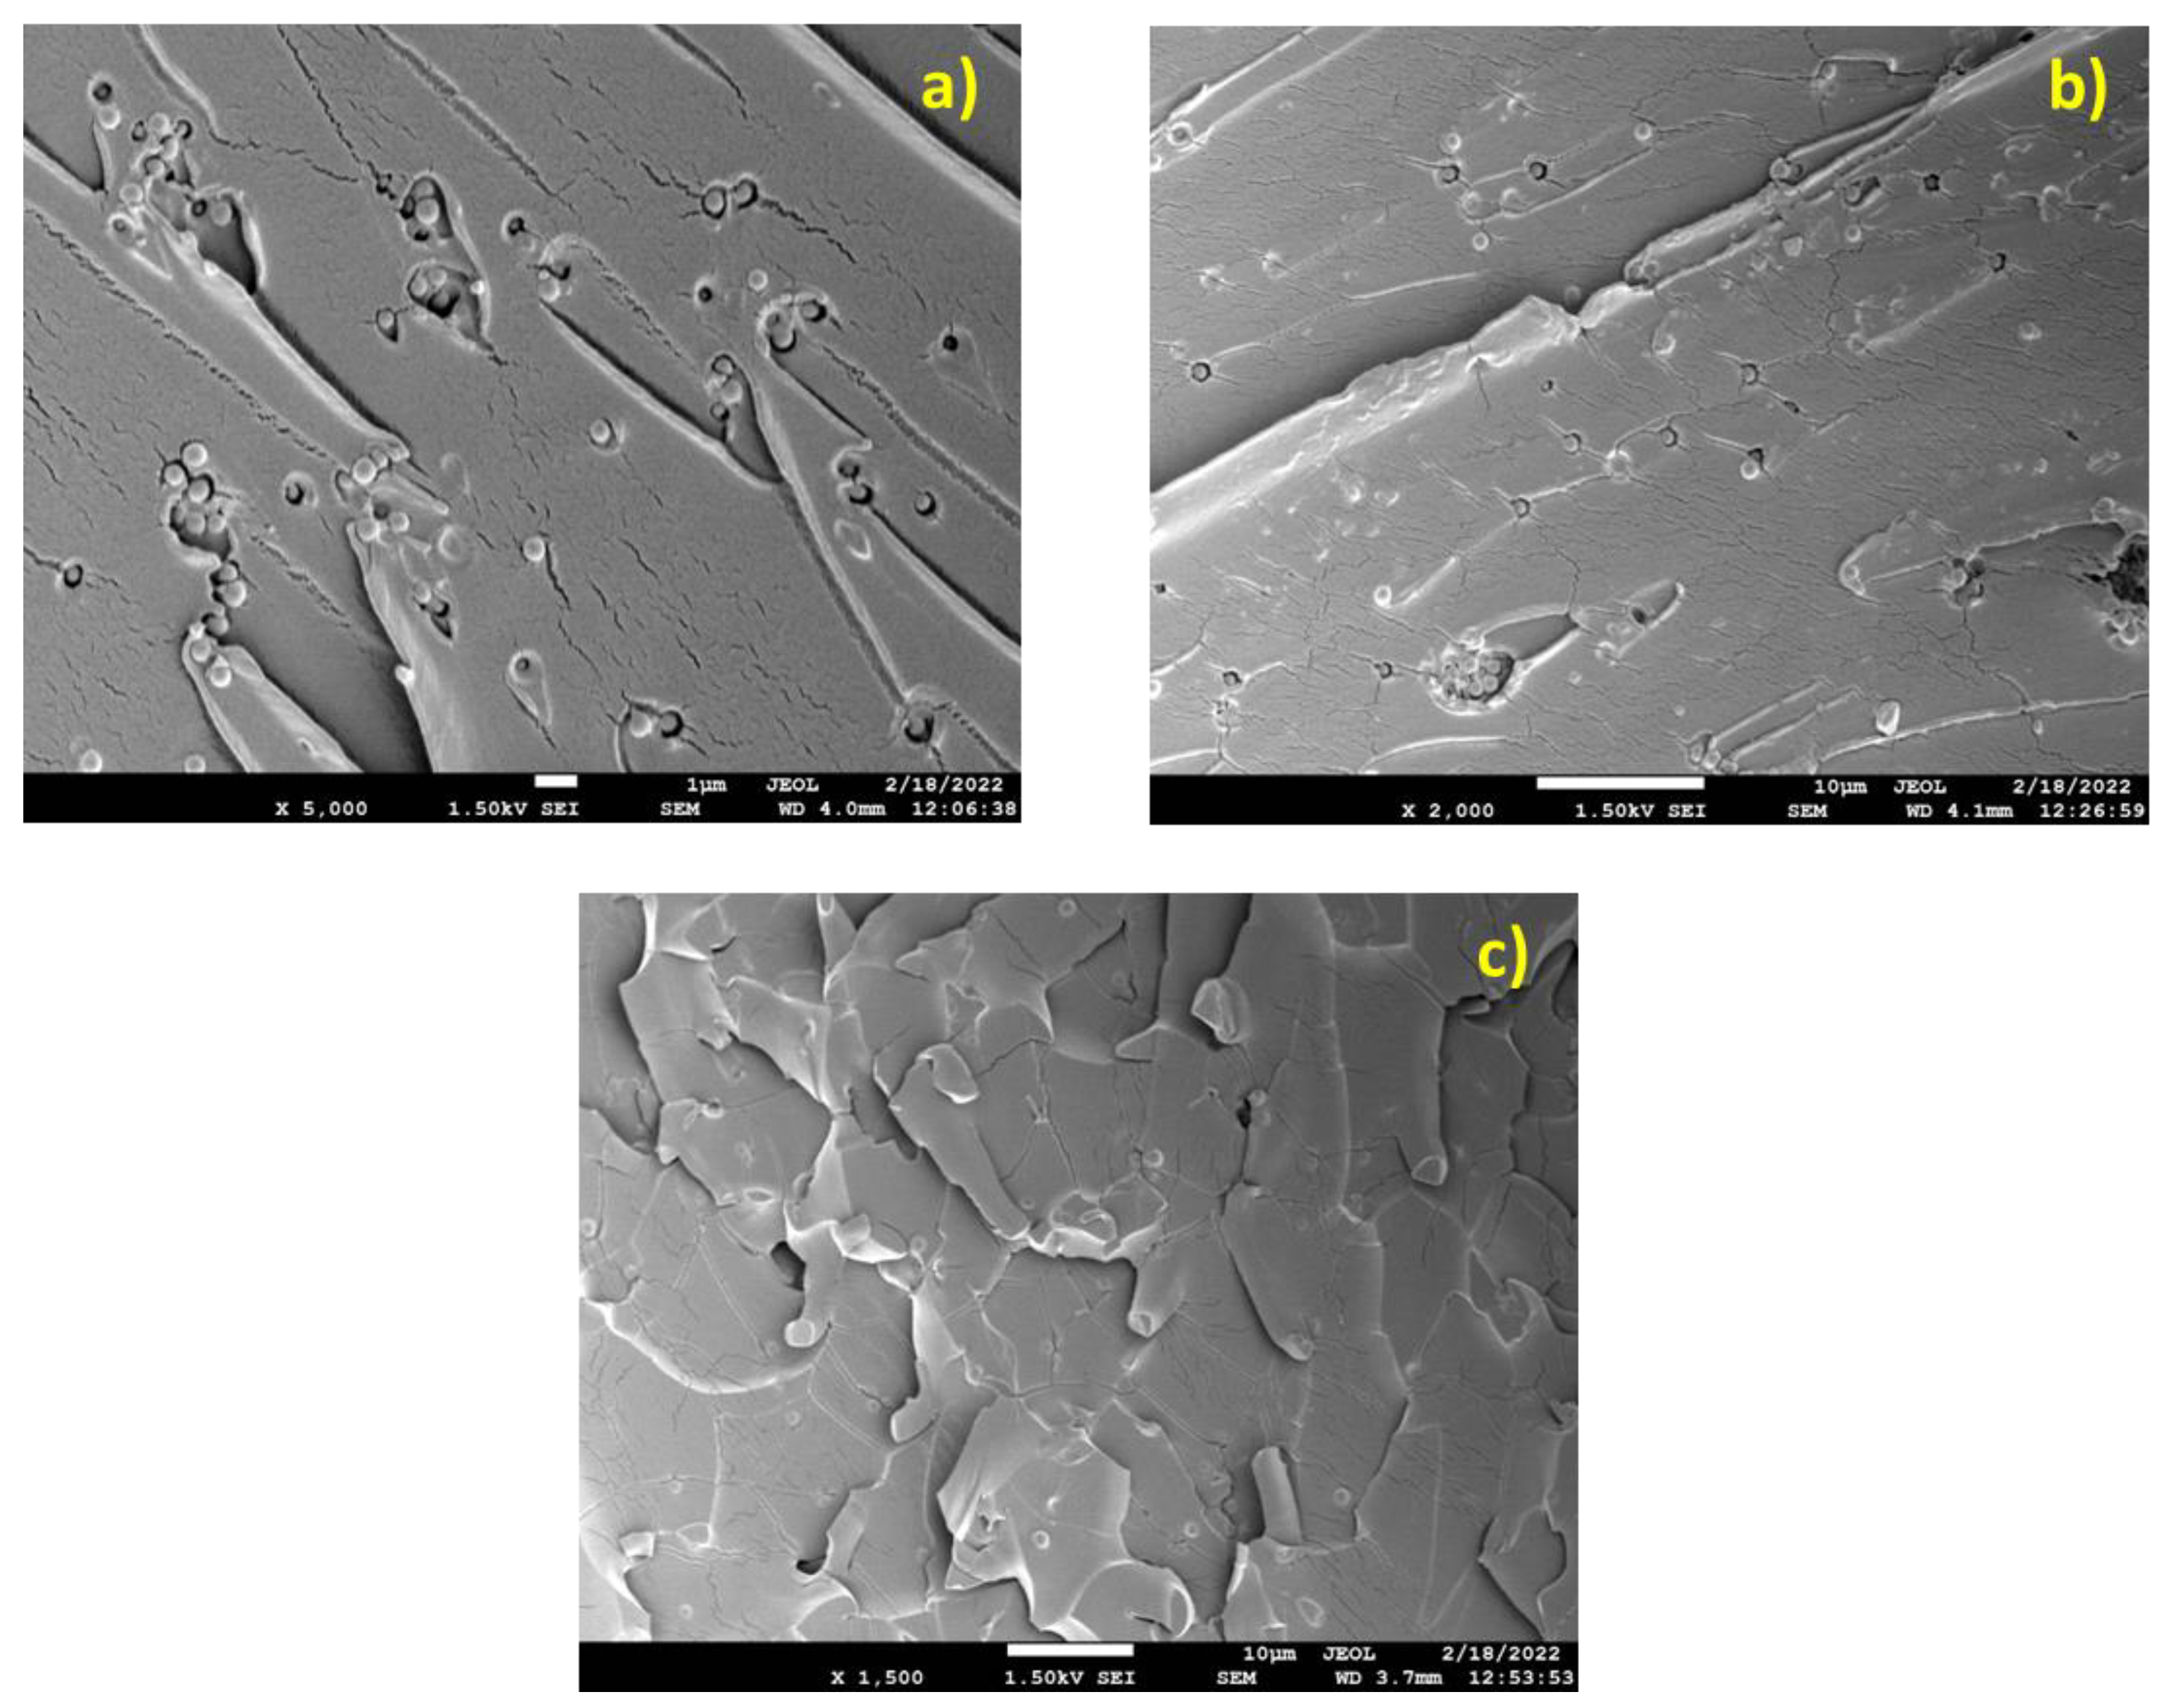
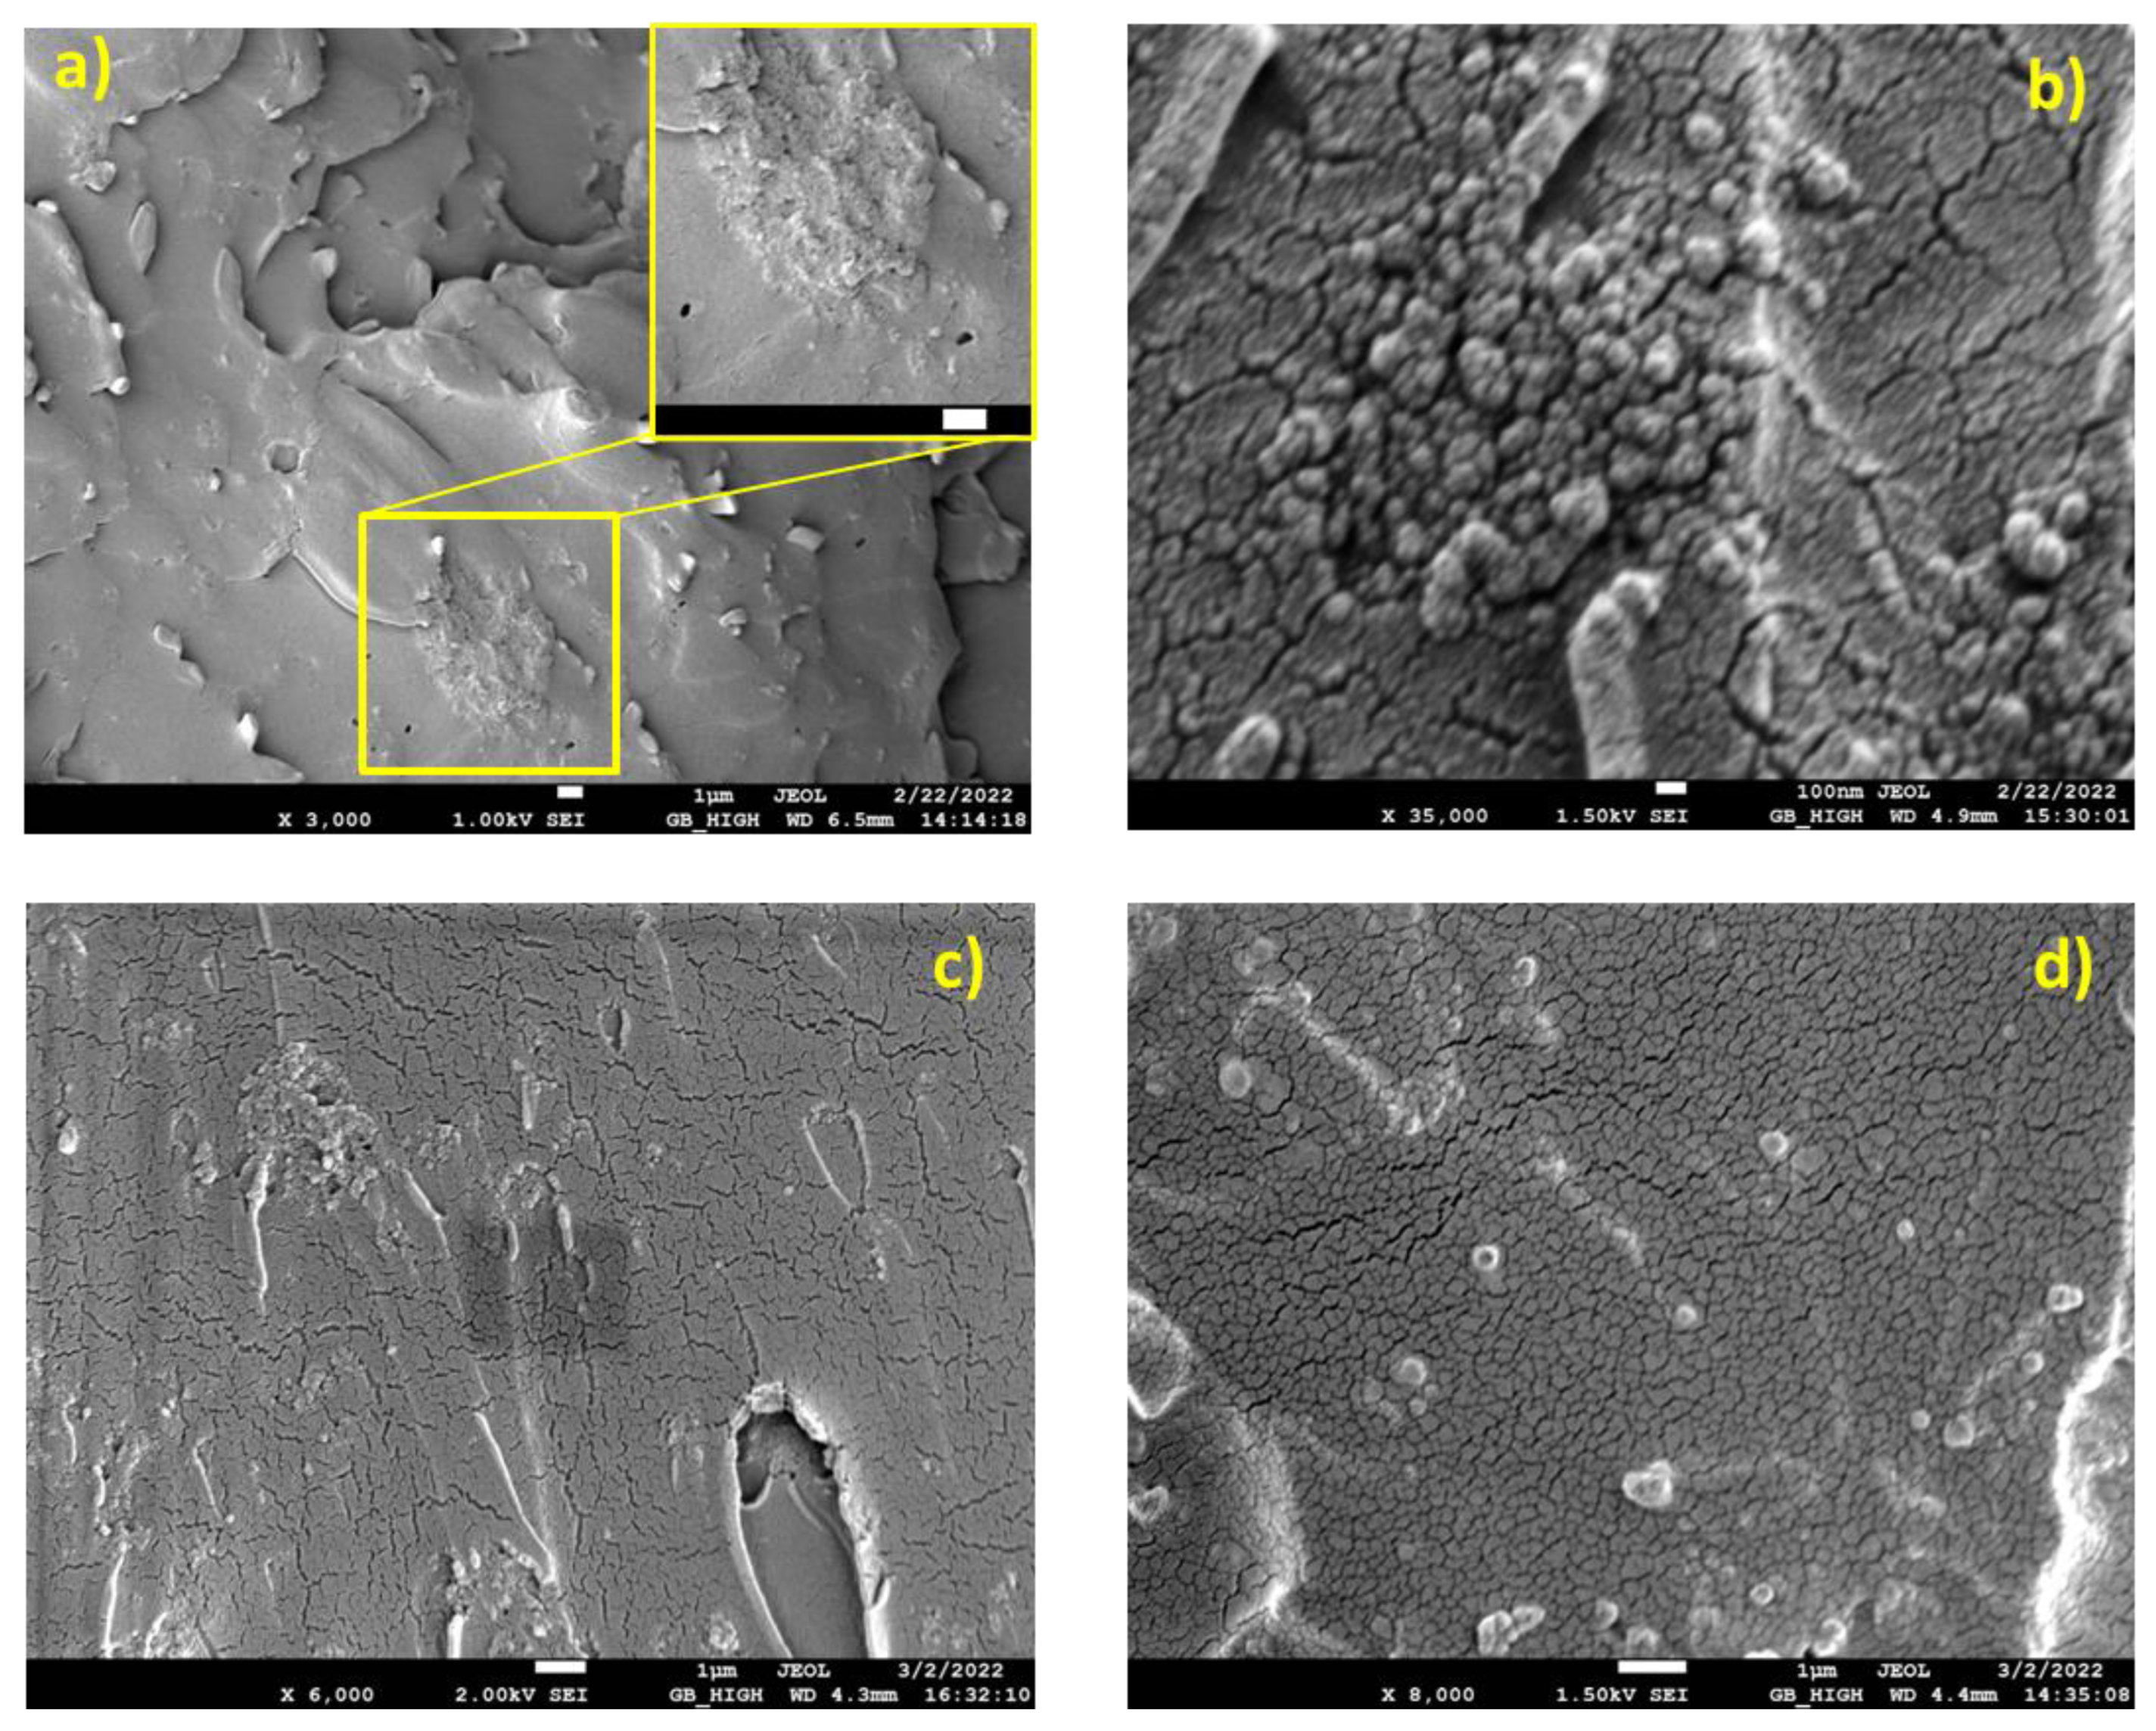
2.3. Scanning Electron Microscopy (SEM)
2.4. Dynamic Mechanical Analysis (DMA)
3. Results
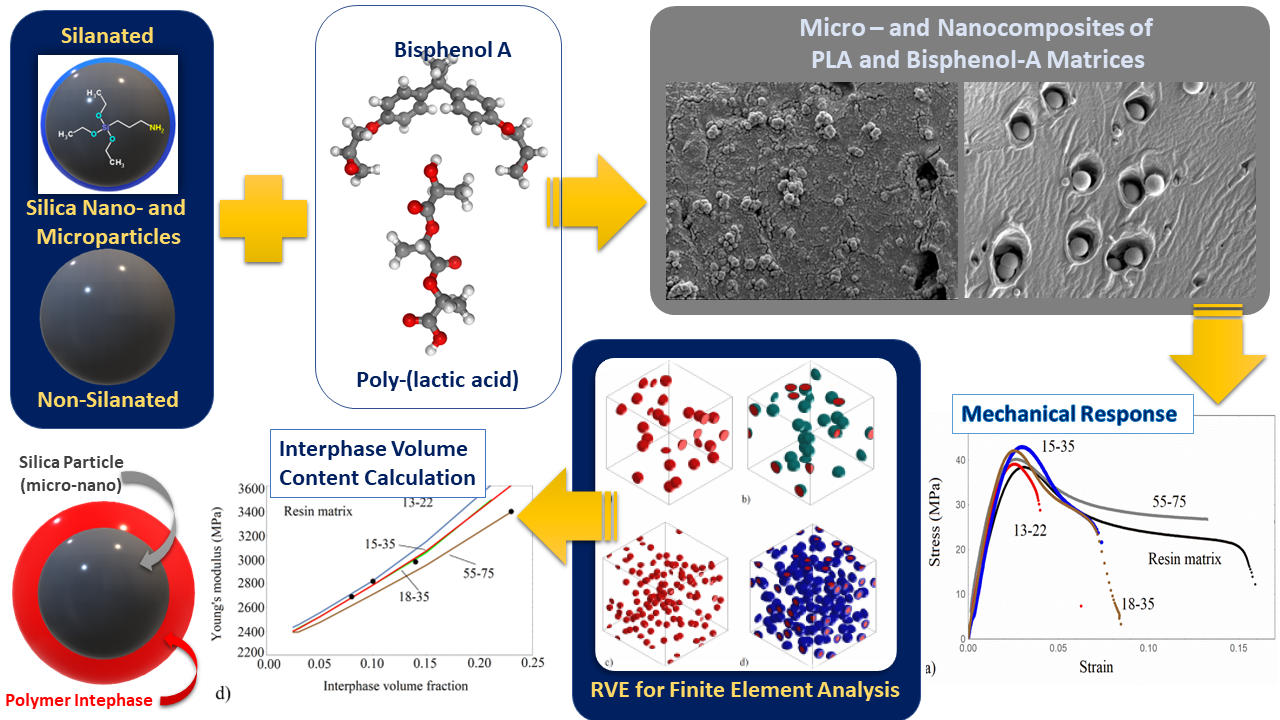
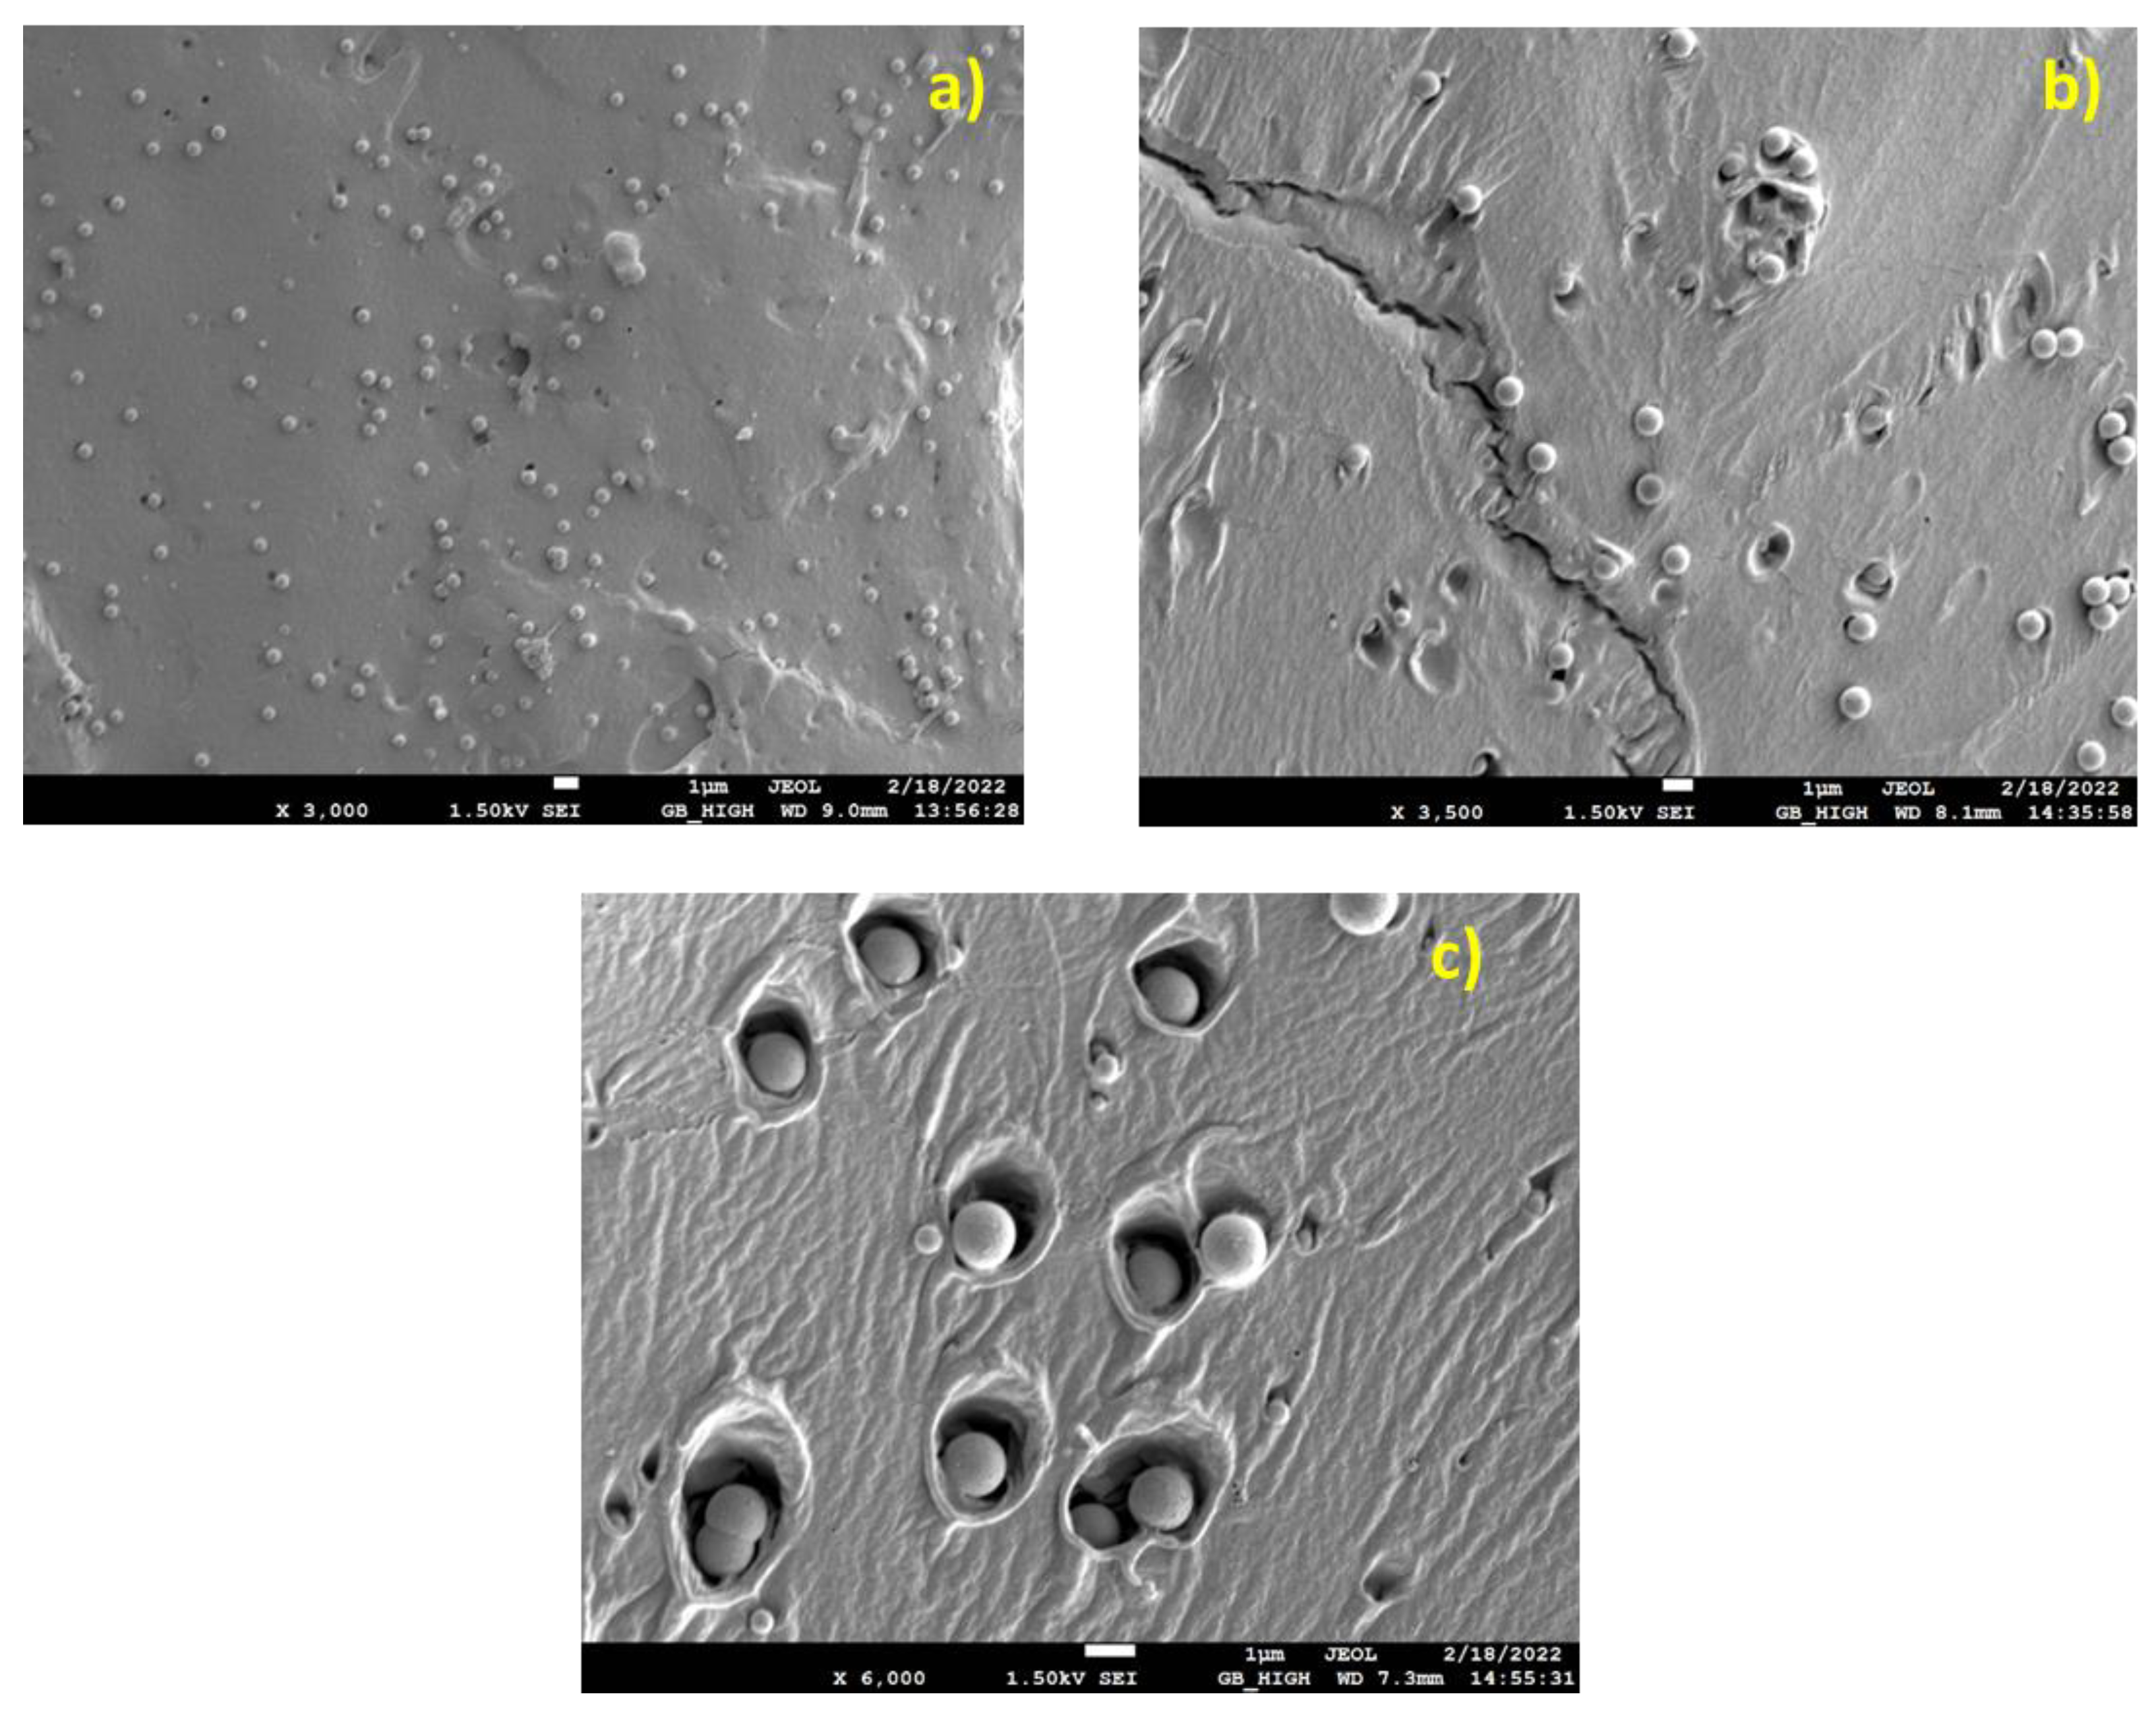
3.1. SEM Results
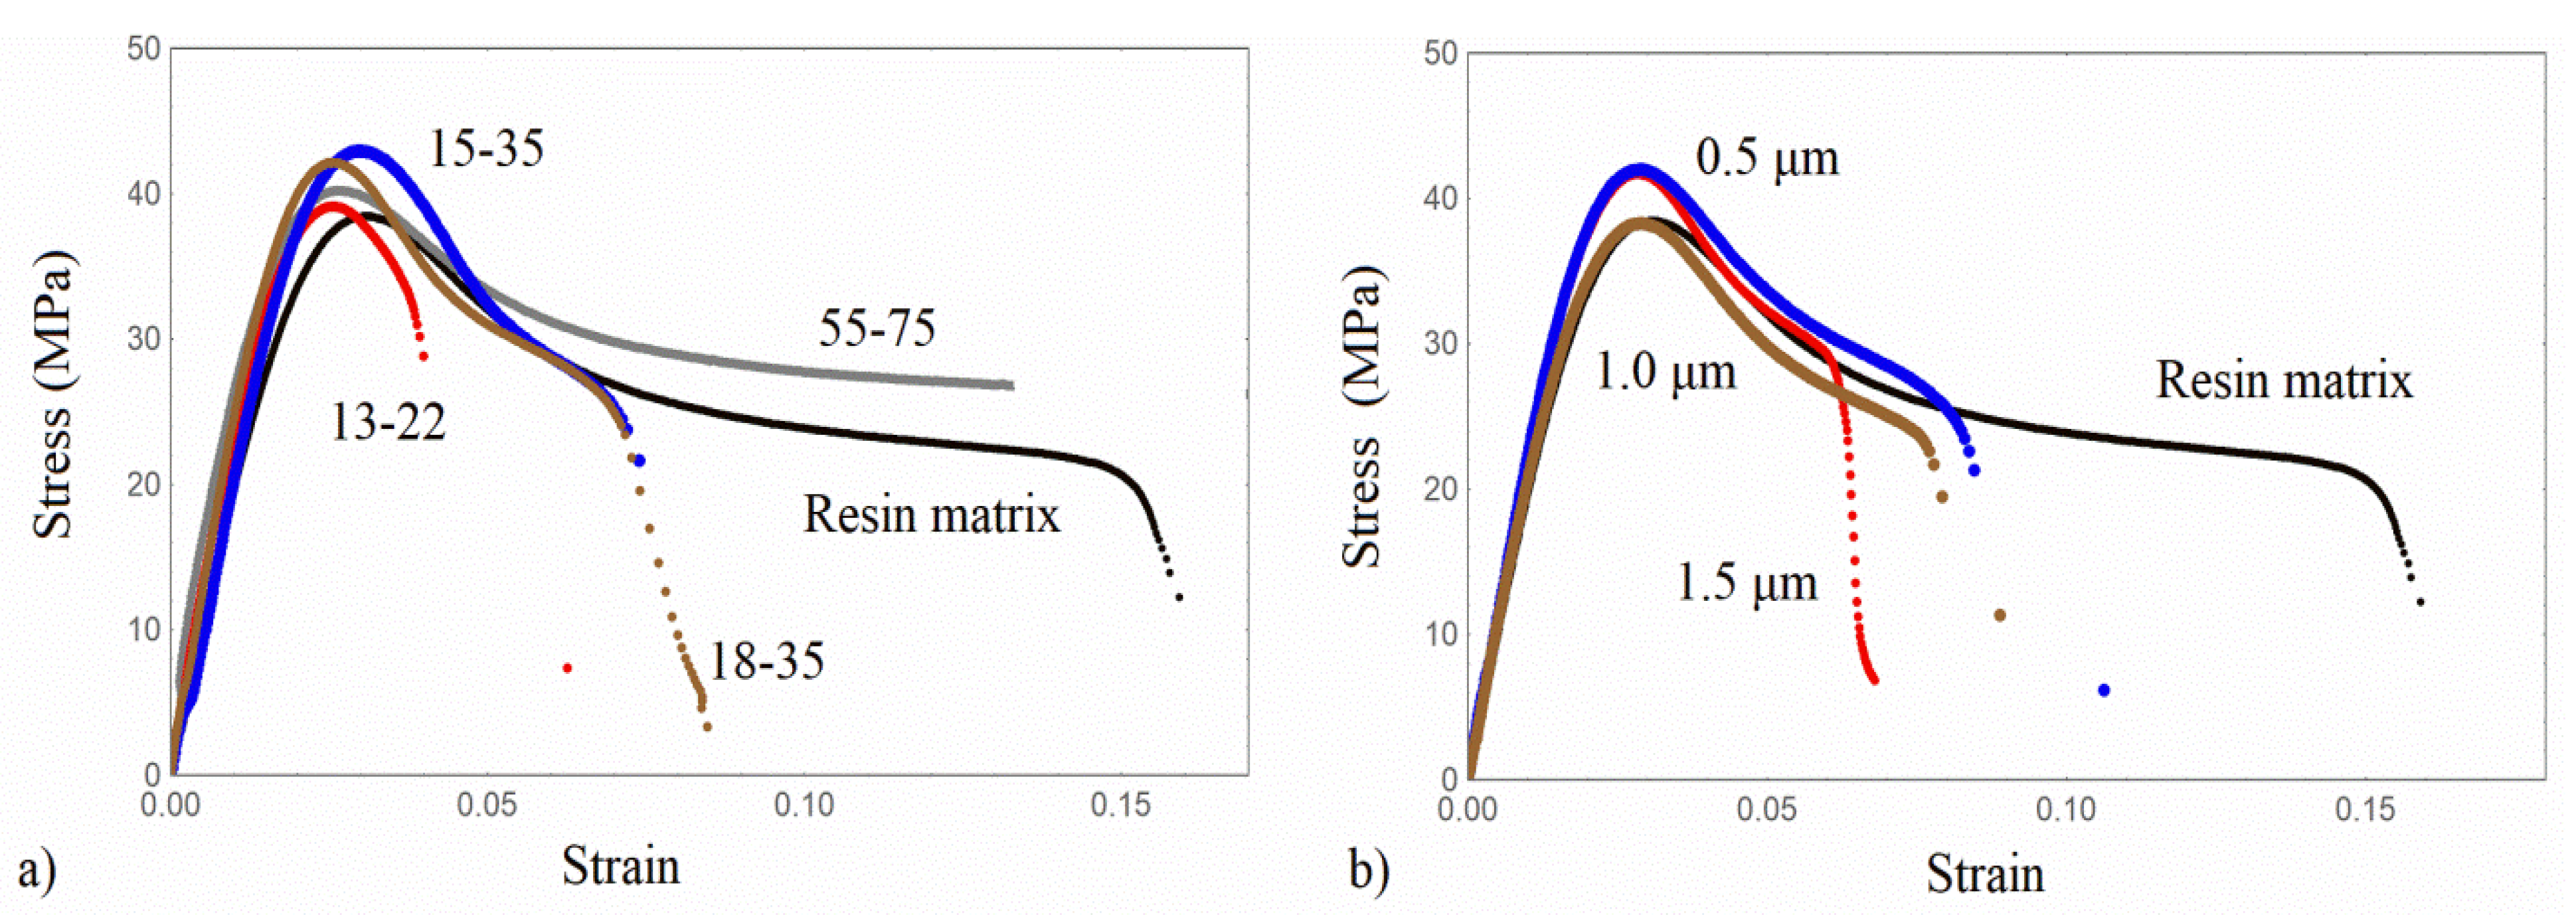
3.2. Tensile Results
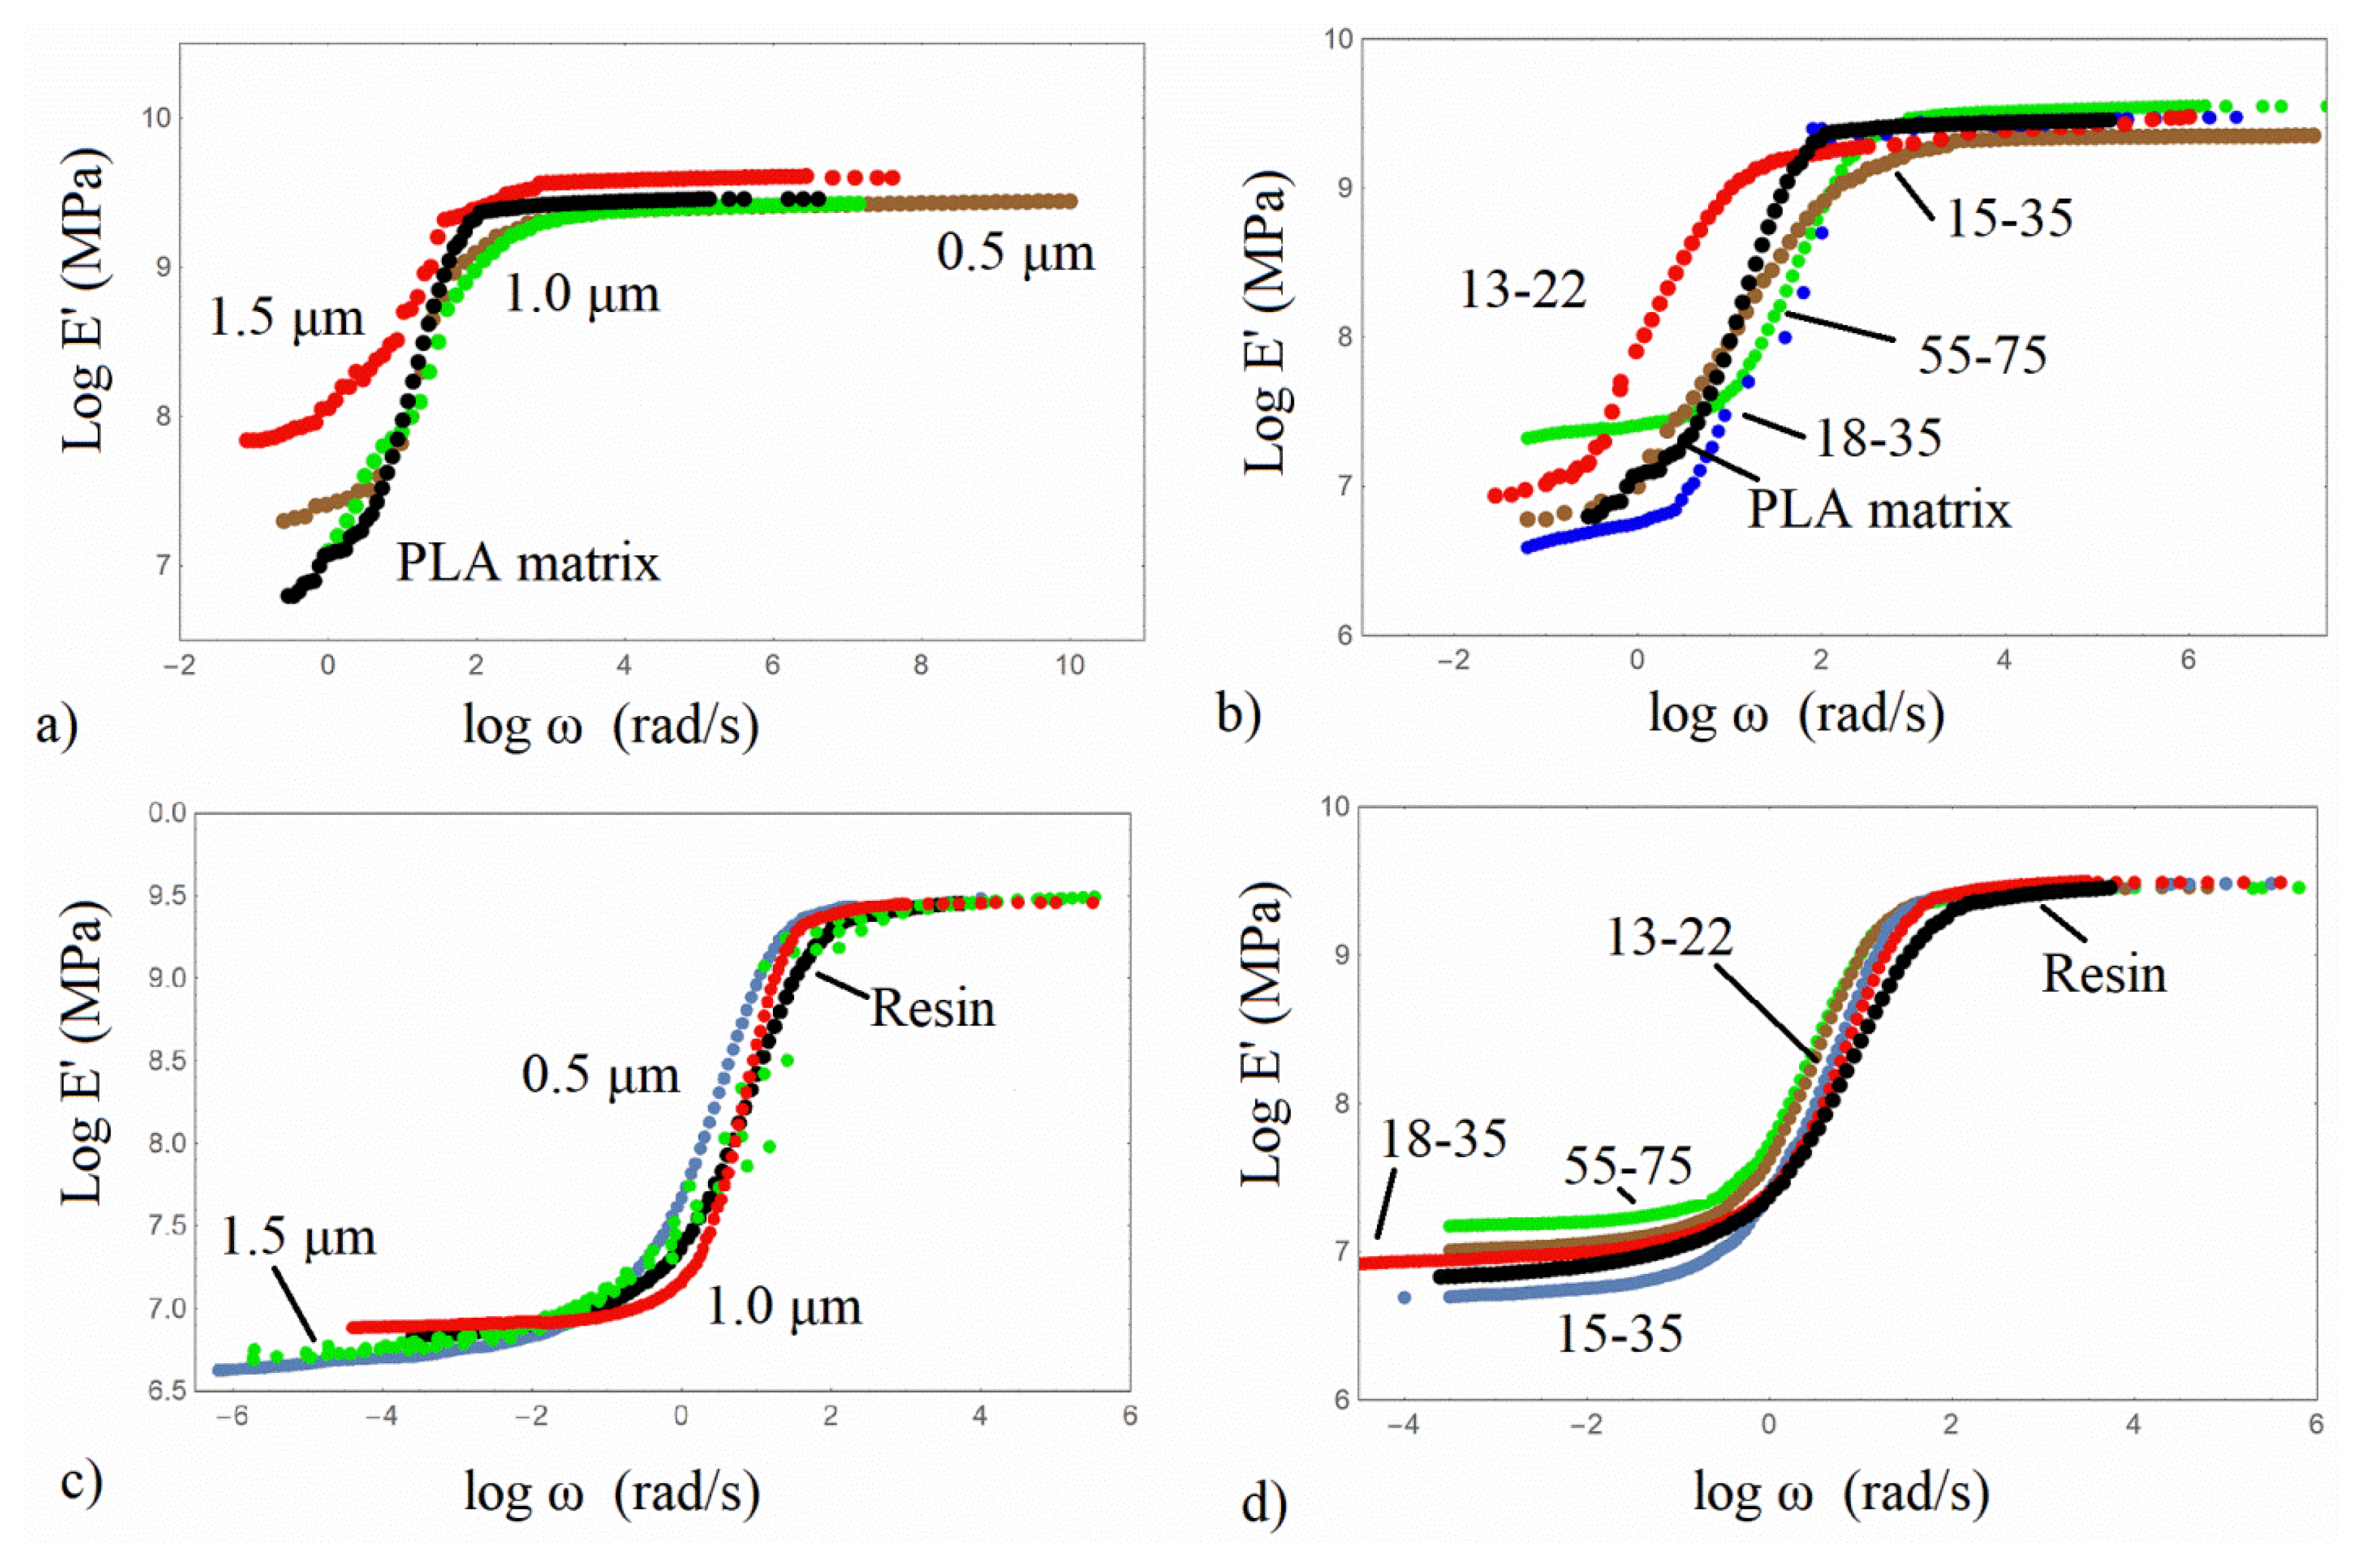
3.3. Dynamic Mechanical Analysis (DMA)
3.4. Modeling of the Effective Modulus Tensor
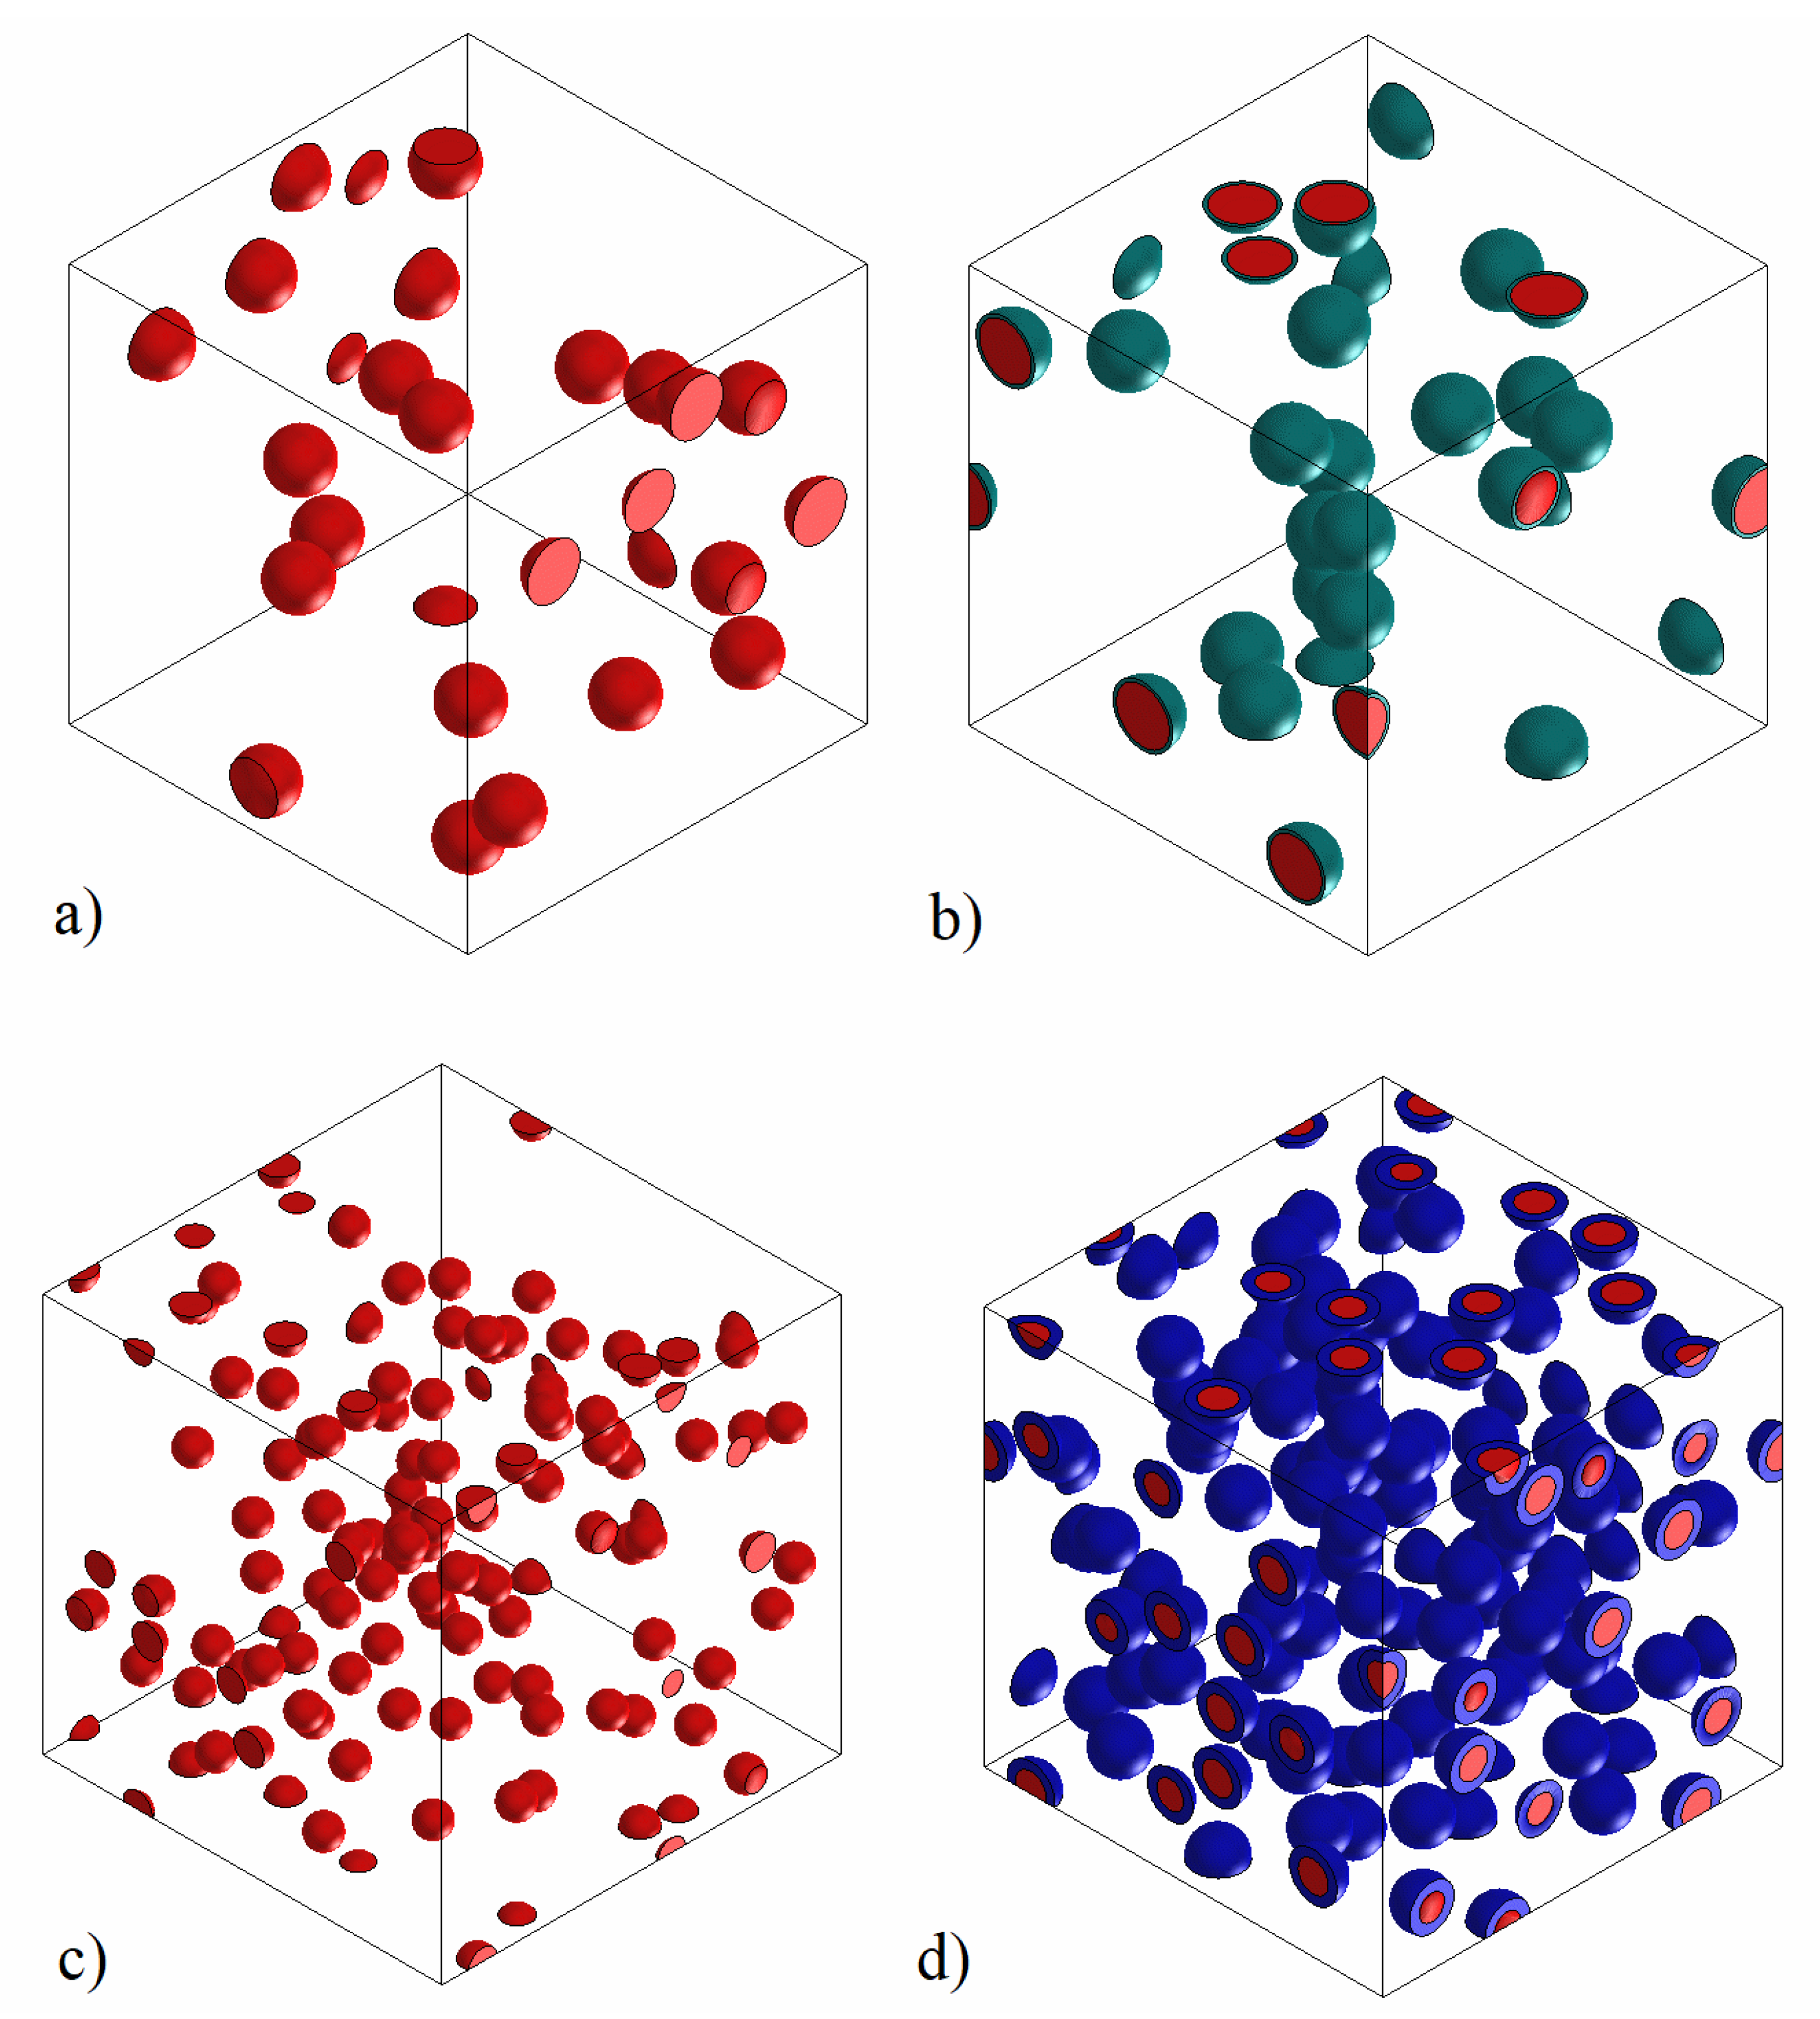
3.4.1. Finite Element Analysis (FEA)
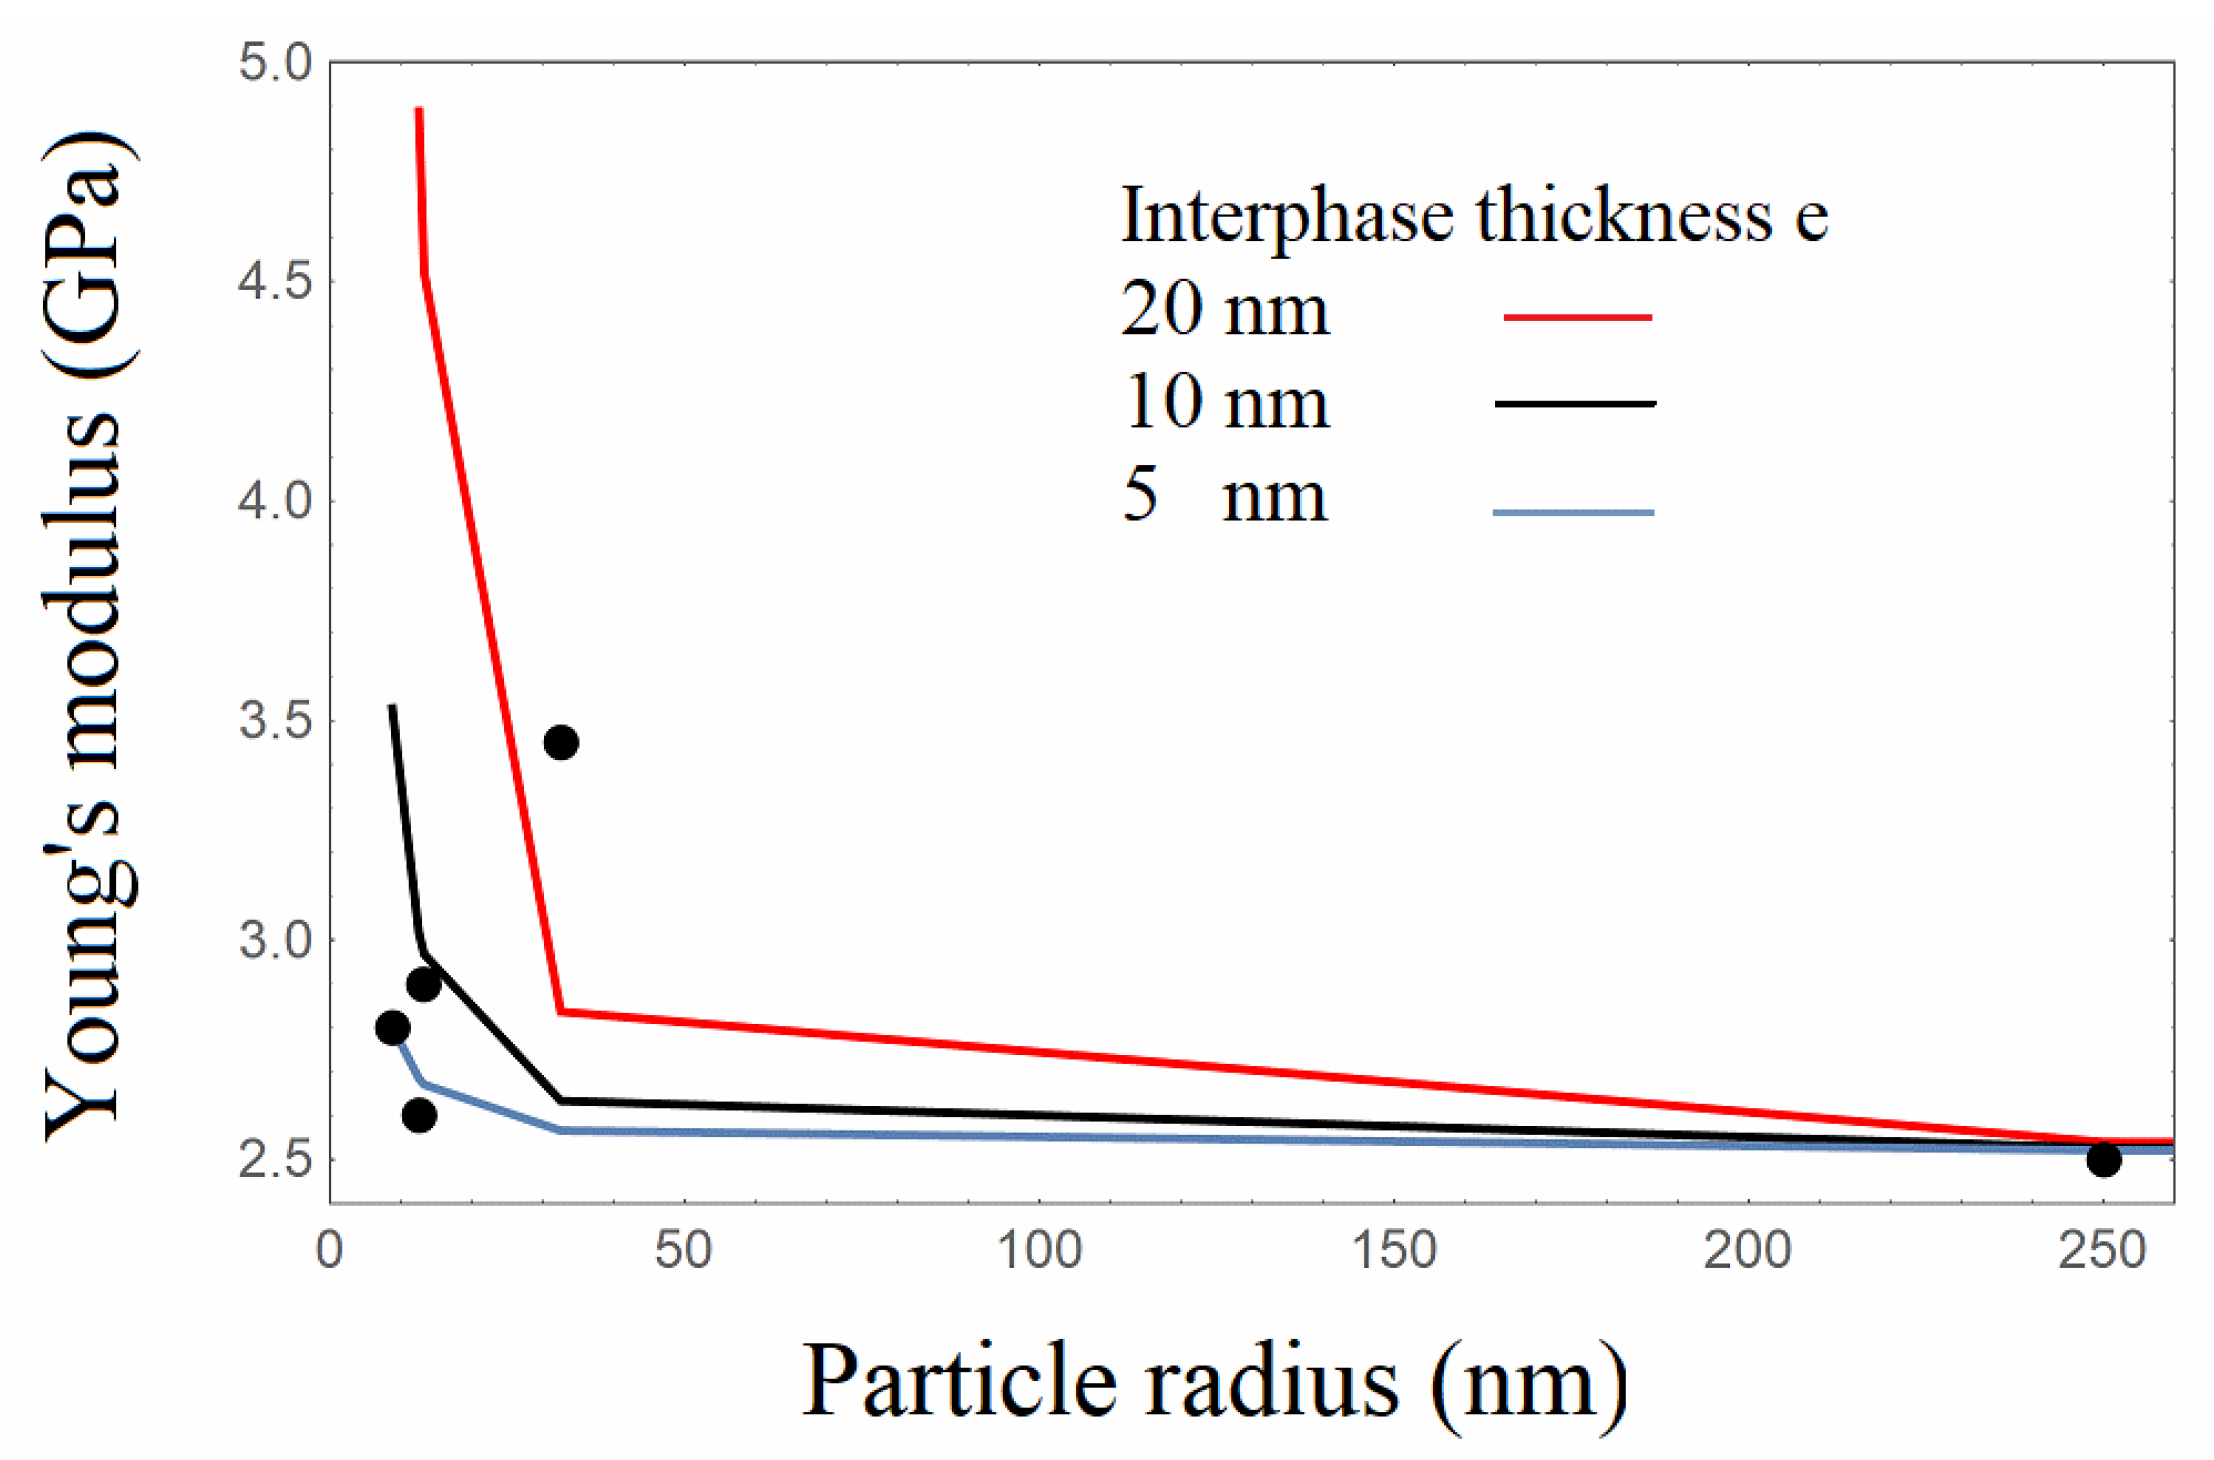
3.4.2. Analytical Model
4. Conclusions
Author Contributions
Funding
Data Availability Statement
Conflicts of Interest
References
- Sinha Ray, S.; Okamoto, M. Polymer/layered silicate nanocomposites: A review from preparation to processing. Prog. Polym. Sci. 2003, 28, 1539–1641. [Google Scholar] [CrossRef]
- Demjén, Z.; Pukánszky, B.; Nagy, J. Evaluation of interfacial interaction in polypropylene/surface treated CaCO3 composites. Compos. Part A Appl. Sci. Manuf. 1998, 29, 323–329. [Google Scholar] [CrossRef]
- Leidner, J.; Woodhams, R.T. The strength of polymeric composites containing spherical fillers. J. Appl. Polym. Sci. 1974, 18, 1639–1654. [Google Scholar] [CrossRef]
- Alexandre, M.; Dubois, P. Polymer-layered silicate nanocomposites: Preparation, properties and uses of a new class of materials. Mater. Sci. Eng. R Rep. 2000, 28, 1–63. [Google Scholar] [CrossRef]
- Kim, M.H.; Park, C.I.; Choi, W.M.; Lee, J.W.; Lim, J.G.; Park, O.O.; Kim, J.M. Synthesis and Material Properties of Syndiotactic Polystyrene/Organophilic Clay Nanocomposites. J. Appl. Polym. Sci. 2004, 92, 2144–2150. [Google Scholar] [CrossRef]
- Bikiaris, D.N.; Papageorgiou, G.Z.; Pavlidou, E.; Vouroutzis, N.; Palatzoglou, P.; Karayannidis, G.P. Preparation by melt mixing and characterization of isotactic polypropylene/SiO2 nanocomposites containing untreated and surface-treated nanoparticles. J. Appl. Polym. Sci. 2006, 100, 2684–2696. [Google Scholar] [CrossRef]
- Alaei, M.H.; Mahajan, P.; Brieu, M.; Kondo, D.; Rizvi, S.J.A.; Kumar, S.; Bhatnagar, N. Effect of particle size on thermomechanical properties of particulate polymer composite. Iran. Polym. J. (Engl. Ed.) 2013, 22, 853–863. [Google Scholar] [CrossRef]
- Georgiopoulos, P.; Kontou, E. Modeling of the elastic stiffness of biobased polymer nanocomposites. J. Reinf. Plast. Compos. 2014, 33, 942–952. [Google Scholar] [CrossRef]
- Seon, H.A.; Seong, H.K.; Byoung, C.K.; Kwang, B.S.; Bong, G.C. Mechanical properties of silica nanoparticle reinforced poly(ethylene 2, 6-naphthalate). Macromol. Res. 2004, 12, 293–302. [Google Scholar]
- Kontou, E.; Niaounakis, M. Thermo-mechanical properties of LLDPE/SiO2 nanocomposites. Polymer 2006, 47, 1267–1280. [Google Scholar] [CrossRef]
- Benveniste, Y. A new approach to the application of Mori-Tanaka’s theory in composite materials. Mech. Mater. 1987, 6, 147–157. [Google Scholar] [CrossRef]
- Dai, L.H.; Huang, Z.P.; Wang, R. Explicit expressions for bounds for the effective moduli of multi-phased composites by the generalized self-consistent method. Compos. Sci. Technol. 1999, 59, 1691–1699. [Google Scholar] [CrossRef]
- Eshelbby, J.D. The determination of the elastic field of an ellipsoidal inclusion in an anisotronic medium. Proc. R. Soc. Lond. 1957, 241, 376–396. [Google Scholar] [CrossRef]
- Mori, T.; Tanaka, K. Average stress in matrix and average elastic energy of materials with misfitting inclusions. Acta Metall. 1973, 21, 571–574. [Google Scholar] [CrossRef]
- Ashraf, M.A.; Peng, W.; Zare, Y.; Rhee, K.Y. Effects of Size and Aggregation/Agglomeration of Nanoparticles on the Interfacial/Interphase Properties and Tensile Strength of Polymer Nanocomposites. Nanoscale Res. Lett. 2018, 13, 1–7. [Google Scholar] [CrossRef]
- Blivi, A.S.; Benhui, F.; Bai, J.; Kondo, D.; Bédoui, F. Experimental evidence of size effect in nano-reinforced polymers: Case of silica reinforced PMMA. Polym. Test. 2016, 56, 337–343. [Google Scholar] [CrossRef]
- Nielsen, L.E. Generalized equation for the elastic moduli of composite materials. J. Appl. Phys. 1970, 41, 4626–4627. [Google Scholar] [CrossRef]
- Zamani Zakaria, A.; Shelesh-Nezhad, K. Quantifying the particle size and interphase percolation effects on the elastic performance of semi-crystalline nanocomposites. Comput. Mater. Sci. 2016, 117, 502–510. [Google Scholar] [CrossRef]
- Fu, S.Y.; Feng, X.Q.; Lauke, B.; Mai, Y.W. Effects of particle size, particle/matrix interface adhesion and particle loading on mechanical properties of particulate-polymer composites. Compos. Part B Eng. 2008, 39, 933–961. [Google Scholar] [CrossRef]
- Cho, J.; Joshi, M.S.; Sun, C.T. Effect of inclusion size on mechanical properties of polymeric composites with micro and nano particles. Compos. Sci. Technol. 2006, 66, 1941–1952. [Google Scholar] [CrossRef]
- Pustak, A.; Leskovac, M.; Denac, M.; Švab, I.; Pohleven, J.; MakaroviÄ, M.; Musil, V.; Šmit, I. Interfacial and mechanical properties of polypropylene/silica nano- And microcomposites. J. Reinf. Plast. Compos. 2014, 33, 851–861. [Google Scholar] [CrossRef]
- Siraj, S.; Al-Marzouqi, A.; Iqbal, M.; Ahmed, W. Impact of Micro Silica Filler Particle Size on Mechanical Properties of Polymeric Based Composite Material. Polymers 2022, 14, 4830. [Google Scholar] [CrossRef]
- Dittanet, P.; Pearson, R.A. Effect of silica nanoparticle size on toughening mechanisms of filled epoxy. Polymer 2012, 53, 1890–1905. [Google Scholar] [CrossRef]
- Chen, Y.; Han, L.; Dong, L. Effect of silica particle size on the microstructure and physical properties of microporous poly(L-lactic acid) produced by uniaxial stretching. Polym. Test. 2019, 79, 106051. [Google Scholar] [CrossRef]
- Dekkers, M.E.J.; Heikens, D. The effect of interfacial adhesion on the tensile behavior of polystyrene–glass-bead composites. J. Appl. Polym. Sci. 1983, 28, 3809–3815. [Google Scholar] [CrossRef] [Green Version]
- Spanoudakis, J.; Young, R.J. Crack propagation in a glass particle-filled epoxy resin—Part 1 Effect of particle volume fraction and size. J. Mater. Sci. 1984, 19, 473–486. [Google Scholar] [CrossRef]
- Amdouni, N.; Sautereau, H.; Gerard, J.F. Epoxy composites based on glass beads. I. Viscoelastic properties. J. Appl. Polym. Sci. 1992, 45, 1799–1810. [Google Scholar] [CrossRef]
- Charitos, I.; Mouzakis, D.; Kontou, E. Comparing the rheological and reinforcing effects of graphene oxide on glassy and semicrystalline polymers. Polym. Eng. Sci. 2019, 59, 1933–1947. [Google Scholar] [CrossRef]
- Lau, K.; Gu, C.; Hui, D. A critical review on nanotube and nanotube/nanoclay related polymer composite materials. Compos. Part B Eng. 2006, 37, 425–436. [Google Scholar] [CrossRef]
- Yang, J.; Sang, Y.; Chen, F.; Fei, Z.; Zhong, M. Synthesis of silica particles grafted with poly(ionic liquid) and their nucleation effect on microcellular foaming of polystyrene using supercritical carbon dioxide. J. Supercrit. Fluids 2012, 62, 197–203. [Google Scholar] [CrossRef]
- Hsueh, C. -H Effects of Aspect Ratios of Ellipsoidal Inclusions on Elastic Stress Transfer of Ceramic Composites. J. Am. Ceram. Soc. 1989, 72, 344–347. [Google Scholar] [CrossRef]
- Nakamura, Y.; Yamaguchi, M.; Okubo, M.; Matsumoto, T. Effects of particle size on mechanical and impact properties of epoxy resin filled with spherical silica. J. Appl. Polym. Sci. 1992, 45, 1281–1289. [Google Scholar] [CrossRef]
- Kawaguchi, T.; Pearson, R.A. The effect of particle-matrix adhesion on the mechanical behavior of glass filled epoxies. Part 2. A study on fracture toughness. Polymer 2003, 44, 4239–4247. [Google Scholar] [CrossRef]
- Le, T.T.; Le, M.V. Nanoscale Effect Investigation for Effective Bulk Modulus of Particulate Polymer Nanocomposites Using Micromechanical Framework. Adv. Mater. Sci. Eng. 2021, 2021, 1563845. [Google Scholar] [CrossRef]
- Douce, J.; Boilot, J.P.; Biteau, J.; Scodellaro, L.; Jimenez, A. Effect of filler size and surface condition of nano-sized silica particles in polysiloxane coatings. Thin Solid Films 2004, 466, 114–122. [Google Scholar] [CrossRef]
- Rodrigue, D.; Kavianiboroujeni, A.; Cloutier, A. Determination of the optimum coupling agent content for composites based on hemp and high density polyethylene. AIP Conf. Proc. 2017, 1914, 030003. [Google Scholar] [CrossRef] [Green Version]
- Meng, Q.K.; Hetzer, M.; De Kee, D. PLA/clay/wood nanocomposites: Nanoclay effects on mechanical and thermal properties. J. Compos. Mater. 2011, 45, 1145–1158. [Google Scholar] [CrossRef]
- Tsai, P.A.; Chiu, W.M.; Lin, C.E.; Wu, J.H. Fabrication and Characterization of PLA/SiO2/Al2O3 Composites Prepared by Sol-Gel Process. Polym. Plast. Technol. Eng. 2013, 52, 1488–1495. [Google Scholar] [CrossRef]
- Piekarska, K.; Sowinski, P.; Piorkowska, E.; Haque, M.M.U.; Pracella, M. Structure and properties of hybrid PLA nanocomposites with inorganic nanofillers and cellulose fibers. Compos. Part A Appl. Sci. Manuf. 2016, 82, 34–41. [Google Scholar] [CrossRef]
- Charitos, I.; Georgousis, G.; Klonos, P.A.; Kyritsis, A.; Mouzakis, D.; Raptis, Y.; Kontos, A.; Kontou, E. The synergistic effect on the thermomechanical and electrical properties of carbonaceous hybrid polymer nanocomposites. Polym. Test. 2021, 95, 107102. [Google Scholar] [CrossRef]
- Turcsányi, B.; Pukánszky, B.; Tüdõs, F. Composition dependence of tensile yield stress in filled polymers. J. Mater. Sci. Lett. 1988, 7, 160–162. [Google Scholar] [CrossRef]
- Maghsoudlou, M.A.; Barbaz Isfahani, R.; Saber-Samandari, S.; Sadighi, M. Effect of interphase, curvature and agglomeration of SWCNTs on mechanical properties of polymer-based nanocomposites: Experimental and numerical investigations. Compos. Part B Eng. 2019, 175, 107119. [Google Scholar] [CrossRef]
- Boutaleb, S.; Zaïri, F.; Mesbah, A.; Naït-Abdelaziz, M.; Gloaguen, J.M.; Boukharouba, T.; Lefebvre, J.M. Micromechanics-based modelling of stiffness and yield stress for silica/polymer nanocomposites. Int. J. Solids Struct. 2009, 46, 1716–1726. [Google Scholar] [CrossRef]
- Ju, J.W.; Chen, T.M. Micromechanics and effective moduli of elastic composites containing randomly dispersed ellipsoidal inhomogeneities. Acta Mech. 1994, 103, 103–121. [Google Scholar] [CrossRef]
- Hori, M.; Nemat-Nasser, S. Double-inclusion model and overall moduli of multi-phase composites. Mech. Mater. 1993, 14, 189–206. [Google Scholar] [CrossRef]
- Odegard, G.M.; Clancy, T.C.; Gates, T.S. Modeling of the Mechanical Properties of Nanoparticle/Polymer Composites; Jenny Stanford Publishing: Dubai, United Arab Emerites, 2017; pp. 319–342. [Google Scholar]
- Brune, D.A.; Biccerano, J. Micromechanics of nanocomposites: Comparison of tensile and compressive elastic moduli, and prediction of effects of incomplete exfoliation and imperfect alignment on modulus. Polymer 2002, 43, 369–387. [Google Scholar] [CrossRef]


| Specimen’s Designations | Matrix Type | SiO2Filler wt%/Vf | SiO2Filler Diameter∅ [nm] |
|---|---|---|---|
| PLA | poly-lactic acid (PLA) | 0/0 | - |
| PLA/13-22 | -//- | 4/0.025 | 13–22 |
| PLA/15-35 | -//- | -//- | 15–35 |
| PLA/18-35 * | -//- | -//- | 18–35 |
| PLA/55-75 | -//- | -//- | 55–75 |
| PLA/0.5 | -//- | -//- | 500 |
| PLA/1.0 | -//- | -//- | 1000 |
| PLA/1.5 | -//- | -//- | 1500 |
| Resin ES-35 | bisphenol A—Epoxy- DGEBA | 0/0 | - |
| Res/13-22 | -//- | 4/0.025 | 13–22 |
| Res/15-35 | -//- | -//- | 15–35 |
| Res/18-35 * | -//- | -//- | 18–35 |
| Res/55-75 | -//- | -//- | 55–75 |
| Res/0.5 | -//- | -//- | 500 |
| Res/1.0 | -//- | -//- | 1000 |
| Res/1.5 | -//- | -//- | 1500 |
| Material/ Specimens | Young’s Modulus (MPa) | Modulus Increment% | Yield Stress (MPa) | Yield Strain | Tensile Strength (MPa) | Failure Strain |
|---|---|---|---|---|---|---|
| PLA | 3000 ± 120 | - | 48.6 ± 3.5 | 0.02 | 36.9 | 0.056 |
| PLA/13-22 | 3200 ± 140 | 7 | 47.8 ± 3.1 | 0.019 | 43.3 | 0.02 |
| PLA/15-35 | 3600 ± 144 | 20 | 48.9 ± 3.0 | 0.018 | 48.6 | 0.02 |
| PLA/18-35 | 3800 ± 185 | 27 | 43.0 ± 2.8 | 0.016 | 43.0 | 0.016 |
| PLA/55-75 | 3202 ± 135 | - | 37.8 ± 2.8 | 0.015 | 31.0 | 0.04 |
| PLA/0.5 | 3455 ± 131 | 15 | 45.8 ± 2.8 | 0.017 | 41.3 | 0.047 |
| PLA/1.0 | 3250 ± 130 | 8 | 39.2 ± 2.4 | 0.018 | 32.0 | 0.025 |
| PLA/1.5 | 3120 ± 123 | 4 | 41.0 ± 2.3 | 0.019 | - | 0.018 |
| Resin ES-35 | 2150 ± 107 | - | 38.5 ± 3.2 | 0.03 | 20.0 | 0.17 |
| Res/13-22 | 2800 ± 133 | 30 | 40 ± 3.3 | 0.024 | 22.5 | 0.07 |
| Res/15-35 | 2600 ± 117 | 21 | 43 ± 2.1 | 0.028 | 20.0 | 0.09 |
| Res/18-35 | 2900 ± 122 | 34.8 | 43 ± 3.0 | 0.028 | 25.0 | 0.08 |
| Res/55-75 | 3450 ± 149 | 60 | 40 ± 2.1 | 0.027 | 26.0 | 0.13 |
| Res/0.5 | 2470 ± 104 | 15 | 42.2 ± 2.8 | 0.028 | 20.0 | 0.085 |
| Res/1.0 | 2380 ± 100 | 11 | 38 ± 4.0 | 0.028 | 23.6 | 0.08 |
| Res/1.5 | 2500 ± 108 | 16 | 41.5 ± 2.5 | 0.026 | 25.0 | 0.07 |
| Material | Interaction Parameter |
|---|---|
| PLA | - |
| PLA/13-22 | 2.77 |
| PLA/15-35 | 3.68 |
| PLA/18-35 | - |
| PLA/55-75 | - |
| PLA/0.5 | 1.06 |
| PLA/1.0 | - |
| PLA/1.5 | - |
| Resin | - |
| Res/13-22 | 4.96 |
| Res/15-35 | 7.86 |
| Res/18-35 | 7.86 |
| Res/55-75 | 4.96 |
| Res/0.5 | 7.10 |
| Res/1.0 | 2.91 |
| Res/1.5 | 6.44 |
| Material | Average Particle Diameter | Young’s Modulus Experim. | Young’s Modulus FEA | FEA Results Deviation from Experim. | Young’s Modulus FEA/Interphase | FEA/Interphase Results Deviation from Experim. |
|---|---|---|---|---|---|---|
| (nm) | (MPa) | (MPa) | (%) | (MPa) | (%) | |
| PLA | - | 3000 | - | - | - | - |
| PLA/13-22 | 17.5 | 3200 | 3128 | 2.25 | 3284 | 2.62 |
| PLA/15-35 | 25.0 | 3600 | 3131 | 13.0 | 3585 | 0.41 |
| PLA/18-35 | 26.5 | 3800 | 3197 | 15.8 | 3840 | 1.0 |
| PLA/55-75 | 65.0 | 3202 | 3162 | 1.25 | 3226 | 0.75 |
| PLA/0.5 | 500 | 3455 | 3205 | 7.23 | 3425 | 0.10 |
| PLA/1.0 | 1000 | 3250 | 3177 | 2.25 | 3219 | 0.95 |
| PLA/1.5 | 1500 | 3120 | 3161 | 1.31 | 3180 | 1.90 |
| Resin ES-35 | - | 2150 | - | - | - | - |
| Res/13-22 | 17.5 | 2800 | 2321 | 17.1 | 2819 | 0.67 |
| Res/15-35 | 25.0 | 2600 | 2300 | 11.5 | 2690 | 3.46 |
| Res/18-35 | 26.5 | 2900 | 2297 | 20.8 | 2982 | 2.82 |
| Res/55-75 | 65.0 | 3450 | 2278 | 33.9 | 3400 | 1.45 |
| Res/0.5 | 500 | 2470 | 2273 | 7.97 | 2446 | 0.97 |
| Res/1.0 | 1000 | 2380 | 2280 | 4.2 | 2388 | 0.33 |
| Res/1.5 | 1500 | 2500 | 2275 | 9.0 | 2496 | 0.16 |
| Material | Interphase Volume Fraction (FEA) | Interphase Volume Fraction (analytical Model) |
|---|---|---|
| Resin | - | - |
| Res/13-22 | 0.10 | 0.74 |
| Res/15-35 | 0.08 | 0.63 |
| Res/18-35 | 0.14 | 0.81 |
| Res/55-75 | 0.23 | 0.88 |
| Res/0.5 | 0.03 | 0.018 |
| Res/1.0 | 0.025 | 0.017 |
| Res/1.5 | 0.05 | 0.01 |
Disclaimer/Publisher’s Note: The statements, opinions and data contained in all publications are solely those of the individual author(s) and contributor(s) and not of MDPI and/or the editor(s). MDPI and/or the editor(s) disclaim responsibility for any injury to people or property resulting from any ideas, methods, instructions or products referred to in the content. |
© 2023 by the authors. Licensee MDPI, Basel, Switzerland. This article is an open access article distributed under the terms and conditions of the Creative Commons Attribution (CC BY) license (https://creativecommons.org/licenses/by/4.0/).
Share and Cite
Kontou, E.; Christopoulos, A.; Koralli, P.; Mouzakis, D.E. The Effect of Silica Particle Size on the Mechanical Enhancement of Polymer Nanocomposites. Nanomaterials 2023, 13, 1095. https://doi.org/10.3390/nano13061095
Kontou E, Christopoulos A, Koralli P, Mouzakis DE. The Effect of Silica Particle Size on the Mechanical Enhancement of Polymer Nanocomposites. Nanomaterials. 2023; 13(6):1095. https://doi.org/10.3390/nano13061095
Chicago/Turabian StyleKontou, Evagelia, Angelos Christopoulos, Panagiota Koralli, and Dionysios E. Mouzakis. 2023. "The Effect of Silica Particle Size on the Mechanical Enhancement of Polymer Nanocomposites" Nanomaterials 13, no. 6: 1095. https://doi.org/10.3390/nano13061095