
Automated Prediction of Bacterial Exclusion Areas on SEM Images of Graphene–Polymer Composites
 , , , , and
Abstract
:1. Introduction
2. Results and Discussion
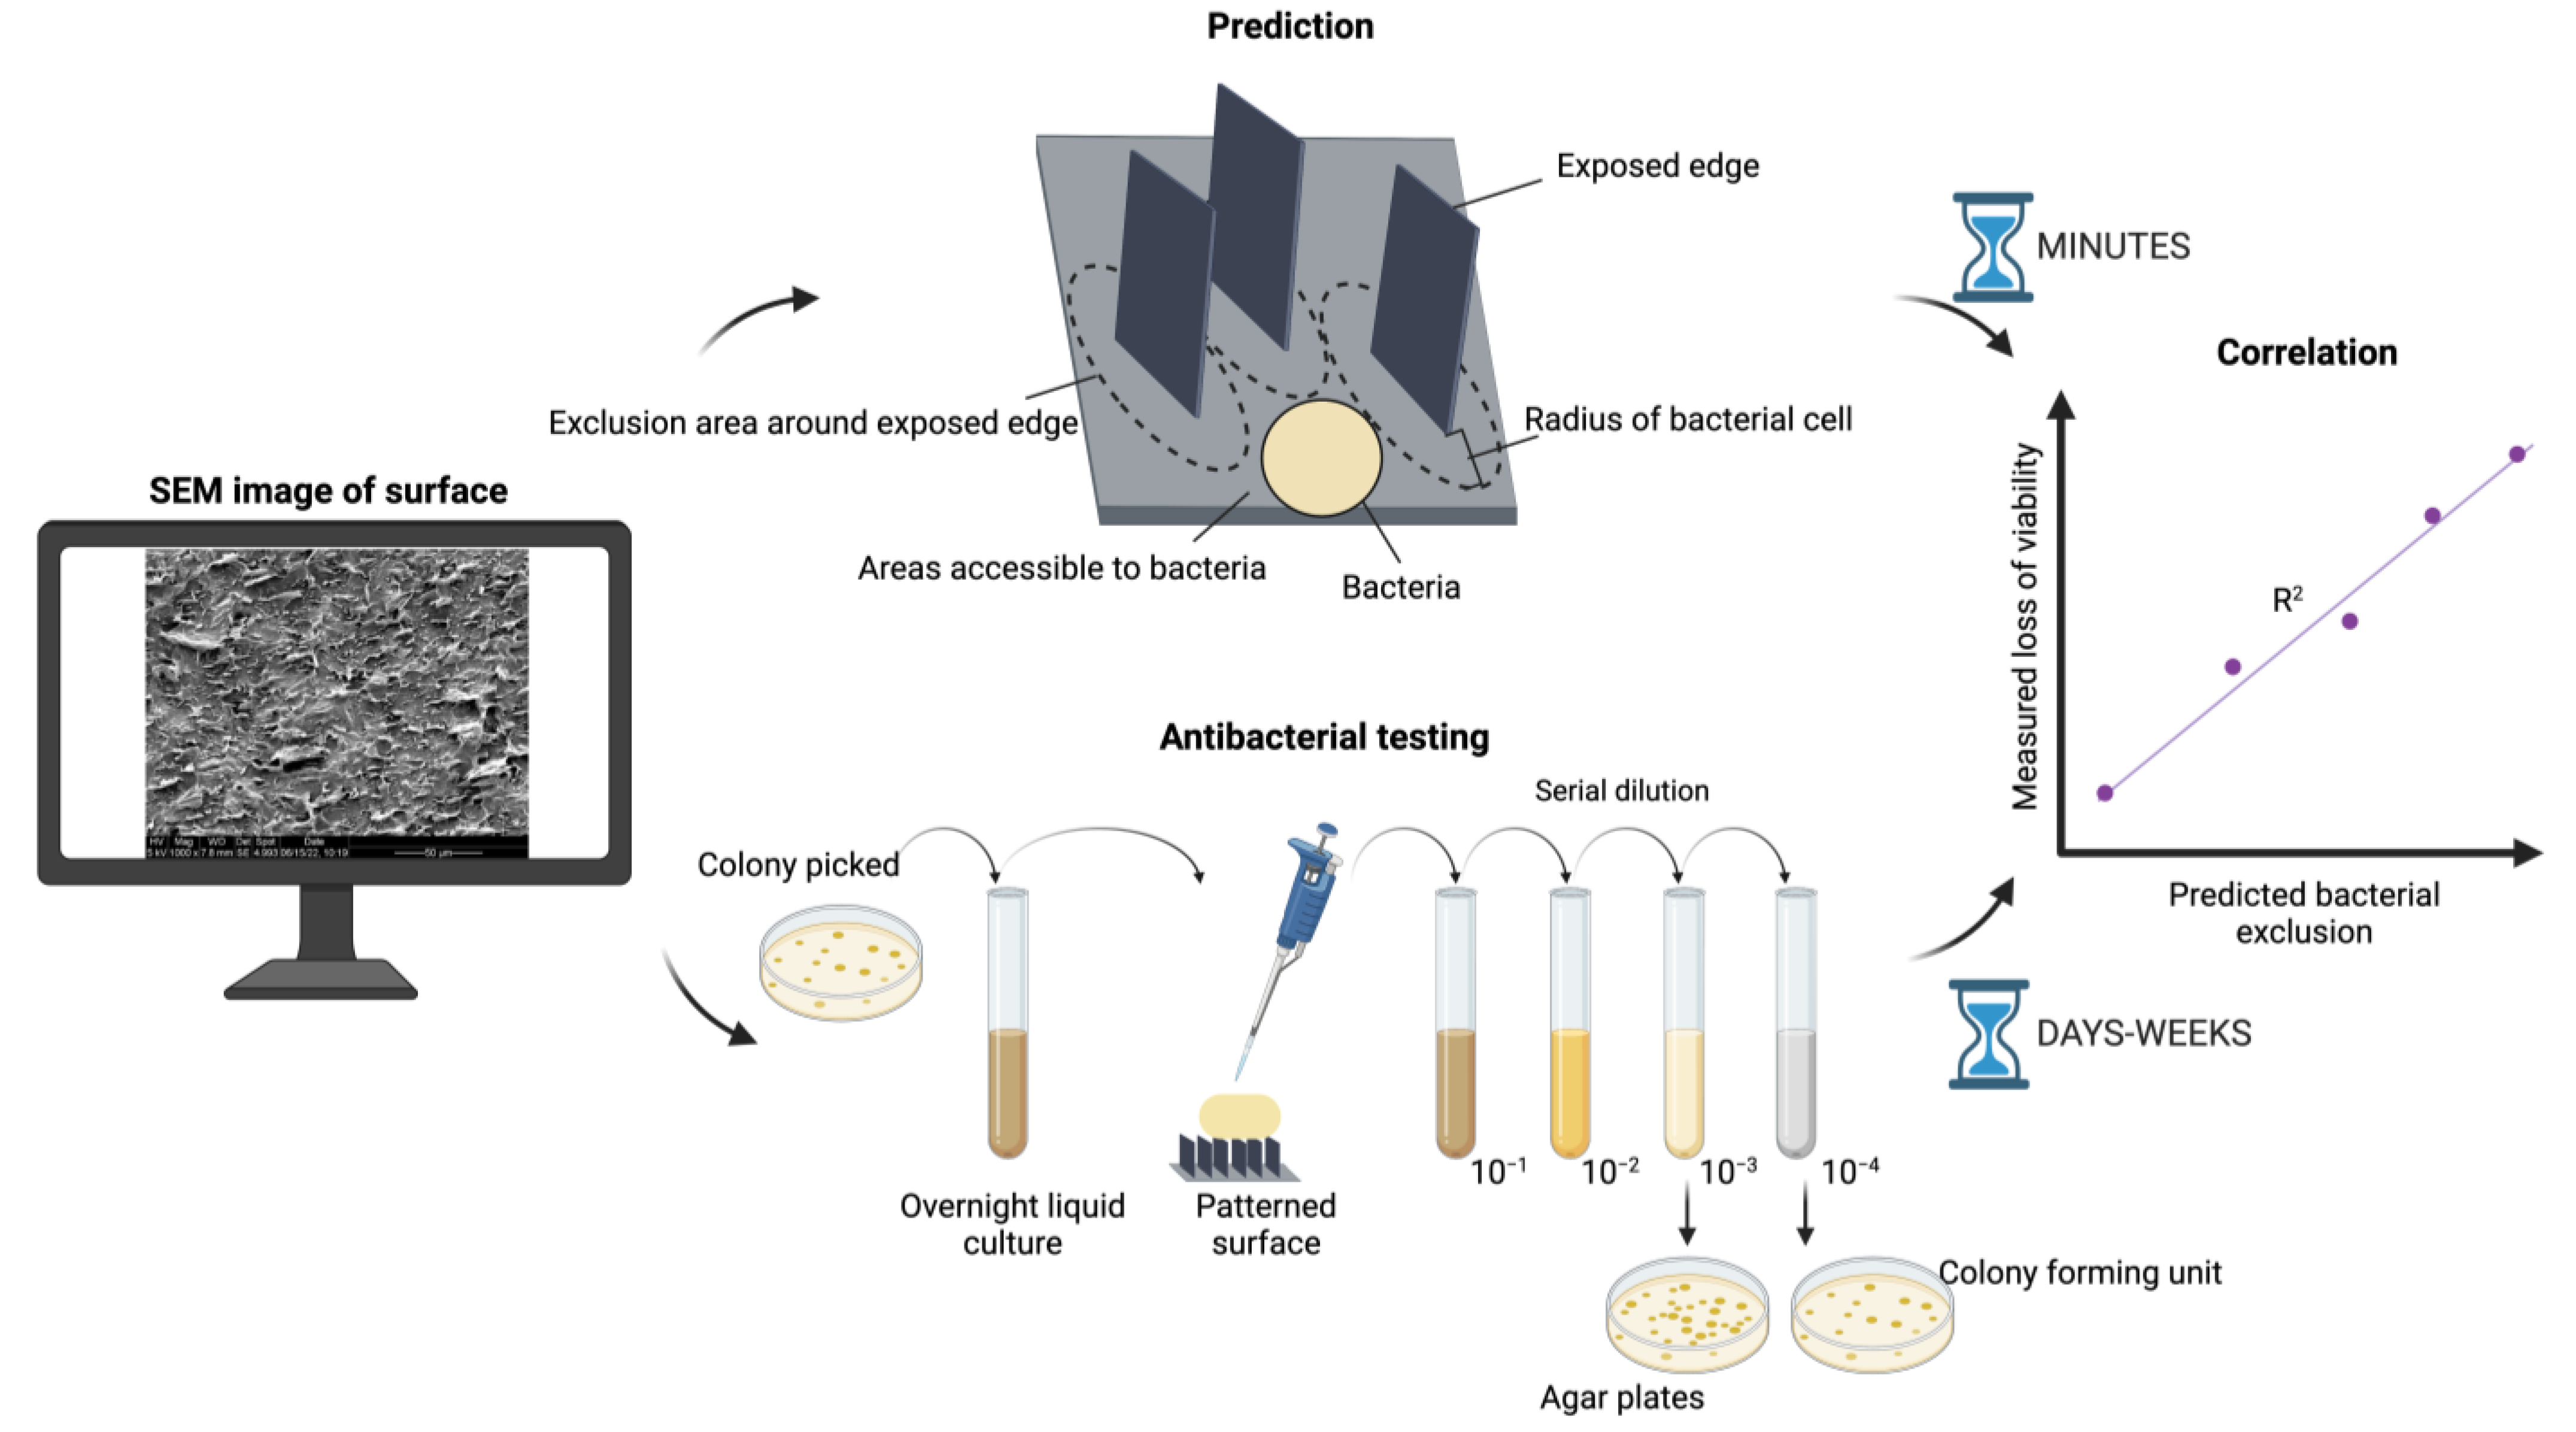
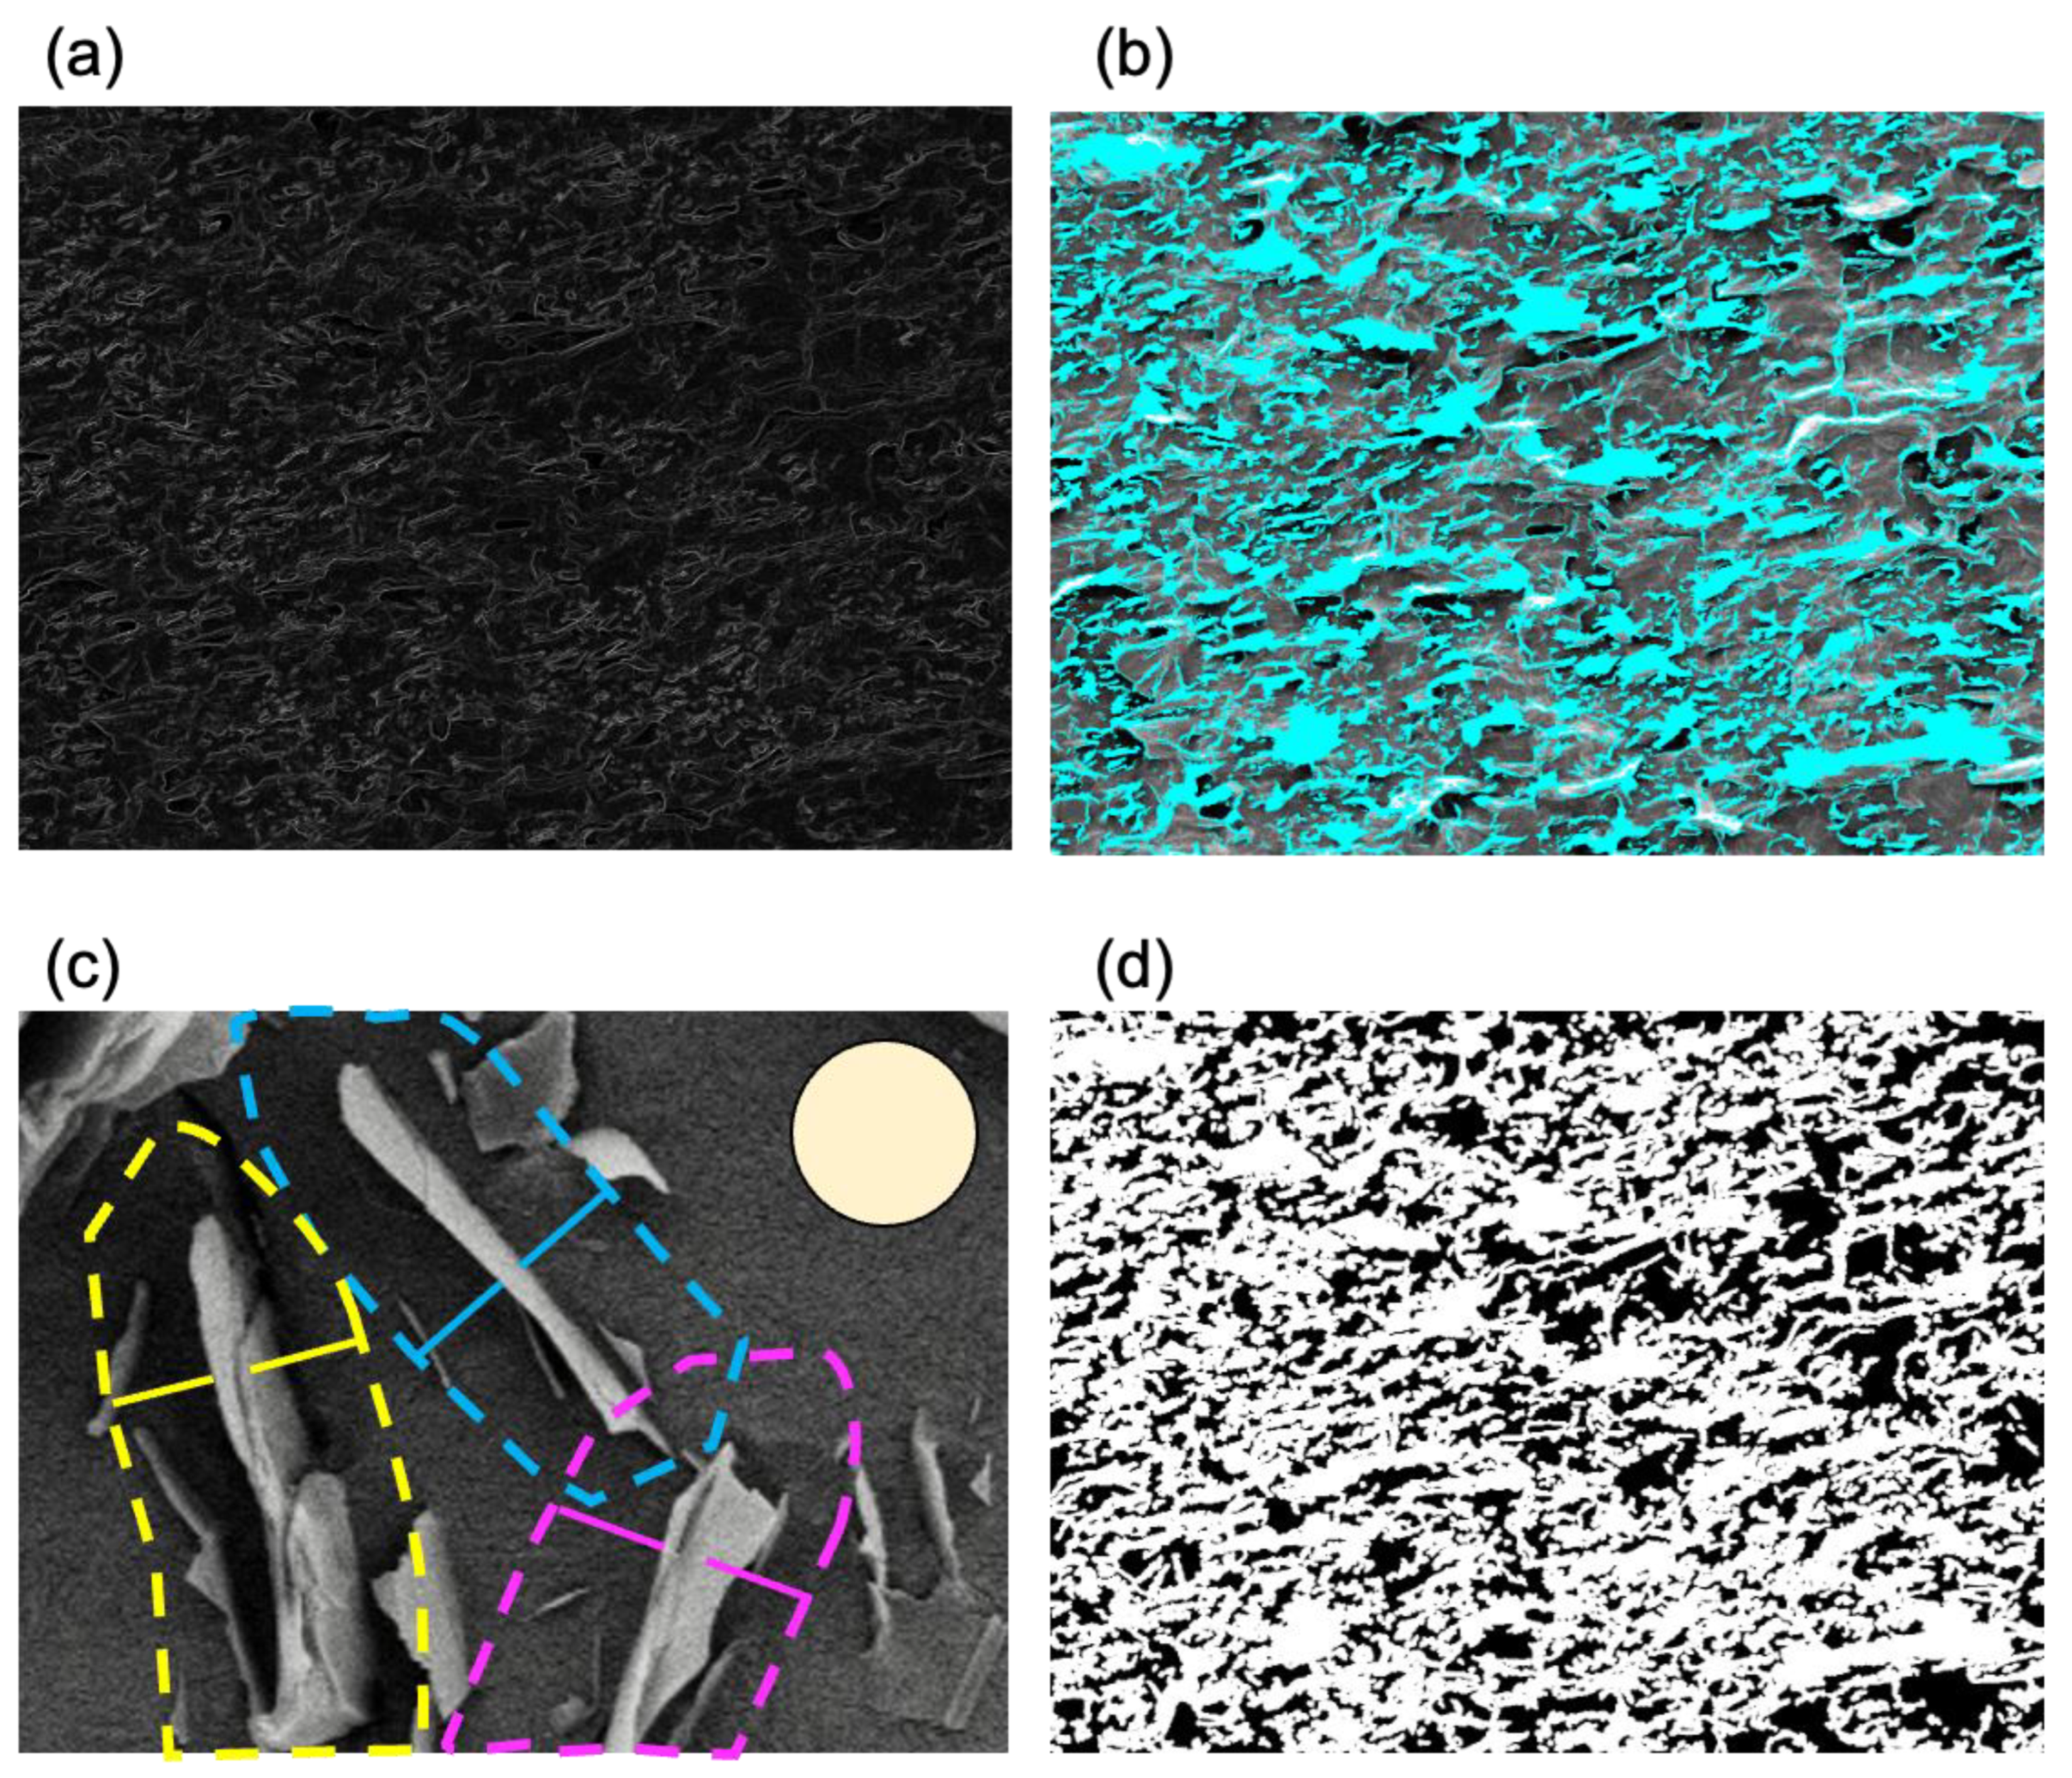
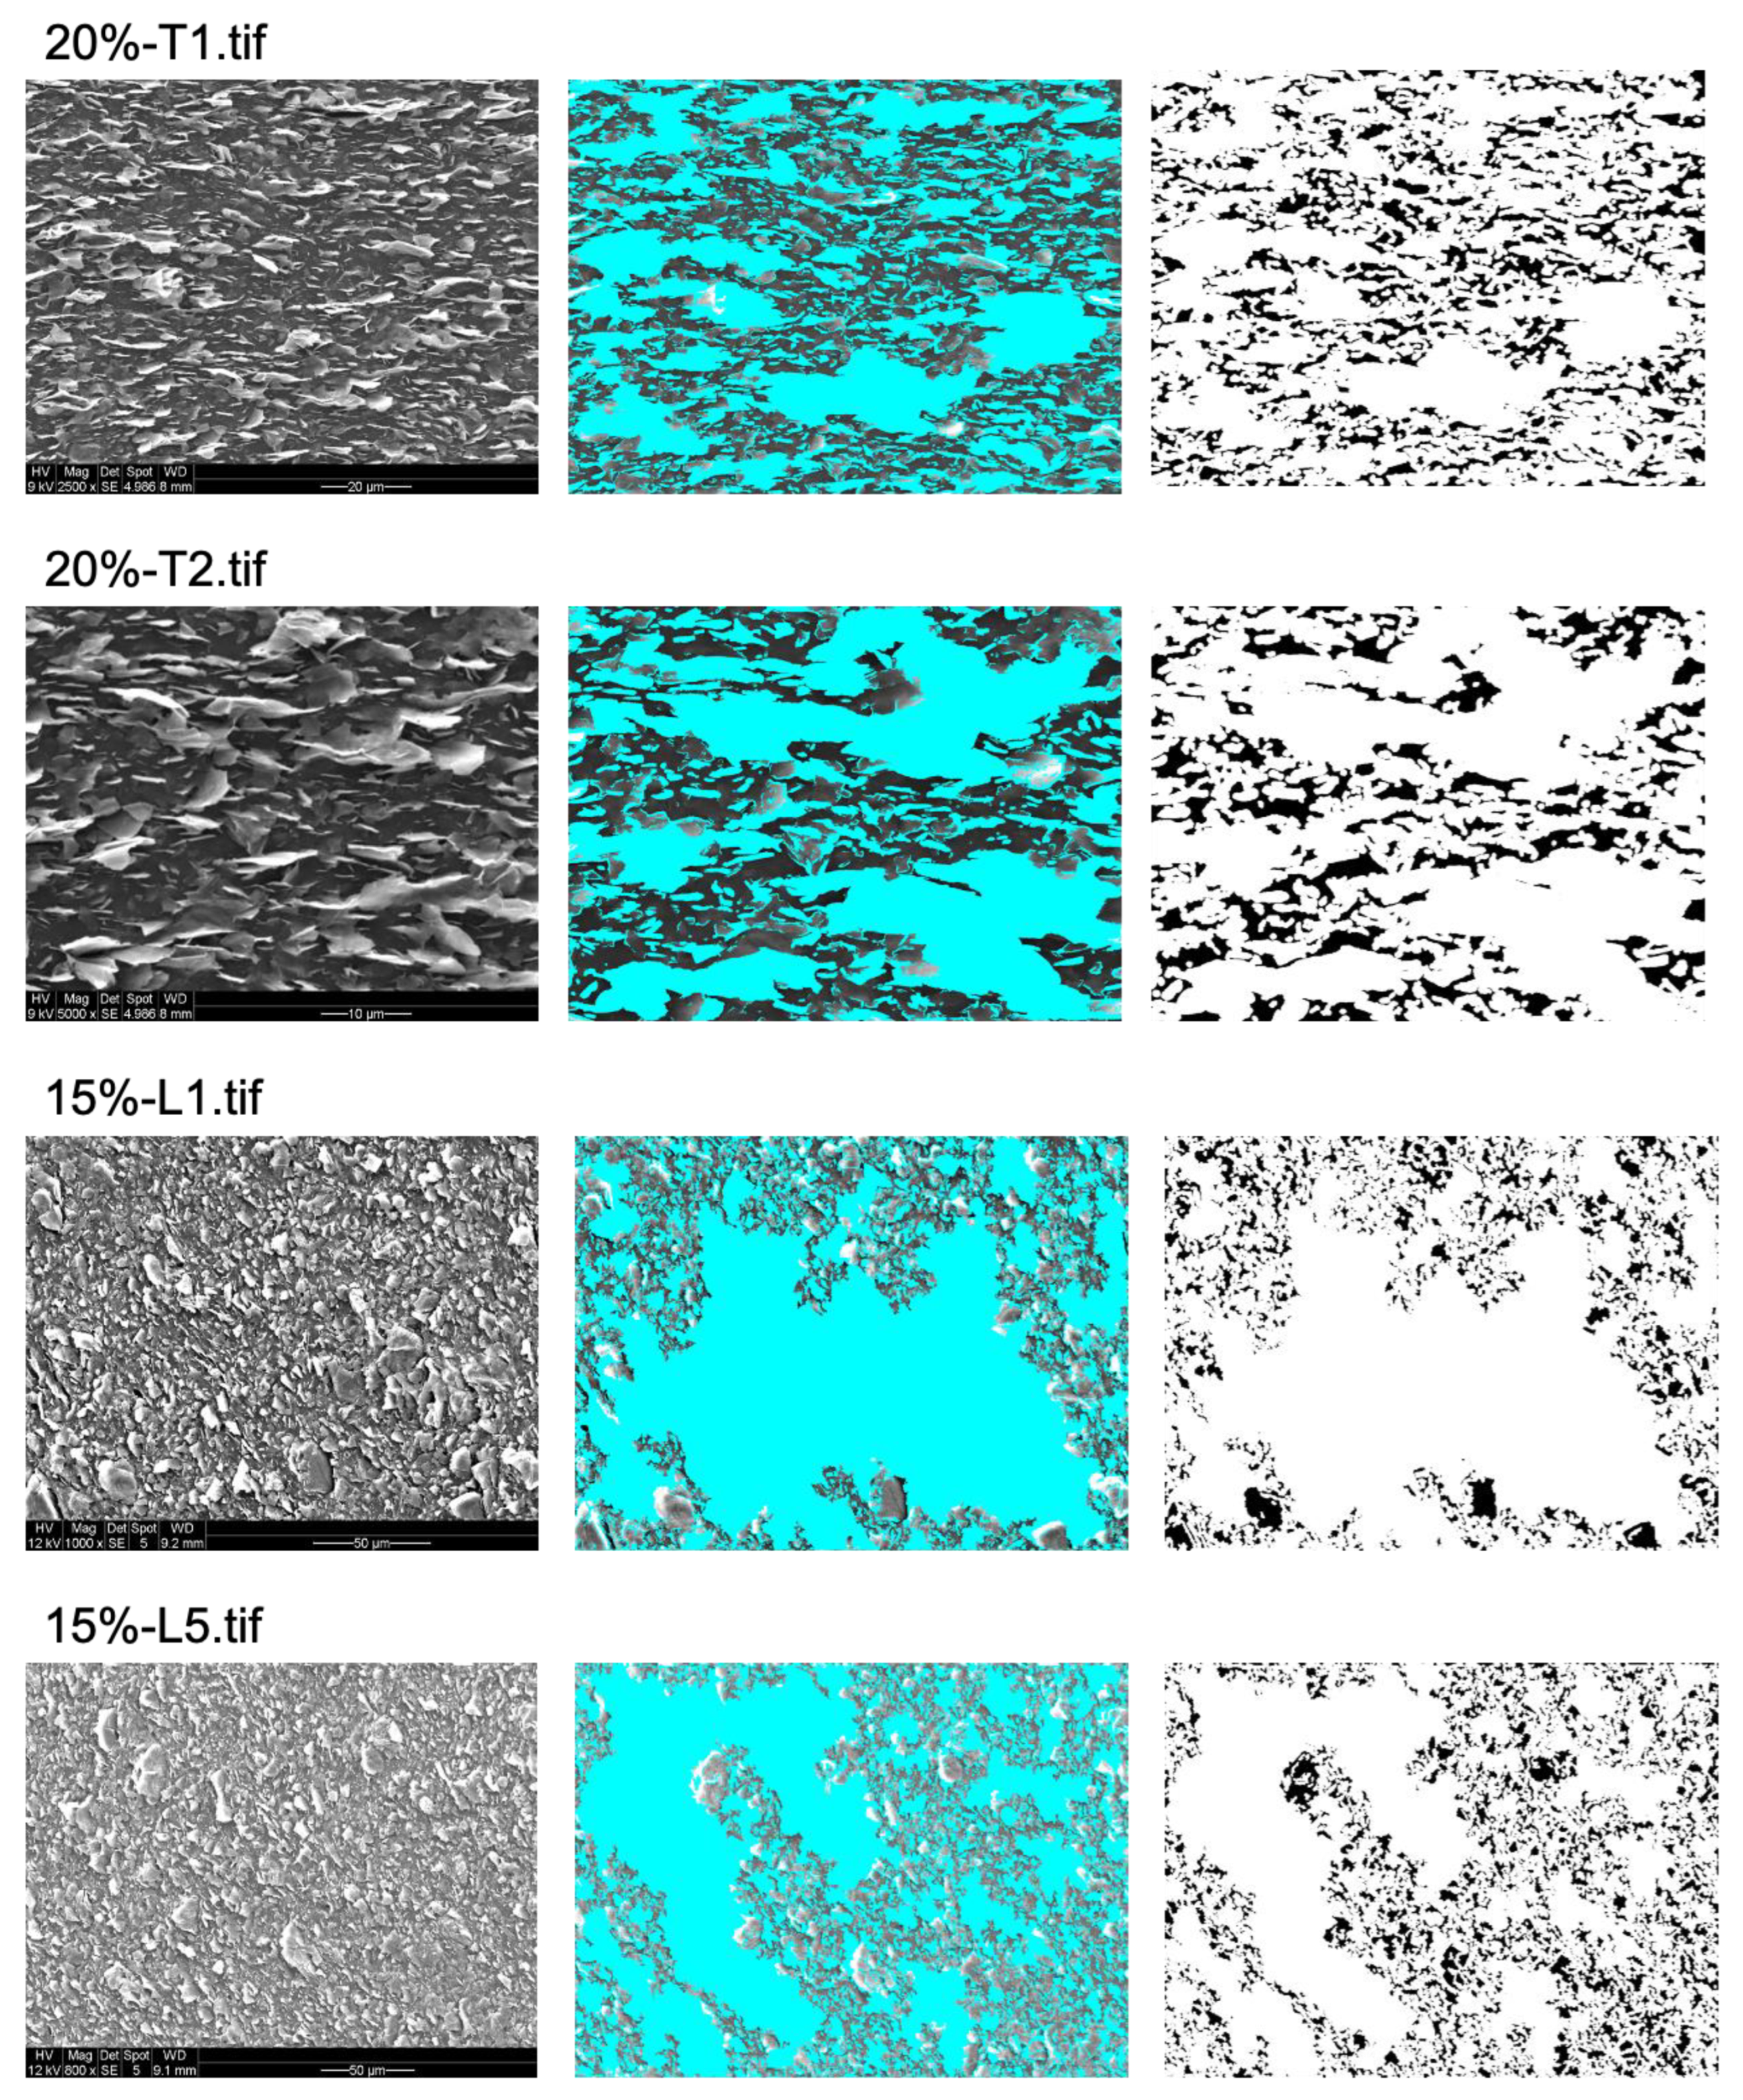
2.1. Algorithm Predicts Bacterial Exclusion Areas from SEM Images of Composite Surface
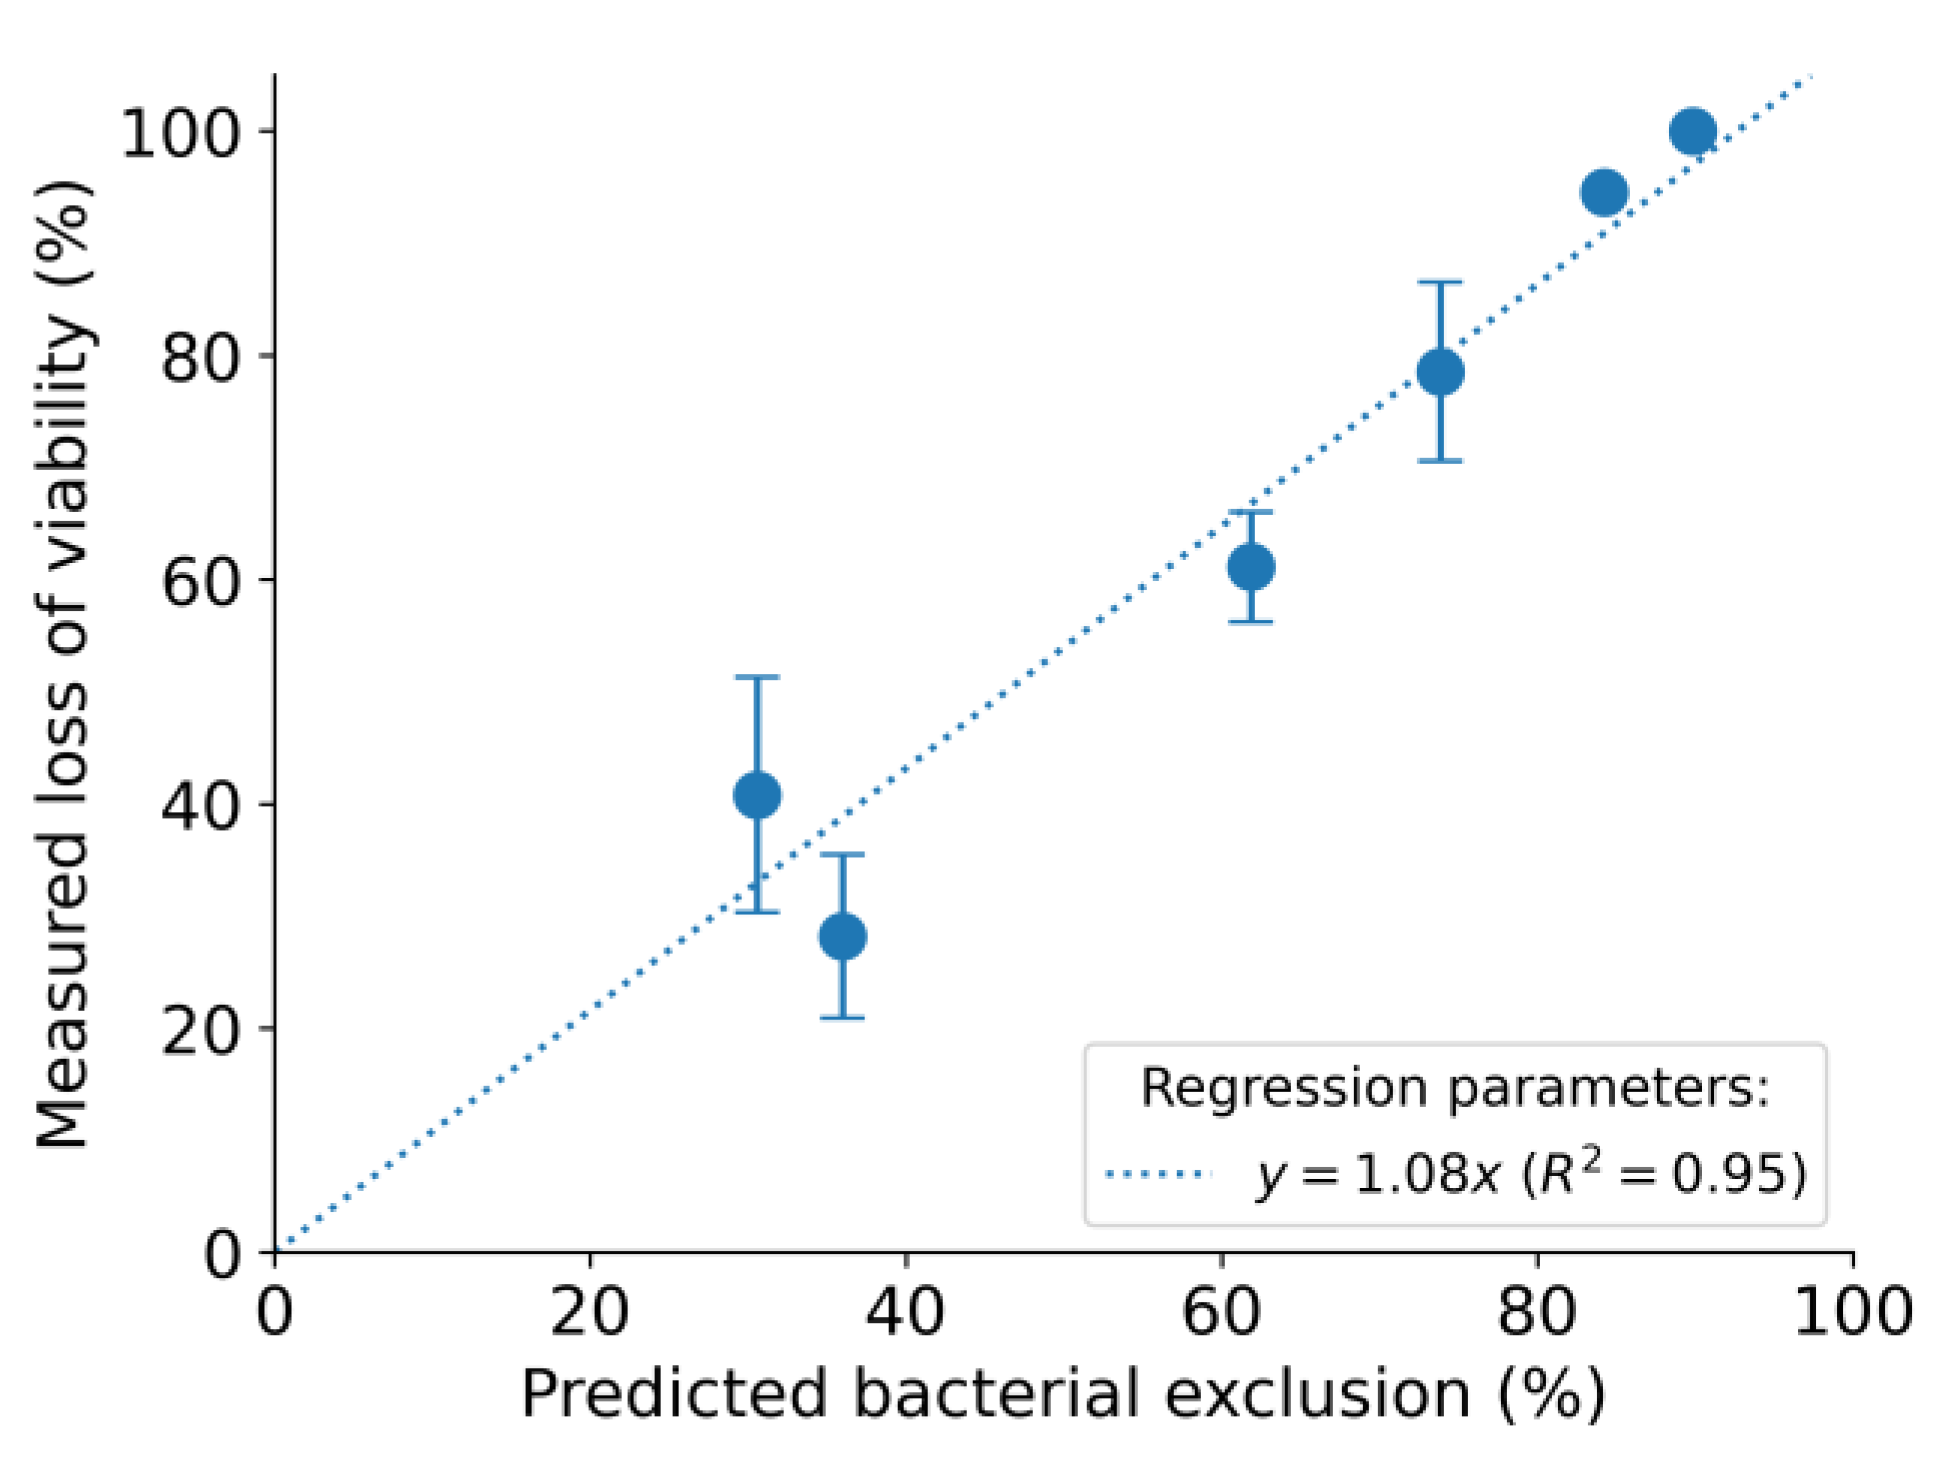
2.2. Predicted Bacterial Exclusion Areas Correlate Well with Experimental Measurements of S. epidermidis Viability
3. Conclusions
4. Materials and Methods
4.1. Polymer Integration with Graphene Nanoplatelets and Scanning Electron Microscopy (SEM) Imaging
4.2. Evaluation of Antibiofilm Potential
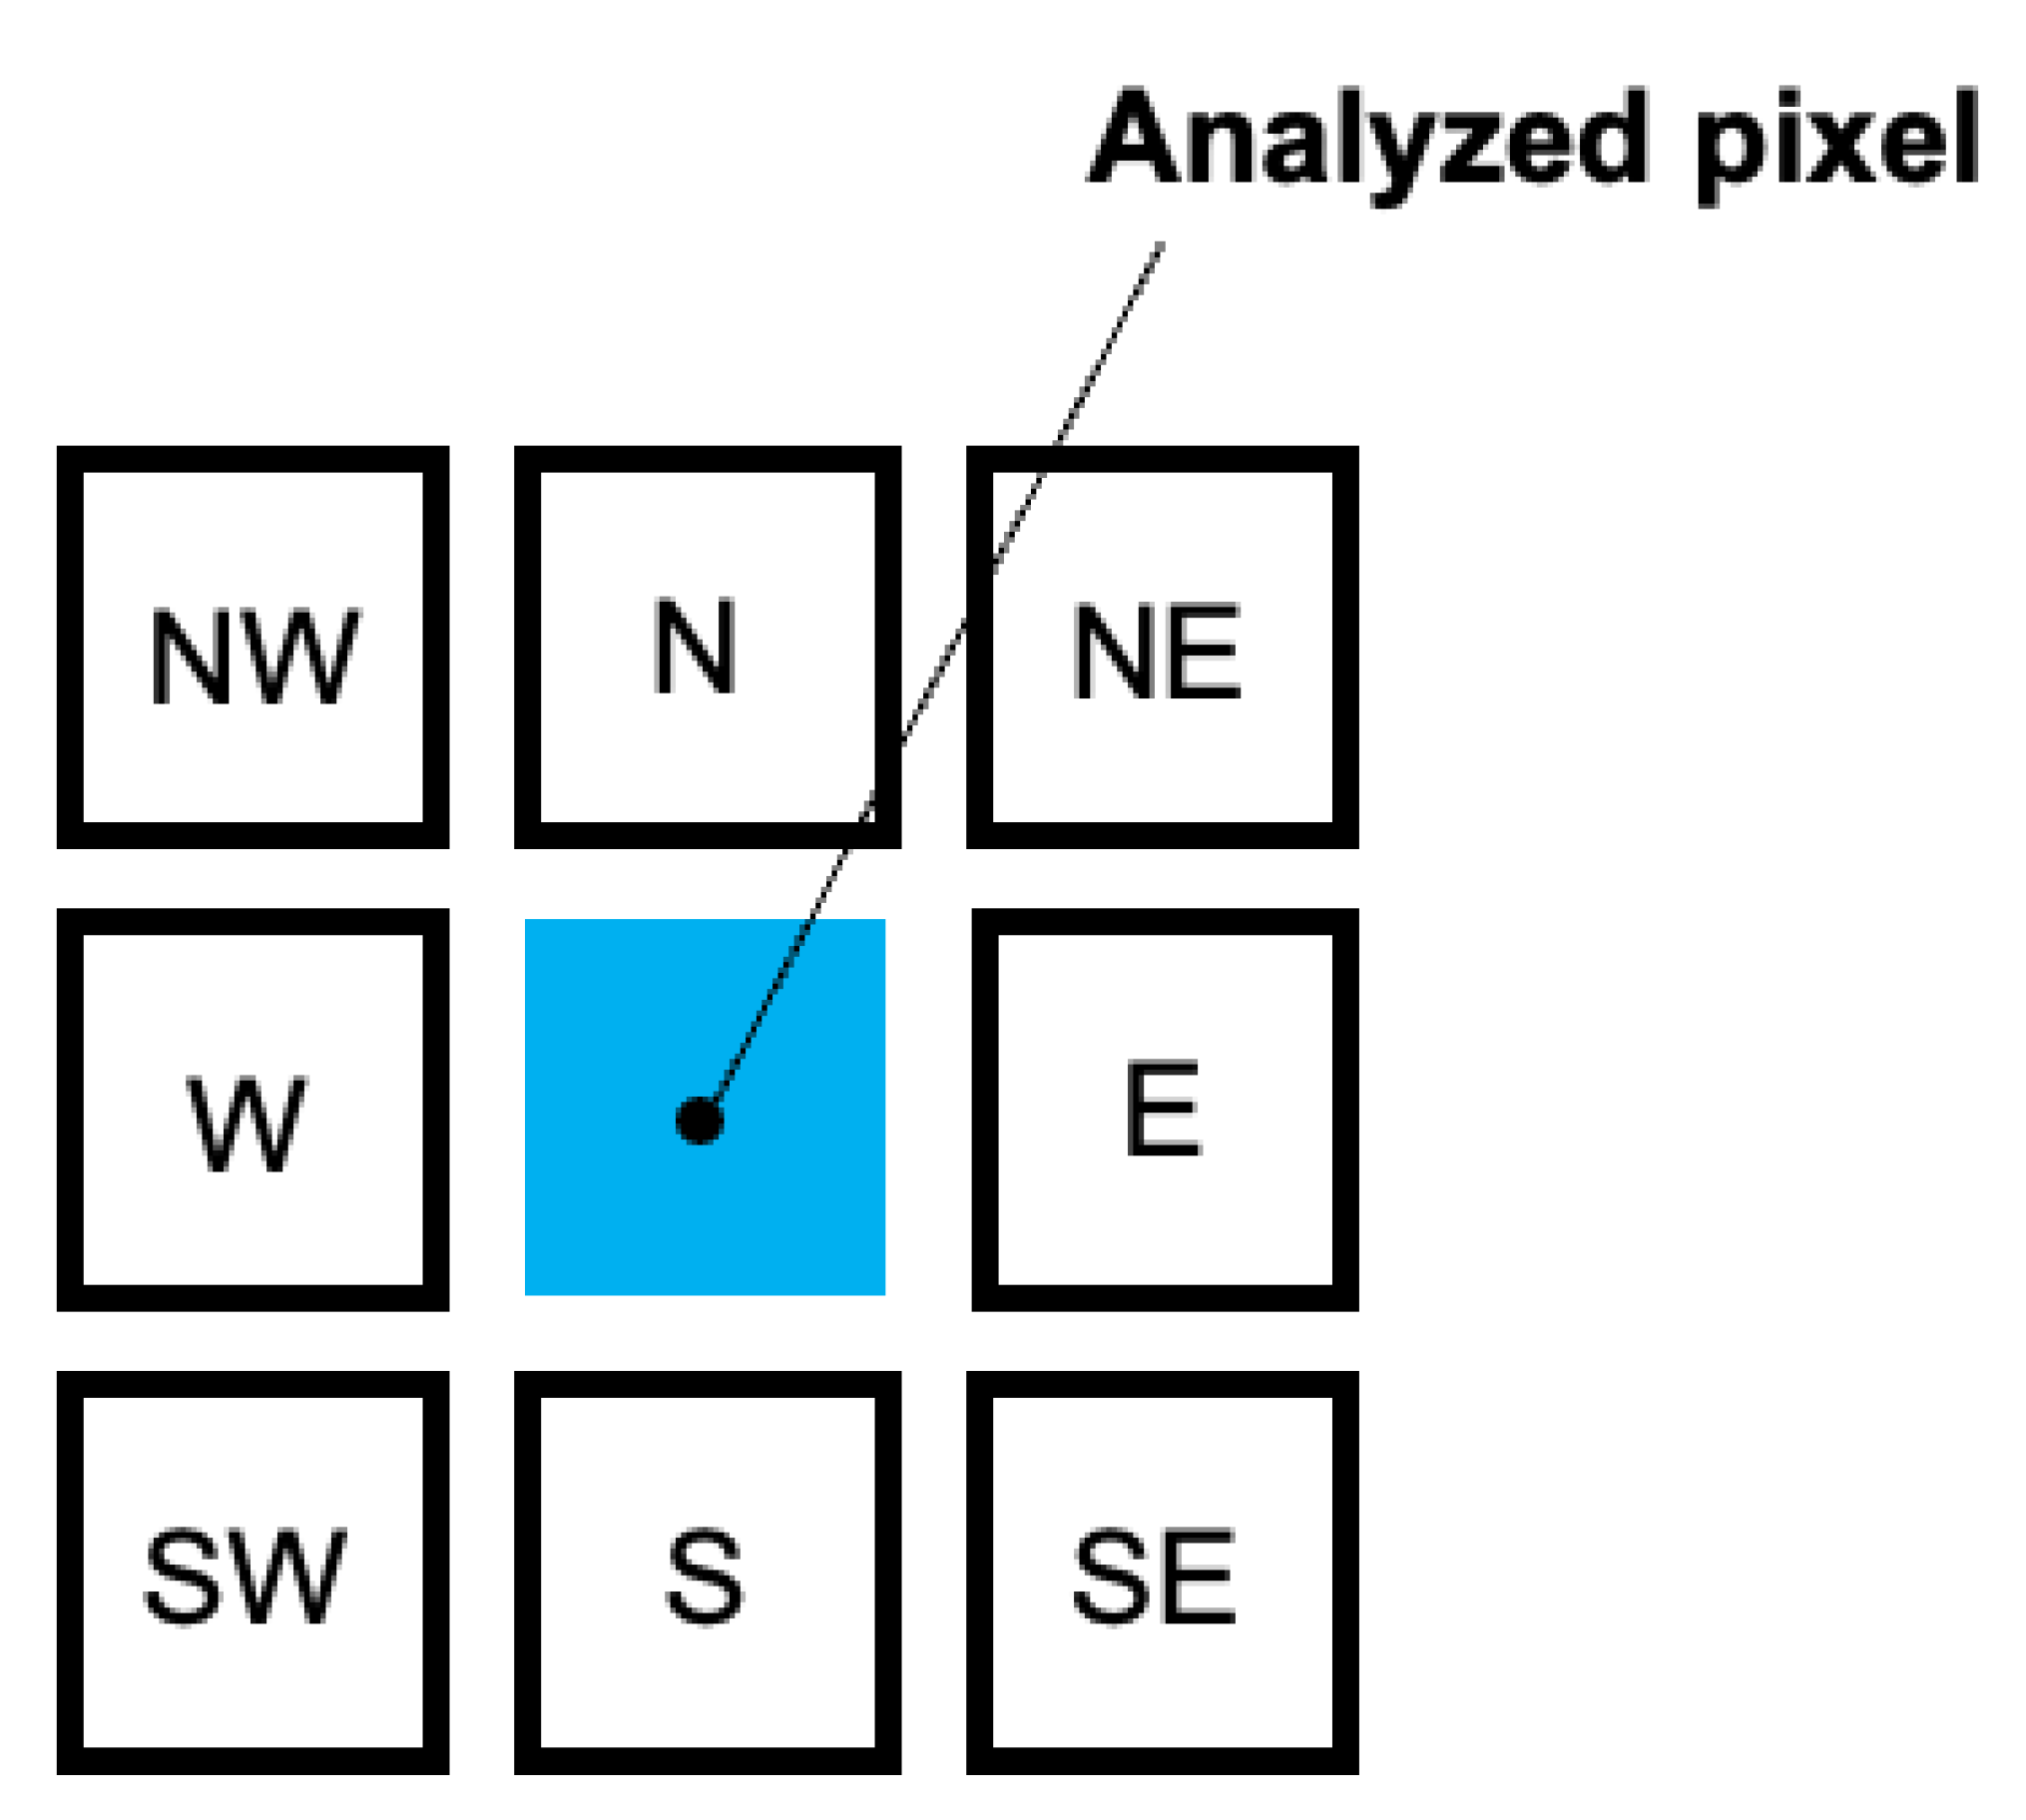
4.3. Development of SEM Image Analysis Algorithm
4.4. Bacterial Exclusion Area Determination
- a.
- The binary image enables us to define groups of connected white pixels isolated from other pixels by black pixels as individual groups. Each group represents a detected graphene flake.
- b.
- Calculation of the area of each group by counting the pixels in the group.
- c.
- Remove group if the area is below a threshold set by the user.
Author Contributions
Funding
Data Availability Statement
Conflicts of Interest
References
- Román-Kustas, J.; Hoffman, J.B.; Reed, J.H.; Gonsalves, A.E.; Oh, J.; Li, L.; Hong, S.; Jo, K.D.; Dana, C.E.; Miljkovic, N.; et al. Molecular and topographical organization: Influence on cicada wing wettability and bactericidal properties. Adv. Mater. Interfaces 2020, 7, 2000112. [Google Scholar] [CrossRef]
- Ivanova, E.P.; Hasan, J.; Webb, H.K.; Truong, V.K.; Watson, G.S.; Watson, J.A.; Baulin, V.A.; Pogodin, S.; Wang, J.Y.; Tobin, M.J.; et al. Natural bactericidal surfaces: Mechanical rupture of Pseudomonas aeruginosa cells by cicada wings. Small 2012, 8, 2489. [Google Scholar] [CrossRef] [PubMed]
- Bandara, C.D.; Singh, S.; Afara, I.O.; Wolff, A.; Tesfamichael, T.; Ostrikov, K.; Oloyede, A. Bactericidal Effects of Natural Nanotopography of Dragonfly Wing on Escherichia coli. ACS Appl. Mater. Interfaces 2017, 9, 6746. [Google Scholar] [CrossRef] [PubMed]
- Rostami, S.; Garipcan, B. Evolution of antibacterial and antibiofouling properties of sharkskin-patterned surfaces. Surf. Innov. 2022, 10, 165. [Google Scholar] [CrossRef]
- Watson, G.S.; Green, D.W.; Schwarzkopf, L.; Li, X.; Cribb, B.W.; Myhra, S.; Watson, J.A. A gecko skin micro/nano structure–A low adhesion, superhydrophobic, anti-wetting, self-cleaning, biocompatible, antibacterial surface. Acta Biomater. 2015, 21, 109. [Google Scholar] [CrossRef]
- Pandit, S.; Cao, Z.; Mokkapati, V.R.S.S.; Celauro, E.; Yurgens, A.; Lovmar, M.; Westerlund, F.; Sun, J.; Mijakovic, I. Vertically aligned graphene coating is bactericidal and prevents the formation of bacterial biofilms. Adv. Mater. Interfaces 2018, 5, 1701331. [Google Scholar] [CrossRef]
- Pandit, S.; Gaska, K.; Mokkapati, V.R.S.S.; Celauro, E.; Derouiche, A.; Forsberg, S.; Svensson, M.; Kádár, R.; Mijakovic, I. Precontrolled alignment of graphite nanoplatelets in polymeric composites prevents bacterial attachment. Small 2020, 16, 1904756. [Google Scholar] [CrossRef]
- Sun, J.; Rattanasawatesun, T.; Tang, P.; Bi, Z.; Pandit, S.; Lam, L.; Wasén, C.; Erlandsson, M.; Bokarewa, M.; Dong, J.; et al. Insights into the Mechanism for Vertical Graphene Growth by Plasma-Enhanced Chemical Vapor Deposition. ACS Appl. Mater. Interfaces 2022, 14, 7152. [Google Scholar] [CrossRef]
- Gaska, K.; Kádár, R.; Xu, X.; Gubanski, S.; Müller, C.; Pandit, S.; Mokkapati, V.R.S.S.; Mijakovic, I.; Rybak, A.; Siwek, A.; et al. Highly structured graphene polyethylene nanocomposites. AIP Conf. Proc. 2019, 2065, 030061. [Google Scholar]
- Reed, J.H.; Gonsalves, A.E.; Román, J.K.; Oh, J.; Cha, H.; Dana, C.E.; Toc, M.; Hong, S.; Hoffman, J.B.; Andrade, J.E.; et al. Ultrascalable multifunctional nanoengineered copper and aluminum for antiadhesion and bactericidal applications. ACS Appl. Bio Mater. 2019, 2, 2726. [Google Scholar] [CrossRef]
- Bhadra, C.M.; Khanh Truong, V.; Pham, V.T.; Al Kobaisi, M.; Seniutinas, G.; Wang, J.Y.; Juodkazis, S.; Crawford, R.J.; Ivanova, E.P. Antibacterial titanium nano-patterned arrays inspired by dragonfly wings. Sci. Rep. 2015, 5, 16817. [Google Scholar] [CrossRef] [PubMed]
- Lorenzetti, M.; Dogsa, I.; Stosicki, T.; Stopar, D.; Kalin, M.; Kobe, S.; Novak, S. The influence of surface modification on bacterial adhesion to titanium-based substrates. ACS Appl. Mater. Interfaces 2015, 7, 1644. [Google Scholar] [CrossRef] [PubMed]
- Tsimbouri, P.M.; Fisher, L.; Holloway, N.; Sjostrom, T.; Nobbs, A.H.; Meek, R.D.; Su, B.; Dalby, M.J. Osteogenic and bactericidal surfaces from hydrothermal titania nanowires on titanium substrates. Sci. Rep. 2016, 6, 36857. [Google Scholar] [CrossRef]
- Sengstock, C.; Lopian, M.; Motemani, Y.; Borgmann, A.; Khare, C.; Buenconsejo, P.J.S.; Schildhauer, T.A.; Ludwig, A.; Köller, M. Structure-related antibacterial activity of a titanium nanostructured surface fabricated by glancing angle sputter deposition. Nanotechnology 2014, 25, 195101. [Google Scholar] [CrossRef]
- Wu, S.; Zuber, F.; Brugger, J.; Maniura-Weber, K.; Ren, Q. Antibacterial Au nanostructured surfaces. Nanoscale 2016, 8, 2620. [Google Scholar] [CrossRef]
- Diu, T.; Faruqui, N.; Sjöström, T.; Lamarre, B.; Jenkinson, H.F.; Su, B.; Ryadnov, M.G. Cicada-inspired cell-instructive nanopatterned arrays. Sci. Rep. 2014, 4, 7122. [Google Scholar] [CrossRef]
- Hsu, L.C.; Fang, J.; Borca-Tasciuc, D.A.; Worobo, R.W.; Moraru, C.I. Effect of micro-and nanoscale topography on the adhesion of bacterial cells to solid surfaces. Appl. Environ. Microbiol. 2013, 79, 2703. [Google Scholar] [CrossRef] [PubMed]
- Ivanova, E.P.; Hasan, J.; Webb, H.K.; Gervinskas, G.; Juodkazis, S.; Truong, V.K.; Wu, A.H.F.; Lamb, R.N.; Baulin, V.A.; Watson, G.S.; et al. Bactericidal activity of black silicon. Nat. Commun. 2013, 4, 2838. [Google Scholar] [CrossRef]
- Dickson, M.N.; Liang, E.I.; Rodriguez, L.A.; Vollereaux, N.; Yee, A.F. Nanopatterned polymer surfaces with bactericidal properties. Biointerphases 2015, 10, 021010. [Google Scholar] [CrossRef]
- Slepička, P.; Fajstavr, D.; Krejčová, M.; Rimpelová, S.; Slepičková Kasálková, N.; Kolská, Z.; Švorčík, V. Biopolymer Composites with Ti/Au Nanostructures and Their Antibacterial Properties. Pharmaceutics 2021, 13, 826. [Google Scholar] [CrossRef]
- Bayraktar, I.; Doganay, D.; Coskun, S.; Kaynak, C.; Akca, G.; Unalan, H.E. 3D printed antibacterial silver nanowire/polylactide nanocomposites. Compos. B Eng. 2019, 172, 671. [Google Scholar] [CrossRef]
- Chen, Y.; Pandit, S.; Rahimi, S.; Mijakovic, I. Interactions Between Graphene-Based Materials and Biological Surfaces: A Review of Underlying Molecular Mechanisms. Adv. Mater. Interfaces 2021, 8, 2101132. [Google Scholar] [CrossRef]
- Perreault, F.; De Faria, A.F.; Nejati, S.; Elimelech, M. Antimicrobial properties of graphene oxide nanosheets: Why size matters. ACS Nano 2015, 9, 7226. [Google Scholar] [CrossRef] [PubMed]
- Tu, Y.; Lv, M.; Xiu, P.; Huynh, T.; Zhang, M.; Castelli, M.; Liu, Z.; Huang, Q.; Fan, C.; Fang, H.; et al. Destructive extraction of phospholipids from Escherichia coli membranes by graphene nanosheets. Nat. Nanotechnol. 2013, 8, 594. [Google Scholar] [CrossRef]
- Liu, S.; Hu, M.; Zeng, T.H.; Wu, R.; Jiang, R.; Wei, J.; Wang, L.; Kong, J.; Chen, Y. Lateral dimension-dependent antibacterial activity of graphene oxide sheets. Langmuir 2012, 28, 12364. [Google Scholar] [CrossRef] [PubMed]
- Dallavalle, M.; Calvaresi, M.; Bottoni, A.; Melle-Franco, M.; Zerbetto, F. Graphene can wreak havoc with cell membranes. ACS Appl. Mater. Interfaces 2015, 7, 4406. [Google Scholar] [CrossRef]
- Wei, W.; Li, J.; Liu, Z.; Deng, Y.; Chen, D.; Gu, P.; Wang, G.; Fan, X. Distinct antibacterial activity of a vertically aligned graphene coating against Gram-positive and Gram-negative bacteria. J. Mater. Chem. B 2020, 8, 6069. [Google Scholar] [CrossRef]
- Zheng, K.; Li, K.; Chang, T.H.; Xie, J.; Chen, P.Y. Synergistic Antimicrobial Nanomaterials: Synergistic Antimicrobial Capability of Magnetically Oriented Graphene Oxide Conjugated with Gold Nanoclusters (Adv. Funct. Mater. 46/2019). Adv. Funct. Mater. 2019, 29, 1904603. [Google Scholar] [CrossRef]
- Zheng, W.; Zhao, X.; Fu, W. Review of vertical graphene and its applications. ACS Appl. Mater. Interfaces 2021, 13, 9561. [Google Scholar] [CrossRef]
- Lu, X.; Feng, X.; Werber, J.R.; Chu, C.; Zucker, I.; Kim, J.H.; Osuji, C.O.; Elimelech, M. Enhanced antibacterial activity through the controlled alignment of graphene oxide nanosheets. Proc. Natl. Acad. Sci. USA 2017, 114, E9793–E9801. [Google Scholar] [CrossRef]
- Smith, R. An overview of the Tesseract OCR engine. In Proceedings of the Ninth International Conference on Document Analysis and Recognition (ICDAR 2007), Curitiba, Brazil, 23–26 September 2007; IEEE: New York, NY, USA, 2007; Volume 2, pp. 629–633. [Google Scholar]


| Image | Contrast Threshold for a Valid Edge | Average of Predicted Bacterial Exclusion from Images from Different Positions in One Sample (%) | Magnification | Measured Loss of Viability (%) |
|---|---|---|---|---|
| M25-6.tif | 50 | 9.73 ± 1.45 | 1000× | −16 ± 42.4 |
| M25-2.tif | 50 | 1000× | ||
| 23.tif | 80 | 20.61 ± 5.62 | 1000× | 13.518 ± 19.49 |
| 11.tif | 90 | 1400× | ||
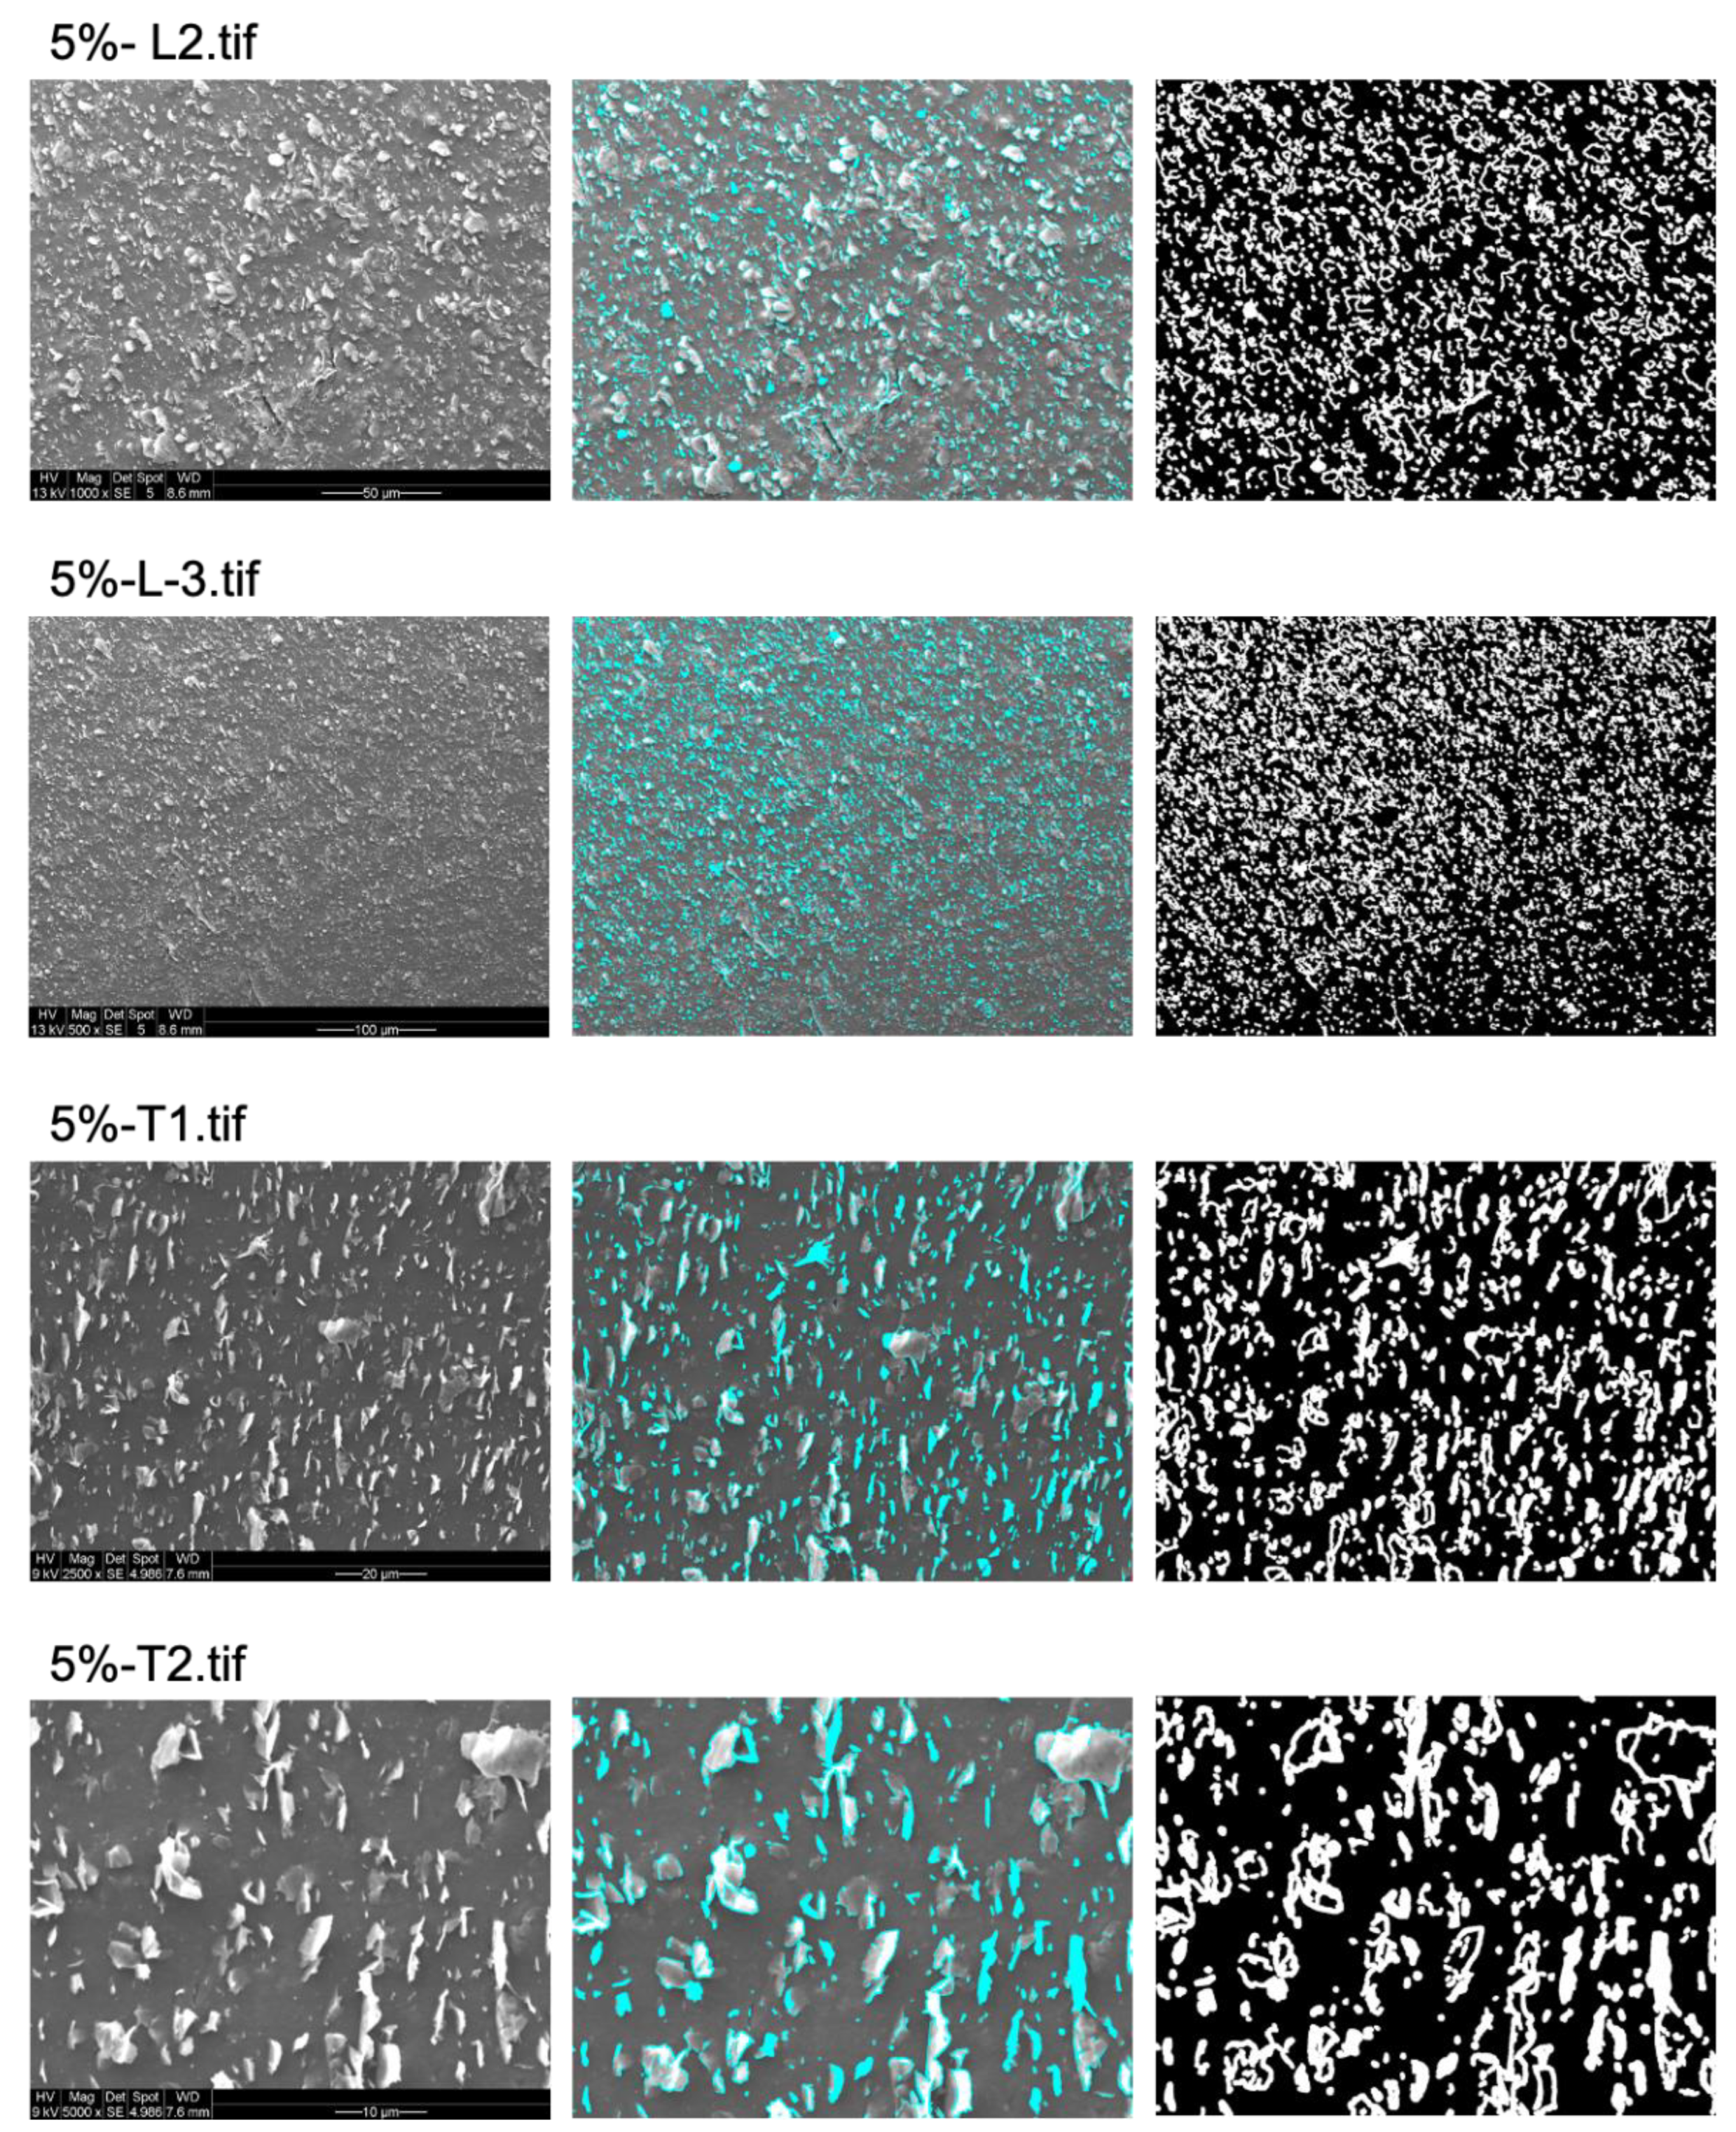
| 5%-L2.tif | 40 | 35.97 ± 3.7 | 1000× | 28.18 ± 7.3 |
| 5%-L-3.tif | 40 | 500× | ||
| 5%-L-5.tif | 40 | 650× | ||
| 5%-L1.tif | 40 | 1000× | ||
| 5%-L4.tif | 20 | 1000× | ||
| 5%-T1.tif | 25 | 30.58 ± 0.58 | 2500× | 40.80 ± 10.48 |
| 5%-T2.tif | 15 | 5000× | ||
| 5%-T4.tif | 20 | 5000× | ||
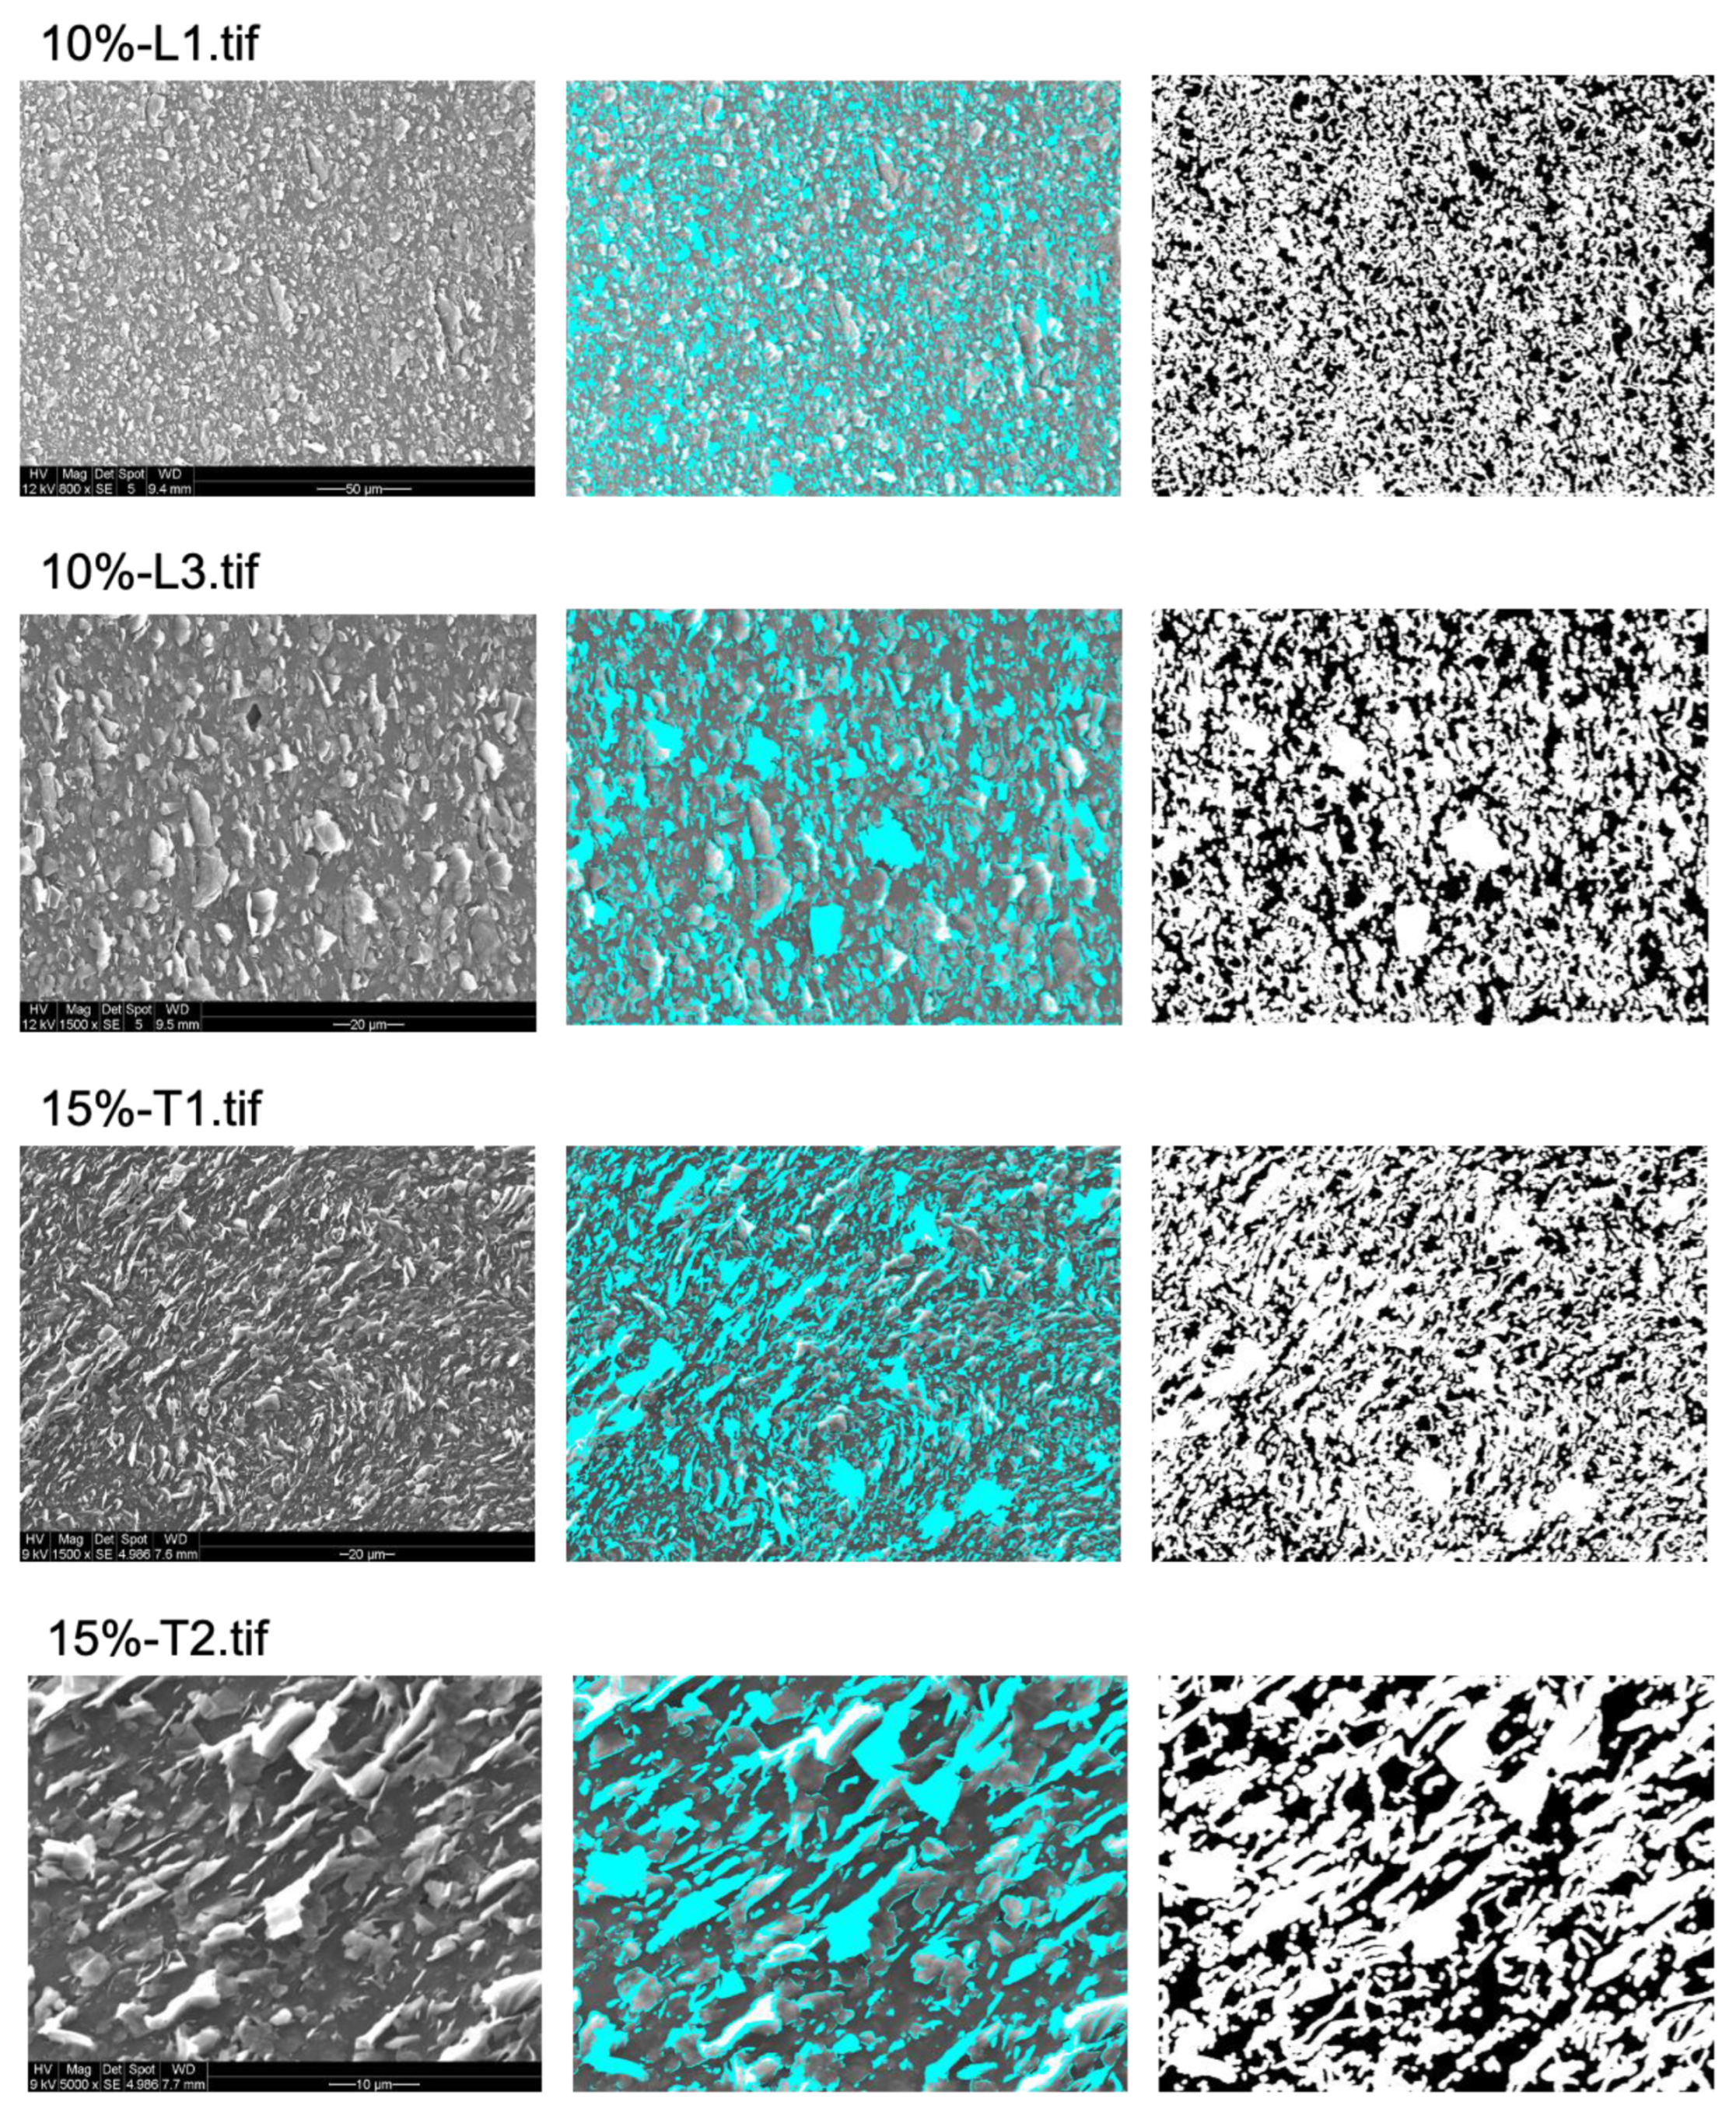
| 10%-L1.tif | 30 | 61.85 ± 4.46 | 800× | 61.12 ± 4.9 |
| 10%-L2.tif | 28 | 800× | ||
| 10%-L3.tif | 20 | 1500× | ||
| 10%-L4.tif | 20 | 1500× | ||
| 15%-T1.tif | 25 | 73.85 ± 6.84 | 1500× | 78.54 ± 7.98 |
| 15%-T2.tif | 10 | 5000× | ||
| 15%-T3.tif | 25 | 1000× | ||
| 15%-T4.tif | 7 | 5000× | ||
| 15%-T6.tif | 12 | 2500× | ||
| 20%-T1.tif | 15 | 84.23 ± 5.33 | 2500× | 94.51 ± 0.66 |
| 20%-T2.tif | 8 | 5000× | ||
| 20%-T3.tif | 23 | 1000× | ||
| 20%-T4.tif | 10 | 2500× | ||
| 20%-T5.tif | 8 | 5000× | ||
| 15%-L1.tif | 30 | 89.86 ± 2.91 | 1000× | 99.99 ± 0 |
| 15%-L2.tif | 30 | 1000× | ||
| 15%-L3.tif | 22 | 1200× | ||
| 15%-L4.tif | 20 | 1200× | ||
| 15%-L5.tif | 25 | 800× |
Disclaimer/Publisher’s Note: The statements, opinions and data contained in all publications are solely those of the individual author(s) and contributor(s) and not of MDPI and/or the editor(s). MDPI and/or the editor(s) disclaim responsibility for any injury to people or property resulting from any ideas, methods, instructions or products referred to in the content. |
© 2023 by the authors. Licensee MDPI, Basel, Switzerland. This article is an open access article distributed under the terms and conditions of the Creative Commons Attribution (CC BY) license (https://creativecommons.org/licenses/by/4.0/).
Share and Cite
Rahimi, S.; Lovmar, T.; Aulova, A.; Pandit, S.; Lovmar, M.; Forsberg, S.; Svensson, M.; Kádár, R.; Mijakovic, I. Automated Prediction of Bacterial Exclusion Areas on SEM Images of Graphene–Polymer Composites. Nanomaterials 2023, 13, 1605. https://doi.org/10.3390/nano13101605
Rahimi S, Lovmar T, Aulova A, Pandit S, Lovmar M, Forsberg S, Svensson M, Kádár R, Mijakovic I. Automated Prediction of Bacterial Exclusion Areas on SEM Images of Graphene–Polymer Composites. Nanomaterials. 2023; 13(10):1605. https://doi.org/10.3390/nano13101605
Chicago/Turabian StyleRahimi, Shadi, Teo Lovmar, Alexandra Aulova, Santosh Pandit, Martin Lovmar, Sven Forsberg, Magnus Svensson, Roland Kádár, and Ivan Mijakovic. 2023. "Automated Prediction of Bacterial Exclusion Areas on SEM Images of Graphene–Polymer Composites" Nanomaterials 13, no. 10: 1605. https://doi.org/10.3390/nano13101605