
Effect of Biosilicate® Addition on Physical–Mechanical and Biological Properties of Dental Glass Ionomer Cements

 , , , and
Abstract
:1. Introduction
2. Materials and Methods
2.1. Formulation of Experimental Restorative Materials and Group Assignments
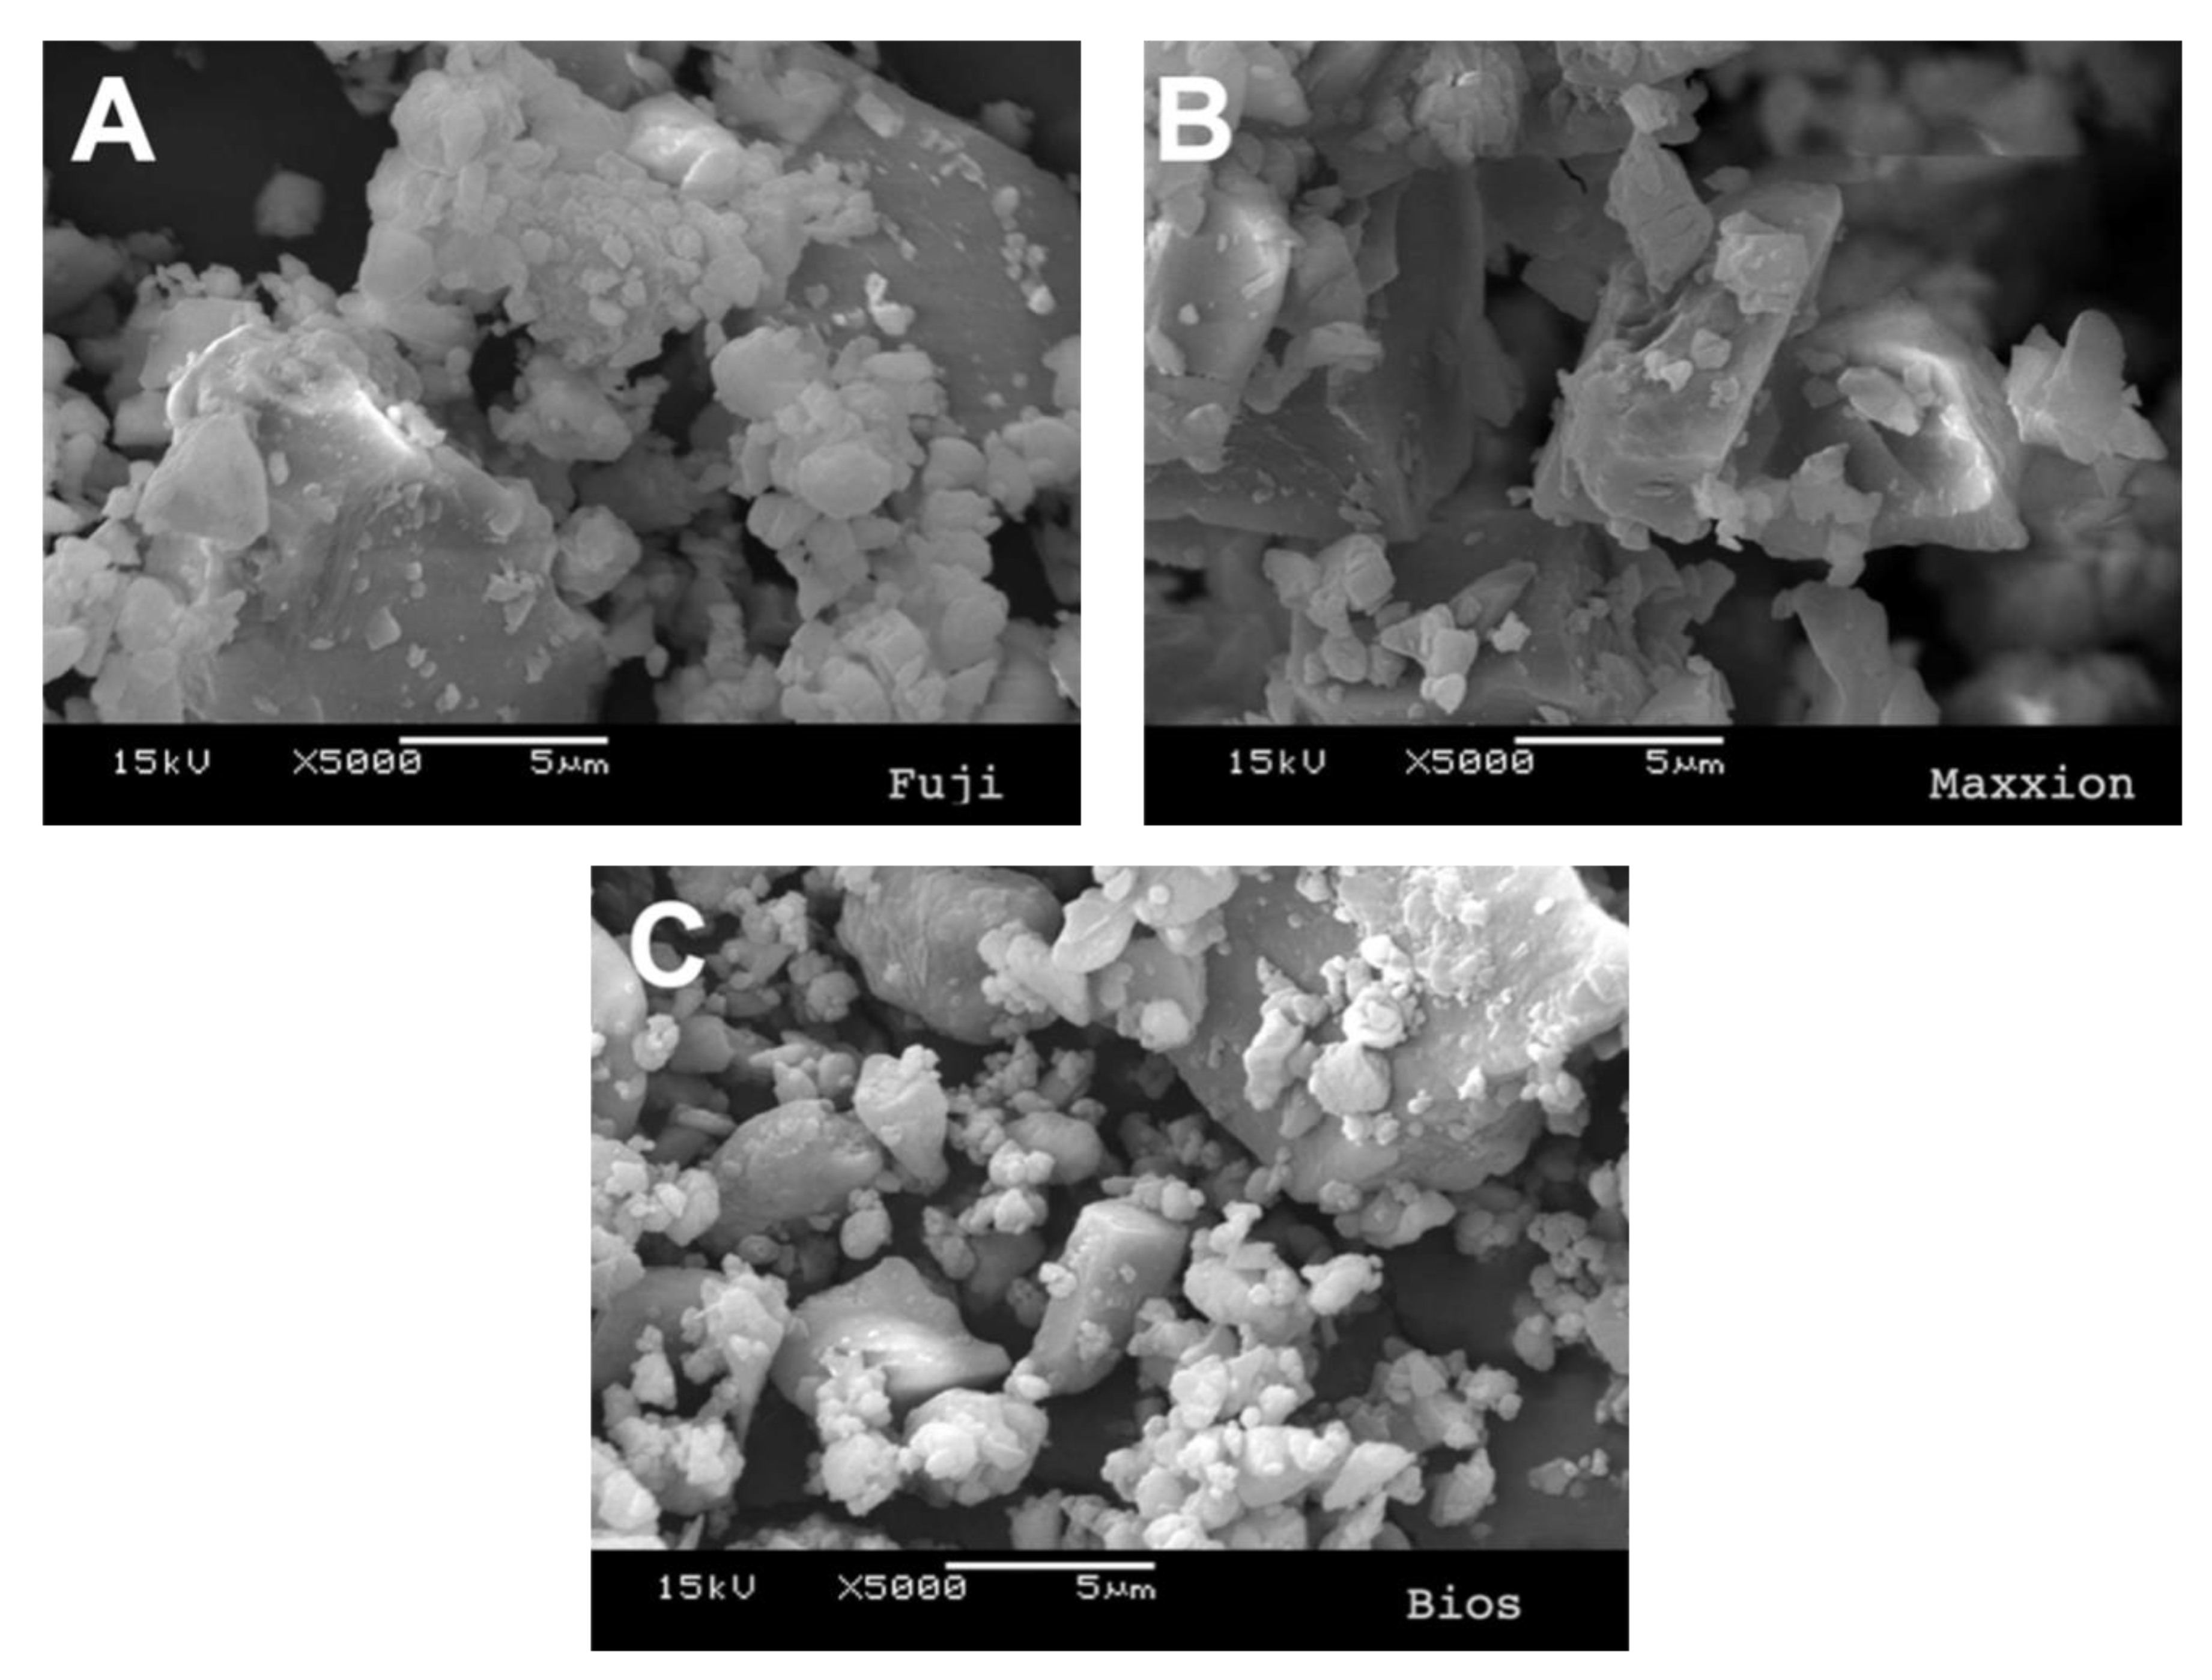
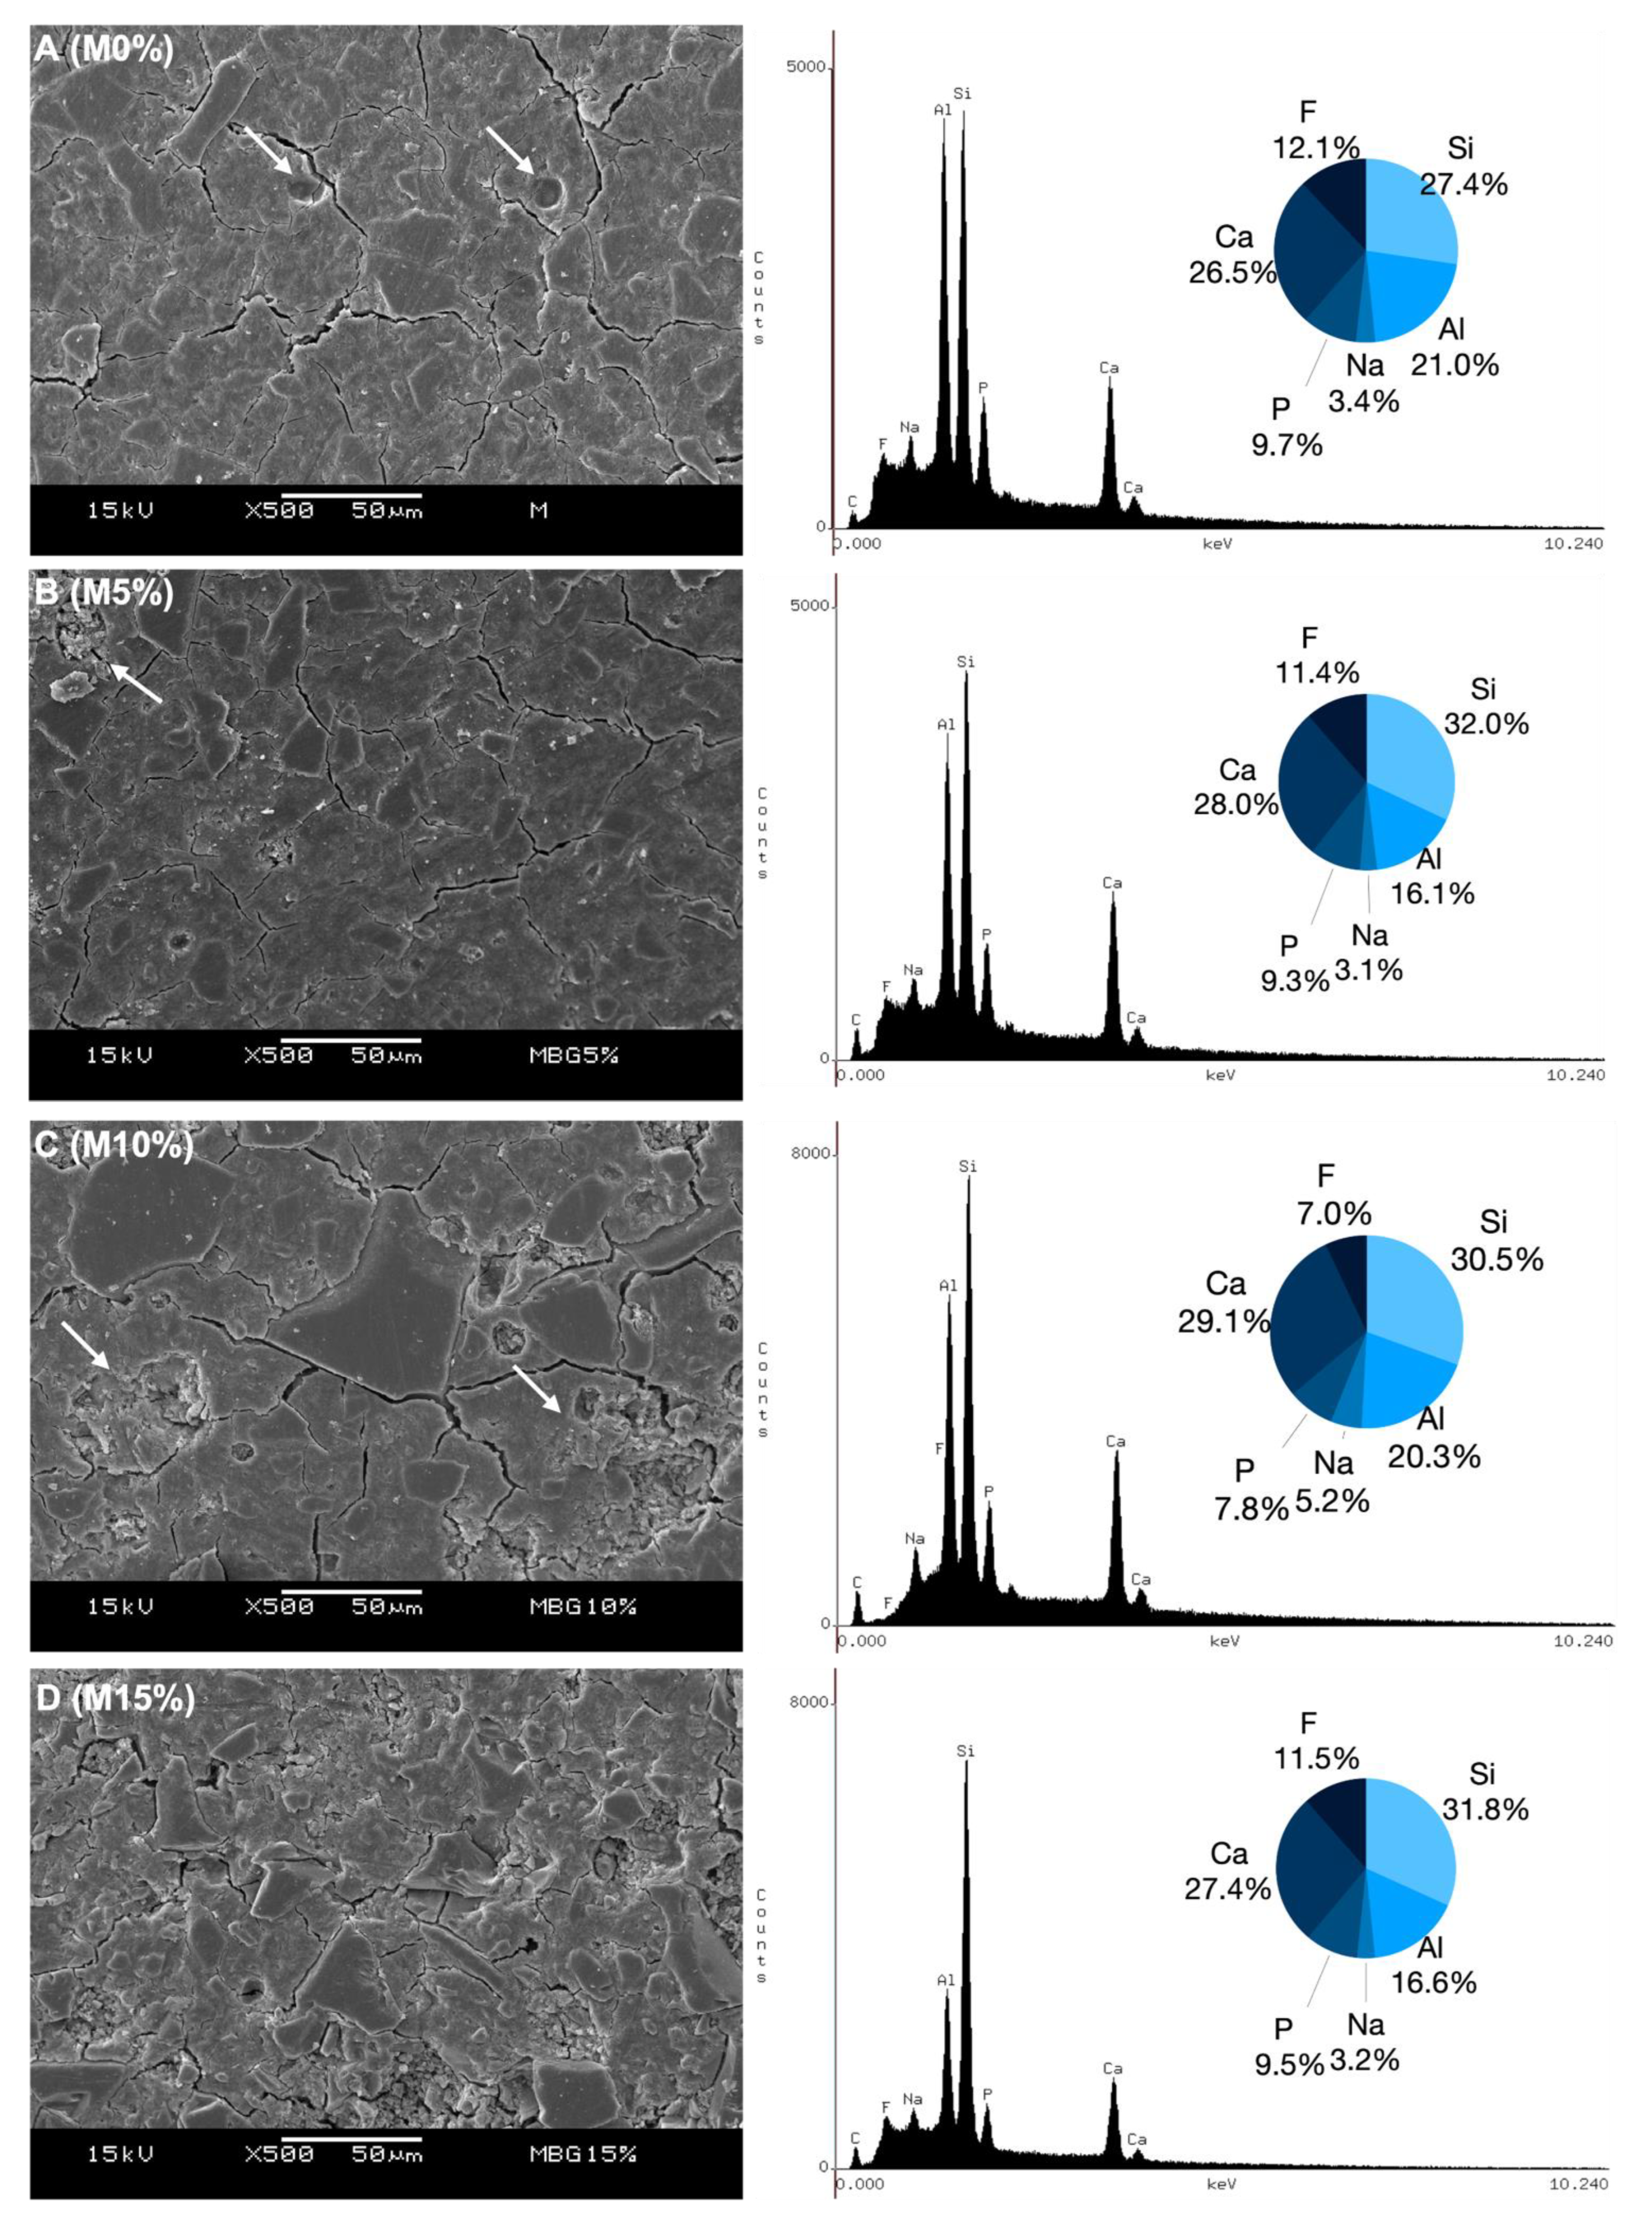
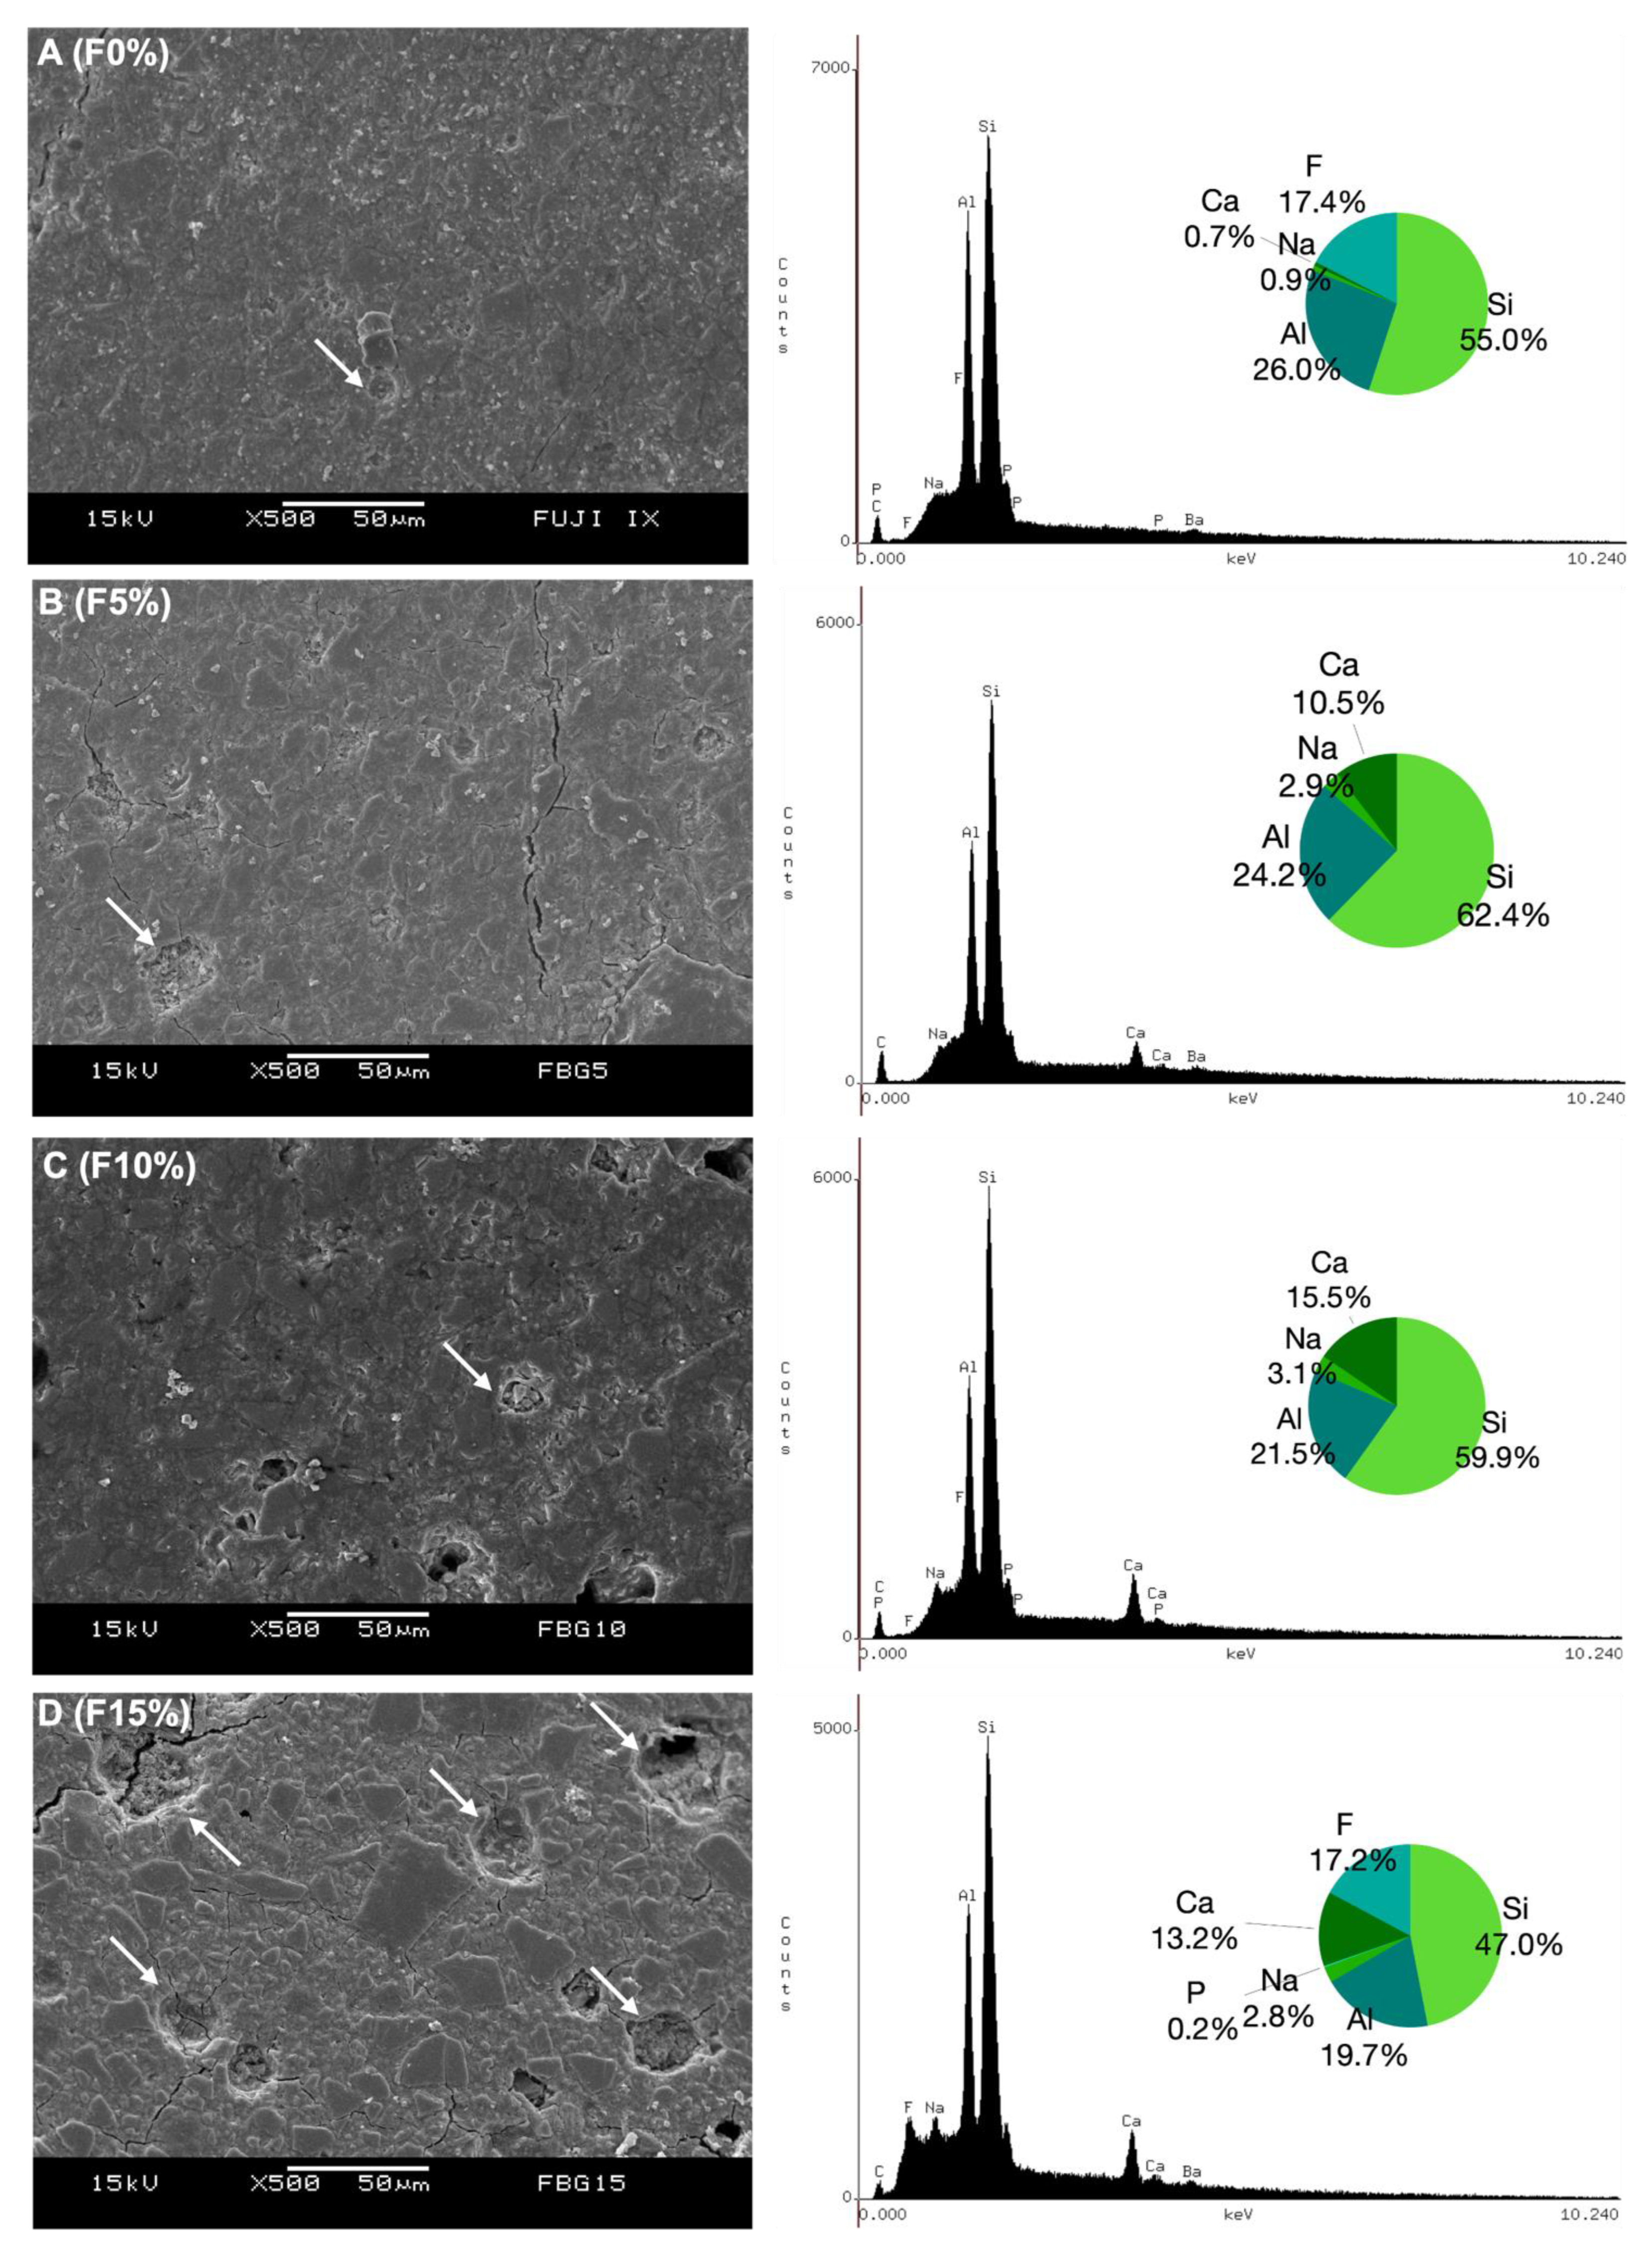
2.2. Scanning Electronic Microscopy (SEM) and Energy-Dispersive X-ray Spectroscopy (EDS)
2.3. Fourier Transform Infrared Spectroscopy (FTIR)
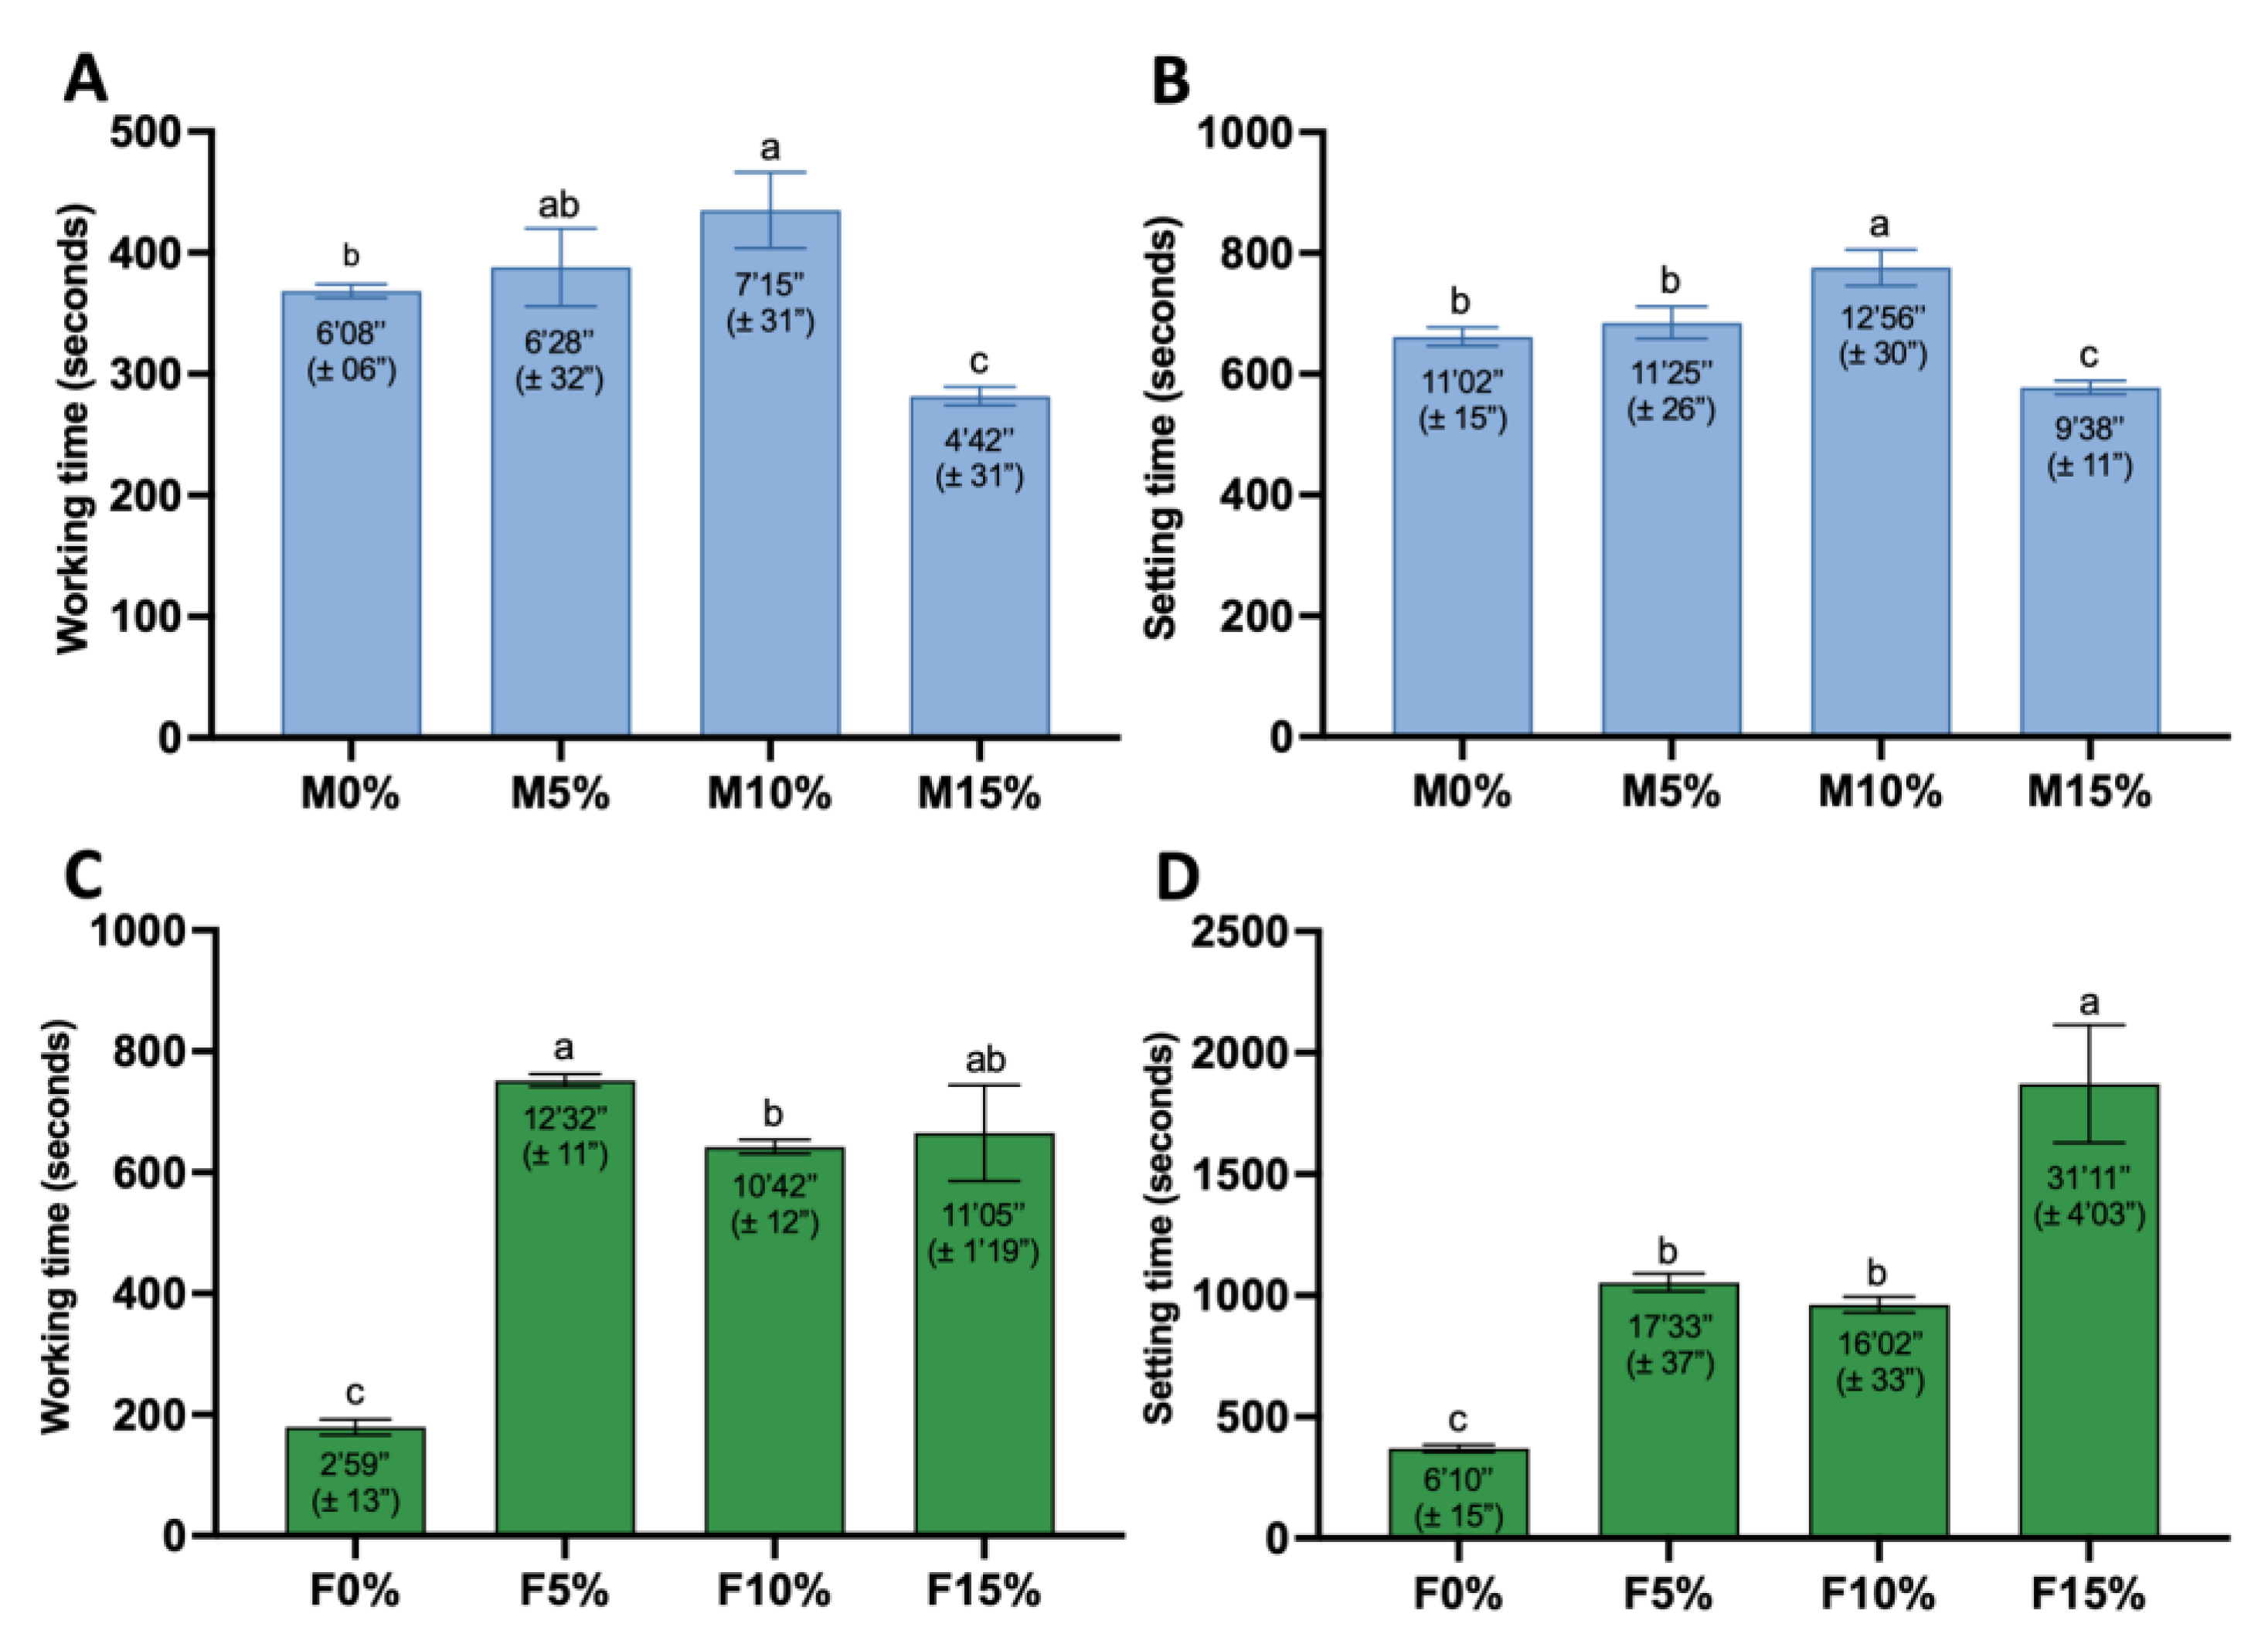
2.4. Working and Setting Time
2.5. Compressive Strength (CS)
2.6. Ion Release by Inductively Coupled Plasma Optical Emission Spectrometry (ICP OES) and Ultraviolet–Visible Spectrometry (UV-Vis)
2.7. GIC Cytotoxicity
2.8. Antimicrobial Activity: Direct Contact with Disk Surfaces
2.9. Data Analysis
3. Results
3.1. SEM and EDS Analyses
3.2. FTIR
3.3. Setting and Working Time
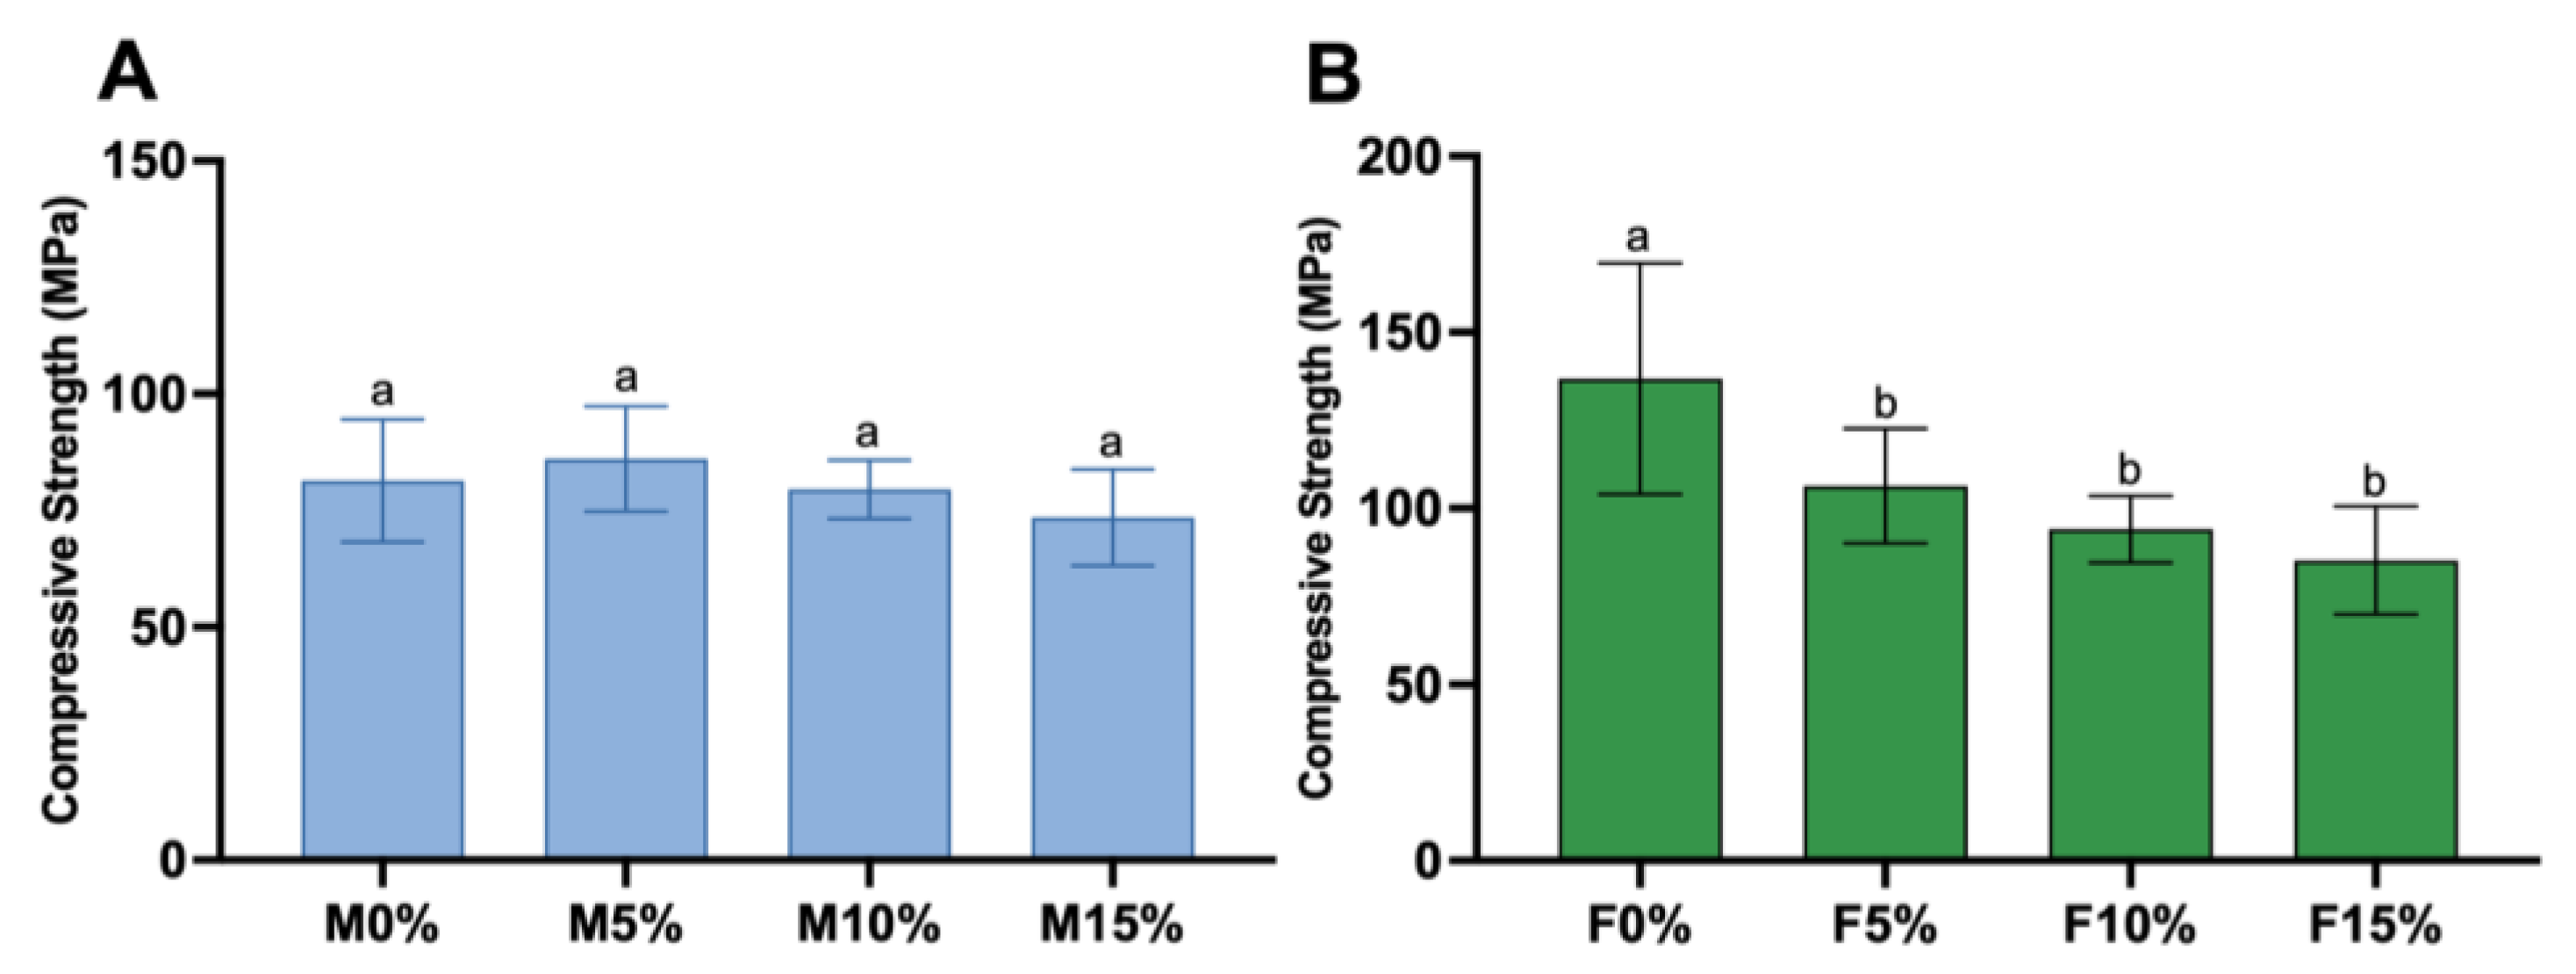
3.4. Compressive Strength (CS)
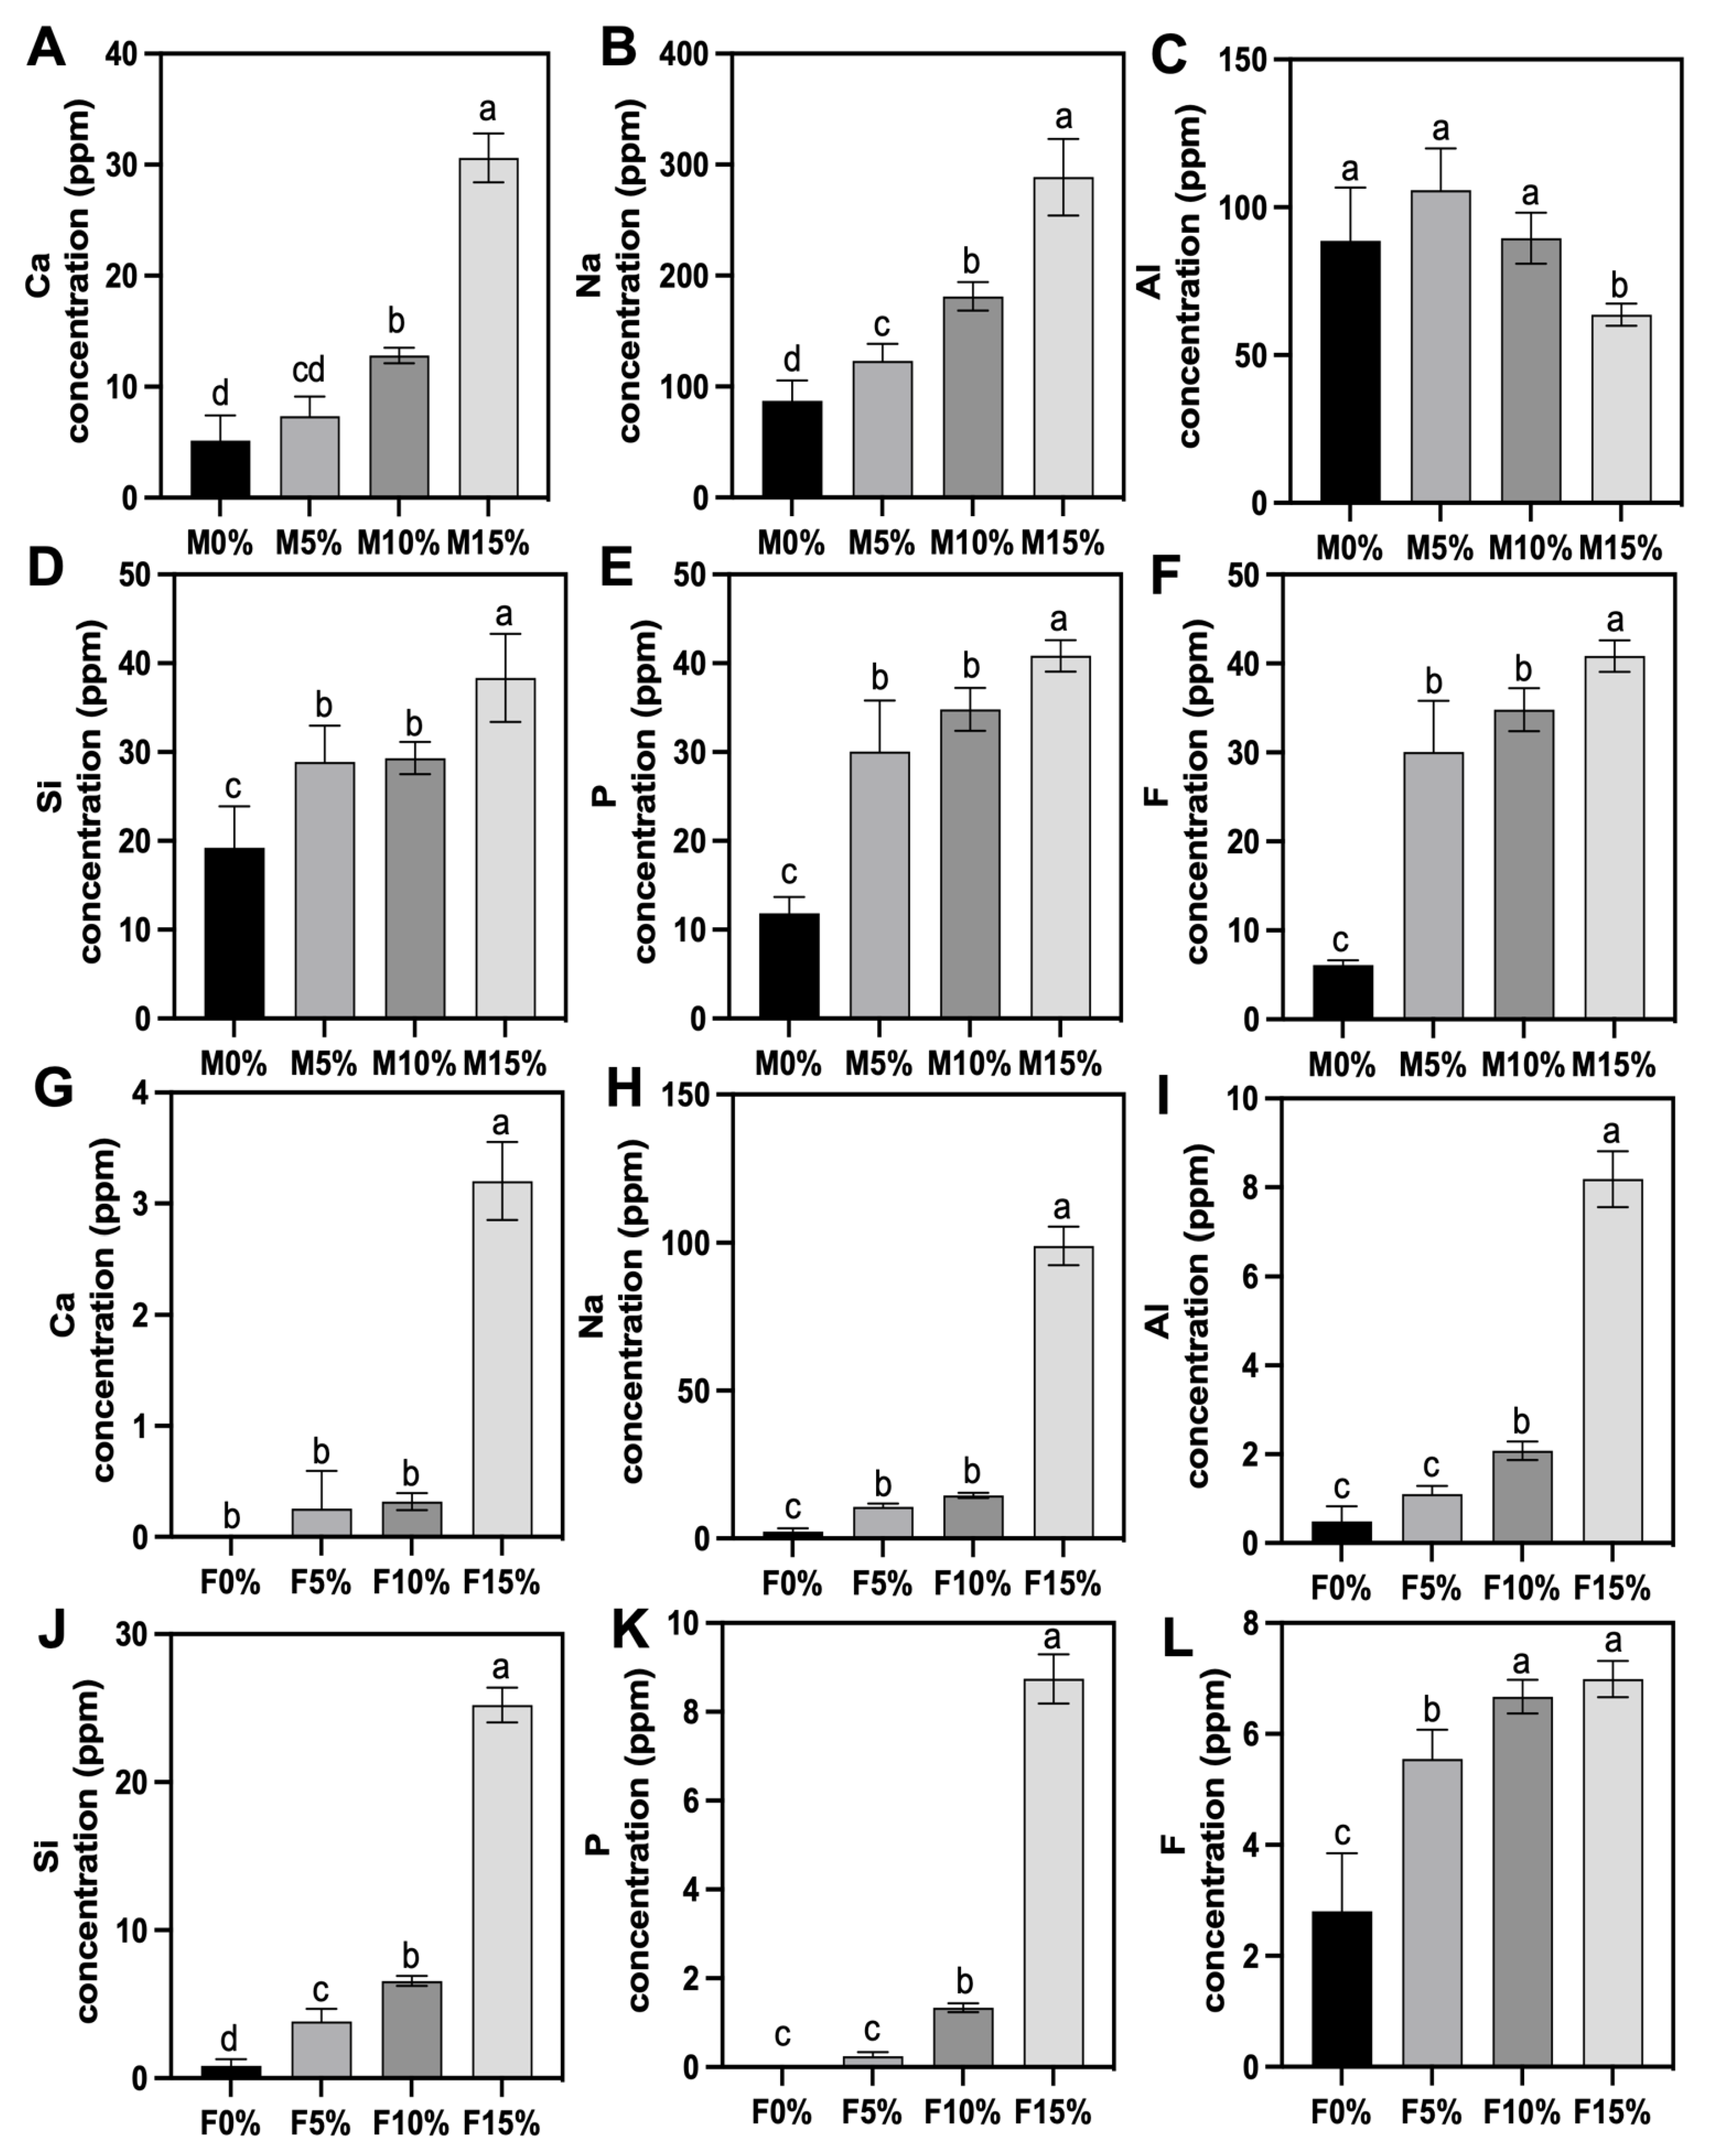
3.5. Ion Release
3.5.1. Ca Ions
3.5.2. Na Ions
3.5.3. Al Ions
3.5.4. Si Ions
3.5.5. P Ions
3.5.6. F Ions
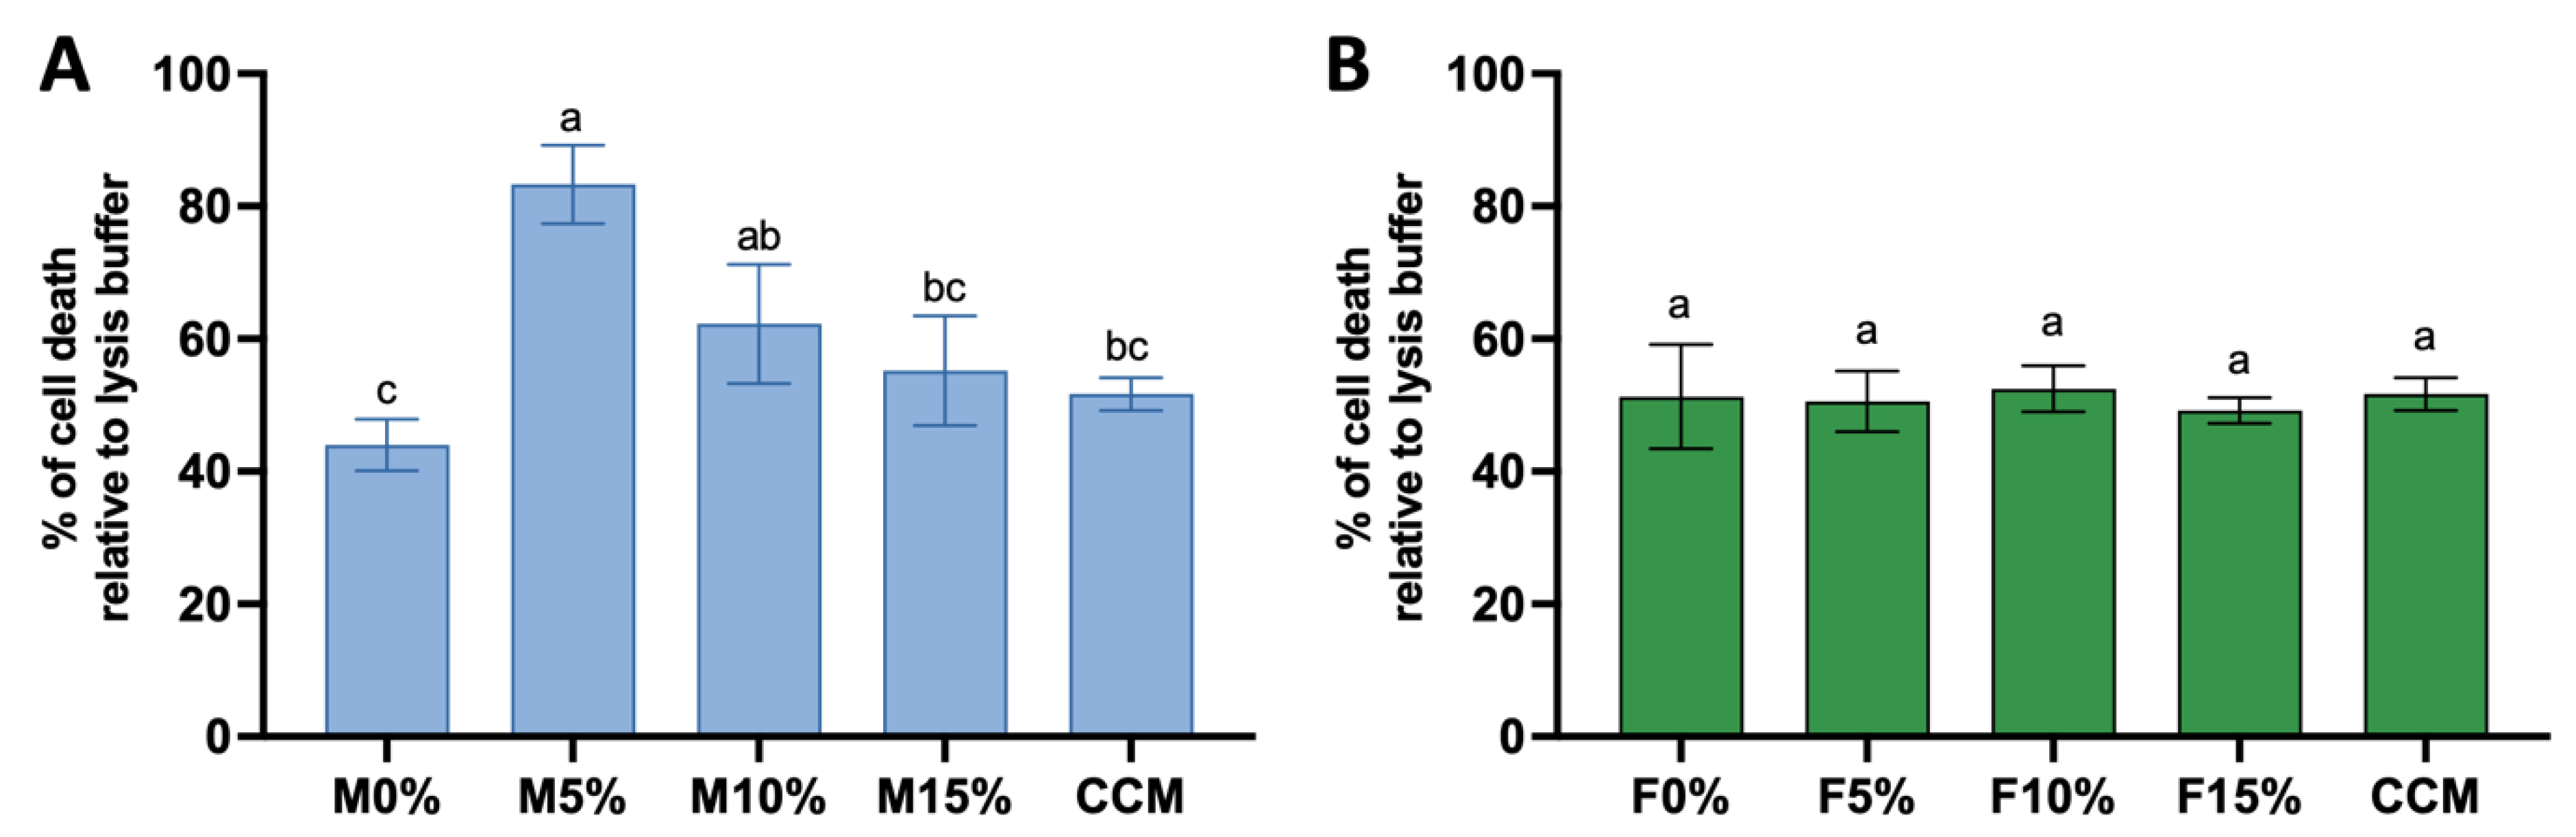
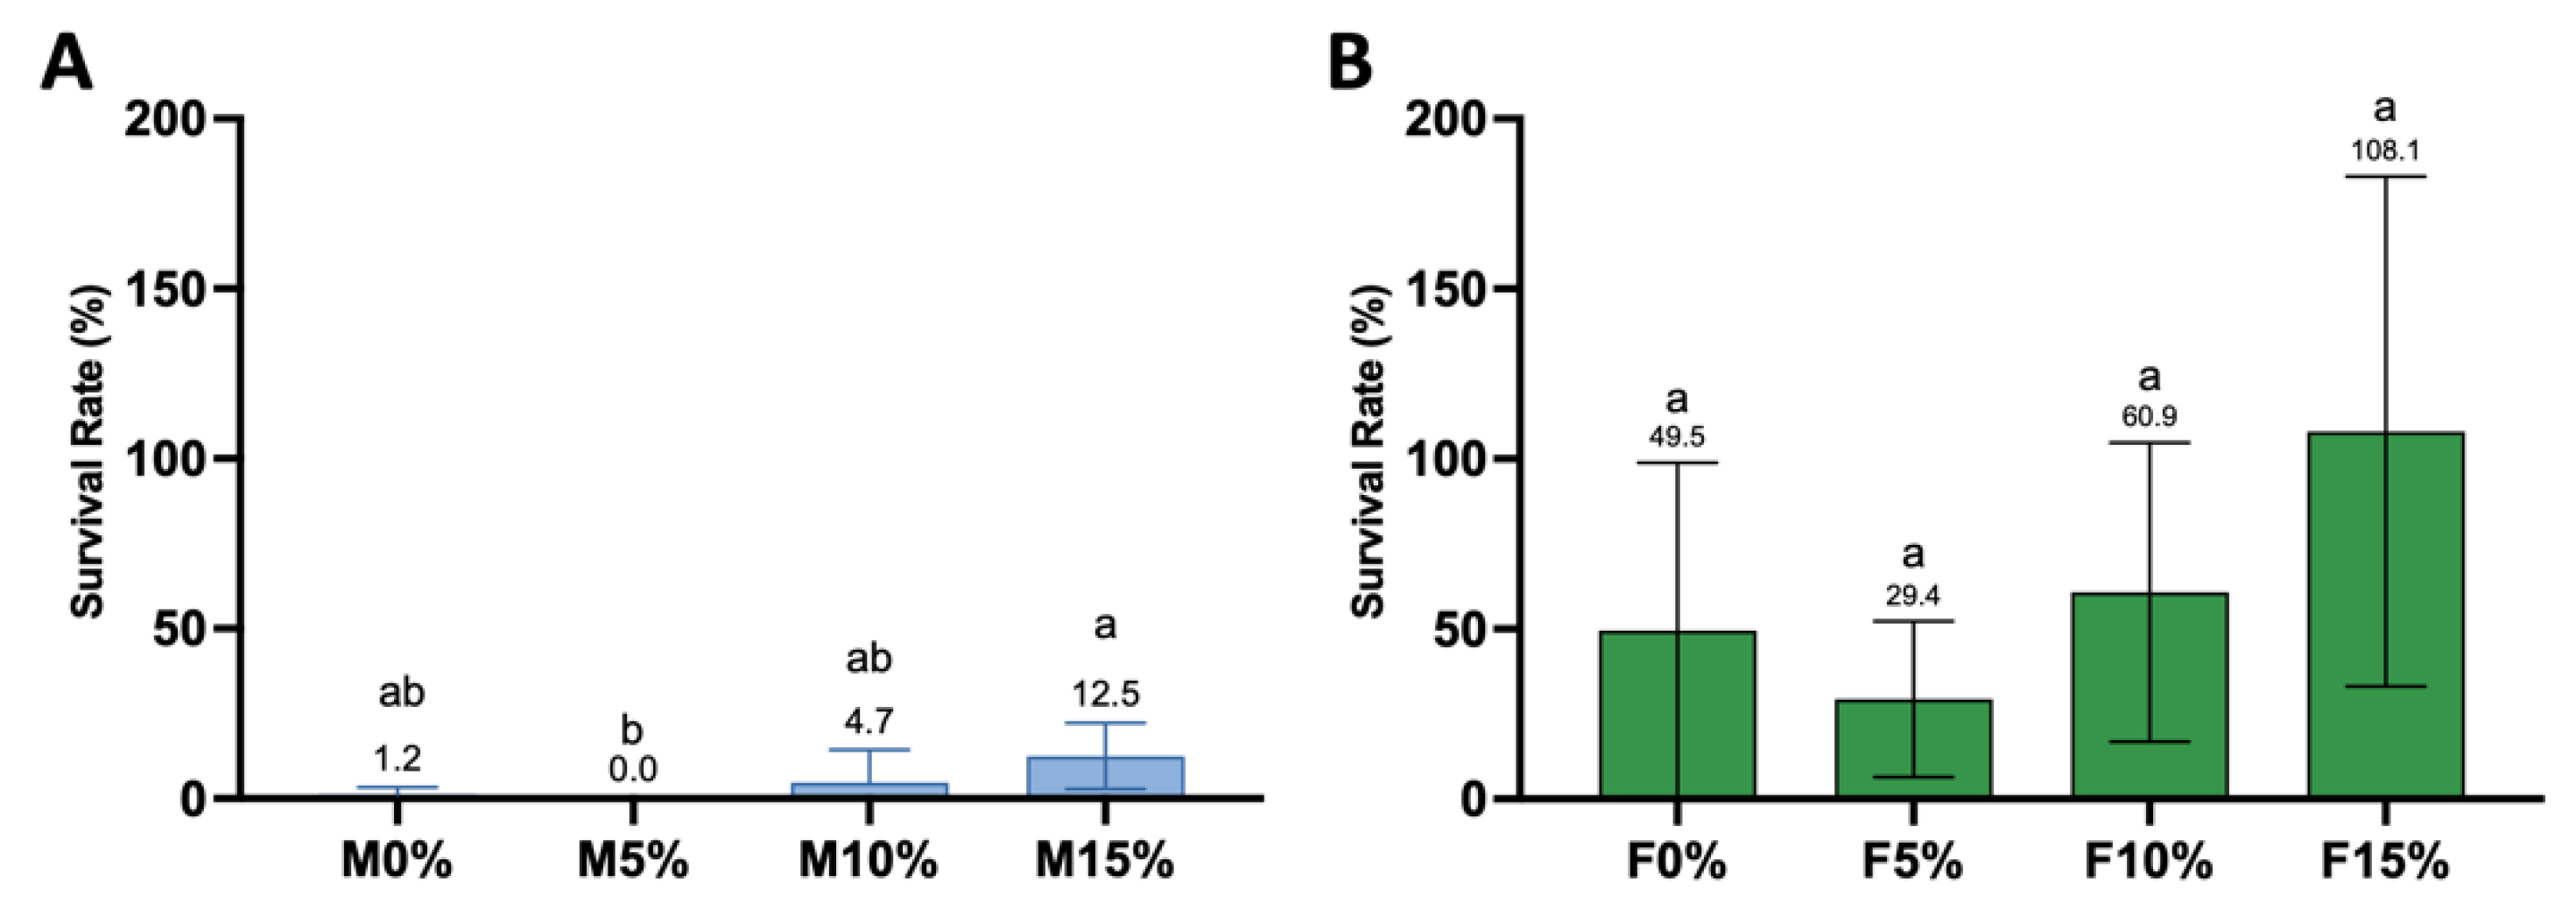
3.6. Cytotocixity
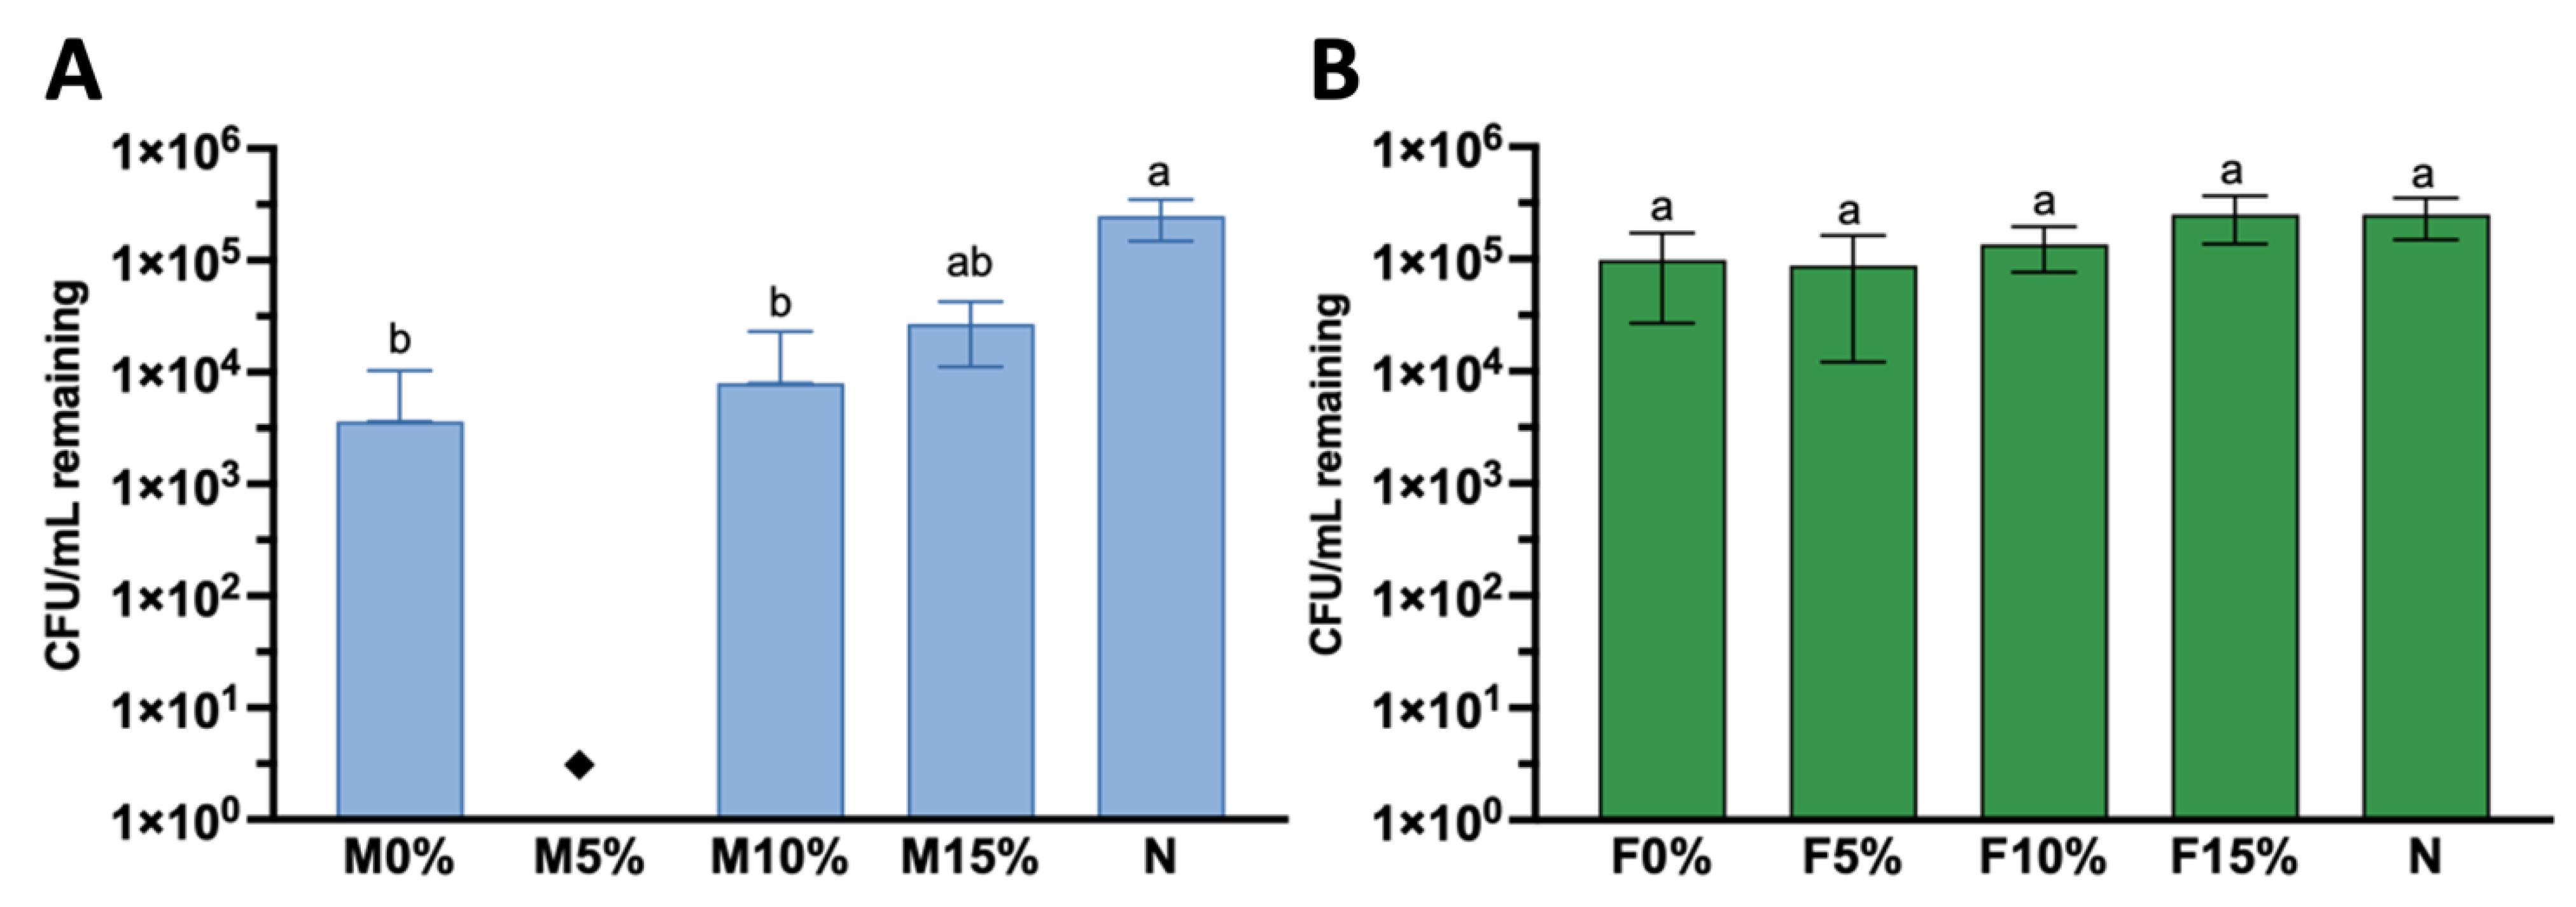
3.7. Antimicrobial Activity
4. Discussion
5. Conclusions
Author Contributions
Funding
Data Availability Statement
Acknowledgments
Conflicts of Interest
References
- Frencken, J.E. The ART approach using glass-ionomers in relation to global oral health care. Dent. Mater. 2010, 26, 1–6. [Google Scholar] [CrossRef] [PubMed]
- Frencken, J.E.; Pilot, T.; Songpaisan, Y.; Phantumvanit, P. Atraumatic restorative treatment (ART): Rationale, technique, and development. J. Public Health Dent. 1996, 56, 135–140; discussion 161–163. [Google Scholar] [CrossRef] [PubMed]
- Frencken, J.E.; Leal, S.C.; Navarro, M.F. Twenty-five-year atraumatic restorative treatment (ART) approach: A comprehensive overview. Clin. Oral Investig. 2012, 16, 1337–1346. [Google Scholar] [CrossRef] [PubMed]
- Hill, R. Glass ionomer polyalkenoate cements and related materials: Past, present and future. Br. Dent. J. 2022, 232, 653–657. [Google Scholar] [CrossRef]
- Sidhu, S.K.; Nicholson, J.W. A Review of Glass-Ionomer Cements for Clinical Dentistry. J. Funct. Biomater. 2016, 7, 16. [Google Scholar] [CrossRef]
- Song, F.V.; Yang, B.; Di Tommaso, D.; Donnan, R.S.; Chass, G.A.; Yada, R.Y.; Farrar, D.H.; Tian, K.V. Resolving nanoscopic structuring and interfacial THz dynamics in setting cements. Mater. Adv. 2022, 3, 4982–4990. [Google Scholar] [CrossRef]
- Nicholson, J.W.; Brookman, P.J.; Lacy, O.M.; Wilson, A.D. Fourier transform infrared spectroscopic study of the role of tartaric acid in glass-ionomer dental cements. J. Dent. Res. 1988, 67, 1451–1454. [Google Scholar] [CrossRef]
- Nicholson, J.W. Maturation processes in glass-ionomer dental cements. Acta Biomater. Odontol. Scand. 2018, 4, 63–71. [Google Scholar] [CrossRef]
- Komatsu, H.; Shimokobe, H.; Kawakami, S.; Yoshimura, M. Caries-preventive effect of glass ionomer sealant reapplication: Study presents three-year results. J. Am. Dent. Assoc. 1994, 125, 543–549. [Google Scholar] [CrossRef]
- Liao, Y.; Brandt, B.W.; Li, J.; Crielaard, W.; Van Loveren, C.; Deng, D.M. Fluoride resistance in Streptococcus mutans: A mini review. J. Oral Microbiol. 2017, 9, 1344509. [Google Scholar] [CrossRef]
- Oh, H.J.; Oh, H.W.; Lee, D.W.; Kim, C.H.; Ahn, J.Y.; Kim, Y.; Shin, H.B.; Kim, C.Y.; Park, S.H.; Jeon, J.G. Chronologic Trends in Studies on Fluoride Mechanisms of Action. J. Dent. Res. 2017, 96, 1353–1360. [Google Scholar] [CrossRef]
- Ten Cate, J.M. Fluorides in caries prevention and control: Empiricism or science. Caries Res. 2004, 38, 254–257. [Google Scholar] [CrossRef]
- Alhalawani, A.M.; Curran, D.J.; Boyd, D.; Towler, M.R. The role of poly (acrylic acid) in conventional glass polyalkenoate cements. J. Polym. Eng. 2016, 36, 221–237. [Google Scholar] [CrossRef]
- Nicholson, J. Glass-ionomer cements for clinical dentistry. Mater. Technol. 2010, 25, 8–13. [Google Scholar] [CrossRef]
- Binaljadm, T.; Moorehead, R.; Almela, T.; Franklin, K.; Tayebi, L.; Moharamzadeh, K. Biomodification of a Class-V Restorative Material by Incorporation of Bioactive Agents. Dent. J. 2019, 7, 110. [Google Scholar] [CrossRef]
- Autefage, H.; Gentleman, E.; Littmann, E.; Hedegaard, M.A.; Von Erlach, T.; O’Donnell, M.; Burden, F.R.; Winkler, D.A.; Stevens, M.M. Sparse feature selection methods identify unexpected global cellular response to strontium-containing materials. Proc. Natl. Acad. Sci. USA 2015, 112, 4280–4285. [Google Scholar] [CrossRef]
- Gentleman, E.; Fredholm, Y.C.; Jell, G.; Lotfibakhshaiesh, N.; O’Donnell, M.D.; Hill, R.G.; Stevens, M.M. The effects of strontium-substituted bioactive glasses on osteoblasts and osteoclasts in vitro. Biomaterials 2010, 31, 3949–3956. [Google Scholar] [CrossRef]
- Choi, J.Y.; Lee, H.H.; Kim, H.W. Bioactive sol-gel glass added ionomer cement for the regeneration of tooth structure. J. Mater. Sci. Mater. Med. 2008, 19, 3287–3294. [Google Scholar] [CrossRef]
- Kim, D.A.; Lee, J.H.; Jun, S.K.; Kim, H.W.; Eltohamy, M.; Lee, H.H. Sol-gel-derived bioactive glass nanoparticle-incorporated glass ionomer cement with or without chitosan for enhanced mechanical and biomineralization properties. Dent. Mater. 2017, 33, 805–817. [Google Scholar] [CrossRef]
- Kim, H.J.; Bae, H.E.; Lee, J.E.; Park, I.S.; Kim, H.G.; Kwon, J.; Kim, D.S. Effects of bioactive glass incorporation into glass ionomer cement on demineralized dentin. Sci. Rep. 2021, 11, 7016. [Google Scholar] [CrossRef]
- Yli-Urpo, H.; Lassila, L.V.; Närhi, T.; Vallittu, P.K. Compressive strength and surface characterization of glass ionomer cements modified by particles of bioactive glass. Dent. Mater. 2005, 21, 201–209. [Google Scholar] [CrossRef] [PubMed]
- Jones, J.R. Review of bioactive glass: From Hench to hybrids. Acta Biomater. 2013, 9, 4457–4486. [Google Scholar] [CrossRef] [PubMed]
- Black, J.; Hastings, G. Handbook of Biomaterial Properties; Springer Science & Business Media: Berlin/Heidelberg, Germany, 2013. [Google Scholar]
- Peitl, O.; Zanotto, E.D.; Serbena, F.C.; Hench, L.L. Compositional and microstructural design of highly bioactive P2O5-Na2O-CaO-SiO2 glass-ceramics. Acta Biomater. 2012, 8, 321–332. [Google Scholar] [CrossRef] [PubMed]
- Crovace, M.C.; Souza, M.T.; Chinaglia, C.R.; Peitl, O.; Zanotto, E.D. Biosilicate®—A multipurpose, highly bioactive glass-ceramic. In vitro, in vivo and clinical trials. J. Non-Cryst. Solids 2016, 432, 90–110. [Google Scholar] [CrossRef]
- Tirapelli, C.; Panzeri, H.; Lara, E.H.; Soares, R.G.; Peitl, O.; Zanotto, E.D. The effect of a novel crystallised bioactive glass-ceramic powder on dentine hypersensitivity: A long-term clinical study. J. Oral Rehabil. 2011, 38, 253–262. [Google Scholar] [CrossRef]
- Rastelli, A.; Nicolodelli, G.; Romano, R.; Milori, D.; Perazzoli, I.; Ferreira, E.; Pedroso, A.; Souza, M.; Peitl, O.; Zanotto, E. After bleaching enamel remineralization using a bioactive glass-ceramic (BioSilicate®). Biomed. Glas. 2016, 2, 1–9. [Google Scholar] [CrossRef]
- de Araújo Lopes, J.M.; Benetti, F.; Rezende, G.C.; Souza, M.T.; Conti, L.C.; Ervolino, E.; Jacinto, R.C.; Zanotto, E.D.; Cintra, L.T.A. Biocompatibility, induction of mineralization and antimicrobial activity of experimental intracanal pastes based on glass and glass-ceramic materials. Int. Endod. J. 2020, 53, 1494–1505. [Google Scholar] [CrossRef]
- Martins, C.H.; Carvalho, T.C.; Souza, M.G.; Ravagnani, C.; Peitl, O.; Zanotto, E.D.; Panzeri, H.; Casemiro, L.A. Assessment of antimicrobial effect of Biosilicate® against anaerobic, microaerophilic and facultative anaerobic microorganisms. J. Mater. Sci. Mater. Med. 2011, 22, 1439–1446. [Google Scholar] [CrossRef]
- Pacheco, R.R.; Garcia-Flores, A.F.; Soto-Montero, J.R.; Lesseux, G.G.; Lancelotti, A.; Martinez, E.D.; Rettori, C.; Urbano, R.R.; Rueggeberg, F.A.; Giannini, M. Synthesis, characterization, and incorporation of upconverting nanoparticles into a dental adhesive. Braz. Oral Res. 2021, 35, e120. [Google Scholar] [CrossRef]
- Tsuzuki, F.M.; Pascotto, R.C.; Malacarne, L.C.; Bento, A.C.; Medina Neto, A.; de Castro-Hoshino, L.V.; Souza, M.; Nicholson, J.W.; Baesso, M.L. Studies of the early stages of the dynamic setting process of chemically activated restorative glass-ionomer cements. Biomater. Investig. Dent. 2021, 8, 39–47. [Google Scholar] [CrossRef]
- Panpisut, P.; Monmaturapoj, N.; Srion, A.; Toneluck, A.; Phantumvanit, P. Physical Properties of Glass Ionomer Cement Containing Pre-Reacted Spherical Glass Fillers. Braz. Dent. J. 2020, 31, 445–452. [Google Scholar] [CrossRef]
- Talal, A.; Tanner, K.E.; Billington, R.; Pearson, G.J. Effect of ultrasound on the setting characteristics of glass ionomer cements studied by Fourier transform infrared spectroscopy. J. Mater. Sci. Mater. Med. 2009, 20, 405–411. [Google Scholar] [CrossRef]
- Yamakami, S.A.; Ubaldini, A.L.M.; Sato, F.; Medina Neto, A.; Pascotto, R.C.; Baesso, M.L. Study of the chemical interaction between a high-viscosity glass ionomer cement and dentin. J. Appl. Oral Sci. 2018, 26, e20170384. [Google Scholar] [CrossRef]
- Chen, S.; Cai, Y.; Engqvist, H.; Xia, W. Enhanced bioactivity of glass ionomer cement by incorporating calcium silicates. Biomatter 2016, 6, e1123842. [Google Scholar] [CrossRef]
- Gandolfi, M.G.; Taddei, P.; Siboni, F.; Modena, E.; Ciapetti, G.; Prati, C. Development of the foremost light-curable calcium-silicate MTA cement as root-end in oral surgery. Chemical-physical properties, bioactivity and biological behavior. Dent. Mater. 2011, 27, e134–e157. [Google Scholar] [CrossRef]
- Nicholson, J.W.; Coleman, N.J.; Sidhu, S.K. Kinetics of ion release from a conventional glass-ionomer cement. J. Mater. Sci. Mater. Med. 2021, 32, 30. [Google Scholar] [CrossRef]
- Kunert, M.; Rozpedek-Kaminska, W.; Galita, G.; Sauro, S.; Bourgi, R.; Hardan, L.; Majsterek, I.; Lukomska-Szymanska, M. The Cytotoxicity and Genotoxicity of Bioactive Dental Materials. Cells 2022, 11, 3238. [Google Scholar] [CrossRef]
- Sonoyama, W.; Liu, Y.; Fang, D.; Yamaza, T.; Seo, B.M.; Zhang, C.; Liu, H.; Gronthos, S.; Wang, C.Y.; Wang, S.; et al. Mesenchymal stem cell-mediated functional tooth regeneration in swine. PLoS ONE 2006, 1, e79. [Google Scholar] [CrossRef]
- Park, M.K.; Kim, S.; Jeon, M.; Jung, U.W.; Lee, J.H.; Choi, H.J.; Choi, J.E.; Song, J.S. Evaluation of the Apical Complex and the Coronal Pulp as a Stem Cell Source for Dentin-pulp Regeneration. J. Endod. 2020, 46, 224–231.e3. [Google Scholar] [CrossRef]
- Smeda, M.; Galler, K.M.; Woelflick, M.; Rosendahl, A.; Moehle, C.; Lenhardt, B.; Buchalla, W.; Widbiller, M. Molecular Biological Comparison of Dental Pulp- and Apical Papilla-Derived Stem Cells. Int. J. Mol. Sci. 2022, 23, 2615. [Google Scholar] [CrossRef]
- Pinto, T.S.; Lima, O.A.d.; Leal Filho, L.d.S. Sphericity of apatite particles determined by gas permeability through packed beds. Min. Metall. Explor. 2009, 26, 105–108. [Google Scholar] [CrossRef]
- Fuchs, M.; Gentleman, E.; Shahid, S.; Hill, R.G.; Brauer, D.S. Therapeutic ion-releasing bioactive glass ionomer cements with improved mechanical strength and radiopacity. Front. Mater. 2015, 2, 63. [Google Scholar] [CrossRef]
- Matsuya, S.; Matsuya, Y.; Ohta, M. Structure of bioactive glass and its application to glass ionomer cement. Dent. Mater. J. 1999, 18, 155–166. [Google Scholar] [CrossRef] [PubMed]
- Tian, K.V.; Yang, B.; Yue, Y.; Bowron, D.T.; Mayers, J.; Donnan, R.S.; Dobó-Nagy, C.; Nicholson, J.W.; Fang, D.C.; Greer, A.L.; et al. Atomic and vibrational origins of mechanical toughness in bioactive cement during setting. Nat. Commun. 2015, 6, 8631. [Google Scholar] [CrossRef]
- Nicholson, J.W.; Czarnecka, B. Review paper: Role of aluminum in glass-ionomer dental cements and its biological effects. J. Biomater. Appl. 2009, 24, 293–308. [Google Scholar] [CrossRef]
- Berg, M.C.; Benetti, A.R.; Telling, M.T.F.; Seydel, T.; Yu, D.; Daemen, L.L.; Bordallo, H.N. Nanoscale Mobility of Aqueous Polyacrylic Acid in Dental Restorative Cements. ACS Appl. Mater. Interfaces 2018, 10, 9904–9915. [Google Scholar] [CrossRef]
- Wilson, A.D.; Hill, R.G.; Warrens, C.P.; Lewis, B.G. The influence of polyacid molecular weight on some properties of glass-ionomer cements. J. Dent. Res. 1989, 68, 89–94. [Google Scholar] [CrossRef]
- De Caluwé, T.; Vercruysse, C.W.; Ladik, I.; Convents, R.; Declercq, H.; Martens, L.C.; Verbeeck, R.M. Addition of bioactive glass to glass ionomer cements: Effect on the physico-chemical properties and biocompatibility. Dent. Mater. 2017, 33, e186–e203. [Google Scholar] [CrossRef]
- De Barra, E.; Hill, R.G. Influence of alkali metal ions on the fracture properties of glass polyalkenoate (ionomer) cements. Biomaterials 1998, 19, 495–502. [Google Scholar] [CrossRef]
- Matsuya, S.; Maeda, T.; Ohta, M. IR and NMR analyses of hardening and maturation of glass-ionomer cement. J. Dent. Res. 1996, 75, 1920–1927. [Google Scholar] [CrossRef]
- Kent, B.E.; Lewis, B.G.; Wilson, A.D. Glass ionomer cement formulations: I. The preparation of novel fluoroaluminosilicate glasses high in fluorine. J. Dent. Res. 1979, 58, 1607–1619. [Google Scholar] [CrossRef]
- Moshaverinia, A.; Roohpour, N.; Chee, W.W.; Schricker, S.R. A review of powder modifications in conventional glass-ionomer dental cements. J. Mater. Chem. 2011, 21, 1319–1328. [Google Scholar] [CrossRef]
- Wilson, A.D.; Crisp, S.; Prosser, H.J.; Lewis, B.G.; Merson, S.A. Aluminosilicate glasses for polyelectrolyte cements. Ind. Eng. Chem. Prod. Res. Dev. 1980, 19, 263–270. [Google Scholar] [CrossRef]
- Brauer, D.S.; Gentleman, E.; Farrar, D.F.; Stevens, M.M.; Hill, R.G. Benefits and drawbacks of zinc in glass ionomer bone cements. Biomed. Mater. 2011, 6, 045007. [Google Scholar] [CrossRef]
- Brauer, D.S.; Karpukhina, N.; Kedia, G.; Bhat, A.; Law, R.V.; Radecka, I.; Hill, R.G. Bactericidal strontium-releasing injectable bone cements based on bioactive glasses. J. R. Soc. Interface 2013, 10, 20120647. [Google Scholar] [CrossRef]
- Al-Taee, L.; Deb, S.; Banerjee, A. An in vitro assessment of the physical properties of manually- mixed and encapsulated glass-ionomer cements. BDJ Open 2020, 6, 12. [Google Scholar] [CrossRef]
- Behr, M.; Rosentritt, M.; Loher, H.; Handel, G. Effect of variations from the recommended powder/liquid ratio on some properties of resin-modified cements. Acta Odontol. Scand. 2006, 64, 214–220. [Google Scholar] [CrossRef]
- AMP Kashani, M. Effect of Cation Substitutions in an Ionomer Glass Composition on the Setting Reaction and Properties of the Resulting Glass Ionomer Cements. Ph.D. Thesis, University of Birmingham, Birmingham, UK, 2013. [Google Scholar]
- Feng, R.; Chen, L.; Chen, K. Cytotoxicity and changes in gene expression under aluminium potassium sulfate on Spodoptera frugiperda 9 cells. Ecotoxicology 2021, 30, 2056–2070. [Google Scholar] [CrossRef]
- Kumar, V.; Bal, A.; Gill, K.D. Susceptibility of mitochondrial superoxide dismutase to aluminium induced oxidative damage. Toxicology 2009, 255, 117–123. [Google Scholar] [CrossRef]
- Santos, E.M.; Ball, J.S.; Williams, T.D.; Wu, H.; Ortega, F.; van Aerle, R.; Katsiadaki, I.; Falciani, F.; Viant, M.R.; Chipman, J.K.; et al. Identifying health impacts of exposure to copper using transcriptomics and metabolomics in a fish model. Environ. Sci. Technol. 2010, 44, 820–826. [Google Scholar] [CrossRef]
- Sharma, S.S.; Dietz, K.J. The relationship between metal toxicity and cellular redox imbalance. Trends Plant Sci. 2009, 14, 43–50. [Google Scholar] [CrossRef] [PubMed]
- Yu, L.; Wu, J.; Zhai, Q.; Tian, F.; Zhao, J.; Zhang, H.; Chen, W. Metabolomic analysis reveals the mechanism of aluminum cytotoxicity in HT-29 cells. PeerJ 2019, 7, e7524. [Google Scholar] [CrossRef] [PubMed]
- Sturr, M.G.; Marquis, R.E. Inhibition of proton-translocating ATPases of Streptococcus mutans and Lactobacillus casei by fluoride and aluminum. Arch. Microbiol. 1990, 155, 22–27. [Google Scholar] [CrossRef] [PubMed]
- Hayacibara, M.F.; Rosa, O.P.; Koo, H.; Torres, S.A.; Costa, B.; Cury, J.A. Effects of fluoride and aluminum from ionomeric materials on S. mutans biofilm. J. Dent. Res. 2003, 82, 267–271. [Google Scholar] [CrossRef]
- Lunardi, J.; Dupuis, A.; Garin, J.; Issartel, J.P.; Michel, L.; Chabre, M.; Vignais, P.V. Inhibition of H+-transporting ATPase by formation of a tight nucleoside diphosphate-fluoroaluminate complex at the catalytic site. Proc. Natl. Acad. Sci. USA 1988, 85, 8958–8962. [Google Scholar] [CrossRef]
- Lemos, J.A.; Palmer, S.R.; Zeng, L.; Wen, Z.T.; Kajfasz, J.K.; Freires, I.A.; Abranches, J.; Brady, L.J. The Biology of Streptococcus mutans. Microbiol. Spectr. 2019, 7, 7. [Google Scholar] [CrossRef]
- Miki, S.; Kitagawa, H.; Kitagawa, R.; Kiba, W.; Hayashi, M.; Imazato, S. Antibacterial activity of resin composites containing surface pre-reacted glass-ionomer (S-PRG) filler. Dent. Mater. 2016, 32, 1095–1102. [Google Scholar] [CrossRef]


| Material (Manufacturers) | Composition |
|---|---|
| Biosilicate® (LaMaV-CeRTEV, São Carlos, SP, Brazil) | 23.75% Na2O, 23.75% CaO, 48.5% SiO2, and 4% P2O5 (%wt), microparticles (D50 = 5 μm). |
| Maxxion R, Shade A2 (FGM, Joinville, Santa Catarina, Brazil) | Powder: aluminofluorosilicate glass and calcium fluoride (10 g). Liquid: polycarboxylic acid, tartaric acid, and water (8 g). |
| Fuji IX GP, Shade A2 (GC Corporation, Tokyo, Japan—authorized by South America GC, SP, Brazil) | Powder: aluminofluorosilicate glass and polyacrilic acid. Liquid (4 mL): polyacrylic acid and water. |
| Groups | Formulations (wt%) | Ratio P/L (wt/wt) |
|---|---|---|
| M0% | 100% Maxxion R | 1.5/1 |
| M5% | 95% Maxxion R + 5% Biosilicate® | 1.5/1 |
| M10% | 90% Maxxion R + 10% Biosilicate® | 1.5/1 |
| M15% | 85% Maxxion R + 15% Biosilicate® | 1.5/1 |
| F0% | 100% Fuji IX | 3.6/1 |
| F5% | 95% Fuji IX + 5% Biosilicate® | 1.8/1 |
| F10% | 90% Fuji IX + 10% Biosilicate® | 1.8/1 |
| F15% | 85% Fuji IX + 15% Biosilicate® | 1.8/1 |
Disclaimer/Publisher’s Note: The statements, opinions and data contained in all publications are solely those of the individual author(s) and contributor(s) and not of MDPI and/or the editor(s). MDPI and/or the editor(s) disclaim responsibility for any injury to people or property resulting from any ideas, methods, instructions or products referred to in the content. |
© 2023 by the authors. Licensee MDPI, Basel, Switzerland. This article is an open access article distributed under the terms and conditions of the Creative Commons Attribution (CC BY) license (https://creativecommons.org/licenses/by/4.0/).
Share and Cite
Magalhães, G.d.A.P.; Thomson, J.J.; Smoczer, C.; Young, L.A.; Matos, A.O.; Pacheco, R.R.; Souza, M.T.; Zanotto, E.D.; Puppin Rontani, R.M. Effect of Biosilicate® Addition on Physical–Mechanical and Biological Properties of Dental Glass Ionomer Cements. J. Funct. Biomater. 2023, 14, 302. https://doi.org/10.3390/jfb14060302
Magalhães GdAP, Thomson JJ, Smoczer C, Young LA, Matos AO, Pacheco RR, Souza MT, Zanotto ED, Puppin Rontani RM. Effect of Biosilicate® Addition on Physical–Mechanical and Biological Properties of Dental Glass Ionomer Cements. Journal of Functional Biomaterials. 2023; 14(6):302. https://doi.org/10.3390/jfb14060302
Chicago/Turabian StyleMagalhães, Gabriela de Alencar Pinto, Joshua J. Thomson, Cristine Smoczer, Laura Ann Young, Adaias O. Matos, Rafael Rocha Pacheco, Maria Trevelin Souza, Edgar Dutra Zanotto, and Regina Maria Puppin Rontani. 2023. "Effect of Biosilicate® Addition on Physical–Mechanical and Biological Properties of Dental Glass Ionomer Cements" Journal of Functional Biomaterials 14, no. 6: 302. https://doi.org/10.3390/jfb14060302