
Topographical and Optical Characteristics of Thermoplastic Dental Appliances Materials Related to Water Sorption
 , ,
, ,
Abstract
:1. Introduction
2. Materials and Methods
2.1. Specimen Preparations
2.2. Water Sorption and Water Solubility
2.3. Surface Roughness Measurements
2.4. Nanosurface Topographic Characterization by Atomic Force Microscopy (AFM)
2.5. Optical and Colour Change Measurements
2.6. Statistical Analyses
3. Results
4. Discussion
5. Conclusions
Author Contributions
Funding
Data Availability Statement
Conflicts of Interest
References
- Cianci, C.; Pappalettera, G.; Renna, G.; Casavola, C.; Laurenziello, M.; Battista, G.; Pappalettere, C.; Ciavarella, D. Mechanical Behavior of PET-G Tooth Aligners Under Cyclic Loading. Front. Mater. 2020, 7, 104. [Google Scholar] [CrossRef]
- Fang, D.; Zhang, N.; Chen, H.; Bai, Y. Dynamic stress relaxation of orthodontic thermoplastic materials in a simulated oral environment. Dent. Mater. J. 2013, 32, 946–951. [Google Scholar] [CrossRef] [Green Version]
- Hussein, A.M.; Mohammed-Salih, H.S.; Al-Sheakli, I.I. Effects of various cleaning agents on polypropylene and copolyester thermoplastic orthodontic retainer materials. J. Taibah Univ. Med. Sci. 2022, 17, 861–868. [Google Scholar] [CrossRef]
- Daniele, V.; Macera, L.; Taglieri, G.; Di Giambattista, A.; Spagnoli, G.; Massaria, A.; Messori, M.; Quagliarini, E.; Chiappini, G.; Campanella, V.; et al. Thermoplastic disks used for commercial orthodontic aligners: Complete physicochemical and mechanical characterization. Materials 2020, 13, 2386. [Google Scholar] [CrossRef]
- Pratto, I.; Busato, M.C.A.; Bittencourt, P.R.S. Thermal and mechanical characterization of thermoplastic orthodontic aligners discs after molding process. J. Mech. Behav. Biomed. Mater. 2022, 126, 104991. [Google Scholar] [CrossRef]
- Macri, M.; Murmura, G.; Varvara, G.; Traini, T.; Festa, F. Clinical performances and biological features of clear aligners materials in orthodontics. Front. Mater. 2022, 9, 819121. [Google Scholar]
- Cond’o, R.; Mampieri, G.; Giancotti, A.; Cerroni, L.; Pasquantonio, G.; Divizia, A.; Convertino, A.; Mecheri, B.; Maiolo, L. SEM Characterization and ageing analysis on two generations of Invisible aligners. BMC Oral Health 2021, 21, 316. [Google Scholar] [CrossRef]
- Latko-Durałek, P.; Dydek, K.; Boczkowska, A. Thermal, rheological and mechanical properties of PETG/rPETG blends. J. Polym. Environ. 2019, 27, 2600–2606. [Google Scholar] [CrossRef] [Green Version]
- Hassan, M.H.; Omar, A.M.; Daskalakis, E.; Hou, Y.; Huang, B.; Strashnov, I.; Grieve, B.D.; Bártolo, P. The potential of polyethylene terephthalate glycol as biomaterial for bone tissue engineering. Polymers 2020, 12, 3045. [Google Scholar] [CrossRef]
- Bichu, Y.M.; Alwafi, A.; Liu, X.; Andrews, J.; Ludwig, B.; Bichu, A.Y.; Zou, B. Advances in orthodontic clear aligner materials. Bioact. Mater. 2022, 22, 384–403. [Google Scholar] [CrossRef]
- Hallmann, L.; Gerngroß, M.D. Effect of Dental Thermoplastic Materials on the Clinical Effectiveness of Clear Aligner. Austin J. Dent. 2021, 8, 1151. [Google Scholar]
- Ryokawa, H.; Miyazaki, Y.; Fujishima, A.; Miyazaki, T.; Maki, K. The mechanical properties of dental thermoplastic materials in a simulated intraoral environment. Orthod. Waves 2006, 65, 64–71. [Google Scholar] [CrossRef]
- Bernard, G.; Rompre, P.; Tavares, J.R.; Monpetit, A. Colorimetric and spectrophotometric measurements of orthodontic thermoplastic aligners exposed to various staining. Head Face Med. 2020, 16, 2. [Google Scholar] [CrossRef]
- Liu, C.L.; Sun, W.T.; Liao, W.; Lu, W.X.; Li, Q.W.; Jeong, Y.; Liu, J.; Zhao, Z.H. Color stability of three types of orthodontic clear aligners exposed to staining agents. Int. J. Oral Sci. 2016, 8, 246–253. [Google Scholar] [CrossRef] [Green Version]
- Condo, R.; Pazzini, L.; Cerroni, L.; Pasquantonio, G.; Lagana, G.; Pecora, A.; Mussi, V.; Rinaldi, A.; Mecheri, B.; Licoccia, S.; et al. Mechanical properties of two generations of teeth aligners: Change analysis during oral permanence. Dent. Mater. J. 2018, 37, 835–842. [Google Scholar] [CrossRef] [Green Version]
- Ahn, H.W.; Ha, H.R.; Lim, H.N.; Choi, S. Effect of aging procedures on the molecular, biochemical, morphological, and mechanical properties of vacuum-formed retainers. J. Mech. Behav. Biomed. Mater. 2015, 51, 356–366. [Google Scholar] [CrossRef]
- Ahn, H.W.; Kim, K.A.; Lim, S.H. A new type of clear orthodontic retainer incorporating multi-layer hybrid materials. Korean J. Orthod. 2015, 45, 268–272. [Google Scholar] [CrossRef] [Green Version]
- Jiang, Q.; Li, J.; Mei, L.; Du, J.; Levrini, L.; Abbate, G.M.; Li, H. Periodontal health during orthodontic treatment with clear aligners and fixed appliances: A metaanalysis. J. Am. Dent. Assoc. 2018, 149, 712–720. [Google Scholar] [CrossRef]
- Inoue, S.; Yamaguchi, S.; Uyama, H.; Yamashiro, T.; Imazato, S. Influence of constant strain on the elasticity of thermoplastic orthodontic materials. Dent. Mater. J. 2020, 39, 415–421. [Google Scholar] [CrossRef] [Green Version]
- Zafeiriadis, A.A.; Karamouzos, A.; Athanasiou, A.E.; Eliades, T.; Palaghias, G. In vitro spectrophotometric evaluation of Vivera clear thermoplastic retainer discolouration. Aust. Orthod. J. 2014, 30, 192–200. [Google Scholar]
- Porojan, L.; Vasiliu, R.D.; Porojan, S.D.; Bîrdeanu, M.I. Surface Quality Evaluation of Removable Thermoplastic Dental Appliances Related to Staining Beverages and Cleaning Agents. Polymers 2020, 12, 1736. [Google Scholar] [CrossRef]
- Ryu, J.H.; Kwon, J.S.; Jiang, H.B.; Cha, J.Y.; Kim, K.M. Effects of thermoforming on the physical and mechanical properties of thermoplastic materials for transparent orthodontic aligners. Korean J. Orthod. 2018, 48, 316–325. [Google Scholar] [CrossRef]
- Elsaka, S.E. Optical and Mechanical Properties of Newly Developed Multilayer Zirconia. J. Prosthodont. 2019, 28, 279–284. [Google Scholar] [CrossRef] [Green Version]
- Akl, M.A.; Sim, C.P.C.; Nunn, M.E.; Zeng, L.L.; Hamza, T.A.; Wee, A.G. Validation of two clinical color measuring instruments for use in dental research. J. Dent. 2022, 125, 104223. [Google Scholar] [CrossRef]
- Toma, F.R.; Porojan, S.D.; Vasiliu, R.D.; Porojan, L. The Effect of Polishing, Glazing, and Aging on Optical Characteristics of Multi-Layered Dental Zirconia with Different Degrees of Translucency. J. Funct. Biomater. 2023, 14, 68. [Google Scholar] [CrossRef]
- Shah, V.R.; Shah, D.N.; Chauhan, C.J.; Doshi, P.J.; Kumar, A. Evaluation of flexural strength and color stability of different denture base materials including flexible material after using different denture cleansers. J. Indian Prosthodont. Soc. 2015, 15, 367–373. [Google Scholar] [CrossRef]
- Boubakri, A.; Haddar, N.; Elleuch, K.; Bienvenu, Y. Impact of aging conditions on mechanical properties of thermoplastic polyurethane. Mater. Des. 2010, 31, 4194–4201. [Google Scholar] [CrossRef]
- Boubakri, A.; Elleuch, K.; Guermazi, N.; Ayedi, H.F. Investigations on hygrothermal aging of thermoplastic polyurethane material. Mater. Des. 2009, 30, 3958–3965. [Google Scholar] [CrossRef]
- Xu, W.; Muldowney, G. Quantification of water diffusion in CMP pad polymers and impact on mechanical properties. ECS J. Solid State Sci. 2015, 4, 5078–5087. [Google Scholar] [CrossRef]
- Rajeesh, K.R.; Gnanamoorthy, R.; Velmurugan, R. Effect of humidity on the indentation hardness and flexural fatigue behavior of polyamide 6 nanocomposite. Mater. Sci. Eng. A 2010, 527, 2826–2830. [Google Scholar] [CrossRef]
- Zhang, N.; Bai, Y.; Ding, X.; Zhang, Y. Preparation and characterization of thermoplastic materials for invisible orthodontic. Dent. Mater. J. 2011, 30, 954–959. [Google Scholar] [CrossRef] [Green Version]
- Carniel, E.L.; Fontanella, C.G.; Stefanini, C.; Natali, A.N. A procedure for the computational investigation of stress-relaxation phenomena. Mech. Time-Depend. Mater. 2013, 17, 25–38. [Google Scholar] [CrossRef]
- Aghababaei, R.; Brodsky, E.E.; Molinari, J.F.; Chandrasekar, S. How roughness emerges on natural and engineered surfaces. MRS Bull. 2022, 47, 1229–1236. [Google Scholar] [CrossRef]
- Mühlemann, S.; Bernini, J.M.; Sener, B.; Hämmerle, C.H.; Özcan, M. Effect of Aging on Stained Monolithic Resin-Ceramic CAD/CAM Materials: Quantitative and Qualitative Analysis of Surface Roughness. J. Prosthodont. 2019, 28, e563–e571. [Google Scholar] [CrossRef] [Green Version]


| Material/ Stage | I | II | III | |||
|---|---|---|---|---|---|---|
| Ra | Rz | Ra | Rz | Ra | Rz | |
| C | 0.118 ± 0.014 | 0.883 ± 0.131 | 0.121 ± 0.011 | 0.902 ± 0.116 | 0.118 ± 0.019 | 0.877 ± 0.212 |
| D | 0.127 ± 0.017 | 0.835 ± 0.153 | 0.132 ± 0.012 | 1.094 ± 0.136 | 0.113 ± 0.022 | 0.829 ± 0.199 |
| E | 0.099 ± 0.016 | 0.806 ± 0.196 | 0.134 ± 0.018 | 1.061 ± 0.146 | 0.100 ± 0.019 | 0.871 ± 0.254 |
| L | 0.109 ± 0.012 | 1.083 ± 0.112 | 0.147 ± 0.014 | 1.132 ± 0.155 | 0.106 ± 0.021 | 0.809 ± 0.218 |
| Compared Groups: Material/Stage | p Value |
|---|---|
| D/I-E/I | 0.001 |
| C/II-L/II | 0.000 |
| E/I-E/II | 0.000 |
| L/I-L/II | 0.000 |
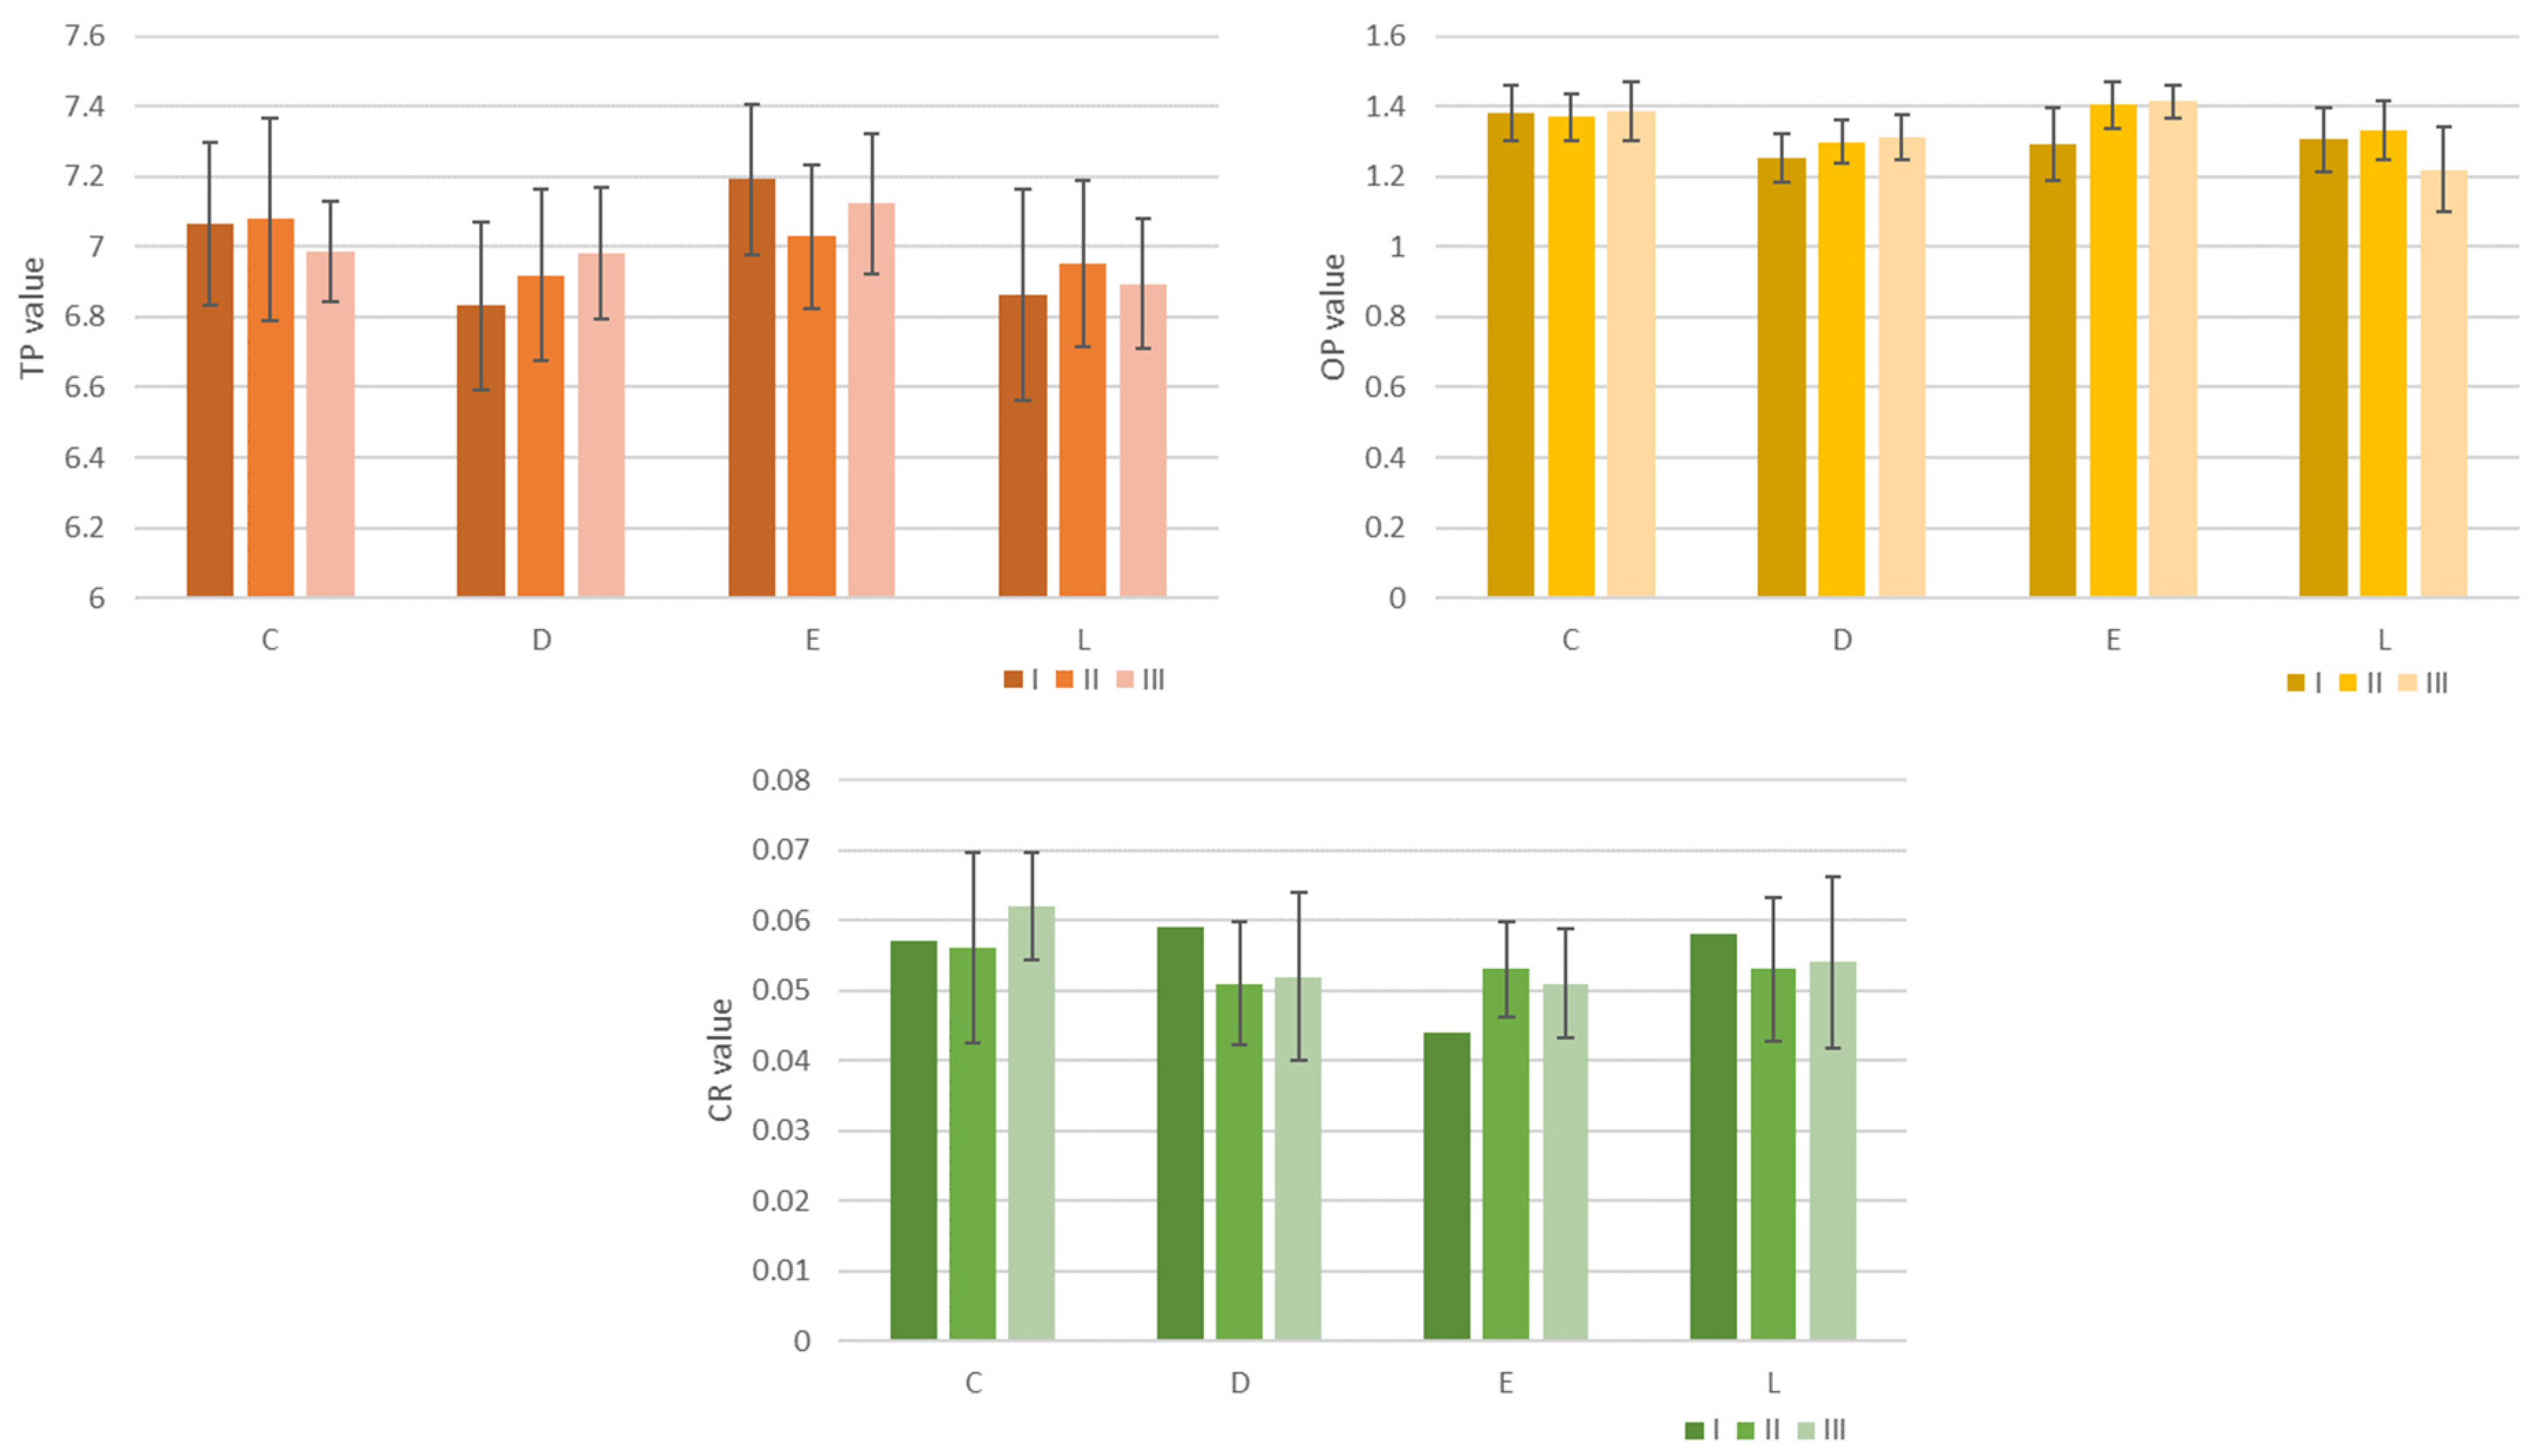
| Material/ Stage | TP | ||
|---|---|---|---|
| I | II | III | |
| C | 7.068 ± 0.231 | 7.079 ± 0.288 | 6.986 ± 0.142 |
| D | 6.832 ± 0.237 | 6.920 ± 0.246 | 6.983 ± 0.186 |
| E | 7.192 ± 0.215 | 7.030 ± 0.203 | 7.123 ± 0.198 |
| L | 6.865 ± 0.300 | 6.952 ± 0.238 | 6.894 ± 0.185 |
| Material/ Stage | OP | ||
|---|---|---|---|
| I | II | III | |
| C | 1.379 ± 0.078 | 1.379 ± 0.066 | 1.379 ± 0.083 |
| D | 1.252 ± 0.069 | 1.252 ± 0.063 | 1.252 ± 0.062 |
| E | 1.293 ± 0.102 | 1.293 ± 0.067 | 1.293 ± 0.047 |
| L | 1.305 ± 0.092 | 1.305 ± 0.082 | 1.305 ± 0.120 |
| Material/ Stage | CR | ||
|---|---|---|---|
| I | II | III | |
| C | 0.057 ± 0.009 | 0.057 ± 0.009 | 0.057 ± 0.009 |
| D | 0.059 ± 0.007 | 0.059 ± 0.007 | 0.059 ± 0.007 |
| E | 0.044 ± 0.006 | 0.044 ± 0.006 | 0.044 ± 0.006 |
| L | 0.058 ± 0.013 | 0.058 ± 0.013 | 0.058 ± 0.013 |
| Optical Parameter/ Material | L* | a* | b* |
|---|---|---|---|
| TP/C | moderate, r = 0.524 r2 = 0.275 p = 0.867 | very strong, r = 0.822 r2 = 0.676 p = 0.002 | moderate, r = 0.531 r2 = 0.282 p = 0.096 |
| TP/D | strong, r = 0.654 r2 = 0.428 p = 0.546 | very strong, r = 0.998 r2 = 0.997 p = 0.000 | very strong, r = 0.995 r2 = 0.991 p = 0.028 |
| TP/E | strong, r = 0.613 r2 = 0.375 p = 0.703 | strong, r = 0.623 r2 = 0.388 p = 0.004 | very strong, r = 0.873 r2 = 0.763 p = 0.122 |
| TP/L | strong, r = 0.673 r2 = 0.453 p = 0.472 | very strong, r = 0.944 r2 = 0.892 p = 0.001 | moderate, r = 0.500 r2 = 0.250 p = 0.071 |
| OP/C, D, E, L | strong, r = 0.782 r2 = 0.612 p = 0.700 | weak, r = 0.386 r2 = 0.149 p = 0.000 | strong, r = 0.736 r2 = 0.542 p = 0.042 |
| Material/ Period | ΔE* NBS | |
|---|---|---|
| After Water Uptake | After Desiccation | |
| C | 0.540 | 0.540 |
| D | 0.386 | 0.386 |
| E | 0.745 | 0.745 |
| L | 0.581 | 0.581 |
Disclaimer/Publisher’s Note: The statements, opinions and data contained in all publications are solely those of the individual author(s) and contributor(s) and not of MDPI and/or the editor(s). MDPI and/or the editor(s) disclaim responsibility for any injury to people or property resulting from any ideas, methods, instructions or products referred to in the content. |
© 2023 by the authors. Licensee MDPI, Basel, Switzerland. This article is an open access article distributed under the terms and conditions of the Creative Commons Attribution (CC BY) license (https://creativecommons.org/licenses/by/4.0/).
Share and Cite
Porojan, L.; Toma, F.R.; Bîrdeanu, M.I.; Vasiliu, R.D.; Matichescu, A. Topographical and Optical Characteristics of Thermoplastic Dental Appliances Materials Related to Water Sorption. J. Funct. Biomater. 2023, 14, 190. https://doi.org/10.3390/jfb14040190
Porojan L, Toma FR, Bîrdeanu MI, Vasiliu RD, Matichescu A. Topographical and Optical Characteristics of Thermoplastic Dental Appliances Materials Related to Water Sorption. Journal of Functional Biomaterials. 2023; 14(4):190. https://doi.org/10.3390/jfb14040190
Chicago/Turabian StylePorojan, Liliana, Flavia Roxana Toma, Mihaela Ionela Bîrdeanu, Roxana Diana Vasiliu, and Anamaria Matichescu. 2023. "Topographical and Optical Characteristics of Thermoplastic Dental Appliances Materials Related to Water Sorption" Journal of Functional Biomaterials 14, no. 4: 190. https://doi.org/10.3390/jfb14040190