Article

Amperometric Miniaturised Portable Enzymatic Nanobiosensor for the Ultrasensitive Analysis of a Prostate Cancer Biomarker

1
Institute of Chemistry, Slovak Academy of Sciences, Dubravska Cesta 9, 845 38 Bratislava, Slovakia
2
Center for Advanced Materials, Qatar University, Doha P.O. Box 2713, Qatar
*
Author to whom correspondence should be addressed.
J. Funct. Biomater. 2023, 14(3), 161; https://doi.org/10.3390/jfb14030161
Submission received: 19 February 2023 / Revised: 12 March 2023 / Accepted: 14 March 2023 / Published: 17 March 2023

Abstract

:
Screen-printing technology is a game changer in many fields including electrochemical biosensing. Two-dimensional nanomaterial MXene Ti3C2Tx was integrated as a nanoplatform to immobilise enzyme sarcosine oxidase (SOx) onto the interface of screen-printed carbon electrodes (SPCEs). A miniaturised, portable, and cost-effective nanobiosensor was constructed using chitosan as a biocompatible glue for the ultrasensitive detection of prostate cancer biomarker sarcosine. The fabricated device was characterised with energy-dispersive X-ray spectroscopy (EDX), electrochemical impedance spectroscopy (EIS) and cyclic voltammetry (CV). Sarcosine was detected indirectly via the amperometric detection of H2O2 formed during enzymatic reaction. The nanobiosensor could detect sarcosine down to 7.0 nM with a maximal peak current output at 4.10 ± 0.35 × 10⁻⁵ A using only 100 µL of a sample per measurement. The assay run in 100 μL of an electrolyte showed the first linear calibration curve in a concentration window of up to 5 μM with a slope of 2.86 μA·μM−1, and the second linear calibration curve in the range of 5–50 μM with a slope of 0.32 ± 0.01 μA·μM−1 (R2 = 0.992). The device provided a high recovery index of 92.5% when measuring an analyte spiked into artificial urine, and could be used for detection of sarcosine in urine for at least a period of 5 weeks after the preparation.

1. Introduction

Prostate cancer (PCa) is one of the leading global causes of cancer death and the most frequent type of cancer diagnosed for men in 112 countries. Around 650,000 new patients are diagnosed with prostate cancer each year, and the incidence continues to rise [1,2]. Among PCa risk factors, the following are at the top of the list: age, race, genetic predispositions, and family history. PCa is also linked with other factors, including eating habits (a high consumption of saturated fat of animal origin and red meat, and a low intake of fruits, vegetables, vitamins, and coffee), being overweight, physical inactivity, inflammation, hyperglycaemia, infections, and exposure to hazardous chemicals and radiation [3,4]. Male androgenic hormones also play key roles in the development and progression of PCa [5].
Most PCa types are slow-growing and often asymptomatic, or their symptoms are similar to those of benign prostate hyperplasia (BPH) and are, hence, underestimated [6,7]. Since PCa is often asymptomatic in its earlier stages, it is very difficult to diagnose it before it reaches advanced stages. Late stages of PCa are associated with frequent night urination (nocturia), pain and difficulties during urination (dysuria), and the presence of blood in urine (haematuria) [8,9]. PCa may also cause problems with sexual function and performance [10].
PCa is screened via the analysis of the serological level of the prostate-specific antigen (PSA). Initially, the US Food and Drug Administration (FDA) agency approved PSA tests together with a digital rectal examination (DRE) for PCa screening in 1994 [11]. A low level of PSA is present in healthy men, and an increased level is not only associated with PCa, but also with prostate enlargement, inflammation, and even cycling [7]. Hence, PSA is not a reliable PCa biomarker, with high false-negative and false-positive results due to the low specificity and sensitivity of the assay [7,8].
Since PSA is not able to provide reliable information as a biomarker for the diagnostics and screening of PCa, more specific biomarkers need to be studied and validated. Numerous types of biomolecules have been proposed as PCa biomarkers, including metabolites (i.e., sarcosine), proteins (i.e., prostate-specific antigen), RNAs (i.e., transmembrane protease serine 2-ETS-related gene fusion), and glycans [12,13,14,15].
Sarcosine is an intermediate metabolite involved in glycine synthesis and degradation. The first paper showing a link between changed sarcosine levels and cancer was published by A. Sreekumar and co-workers in 2009 [16]. Since this publication, there have been numerous studies that aimed to examine the association between sarcosine and PCa [17]. Elevated levels of sarcosine associated with prostate cancer can be found in prostate tissue, blood, and urine [18]. Significantly elevated levels of sarcosine are present in urine, and urine is the biofluid of choice since the analysis of biomarkers in urine is considered noninvasive [19].
The level of sarcosine in urine can vary from 20 nM to 5 µM [20]. The role of sarcosine in the onset and development of the disease is the stimulation of the growth of malignant and metastatic cells [21]. Various methods are available for the determination of sarcosine [18,22,23,24,25] that exhibit several drawbacks that can be addressed with biosensing devices that are simple, fast, inexpensive, and reliable. Electrochemical techniques coupled with SPCEs can offer additional benefits to users, including portability and miniaturisation [26,27,28]. The integration of such devices for “cancer-on-a-chip” assay platforms is an additional advantage for their use in many applied areas [29,30].
We have been witnessing a revolution in the integration of nanomaterials to design biosensors over the past few decades. MXenes, discovered in 2011, are one of the largest families of two-dimensional (2D) materials for a diverse range of applications, including biosensing due to their high electrical conductivity, large active area, hydrophilic nature, easily tuneable structure, excellent thermal stability, and large interlayer spacing [31,32,33,34].
In this work, MXene Ti3C2Tx was applied to the integration of sarcosine oxidase (SOx) onto SPCEs to fabricate a miniaturised, portable, cost-effective nanobiosensor for the ultrasensitive analysis of sarcosine as a PCa biomarker (Figure 1).
The Materials and Methods section is provided in the supporting information file.

2. Results

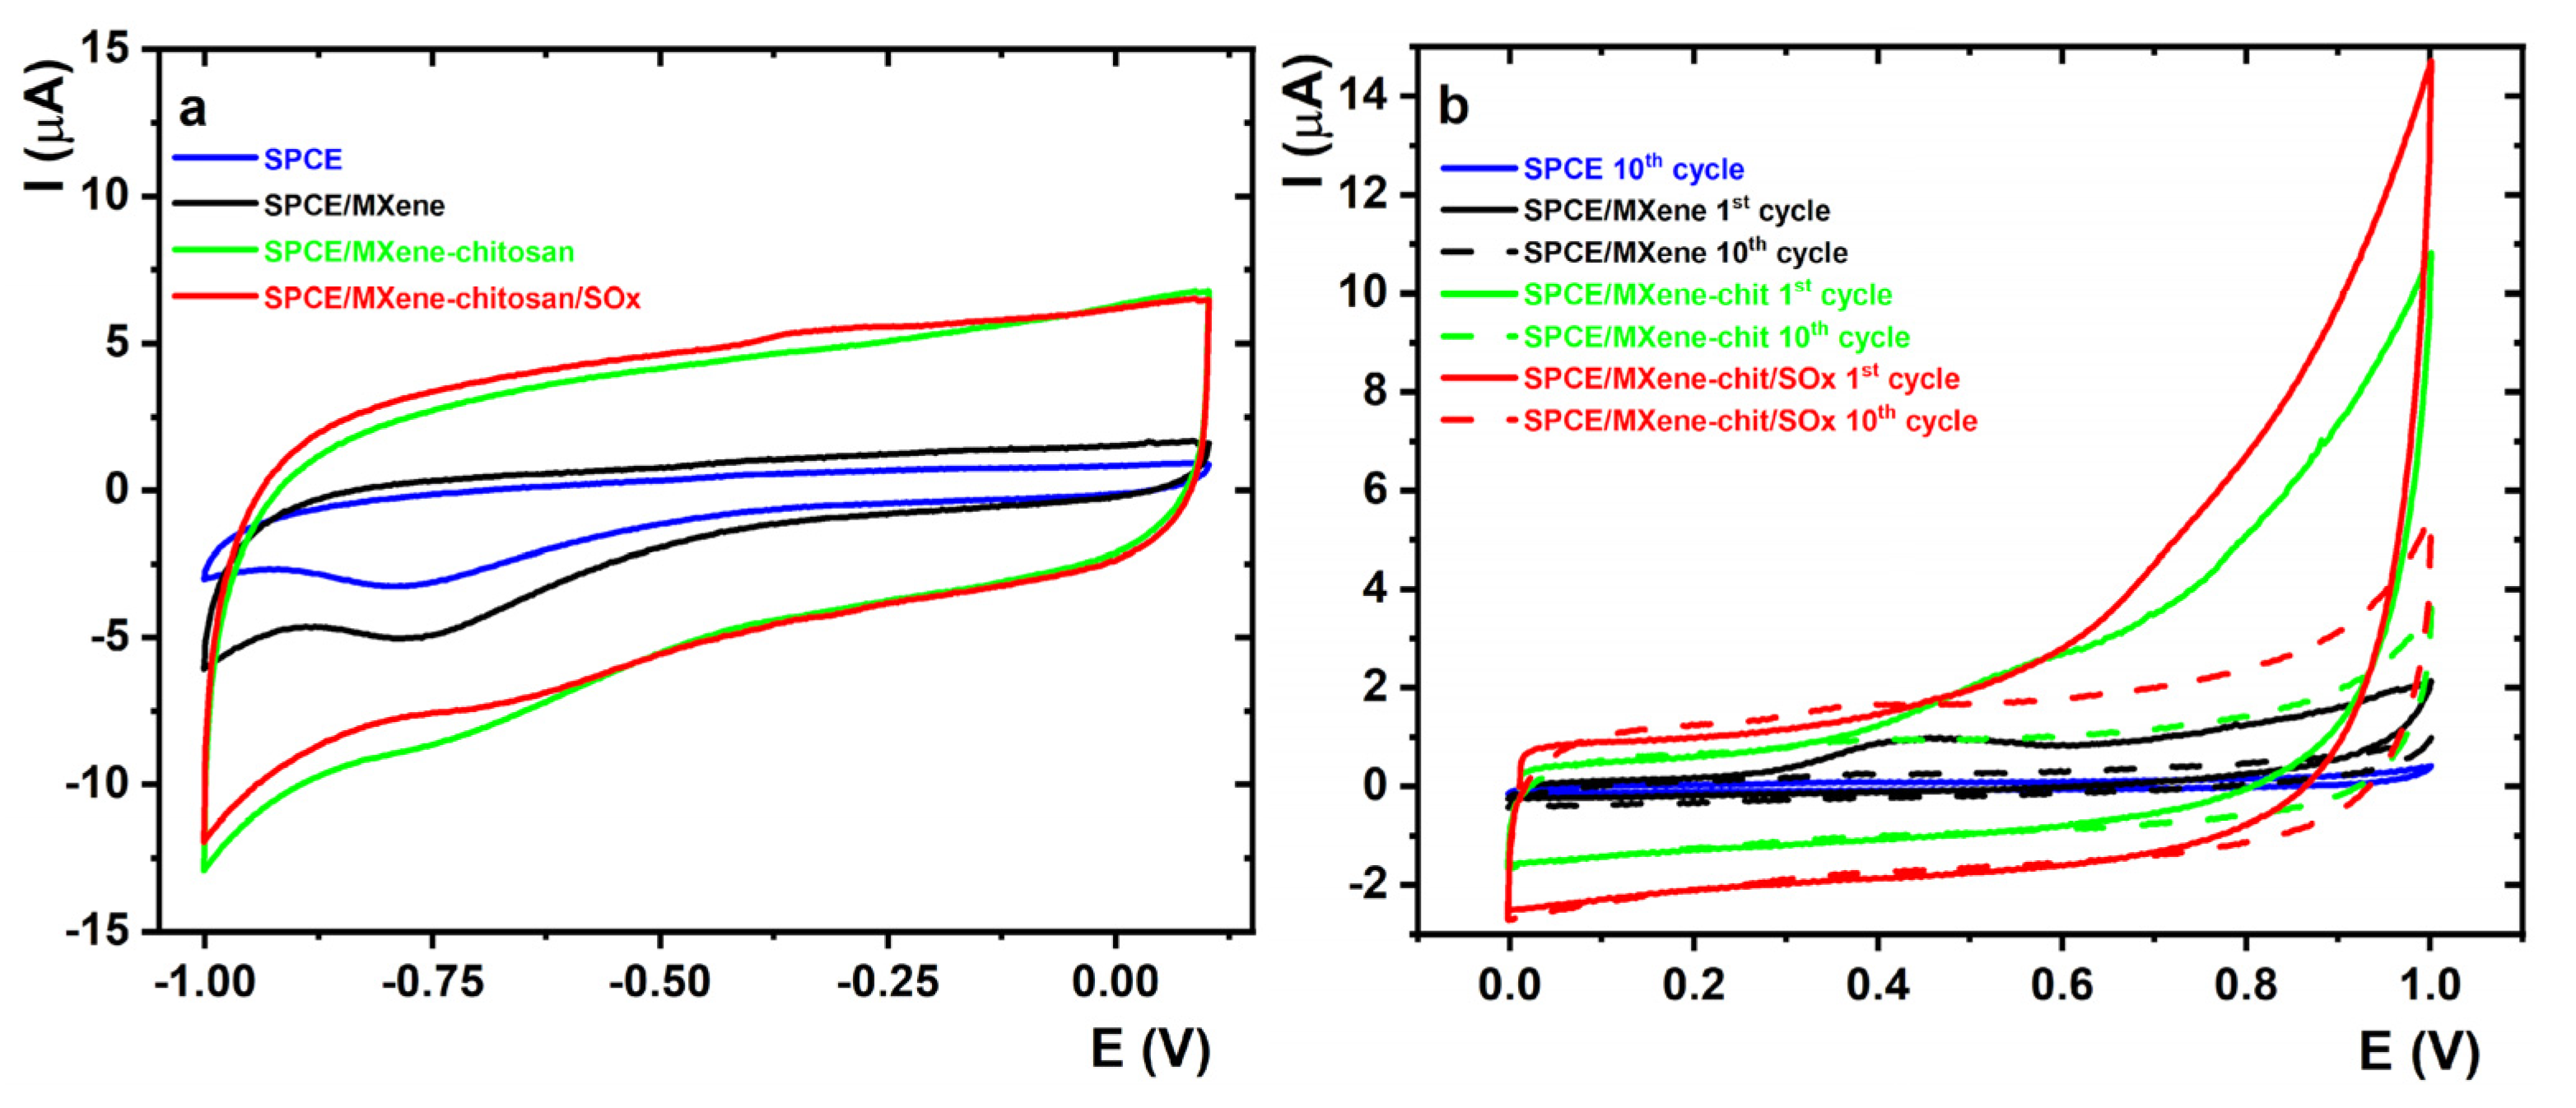
2.1. Basic CV Studies in a Plain Buffer

Initial electrochemical experiments were performed by running CVs in a plain 0.1 M PB pH 7.4 in potential windows from 0.1 to −1.0 V (a cathodic window) and from 0.0 to 1.0 V (an anodic window) with a scan rate of 0.1 V·s−1 using modified SPCEs. The following electrodes were examined: SPCE, MXene/SPCE, MXene–chitosan/SPCE, and SOx/MXene–chitosan/SPCE (Figure 2).
As shown in the Figure 2a, the capacitive current increased in the following order: unmodified SPCE, MXene/SPCE, MXene–chitosan/SPCE, and SOx/MXene–chitosan/SPCE. For MXene-modified SPCE, a higher current was observed than that of pristine SPCE because MXene/SPCE, due to the porous MXene structure, has a greater electrochemically active surface area when compared to the unmodified surface. These findings are in good agreement with already published results [35]. In the cases of MXene–chitosan/SPCE and SOx/MXene–chitosan/SPCE, the capacitive current was significantly higher than the unmodified SPCE and MXene/SPCE surface, suggesting the presence of enhanced MXene loading onto the electrode surface when present within the nanocomposite compared to the electrode modified only by MXene.
On the other hand, cyclic voltammetry in an anodic potential window (0.0 to 1.0 V) revealed that the MXene present on the MXene/SPCE surface underwent irreversible anodic oxidation with an oxidation peak at 0.457 V recorded in the first CV scan (9.67 ± 0.27) × 10−7 A (Figure 2b). The experiment revealed that the beneficial redox behaviour of MXene substantially dropped in the second scan, and a further decrease in anodic current with the increasing number of scans was observed. The exposure of MXene to an anodic potential in the aqueous solution oxidised the nanomaterial, forming a TiO2 layer or TiO2 domains with the subsequent TiO2 dissolution by F ions, rendering the resulting nanomaterial less electrochemically active compared to the pristine MXene [36]. Similar results could be observed in the cases of the MXene–chitosan/SPCE and SOx/MXene–chitosan/SPCE surfaces. The prepared devices could, thus, be applied to electrochemical reactions in a cathodic potential window.

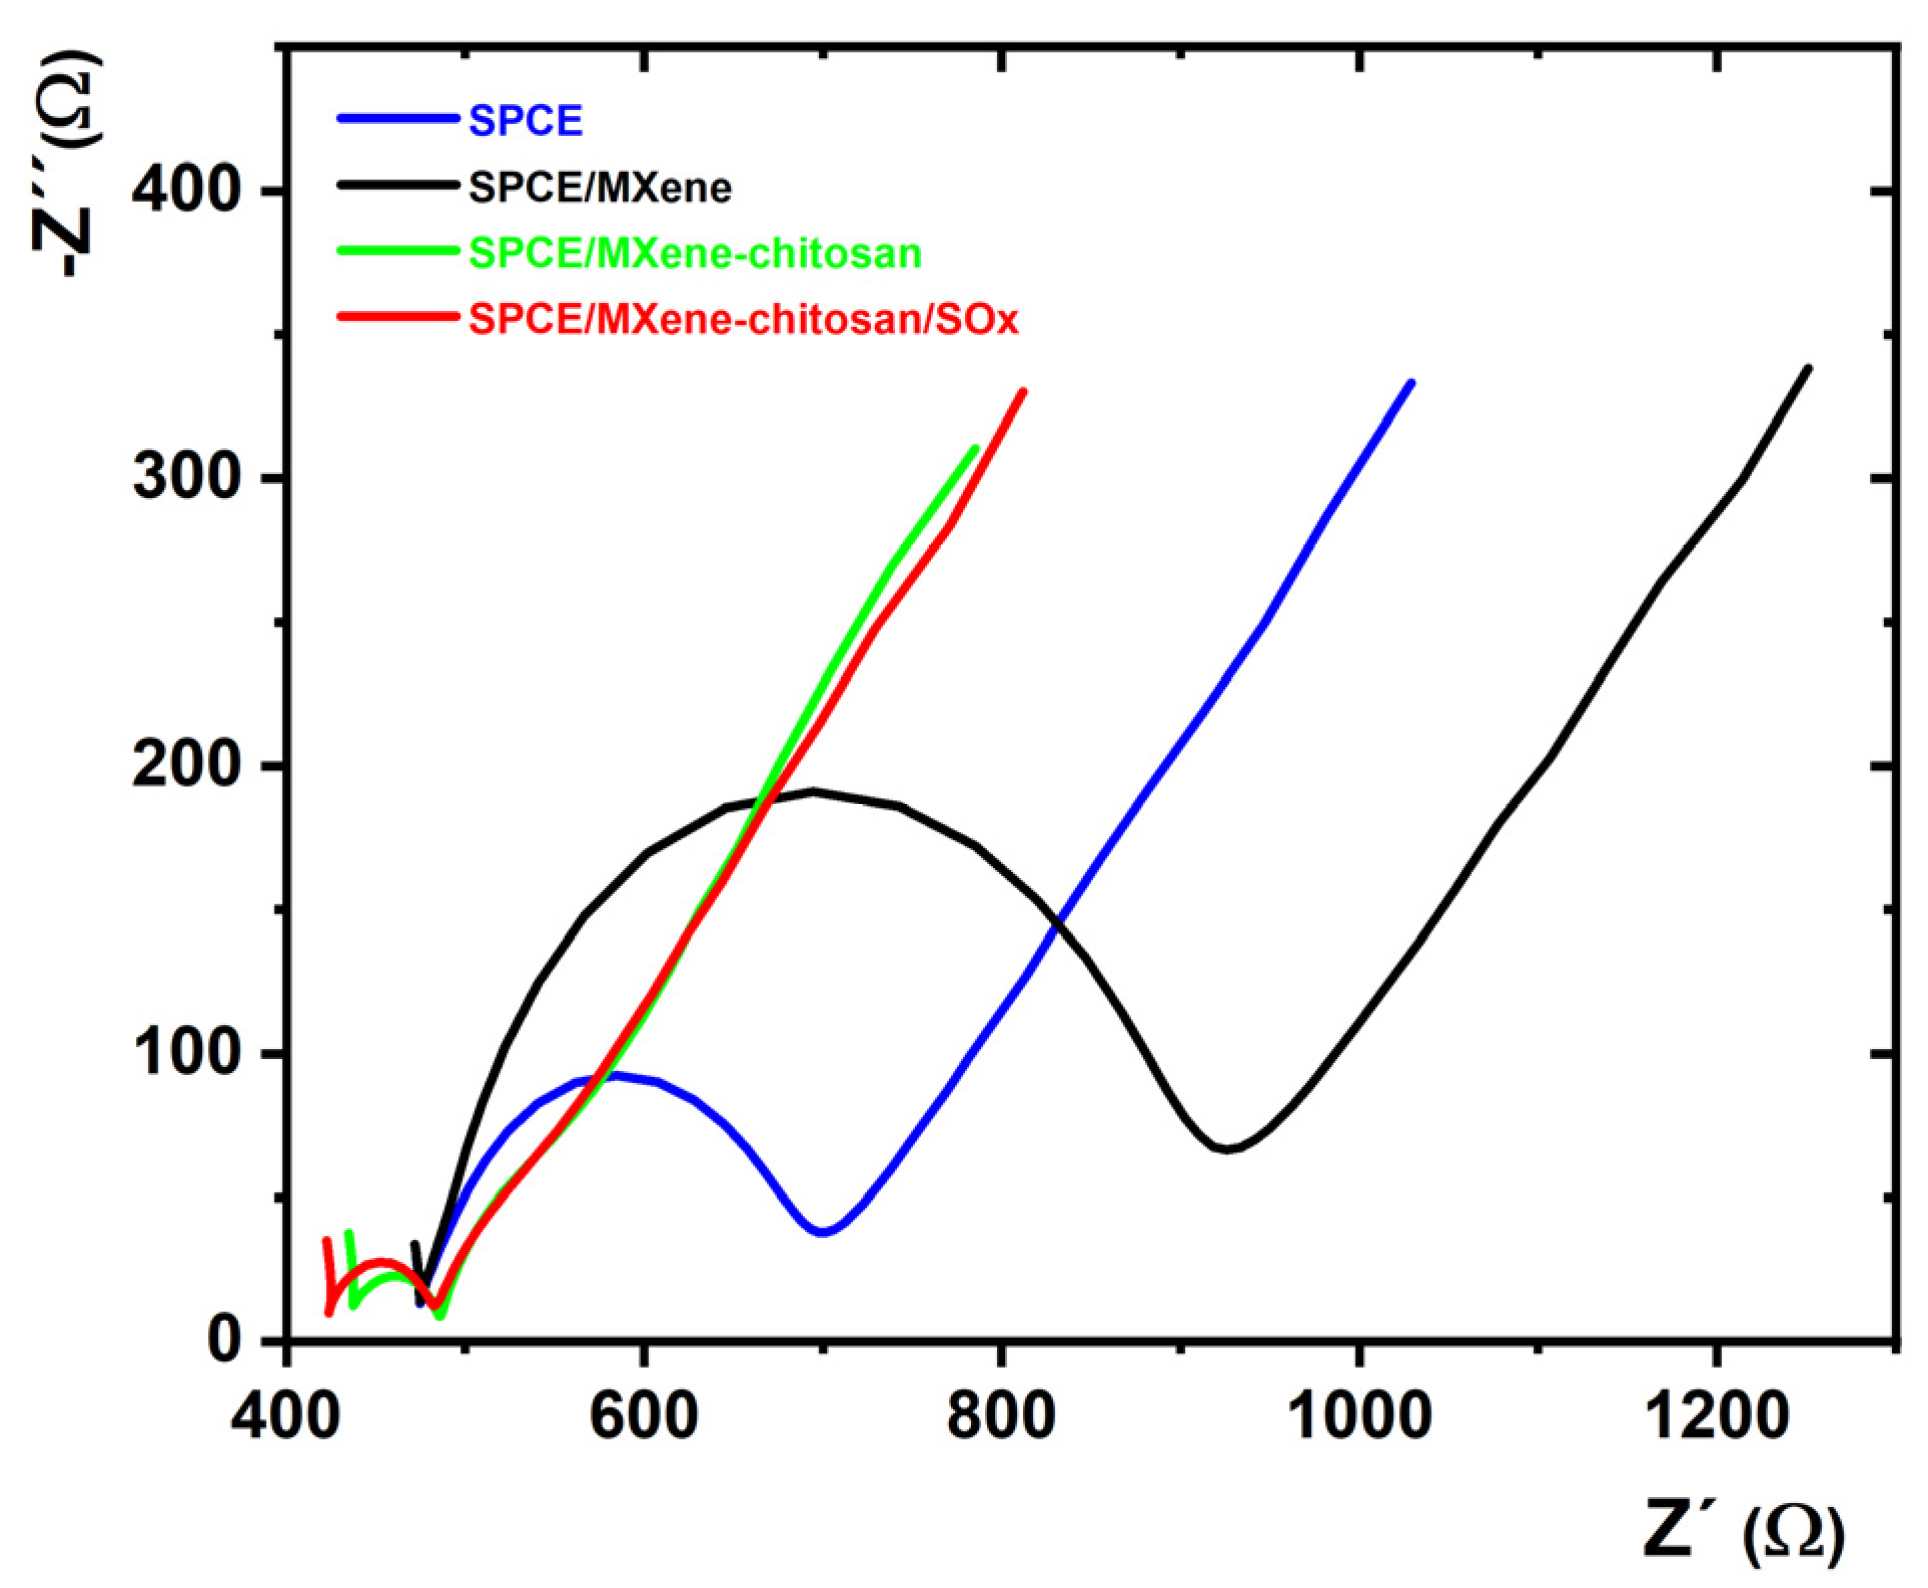
2.2. EIS Measurements Using a Ferricyanide/Ferrocyanide Redox Couple

EIS is a powerful characterisation technique to probe the interfacial properties of individual unmodified and modified SPCEs. EIS measurements were performed to observe the characteristics of individual modified SPCEs, and investigate the short-term stability of the prepared MXene/SPCE and MXene–chitosan/SPCE surfaces. Figure 3 shows the impedance spectra of the prepared modified electrodes.
A Nyquist plot shows two main features: a semicircular part with a diameter representing charge transfer resistance Rct and a linear part representing the diffusional properties of the interface [37].
EIS using a ferricyanide/ferrocyanide redox couple revealed that the Rct of MXene-modified SPCE was approximately 1.9 times larger than that of bare SPCE (Table 1), indicating that a layer of negatively charged nanomaterial had formed on the surface, which hindered the electron transfer between [Fe(CN)6]3−/4− and the electrode surface (Table 1). Though MXene could hinder the electron transfer of a negatively charged soluble redox probe pair, it is an excellent candidate with high metallic conductivity and great film-forming ability for the design of electrochemical biosensors. In contrast, the MXene–chitosan/SPCE and SOx/MXene–chitosan/SPCE surfaces exhibited significantly lower Rct compared to those of the unmodified and MXene/SPCE. The Rct value changed because of the electrostatic interactions between the positively charged chitosan-containing surface and [Fe(CN)6]3−/4− ions.
MXenes are promising nanoplatforms for the construction of biosensing devices due to their excellent physicochemical properties. A natural biopolymer, chitosan, is an excellent counterpart to MXene since it is a hydrophilic hydrogel that can form adhesive membranes/films with biocompatible properties [38,39]. Thus, the combination of chitosan and nanomaterials such as MXene is an efficient strategy for the design of mechanically robust biosensing devices [40,41].
In order to investigate the short-term stability of the prepared MXene/SPCE and MXene–chitosan/SPCE surfaces, and the stabilisation of nanomaterial with a chitosan matrix, seven subsequent EIS measurements were run in 0.1 M PB containing 5 mM K3[Fe(CN)6] and K4[Fe(CN)6]·3H2O at 50 different frequencies in the range from 0.1 Hz to 100 kHz. The obtained Nyquist plots of MXene/SPCE and MXene–chitosan/SPCE are presented in Figure 4.
The obtained results confirmed the stabilisation effect of the chitosan matrix on biosensor performance. In the case of the MXene/SPCE surface, a more significant change in Rct value was observed compared to that on the MXene–chitosan/SPCE surface. The greatest decrease in Rct value was recorded during the first four EIS measurements (Figure 4a). When the assay was performed in an electrochemical cell, a much quicker change (decrease) in Rct was observed, i.e., 84.5% of the initial value on the MXene/SPCE interface (Figure 4b) compared to the assay performed on MXene–chitosan/SPCE (Figure 4c), i.e., 93.0% of the initial value (Figure 4d) within 22 min, indicating that chitosan had a positive effect on the stability of the MXene-modified interface. The exponential fitting of the operational stability curve performed on an electrochemical cell revealed that the signal would be stable at the Rct value of 341 Ω (i.e., 77.6% of the initial value).

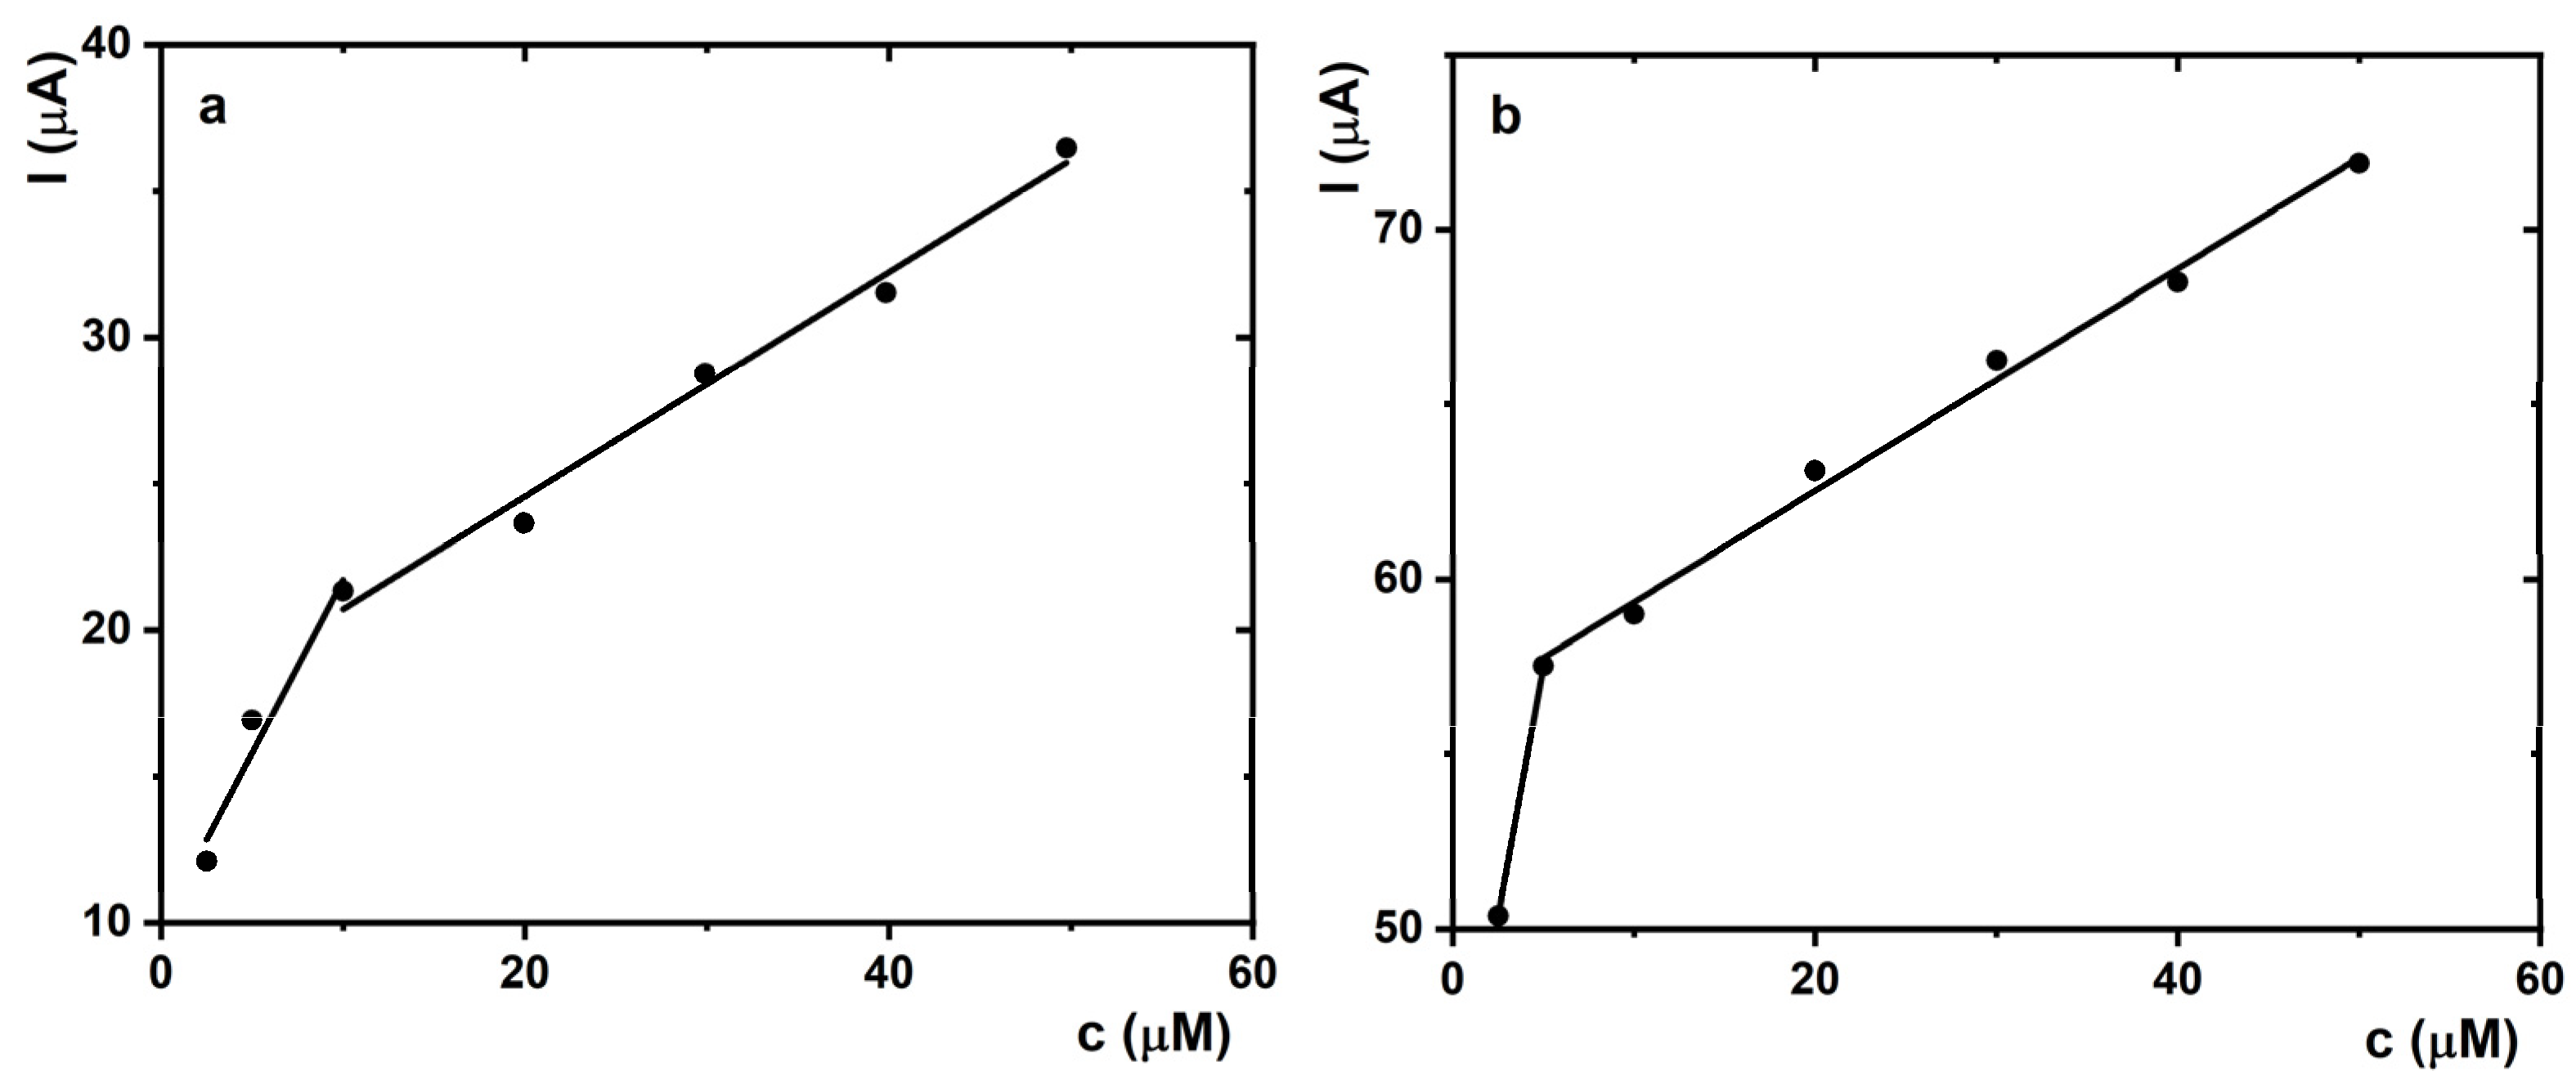
2.3. Detection of Sarcosine Using SOx/MXene–Chitosan/SPCE Biosensor

CV measurements with SOx/MXene–chitosan/SPCE electrodes for detection of sarcosine were performed in a cathodic potential window. SOx enzyme was characterised by maximal stability at pH value of 7.4 [42]. The bioelectrochemical activity of the biosensor was evaluated by constructing the corresponding calibration curves when 10 mM sarcosine stock solution was added into the cell during the measurement. The final sarcosine concentration was in the range of 2.5–50 µM. Well-defined irreversible redox peaks were observed on the SOx/MXene–chitosan/SPCE electrode in the presence of sarcosine. The cathodic peak of H2O2 reduction increased with increasing biomarker concentration (Figure 5, inset). The plot of the peak current in the first CV scan vs. sarcosine concentration was applied to calibrate the device by subtracting a blank signal. In this work, blank was considered the fifth CV scan obtained in the absence of sarcosine (Figure 5).
In comparison with our previous study, several differences could be observed when working with SOx/MXene–chitosan/SPCE biosensor compared to SOx/MXene–chitosan/GCE device [43]. Significant differences in the values of the current responses were recorded. In the case of SPCE-based detection platform, they were about 19 times higher (1.21 × 10⁻⁵ A in the presence of 2.5 μM sarcosine) in comparison with those of GCE-based biosensing (6.38 × 10⁻⁷ A in the presence of 2.5 μM sarcosine). Changes in the current responses could be attributed to the properties of the carbon working-electrode material. The fitting of the calibration curve revealed two different ranges in which the calibration curve was linear for both types of measurements (Figure 5).
The assay in the electrochemical cell exhibited a first linear calibration curve in a range up to 10 μM with a slope of 1.19 ± 0.25 μA·μM−1 (R2 = 0.910), and a second linear calibration curve in the range of 10–50 μM with a slope of 0.38 ± 0.03 μA·μM−1 (R2 = 0.982) (Figure 5a). Additionally, the prepared SOx/MXene–chitosan/SPCE biosensor exhibited a satisfactory LOD value of 7.0 nM. Hence, the LOD was successfully reduced by 2.6 times [43]. In comparison with the SOx/MXene–chitosan/GCE device, a noticeable shift in peak potential values with respect to Ag/AgCl/KCl (3 M) RE was recorded. The peak potential shifted to more positive values with the increasing concentration of sarcosine. The electrochemical reduction in H2O2 by the device started at −0.2 V, with the peak maximum present at approx. −0.6 V (Figure 5, inset).
The proposed biosensing detection platform was subsequently further optimised. For this purpose, electrochemical measurements focusing on sample volume reduction were performed. For each measurement, drops with a volume of 100 µL were applied onto the surface of the SPCE’s working electrode, since SPCEs are suitable for either working with microvolumes or dipping them into solutions. In this case, the electrochemical cell consisted of a modified carbon working electrode, carbon auxiliary electrode, and silver RE (Figure 5b). The assay run in 100 μL of an electrolyte showed a first linear calibration curve in the concentration window up to 5 μM with a slope of 2.86 μA·μM−1 and a second linear calibration curve in the range of 5–50 μM with a slope of 0.32 ± 0.01 μA·μM−1 (R2 = 0.992) (Figure 5b). In comparison with the previous measurement (Figure 5a), a shift in the reduction process towards more negative potentials was observed. The electrochemical reduction in H2O2 started at −0.5 V with the peak maximum present at −0.9 V. Such an electrochemical behaviour can be assigned to the characteristics of the silver reference electrode used in three-electrode system. Moreover, similar findings were observed in the peak potential shift towards more positive values with an increasing concentration of sarcosine when compared to that in Figure 5a. Additionally, the prepared SOx/MXene–chitosan/SPCE biosensor exhibited a satisfactory LOD value of 10.4 nM. A slight increase in the LOD value in the case of the detection of sarcosine in the drop using the SOx/MXene–chitosan/SPCE device was caused by the increased intensity of noise during the electrochemical measurements. The intensified noise could be attributed to the nature of the used SPCE devices.
The reproducibility of the biosensor device’s fabrication, examined as the sensitivity of the devices, was within 10 % (n = 5) when measured in an electrochemical cell, and within 3 % (n = 4) when measured in 100 μL of an electrolyte. Such observations indicate that it is much better to use the biosensor device for measurements in 100 μL of an electrolyte with the bionanocomposite at the bottom in the measurement setup. Part of the bionanocomposite in the electrochemical cell was most likely dissolving over time.
The above MXene-based sarcosine biosensor device based on SPCEs is among the most sensitive applied to the analysis of sarcosine when comparing the LOD with that of other publications focused on the design of sarcosine sensors or biosensors (Table 2). Additionally, the as-fabricated biosensor belongs to the most sensitive MXene-based devices published so far when considering LOD (Table 3).
Scanning electron microscopy was used to visualise both pristine MXene (Figure 6, left) and the Ti3C2TX MXene@chitosan composite (Figure 6, right).

2.4. Clinical Application of SOx/MXene–Chitosan/SPCE Biosensor

The practical application of the biosensor was evaluated by analysing the analyte in real samples. For that purpose, the SOx/MXene–chitosan/SPCE device was applied to analyse sarcosine (from 0.1 to 1.0 µM) spiked into 10× diluted artificial urine using sarcosine as the PCa biomarker [20]. Calibration curves were obtained from measurements in 0.1 M PB pH 7.4 and 10× diluted artificial urine together with the CVs of the prepared SOx/MXene–chitosan/SPCE biosensor. The value of the obtained recovery index was 92.5% (data not shown). The recovery index was calculated via the standard addition of 1 μM sarcosine into artificial urine, and the current response obtained in urine was compared to the current response obtained in plain PB. This means that, under such conditions, there were no significant interferences affecting the biosensor’s performance. The results prove that the as-fabricated biosensor is a reliable tool for sarcosine detection in urine samples. Obviously, analysis with real human urine is needed to reach more general conclusions about the performance of the prepared MXene-based sarcosine biosensor in the analysis of real urine samples.

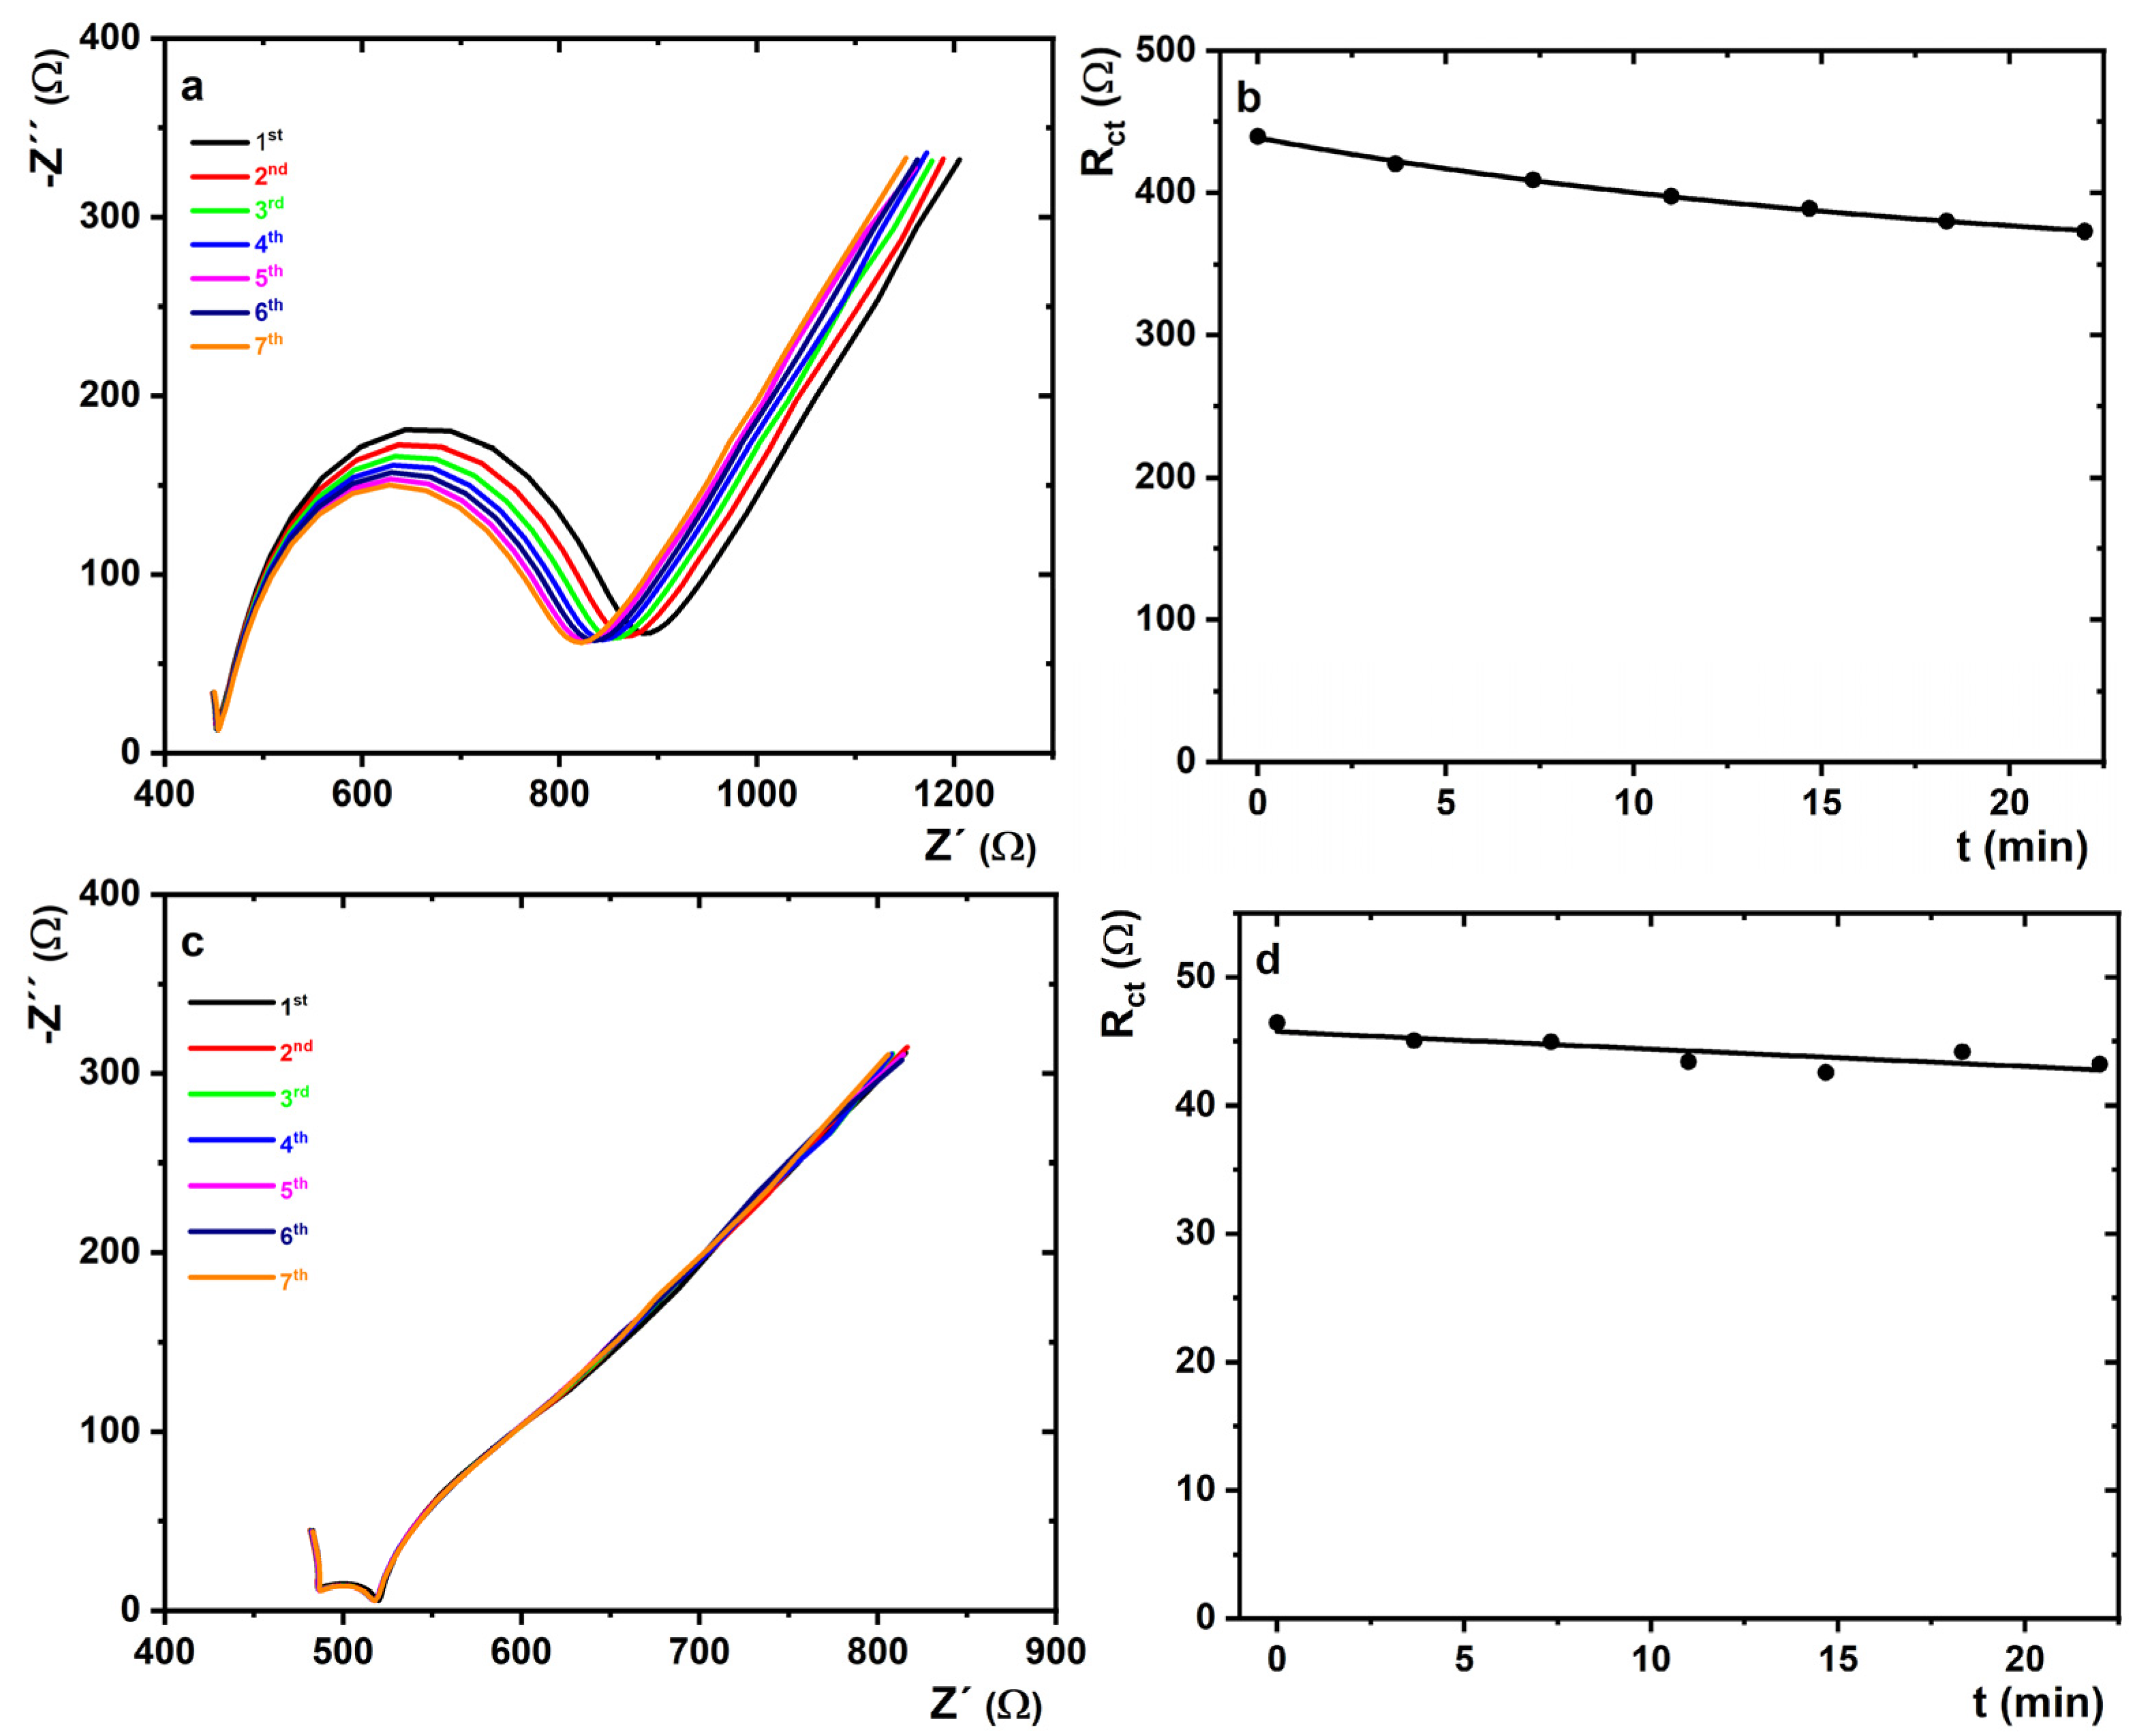
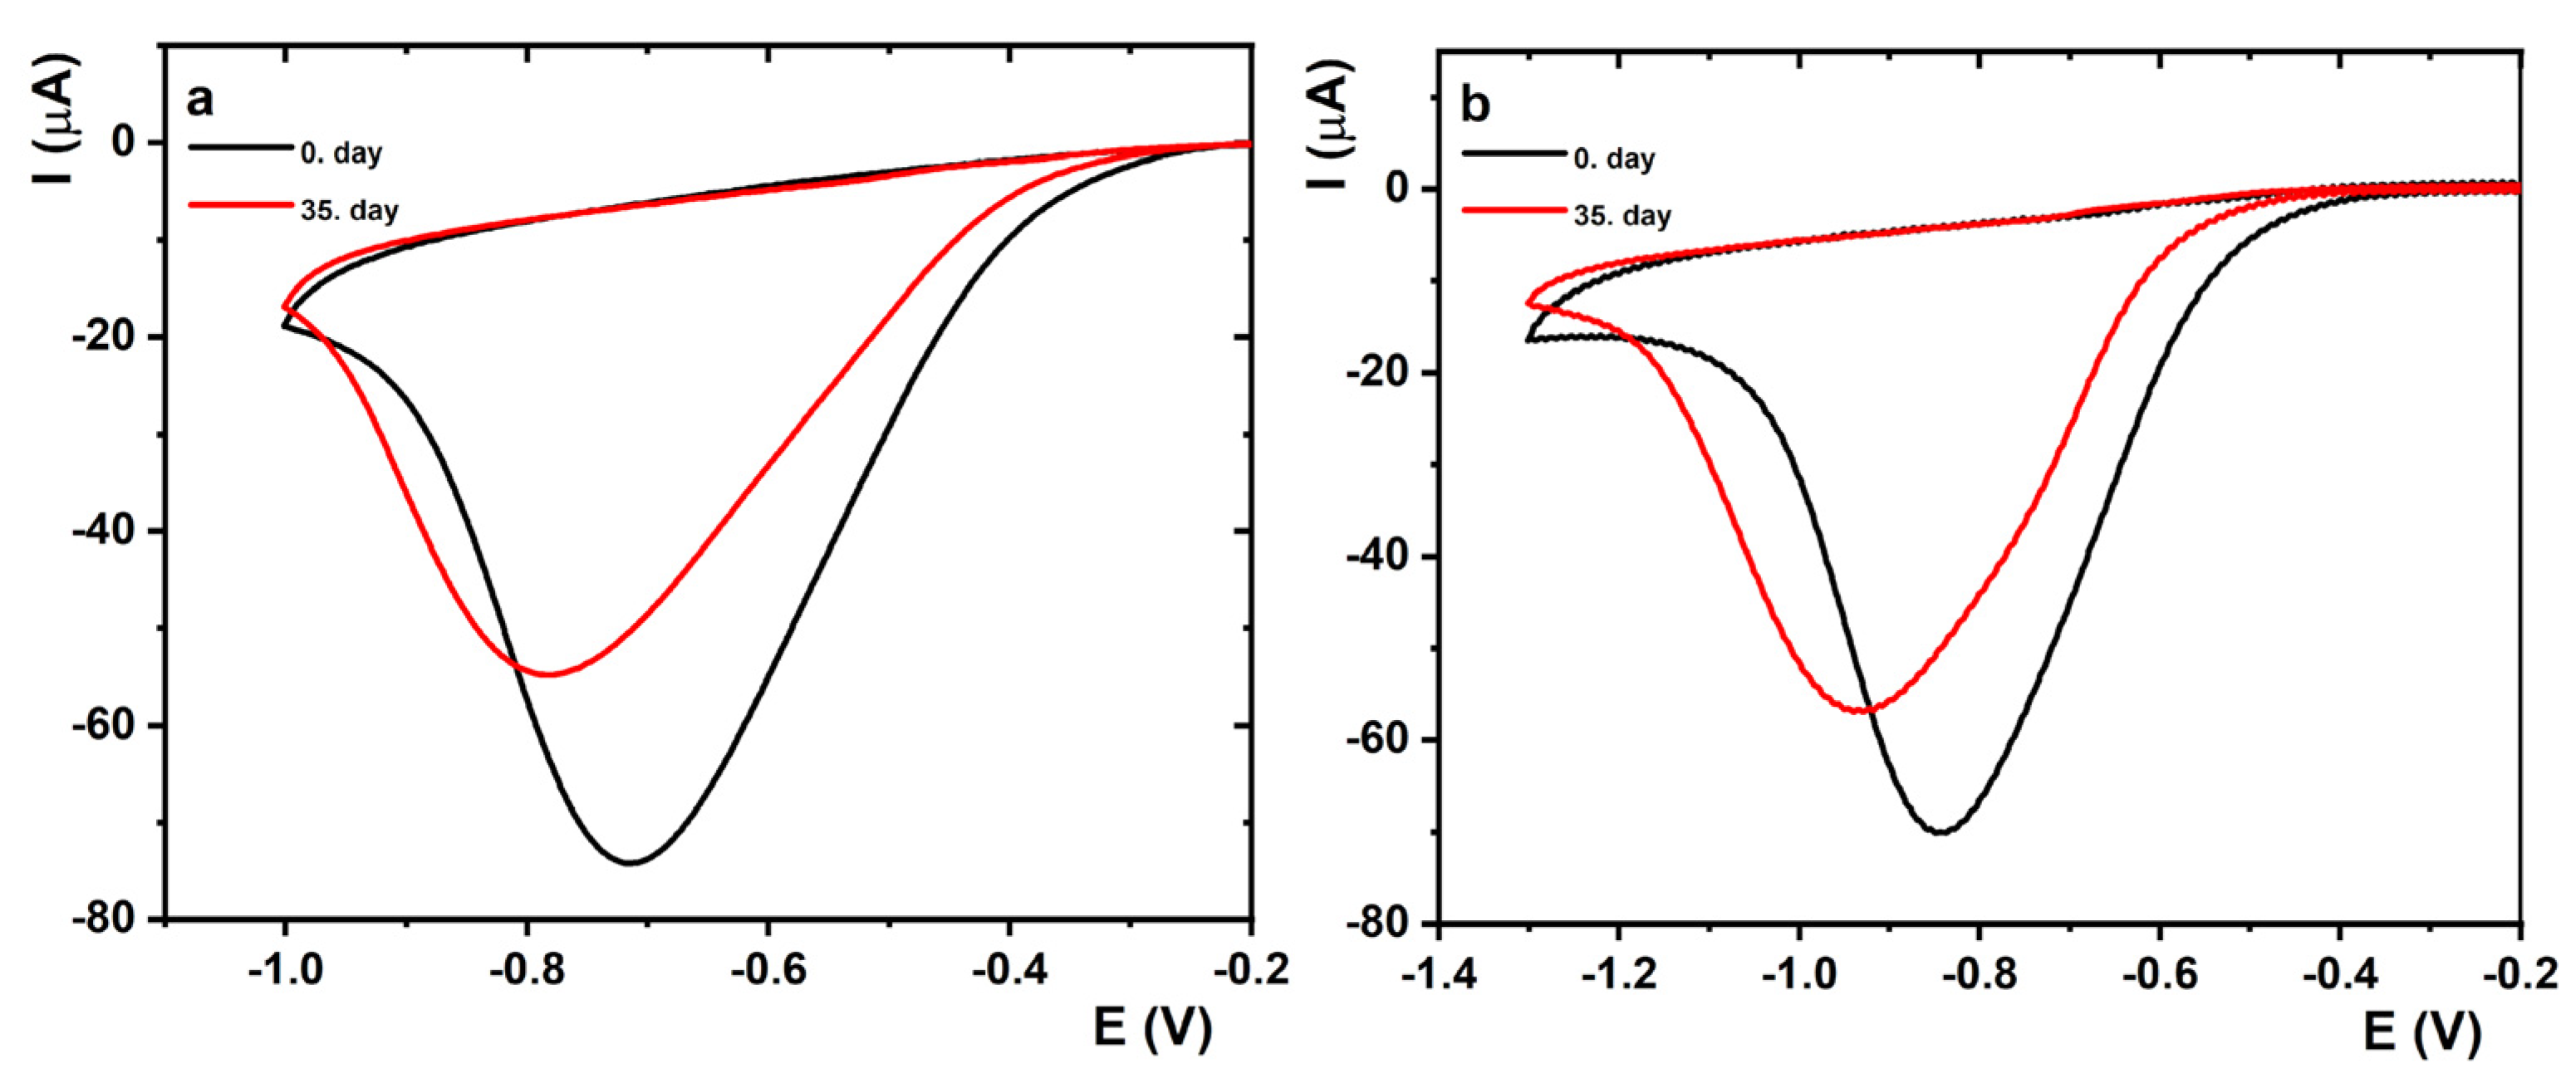
2.5. Long-Term Stability of the SOx/MXene–Chitosan/SPCE Device

To investigate the long-term stability of the prepared SOx/MXene–chitosan/SPCE device, CV measurements in the presence of 30 µM sarcosine in the potential window from 0.1 to −1.0 V and 0.1 to −1.3 V in the cell and in a 100 µL droplet, respectively, were performed (Figure 7). All prepared devices were stored in the refrigerator throughout the experiment.
In the case of the performed measurements in the cell (Figure 7a), the average current responses of the prepared SOx/MXene–chitosan/SPCE device decreased from 7.05 ± 0.51 × 10⁻⁵ A on day 0 to 5.94 ± 0.65 × 10⁻⁵ A on Day 35 after biosensor preparation. Thus, a 15.7% drop of the SOx/MXene–chitosan/SPCE current response was observed for measurements in the cell within 35 days. For the measurements performed in the 100 µL droplet (Figure 7b), a 6.8% decrease in the SOx/MXene–chitosan/SPCE current response was observed on Day 35 after fabrication. In this case, the average current responses of the prepared SOx/MXene–chitosan/SPCE device decreased from 6.12 ± 0.77 × 10⁻⁵ A on Day 0 to 5.71 ± 0.01 × 10⁻⁵ A on Day 35. Despite a slight decrease in the current response, the as-fabricated SOx/MXene-chitosan/SPCE device was able to detect sarcosine even after a period of 5 weeks. In summary, the obtained data confirm that the as-fabricated device could be used for analysis for at least 5 weeks after its preparation.

3. Conclusions

The goal of this paper was to design an enzymatic nanobiosensor for the detection of PCa biomarkers using disposable SPCEs and modern 2D nanomaterial MXene in order to prepare a sensitive, reliable, portable and miniaturised, stable, cost-effective, and quick detection platform based on previously obtained results and findings. By dipping SPCEs into the solution, the prepared SOx/MXene–chitosan/SPCE biosensor exhibited a satisfactory LOD value of 7.0 nM. Hence, the LOD was successfully reduced 2.6 times when compared to our previous paper. The proposed detection platform was subsequently further optimised with a focus on a sample volume reduction of up to 100 µL, exhibiting a satisfactory LOD value of 10.4 nM. To investigate the long-term stability of the prepared SOx/MXene–chitosan/SPCE device, CV measurements were performed in the presence of 30 µM in both the cell and a 100 µL droplet. For the measurements performed in the 100 µL droplet, only a 6.8% decrease in the SOx/MXene–chitosan/SPCE current response could be observed during the first 35 days after fabrication. Thus, the obtained data confirm that the as-fabricated device could be used for the detection of sarcosine in urine for a period of at least 5 weeks after its preparation. Moreover, to evaluate the potential application of the biosensor for the analysis of real samples, the as-fabricated device was successfully applied for the determination of sarcosine spiked into 10× diluted artificial urine with the 92.5% recovery index value. Such results prove that the as-fabricated biosensor is a reliable tool for sarcosine detection in urine samples. The portable SOx/MXene–chitosan/SPCE device is one of the most sensitive electrochemical biosensor devices for the analysis of sarcosine when classified by LOD. Additionally, the as-fabricated MXene-based biosensor is one of the most sensitive MXene-based devices.

Supplementary Materials

The following supporting information can be downloaded at: https://www.mdpi.com/article/10.3390/jfb14030161/s1, Figure S1: Enlarged graph shown in Figure 5A in the inset; Figure S2: Enlarged graph shown in Figure 5B in the inset.

Author Contributions

Conceptualisation, T.B. and J.T.; methodology, L.L., T.B., M.B., P.K. and J.T.; validation, S.H. and L.L.; formal analysis, M.H. and E.J.; investigation, S.H., L.L., M.H. and E.J.; resources, M.B., P.K. and J.T.; data curation, S.H., L.L. and J.T.; writing—original draft preparation, S.H., L.L. and J.T.; writing—review and editing, S.H., L.L., T.B., M.H., E.J., M.B., P.K. and J.T.; supervision, T.B. and M.B.; project administration, M.B., P.K. and J.T.; funding acquisition, M.B., P.K. and J.T. All authors have read and agreed to the published version of the manuscript.

Funding

This research was funded by the Slovak Research and Development Agency (APVV-20-0272 and APPV 17-0300) and by the Slovak Scientific Grant Agency (VEGA 2/0137/18 and 2/0130/20). We would like to acknowledge the support received from the Ministry of Health of the Slovak Republic under project registration number 2019/68-CHÚSAV-1. This publication was created with the support of the Operational Programme Integrated Infrastructure for the project of Center for Biomedical Research-BIOMEDIRES-II stage (ITMS: 313011W428) co-financed by the European Regional Development Fund. P.K. thanks that this publication was jointly supported by Qatar University grant # QUCG-CAM-22/23-504.

Data Availability Statement

Research data are available upon request.

Conflicts of Interest

The authors declare no conflict of interest.

References

  1. Sung, H.; Ferlay, J.; Siegel, R.L.; Laversanne, M.; Soerjomataram, I.; Jemal, A.; Bray, F. Global Cancer Statistics 2020: GLOBOCAN Estimates of Incidence and Mortality Worldwide for 36 Cancers in 185 Countries. Cancer J. Clin. 2021, 71, 209–249. [Google Scholar] [CrossRef]
  2. Nuhić, J.; Kevrić, J. Prostate Cancer Detection Using Different Classification Techniques. In CMBEBIH 2019; Springer: Banja Luka, Bosnia and Herzegovina, 2020; pp. 67–73. [Google Scholar]
  3. Rawla, P. Epidemiology of Prostate Cancer. World J. Oncol. 2019, 10, 63–89. [Google Scholar] [CrossRef] [Green Version]
  4. Bertok, T.; Bertokova, A.; Hroncekova, S.; Chocholova, E.; Svecova, N.; Lorencova, L.; Kasak, P.; Tkac, J. Novel Prostate Cancer Biomarkers: Aetiology, Clinical Performance and Sensing Applications. Chemosensors 2021, 9, 205. [Google Scholar] [CrossRef]
  5. Bostwick, D.G.; Burke, H.B.; Djakiew, D.; Euling, S.; Ho, S.M.; Landolph, J.; Morrison, H.; Sonawane, B.; Shifflett, T.; Waters, D.J.; et al. Human prostate cancer risk factors. Cancer 2004, 101, 2371–2490. [Google Scholar] [CrossRef]
  6. Tkac, J.; Bertok, T.; Hires, M.; Jane, E.; Lorencova, L.; Kasak, P. Glycomics of prostate cancer: Updates. Exp. Rev. Proteom. 2019, 16, 65–76. [Google Scholar] [CrossRef]
  7. Tkac, J.; Gajdosova, V.; Hroncekova, S.; Bertok, T.; Hires, M.; Jane, E.; Lorencova, L.; Kasak, P. Prostate-specific antigen glycoprofiling as diagnostic and prognostic biomarker of prostate cancer. Interface Focus 2019, 9, 20180077. [Google Scholar] [CrossRef] [Green Version]
  8. Damborsky, P.; Damborska, D.; Belicky, S.; Tkac, J.; Katrlik, J. Sweet Strategies in Prostate Cancer Biomarker Research: Focus on a Prostate Specific Antigen. BioNanoScience 2017, 8, 690–700. [Google Scholar] [CrossRef]
  9. Talcott, A.; Rieker, P.; Clark, J.A.; Propert, K.J.; Weeks, J.C.; Beard, C.J.; Wishnow, K.I.; Kaplan, I.; Laughlin, K.R.; Richie, J.P.; et al. Patient-Reported Symptoms After Primary Therapy for Early Prostate Cancer: Results of a Prospective Cohort Study. J. Clin. Oncol. 1998, 16, 275–283. [Google Scholar] [CrossRef]
  10. Miller, D.C.; Hafez, K.S.; Stewart, A.; Montie, J.E.; Wei, J.T. Prostate carcinoma presentation, diagnosis, and staging: An update form the National Cancer Data Base. Cancer 2003, 98, 1169–1178. [Google Scholar] [CrossRef]
  11. O’Reilly, J.; O’Kennedy, R.J. Prostate Cancer Detection: Complexities and Strategies. J. Cancer Treat. Diagn. 2017, 2, 18–25. [Google Scholar] [CrossRef]
  12. Katafigioti, A.; Katafigiotis, I.; Sfoungaristos, S.; Alamanis, C.; Stravodimos, K.; Anastasiou, I.; Roumelioti, E.; Duvdevani, M.; Constantinides, C. In the search of novel urine biomarkers for the early diagnosis of prostate cancer. Intracellular or secreted proteins as the target group? Where and how to search for possible biomarkers useful in the everyday clinical practice. Arch. Ital. Urol. Androl. 2016, 88, 195–200. [Google Scholar] [CrossRef] [Green Version]
  13. Jakobsen, N.A.; Hamdy, F.C.; Bryant, R.J. Novel biomarkers for the detection of prostate cancer. J. Clin. Urol. 2016, 9, 3–10. [Google Scholar] [CrossRef] [Green Version]
  14. Bertok, T.; Lorencova, L.; Hroncekova, S.; Gajdosova, V.; Jane, E.; Hires, M.; Kasak, P.; Kaman, O.; Sokol, R.; Bella, V.; et al. Advanced impedimetric biosensor configuration and assay protocol for glycoprofiling of a prostate oncomarker using Au nanoshells with a magnetic core. Biosens. Bioelectron. 2019, 131, 24–29. [Google Scholar] [CrossRef]
  15. Bertokova, A.; Bertok, T.; Jane, E.; Hires, M.; Dubjakova, P.; Novotna, O.; Belan, V.; Fillo, J.; Tkac, J. Detection of N,N-diacetyllactosamine (LacdiNAc) containing free prostate-specific antigen for early stage prostate cancer diagnostics and for identification of castration-resistant prostate cancer patients. Biorg. Med. Chem. 2021, 39, 116156. [Google Scholar] [CrossRef]
  16. Sreekumar, A.; Poisson, L.M.; Rajendiran, T.M.; Khan, A.P.; Cao, Q.; Yu, J.; Laxman, B.; Mehra, R.; Lonigro, R.J.; Li, Y.; et al. Metabolomic profiles delineate potential role for sarcosine in prostate cancer progression. Nature 2009, 457, 910–914. [Google Scholar] [CrossRef] [Green Version]
  17. Yousefi, M.; Qujeq, D.; Shafi, H.; Tilaki, K.H. Serum and Urine Levels of Sarcosine in Benign Prostatic Hyperplasia and Newly Diagnosed Prostate Cancer Patients. J. Kermanshah Univ. Med. Sci. 2020, 24, e970002020. [Google Scholar] [CrossRef] [Green Version]
  18. Cernei, N.; Heger, Z.; Gumulec, J.; Zitka, O.; Masarik, M.; Babula, P.; Eckschlager, T.; Stiborova, M.; Kizek, R.; Adam, V. Sarcosine as a potential prostate cancer biomarker-a review. Int. J. Mol. Sci. 2013, 14, 13893–13908. [Google Scholar] [CrossRef] [Green Version]
  19. Jornet-Martínez, N.; Henderson, C.J.; Campíns-Falcó, P.; Daly, R.; Hall, E.A.H. Towards sarcosine determination in urine for prostatic carcinoma detection. Sens. Actuat. B Chem. 2019, 287, 380–389. [Google Scholar] [CrossRef]
  20. Hu, J.; Wei, W.; Ke, S.; Zeng, X.; Lin, P. A novel and sensitive sarcosine biosensor based on organic electrochemical transistor. Electrochim. Acta 2019, 307, 100–106. [Google Scholar] [CrossRef]
  21. Khan, A.P.; Rajendiran, T.M.; Ateeq, B.; Asangani, I.A.; Athanikar, J.N.; Yocum, A.K.; Mehra, R.; Siddiqui, J.; Palapattu, G.; Wei, J.T.; et al. The role of sarcosine metabolism in prostate cancer progression. Neoplasia 2013, 15, 491–501. [Google Scholar] [CrossRef] [Green Version]
  22. Mazzu-Nascimento, T.; Gomes Carneiro Leão, P.A.; Catai, R.J.; Morbioli, G.; Carrilho, E. Towards low-cost bioanalytical tools for sarcosine assays for cancer diagnostics. Anal. Methods 2016, 8, 7312–7318. [Google Scholar] [CrossRef]
  23. Burton, C.; Gamagedara, S.; Ma, Y. A novel enzymatic technique for determination of sarcosine in urine samples. Anal. Methods 2012, 4, 141–146. [Google Scholar] [CrossRef]
  24. Cernei, N.; Zitka, O.; Ryvolova, M.; Adam, V.; Masarik, M.; Hubalek, J.; Kizek, R. Spectrometric and Electrochemical Analysis of Sarcosine as a Potential Prostate Carcinoma Marker. Int. J. Electrochem. Sci. 2012, 7, 4286–4301. [Google Scholar]
  25. Jiang, Y.; Cheng, X.; Wang, C.; Ma, Y. Quantitative Determination of Sarcosine and Related Compounds in Urinary Samples by Liquid Chromatography with Tandem Mass Spectrometry. Anal. Chem. 2010, 82, 9022–9027. [Google Scholar] [CrossRef] [PubMed]
  26. Torres-Rivero, K.; Florido, A.; Bastos-Arrieta, J. Recent Trends in the Improvement of the Electrochemical Response of Screen-Printed Electrodes by Their Modification with Shaped Metal Nanoparticles. Sensors 2021, 21, 2596. [Google Scholar] [CrossRef] [PubMed]
  27. Suresh, R.R.; Lakshmanakumar, M.; Arockia Jayalatha, J.B.B.; Rajan, K.S.; Sethuraman, S.; Krishnan, U.M.; Rayappan, J.B.B. Fabrication of screen-printed electrodes: Opportunities and challenges. J. Mater. Sci. 2021, 56, 8951–9006. [Google Scholar] [CrossRef]
  28. Yanez-Sedeno, P.; Campuzano, S.; Pingarron, J.M. Screen-Printed Electrodes: Promising Paper and Wearable Transducers for (Bio)Sensing. Biosensors 2020, 10, 76. [Google Scholar] [CrossRef] [PubMed]
  29. Cui, F.; Zhou, Z.; Zhou, H.S. Review—Measurement and Analysis of Cancer Biomarkers Based on Electrochemical Biosensors. J. Electrochem. Soc. 2020, 167, 037525. [Google Scholar] [CrossRef]
  30. García-Miranda Ferrari, A.; Rowley-Neale, S.J.; Banks, C.E. Screen-printed electrodes: Transitioning the laboratory in-to-the field. Talanta Open 2021, 3, 100032. [Google Scholar] [CrossRef]
  31. Jun, B.M.; Kim, S.; Heo, J.; Park, C.M.; Her, N.; Jang, M.; Huang, Y.; Han, J.; Yoon, Y. Review of MXenes as new nanomaterials for energy storage/delivery and selected environmental applications. Nano Res. 2018, 12, 471–487. [Google Scholar] [CrossRef] [Green Version]
  32. Hart, J.L.; Hantanasirisakul, K.; Lang, A.C.; Anasori, B.; Pinto, D.; Pivak, Y.; van Omme, J.T.; May, S.J.; Gogotsi, Y.; Taheri, M.L. Control of MXene’s electronic properties through termination and intercalation. Nat. Commun. 2019, 10, 522. [Google Scholar] [CrossRef] [PubMed] [Green Version]
  33. Anasori, B.; Lukatskaya, M.R.; Gogotsi, Y. 2D metal carbides and nitrides (MXenes) for energy storage. Nat. Rev. Mat. 2017, 2, 16098. [Google Scholar] [CrossRef]
  34. Hong, W.; Wyatt, B.C.; Nemani, S.K.; Anasori, B. Double transition-metal MXenes: Atomistic design of two-dimensional carbides and nitrides. MRS Bull. 2020, 45, 850–861. [Google Scholar] [CrossRef]
  35. Liu, H.; Duan, C.; Yang, C.; Shen, W.; Wang, F.; Zhu, Z. A novel nitrite biosensor based on the direct electrochemistry of hemoglobin immobilized on MXene-Ti3C2. Sens. Actuat. B Chem. 2015, 218, 60–66. [Google Scholar] [CrossRef]
  36. Lorencova, L.; Bertok, T.; Dosekova, E.; Holazova, A.; Paprckova, D.; Vikartovska, A.; Sasinkova, V.; Filip, J.; Kasak, P.; Jerigova, M.; et al. Electrochemical performance of Ti3C2Tx MXene in aqueous media: Towards ultrasensitive H2O2 sensing. Electrochim. Acta 2017, 235, 471–479. [Google Scholar] [CrossRef] [Green Version]
  37. Feng, J.J.; Zhao, G.; Xu, J.J.; Chen, H.Y. Direct electrochemistry and electrocatalysis of heme proteins immobilized on gold nanoparticles stabilized by chitosan. Anal. Biochem. 2005, 342, 280–286. [Google Scholar] [CrossRef]
  38. Yang, P.; Gao, X.; Wang, L.; Wu, Q.; Chen, Z.; Lin, X. Amperometric sensor for ascorbic acid based on a glassy carbon electrode modified with gold-silver bimetallic nanotubes in a chitosan matrix. Microchim. Acta 2013, 181, 231–238. [Google Scholar] [CrossRef]
  39. Suginta, W.; Khunkaewla, P.; Schulte, A. Electrochemical biosensor applications of polysaccharides chitin and chitosan. Chem. Rev. 2013, 113, 5458–5479. [Google Scholar] [CrossRef]
  40. Hao, C.; Shen, Y.; Shen, J.; Xu, K.; Wang, X.; Zhao, Y.; Ge, C. A glassy carbon electrode modified with bismuth oxide nanoparticles and chitosan as a sensor for Pb(II) and Cd(II). Microchim. Acta 2016, 183, 1823–1830. [Google Scholar] [CrossRef]
  41. Xu, W.; Qing, Y.; Chen, S.; Chen, J.; Qin, Z.; Qiu, J.; Li, C. Electrochemical indirect competitive immunoassay for ultrasensitive detection of zearalenone based on a glassy carbon electrode modified with carboxylated multi-walled carbon nanotubes and chitosan. Microchim. Acta 2017, 184, 3339–3347. [Google Scholar] [CrossRef]
  42. Matsuda, Y.; Hoshika, H.; Inouye, Y.; Ikuta, S.; Matsuura, K.; Nakamura, S. Purification and Characterization of Sarcosine oxidase of Bacillus Origin. Chem. Pharm. Bull. 1987, 35, 711–717. [Google Scholar] [CrossRef] [PubMed] [Green Version]
  43. Hroncekova, S.; Bertok, T.; Hires, M.; Jane, E.; Lorencova, L.; Vikartovska, A.; Tanvir, A.; Kasak, P.; Tkac, J. Ultrasensitive Ti3C2Tx MXene/chitosan nanocomposite-based amperometric biosensor for detection of potential prostate cancer marker in urine samples. Processes 2020, 8, 580. [Google Scholar] [CrossRef]
  44. Lad, U.; Kale, G.M.; Bryaskova, R. Sarcosine Oxidase Encapsulated Polyvinyl Alcohol-Silica-AuNP Hybrid Films for Sarcosine Sensing Electrochemical Bioelectrode. J. Electrochem. Soc. 2014, 161, B98–B101. [Google Scholar] [CrossRef]
  45. Rebelo, T.S.; Pereira, C.M.; Sales, M.G.; Norona, J.P.; Costa-Rodrigues, J.; Silva, F.; Fernandes, M.H. Sarcosine oxidase composite screen-printed electrode for sarcosine determination in biological samples. Anal. Chim. Acta 2014, 850, 26–32. [Google Scholar] [CrossRef] [Green Version]
  46. Narwal, V.; Kumar, P.; Joon, P.; Pundir, C.S. Fabrication of an amperometric sarcosine biosensor based on sarcosine oxidase/chitosan/CuNPs/c-MWCNT/Au electrode for detection of prostate cancer. Enzyme Microb. Technol. 2018, 113, 44–51. [Google Scholar] [CrossRef]
  47. Kumar, P.; Narwal, V.; Jaiwal, R.; Pundir, C.S. Construction and application of amperometric sarcosine biosensor based on SOxNPs/AuE for determination of prostate cancer. Biosens. Bioelectron. 2018, 122, 140–146. [Google Scholar] [CrossRef]
  48. Yang, H.; Wang, J.; Yang, C.; Zhao, X.; Xie, S.; Ge, Z. Nano Pt@ZIF8 Modified Electrode and Its Application to Detect Sarcosine. J. Electrochem. Soc. 2018, 165, H247–H250. [Google Scholar] [CrossRef]
  49. Wang, Q.; Zhao, Y.; Yang, Q.; Du, D.; Yang, H.; Lin, Y. Amperometric sarcosine biosensor with strong anti-interference capabilities based on mesoporous organic-inorganic hybrid materials. Biosens. Bioelectron. 2019, 141, 111431. [Google Scholar] [CrossRef]
  50. Li, J.; Ma, J.; Zhang, Y.; Zhang, Z.; He, G. An amperometric biosensor for the assay of sarcosine based on the cross coupled chemical and electrochemical reactions with practical applications. J. Electroanal. Chem. 2019, 833, 568–572. [Google Scholar] [CrossRef]
  51. Yang, Q.; Li, N.; Li, Q.; Chen, S.; Wang, H.; Yang, H. Amperometric sarcosine biosensor based on hollow magnetic Pt-Fe3O4@C nanospheres. Anal. Chim. Acta 2019, 1078, 161–167. [Google Scholar] [CrossRef] [PubMed]
  52. Tang, P.; Wang, Y.; He, F. Electrochemical sensor based on super-magnetic metal–organic framework@molecularly imprinted polymer for Sarcosine detection in urine. J. Saudi Chem. Soc. 2020, 24, 620–630. [Google Scholar] [CrossRef]
  53. Özkütük, E.B.; Diltemiz, S.E.; Avci, S.; Ugurag, D.; Aykanat, R.B.; Ersoz, A.; Say, R. Potentiometric sensor fabrication having 2D sarcosine memories and analytical features. Mater. Sci. Eng. C 2016, 69, 231–235. [Google Scholar] [CrossRef]
  54. Altunkök, N.; Biçen Ünlüer, Ö.; Birlik Özkütük, E.; Ersöz, A. Development of potentıometrıc bıosensor for dıagnosıs of prostate cancer. Mater. Sci. Eng. B 2021, 263, 114789. [Google Scholar] [CrossRef]
  55. Nguy, T.P.; Van Phi, T.; Tram, D.T.N.; Eersels, K.; Wagner, P.; Lien, T.T.N. Development of an impedimetric sensor for the label-free detection of the amino acid sarcosine with molecularly imprinted polymer receptors. Sens. Actuat. B Chem. 2017, 246, 461–470. [Google Scholar] [CrossRef]
  56. Lan, J.; Xu, W.; Wan, Q.; Zhang, X.; Lin, J.; Chen, J.; Chen, J. Colorimetric determination of sarcosine in urine samples of prostatic carcinoma by mimic enzyme palladium nanoparticles. Anal. Chim. Acta 2014, 825, 63–68. [Google Scholar] [CrossRef]
  57. Xue, Z.; Yin, B.; Wang, H.; Li, M.; Rao, H.; Liu, X.; Zhou, X.; Lu, X. An organic indicator functionalized graphene oxide nanocomposite-based colorimetric assay for the detection of sarcosine. Nanoscale 2016, 8, 5488–5496. [Google Scholar] [CrossRef]
  58. Heger, Z.; Cernei, N.; Krizkova, S.; Masarik, M.; Kopel, P.; Hodek, P.; Zitka, O.; Adam, V.; Kizek, R. Paramagnetic nanoparticles as a platform for FRET-based sarcosine picomolar detection. Sci. Rep. 2015, 5, 8868. [Google Scholar] [CrossRef] [PubMed] [Green Version]
  59. Luo, Y.; Wang, J.; Yang, L.; Gao, T.; Pei, R. In vitro selection of DNA aptamers for the development of fluorescent aptasensor for sarcosine detection. Sens. Actuat. B Chem. 2018, 276, 128–135. [Google Scholar] [CrossRef]
  60. Rakhi, R.B.; Nayak, P.; Xia, C.; Alshareef, H.N. Novel amperometric glucose biosensor based on MXene nanocomposite. Sci. Rep. 2016, 6, 36422. [Google Scholar] [CrossRef] [Green Version]
  61. Wang, F.; Yang, C.; Duan, M.; Tang, Y.; Zhu, J. TiO2 nanoparticle modified organ-like Ti3C2 MXene nanocomposite encapsulating hemoglobin for a mediator-free biosensor with excellent performances. Biosens. Bioelectron. 2015, 74, 1022–1028. [Google Scholar] [CrossRef]
  62. Wang, H.; Wu, Y.; Zhang, J.; Li, G.; Huang, H.; Zhang, X.; Jiang, Q. Enhancement of the electrical properties of MXene Ti3C2 nanosheets by post-treatments of alkalization and calcination. Mater. Lett. 2015, 160, 537–540. [Google Scholar] [CrossRef]
  63. Zheng, J.; Diao, J.; Jin, Y.; Ding, A.; Wang, B.; Wu, L.; Weng, B.; Chen, J. An Inkjet Printed Ti3C2-GO Electrode for the Electrochemical Sensing of Hydrogen Peroxide. J. Electrochem. Soc. 2018, 165, B227–B231. [Google Scholar] [CrossRef]
  64. Lorencova, L.; Bertok, T.; Filip, J.; Jerigova, M.; Velic, D.; Kasak, P.; Mahmoud, K.A.; Tkac, J. Highly stable Ti3C2Tx(MXene)/Pt nanoparticles-modified glassy carbon electrode for H2O2 and small molecules sensing applications. Sens. Actuat. B Chem. 2018, 263, 360–368. [Google Scholar] [CrossRef]
  65. Xu, B.; Zhu, M.; Zhang, W.; Zhen, X.; Pei, Z.; Xue, Q.; Zhi, C.; Shi, P. Ultrathin MXene-Micropattern-Based Field-Effect Transistor for Probing Neural Activity. Adv. Mater. 2016, 28, 3333–3339. [Google Scholar] [CrossRef]
  66. Fang, Y.; Yang, X.; Chen, T.; Xu, G.; Liu, M.; Liu, J.; Xu, Y. Two-dimensional titanium carbide (MXene)-based solid-state electrochemiluminescent sensor for label-free single-nucleotide mismatch discrimination in human urine. Sens. Actuat. B Chem. 2018, 263, 400–407. [Google Scholar] [CrossRef]
  67. Wu, L.; Lu, X.; Dhanjai; Wu, Z.S.; Dong, Y.; Wang, X.; Zheng, S.; Chen, J. 2D transition metal carbide MXene as a robust biosensing platform for enzyme immobilization and ultrasensitive detection of phenol. Biosens. Bioelectron. 2018, 107, 69–75. [Google Scholar] [CrossRef] [PubMed]
  68. Zhu, X.; Liu, B.; Hou, H.; Huang, Z.; Zeinu, K.M.; Huang, L.; Yuan, X.; Guo, D.; Hu, J.; Yang, J. Alkaline intercalation of Ti3C2 MXene for simultaneous electrochemical detection of Cd(II), Pb(II), Cu(II) and Hg(II). Electrochim. Acta 2017, 248, 46–57. [Google Scholar] [CrossRef]
  69. Rasheed, P.A.; Pandey, R.P.; Rasool, K.; Mahmoud, K.A. Ultra-sensitive electrocatalytic detection of bromate in drinking water based on Nafion/Ti3C2Tx (MXene) modified glassy carbon electrode. Sens. Actuat. B Chem. 2018, 265, 652–659. [Google Scholar] [CrossRef]
  70. Zhou, L.; Zhang, X.; Ma, L.; Gao, J.; Jiang, Y. Acetylcholinesterase/chitosan-transition metal carbides nanocomposites-based biosensor for the organophosphate pesticides detection. Biochem. Eng. J. 2017, 128, 243–249. [Google Scholar] [CrossRef]
  71. Sinha, A.K.; Dhanjai; Mugo, S.M.; Chen, J.; Lokesh, K.S. MXene-based sensors and biosensors: Next-generation detection platforms. In Handbook of Nanomaterials in Analytical Chemistry; Elsevier: Amsterdam, The Netherlands, 2020; pp. 361–372. [Google Scholar]
Figure 1. (a) Image of the SPCE electrode used to prepare the SOx/MXene–chitosan/SPCE biosensor. (b) Image of SOx/MXene–chitosan/SPCE electrode taken during CV analysis performed in 100 µL droplet in the potential window from +0.1 V to −1.3 V vs. silver RE at a scan rate of 0.1 V·s−1 using 10 (blank) or 3 (sarcosine) scans.
Jfb 14 00161 g001
Figure 2. CVs in the plain 0.1 M PB pH 7.4 in (a) cathodic and (b) anodic potential windows with a scan rate of 100 mV·s−1 recorded using SPCE, MXene/SPCE, and MXene–chitosan/SPCE; SOx/MXene–chitosan/SPCE.
Jfb 14 00161 g002
Figure 3. Nyquist plots of SPCE, MXene/SPCE, MXene–chitosan/SPCE, and SOx/MXene–chitosan/SPCE in 0.1 M PB containing 5 mM K3[Fe(CN)6] and K4[Fe(CN)6]·3H2O. Results are presented in the form of a Nyquist plot with equivalent circuit R[Q(RW)] applied for data fitting.
Jfb 14 00161 g003
Figure 4. Nyquist plots of (a,b) MXene/SPCE and (c,d) MXene–chitosan/SPCE in 0.1 M PB pH 7.4 containing 5 mM K3[Fe(CN)6] and K4[Fe(CN)6]·3H2O with measurements repeated 7 times. Results are presented in the form of a Nyquist plot, with an equivalent circuit R[Q(RW)] applied for data fitting. The duration of the 7 subsequent EIS analyses was approximately 22 min.
Jfb 14 00161 g004
Figure 5. Calibration curves of the SOx/MXene–chitosan/SPCE biosensor vs. sarcosine concentration. Inset: CVs of the prepared SOx/MXene–chitosan/SPCE biosensor in 0.1 M PB pH 7.4 containing 0, 2.5, 5, 10, 20, 30, 40, 50 μM sarcosine at a scan rate of 0.1 V·s−1 in a potential window from +0.1 V to −1.0/−1.3 V. Measurements were run in the electrochemical cell by dipping SPCEs into (a) the solution or in (b) 100 μL of an electrolyte. CVs are shown in the Supplemental Figures S1 and S2, respectively.
Jfb 14 00161 g005
Figure 6. Scanning electron microscopy images representing (left) pristine multilayered Ti3C2TX MXene structure, 40,000× and (right) Ti3C2TX MXene@chitosan composite, 20,000×.
Jfb 14 00161 g006
Figure 7. (a) CVs after the subtraction of the blank of the prepared SOx/MXene–chitosan/SPCE biosensor in 0.1 M PB pH 7.4 in a cell containing 30 μM sarcosine at a scan rate of 0.1 V·s−1 in a potential window from 0.1 to −1.0 V measured on days 0 (black) and 35 (red) after its preparation. (b) CVs after the subtraction of the blank of the SOx/MXene–chitosan/SPCE biosensor in 0.1 M PB pH 7.4 containing 30 μM sarcosine at a scan rate of 0.1 V s−1 in a potential window from 0.1 to −1.3 V measured on days 0 (black) and 35 (red) after preparation. During each measurement, 100 µL was applied to the surface of SPCE electrode.
Jfb 14 00161 g007
Table 1. Rct values for each electrode modification obtained by running EIS in 0.1 M PB containing 5 mM K3[Fe(CN)6] and K4[Fe(CN)6]·3H2O at 50 different frequencies in the range from 0.1 Hz to 100 kHz.
SPCE ModificationCharge Transfer Resistance (Rct) Values (Ω)
SPCE233 ± 4
MXene/SPCE447 ± 10
MXene–chitosan/SPCE52 ± 8
SOx/MXene–chitosan/SPCE66 ± 1
Table 2. Basic operational parameters of various (bio)sensors for the detection of sarcosine.
DetectionSurface ModificationLOD (nM)Linear Range (µM)RT (s)StabilityApplicationRef.
AmperometricPVA–Ag/AuNPs–pphTEOS–SOx/GCE5000.5–7.517NRAqueous media[44]
AmperometricSOx/EDC/NHS/Au/ZnONPs/SPEs160.01–0.1NR60 daysSynthetic urine[45]
AmperometricSOx/CHIT/CuNPs/cMWCNT/AuE0.00010.1–1002180 daysHuman serum[46]
AmperometricSOxNPs/AuE100.1–1002180Urine[47]
AmperometricSOx/Pt@ZIF8/GCE10605–30NR3Urine[48]
AmperometricNafion–SOx/Pt/AAO500.05–100NRNRAqueous media[20]
AmperometricSOx/Pt/OIHMMP/GCE1301–70NRNRHuman serum[49]
AmperometricSOx/PAA/GCE0.40.001–0.05NR15 daysUrine[50]
AmperometricSOx/Pt–Fe3O4@C/GCE4300.5–60NRNRHuman serum[51]
AmperometricFe3O4@ZIF–8@MIP/AuE0.00040.000001–0.0001NRNRUrine[52]
AmperometricSOx/chitosan/Ti3C2TX/GCE180.036–7.82NRSynthetic urine[43]
AmperometricSOx/chitosan/Ti3C2TX/SPE70.1–1.0NRNRSynthetic urinethis work
PotentiometricMIP-based sensor0.140.001–10<120>5 monthsAqueous media[53]
PotentiometricAntisarcosine–Ab–GFOX@graphite–powder@dibutyl phthalate-electrode0.0030.01–100603–4 monthsAqueous media[54]
PotentiometricAntisarcosine–Ab@graphite–powder@dibutyl phthalate–electrode0.0050.001–10603–4 monthsAqueous media[54]
ImpedimetricMIP/AuNPs/SPCE8.50.011–17.9NR~7 daysAqueous media[55]
ColorimetricPdNP-based sensing platform5.00.01–50NRNRUrine[56]
ColorimetricNQS/GO/GCE7306.2–26.3NRNRAqueous media[57]
FluorimetricNanomaghemite/AuNPs/QD/peptide0.050.005–0.05NRNRUrine
Cell lines
[58]
FluorimetricssDNA aptamer-based sensor550.1–2NRNRUrine[59]
Abbreviations: LOD—limit of detection, RT—response time, PVA—polyvinyl alcohol, pph-TEOS—partially prehydrolysed tetraethyl orthosilicate, CHIT—chitosan, cMWCNT—carboxylated multi-walled carbon nanotubes, Pt@ZIF8—nanoplatinum-loaded porous zeolitic imidazolate framework-8, AAO—anodised aluminium oxide, Pt/OIHMMP—platinum-supported mesoporous organic-inorganic hybrid molybdenum phosphonate, MIP—molecularly imprinted polymer, GO—graphene oxide, GO-based nanocomposite: Ab-GO@graphite-powder@dibutyl phthalate-electrode; NQS—1,2-naphthoquinone-4-sulphonic acid sodium salt, NR—not reported.
Table 3. Operational performance of electrochemical MXene-based (bio)sensors.
AnalyteDetectionLODLinear rangeReference
GlucoseAmperometry5.9 µM0.1–18 mM[60]
H2O2Amperometry0.02 µM0.1–260 µM[61]
NO2-Amperometry0.12 µM0.5 µM–11.8 mM[35]
H2O2Amperometry14.0 nM0.1–380 µM[62]
H2O2Voltammetry (DPV)1.95 µM2 µM–1 mM[63]
H2O2Amperometry448 nM490 µM–53.6 mM[64]
AA,Voltammetry (DPV)0.25 µM,Up to 750 µM[64]
DA,0.26 µM,
UA,0.12 µM,
APAP0.13 µM
H2O2Chronoamperometry0.7 nMNR[36]
DAFET100 × 10−9 M100 × 10−9–50 × 10−6 M[65]
P53 geneECL5 nM10 nM–1 mM[66]
PhenolAmperometry12 nM0.05–15.5 µM[67]
Cd2+,Voltammetry (SWASV)98 nM,0.1–1.5 µM[68]
Pb2+,41 nM,
Cu2+,32 nM,
Hg2+130 nM
BrO3Voltammetry41 nM50 nM–5 µM[69]
MalathionVoltammetry (DPV)0.3 × 10⁻¹⁴ M1 × 10−14–1 × 10⁻⁸ M[70]
SarcosineChronoamperometry18 nM36 nM–7.8 µM[43]
SarcosineCyclic voltammetry (CV)7 nM0.1–1.0 µMThis work
Abbreviations: AA—ascorbic acid, APAP—acetaminophen, DA—dopamine, DPV—differential pulse voltammetry, ECL—electrochemiluminescence, FET—field effect transistor, SWASV—square-wave stripping voltammetry, UA—uric acid [71].
Disclaimer/Publisher’s Note: The statements, opinions and data contained in all publications are solely those of the individual author(s) and contributor(s) and not of MDPI and/or the editor(s). MDPI and/or the editor(s) disclaim responsibility for any injury to people or property resulting from any ideas, methods, instructions or products referred to in the content.

