
Innovative Out-of-Stock Prediction System Based on Data History Knowledge Deep Learning Processing
Astrea Consulting srl—R&D Department, Via F. Bruno, Petralia Soprana, 90026 Palermo, Italy
*
Author to whom correspondence should be addressed.
Computation 2023, 11(3), 62; https://doi.org/10.3390/computation11030062
Submission received: 7 February 2023
/
Revised: 11 March 2023
/
Accepted: 13 March 2023
/
Published: 20 March 2023
Abstract
:Research and development efforts in the field of commercial applications have invested strategic interest in the design of intelligent systems that correctly handle out-of-stock events. An out-of-stock event refers to a scenario in which such customers do not have the availability of the products they want to buy. This scenario generates important economic damage to the producer and to the commercial store. Addressing the out-of-stock problem is currently of great interest in the commercial field as it would allow limiting the economic damages deriving from these events. Furthermore, in the era of online commerce (e-commerce), it would significantly limit out-of-stock events which show a considerable economic impact in the field. For these reasons, the authors proposed a solution based on deep learning for predicting the residual stock amount of a commercial product based on the intelligent analysis of specific visual–commercial data as well as seasonality. By means of a combined deep pipeline embedding convolutional architecture boosted with a self-attention mechanism and a downstream temporal convolutional network, the authors will be able to predict the remaining stock of a particular commodity. By integrating and interpreting climate/seasonal information, customers’ behavior data, and full history data on the dynamics of commercial sales, it will be possible to estimate the residual stock of a certain product and, therefore, define purchase orders efficiently. An accurate prediction of remaining stocks allows an efficient trade order policy which results in a significant reduction in out-of-stock events. The experimental results confirmed the effectiveness of the proposed approach with an accuracy (in the prediction of the remaining stock of such products) greater than 90%.
1. Introduction
Modern technology developments are enabling new challenges and opportunities in the field of the commercial market [1,2]. Specifically, recent predictive technologies based on deep learning are making it possible to deal more effectively with the out-of-stock (OOS) problem of commercial products, i.e., their unavailability upon customer request [3,4]. Practically, an efficient prediction system will be able to correlate product availability in terms of out-of-stock (OOS) events. Formally, the OOS event occurs when the product requested by customers is not available on the market store shelves and it is addressed when the related product(s) are received in the storage at the market store. In this time window, the OOS events certainly generate economic damage as a function of the intensity of product’s demand [5].
Despite major commercial companies’ efforts to reduce the impact of OOS events, the wide impact on the retail industry is still significant. In [6], it was estimated that 4% of total worldwide annual revenue in the commercial market is lost due to OOS events (it is close to more than USD 900 billion in losses). The authors of the work reported in [5] discovered that OOS events distort the true commercial demand and impact brand loyalty and commercial market dynamics. For these reasons, the scientific community investigated deeply new information technology solutions for addressing the issue of OOS.
In more detail, both statistical-based approaches as well as deep learning and bioinspired solutions have been widely investigated to cover the OOS issue. As mentioned, the significant economic impact of OOS events in commercial stores make the modeling of this phenomenon extremely important for large companies. Therefore, in this work, the authors, in addition to proposing a valid solution for a reduction in OOS events, will also try to frame the complexity of the problem and the related solutions proposed to address it. Specifically, the effectiveness of deep learning in predicting and detecting the OOS events related to multiple products will be analyzed.
Some of the proposed solutions try to solve the OOS issue from a manufacturer’s perspective, using point-of-sale data enhanced by other discriminative features retrieved using statistical analysis or machine learning approaches [6,7,8,9,10,11]. Furthermore, the approaches featured in scientific literature use statistical models and deep-learning-based approaches (mostly supervised) to determine both the risk of an OOS event and the corrective factors to be applied (to the product’s inventory) to minimize OOS events [5,6,7,8,9,10,11,12]. However, these scientific approaches degrade in performance due to implicitly unpredictable dynamics that significantly impact OOS events [10,11,12] and that can hardly be modeled from previous data. This assumption is supported by the fact that, sometimes, the underlying OOS event’s dynamic is sometimes new and historical data of the market store have never been exploited [12,13]. Moreover, the predictive models of OOS events may not take into account all the stochastic variables that influence this phenomenon [12,13].
The algorithm proposed herein goes beyond the mentioned limits as although it is based on historical data of the commercial point of sale, it integrates real-time context information which comes from distinct knowledge bases (climate impact and customer sentiment) and, therefore, enriches the features of historical data used to model and predict OOS events. Unlike the methods proposed in the scientific literature, the designed pipeline contains a temporal processing downstream system based on the hypothesis that the OOS events embed a temporal autocorrelation dynamic. As confirmed by the results reported in the specific “experimental results” section, this enhancement significantly improves the performance of the proposed system in comparison with the other methods outlined in the literature. This aspect allows us to consider the proposed approach very promising.
Specifically, the authors of this work propose a combined system which integrates deep learning and advanced statistical analysis for addressing OOS events in a commercial store. The work described herein is organized as follows: Section 2 reports a summary of the most interesting solutions proposed in the literature for addressing the OOS issue. In Section 3, the proposed pipeline are introduced and described in detail. In Section 4, the collected experimental results retrieved through extensive testing and validation of the proposed pipeline are reported. Finally, in Section 5, related conclusions and future works about the proposed system are discussed.
Notations Table
In this work, the authors make use of several notations and acronyms. For this reason, it was considered useful to summarize these notations and acronyms in the following table.
OOS: out-of-stock;
SKU: stock-keeping unit;
RFID: radio frequency identification;
HMM: hidden Markov model;
CNN: convolutional neural network;
RNN: recurrent neural network;
GNN: graph neural networks;
TCNN: temporal convolutional neural network;
CAT-CNN: crowd attention convolutional neural network;
CCP: criss-cross processing;
CCL: criss-cross layer;
CU: convolutional unit;
3D-DCNN: 3D densely connected convolutional neural network;
NLB: nonlocal block;
GDPR: general data protection regulation;
CAT-CNN-CCnet: crowd attention convolutional neural network with criss-cross layer;
SGD: stochastic gradient descent.
2. Related Works
A simple approach for detecting and predicting OOS events is monitoring anomalies in the transactional data provided by retailers. In that topic, data monitoring can be efficiently empowered by using deep learning or soft computing-based algorithms [7,8,9]. In [9], an intelligent classification method for reducing OOS events, based on inventory control models boosted by ad hoc statistical classification methods, is proposed. The approach analyzed in [9] is in line with the classical methods proposed in the literature for the management of OOS events.
Another approach is described in [7] and embeds an ensemble learning approach. With a performance of about 90.2% (area under the curve), the method described in [7] confirmed the promising results of machine learning in OOS event management.
A similar OOS predictor was described in [10,11]. Other approaches, including image-processing methods [12], an autonomous robotic system for the monitoring a store’s shelves [13], depth cameras and neural networks for monitoring market store shelves [14], deep learning [15], and both supervised [16] and semisupervised learning [17,18,19,20] have been investigated in the scientific literature. All these proposed approaches are based on the use of internal historical data of the store and, therefore, are affected by the limit of modeling dynamics already present in historical data, showing reduced performance due to OOS trends not included in the historical series.
In order to provide a robust approach for addressing OOS events, several studies analyzed the so-called “drivers” of the OOS events as well as the consequence of these events and, finally, the mathematical predictor of the OOS events [19,20,21]. These approaches will be described in the next paragraphs.
As introduced, the reasons for which many researchers are investigating OOS event management in the commercial field range from negative consumer reactions to store switching, product switching, or purchase postponement [21,22,23,24,25,26].
Fitzsimons et al., in [20], presented a systematic review about the drivers of retail on-shelf availability and OOS-correlated events. The OOS drivers can be grouped into two sectors: retail store practices and upstream problems in the retail supply chain. In the first group, we can include the inventory inaccuracy, shrinkage, and so on. The second group includes product transportation issues as well as forecast model inaccuracy [4,5,27,28]. In this context, Kang et al. in [29] analyzed the problems generated by wrong inventory systems. This work confirmed that inventory inaccuracy generates OOS events [29,30]. Specifically, Kang et al. discovered that the performance of the OOS event prediction approach is highly sensitive to the inventory inaccuracy. For this reason, Reiner et al. tried to address the inventory inaccuracy issue through the optimal reallocation of the shopper shelf space [31]. The results seem interesting as the OOS event rate can be reduced (about 30%) with this optimal reallocation.
Another interesting research field related to OOS event reduction is the so-called RFID [32] used for monitoring both shelf arrangement as well as product delivery policy.
In [33], the combined correlation between demand and supply side issues on repeated OOS events was analyzed. Another promising investigation relied on studying the relationship between the SKU and stockout performance. This relation seems robust: the OOS event begins when the final saleable unit of an SKU is removed from the shelf, and it ends when the presence of a saleable unit on the shelf is replenished [33]. This correlation confirms that focusing on a relatively small number of SKUs can be an effective strategy to lower OOS sales losses [33].
In [34], it was confirmed that stockout performance was negatively affected by the presence of fast-selling dynamics, while the automation of the ordering process can affect OOS events positively. Product availability is also related to the performance of the developed forecasting algorithms [35]. In [36], the authors proposed an approach that leverages a hybrid artificial neural network to develop a sales forecasting model. The model’s predictions allow the identification of whether there are either insufficient or too many products in store. By using data from a consumable product category, the approach reported in [36] was shown to outperform approaches based singularly on order or POS data, by up to 25%.
In [37], Chen et al. discovered that larger case packs decrease the number of store replenishments, i.e., the store’s chance of stockouts decreases. In [38,39], highly interesting methods based on the analysis of employees’ walking dynamics were presented. The results seem very promising as the proposed algorithms analyzed employees’ motion dynamics, trying to correlate these data with the OOS event. Despite the promising results (an accuracy/sensitivity >80%), the method showed financial limitations partially correlated to the unavailability of staff to conduct physical audits.
An interesting study was described in [40]. In this paper, a key project based on the usage of RFID infrastructure for OOS tracking was highlighted. This work reported interesting performance even though such authors raised such limitations on the usage of RFID technology confirmed by the poor specificity of the related application [40]. In fact, the authors of [40,41] addressed the physical limits of RFID, improving the sensitivity and specificity of the proposed approach. Anyway, RFID is still more expensive than conventional recognition technology, and its applications often require higher costs [42,43,44].
In [45,46], probabilistic-based methods were investigated in order to detect OOS events. Specifically, in [46], the use of Bayesian probability to correct “phantom stockout” using historical data integrated with inventory inspection policies was presented. The authors of [46] leveraged the so-called “Bernoulli shrinkage process” for OOS event management. The authors investigated the correlation between sales transactions, shopping store on-shelf availability, consecutive zero-sales events, and similar data [10,11,46,47,48,49]. Through the application of the HMM (in which the OOS condition was represented by the hidden state), the authors of scientific papers reported in [48,49] achieved promising results in terms of the accuracy predicting OOS events.
However, leveraging the promising results in data prediction collected with modern techniques based on deep learning, the authors investigated the usage of deep architecture trained on both a supervised and unsupervised basis for predicting OOS events. Due to the interesting capability of feature interaction, deep neural networks were investigated to extract nonlinear predictive patterns in input time series. Specifically, the deep solutions known as DeepAR [50] and LogTrans [51] were proposed for univariate time series prediction. Moreover, emerging transformer-based architectures or enhanced convolutional neural networks (CNNs)/recurrent neural networks (RNNs) were analyzed for time series forecasting based on the inference processing of long-range dependencies embedded in the input time series [52]. The results in multivariate/multihorizon time series forecasting were very promising [50,51,52].
In more detail, in [53], a complete survey containing an interesting examination of the methods based on artificial intelligence for the management of the inventory of shopping centers (and, therefore, for the management of OOS events) was described. This study focused its analysis on research articles embedded in two scientific databases published between 2012 and 2022 for a detailed study. Similar other works confirmed that deep learning can be used efficiently to improve the management of commercial inventory and then to reduce OOS events [54,55,56].
Another set of research works in the field of time series forecasting were based on the usage of GNNs as well as spatial–temporal GNNs, which usually embed a graph convolution capturing the spatial structure and a deep architecture dealing with time series on nodes through CNNs. These approaches showed remarkable performance in the time series forecasting of multivariate uncorrelated input time series; even the designed deep backbones were very complex and computationally expensive [57,58,59,60,61,62].
In this scientific context, the authors of this manuscript proposed a solution based on a framework which combines different deep networks and multivariate data for retrieving the remaining stock amount of the analyzed product and then the corresponding OOS event risk.
3. Materials and Methods
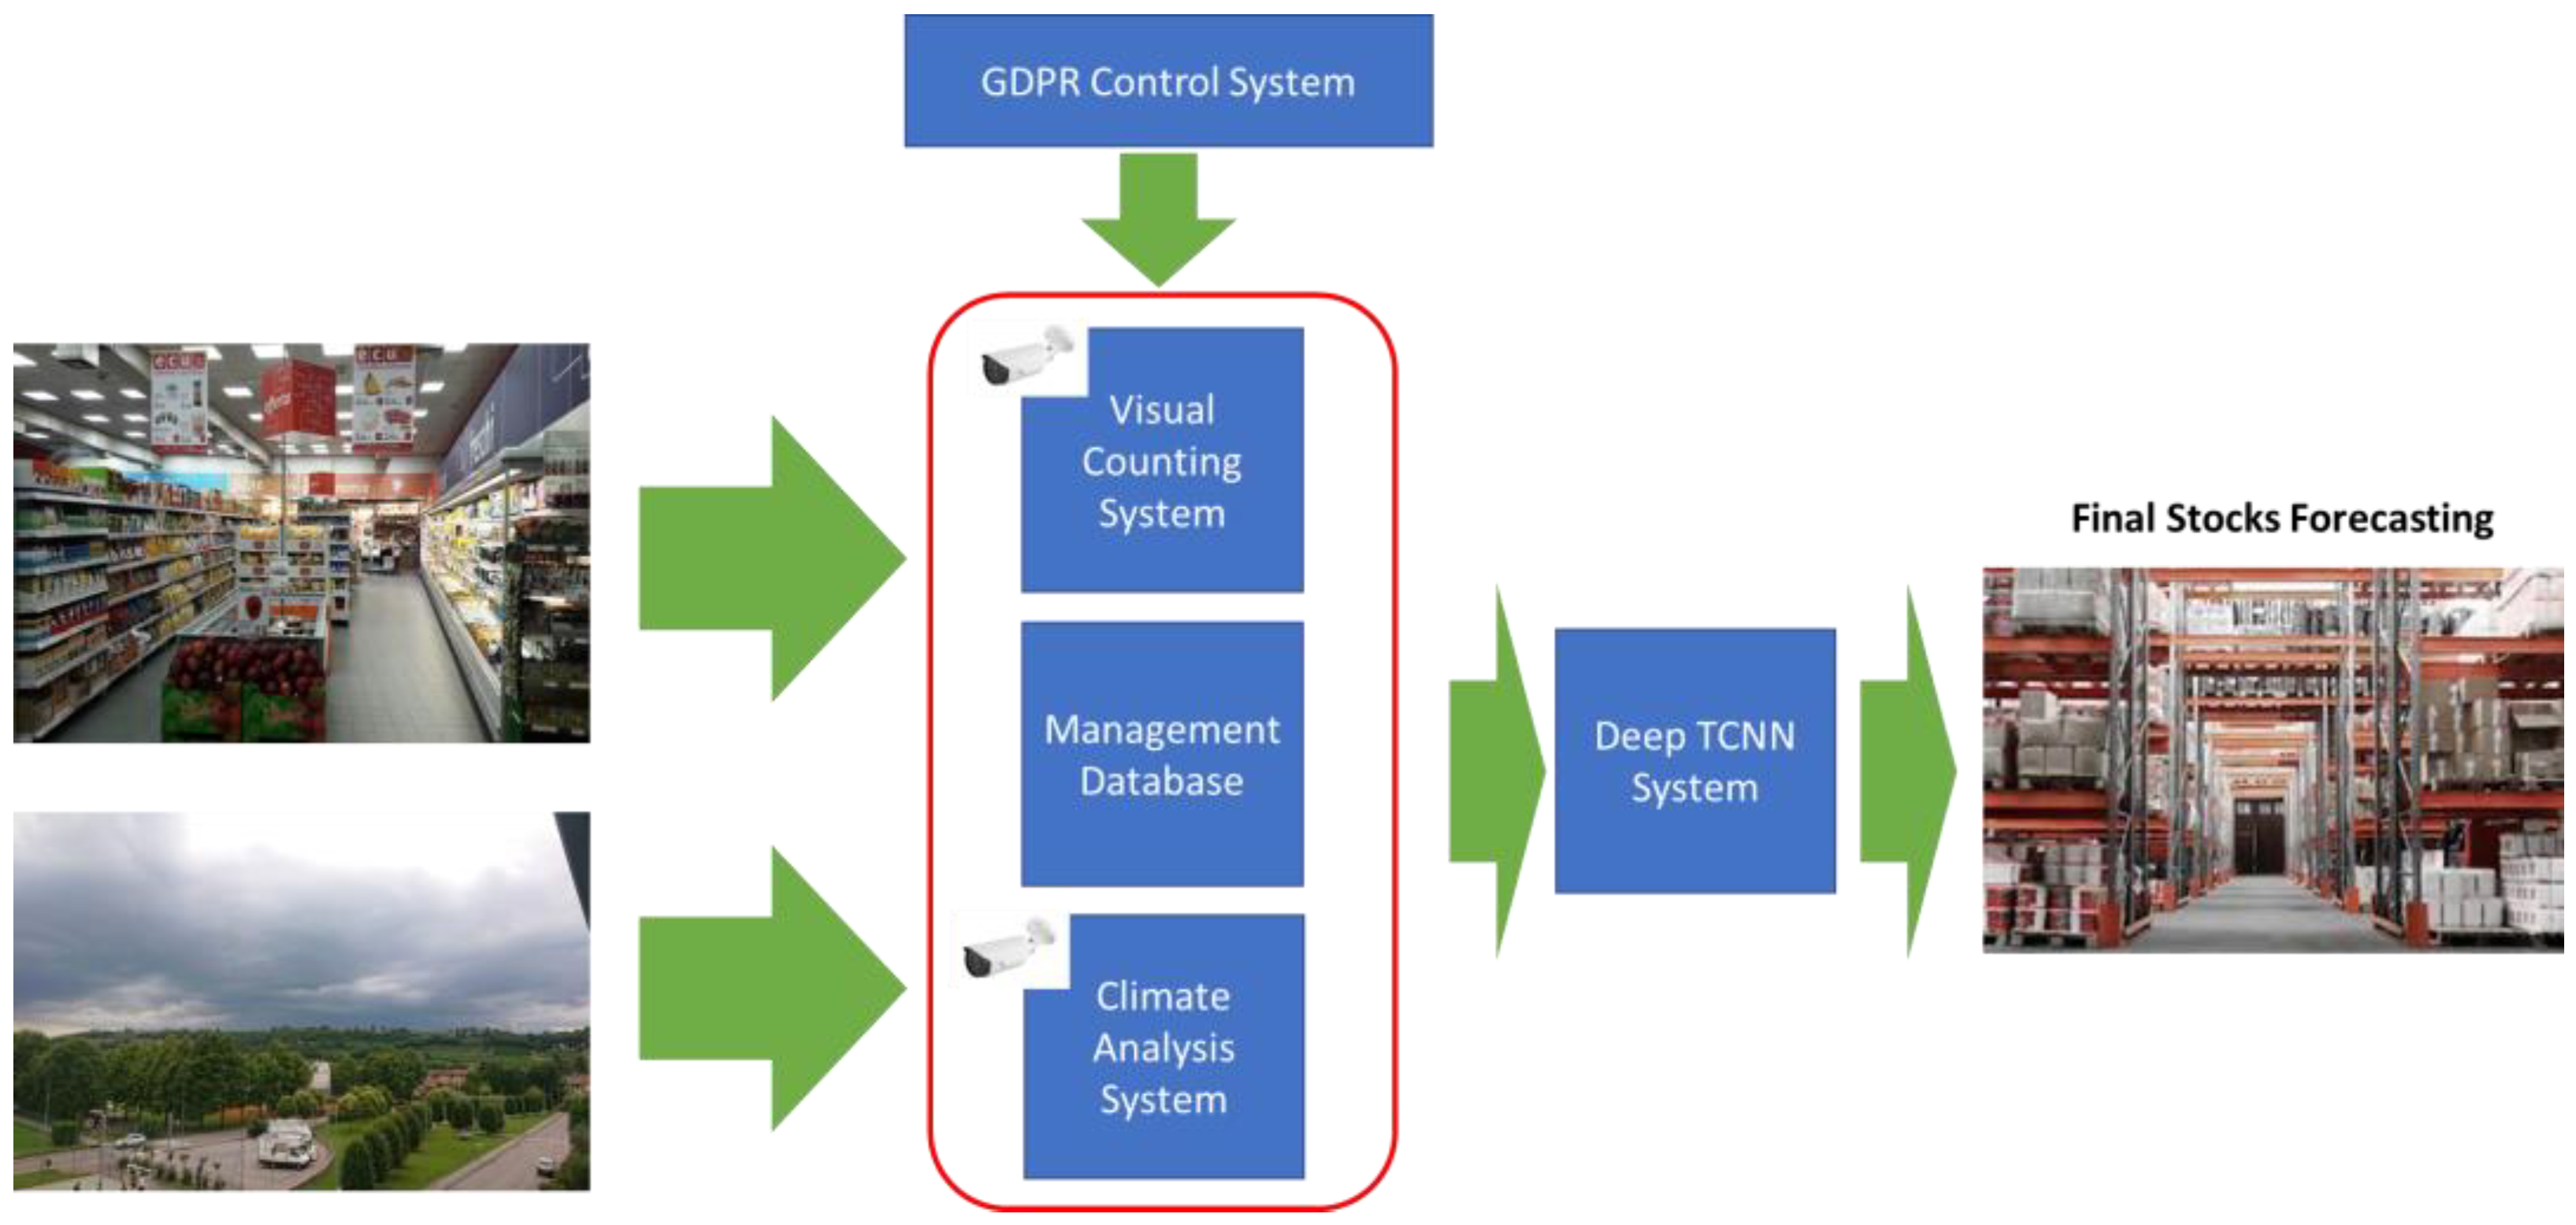
In this section, the proposed pipeline will be described. In Figure 1, the designed system is reported.
As described in Figure 1, the proposed system is composed of different subsystems which provide input data to the downstream “Deep TCNN System” (which embeds a TCNN) suitable to provide the prediction of the final stock amount of the analyzed commodity. The designed subsystems are: “The Visual Counting System” which will make a daily count of the customers present in the market store (using a computer vision approach) and, therefore, reconstruct an average of the customers who have frequented the store in a specific period. After that, there is the “Management Database” which has the target of providing historical information relating to the purchase, sale, and orders of the product whose future final stock is to be predicted. Finally, there is the “Climate Analysis System”, which provides information on the climate in the last period and in the context of the store. This multimodal information will then be fed as an input to the deep TCNN system which has the task of correlating these data with the final stock of the product after a certain number of days. This TCNN system is based on a temporal causal–convolutional backbone with self-attention layers, as better described in the following subsections. Each of the described blocks will be detailed in the following paragraphs.
Finally, on top of these subsystems, a module named “GDPR Control System” will be embedded in the proposed pipeline with the aim of providing privacy control check activities in the collected data of the market store.
3.1. The Visual Counting System
The target of this block is to provide a robust approach to retrieve customer counting in the market store using computer vision techniques. Through this technique, the proposed system will be able to count the average number of customers who visit the shopping store and, therefore, to reconstruct the average number of customers who visit the store in a given period. Several approaches have been proposed in the literature for performing crowd counting by means of computer vision and deep learning methods. The authors proposed a modified version of the deep pipeline reported in [63]. The authors of [63] proposed an interesting end-to-end architecture, i.e., CAT-CNN, which can adaptively track human heads through an innovative encoding approach.
By using the concept of an “estimated density map”, the designed solution performs crowd counting by integrating the final density map through the ad hoc encoding of this map. More details are presented in [63]. Anyway, in order to improve the performance and robustness of the proposed approach, we modified the backbone developed by the authors of [63] by adding a further self-attention enhancement based on the usage of criss-cross processing [64]. Through the criss-cross block, we were able to make the network’s hidden features more discriminating as the self-attention mechanism will select the components of the features related to the input data that contribute most to the overall pipeline performance. This self-attention mechanism is characterized by an adaptive weighting of the pixels of the features along a well-defined spatial path, precisely called criss-cross. The criss-cross processing (CCP) was first described in detail in [64] as a self-attention mechanism to improve the discrimination capability of the hidden features.
Basically, averaging pixel-based processing along the criss-cross path of the hidden feature can improve the performance of the overall deep backbone as the parts of the features that weigh the most in solving the problem will be more represented in the inference phase. More details are presented in [64].
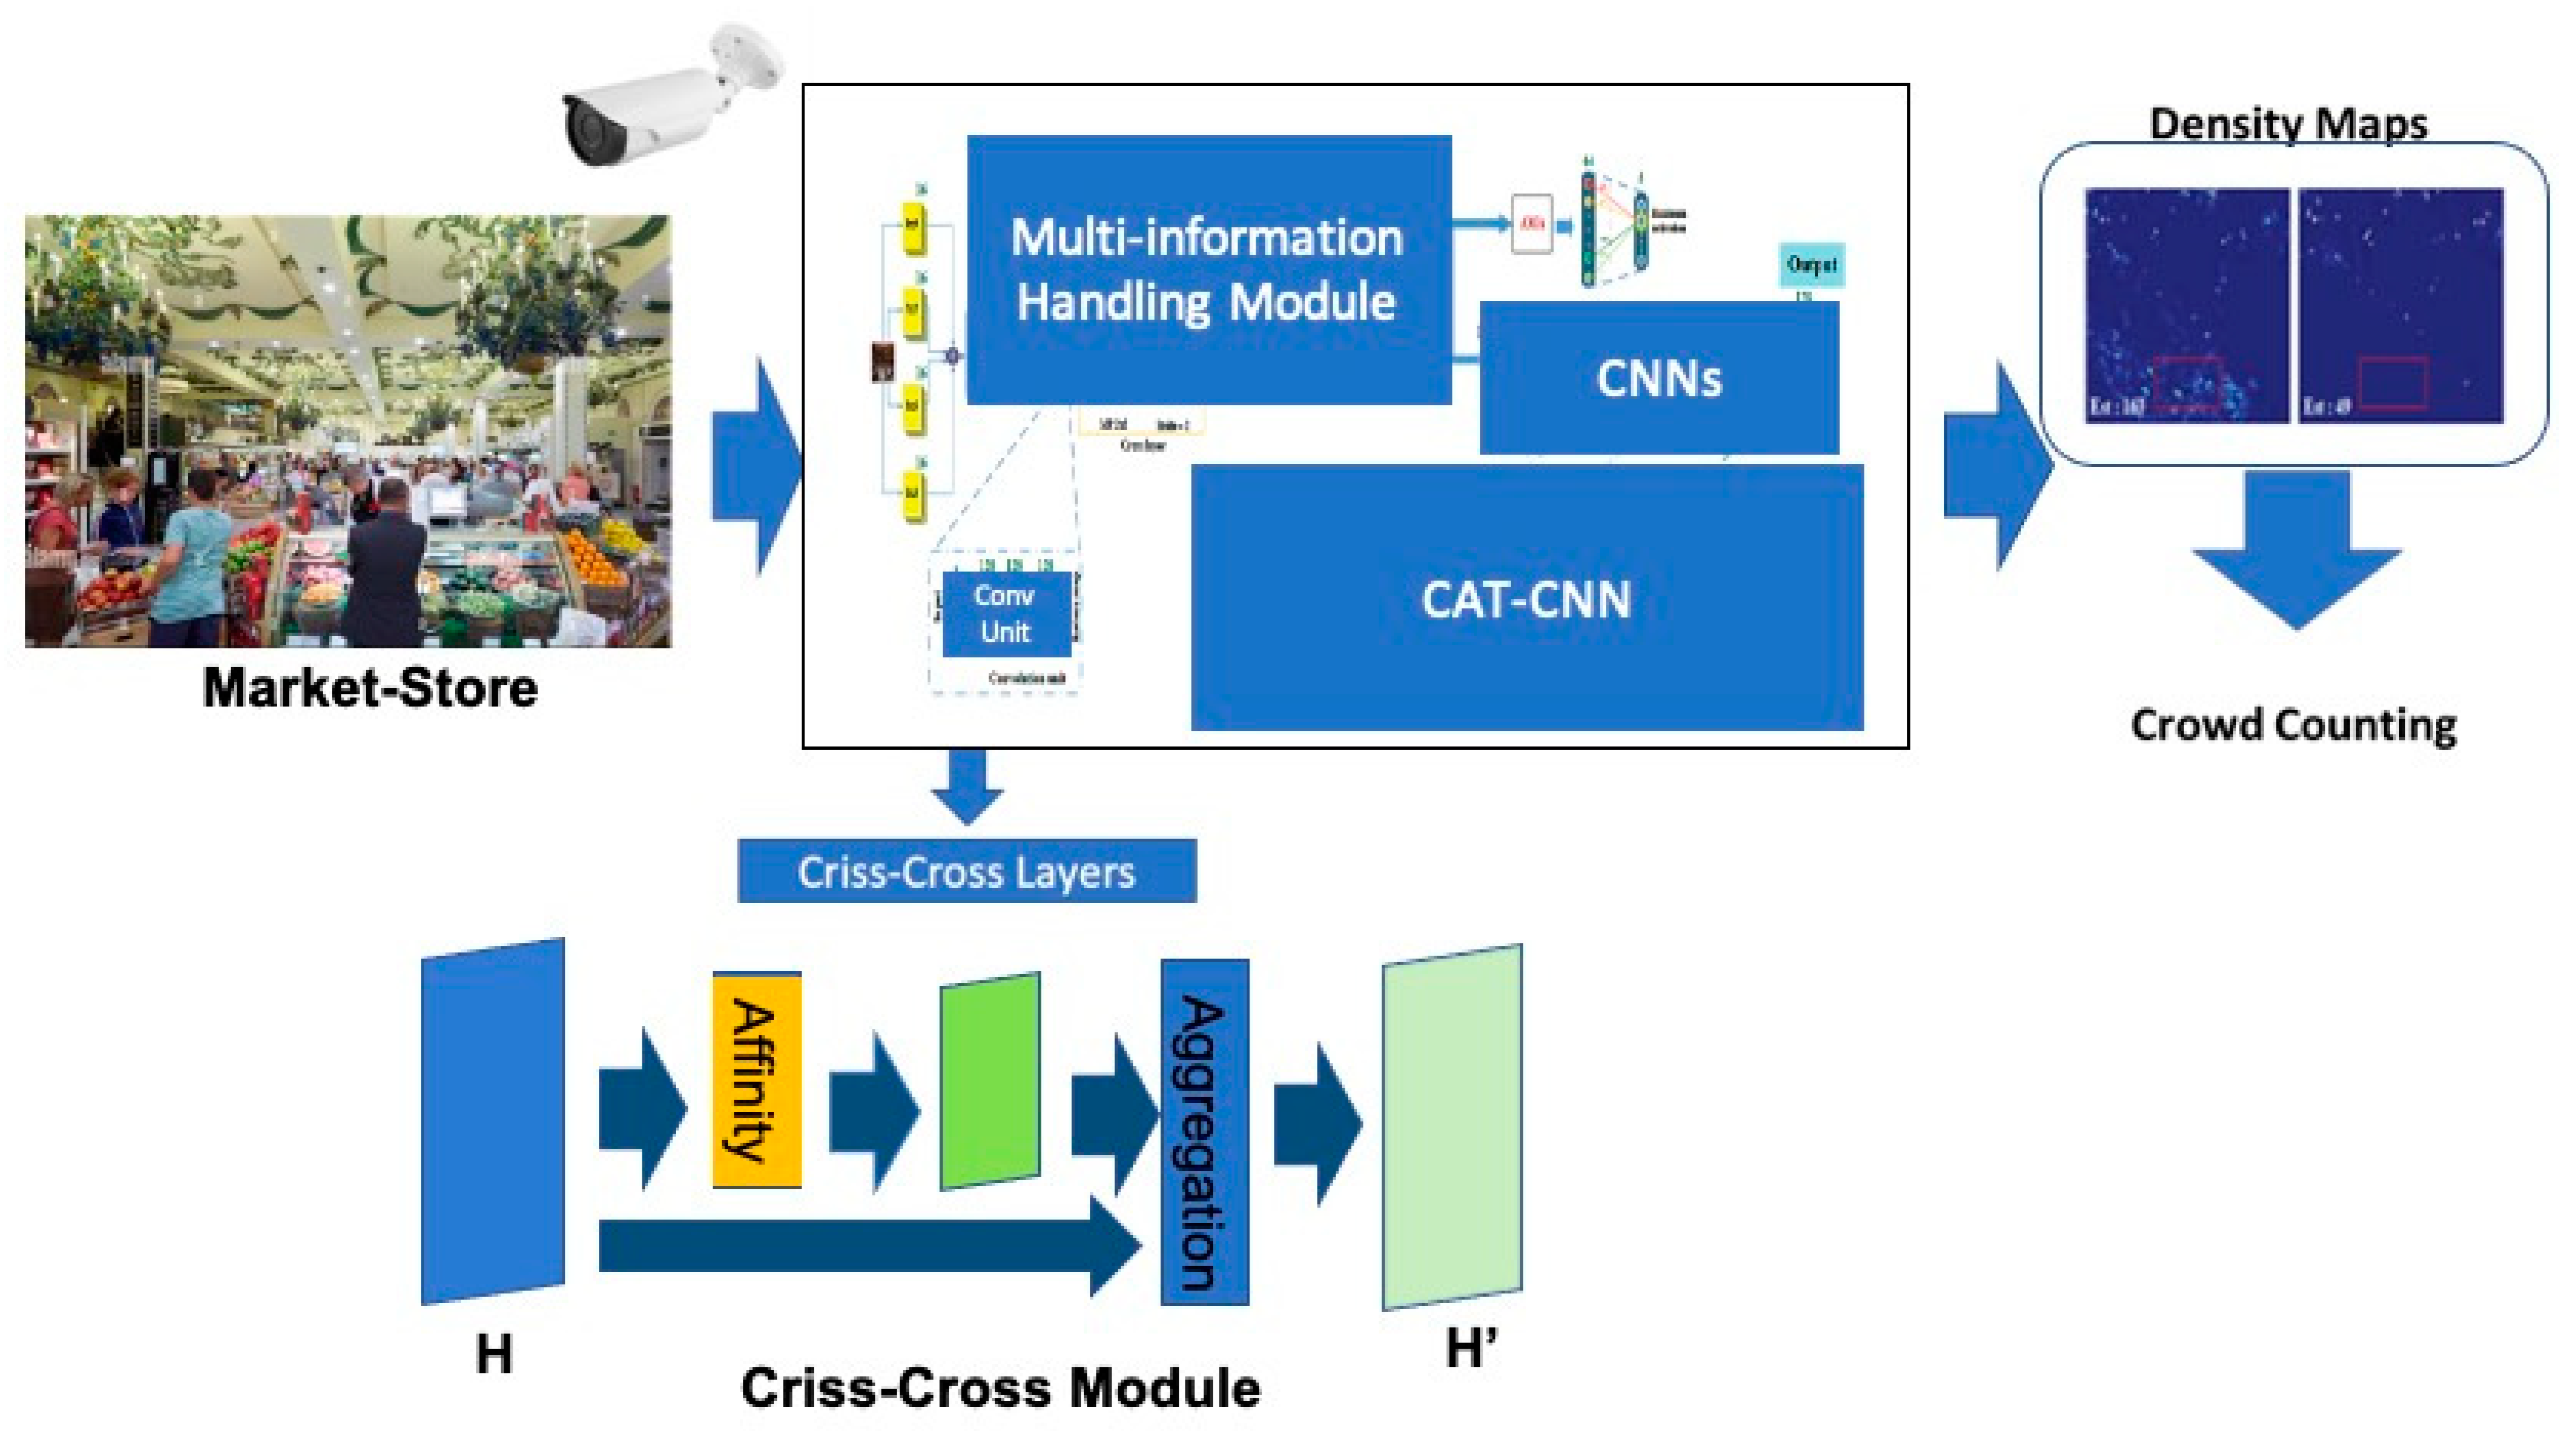
The following Figure 2 shows the modified version of the CAT-CNN embedding the CCP block.
As reported in Figure 2, the designed model embeds a classical pipeline for visual feature extraction for computing density maps from which it retrieves a crowd count. Moreover, a self-attention mechanism based on criss-cross processing was added in order to improve the overall performance of the implemented pipeline. To capture the video frames of the market store, the authors propose using the surveillance cameras normally installed in shopping stores. The frames thus obtained have to be corrected in projection to optimize the performance of the designed method.
Let f(x,y,t) the spatiotemporal frames captured by the shopping store’s camera for a specific commercial area; the calibrated frame should be computed as follows:
where represents the calibration function, while pi represents the calibration parameters defined to apply the spatial transformation of the input frame. The authors, after several tests, propose the following projection–calibration function:
where Mp represents the rotation tensor, while T represents the translation component. Basically, the projection correction is performed by means of a rototranslation of the input frame through the coefficients of the matrixes Mp and T.
The Mp and T coefficients will be determined by optimizing the overall performance of the proposed system and, therefore, will be subject to an initial calibration phase of the whole architecture in which the optimal perspective transformation will be reconstructed with unsupervised “trial and error” techniques; therefore, formally:
In Equation (3), we define the heuristic approach used for retrieving the optimal coefficients of Mp and T matrixes in order to minimize the error in the prediction of the real remaining stock (Sf) with respect to the predicted (Sp). The policy adopted to change the coefficients of Mp and T is random and driven by Equation (3).
The adopted calibrated frame is used as the input of the modified CAT-CNN in which we embedded the criss-cross block as the self-attention mechanism to improve the discrimination capability of the hidden deep features. Clearly, we are interested in having the average count of the customers who visit the market store and each of the store departments in a fixed time window. If we set the calibrated frames for the store department “d” as Id(x,y,t) and the total number of customers who visit the market store as cd, the total number of customers who visit the store per day (D1) can be defined as follows:
where Nc represents the total number of discount departments. The average number of customers who visit the commercial store can be computed as follows:
where td represents the time range (composed of Dn days) in which the proposed system retrieves the average number of customers who visit the commercial store. In order to improve the efficient pipeline proposed in [63], the authors embedded the criss-cross block in the CAT-CNN designed by the authors of [63]. More specifically, in the multi-information handling module embedded in the CAT-CNN, a convolutional neural network (CNN) was used for generating deep features to be used by the downstream fusion blocks to retrieve a density map and then a crowd-counting estimation [64]. We embedded the criss-cross layer in the original multi-information handling module in the part named the CU, i.e., the convolutional unit [64]. In this way, the CU block is the same as that proposed in [63] but with a criss-cross block interpolated after the latest 3 × 3 convolutional layer and before the output layer from which the feature map was extracted.
Let us define as “H” the feature map of the convolutional layers (with “C” number of channels and the dimensions W × H) before the CCL, the latter providing the following feature processing (for each pixel i-th):
In which is an attention map generated by the “Affinity” operator [64], is the corresponding vectors across the criss-cross path of the pixel i-th, while wi and wH are the weights determined during the training of the deep network. The operation reported in Equation (6) is defined as “Aggregation”. More details are presented in [64].
The visual features so enhanced will be used by the CAT-CNN to build the related density map from which the crowd counting can be performed [63,64]. The remaining blocks of the system described in Figure 2 are the same as reported in [63]. All the estimated visual counts will be stored for the defined time period and then the average number of customers will be computed as per Equations (4) and (5). This value as the final output of the visual counting subsystem will be used in the downstream deep transformer together with the other information coming from the other subsystems described in the next sections.
3.2. The Management Database System
The target of this subsystem is the extraction of the store management data from the internal managerial software framework. All commercial stores are equipped with management software that allows managing the data storage of goods, sales, orders, commercial invoices, etc. By using this commercial software, the authors for the system proposed herein need to retrieve the following information (for each product, px, for which it is intended to predict the future average stock):
- Ipx: the inventory quantity of the product, px;
- Qi(px): the quantity of the product, px, ordered up to the moment of prediction;
- Qs(px): the quantity of the product, px, sold up to the moment of the prediction;
- Qip(px): the quantity of the product, px, sold up to the moment of the prediction, promoted as a flyer;
- [Ds, Ss]: the date and season related to the prediction;
- Id: the product identification code and the macroarea to which it belongs;
- Lp: local or commercial flyer promotion.
These fields will be retrieved to the time instant of the prediction and automatically extracted from the store management database. They will be arranged in a vector Tx containing this information for the product px.
3.3. The Climate Analysis System
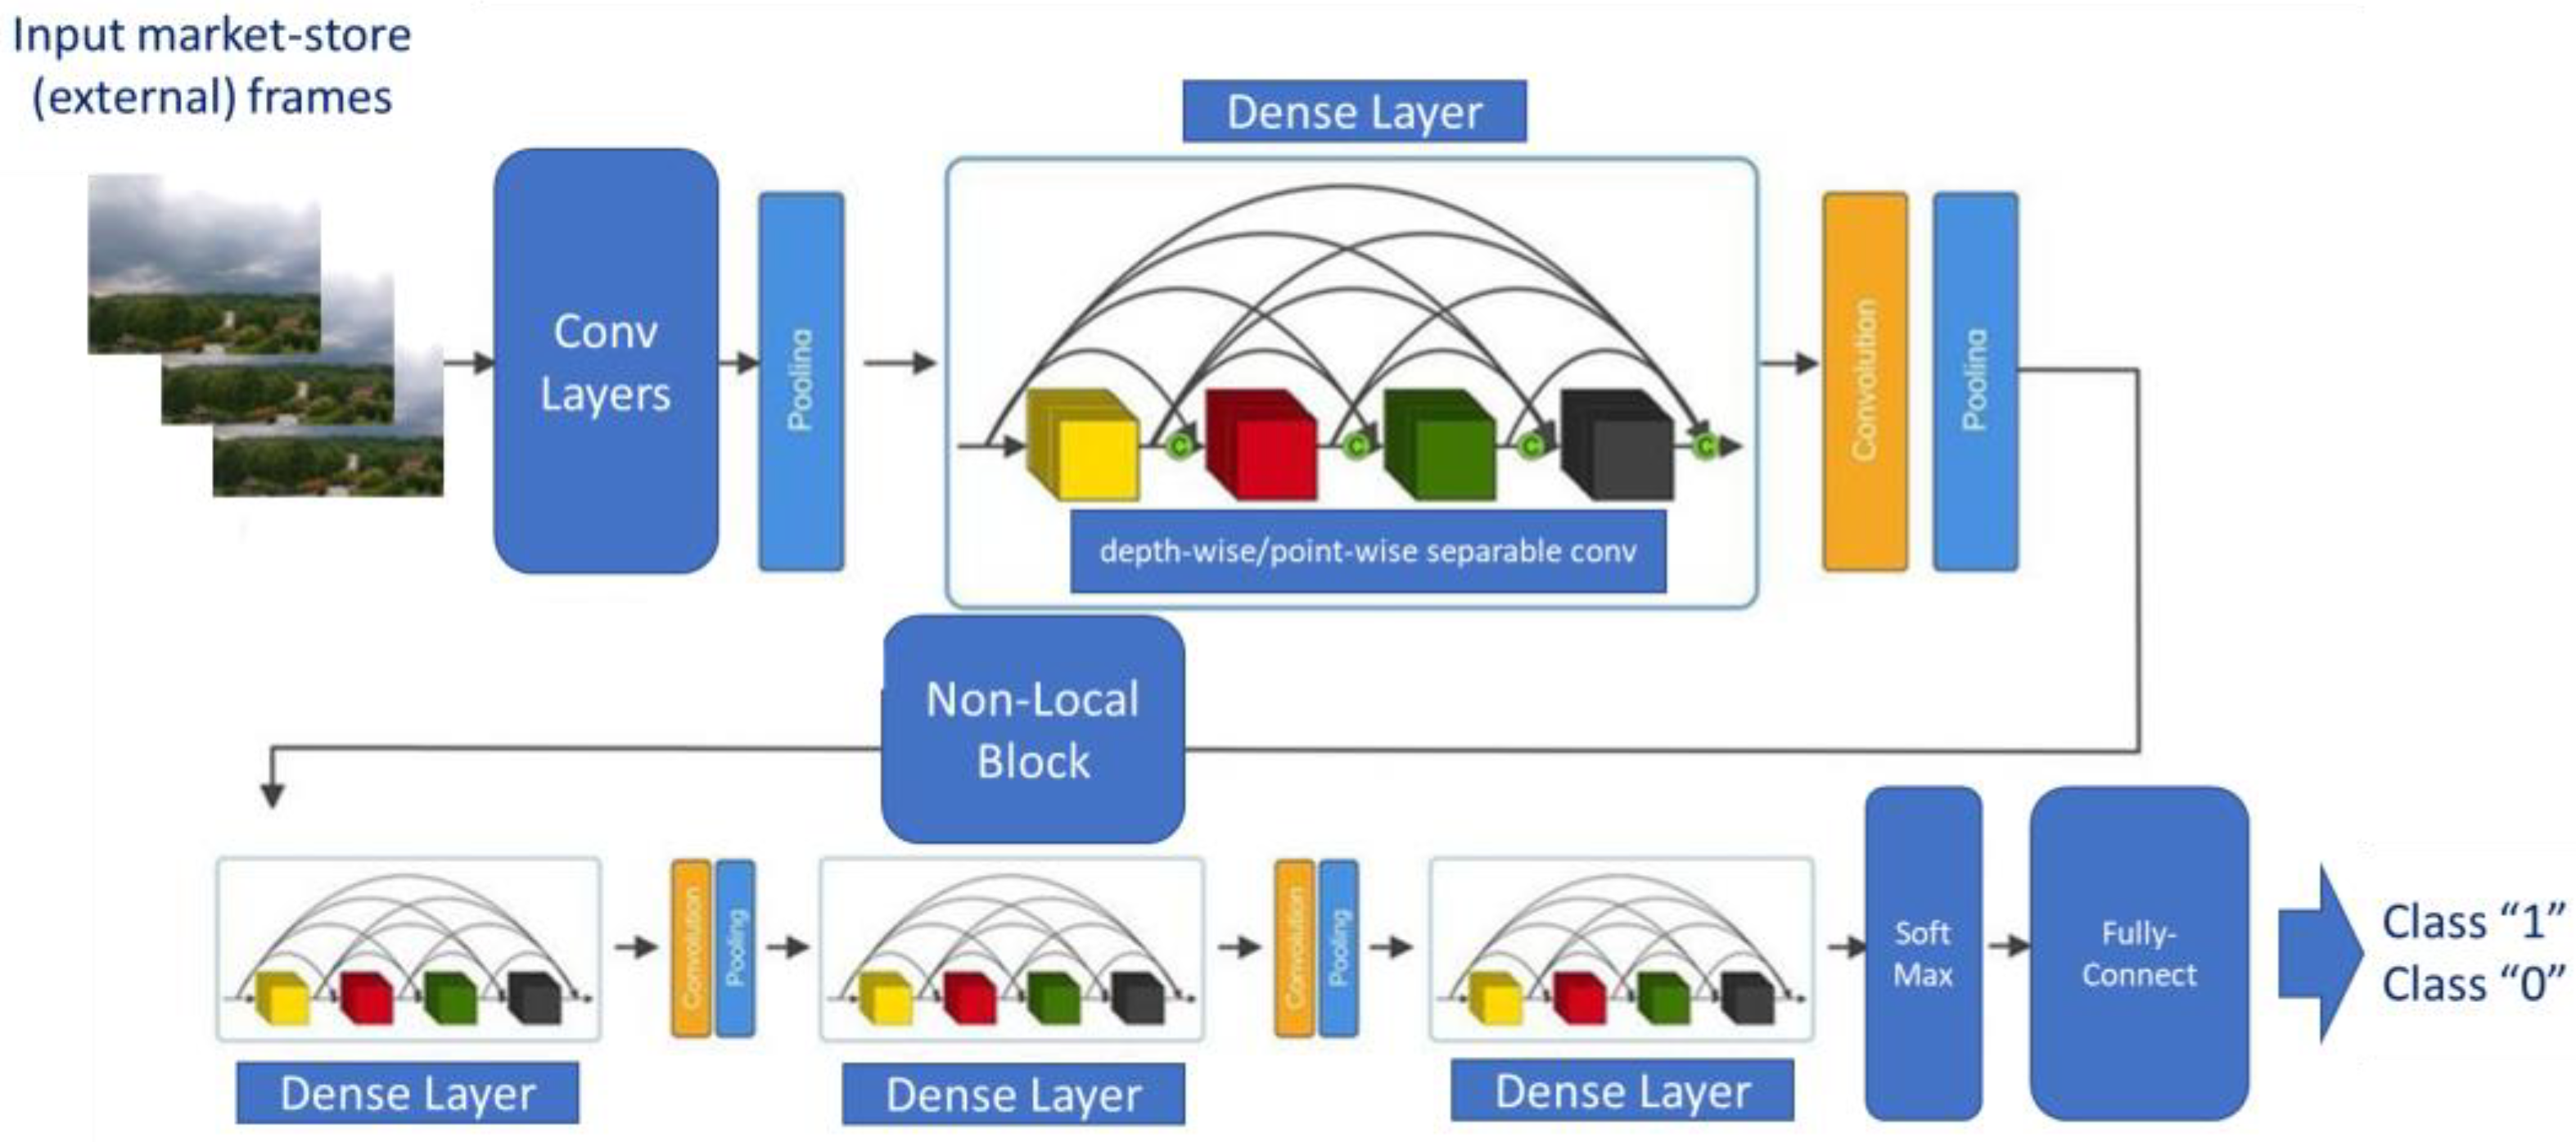
The target of this block is the local average climatic characterization of the geographical area in which the market store is located. In order to characterize this aspect, a 3D-DCNN enhanced with nonlocal self-attention layers was proposed [65]. The input of the designed 3D-DCNN will be the time–depth video frames captured by the outside (of the shopping store) visual system in specific time instants. In this work, the authors proposed the capturing of a visual snapshot of the outside of the market store in the morning (at 08.00 am) followed by a second, sampled at 12.00 am, and, finally, in the afternoon at 5.00 pm. In this way, it will be possible to characterize the climate of the local geographic area where the shopping store is located.
Indeed, we are significantly confident about the key impact that climate estimation certainly has in relation to the prediction of the future remaining stock of a specific product. This is because it impacts the customers’ willingness to reach the shopping store or the need to purchase that specific product. For instance, thirst-quenching liquid products will certainly have a greater demand in summer climatic conditions with high temperatures and intense heat, with significantly reduced interest in cold climatic periods. With sampling at different points of the day, it will be possible to determine an average assessment of the climatic conditions of the place of residence of the market store. For each captured frame, the designed 3D-DCNN will output a binary classification “Oc”, as reported in the following:
- Optimal for customers (Class “1”);
- Not optimal for customers (Class “0”).
As introduced, we proposed a 3D-DCNN to classify the input sampling video frames. This 3D-DCNN has been enhanced by the usage of nonlocal blocks enabling a self-attention mechanism embedded in the designed downstream network [66].
As reported in Figure 3, the proposed 3D-DCNN includes densely connected blocks (dense layers) with 3D separable convolution layers (both depthwise and pointwise). We embedded separable convolutions in order to optimize the model’s parameters without a significant loss of overall performance. Each dense block embeds a sequence of dense layers with a batch normalization layer, a 3D convolutional layer with a kernel size of 3 × 3 × 3 (depthwise and pointwise) completed by a ReLU activation. Each dense block is followed by a convolutional layer with a kernel size of 1 × 1 × 1 followed by a max pooling layer of kernel size 2 × 2 × 2. The output of the first dense block is then passed to the nonlocal block (NLB). The NLB was first introduced by Wang et al. in [66] for improving the ability of the deep network to learn long-time visual dependencies in input frames. Let us formalize the processing made by the NLB.
The following figure reports the scheme of the designed 3D-DCNN.
Let “pi” be the hidden pixel at any “i” position in the feature map; the NLB processing is computed as follows:
where ζ(∙) is a pairwise potential correlated to the “affinity” between pixels at positions “i” and “j”. β(∙) is a heuristic coefficient which modulates the function ζ. The term ψ(x) is a normalization factor. The parameters ζ, β e ψ are learned during the training phase as follows:
where Θ e Φ are spatial transformation functions learned during the training by means of the following relationship:
where β(∙) is an embedding function (usually a 1 × 1 × 1 convolutional block) with a weight distribution learned during the training phase. The normalization factor is computed as follows:
The NLB processing as described in Equations (7) and (10) improves the modeling of the long-term dependencies in the input frames and then the overall performance of the whole deep architecture in predicting the climate’s impact on the remaining stock estimation. The output of this subsystem will be fed as an input to the downstream deep temporal convolutional network.
3.4. The Deep Temporal Convolutional Neural Network System
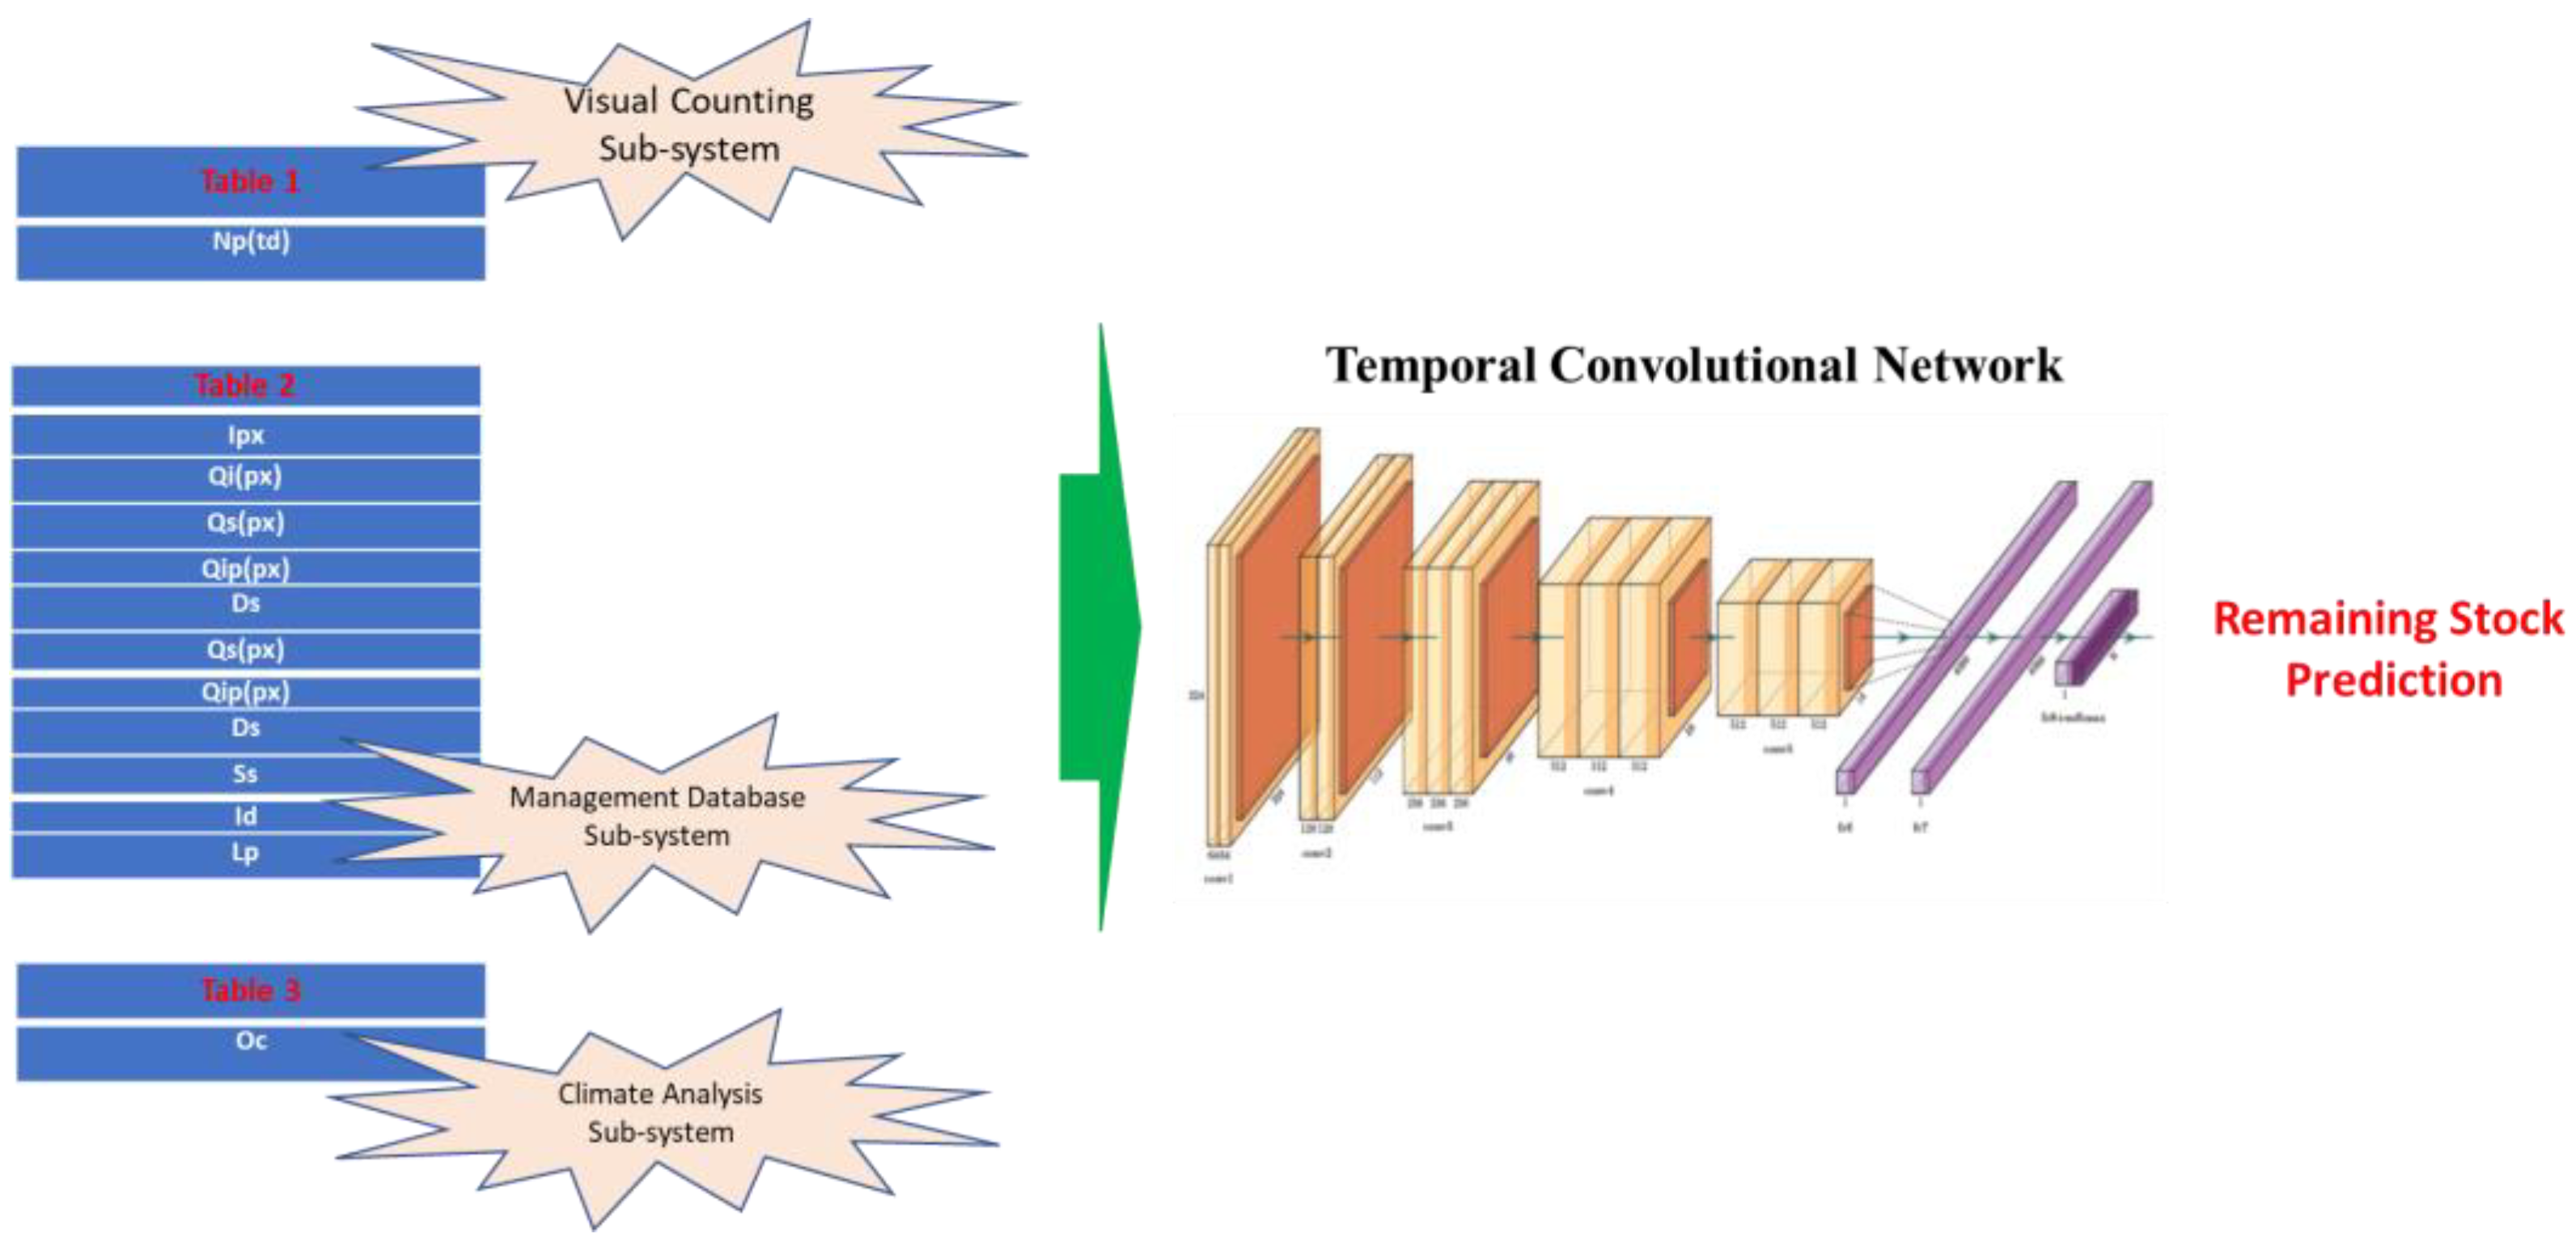
The aim of this block is to collect the output of the previous subsystems as reported in Figure 1 (the visual counting system, the management database subsystem, and the climate analysis subsystem) and then provide a correlation at the inference time to the general label of the proposed architecture, i.e., the remaining stock of a determined product. In essence, the input data are arranged in a vector containing the following field: (1) as per Equation (5), i.e., the average number of customers who visited the market store in a period, td; (2) the vector Tx containing the information coming from the management database system; (3) the binary classification (“1” or “0”) Oc coming from the visual climate analysis subsystem. This 1D input data will be used as the input of the downstream regressor which will correlate this input with the remaining stock amount of the product from which the input information is retrieved. The following Figure 4 reports the overall description of the designed architecture. Figure 4 highlights the underlying backbone of the designed regressor, i.e., an input vector embedding data from the upstream subsystems and a regressor of the remaining product stock based on the usage of the convolutional network.
The deep architecture used as an intelligent regressor for performing the correlation with the remaining stock prediction at T days as the temporal depth is a temporal convolutional neural network (TCNN). The TCNN was originally introduced by the authors of [67] and it is suitable to provide the regression/classification of sequential 1D input data. Unlike a traditional 2D CNN, which often processes data in a fixed-size window, the TCNN is able to process variable-sequence-length data (while also embedding convolution with dilation) which enables the network to have a larger receptive field without increasing the number of parameters. This makes the TCNN particularly well suited for tasks that require processing long sequences of data. More detail is presented in [10].
In the application proposed herein, the designed TCNN is composed of 12 blocks in which each block embeds a dilated 3 × 3 convolutional layer; followed by a normalization layer, spatial dropout; followed by another dilated 3 × 3 convolutional layer, normalization; and, finally, a ReLU activation followed by another dropout block. The proposed TCNN shows a residual backbone with skip connections applied to each block. The final block contains a fully connected network with one output, i.e., the remaining stock prediction at T steps of temporal depth. More detail is presented in [65,66,67].
3.5. The GDPR Control System
The target of this subsystem is the overall privacy monitoring of the collected data of the input subsystems. The GDPR document contains the requirements which data management has to respect in terms of privacy [67,68,69]. This block inserts a darkening or blurring of the faces of the market customers that are acquired in the visual counting system. There are several approaches to conduct this, but the authors preferred the generative approach proposed in [66,67,68].
4. Experimental Results
In this section, the experimental results of the proposed architecture will be highlighted. First, we present some information about the collected dataset. The authors collected the local dataset including external images of the place where the market store, the object of this work, was located. The collected images represented different climatic scenarios, some manually as optimal for customers and some others classified as not optimal. The classification was applied according to the impact on the commercial demand, that the authors monitored, and then on the remaining stock of the related products.
Furthermore, information was obtained from the management database of a discount store of a large food distribution holding present in the national territory where the authors reside. Approximately 5 years (2017–2022) of commercial product management information was collected in compliance with the provisions of the GDPR [69]. This dataset, composed of 600,000 records arranged as explained in Section 3.2 of this work, was split: approximately 70% was used for training, while the remaining 30% was used for the validation (15%) and testing (15%) of the proposed architecture. Moreover, according to GDPR requirements, we collected images reporting customers in the discount store in different numbers and at different time instants. For each of the mentioned 600,000 records of commercial data, the authors associated with it a set of images of the external climate scenario as well as of customer distribution. This association was carried out according to the impact of climate/customer number monitored by the authors in the local commercial store analyzed in this work.
Beyond the validation of the system, the individual subsystems of visual counting and climate analysis were validated with respect to the collected dataset and with respect to the public domain dataset. Before presenting the benchmark performance data, we present some information about the configuration of the proposed deep backbones as well as the learning algorithms and parameter configuration.
Concerning the CAT-CNN enhanced with the criss-cross architecture, we used the same backbone and combined loss function proposed in [63], enabling a cross-layer connection with a 3 × 3 kernel size. The input frame size was defined as 800 × 600, with the images which exceeded this size being reshaped. Our CAT-CNN backbone enhanced with the criss-cross (CAT-CNN-CCnet) layer was tested against the Shanghaitech dataset proposed in [70] and composed of two sets of images. The first set (part A) contained 300 training images and 182 test images; the second one (part B) contained 400 training images and 316 test images. The following table reports the performance benchmarks of the proposed architecture (by using the mean absolute error (MAE) as the metric [63]):
As reported in Table 1, our proposed system performed better with respect to the previous CAT-CNN [63] as well as with respect to other previous architectures. The training algorithm was the classical SGD [63] with Adam optimization and a batch size of 8; the initial learning rate was set to 1 × 10⁻⁶. The simulation was run on a server with a multicore INTEL-9 with 128 Gbyte of RAM and with an NVIDIA A6000 GPU with 48 Gbyte of video memory. The code was developed in the Pytorch environment.
After that, the visual climate analysis system was tested. We collected a total of 300 800 × 600 RGB images at different times of the day as described in Section 3.3. In this case, we only worked with the luminance component (Y) of the input image after a conversion from RGB to YCbCr. The dataset was split into 70% for training and the remaining 30% for validation and testing. The used dataset was balanced as it included a total of 150 samples representing class “1”, while the remaining samples represented class “0”. K-fold (with k = 3) cross-validation was applied.
The proposed deep architecture enhanced with an NLB self-attention mechanism was compared with the same one without NLB processing (the ablation study) and with respect to other classical 3D backbones such as ResNet-101. The designed deep network was trained with classical SGD boosted with Adam optimization, a batch size of 4, an an initial learning rate of 1 × 10⁻⁶. The simulation was run on a server with a multicore INTEL-9 with 128 Gbyte of RAM and with an NVIDIA A6000 GPU with 48 Gbyte of video memory. The code was developed in the Pytorch environment. The following Table 2 reports the performance comparison related to the proposed solution.
As shown in Table 2, the performance of our architecture enhanced with the self-attention processing based on the usage of a criss-cross layer outperformed the classical architectures (75.31% compared to 72.12% and 72% for the CNNs with DenseNet or ResNet backbones) in classifying the input images containing the local scenario outside the discount store analyzed in this work. Our proposed solution was able to better discriminate the climate scenario, which increases the commercial demand compared to those that instead have no impact or even reduce it. The collected dataset referred to products which were selected from all the representative categories of the large food distribution holding.
Finally, we tested the downstream regressor based on the TCNN as shown in Figure 4. The following Table 3 reports the collected comparison benchmark. The test execution was run on a server machine with a multicore INTEL-9 with 128 Gb of RAM and with an NVIDIA A6000 GPU with 48 Gb of video memory. We compared our proposed solution by replacing the TCNN with a multilayer perceptron [75], LSTM [76], and LSTM with attention (LSTM-A) [76]. The remaining product stock prediction was set to T = 5 as the temporal depth.
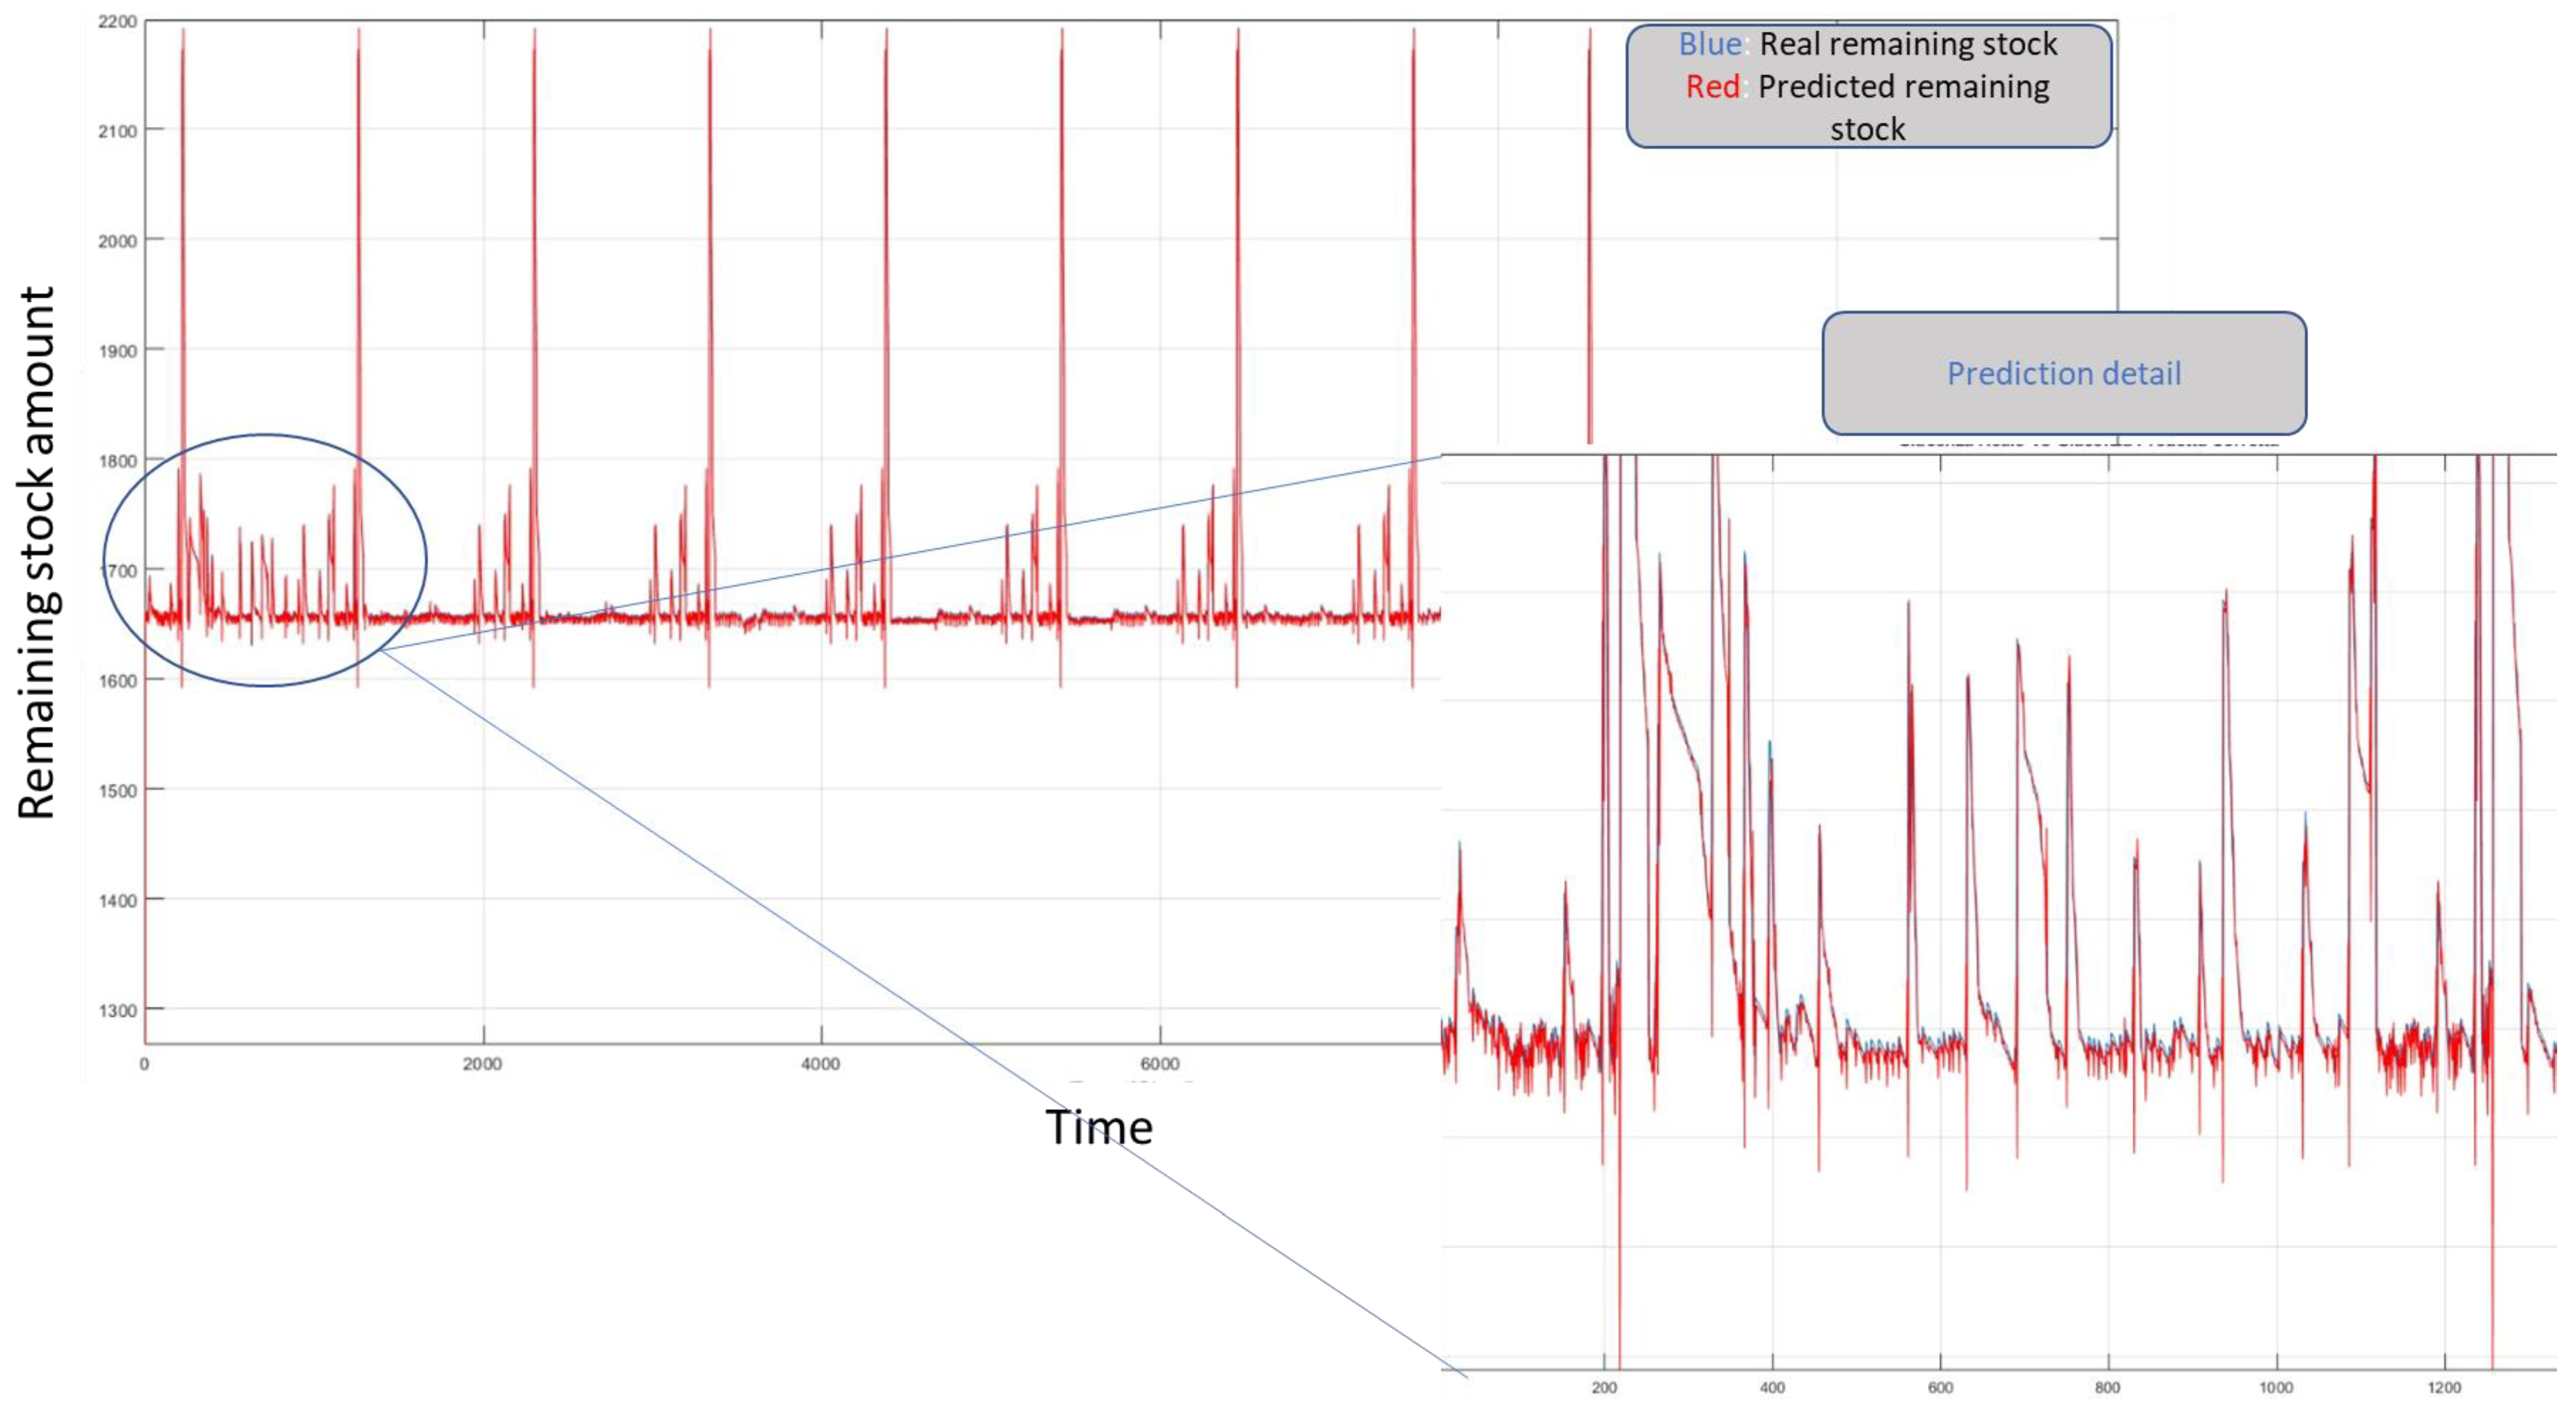
Additionally, in this case, as shown in Table 3, the proposed solution as reported in Figure 4 outperformed the other architectures in terms of remaining stock prediction for these commercial products. The following figure shows the overlay behavior of the predicted time series and the actual ones for a specific product selected from the dataset. Moreover, the training graph is reported.
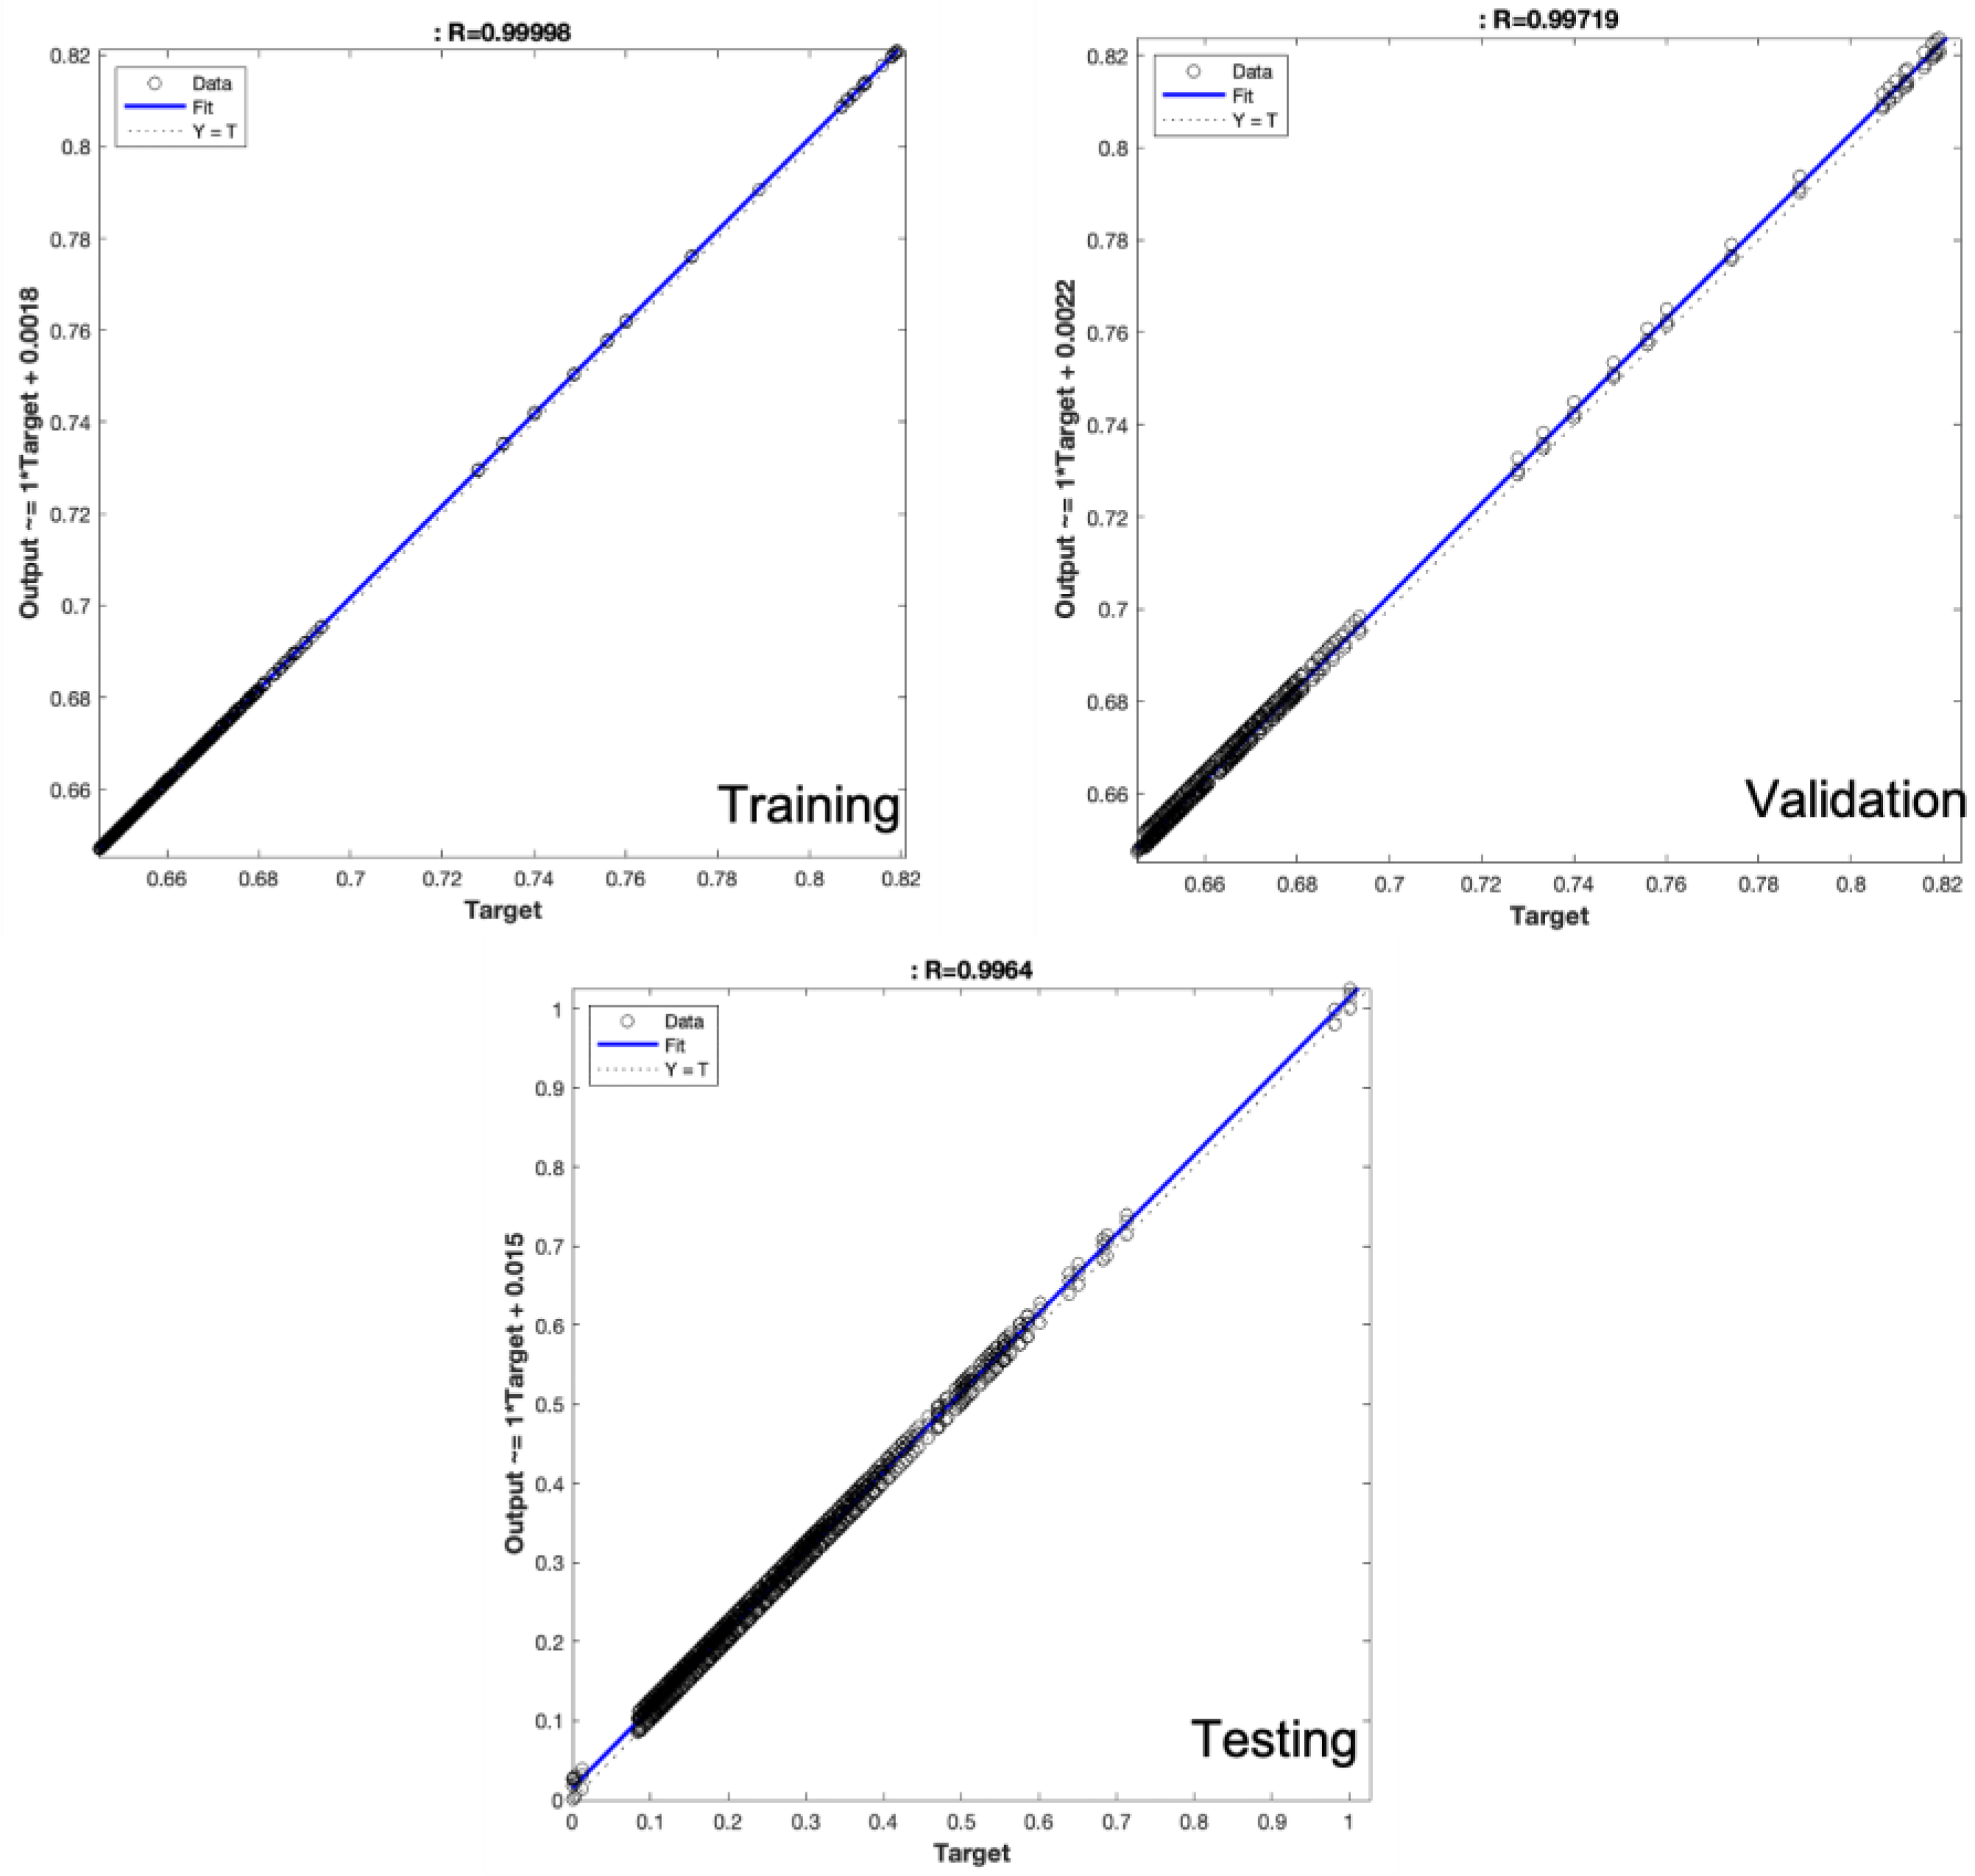
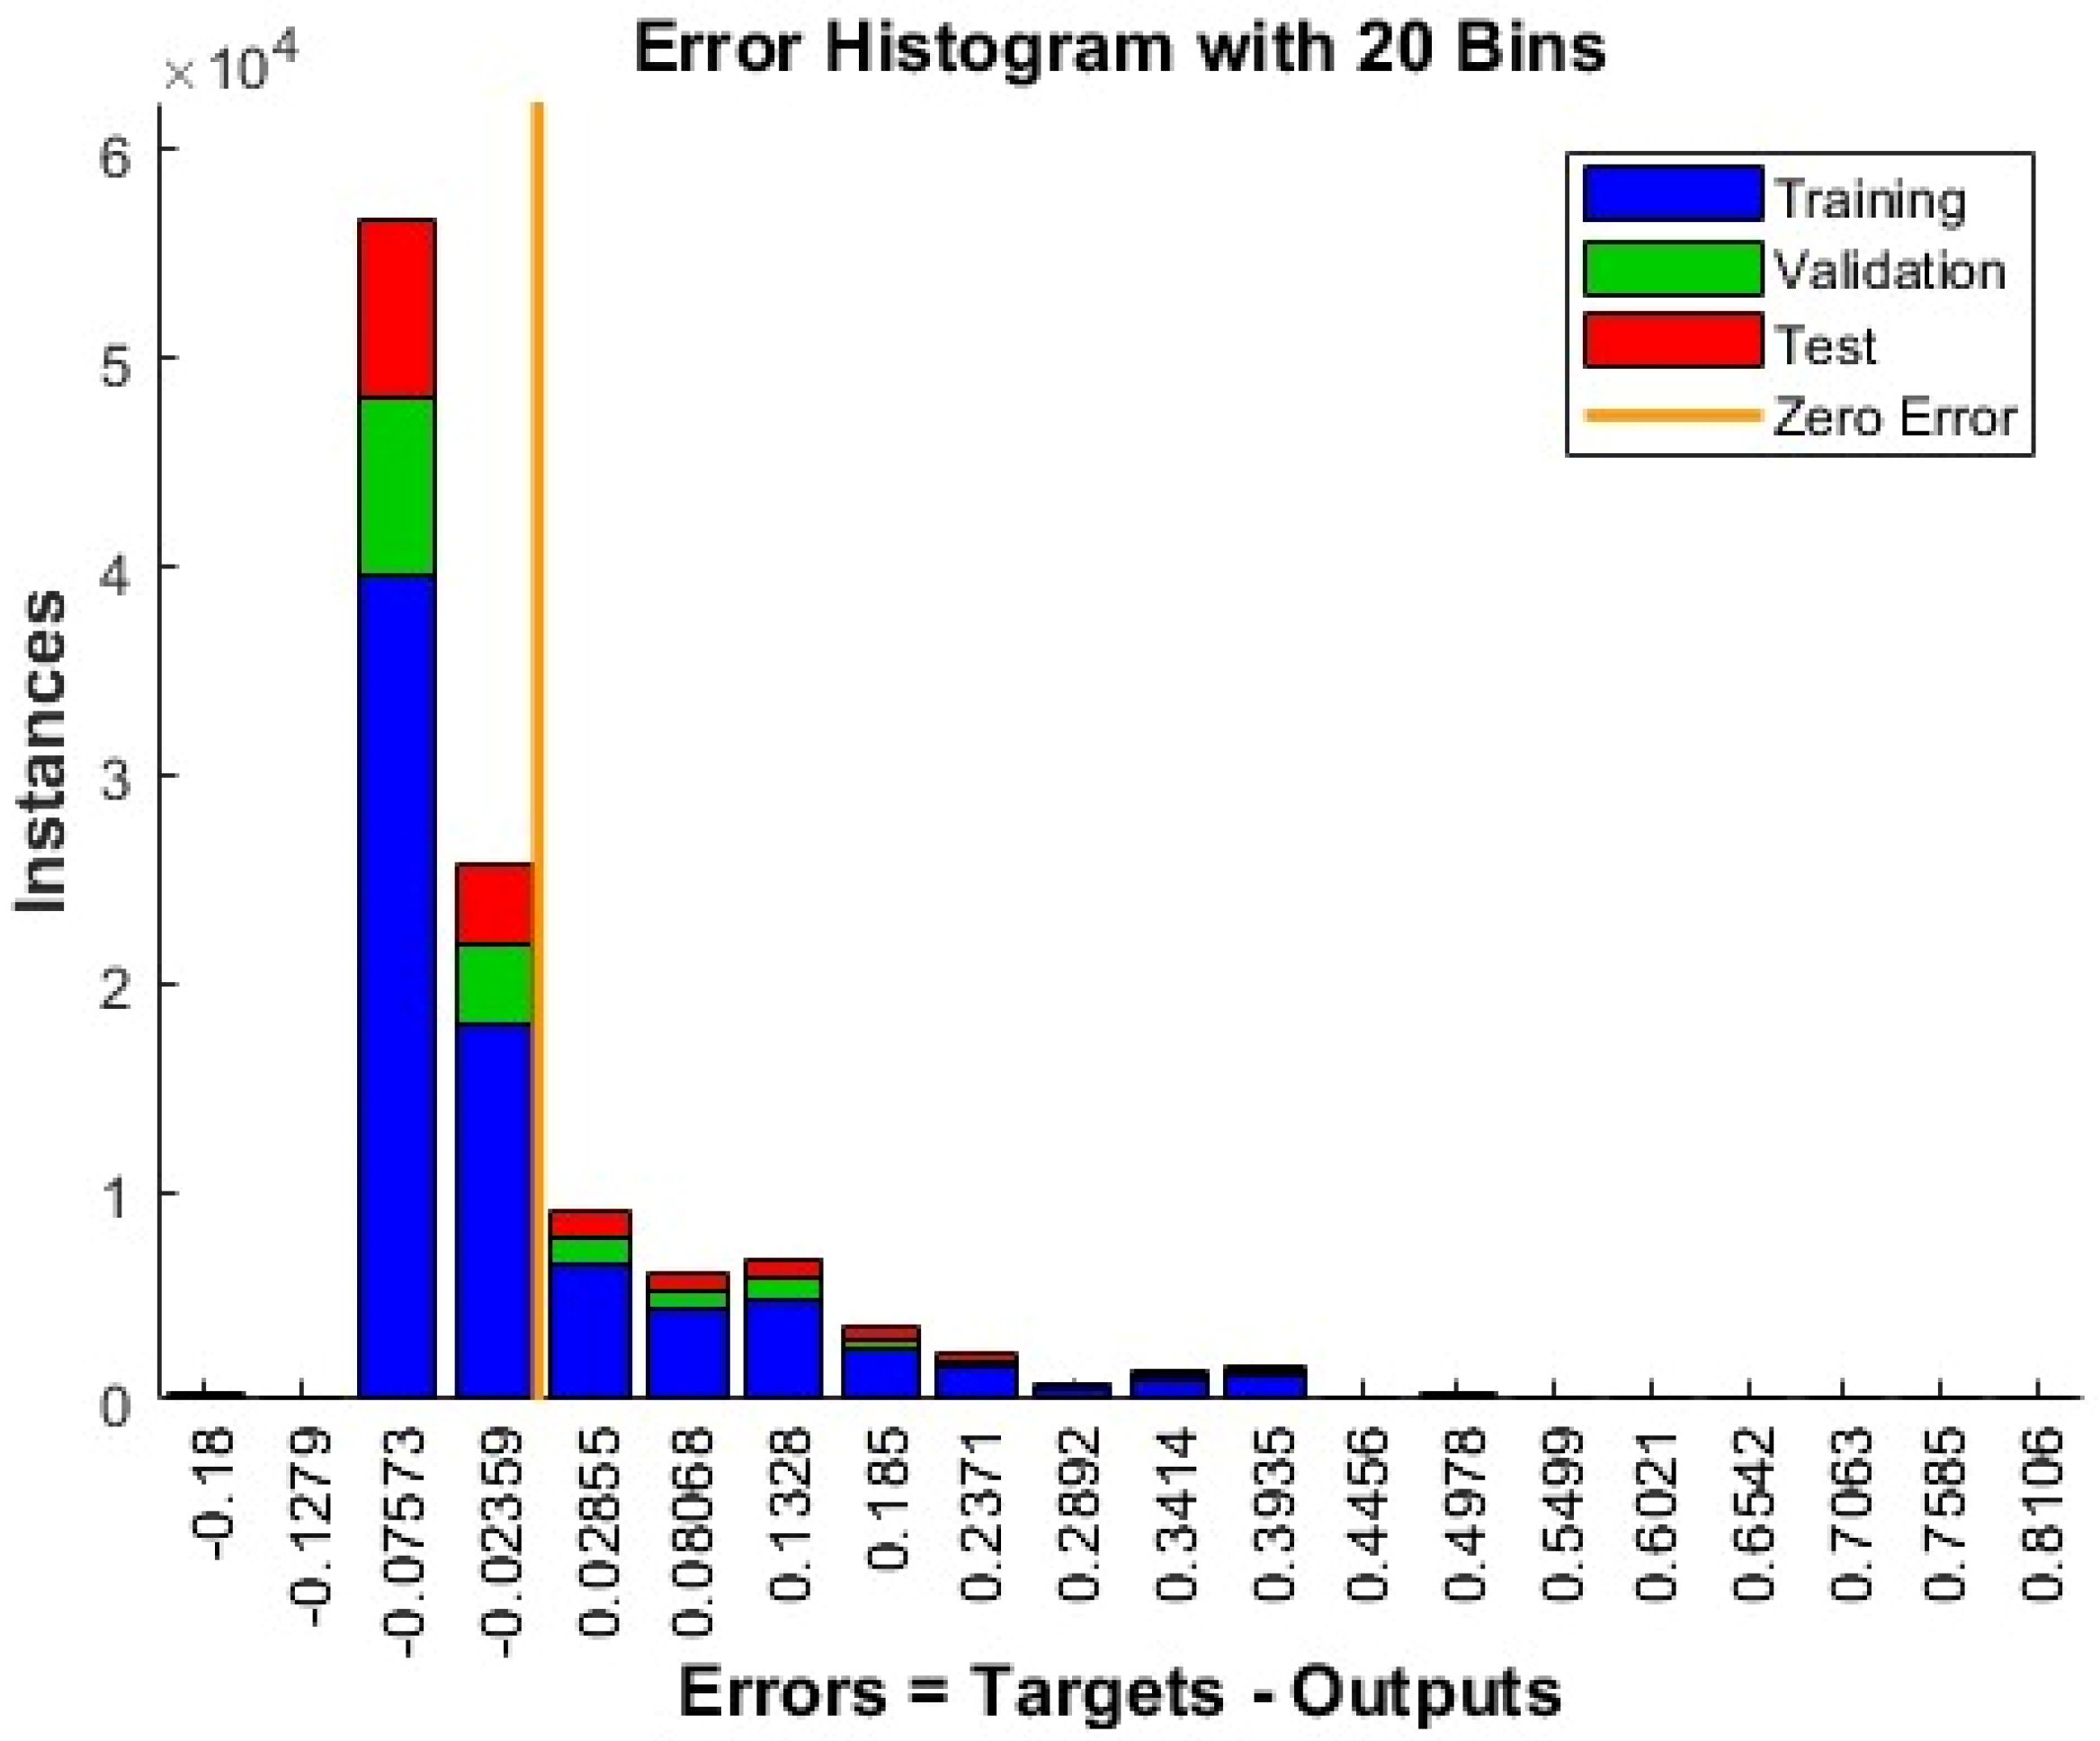
As shown in the data reported in Figure 5, Figure 6 and Figure 7 as well as in Table 3, the solution proposed in this work and based on TCNN outperformed the other solutions based on other deep backbones. In Figure 5, a comparison between the remaining stock dynamic (ground truth in blue) of such commercial products with respect to predicted ones (in red) is reported. The highlighted comparison confirms the effectiveness of the proposed deep predictor based on the analysis of history data integrated with the contextual visual information of the market store. The regression performance plot reported in Figure 6, as well as the error dynamic (in the training/validation and testing sessions) reported in Figure 7, confirms that the designed pipeline was able to learn and generalize the remaining stock correlation with the input variables. Moreover, the performance in the validation and test set confirmed that the no overfitting issue occurred in the learning phase of the proposed pipeline. The accuracy of the prediction of the remaining products’ stock was significantly greater (94%) compared to the other deep backbones due to the capability of the TCNN to retrieve the temporal correlation between input data, providing robust discriminative features to be used to generate an effective prediction of the remaining stock of such products.
5. Conclusions and Future Works
In the present work, the authors proposed a composite system named “iSPEAK” (an acronym of innovative out-of-stock prediction system based on data history knowledge deep learning) for predicting the residual stock of commercial products in the field of large-scale food distribution. The system is made up of two visual pipelines (the visual counting system and the visual climate analysis system) which allows characterizing the external climate and the average number of customers who frequent the analyzed shopping store. By means of a regressor based on convolutive temporal architectures, we were able to correlate this visual information with historical product management data (orders, sales, promotions, etc.) in order to predict the residual stock of the product at T days in the future. In the experimental results section, the performance results of the designed pipeline were reported. These data confirmed that, among those tested, the iSPEAK pipeline was able to predict the residual stock of a commercial product (at T = 5 days) with an accuracy of over 90%. The proposed method, with respect to the solutions present in the scientific literature and based on artificial intelligence, exhibited significantly higher performance compared to classic architectures based on MLP, LSTM, or convolutional platforms. This result was possible to obtain thanks to the integration of a pipeline that analyzed both “historical”-type (a regression system based on the historical data of the stock of the commercial store) and “current”-type data, that is, photographing the status of the market space in reference to the sentiment of customers and climatic data. The usage of the TCNN improved the performance of the designed system with respect to other solutions (94% vs. 90%, on average) as it allowed elucidating well the time correlation between the input multimodal data thanks to the “causal” module convolution embedded in the backbone of the TCNN.
The proposed system still has some critical issues regarding the prediction of the residual stock at T days, with T > 5. In fact, according to the performed test sessions, we noticed a degradation in performance which increased proportionally as the prediction time depth increased. In fact, the performance in predicting the residual stock of a commercial product gradually dropped to 79% (for T = 8) and 63% (for T = 13). We believe that this drop in performance is attributable to the downstream regressor being unable to time-correlate the features of historical and visual data (customer sentiment and climate) with the residual product stock in the subsequent T days.
Future works will aim to significantly improve the performance at T days as the temporal depth (with T > 5) by using transformer-based systems and integrating additional predictive information by equipping the iSPEAK system with the related ability to establish product order quantity based on residual inventory prediction. Moreover, the authors of the solution described herein intend to investigate the relationship between robotic wireless sensor networks and internet-of-things-based real-time production logistics as regards out-of-stock detection based on deep learning algorithms, as these seem very promising technologies in commercial and logistic fields [75,76,77].
6. Patents
Chamas, A.; Giaconia, C. GAIA: Great-Distribution Artificial Intelligence Algorithms. IT Patent Nr. 101022000002828, 16 February 2022.
Chamas, A.; Giaconia, C. iSPEAK: innovative out-of-Stocks PrEdiction system based on dA-ta-history Knowledge deep learning processing. IT Patent Nr. 102022000024186, 24 November 2022.
Author Contributions
Conceptualization, C.G. and A.C.; methodology, C.G. and A.C.; software, A.C.; validation, C.G. and A.C.; formal analysis, C.G. and A.C.; investigation, C.G. and A.C.; resources, C.G. and A.C.; data curation, A.C.; writing—original draft preparation, C.G. and A.C.; writing—review and editing, C.G. and A.C.; visualization, C.G. and A.C.; supervision, C.G. and A.C.; project administration, C.G. and A.C.; funding acquisition, C.G. All authors have read and agreed to the published version of the manuscript.
Funding
This research received no external funding.
Data Availability Statement
The dataset and the material of this work cannot be shared due to patent registration and related nondisclosure policy.
Acknowledgments
The authors thank the “Giaconia srl, Giaconia Concetta srl and Già Quì srl Companies” for having shared the dataset used for training/validation and the testing of the proposed pipeline.
Conflicts of Interest
The authors declare no conflict of interest.
References
- García-Arca, J.; Prado-Prado, J.C.; González-Portela Garrido, A.T. On-shelf availability and logistics rationalization. A participative methodology for supply chain improvement. J. Retail. Consum. Serv. 2020, 52, 101889. [Google Scholar] [CrossRef]
- Mou, S.; Robb, D.J.; DeHoratius, N. Retail store operations: Literature review and research directions. Eur. J. Oper. Res. 2018, 265, 399–422. [Google Scholar] [CrossRef]
- Berger, R. Optimal SHELF AVAILABILITY: Increasing Shopper Satisfaction at the Moment of Truth; Roland Berger Consultants: Kontich, Belgium, 2003; pp. 1–64. [Google Scholar]
- Corsten, D.; Gruen, T. Desperately seeking shelf availability: An examination of the extent, the causes, and the efforts to address retail out-of-stocks. Int. J. Retail Distrib. Manag. 2003, 31, 605–617. [Google Scholar] [CrossRef]
- Gruen, T.W.; Corsten, D. A Comprehensive Guide to Retail Reduction in the Fast-Moving Consumer Goods Industry; Grocery Manufacturers of America: Washington, DC, USA, 2008; ISBN 9783905613049. [Google Scholar]
- Buzek, G. Worldwide Costs of Retail Out-of-Stocks. Available online: https://www.ihlservices.com/news/analyst-corner/2018/06/worldwide-costs-of-retail-out-of-stocks/ (accessed on 26 January 2023).
- Papakiriakopoulos, D. Predict on-shelf product availability in grocery retailing with classification methods. Expert Syst. Appl. 2012, 39, 4473–4482. [Google Scholar] [CrossRef]
- Papakiriakopoulos, D.; Pramatari, K.; Doukidis, G. A decision support system for detecting products missing from the shelf based on heuristic rules. Decis. Support Syst. 2009, 46, 685–694. [Google Scholar] [CrossRef]
- Papakiriakopoulos, D. Developing a mechanism to support decisions for products missing from the shelf. J. Decis. Syst. 2011, 20, 417–441. [Google Scholar]
- Chuang, H.H.C.; Oliva, R.; Liu, S. On-shelf availability, retail performance, and external audits: A field experiment. Prod. Oper. Manag. 2016, 25, 935–951. [Google Scholar] [CrossRef]
- Montoya, R.; Gonzalez, C. A hidden Markov model to detect on-shelf out-of-stocks using point-of-sale data. Manuf. Serv. Oper. Manag. 2019, 21, 932–948. [Google Scholar] [CrossRef] [Green Version]
- Geng, Z.; Wang, Z.; Weng, T.; Huang, Y.; Zhu, Y. Shelf Product Detection Based on Deep Neural Network. In Proceedings of the 2019 12th International Congress on Image and Signal Processing, BioMedical Engineering and Informatics (CISP-BMEI), Suzhou, China, 19–21 October 2019; pp. 1–6. [Google Scholar]
- Mehta, R.N.; Joshi, H.V.; Dossa, I.; Gyanch Yadav, R.; Mane, S.; Rathod, M. Supermarket Shelf Monitoring Using ROS based Robot. In Proceedings of the 2021 5th International Conference on Trends in Electronics and Informatics (ICOEI), Tirunelveli, India, 3–5 June 2021; pp. 58–65. [Google Scholar]
- Craciunescu, M.; Baicu, D.; Mocanu, S.; Dobre, C. Determining On-Shelf Availability Based on RGB and ToF Depth Cameras. In Proceedings of the 2021 23rd International Conference on Control Systems and Computer Science (CSCS), Bucharest, Romania, 26–28 May 2021; pp. 243–248. [Google Scholar]
- Chen, J.; Wang, S.-L.; Lin, H.-L. Out-of-Stock Detection Based on Deep Learning. In Proceedings of the 15th International Conference (ICIC 2019), Nanchang, China, 3–6 August 2019; pp. 228–237. [Google Scholar]
- Higa, K.; Iwamoto, K. Robust shelf monitoring using supervised learning for improving on-shelf availability in retail stores. Sensors 2019, 19, 2722. [Google Scholar] [CrossRef] [Green Version]
- Yilmazer, R.; Birant, D. Shelf auditing based on image classification using semi-supervised deep learning to increase on-shelf availability in grocery stores. Sensors 2021, 21, 327. [Google Scholar] [CrossRef]
- Avlijas, G.; Vukanovic Dumanovic, V.; Radunovic, M. Measuring the effects of automatic replenishment on product availability in retail stores. Sustainability 2021, 13, 1391. [Google Scholar] [CrossRef]
- Fitzsimons, G.J. Consumer response to stockouts. J. Consum. Res. 2000, 27, 249–266. [Google Scholar] [CrossRef] [Green Version]
- Koos, S.E.; Shaikh, N.I. Dynamics of consumers’ dissatisfaction due to stock-outs. Int. J. Prod. Econ. 2019, 208, 461–471. [Google Scholar] [CrossRef]
- Azeem, M.M.; Baker, D.; Villano, R.A.; Mounter, S.; Griffith, G. Response to stockout in grocery stores: A small city case in a changing competitive environment. J. Retail. Consum. Serv. 2019, 49, 242–252. [Google Scholar] [CrossRef]
- Hamilton, R.; Thompson, D.; Bone, S.; Chaplin, L.N.; Griskevicius, V.; Goldsmith, K.; Hill, R.; John, D.R.; Mittal, C.; O’Guinn, T.; et al. The effects of scarcity on consumer decision journeys. J. Acad. Mark. Sci. 2019, 47, 532–550. [Google Scholar] [CrossRef]
- Verbeke, W.; Farris, P.; Thurik, R. Consumer response to the preferred brand out-of-stock situation. Eur. J. Mark. 1998, 32, 1008–1028. [Google Scholar] [CrossRef]
- Campo, K.; Gijsbrechts, E.; Nisol, P. Towards understanding consumer response to stock-outs. J. Retail. 2000, 76, 219–242. [Google Scholar] [CrossRef]
- Ehrenthal, J.C.F.; Stölzle, W. An examination of the causes for retail stockouts. Int. J. Phys. Distrib. Logist. Manag. 2013, 43, 54–69. [Google Scholar] [CrossRef]
- Andersen Consulting. The Retail Problem of Out-of-Stock Merchandise; Coca-Cola Retailing Research Council: Atlanta, GA, USA, 1996. [Google Scholar]
- Kang, Y.; Gershwin, S.B. Information inaccuracy in inventory systems: Stock loss and stockout. IIE Trans. 2005, 37, 843–859. [Google Scholar] [CrossRef]
- Frontoni, E.; Marinelli, F.; Rosetti, R.; Zingaretti, P. Shelf space re-allocation for out of stock reduction. Comput. Ind. Eng. 2017, 106, 32–40. [Google Scholar] [CrossRef]
- Reiner, G.; Teller, C.; Kotzab, H. Analyzing the efficient execution of in-store logistics processes in grocery retailing—The case of dairy products. Prod. Oper. Manag. 2013, 22, 924–939. [Google Scholar] [CrossRef] [Green Version]
- Condea, C.; Thiesse, F.; Fleisch, E. RFID-enabled shelf replenishment with backroom monitoring in retail stores. Decis. Support Syst. 2012, 52, 839–849. [Google Scholar] [CrossRef]
- Rosales, C.R.; Whipple, J.M.; Blackhurst, J. The impact of distribution channel decisions and repeated stockouts on manufacturer and retailer performance. IEEE Trans. Eng. Manag. 2019, 66, 312–324. [Google Scholar] [CrossRef]
- Avlijas, G.; Simicevic, A.; Avlijas, R.; Prodanovic, M. Measuring the impact of stock-keeping unit attributes on retail stock-out performance. Oper. Manag. Res. 2015, 8, 131–141. [Google Scholar] [CrossRef]
- Williams, B.D.; Waller, M.A.; Ahire, S.; Ferrier, G.D. Predicting retailer orders with POS and order data: The inventory balance effect. Eur. J. Oper. Res. 2014, 232, 593–600. [Google Scholar] [CrossRef]
- Chen, C.Y.; Lee, W.I.; Kuo, H.M.; Chen, C.W.; Chen, K.H. The study of a forecasting sales model for fresh food. Expert Syst. Appl. 2010, 37, 7696–7702. [Google Scholar] [CrossRef]
- Waller, M.A.; Williams, B.D.; Tangari, A.H.; Burton, S. Marketing at the retail shelf: An examination of moderating effects of logistics on SKU market share. J. Acad. Mark. Sci. 2010, 38, 105–117. [Google Scholar] [CrossRef]
- Fisher, M.; Raman, A. The New Science of Retailing; Harvard Business Review Press: Cambridge, MA, USA, 2010; ISBN 9781422110577. [Google Scholar]
- Bottani, E.; Bertolini, M.; Rizzi, A.; Romagnoli, G. Monitoring on-shelf availability, out-of-stock and product freshness through RFID in the fresh food supply chain. Int. J. RF Technol. Res. Appl. 2017, 8, 33–55. [Google Scholar] [CrossRef]
- Metzger, C.; Thiesse, F.; Gershwin, S.; Fleisch, E. The impact of false-negative reads on the performance of RFID-based shelf inventory control policies. Comput. Oper. Res. 2013, 40, 1864–1873. [Google Scholar] [CrossRef]
- Mersereau, A.J. Demand estimation from censored observations with inventory record inaccuracy. Manuf. Serv. Oper. Manag. 2015, 17, 335–349. [Google Scholar] [CrossRef] [Green Version]
- Sarac, A.; Absi, N.; Dauzere-Pérès, S. A literature review on the impact of RFID technologies on supply chain management. Int. J. Prod. Econ. 2010, 128, 77–95. [Google Scholar] [CrossRef]
- Piramuthu, S.; Wochner, S.; Grunow, M. Should retail stores also RFID-tag “cheap” items? Eur. J. Oper. Res. 2014, 233, 281–291. [Google Scholar] [CrossRef]
- Franco, A.; Maltoni, D.; Papi, S. Grocery product detection and recognition. Expert Syst. Appl. 2017, 81, 163–176. [Google Scholar] [CrossRef]
- Fleisch, E.; Tellkamp, C. Inventory inaccuracy and supply chain performance: A simulation study of a retail supply chain. Int. J. Prod. Econ. 2005, 95, 373–385. [Google Scholar] [CrossRef]
- Chen, L. Fixing phantom stockouts: Optimal data-driven shelf inspection policies. SSRN Electron. J. 2015, 30, 1–21. [Google Scholar]
- Chuang, H.H.C. Fixing shelf out-of-stock with signals in point-of-sale data. Eur. J. Oper. Res. 2018, 270, 862–872. [Google Scholar] [CrossRef]
- R Core Team. R: A Language and Environment for Statistical Computing; R Foundation for Statistical Computing: Vienna, Austria, 2020. [Google Scholar]
- Salinas, D.; Flunkert, V.; Gasthaus, J.; Januschowski, T. DeepAR: Probabilistic forecasting with autoregressive recurrent networks. Int. J. Forecast. 2020, 36, 1181–1191. [Google Scholar] [CrossRef]
- Li, S.; Jin, X.; Xuan, Y.; Zhou, X.; Chen, W.; Wang, Y.-X.; Yan, X. Enhancing the locality and breaking the memory bottleneck of transformer on time series forecasting. Adv. Neural Inf. Process. Syst. 2019, 32, 5243–5253. [Google Scholar]
- Maggiolo, M.; Spanakis, G. Autoregressive convolutional recurrent neural network for univariate and multivariate time series prediction. arXiv 2019, arXiv:1903.02540. [Google Scholar]
- Shih, S.-Y.; Sun, F.-K.; Lee, H.-Y. Temporal pattern attention for multivariate time series forecasting. Mach. Learn. 2019, 108, 1421–1441. [Google Scholar] [CrossRef] [Green Version]
- Dey, B.K.; Seok, H. Intelligent inventory management with autonomation and service strategy. J. Intell. Manuf. 2022, 1–24. [Google Scholar] [CrossRef] [PubMed]
- Jauhar, S.K.; Jani, S.M.; Kamble, S.S.; Pratap, S.; Belhadi, A.; Gupta, S. How to use no-code artificial intelligence to predict and minimize the inventory distortions for resilient supply chains. Int. J. Prod. Res. 2023, 1–25. [Google Scholar] [CrossRef]
- Biswas, M.; Nova, A.J.; Mahbub, M.K.; Chaki, S.; Ahmed, S.; Islam, M.A. Stock Market Prediction: A Survey and Evaluation. In Proceedings of the 2021 International Conference on Science & Contemporary Technologies (ICSCT), Dhaka, Bangladesh, 5–7 August 2021; pp. 1–6. [Google Scholar] [CrossRef]
- Theodorou, E.; Spiliotis, E.; Assimakopoulos, V. Optimizing inventory control through a data-driven and model-independent framework. EURO J. Transp. Logist. 2023, 12, 100103. [Google Scholar] [CrossRef]
- Kipf, T.N.; Welling, M. Semi-supervised classification with graph convolutional networks. arXiv 2016, arXiv:1609.02907. [Google Scholar]
- Chen, W.; Chen, L.; Xie, Y.; Cao, W.; Gao, Y.; Feng, X. Multi-range attentive bicomponent graph convolutional network for traffic forecasting. In Proceedings of the AAAI Conference on Artificial Intelligence, New York, NY, USA, 7–12 February 2020; pp. 3529–3536. [Google Scholar]
- Yan, S.; Xiong, Y.; Lin, D. Spatial temporal graph convolutional networks for skeleton-based action recognition. In Proceedings of the Thirty-Second AAAI Conference on Artificial Intelligence, New York, NY, USA, 2–7 February 2018. [Google Scholar]
- Li, Y.; Yu, R.; Shahabi, C.; Liu, Y. Diffusion convolutional recurrent neural network: Data-driven traffic forecasting. arXiv 2017, arXiv:1707.01926. [Google Scholar]
- Seo, Y.; Defferrard, M.; VanderGheynst, P.; Bresson, X. Structured Sequence Modeling with Graph Convolutional Recurrent Networks. In Proceedings of the 29th International Conference on Neural Information Processing, Siem Reap, Cambodia, 13–16 December 2018; pp. 362–373. [Google Scholar]
- Xie, Q.; Guo, T.; Chen, Y.; Xiao, Y.; Wang, X.; Zhao, B.Y. Deep Graph Convolutional Networks For Incident-Driven Traffic Speed Prediction. In Proceedings of the 29th ACM International Conference on Information & Knowledge Management, New York, NY, USA, 19–23 October 2020; pp. 1665–1674. [Google Scholar]
- Chen, J.; Su, W.; Wang, Z. Crowd counting with crowd attention convolutional neural network. Neurocomputing 2020, 382, 210–220. [Google Scholar] [CrossRef]
- Huang, Z.; Wang, X.; Huang, L.; Huang, C.; Wei, Y.; Liu, W. CCNet: Criss-Cross Attention for Semantic Segmentation. In Proceedings of the 2019 IEEE/CVF International Conference on Computer Vision (ICCV), Seoul, Republic of Korea, 27 October–2 November 2019; pp. 603–612. [Google Scholar] [CrossRef] [Green Version]
- Rundo, F.; Banna, G.L.; Prezzavento, L.; Trenta, F.; Conoci, S.; Battiato, S. 3D Non-Local Neural Network: A Non-Invasive Biomarker for Immunotherapy Treatment Outcome Prediction. Case-Study: Metastatic Urothelial Carcinoma. J. Imaging 2020, 6, 133. [Google Scholar] [CrossRef]
- Wang, X.; Girshick, R.; Gupta, A.; He, K. Non-local Neural Networks. In Proceedings of the 2018 IEEE Conference on Computer Vision and Pattern Recognition (CVPR), Honolulu, HI, USA, 21–26 July 2018; pp. 7794–7803. [Google Scholar] [CrossRef] [Green Version]
- Pelletier, C.; Webb, G.I.; Petitjean, F. Temporal convolutional neural network for the classification of satellite image time series. arXiv 2018, arXiv:abs/1811.10166. [Google Scholar] [CrossRef] [Green Version]
- Qiu, Y.; Niu, Z.; Song, B.; Ma, T.; Al-Dhelaan, A.; Al-Dhelaan, M. A Novel Generative Model for Face Privacy Protection in Video Surveillance with Utility Maintenance. Appl. Sci. 2022, 12, 6962. [Google Scholar] [CrossRef]
- GDPR General Data Protection Regulation, Complete Guide to GDPR Compliance. Available online: https://gdpr.eu/ (accessed on 31 January 2023).
- Zhang, Y.; Zhou, D.; Chen, S.; Gao, S.; Ma, Y. Single-image crowd counting via multi-column convolutional neural network. In Proceedings of the IEEE Conference on Computer Vision and Pattern Recognition, Las Vegas, NV, USA, 26 June–1 July 2016; pp. 589–597. [Google Scholar]
- Sam, D.B.; Surya, S.; Babu, R.V. Switching convolutional neural network for crowd counting. In Proceedings of the IEEE Conference on Computer Vision and Pattern Recognition, Honolulu, HI, USA, 21–6 July 2017; p. 6. [Google Scholar]
- Zhang, Y.; Zhou, C.; Chang, F.; Kot, A.C. Multi-resolution attention convolutional neural network for crowd counting. Neurocomputing 2019, 329, 144–152. [Google Scholar] [CrossRef]
- Shi, Z.; Zhang, L.; Liu, Y.; Cao, X.; Ye, Y.; Cheng, M.-M.; Zheng, G. Crowd Counting with Deep Negative Correlation Learning. In Proceedings of the IEEE Conference on Computer Vision and Pattern Recognition, Salt Lake City, UT, USA, 18–23 June 2018; pp. 5382–5390. [Google Scholar]
- Sam, D.B.; Sajjan, N.N.; Babu, R.V.; Srinivasan, M. Divide and Grow: Capturing Huge Diversity in Crowd Images with Incrementally Growing CNN. In Proceedings of the 2018 IEEE/CVF Conference on Computer Vision and Pattern Recognition, Salt Lake City, UT, USA, 18–23 June 2018; pp. 3618–3626. [Google Scholar]
- Rumelhart, D.E.; Hinton, G.E.; Williams, R.J. Learning representations by back-propagating errors. Nature 1986, 323, 533–536. [Google Scholar] [CrossRef]
- Zhang, Y.; Hutchinson, P.; Lieven, N.A.J.; Nunez-Yanez, J. Remaining Useful Life Estimation Using Long Short-Term Memory Neural Networks and Deep Fusion. IEEE Access 2020, 8, 19033–19045. [Google Scholar] [CrossRef]
- Lăzăroiu, G.; Andronie, M.; Iatagan, M.; Geamănu, M.; Ștefănescu, R.; Dijmărescu, I. Deep Learning-Assisted Smart Process Planning, Robotic Wireless Sensor Networks, and Geospatial Big Data Management Algorithms in the Internet of Manufacturing Things. ISPRS Int. J. Geo-Inf. 2022, 11, 277. [Google Scholar] [CrossRef]
- Nica, E.; Stan, C.I.; Luțan (Petre), A.G.; Oașa (Geambazi), R.-Ș. Internet of things-based real-time production logistics, sustainable industrial value creation, and artificial intelligence-driven big data analytics in cyber-physical smart manufacturing systems. Econ. Manag. Financ. Mark. 2021, 16, 52–62. [Google Scholar] [CrossRef]
- Andronie, M.; Lăzăroiu, G.; Iatagan, M.; Uță, C.; Ștefănescu, R.; Cocoșatu, M. Artificial intelligence-based decision-making algorithms, internet of things sensing networks, and deep learning-assisted smart process management in cyber-physical production systems. Electronics 2021, 10, 2497. [Google Scholar] [CrossRef]
Figure 1.
Overall scheme of the proposed pipeline.

Figure 2.
The proposed Visual Counting System.

Figure 3.
The proposed Climate Analysis System.

Figure 4.
The proposed downstream deep regressor.

Figure 5.
The benchmark comparison of the downstream intelligent regressor. (Blue): real dynamic of the product’s remaining stock; (red): predicted remaining stock of product.
Figure 5.
The benchmark comparison of the downstream intelligent regressor. (Blue): real dynamic of the product’s remaining stock; (red): predicted remaining stock of product.

Figure 6.
Regression scatter-plot graphs.

Figure 7.
Error histogram behavior for training/validation and test sessions of the proposed solution.
Figure 7.
Error histogram behavior for training/validation and test sessions of the proposed solution.


Table 1.
Visual Counting subsystem: performance benchmark (metric: MAE).
| Method | Part A | Part B |
|---|---|---|
| Switch-CNN [71] | 90.4 | 21.6 |
| MRA-CNN [72] | 74.2 | 11.9 |
| D-ConvNet-V1 [73] | 73.5 | 11.0 |
| IG-CNN [74] | 72.5 | 13.6 |
| CAT-CNN [63] | 66.7 | 11.2 |
| CAT-CNN-CCnet (ours) | 65.1 | 10.2 |
Table 2.
Visual Climate Analysis subsystem: performance benchmark.
| Method | Accuracy (%) |
|---|---|
| Proposed [71] | 75.31 |
| 3D DenseNet-201 | 72.12 |
| 3D ReseNet-101 | 72.00 |
Table 3.
The downstream regressor performance benchmark (T = 5 days).
| Method | Accuracy (%) |
|---|---|
| Proposed | 94.11 |
| Proposed with MLP | 89.22 |
| Proposed with LSTM | 90.11 |
| Proposed with LSTM-A | 91.98 |
Disclaimer/Publisher’s Note: The statements, opinions and data contained in all publications are solely those of the individual author(s) and contributor(s) and not of MDPI and/or the editor(s). MDPI and/or the editor(s) disclaim responsibility for any injury to people or property resulting from any ideas, methods, instructions or products referred to in the content. |
© 2023 by the authors. Licensee MDPI, Basel, Switzerland. This article is an open access article distributed under the terms and conditions of the Creative Commons Attribution (CC BY) license (https://creativecommons.org/licenses/by/4.0/).
Share and Cite
MDPI and ACS Style
Giaconia, C.; Chamas, A. Innovative Out-of-Stock Prediction System Based on Data History Knowledge Deep Learning Processing. Computation 2023, 11, 62. https://doi.org/10.3390/computation11030062
AMA Style
Giaconia C, Chamas A. Innovative Out-of-Stock Prediction System Based on Data History Knowledge Deep Learning Processing. Computation. 2023; 11(3):62. https://doi.org/10.3390/computation11030062
Chicago/Turabian StyleGiaconia, Concetta, and Aziz Chamas. 2023. "Innovative Out-of-Stock Prediction System Based on Data History Knowledge Deep Learning Processing" Computation 11, no. 3: 62. https://doi.org/10.3390/computation11030062
Note that from the first issue of 2016, this journal uses article numbers instead of page numbers. See further details here.