Article

Artificial Intelligence Model Based on Grey Clustering to Access Quality of Industrial Hygiene: A Case Study in Peru

by
Alexi Delgado
1,*,
Ruth Condori
2,
Miluska Hernández
2,
Enrique Lee Huamani
3 and
Laberiano Andrade-Arenas
4
1
Mining Engineering Section, Pontificia Universidad Católica del Perú, Lima 15023, Peru
2
Faculty of Environmental Engineering, Universidad Nacional de Ingeniería, Lima 15012, Peru
3
Image Processing Research Laboratory, Universidad de Ciencias y Humanidades, Lima 15304, Peru
4
Systems Engineering Program, Universidad Privada Norbert Wiener, Lima 15046, Peru
*
Author to whom correspondence should be addressed.
Computation 2023, 11(3), 51; https://doi.org/10.3390/computation11030051
Submission received: 21 October 2022 / Revised: 8 January 2023 / Accepted: 15 January 2023 / Published: 3 March 2023
(This article belongs to the Section Computational Engineering)

Abstract

:
Industrial hygiene is a preventive technique that tries to avoid professional illnesses and damage to health caused by several possible toxic agents. The purpose of this study is to simultaneously analyze different risk factors (body vibration, lighting, heat stress and noise), to obtain an overall risk assessment of these factors and to classify them on a scale of levels of Unacceptable, Not recommended or Acceptable. In this work, an artificial intelligence model based on the grey clustering method was applied to evaluate the quality of industrial hygiene. The grey clustering method was selected, as it enables the integration of objective factors related to hazards present in the workplace with subjective employee evaluations. A case study, in the three warehouses of a beer industry in Peru, was developed. The results obtained showed that the warehouses have an acceptable level of quality. These results could help industries to make decisions about conducting evaluations of the different occupational agents and determine whether the quality of hygiene represents a risk, as well as give certain recommendations with respect to the factors presented.

1. Introduction

According to WHO, health risks in the workplace, including heat, noise, dust, hazardous chemicals, unsafe machinery, and psychosocial stress, cause occupational illnesses and can also aggravate or lead to other health problems [1]. Nowadays, the importance of safeguarding workers’ health and safety has been widely accepted within companies and institutions [2]. However, at a general level, there is no method that integrates the different types of risks, even though it is necessary to have indicators of health and safety management through comprehensive risk assessments; therefore, this paper proposes a model to integrate this risk by applying the grey clustering method [
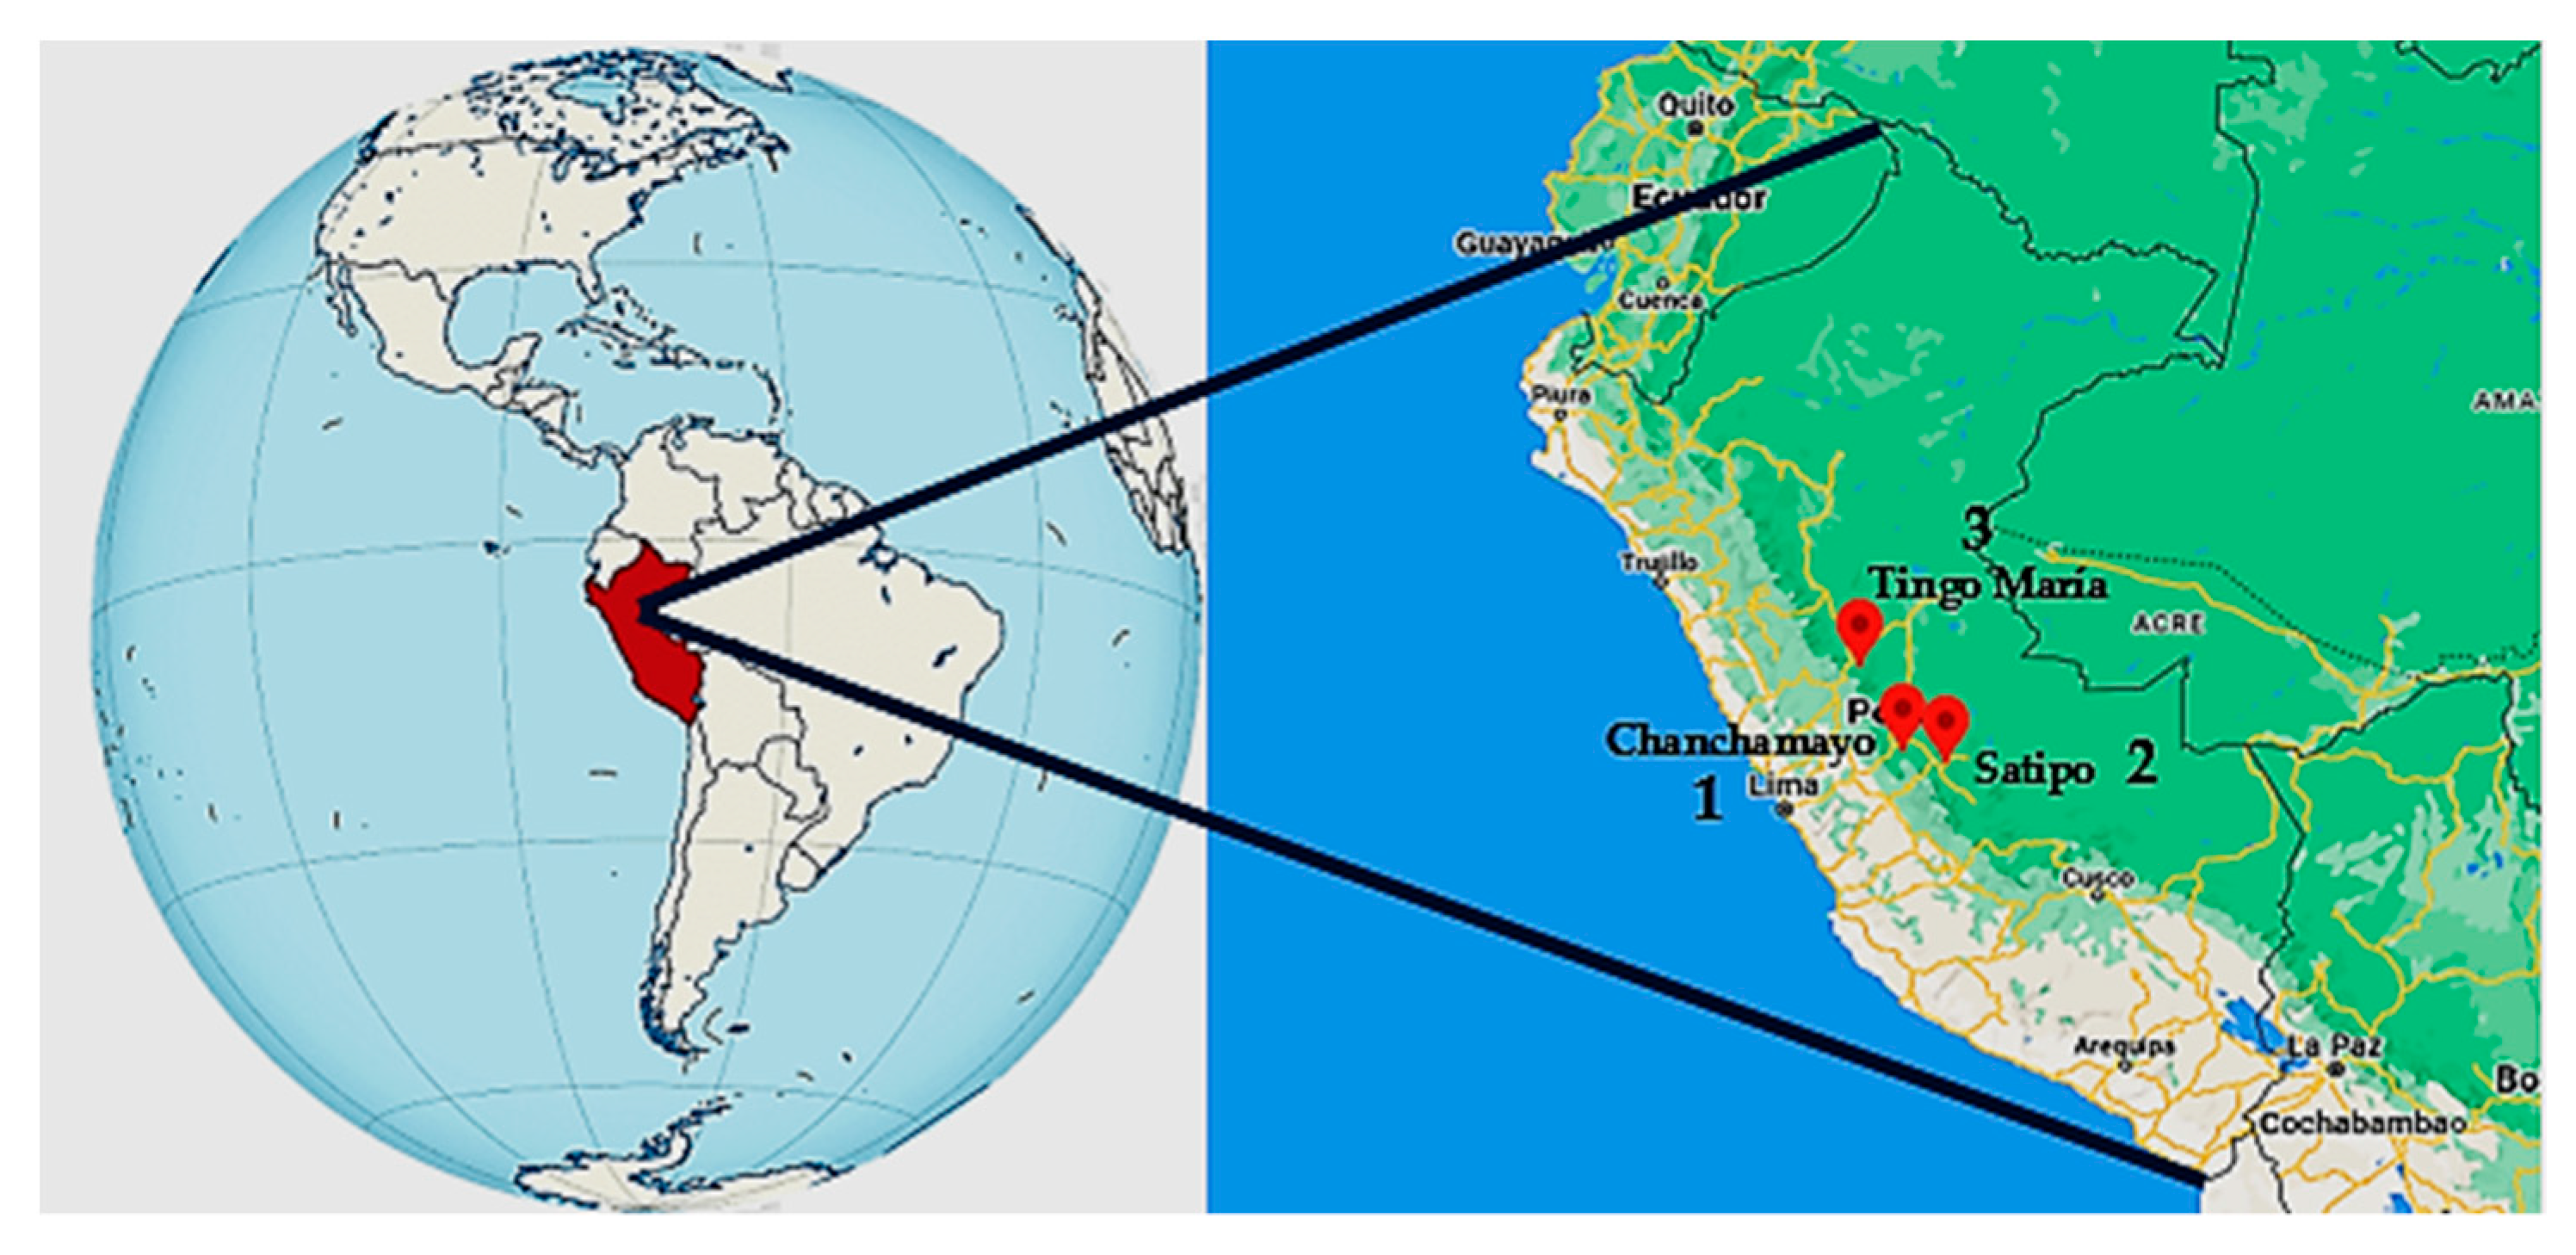
3]. In this sense, the present study evaluates the risk level of hygiene quality in three different contexts in Peru (Chanchamayo, Satipo and Tingo Maria), analyzing the warehouse area of a company from the beer sector. This company has three decentralized beer production plants which are allocated in the central region of Peru, in which the level of exposure to physical agents such as lighting, heat stress, noise and vibration are present during work activities.
In turn, there are approaches to access occupational risks, such as the Delphi method, as shown in work on occupational challenges [4], the AHP method, as shown in research work on a safety evaluation model [5], or the Fuzzy AHP method (FAHP), as shown in work on a two-dimensional fuzzy risk assessment model [6]. Among the methodological alternatives available to quantify the qualitative information during the occupational risk assessment, the grey clustering method is considered a good alternative, as it considers uncertainty in the analysis [7]. The grey clustering method is based on grey systems theory, which is an approach from artificial intelligence theory as shown by Liu and Lin in their work entitled Grey Systems Theory and Applications [8,9]. In addition, the grey clustering method was previously used in different areas such as industrial hygiene [3], social conflict [10], air pollution [11] and air quality [12]. In this work, the “Center-point Triangulation based on Whitenization Functions” (known as CTWF), which is an approach from the grey clustering method [7], was applied, since it is mainly applied to test if the study groups belong to predetermined classes known as grey classes [12] and can operate with a degree of uncertainty in circumstances where limited data are available [3].
In addition, the novelty of this work is the integration of industrial hygiene agents for the first time, which allows the building of an index to measure the quality of industrial hygiene management. Furthermore, from the computational point of view, this work uses an approach based on the grey systems theory that allows the considering of uncertainty within its analysis.
Hence, the specific objective in this work is to apply the grey clustering method in the integral risk assessment of three warehouses of a beer industry in Peru to better understand the scenario and give the recommendations accordingly, regarding the control measures. In addition, the level of risk for each agent is analyzed to obtain an overall risk assessment of these factors.
This work is organized as follows: Section 2 presents the methodology, followed by Section 3 in which the case study is developed. Section 4 provides the results and discussion, and finally Section 5 evidences the conclusions.

2. Methodology

In this section, the grey clustering method is explained according to its different steps; it is important to highlight that this methodology was developed to classify observation groups into definable classes, and can be performed by means of whitenization functions [13]. Such functions are mainly used to check whether the observation groups belong to predetermined classes, and conclusions based on this cognitive certainty could be more reliable [12].
The CTWF method can be described as follows: first it is necessary to assume that there are a set of n groups ( i = 1 , 2 , , n ) , a set of m criteria j = 1 , 2 , , m ,   and a set of s grey classes k = 1 , 2 , , s   according to the sample value x i j = i = 1 , 2 , , n ; j = 1 , 2 , , m , and then the steps of the CTWF method can be developed as follows [13]:

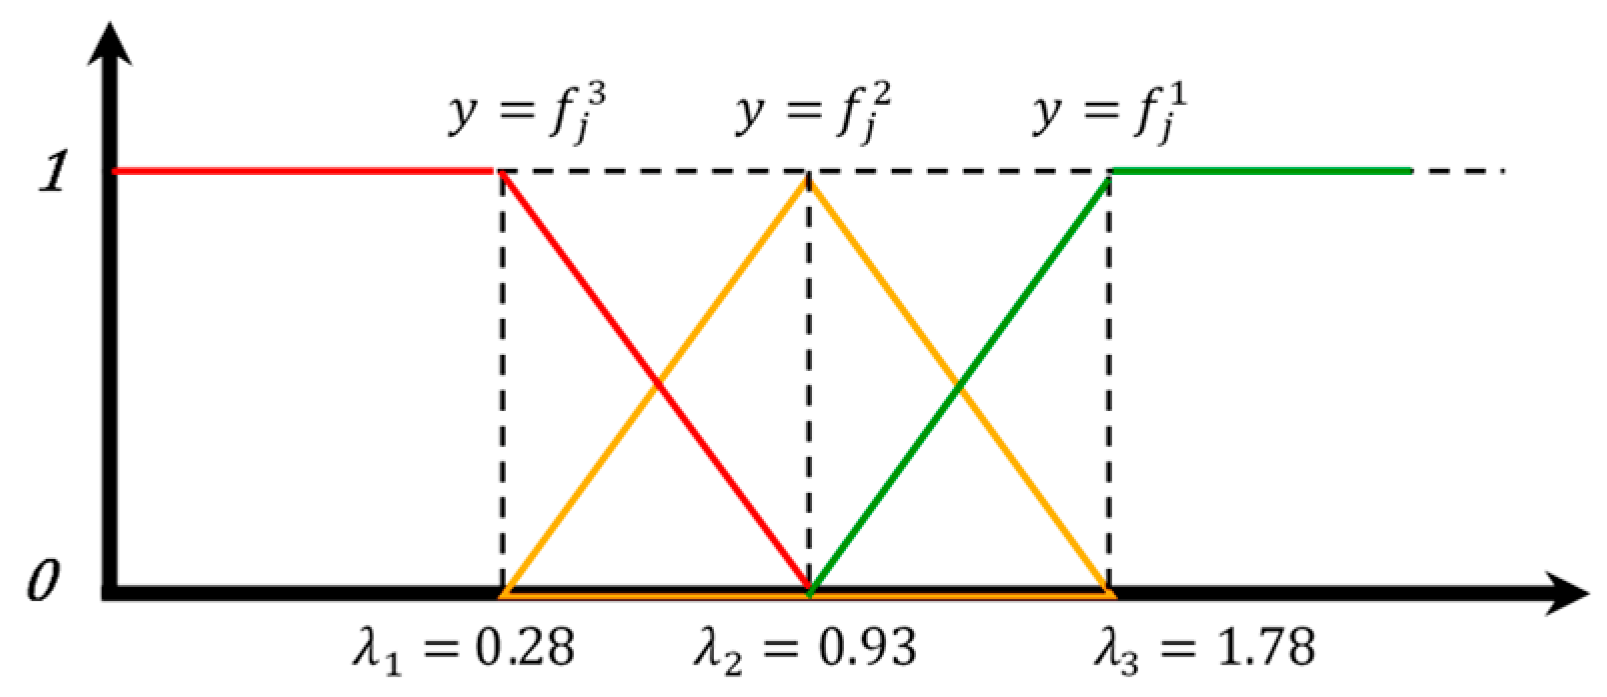
2.1. Determination of Central Points

The intervals of the criteria are divided into s grey classes, and then their center-points λ1, λ2,…, λS are determined from the standard data.

2.2. Dimensionless

The standard data are dimensioned using the arithmetic mean of the central points (λ1, λ2,…, λS) found in step 1 of each criterion j (j = 1, 2, ..., m); then, each central point λS of each criterion is divided by its respective mean, which is calculated using (1).
  λ j k = λ s 1 s s = 1 s λ s

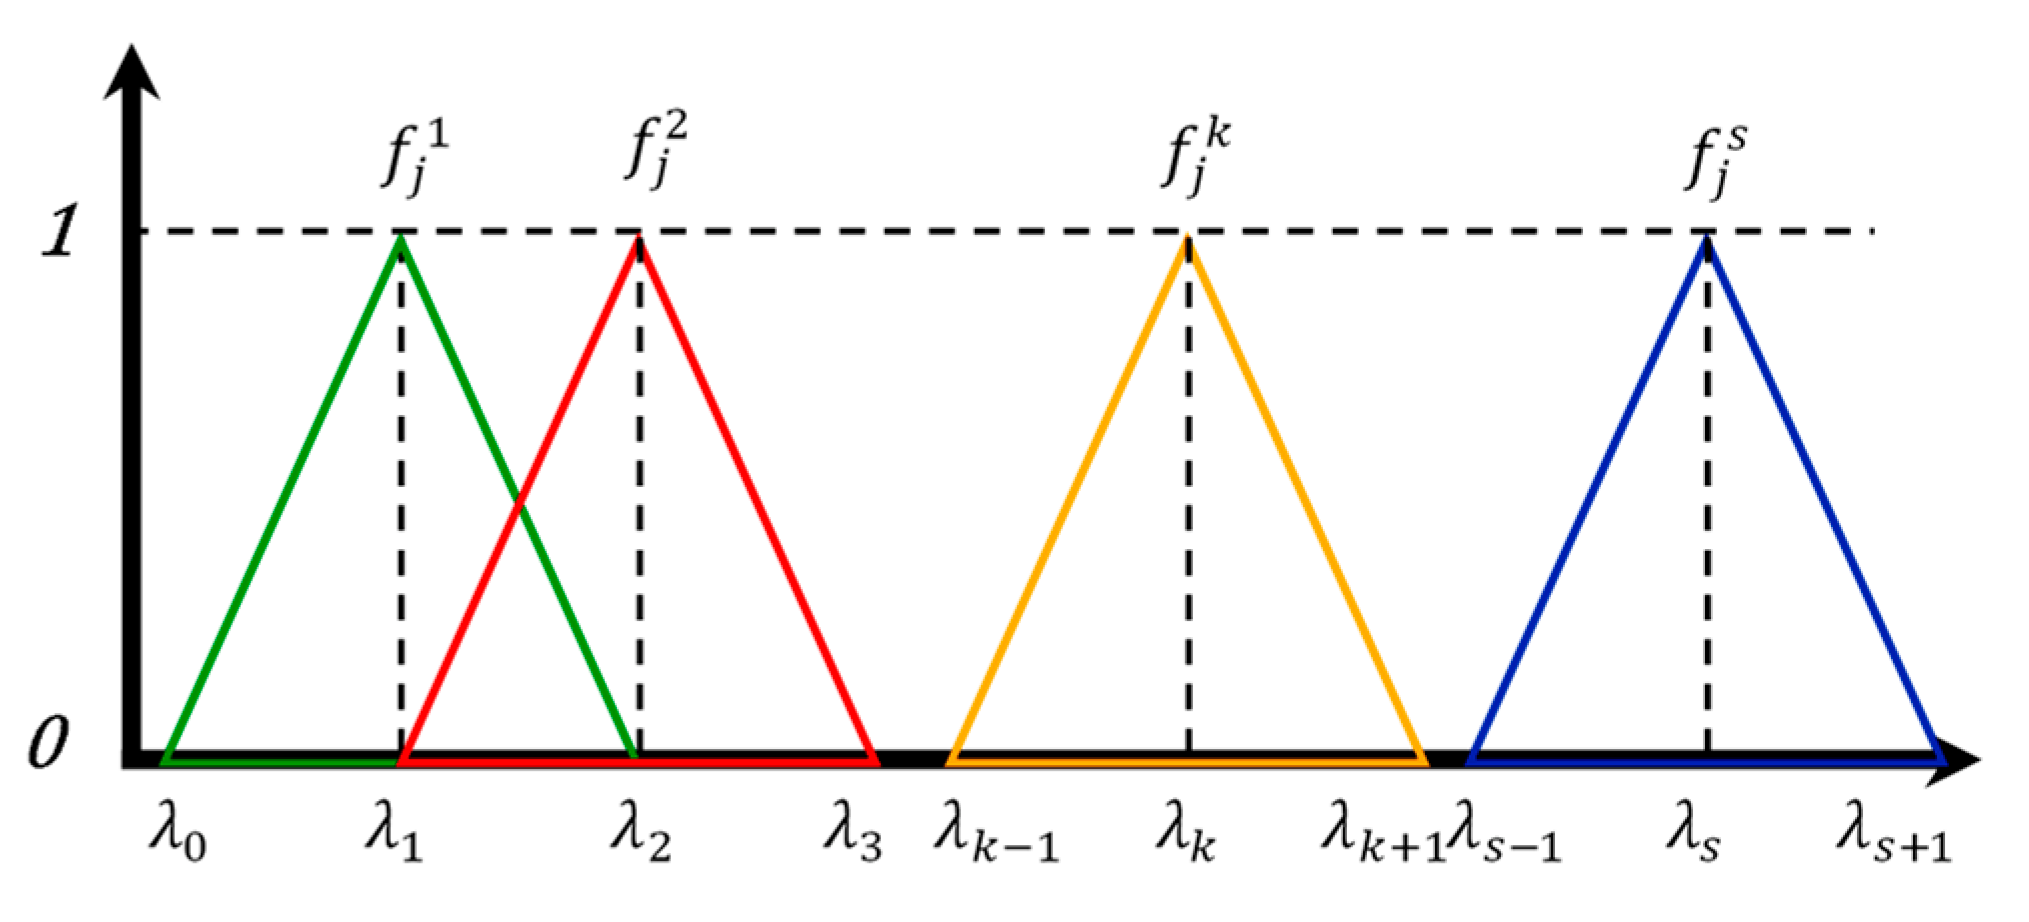
2.3. Whitenization Functions and Their Values Determination

The grey classes are expanded in two directions, adding the grey classes 0   and s + 1 with their center-points λ 0 and   λ s + 1 , respectively. Thus, the new sequence of center-points is   λ 0 , λ 1 , λ 2   λ s , λ s + 1 , (see details in Figure 1).
For the k t h grey class, k = 1 , 2 , , s , of the j t h criterion,   j = 1 , 2 , , m , for an observed value x i j , the CTWF is calculated by (2).
f j k = 0 ;   x     λ k 1 ,   λ k + 1 x λ k 1 λ k λ k 1 ;   x     λ k 1 ,   λ k λ k + 1 x λ k + 1 λ k ;   x   λ k ,   λ k + 1

2.4. Weight of the Criteria Determination

The weight of the criteria is determined by the harmonic mean; first, the inverse of the standard dimensionless data must be determined and divided by the sum of the inverses found, as shown in (3).
n j k = 1 λ j k j = 1 m 1 λ j k  

2.5. Determination of the Clustering Coefficient

The comprehensive clustering coefficient σ i k for group i, in which   i = 1 , 2 n , in the grey class   k ,   k = 1 , 2 s , is calculated by (4).
  σ i k = j = 1 n f j k x i j · n j  
where f j k x i j is the CTWF of the   k t h   grey class of the j t h   criterion, and 𝓃 j is the weight of criterion   j [7].

2.6. Analysis of Results Using the Maximum Clustering Coefficient

After calculating σ i k , the maximum grey cluster coefficient is determined using (5) [14].
  σ k * = max σ k   f o r   1 K s
If   max 1 k s σ i k = σ i k * , it is decided that group   i belongs to grey class k * . When there are several groups in grey class k * , these groups can be ordered according to the magnitudes of their comprehensive clustering coefficients [13].

3. Case Study

The focus of the study is the maneuvering yards of the warehouses in three locations (Chanchamayo, Satipo and Tingo Maria) that belong to a company that has several decentralized beer production plants, which operate according to the standards defined by its integrated management system policy. Within these warehouses, workers are exposed to various physical agents. Figure 2 shows the location of the departments where the headquarters evaluated are located, and which belong to the brewery company, as previously mentioned.

3.1. Definition of Study Groups

During the implementation of the study, three different groups have been identified (n = 3), as can be seen in Table 1, in which the composition of these groups was determined according to the similarities found during the evaluation of the monitoring of the physical agent for all the warehouses of the brewery company.

3.2. Definition of Evaluation Criteria

The criteria for the case study were established considering the exposure of workers who are exposed to diverse physical agents and the characteristics of the work environment. These physical agent criteria are present in many work activities such as construction, industry, and research centers, as well as in the service sector. Therefore, four relevant criteria were identified (m = 4), as shown in Table 2.
Likewise, Table 3 shows the field values monitored in 2018 in the different study groups.

3.3. Definition of the Grey Classes

Three grey classes were established for the case study (s = 3). In order to find the ranges by level for each one of the criteria, the Maximum Allowable Limits (MEL) and the action level established in the Peruvian national standard R.M–375 [15] were taken into account. Therefore, those values that exceed the MEL were considered Unacceptable, while those between the MEL and the action level were considered Not Recommended, and finally, those values below the action level were considered Acceptable within the framework of the Peruvian national standard R.M–375. The criteria are shown in Table 4.

3.4. Calculations Using CTWF

3.4.1. Determination of Central Points

From Table 4, the central point of each grey class is calculated according to Section 2.1. The results are presented in Table 5.

3.4.2. Dimensionless

To dimensionless the standard data values and sample values, (1) was used. The results are presented in Table 6 and Table 7.

3.4.3. Whitenization Functions and Their Values Determination

From the data in Table 6, the whitenization functions were constructed. As an example, the graph of the function for the first criterion C1 is shown in Figure 3.
As an illustration for the criterion C1 shown in the first row of Table 6   j = 1 , the central points considered are   λ 1 = 0.28 , λ 2 = 0.93 and   λ 3 = 1.78 . These values are substituted in (2) with the purpose of obtaining the CTWF of the three grey classes. The results of the functions for the first criterion C1 are shown in (6)–(8).
  f j 1 = 0 ;   x     0 ;   0.93 x 0.93 1.78 0.93 ;   x     0.93 ;   1.78 1 ;   x   1.78 ;   +
f j 2 = 0 ;   x     0 ;   0.28     1.78   ; + x 0.28 0.93 0.28 ;   x 0.28 ;   0.93 1.78 x 1.78 0.93 ;   x 0.93 ;   1.78
f j 3 = 1 ;   x     0 ;   0.28 0.93 x 0.93 0.28 ;   x     0.28 ;   0.93 0 ;   x   0.93 ;   +
The other parameters or criteria functions are developed following the same procedure as above. Consequently, the values of the functions evaluated in the different study groups are presented in Table 8.

3.4.4. Weight of the Criteria Definition

From Table 6, the inverses of the non-dimensional values of the standard data are obtained; such values are displayed in Table 9.
Then, the criteria were weighted by the harmonic mean using (3); the values are shown in Table 10.

3.4.5. Determination of the Clustering Coefficient

The clustering coefficient σ i k was calculated for each study group using (4). The values of σ i k obtained for groups G1, G2 and G3 are shown in Table 11.

3.4.6. Analysis of Results Using the Maximum Clustering Coefficient

Equation (5) was used to calculate the maximum clustering coefficient for each criterion. The values are represented in Table 12.
From the data obtained in Table 12, the values of the maximum σ i k are shown for each group with its respective grey class. The values are shown in Table 13.
Then, in Table 14, the maximum σ i k of each criterion for each one of the study groups is presented; in the same way, in Table 15, the value of the grey classes of each criterion for each group is given.

4. Results and Discussion

The results and discussion are presented below.

4.1. About the Case Study

First, Figure 4, which was constructed from Table 13, shows that the level of hygiene of the three analyzed groups is acceptable. In the same way, the Tingo Maria store (G3) is the most outstanding in terms of hygiene quality and is above the other stores due to its high level of performance.
Second, Table 15 shows the behavior of the criteria for groups G1, G2 and G3. For group G1 all criteria are in the range of “Acceptable”, while for the group G2 the criteria C2 and C3 are in the range of “Not recommended”, and C1 and C4 are in the range of “Acceptable”. Finally, for group G3, which was the warehouse that stood out for its hygienic quality, C3 is in the range of “Not recommended”, while C1, C2 and C4 are in the range of “Acceptable”. In addition, the evaluation of criterion C2 (Lighting), group G2 (Satipo’s warehouse), presents a level “Not Recommended”; this is because, according to the results obtained, in the warehouse area it was evident that 83% of the points evaluated during the night do not meet the recommendations in the MR 375-2008-TR [16]. On the other hand, regarding the evaluation of criteria C3 (Heat stress), the groups G2 (Tingo Maria) and G3 (Satipo’s store) present a level of “Not recommended”. This could be due to the fact that during the “Loading and unloading” activity within this warehouse, a TGBHe of 28.12 °C and 27.96 °C, respectively, was recorded, which does not exceed the permissible limit (29.5 °C) but does exceed the action level (27.5 °C); therefore, it requires an action to be taken, but not immediately.
In addition, the vibration levels (C1) are acceptable for the operators of each of the three warehouses studied. However, several methodologies could have been applied for this criterion, such as in a research study conducted by Petré F. et al. [17], which used the ISO 2631 methodology for the assessment of whole-body vibration in workers operating vehicles. Nevertheless, the application of ISO 2631 methodology does not quantify the risk, but only discriminates the most obvious cases of low risk, medium risk, and high risk; therefore, the advantage of the grey clustering method used in the present study is emphasized, as this method quantifies the risk level.
Regarding the lighting criterion (C2), the lighting level was deficient for Satipo’s warehouse. In order to solve this fact, the study carried out by Kapliienko O. et al. [18] mentioned how the lighting level in warehouses could be improved, since they propose to implement virtual reality in order to make lighting designs in warehouses to provide better visibility to the operators.
For the heat stress criterion (C3), it was found that the heat stress levels are not recommended for the workers of two of the warehouses as evaluated with the grey clustering methodology. Therefore, the study conducted by S. Srivastava, Y. K Anand and V. Soamidas [19] proposes the implementation of a system design to reduce the risk of heat stress, whose system will have artificial neural networks (ANN) as a model free of estimators to evaluate the discomfort perceived by workers for different combinations of proposals at work.
Finally, for the evaluation of the noise criterion (C4), this paper found that the levels for this agent are acceptable according to the evaluation already performed by the grey clustering method. In the paper by D. P. Martins and M. S. Alencar [20], the authors use the mathematical logarithm model to predict the behavior of the measured noise, and thus identify which frequencies are harmful to human health according to the MTE regulations (Brazil). This model could complement our analysis of research work, identifying which sources are harmful to the health of workers who work within these areas and adjusting the parameters to the regulations of the country.

4.2. About the CTWF Method

Due to its simple construction, the CTWF method is one of the most used methods in occupational risk assessments [13]. However, its simple design is also its disadvantage, as to determine the cumulative value individual factors are classified into qualitative measures, thereby making significant simplifications that may give a misleading picture of the resultant risk of individual hazards. This is noted by both practitioners and theoreticians of occupational safety, who search for ways to formalize the process of estimating the level of occupational risk and formulate general recommendations for the entire process of risk analysis and assessment [3].
In addition, the method enables the integration of objective factors related to hazards present in the workplace with subjective employee evaluations. The main advantage of the method is the ability to combine objective (measurable) factors with subjective factors (qualitative, related to expert judgment) in the risk assessment process [3,21]. Moreover, Table 16 provides a comparison between the grey clustering method and other methodologies for a better appreciation of its advantages and disadvantages according to four different methodologies: the grey clustering method, the Delphi Method, the AHP Method, and the FAHP Method [22].

4.3. About the Control Proposals

Taking as reference Table 15 and considering the criteria with results Not recommended, the following control proposals are considered:

4.3.1. Control Proposal for Lighting Criteria (C2)

For the Satipo warehouse (G2), a perform corrective maintenance is recommended, increasing the number of lamps in areas of pedestrian traffic and forklift traffic. As shown in Figure 5, the installation of asymmetrical projectors is recommended for the better use of the luminous flux. It is also recommended to replace the forklift headlights with ones with a higher luminous flux (the luminous flux information is provided by the manufacturer in the technical data sheets).

4.3.2. Control Proposal for Heat Stress Criterion (C3)

For the warehouses of Satipo (G2) and Tingo Maria (G3), the recommendations area:
First, a work regime/rest area: It is recommended to rest in cool places when the temperature increases. Likewise, there should be considerations in case the personnel feel sick, as they should stop their activity and rest in a cool place in conditions below 25 °C or in thermal comfort until they recover, as continuing to work can put their health at risk.
Second, rehydration: Workers should be provided with fresh water to enjoy constant rehydration that allows them to continue with their activities without affecting their physical health. In addition, it is recommended to inform and train the workers about the risks, effects, and preventive measures against thermal stress in a consistent manner. The aim is for workers to be able to recognize the first symptoms of heat illness in themselves and in their colleagues for proper prevention. Likewise, the aim is to ensure the surveillance of the workers’ health and to suggest training exercises and adequate nutrition to prevent being overweight, and to spread the importance of the use of sunscreen.

5. Conclusions

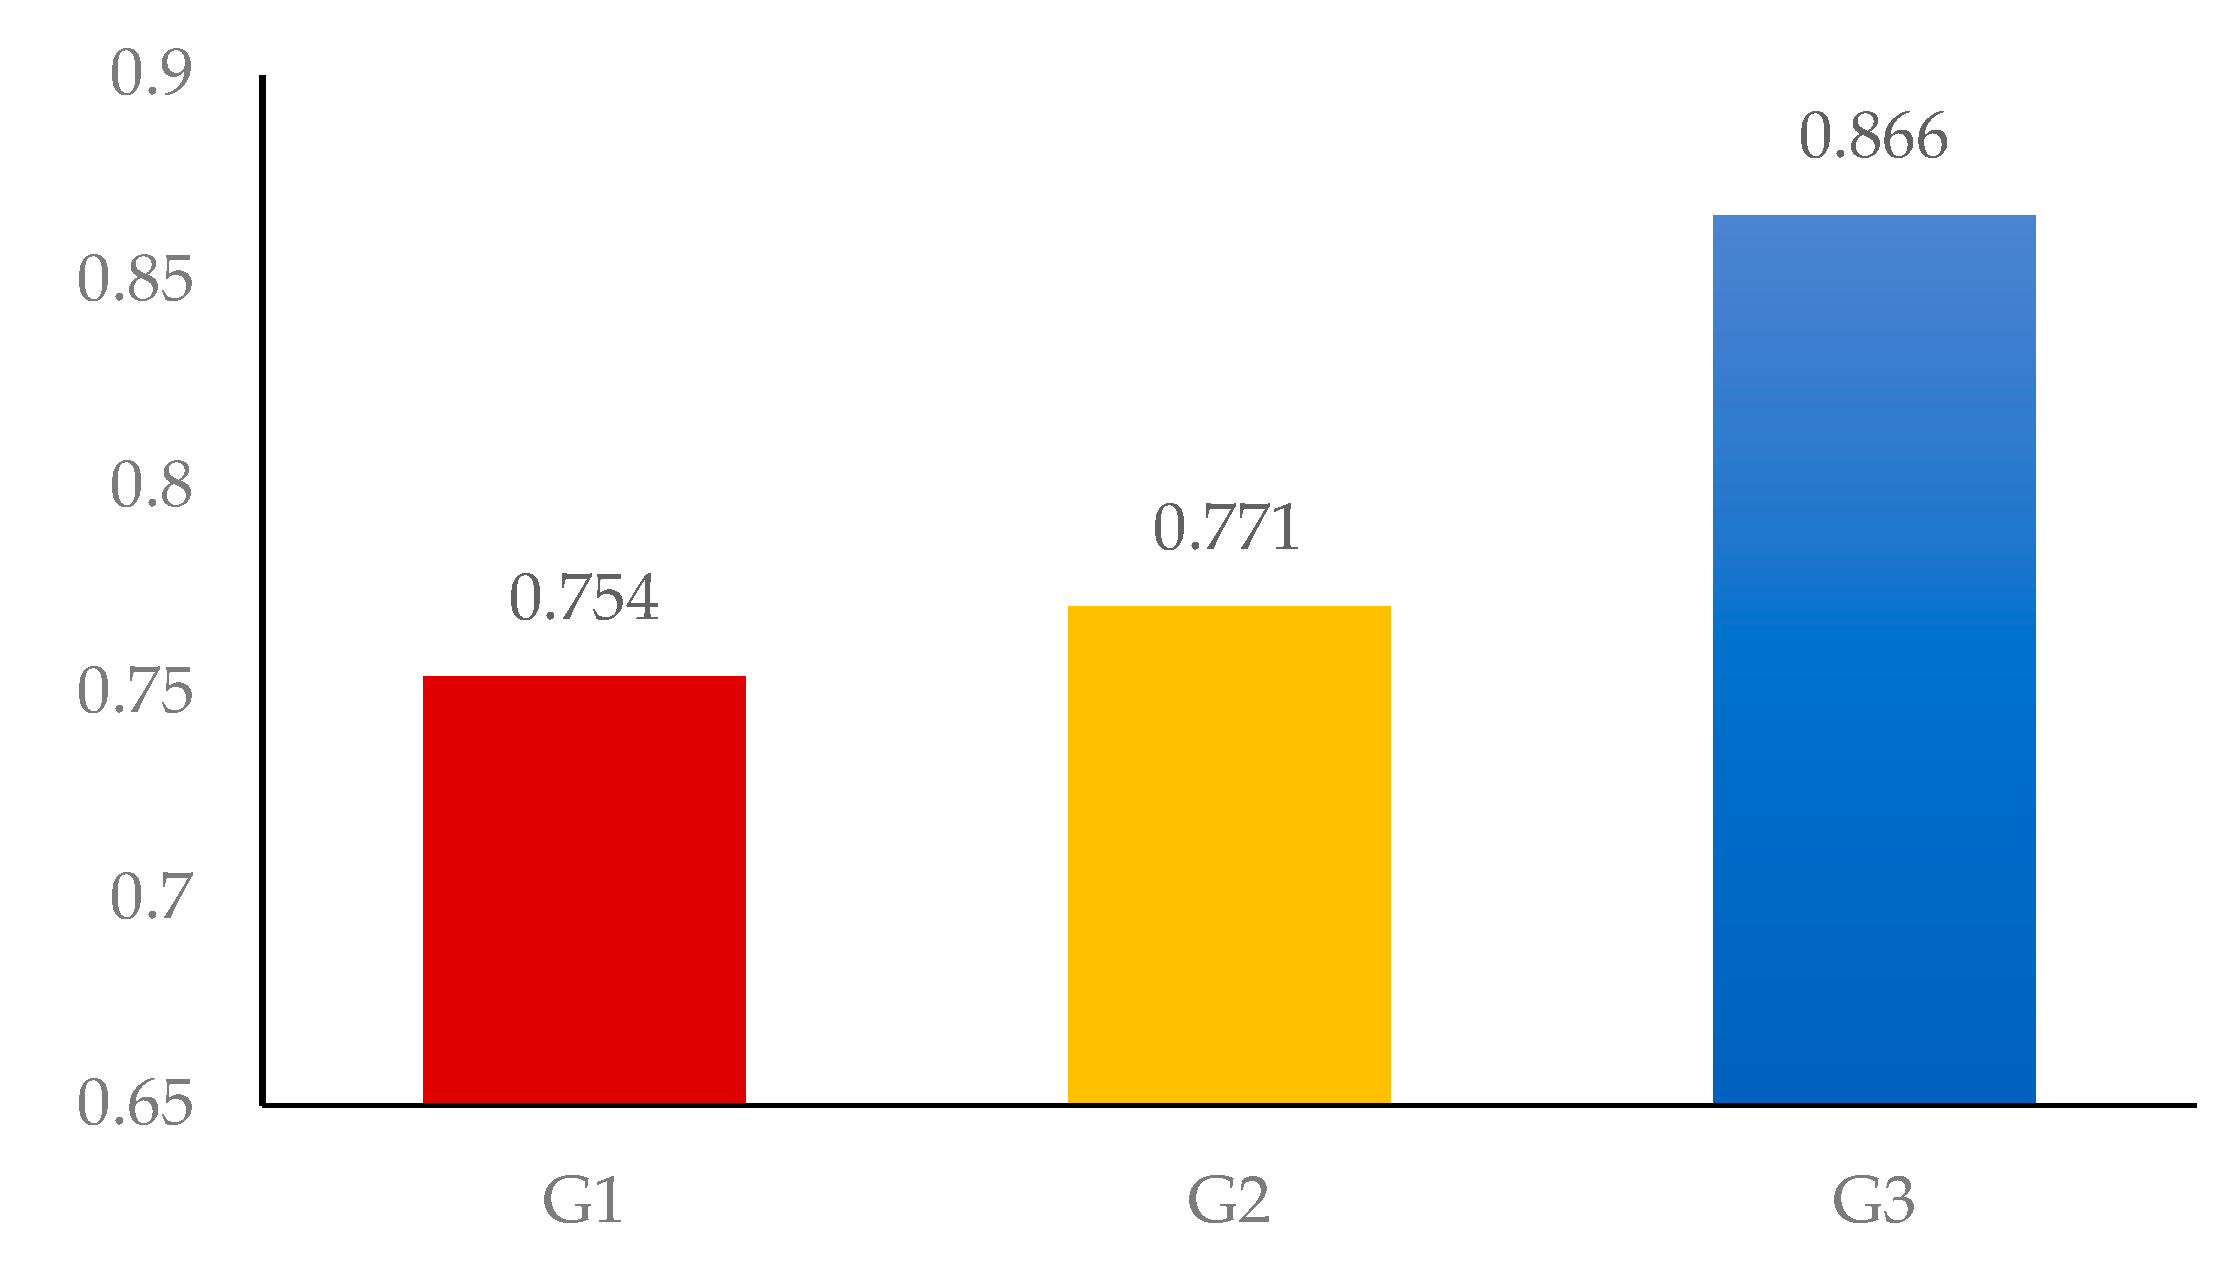
In this work, the Tingo Maria warehouse presented a higher acceptable risk level than the levels of the other warehouses (Chanchamayo and Satipo), which also resulted in an acceptable risk level. Therefore, it is concluded that workers on average are not affected by these risks, but it was observed in the results that in the Satipo warehouse the level of lighting and thermal stress is not recommended, as well as in Tingo Maria. The method used in this work shown its usefulness and flexibility to be applied to other types of research problems
In the study, the grey clustering method was applied, which proved to be effective since it allowed us to have a comprehensive global risk that allows us to evaluate safety management and has an advantage over the AHP or Delphi methods as it considers uncertainty within its analysis. In addition, this methodology allows us to use several criteria, which can be established by grey classes to determine the impact of the risk level for each criterion.
Finally, the CTWF method could be applied to analyze other types of research or cases that have a high level of uncertainty, such as the analysis of psychosocial risk, social conflicts, educational problems, technological impact problems, etc. It could also be applied to other industry sectors such as hydrocarbons, mining, manufacturing, etc., which will help prevent those risks that threaten the health of the worker. In addition, the grey clustering method could be applied, using more classification grades to better address the severity of the risks.

Author Contributions

Conceptualization, A.D., R.C. and M.H.; methodology, A.D., R.C., M.H., E.L.H. and L.A.-A.; software, R.C. and M.H.; validation, A.D., R.C., M.H., E.L.H. and L.A.-A.; formal analysis, A.D., R.C., M.H., E.L.H. and L.A.-A.; investigation, A.D., R.C., M.H., E.L.H. and L.A.-A.; resources, A.D., R.C., M.H., E.L.H. and L.A.-A.; data curation, A.D., R.C., M.H., E.L.H. and L.A.-A.; writing—original draft preparation, A.D., R.C., M.H., E.L.H. and L.A.-A.; writing—review and editing, A.D.; visualization, A.D., R.C., M.H., E.L.H. and L.A.-A.; supervision, A.D.; project administration, A.D. All authors have read and agreed to the published version of the manuscript.

Funding

This research received no external funding.

Institutional Review Board Statement

Not applicable.

Informed Consent Statement

Not applicable.

Data Availability Statement

Not applicable.

Conflicts of Interest

The authors declare no conflict of interest.

References

  1. Chumachenko, D.; Meniailov, I.; Bazilevych, K.; Chumachenko, T.; Yakovlev, S. Investigation of Statistical Machine Learning Models for COVID-19 Epidemic Process Simulation: Random Forest, K-Nearest Neighbors, Gradient Boosting. Computation 2022, 10, 86. [Google Scholar] [CrossRef]
  2. Kumar, S.A.; Kumar, H.; Dutt, V.; Soni, H. Self-health analysis with two step histogram based procedure using machine learning. In Proceedings of the 3rd International Conference on Intelligent Communication Technologies and Virtual Mobile Networks, ICICV 2021, Tirunelveli, India, 4–6 February 2021; pp. 794–799. [Google Scholar] [CrossRef]
  3. Nowak, M.; Mierzwiak, R.; Butlewski, M. Occupational risk assessment with grey system theory. Cent. Eur. J. Oper. Res. 2020, 28, 717–732. [Google Scholar] [CrossRef] [Green Version]
  4. Pamidimukkala, A.; Kermanshachi, S. Occupational Challenges of Women in Construction Industry: Development of Overcoming Strategies Using Delphi Technique. J. Leg. Aff. Disput. Resolut. Eng. Constr. 2023, 15, 04522028. [Google Scholar] [CrossRef]
  5. Ji, L.X.; Kun, S.J.; Liu, Q.; Lin, T.X.; Hao, L.; Xingqin, L.; Jian, L. Research on safety evaluation model of drilling operation based on AHP-BP. In Proceedings of the 2020 International Conference on Urban Engineering and Management Science, ICUEMS 2020, Zhuhai, China, 24–26 April 2020; pp. 639–641. [Google Scholar] [CrossRef]
  6. Yakut, M.; Kaya, I.; Bozkus, E. A Two-Dimensional Fuzzy Risk Assessment Model for Occupational Health and Safety Evaluations. In Proceedings of the HORA 2022—4th International Congress on Human-Computer Interaction, Optimization and Robotic Applications, Proceedings, Ankara, Turkey, 9–11 June 2022. [Google Scholar] [CrossRef]
  7. Liu, S.; Lin, Y. Grey Systems: Theory and Applications; Springer: Berlin/Heidelberg, Germany, 2011; Volume 68. [Google Scholar] [CrossRef]
  8. Liu, S.; Yi, J.; Forrest, L. Grey Systems: Theory and Applications; Springer: Berlin/Heidelberg, Germany, 2014. [Google Scholar]
  9. Martínez-García, A.N. Artificial Intelligence for Sustainable Complex Socio-Technical-Economic Ecosystems. Computation 2022, 10, 95. [Google Scholar] [CrossRef]
  10. Delgado, A.; Romero, I. Applying the Grey Systems Theory to Assess Social Impact from an Energy Project. In Proceedings of the 2018 IEEE XXV International Conference on Electronics, Electrical Engineering and Computing (INTERCON), Lima, Peru, 8–10 August 2018; pp. 1–4. [Google Scholar] [CrossRef]
  11. Fahim, W.A.; Sarkar, P.R.; Tonmoy, S.S.; Pranto, A.R.; Islam, M.A.; Khatun, T. Smart environmental solution for modern urbanization using mobile application. In Proceedings of the 3rd International Conference on Intelligent Communication Technologies and Virtual Mobile Networks, ICICV 2021, Tirunelveli, India, 4–6 February 2021; pp. 104–112. [Google Scholar] [CrossRef]
  12. Delgado, A.; Montellanos, P.; Llave, J. Air quality level assessment in Lima city using the grey clustering method. In Proceedings of the IEEE ICA-ACCA 2018—IEEE International Conference on Automation/23rd Congress of the Chilean Association of Automatic Control: Towards an Industry 4.0—Proceedings, Concepcion, Chile, 17–19 October 2018. [Google Scholar] [CrossRef]
  13. Delgado, A.; Romero, I. Environmental conflict analysis on a hydrocarbon exploration project using the Shannon entropy. In Proceedings of the 2017 Electronic Congress, E-CON UNI 2017, Lima, Peru, 22–24 November 2017; pp. 1–4. [Google Scholar] [CrossRef]
  14. Delgado, A.; Aguirre, A.; Palomino, E.; Salazar, G. Applying triangular whitenization weight functions to assess water quality of main affluents of Rimac river. In Proceedings of the 2017 Electronic Congress, E-CON UNI 2017, Lima, Peru, 22–24 November 2017; pp. 1–4. [Google Scholar] [CrossRef]
  15. Ministerio de Trabajo y Promoción del Empleo. Resolución Ministerial N° 375-2008-TR—Normas y Documentos Legales—Ministerio de Trabajo y Promoción del Empleo—Gobierno del Perú. 2008. Available online: https://www.gob.pe/institucion/mtpe/normas-legales/394457-375-2008-tr (accessed on 12 September 2022).
  16. Suzuki, T.; Chauvicourt, F.; Fujimoto, H. High-bandwidth suspension resonance analysis of in-wheel motor vehicle using multibody dynamics. In Proceedings of the 2021 IEEE International Conference on Mechatronics, ICM 2021, Kashiwa, Japan, 7–9 March 2021. [Google Scholar] [CrossRef]
  17. Petré, F.; Bouwens, F.; Gillijns, S.; Massé, F.; Engels, M.; Gyselinckx, B.; Vanstechelman, K.; Thomas, C. Wireless vibration monitoring on human machine operator. In Proceedings of the 2010 17th IEEE Symposium on Communications and Vehicular Technology in the Benelux, SCVT2010, Enschede, The Netherlands, 24–25 November 2010. [Google Scholar] [CrossRef]
  18. Kapliienko, O.; Tabunshchyk, S.; Tabunshchyk, G.; Kapliienko, T.; Sylenko, S. Virtual Reality Implementation for Design of Warehouse Lighting. In Proceedings of the 2019 10th IEEE International Conference on Intelligent Data Acquisition and Advanced Computing Systems: Technology and Applications, IDAACS 2019, Metz, France, 18–21 September 2019; Volume 2, pp. 969–973. [Google Scholar] [CrossRef]
  19. Srivastava, S.; Anand, Y.K.; Soamidas, V. Reducing the risk of heat stress using artificial neural networks based job-combination approach. In Proceedings of the IEEM 2010—IEEE International Conference on Industrial Engineering and Engineering Management, Macao, China, 7–10 December 2010; pp. 542–546. [Google Scholar] [CrossRef]
  20. Martins, D.P.; Alencar, M.S. A new approach to noise measurement and analysis in an industrial facility. In Proceedings of the Conference Record—IEEE Instrumentation and Measurement Technology Conference, Montevideo, Uruguay, 12–15 May 2014; pp. 964–967. [Google Scholar] [CrossRef]
  21. Szpak, D.; Tchórzewska-Cieślak, B. The Use of Grey Systems Theory to Analyze the Water Supply Systems Safety. Water Resour. Manag. 2019, 33, 4141–4155. [Google Scholar] [CrossRef] [Green Version]
  22. Delgado, A.; Flor, H. Selection of the best air purifier system to urban houses using AHP. In Proceedings of the 2017 CHILEAN Conference on Electrical. Electronics Engineering, Information and Communication Technologies, CHILECON 2017—Proceedings, Pucon, Chile, 18–20 October 2017. [Google Scholar] [CrossRef]
Figure 1. Center-point triangulation based on whitenization functions (CTWF).
Computation 11 00051 g001
Figure 2. Location of the headquarters for the evaluation of hygiene quality of the beer company, presented in the following order: Chanchamayo (1), Satipo (2), Tingo Maria (3).
Computation 11 00051 g002
Figure 3. Representation of the whitenization functions for criterion 1 (C1).
Computation 11 00051 g003
Figure 4. Results for each group.
Computation 11 00051 g004
Figure 5. Difference between an asymmetric and a symmetric projector representation.
Computation 11 00051 g005
Table 1. Groups in the case study.
LocationNomenclatureDescription
ChanchamayoG1The headquarters is located in the Urb. San. Carlos, La Merced.
SatipoG2The headquarters is located on the Rio Negro marginal highway, Satipo.
Tingo MariaG3The headquarters is located on the road Fernando Belaunde Terry—Naranjillo.
Table 2. Criteria in the case study.
CriterionNomenclature
Whole-Body Vibration (m/s2)C1
Lighting (lux)C2
Heat Stress (°C)C3
Noise (dB)C4
Table 3. Actual sampling data.
CriterionChanchamayoSatipoTingo Maria
C10.4950.00320.0006
C2241628
C325.7228.1227.96
C471.572.473
Table 4. Grey classes for each criterion in the case study.
CriterionGrey Classes
UnacceptableNot RecommendedAcceptable
C12–1.151.15–0.50.5–0
C20–1010–2020–30
C332.5–29.529.5–27.527.5–24.5
C4140–8585–8282–65
Table 5. Standard data midpoints.
Criterion f j 1 f j 2 f j 3
UnacceptableNot RecommendedAcceptable
C11.5750.8250.25
C251525
C33128.526
C4112.583.573.5
Table 6. Dimensionless values of the standard data.
Criterion f j 1 x f j 2 x f j 3 x
C11.780.930.28
C20.3311.67
C31.0910.91
C41.250.930.82
Table 7. Dimensionless values of the sampling data.
CriterionG1G2G3
C10.5600.00360.0007
C21.6001.0671.867
C30.9020.9870.981
C40.7960.8060.813
Table 8. Values of the functions evaluated in the groups.
Chanchamayo (G1)
Grey ClassC1C2C3C4
f j 1 x 0000
f j 2 x 0.430.1000
f j 3 x 0.570.9011
Satipo (G2)
Grey ClassC1C2C3C4
f j 1 x 0000
f j 2 x 00.90.860
f j 3 x 10.10.141
Tingo Maria (G3)
Grey ClassC1C2C3C4
f j 1 x 0000
f j 2 x 000.790
f j 3 x 110.211
Table 9. Inverse of standard data.
Criterion f j 1 x f j 2 x f j 3 x
C10.561.073.53
C23.001.000.60
C30.921.001.10
C40.801.081.22
Sum5.284.156.45
Table 10. Weight values for each criterion.
Criterion f j 1 x f j 2 x f j 3 x
C10.110.260.55
C20.570.240.09
C30.170.240.17
C40.150.260.19
Table 11. Values of the clustering coefficients in the respective groups.
Chanchamayo (G1)
CriterionC1C2C3C4 σ i k
f j 1 x 00000.000
f j 2 x 0.430.10000.136
f j 3 x 0.570.90110.754
Satipo (G2)
CriterionC1C2C3C4 σ i k
f j 1 x 00000.000
f j 2 x 00.90.8600.423
f j 3 x 10.10.1410.771
Tingo Maria (G3)
CriterionC1C2C3C4 σ i k
f j 1 x 00000.000
f j 2 x 000.7900.190
f j 3 x 110.2110.866
Table 12. Inverse of standard data.
GroupsUnacceptableNot RecommendedAcceptable max σ i k
f j 1 x f j 2 x f j 3 x
G10.0000.1360.7540.754
G20.0000.4230.7710.771
G30.0000.1900.8660.866
Table 13. Level of maximum clustering coefficients in the respective groups.
Groups σ i k Level
G1Chanchamayo0.754Acceptable
G2Satipo0.771Acceptable
G3Tingo Maria0.866Acceptable
Table 14. Level of maximum clustering coefficients by criteria for each group.
GroupsC1C2C3C4
G10.570.911
G210.90.861
G3110.791
Table 15. Quality level by criteria for each group.
GroupsC1C2C3C4
Vibration (m/s2)Lighting (lux)Heat Stress (°C)Noise (dB)
G1AcceptableAcceptableAcceptableAcceptable
G2AcceptableNot recommendedNot recommendedAcceptable
G3AcceptableAcceptableNot recommendedAcceptable
Table 16. Comparison of the grey clustering method with other methodologies.
MethodsComparison of Methodologies
AdvantagesDisadvantages
Delphi MethodExperts can argue their answers anonymously, and the opinion of a team of experts could be considered subjective but it is not arbitrary; therefore, the results are reliable, and Delphi can be considered as a complement to other methodologies.The use of a descriptive statistic in the treatment of the data diminishes its capacity of quantification; in addition, if many rounds are made, the experts tend to change their opinions.
AHP MethodThe use of evaluation criteria and the determination of weights for each criterion raises the level of objectivity of the evaluation with respect to Delphi; on the other hand, the relatively simple calculations make this method applicable to different case studies.Its relatively simple mathematical basis needs to be supplemented with other theories to become more objective.
FAHP MethodThe advantage of the FAHP method over AHP is that it raises the level of quantification because it uses fuzzy logic theory in the calculation process.It is important to take care in collecting the data from the experts, to have optimal results when applying the FAHP method. In many cases, there are no quantitative data available to facilitate the assessment of experts, which makes the assessment subjective, so it is necessary to previously perform a quantification of variables using the theory of grey systems.
Grey Clustering MethodTo have a good level of quantification by the application of grey systems in data processing, it incorporates the use of grey classes in each criterion to make the assessment, which allows a greater range of evaluation for experts and therefore facilitates the collection of information.Its simple design as to determining the cumulative value; individual factors are classified into qualitative measures, making important simplifications that can give a misleading picture of the resulting risk for individual hazards.
Disclaimer/Publisher’s Note: The statements, opinions and data contained in all publications are solely those of the individual author(s) and contributor(s) and not of MDPI and/or the editor(s). MDPI and/or the editor(s) disclaim responsibility for any injury to people or property resulting from any ideas, methods, instructions or products referred to in the content.

