Article

Crack Detection in an Aluminium Oxide Grinding Wheel by Impact Hammer Tests

Department of Mechanical & Material Engineering, Portland State University, 1930 SW 4th Ave., Suite 400, Portland, OR 97201, USA
*
Author to whom correspondence should be addressed.
Computation 2023, 11(3), 47; https://doi.org/10.3390/computation11030047
Submission received: 13 December 2022 / Revised: 14 February 2023 / Accepted: 20 February 2023 / Published: 28 February 2023

Abstract

:
Grinding is widely used as the last step of the manufacturing process when a good surface finish and precise dimensional tolerances are required. However, if the grinding wheels have cracks, they may lead to a hazardous working environment and produce poor tolerance in machined products. Therefore, grinding wheels should be inspected for cracks before being mounted onto the machine. In this study, a novel method of finding possible internal cracks in the aluminium oxide grinding wheel will be explored by examining the natural frequency and displacement of wheels using an impact hammer testing method. Grinding wheels were cracked into two segments using a three-point bend fixture and then bonded intentionally to simulate cracks. The impact hammer test indicated that cracks in the grinding wheels caused a drop in natural vibration frequency and an increase in the maximum displacement of the accelerometer sensors.

1. Introduction

Grinding is a common material-removing process used to obtain a good surface finish and precise dimensional tolerances. Therefore, it is important to select the proper grinding wheel to obtain these desired results [1]. Four common types of bonds are used to make grinding wheels: vitrified, resinoid, rubber, and metal. Among them, vitrified bonds are generally preferred since they can withstand the high temperatures caused by grinding operations [2]. Common abrasives are natural abrasives, silicon carbide, aluminium oxide, and cubic boron nitride.
The selection of a grinding wheel’s abrasive and bond material is usually based on the working material that is being machined. For instance, aluminium oxide abrasives are hard and brittle, thus are selected for grinding alloy steel in a soft or hardened condition. Silicon carbide abrasives are used for cast iron, non-ferrous metals, and non-metallic materials. Cubic boron nitride is a synthetic super abrasive used for grinding hardened steels and wear-resistant superalloys and is usually bonded using a metallic binder. It is noteworthy that aluminium oxide is the most commonly used abrasive, and is usually vitrified bonded into a wheel form.
Even if a grinding wheel is properly selected for a work material, it may not produce the desired geometry or surface finish when it has defects. Defects of the grinding wheel include wheel imbalance, improper dressing, cavities, waviness, or cracks that can result in vibrations and damage of the workpiece or spindle. Therefore, defect identification is necessary before mounting the grinding wheel on the grinder bench [2]. This paper will only focus on crack detection in grinding wheels.
Cracks in grinding wheels can occur due to manufacturing defects or mishandling of the grinding wheel. While external cracks in grinding wheels are visible to the naked eye, internal cracks are not. Moreover, if a crack is repaired by glueing the broken wheel back together, it may not be visible. In this paper, we will focus on crack detection in grinding wheels that are not visible on the wheel’s surface.
One common way to detect internal cracks in a grinding wheel is to perform audible ring testing. The United States Occupational Safety and Health Administration (OSHA) [3] recommends that grinding wheels should be ring tested before deploying in a grinding machine. Ring testing involves tapping the grinding wheel with the handle of a screwdriver to determine if the defects can be observed audibly. However, this method of testing may not detect some defects in grinding wheels.
When structures and systems are exposed to static and dynamic loads, they exhibit responses that may reveal the presence of cracks. Static deflection of an undamaged structure is expected to be less than one that has a crack, as the existence of a crack will reduce the stiffness of the structure. Dynamic testing can be made by tap testing the grinding wheel. Tap testing will reveal the mode shapes, natural frequency, and deformation pattern of the grinding wheel that cannot be observed in static testing. These frequencies and mode shapes can be used for troubleshooting and system problem-solving [4]. If the structure has defects, then the response of the structure will be different than one that was non-defective
The following literature shows that vibration analysis can be used to detect defects in a system. Lee et al. [5] explored defect detections in metallic objects by recognizing the fact that defects lead to changes in the natural resonant frequencies. Moreover, they found that defects cause shifts in the resonant frequencies of the metal parts. Jweeg et al. [6] investigated the relationship between natural frequency and defects in a shaft, and they found that increasing the depth of the cracks in the shaft leads to a decrease in the natural frequency. Tandon and Begin [7] performed impact hammer tests on a cast-steel component to investigate the variation in the natural frequency. They found that the natural frequency of a cast-steel decreases when it has porosity/inclusion. Thus, it can be used to determine defective cast-steel components. Kumar et al. [8] investigated the natural frequency response, using tan impact hammer, of undamaged and damaged gears, and they observed that the broken gear showed variation in the natural frequencies. Husain and Al-shammari [9] explored the effect of cracks on the natural frequencies of cylindrical shell structures. In addition, they found that cracks in the structure caused a decrease in the natural frequencies. Raikar [10] investigated cracks in the cantilever composite beam by impact hammer tests. They found that cracks in the structure caused a decrease in the natural frequencies. Similarly, Capozucca [11] studied undamaged and damaged carbon fibre-reinforced polymer beams by impact hammer tests, and found that as the damage in the CFRP cantilever beam increased, the natural frequencies decreased. Wang et al. [12] investigated the effect of fatigue damage in spot-welded joints in automotive galvanized low-carbon sheet steel on the natural frequencies by impact hammer testing. They found that fatigue damage in spot-welded joints dramatically decreased the primary natural frequency.
Fiks and Zora [13] made radial kerfs of different lengths along the radii of grinding wheels and found that the natural frequencies were influenced by defects that exist in the wheel. However, their radial kerfs were large and were an unrealistic representation of defects in grinding wheels.
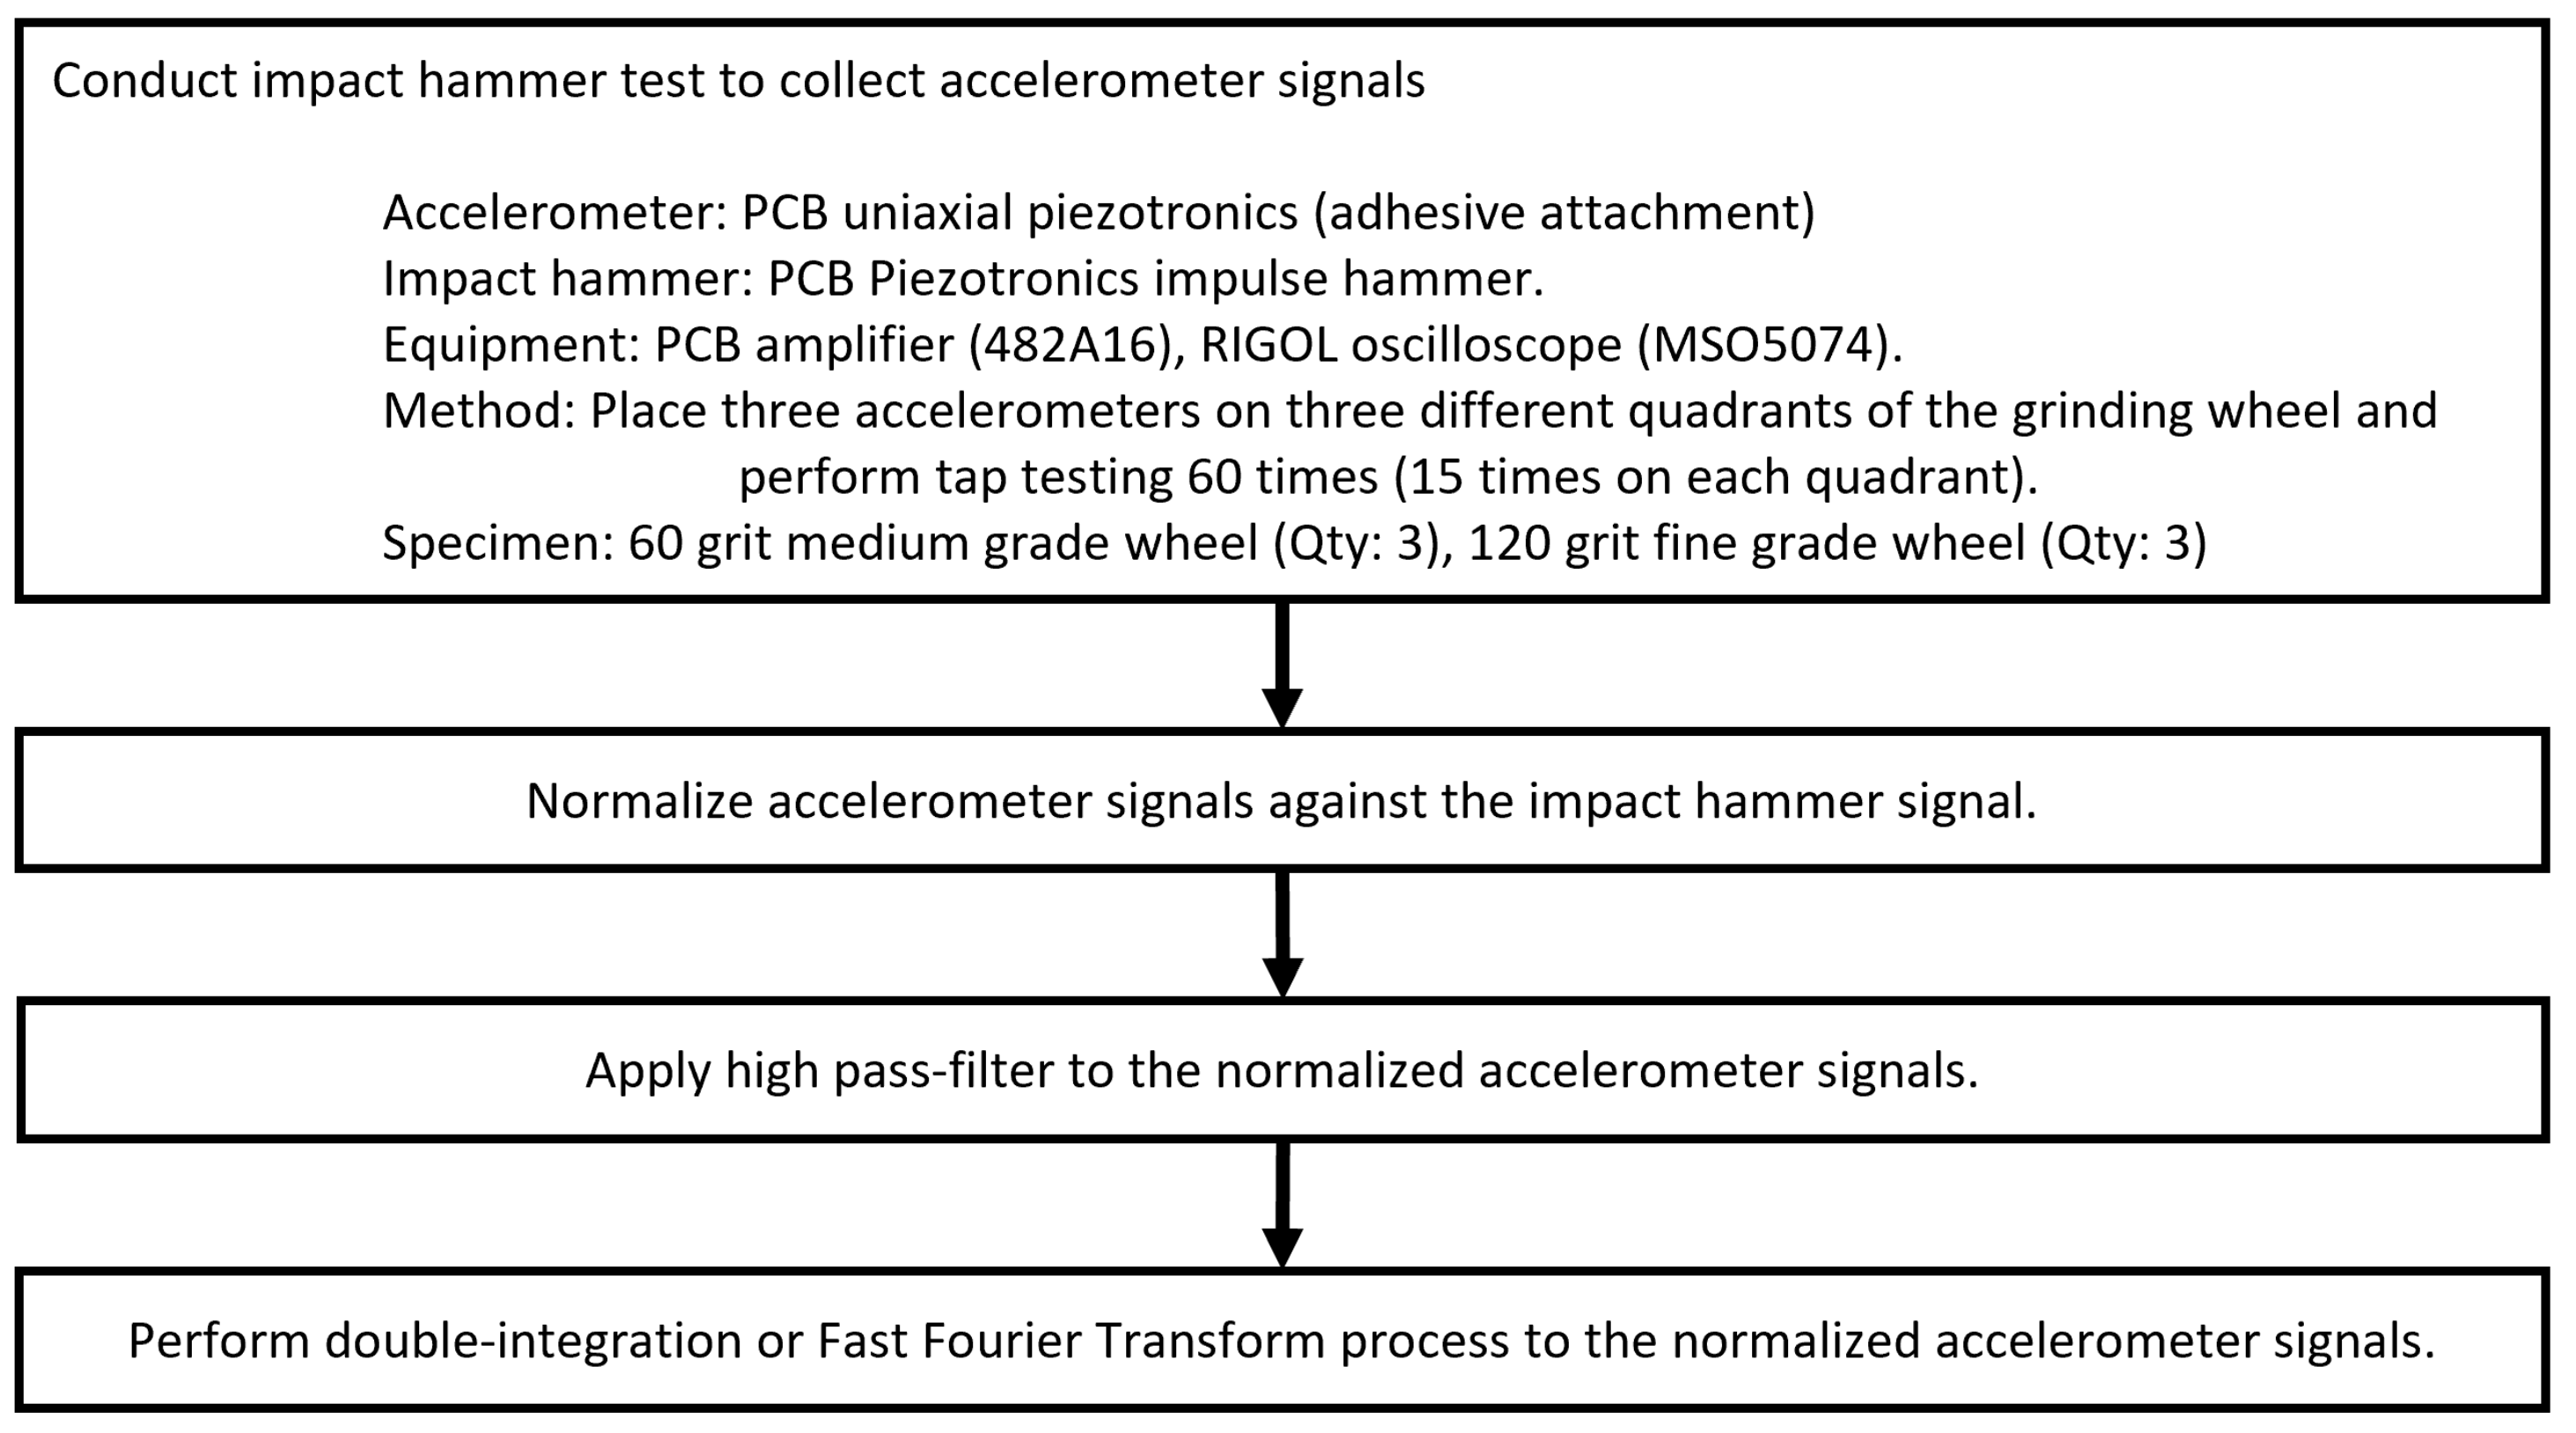
In this paper, we will focus on crack detection in grinding wheels that is not visible on the wheel’s surface. If defects are visible on the grinding wheel’s surface, it would not be put into service. In addition, cracks in grinding wheels that may not be detected by OSHA-recommended ring testing will require another method to detect them. Therefore, this study aims to assess the suitability of impact hammer testing to determine repaired cracks in aluminium oxide grinding wheels. Some commodity-grade wheels were deliberately cracked and glued back together to create internal flaws. Two different grit sizes were chosen to see if tap testing could detect the behavioural differences between the size of grits.

2. Materials and Methods

2.1. Materials

The experiments were conducted on two grades of aluminium oxide grinding wheels listed in Table 1.
Figure 1 illustrates how the two grades of wheels are prepared for testing; 3 aluminium oxide grinding wheels were prepared for each abrasive grit size (60 and 120 grits). To compare undamaged grinding wheels with cracked and glued grinding wheels, the grinding wheels were cracked using a three-point bend fixture and subsequently glued back together with the stated length of glue.

2.2. Grinding Wheel Cracking

The grinding wheels were cracked, as shown in Figure 2, using a three-point bend fixture in a 20 ton hydraulic load frame.
The load and deflection were monitored with a pressure gauge on the load frame hydraulic cylinder and a dial indicator on the wheel directly adjacent to the loading point. The loading points were 203 mm long by 19 mm diameter steel bars. The outer load points were 178 mm apart and the centre loading point was midway, 89 mm, between the two outer bars. The cracked wheels were glued either with 25 mm of glue radially or glued completely, as shown in Figure 3, so that we could determine the effect of the amount of glued surface in the vibrational response of the grinding wheel during impact hammer testing. In this study, a water-curing single part glue was used to bond the grinding wheel segments since it can bond the vitrified grinding wheels. After applying the glue, mechanical steel clamps were used to hold the wheels until the glue was set.

2.3. Ring Testing of Wheel

Following OSHA’s recommendation, ring testing is performed on all the tested wheels to determine if there was a difference in the audible ring tone. As shown in Figure 4, grinding wheels were suspended in the air, and then the audible ring test was performed using a screwdriver handle by gently tapping the grinding wheel to note the sound made by the handle.

2.4. Impact Hammer Test Setup

The grinding wheels were held on a fixture, as shown in Figure 4, suspending the wheel in the air to allow impact hammer testing with an impact hammer and three accelerometers placed around the wheel. The uniaxial accelerometers were placed on three different quadrants of the grinding wheel while taps were made around the wheel. The impact hammer test was performed using the PCB Piezotronics impulse hammer model 086c03 (with a mass of 100 g). The accelerometers were PCB Piezotronic (model 352C22) with a sensitivity of 10 mV/g, and a frequency range between 0.5 and 10,000 Hz. The accelerometer signals were conditioned using a PCB amplifier model 482A16. The accelerometers and impulse hammer signals were sampled with a RIGOL oscilloscope (MSO5074) at 1 MHz.
Figure 5 shows the placements of the accelerometers, and the wheel’s cracked direction is indicated by the black line drawn along the 1st and 3rd quadrants. The accelerometers were located on the 2nd, 3rd, and 4th quadrants, and 15 taps were made on each quadrant using the impulse hammer. To improve the consistency and reliability of the test, a total of 60 taps were made for each grinding wheel. The measurement direction of the accelerometer is along the direction of the cable shown in Figure 5.

2.5. Signal Processing

2.5.1. Displacement of the Wheel

Figure 6 shows how the signals were collected and processed. the accelerometer signals were normalized against the impact hammer signal, using MATLAB R2021a software, since the impact energy of the hammer may not be the same during testing. The normalized signals were then filtered with a high-pass filter of 0.5 Hz to match the operating range of 0.5 to 10,000 Hz of the accelerometer [14]. To obtain the displacement at the accelerometer location, s ( T ) , double integration of the measured acceleration, a ( t ) , was conducted using the integration time step of 10 6 seconds (the sampling frequency of accelerometers is 1 MHz) and it can be written as [15]:
s ( T ) = 0 T [ 0 t a ( t ) d t ] d t
where the initial displacement of accelerometer is zero.

2.5.2. Natural Frequency of the Grinding Wheel

Fast Fourier transform (FFT) was used, with MATLAB R2021a software, to transform the time domain signals obtained by the normalized accelerometers to the frequency domain to determine the grinding wheels frequency response. Equation (2) describes the Fourier transform [16].
S x ( f ) = + x ( t ) e j 2 π f t d t
where S x ( f ) , x ( t ) , t, j, and f represent the output, impulse response function, time, 1 , and frequency, respectively. The Fourier series expressed in discretized form is the Fast Fourier Transform as shown in Equation (3).
S x ( m Δ f ) Δ t n = 0 N 1 x ( n Δ t ) e j 2 π ( m Δ f ) ( n Δ t )
where m, Δ t , N, and Δ f represent a discrete point, sample interval, number of data points, and frequency resolution, respectively. The fast Fourier transform of the signals allows us to observe the resonant frequencies. Moreover, it can be used to determine the natural frequencies of the structure [4].

3. Result

3.1. Ring Testing

Ring testing performed on the undamaged or glued wheels had no audible difference indicating that the recommended OSHA tap testing method was not adequate in detecting this type of flaw. Thus, a better approach is needed to detect this type of flaw in grinding wheels.

3.2. Impact Hammer Test

Since cracks in a structure will result in changes in stiffness, defects in a grinding wheel will lead to changes in the measured displacement of the accelerometers [17]. Figure 7, Figure 8, Figure 9, Figure 10, Figure 11 and Figure 12 show the typical (a) measured acceleration and (b) computed displacement of the tested wheels. Figure 7 shows the response of a new intact 60-grit wheel, and Figure 8 and Figure 9 show the response of fully glued and 25 mm glued broken 60-grit wheels, respectively.
Summary of the displacements of the new, fully glued, and 25 mm glued 60-grit wheels, obtained from Equation (1), are listed in Table 2. It can be seen from Table 2 that the displacement of the wheel is dependent on the stiffness of the wheel. It is expected that the undamaged wheel is the stiffest, then the 25 mm glued wheel is the least stiff. This hypothesis was proven true in Table 2 that shows that the stiffer wheel has the least displacement. Also, the wheel bounced back (displaying positive displacement) after impact events, whereas the broken and glued wheels moved along the impact direction (negative displacement).
Similar acceleration and displacement for the 120-grit grinding wheels are shown in Figure 10, Figure 11 and Figure 12. Figure 10 shows the acceleration and computed displacement for the new wheel, while Figure 11 and Figure 12 show wheels that were fully glued and 25 mm glued.
Table 3 shows the compiled displacement for the 120-grit wheels. It was observed that the 120-grit wheels behaved like the 60-grit wheels, where the new wheel had greater stiffness and lower displacement, while the 25 mm glue wheel had the lowest stiffness and correspondingly highest displacement. The 120-grit wheels behaved like the 60-grit wheels where the new wheel had the bounce back phenomenon where the broken wheel’s displacement was in the impact direction.
Table 4 shows the average percentage increase in displacement of the repaired 60- and 120-grit grinding wheels compared to undamaged wheels of the same grit. It was observed that the displacement increased by 54% for a fully repaired 60-grit wheel as compared to an undamaged wheel. When the glue length was reduced to 25 mm, the average percentage increase in displacement went up to 64%. It was also observed that the 120-grit repaired wheel had a similar trend as the 60-grit repaired wheel, but it exhibited a greater displacement increase than the 60-grit wheel.
The Fast Fourier Transform (FFT) of the accelerometer signals allows us to observe the resonant frequencies of the wheel. Figure 13 shows the FFT of the typical signals for the hammer and accelerometers for the undamaged 60-grit wheel. Even though three accelerometers were placed at different distances from the tap hammer striking locations, the primary natural frequency of 2920 Hz was identically obtained from all three accelerometers for the undamaged 60-grit medium-grade wheel. It was also observed that accelerometer placement, relative to the crack location, did not have an influence on the computed natural frequency.
Figure 14 and Figure 15 show the typical FFT of the fully glued and 25 mm glued 60-grit wheel, respectively. When the wheel was fully glued, the natural frequency response of 2720 Hz was consistently measured by all three accelerometers. Moreover, on the 25 mm glued wheel, the primary natural frequency changed to 2470 Hz. The average natural frequencies are listed in Table 5. It can be seen that cracks on the wheel reduced the resonant frequency of the 60-grit wheel by over 200 Hz. Thus, it can be concluded that impact hammer testing can be used to detect defects of this type in the grinding wheel structure examining the natural frequency.
Figure 16, Figure 17 and Figure 18 show the typical results for the 120-grit wheels. A similar trend in the primary natural frequencies was observed for the 120-grit wheels. Figure 16 shows that the natural frequency of an undamaged 120-grit medium-grade wheel was 2770 Hz. When the wheel was repaired with an entire length of glue, as shown in Figure 17, the natural frequency changed to 2570 Hz. Concerning the 25 mm glued wheel, as shown in Figure 18, the primary natural frequency changed to 2550 Hz. A summary of the natural frequencies in the 120-grit wheels are listed in Table 6. Thus, it is evident that impact hammer testing can be used to detect changes in the structure of 120-grit grinding wheels. In addition, even though 60- and 120-grit wheels have similar dimensions, the differences in grit size and wheel hardness lead to a different primary natural frequency.
It is apparent from Table 5 and Table 6 that in both 60- and 120-grit wheels there is a clear trend of decreasing primary natural frequency because of cracks in the grinding wheels. These results agree with the findings of other studies, in which the primary natural frequency is reduced due to defects in the test subject.

4. Conclusions

The following conclusions were made in this study:
  • Audible ring testing, using a screwdriver handle, did not indicate a distinguishable sound difference between undamaged grinding wheels and grinding wheels that had been broken and glued back together. In future studies, the acoustic emission method can be used to scientifically quantify the possible difference in sound signals between undamaged, damaged, and repaired wheels.
  • Impact hammer tests of the undamaged 60- and 120-grit wheels showed that they had less displacement than repaired wheels. The average displacement of repaired wheel increased by more than fifty percent compared to undamaged wheel. It was also observed that the fully glued wheel had less deflection than one that was partially repaired. Moreover, the undamaged wheels had positive displacements, whereas the repaired wheels had negative displacements.
  • The impact hammer test, using a tap hammer with accelerometers, can be used to detect repaired cracks in a bonded grinding wheel as the repaired cracks manifest as a drop in the natural vibration frequency of the wheel. This was evident by the 200 Hz drop in the detected natural frequency of the repaired wheel when compared to the undamaged wheel.
  • The impact hammer test can be used to distinguish different grit sizes or wheel hardness of grinding wheels as they have different natural frequencies. This phenomenon was observed both in the natural frequency and displacement of the undamaged wheel. A future study could examine in more detail how tap testing can be used to identify different grit sizes or wheel bonding materials.
Thus, the impact hammer test is a suitable method to detect defects in vitrified grinding wheels.

Author Contributions

Conceptualization, C.W.; methodology, C.W. and D.T.; software, Y.L.; validation, D.T. and C.W.; formal analysis, Y.L.; investigation, D.T., D.D. and C.W.; resources, C.W.; data curation, Yubin Lee; writing—original draft preparation, Y.L. and D.D.; writing—review and editing, D.T. and C.W.; visualization, Y.L.; supervision, C.W.; project administration, C.W.; funding acquisition, C.W. All authors have read and agreed to the published version of the manuscript.

Funding

This research received no external funding.

Data Availability Statement

Not applicable.

Acknowledgments

Publication of this article in an open access journal was funded by the Portland State University Library’s Open Access Fund.

Conflicts of Interest

The authors declare no conflict of interest.

References

  1. Stephenson, D.A.; Agapiou, J.S. Metal Cutting Theory and Practice, 3rd ed.; CRC Press: New York, NY, USA, 2019; pp. 255–260. [Google Scholar]
  2. Oberg, E. Machinery’s Handbook: A Reference Book for the Mechanical Engineer, Designer, Manufacturing Engineer, Draftsman, Toolmaker, and Machinist, 29th ed.; Industrial Press: New York, NY, USA, 2012; pp. 1246–1248. [Google Scholar]
  3. 1926.303; Abrasive Wheels and Tools. Safety and Health Regulations for Construction. Occupational Safety & Health Administration (OSHA). U.S. Department of Labor: Washington DC, USA, 1926.
  4. Avitabile, P. Modal Testing: A Practitioner’s Guide, 1st ed.; Wiley: Hoboken, NJ, USA, 2018; pp. 6–89. [Google Scholar]
  5. Lee, C.S.; Kim, J.Y.; Kang, J. Development of the Natural Frequency Analysis System to Examine the Defects of Metal Parts. J. Sens. Sci. Technol. 2015, 24, 169–174. [Google Scholar] [CrossRef]
  6. Muhsin, J.J.; Salah, N.A.; Salah, K.M. Dynamic analysis of a rotating stepped shaft with and without defects. IOP Conf. Ser. Mater. Sci. Eng. 2020, 671, 012004. [Google Scholar]
  7. Tandon, K.N.; Begin, J. A study of variation in the natural frequency of steel castings containing porosity and inclusions. Appl. Acoust. 1990, 29, 219–227. [Google Scholar] [CrossRef]
  8. Kumar, N.M.S.; Kerur, M.R.H.; Khan, N.; Shashank, T.N. Vibration analysis of healthy and faulty gear of parallel shaft drive system. AIP Conf. Proc. 2022, 2463, 020055. [Google Scholar]
  9. Husain, M.A.; Al-shammari, M.A. Effect of Cracks on the Natural Frequency of Cylindrical Shell Structures. Eng. Technol. J. 2020, 38, 1808–1817. [Google Scholar] [CrossRef]
  10. Vader, S.S.; Raikar, V.A. Crack detection in composite cantilever beam by vibration analysis and numerical method. Int. Res. J. Eng. Technol. 2017, 4, 1776–1784. [Google Scholar]
  11. Capozucca, R. Vibration of CFRP cantilever beam with damage. Compos. Struct. 2014, 116, 211–222. [Google Scholar] [CrossRef]
  12. Wang, R.-J.; Shang, D.-G.; Li, L.-S.; Li, C.-S. Fatigue damage model based on the natural frequency changes for spot-welded joints. Int. J. Fatigue 2008, 30, 1047–1055. [Google Scholar] [CrossRef]
  13. Fiks, W.; Zora, A. Grinding wheels defects detection using natural vibration analysis. Diagnostyka 2009, 2, 50. [Google Scholar]
  14. Introduction to Shock. Vibration Response Spectra. Available online: https://endaq.com/pages/introduction-to-shock-vibration-response-spectra (accessed on 8 January 2022).
  15. Thong, Y.K.; Woolfson, M.S.; Crowe, J.A. Numerical double integration of acceleration measurements in noise. Measurement 2004, 36, 73–92. [Google Scholar] [CrossRef]
  16. Nussbaumer, H.J. The Fast Fourier Transform. In Fast Fourier Transform and Convolution Algorithms, 1st ed.; Springer: Berlin/Heidelberg, Germany, 1981; pp. 8–111. [Google Scholar]
  17. Montalvao, D. A review of vibration-based structural health monitoring with special emphasis on composite materials. Shock Vib. Dig. 2006, 38, 295–324. [Google Scholar] [CrossRef]
Figure 1. Grinding wheel test materials.
Computation 11 00047 g001
Figure 2. Three-point bending fixture to crack the grinding wheels.
Computation 11 00047 g002
Figure 3. Glued segments of the grinding wheel.
Computation 11 00047 g003
Figure 4. Test fixture to suspend the grinding wheel.
Computation 11 00047 g004
Figure 5. Measurement setup for impact hammer testing.
Computation 11 00047 g005
Figure 6. Accelerometer signal processing procedure.
Computation 11 00047 g006
Figure 7. Typical acceleration and displacement of the new 60 grit wheel.
Computation 11 00047 g007
Figure 8. Typical acceleration and displacement results of the fully glued 60 grit wheel.
Computation 11 00047 g008
Figure 9. Typical acceleration and displacement results of the 25 mm glued 60 grit wheel.
Computation 11 00047 g009
Figure 10. Typical acceleration and displacement of the new 120 grit wheel.
Computation 11 00047 g010
Figure 11. Typical acceleration and displacement results of the fully glued 120 grit wheel.
Computation 11 00047 g011
Figure 12. Typical acceleration and displacement results of the 25 mm glued 120 grit wheel.
Computation 11 00047 g012
Figure 13. Typical natural frequency result of the new 60 grit wheel.
Computation 11 00047 g013
Figure 14. Typical natural frequency result of the fully glued 60 grit wheel.
Computation 11 00047 g014
Figure 15. Typical natural frequency result of the 25 mm glued 60 grit wheel.
Computation 11 00047 g015
Figure 16. Typical natural frequency result of the new 120 grit wheel.
Computation 11 00047 g016
Figure 17. Typical natural frequency result of the fully glued 120 grit wheel.
Computation 11 00047 g017
Figure 18. Typical natural frequency result of the 25 mm glued 120 grit wheel.
Computation 11 00047 g018
Table 1. Specifications of the aluminium oxide wheels used in this study.
Outer diameter (mm)203.2203.2
Inner diameter (mm)2525
GradeMediumFine
Abrasive grit size (line/25 mm)60120
HardnessMK
Thickness (mm)2525
Abrasive typeBrown aluminium oxideWhite aluminum oxide
Porosity (structure)55
Bond typeVitrifiedVitrified
Table 2. Average and maximum displacement results of 60-grit medium-grade wheels after 60 impact hammer tests.
Absolute Maximum Displacement (mm)
New 60-grit wheelAccelerometersAverageSTDV
1230.03880.0115
0.04450.03240.0396
Fully glued 60-grit wheelAccelerometersAverageSTDV
1230.05990.0140
0.07180.05470.0532
25 mm glued 60-grit wheelAccelerometersAverageSTDV
1230.06350.0145
0.07520.06170.0536
Table 3. Average and maximum displacement results of the 120-grit medium-grade wheels after 60 impact hammer tests.
Absolute Maximum Displacement (mm)
New 120-grit wheelAccelerometerAverageSTDV
1230.02350.0143
0.02920.02500.0164
Fully glued 120-grit wheelAccelerometerAverageSTDV
1230.04320.0224
0.05080.03730.0416
25 mm glued 120-grit wheelAccelerometerAverageSTDV
1230.05070.020
0.06990.04780.0345
Table 4. Grinding wheel average increase in displacement compared to the undamaged wheel (%).
Grinding WheelIncrease in Displacement Compared to Undamaged Wheel (%)
60-grit fully glued54
60-grit 25 mm glue64
120-grit fully glued84
120-grit 25 mm glue116
Table 5. Average and primary natural frequency of 60-grit medium-grade wheels after 60 impact hammer tests.
Grinding WheelPrimary and Average Natural Frequency (Hz)
New 60-grit wheel2920
Fully glued 60 grit wheel2720
25 mm glued 60-grit wheel2470
Table 6. Average and primary natural frequency of 120-grit medium-grade wheels after 60 impact hammer tests.
Grinding WheelPrimary and Average Natural Frequency (Hz)
New 120-grit wheel2770
Fully glued 120-grit wheel2570
25 mm glued 120-grit wheel2550
Disclaimer/Publisher’s Note: The statements, opinions and data contained in all publications are solely those of the individual author(s) and contributor(s) and not of MDPI and/or the editor(s). MDPI and/or the editor(s) disclaim responsibility for any injury to people or property resulting from any ideas, methods, instructions or products referred to in the content.

