

An Intelligent Boosting and Decision-Tree-Regression-Based Score Prediction (BDTR-SP) Method in the Reform of Tertiary Education Teaching


Abstract
:1. Introduction
2. Related Work
2.1. Study of Education Data Dimensions
2.2. Prediction Model of Education Field
2.3. High-Dimensional Small Sample Data Processing
3. A Challenging Prediction Problem
4. Materials and Methods
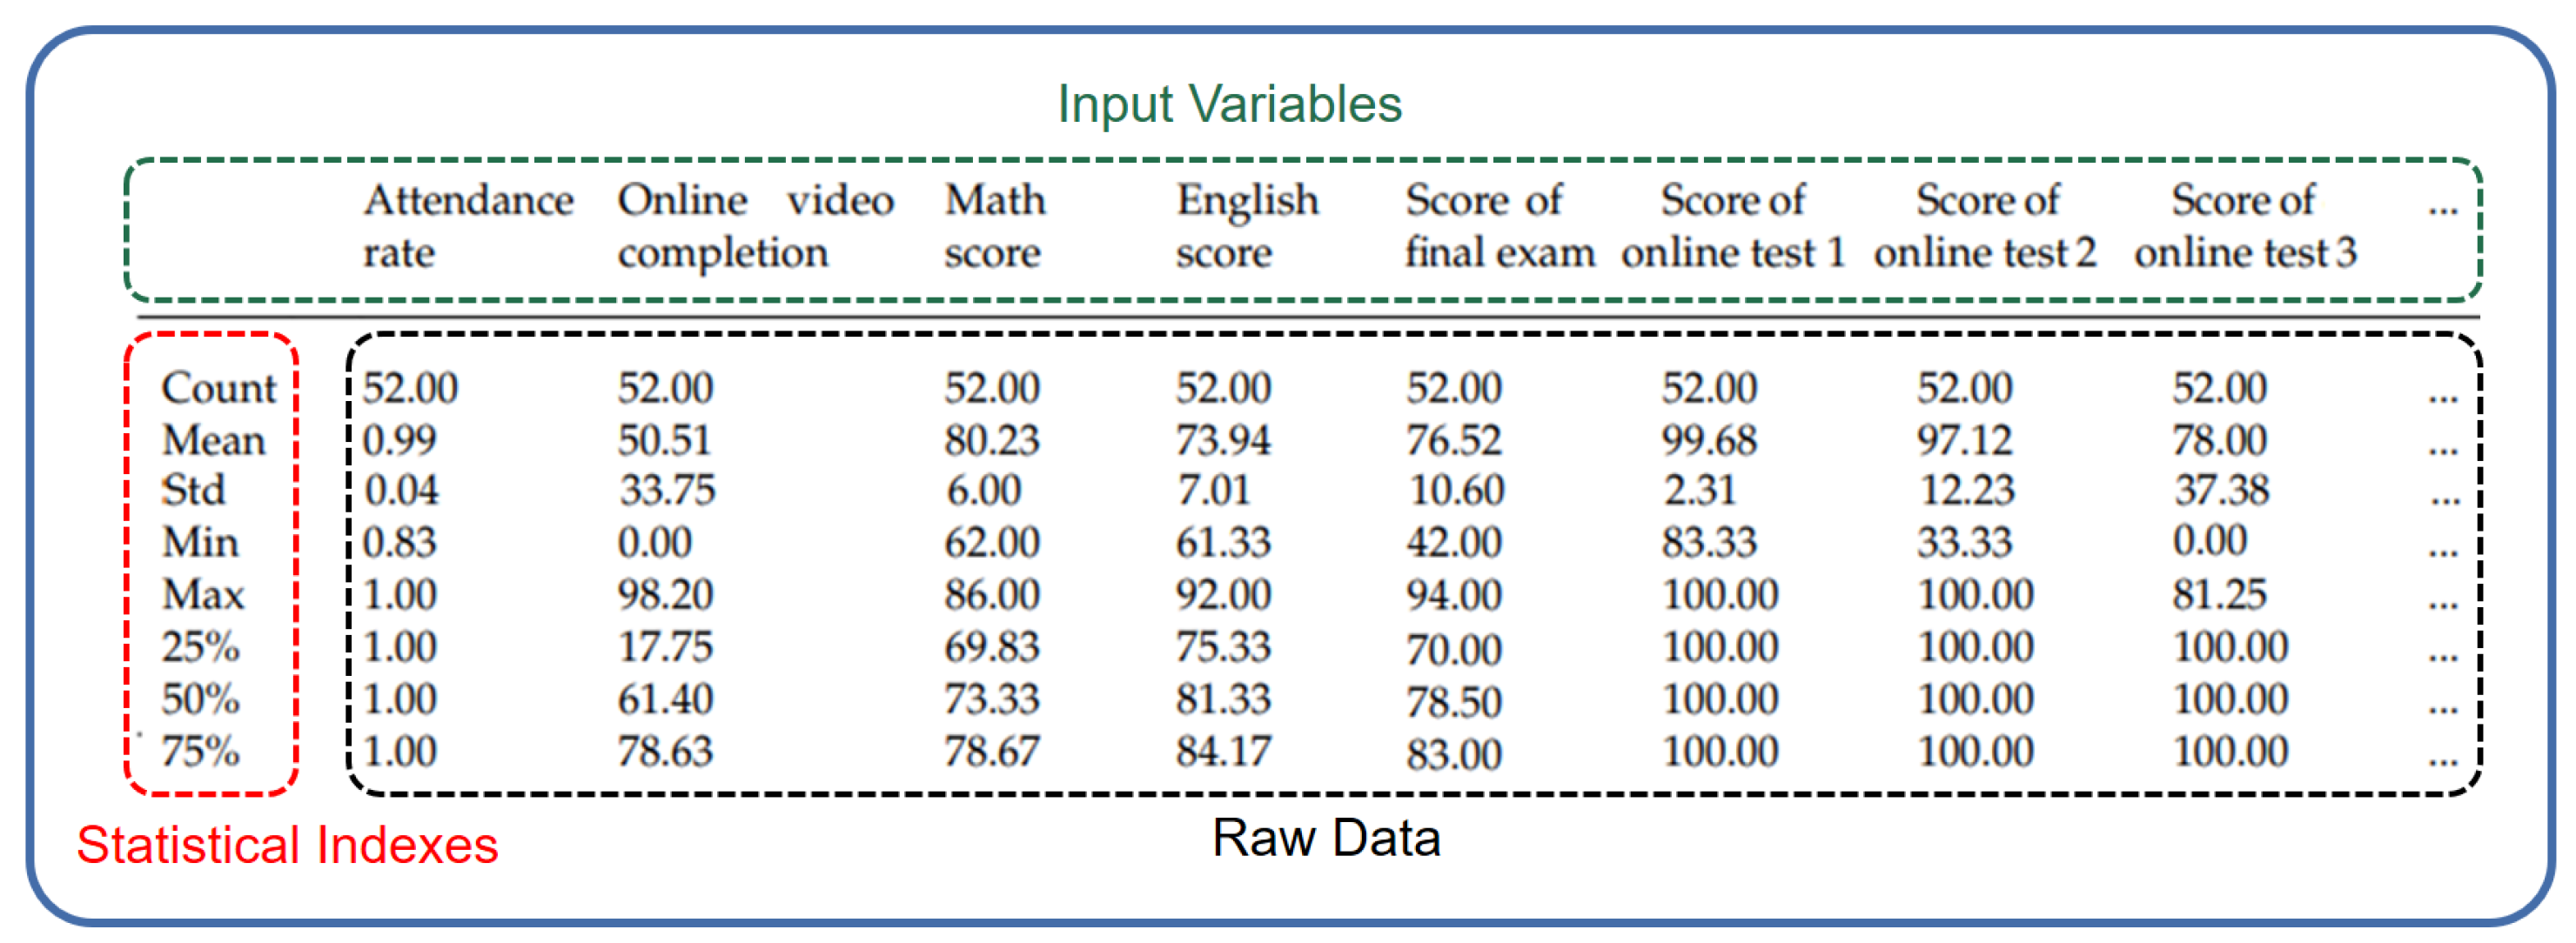
4.1. Definition of the Dataset
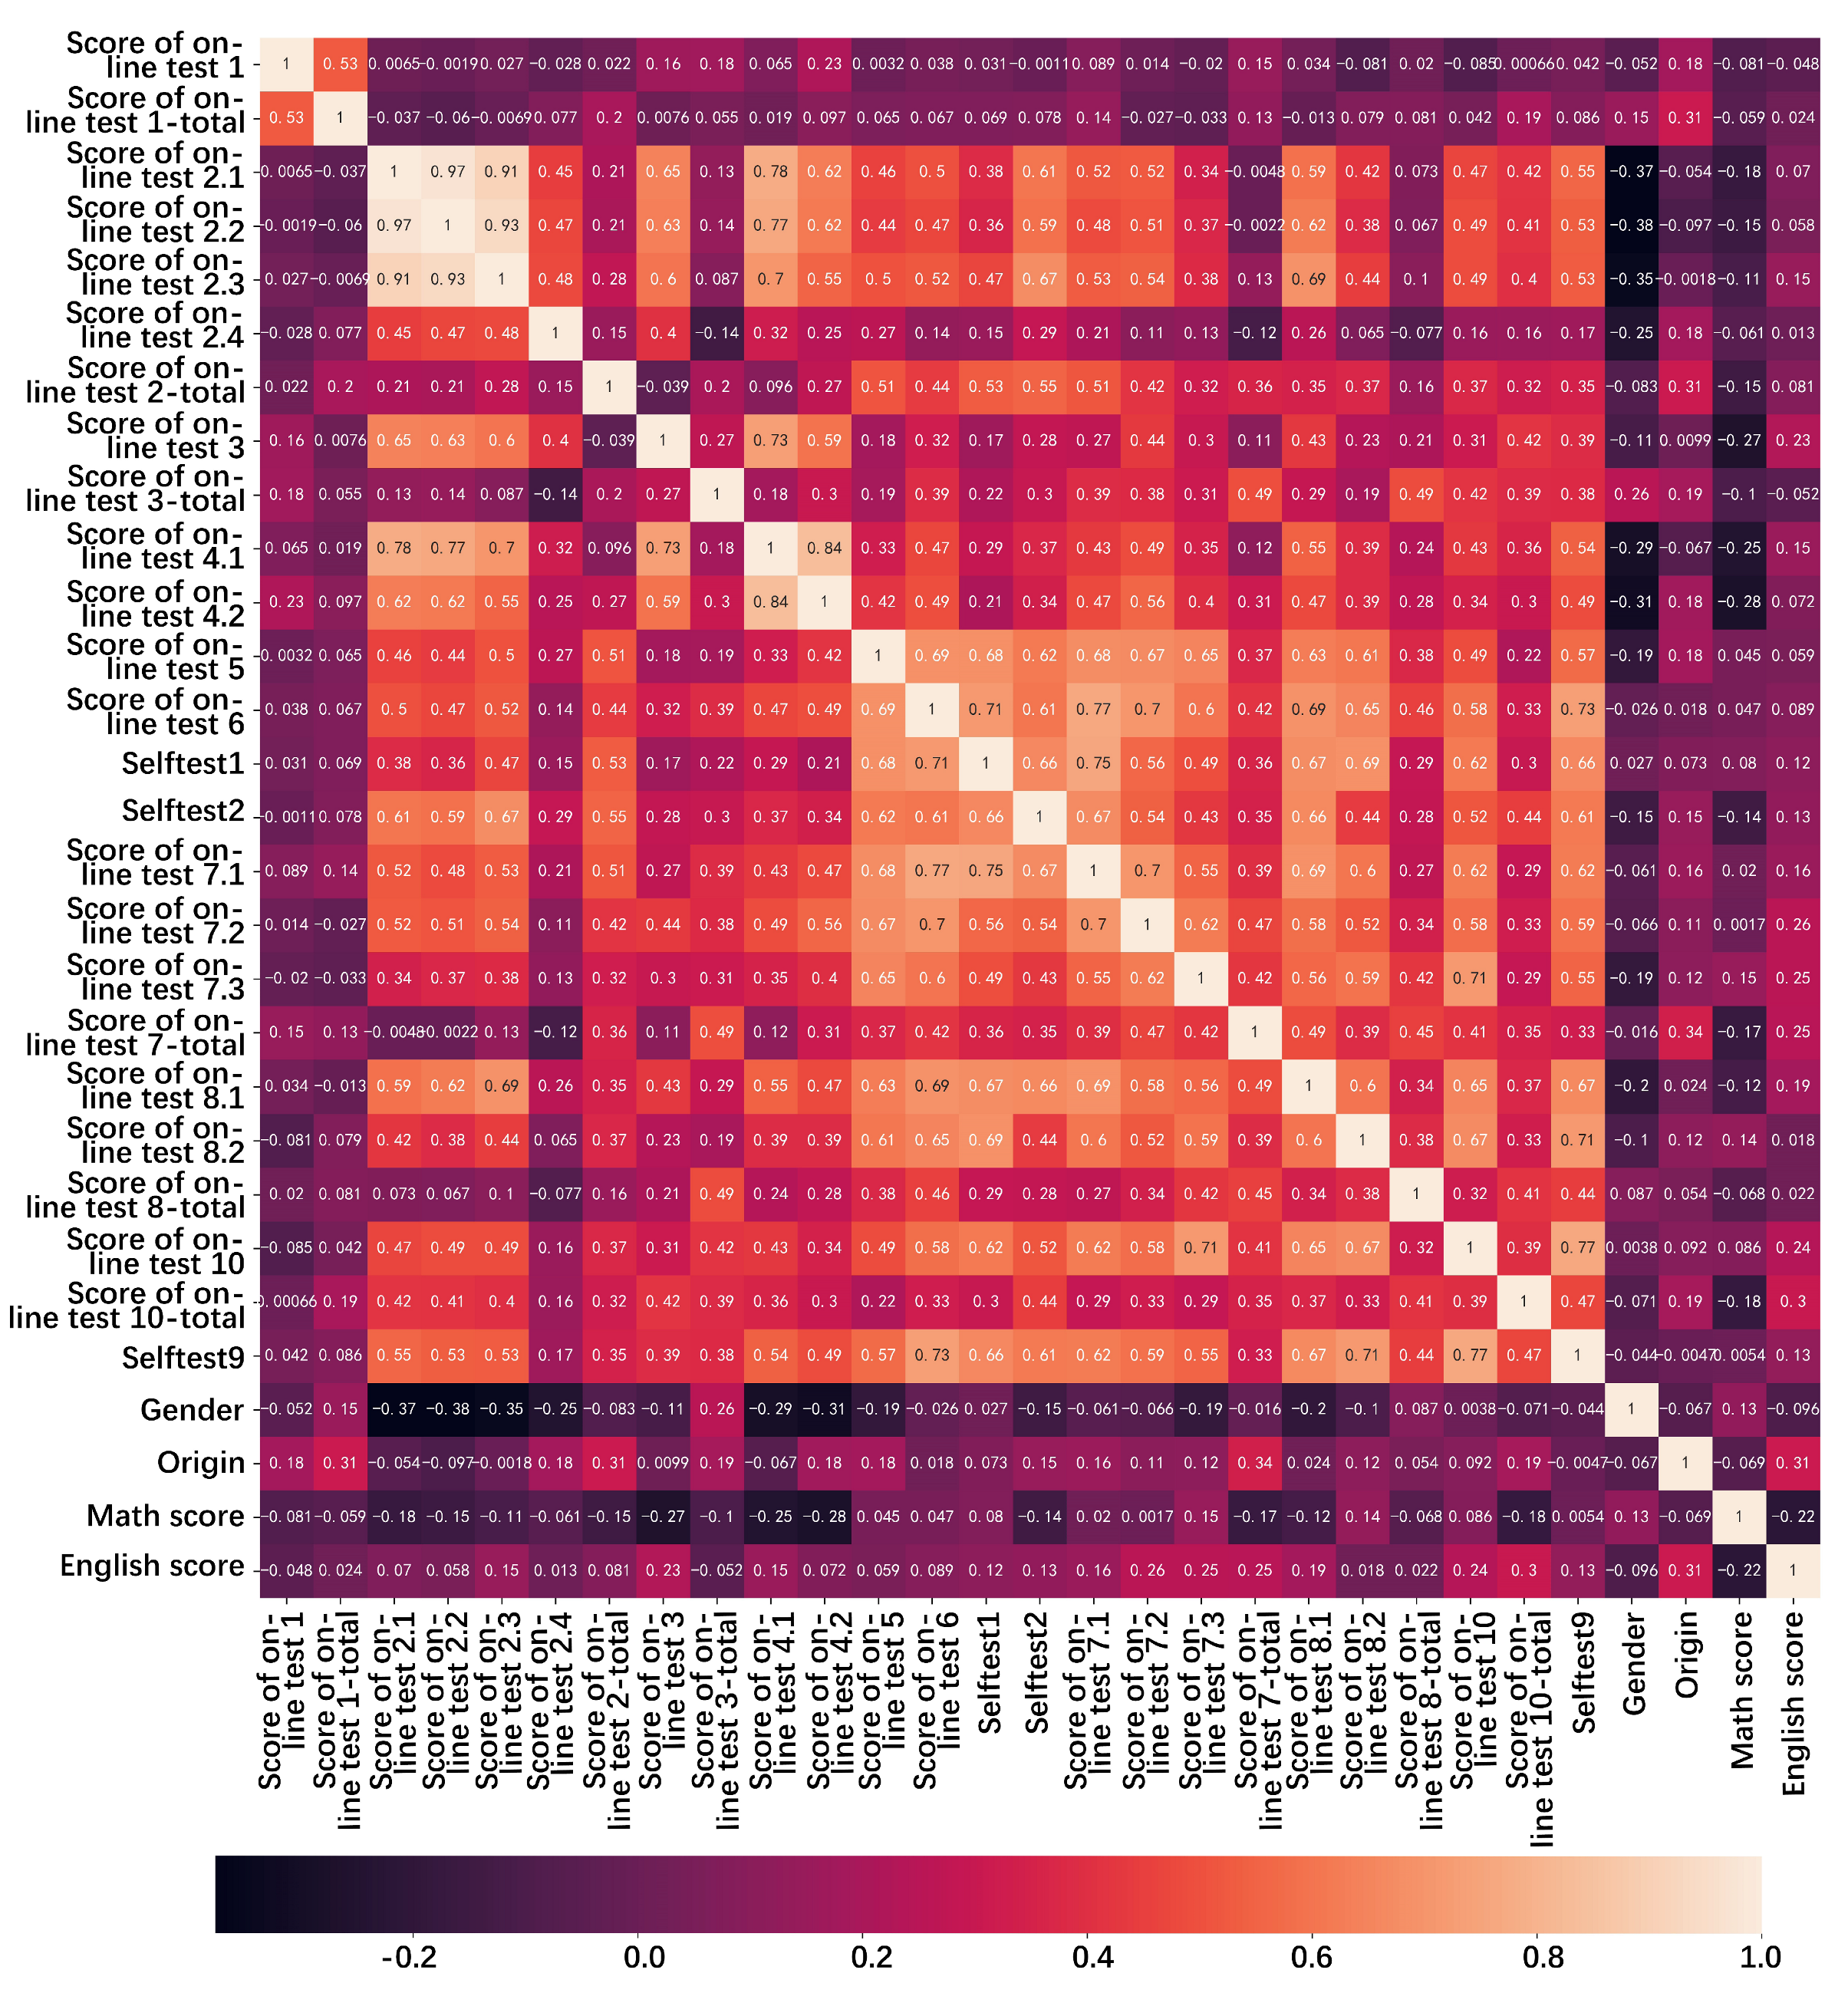
4.2. Correlation Analysis of Variables
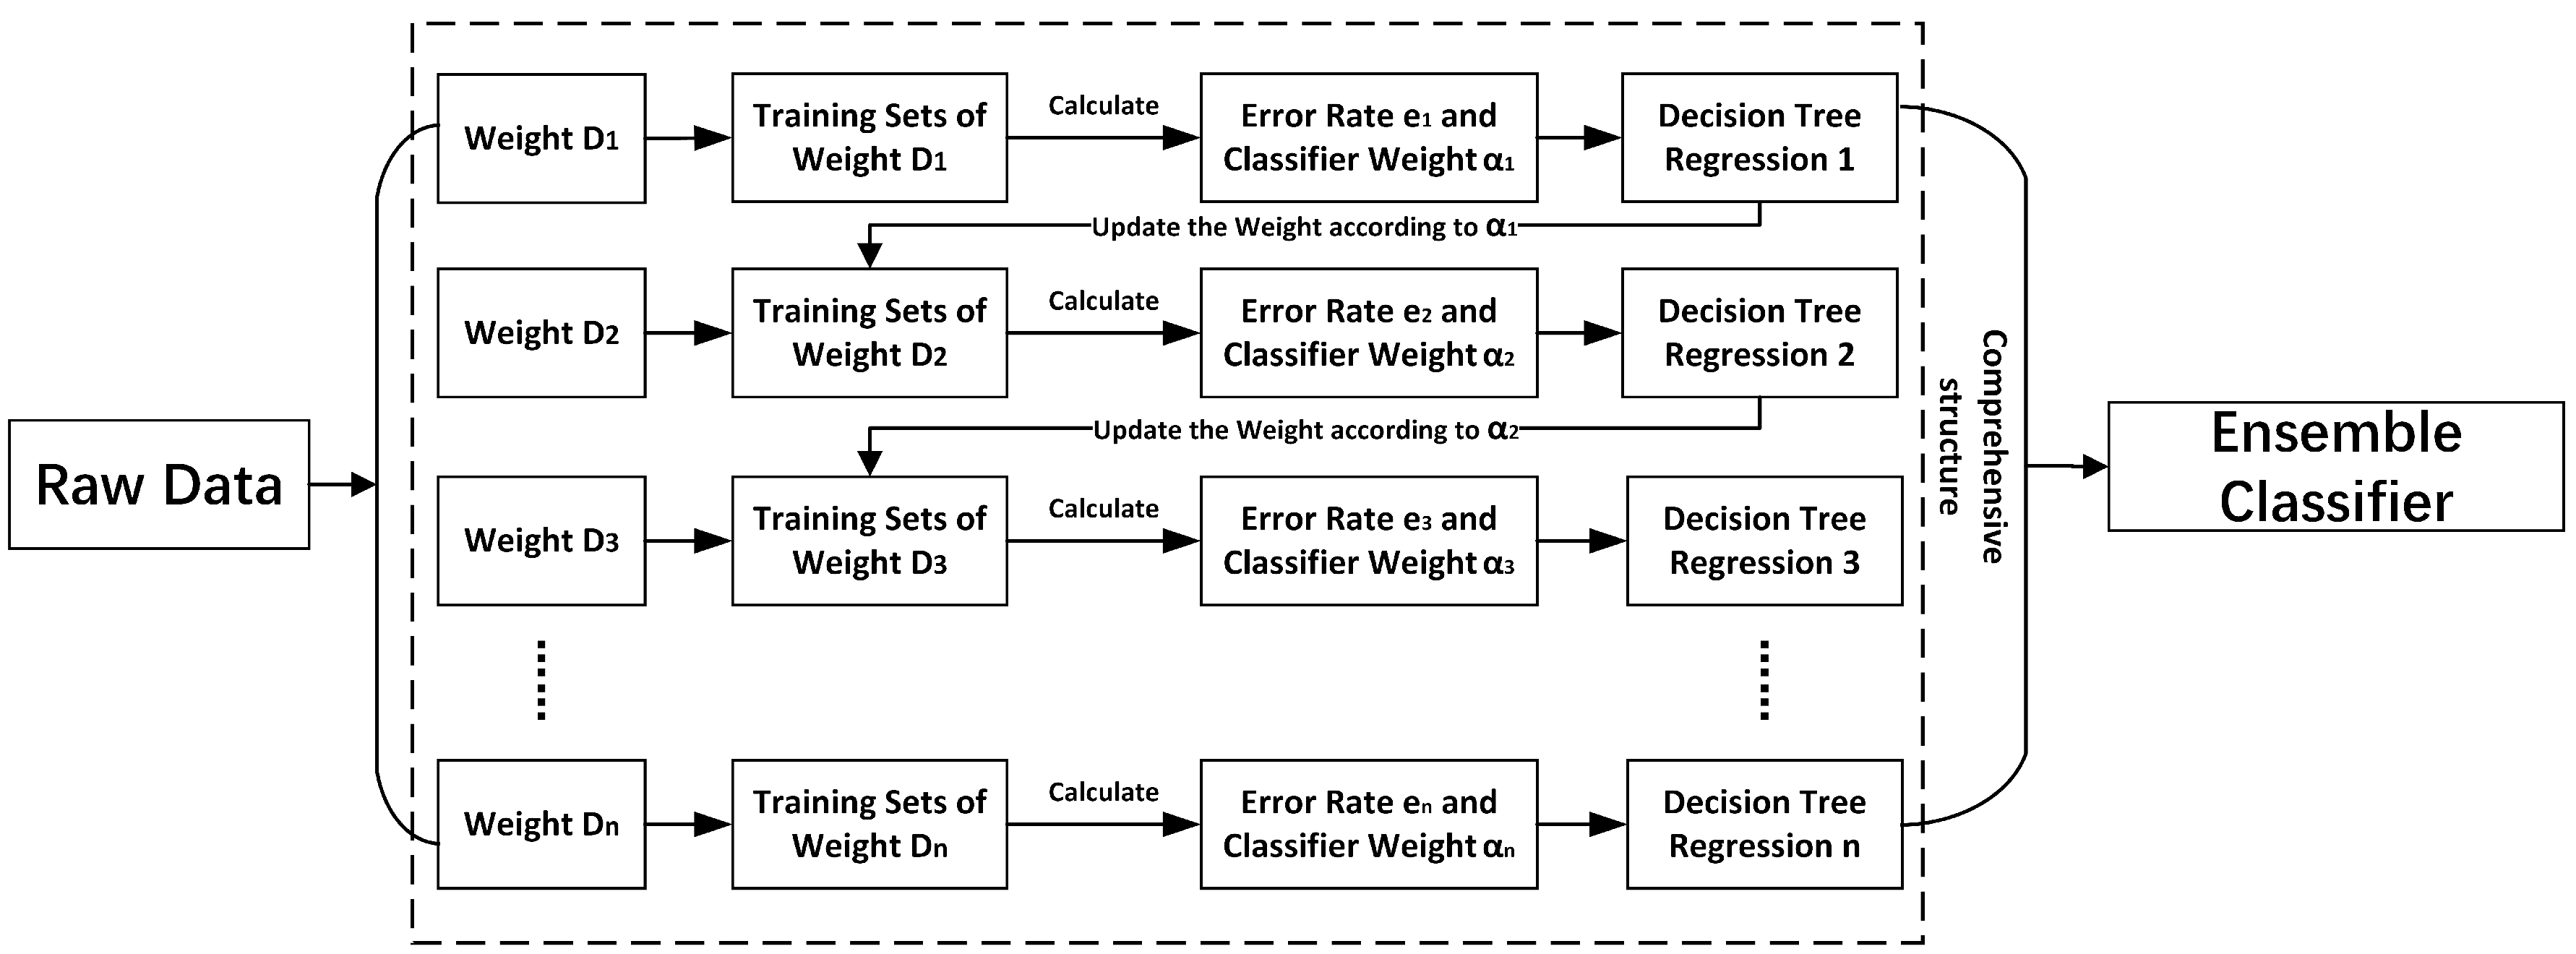
4.3. The Method of BDTR-SP
- Firstly, we divide the dataset into the training set and the test set in a ratio of 7:3, and set the initial weight of each sample in the original training as the same as the other ones.
- Secondly, we set the ensemble learner to consist of M base learners, divide the original training set into K datasets, and allocate them to all base learners.
- Thirdly, we set the decision tree as the base learner in the ensemble learner and use the base learner to train the training set.
- Fourthly, after the training is completed, we use the base learner to predict the score data of the students in the original training set.
- Fifthly, for samples with correct classification prediction, it indicates that the sample has a relatively small impact on performance prediction to reduce the weight of the sample. On the contrary, for samples with incorrect classification prediction, as they have a significant impact on the results of performance prediction, we increase the weight of the sample so as to give it a greater probability of being selected as new training data.
- Sixth, a new classifier is constructed through the above steps and trained iteratively to predict erroneous data and yield better performance.
- Finally, after the training is completed, the ensemble learner adjusts the weight of the classifier, increases the weight of the classifier with small classification error, and synthesizes the prediction results of the learner through weighted adjustment.
5. Experimental Results and Analysis
5.1. Dataset and Features
5.2. Experiment Setting
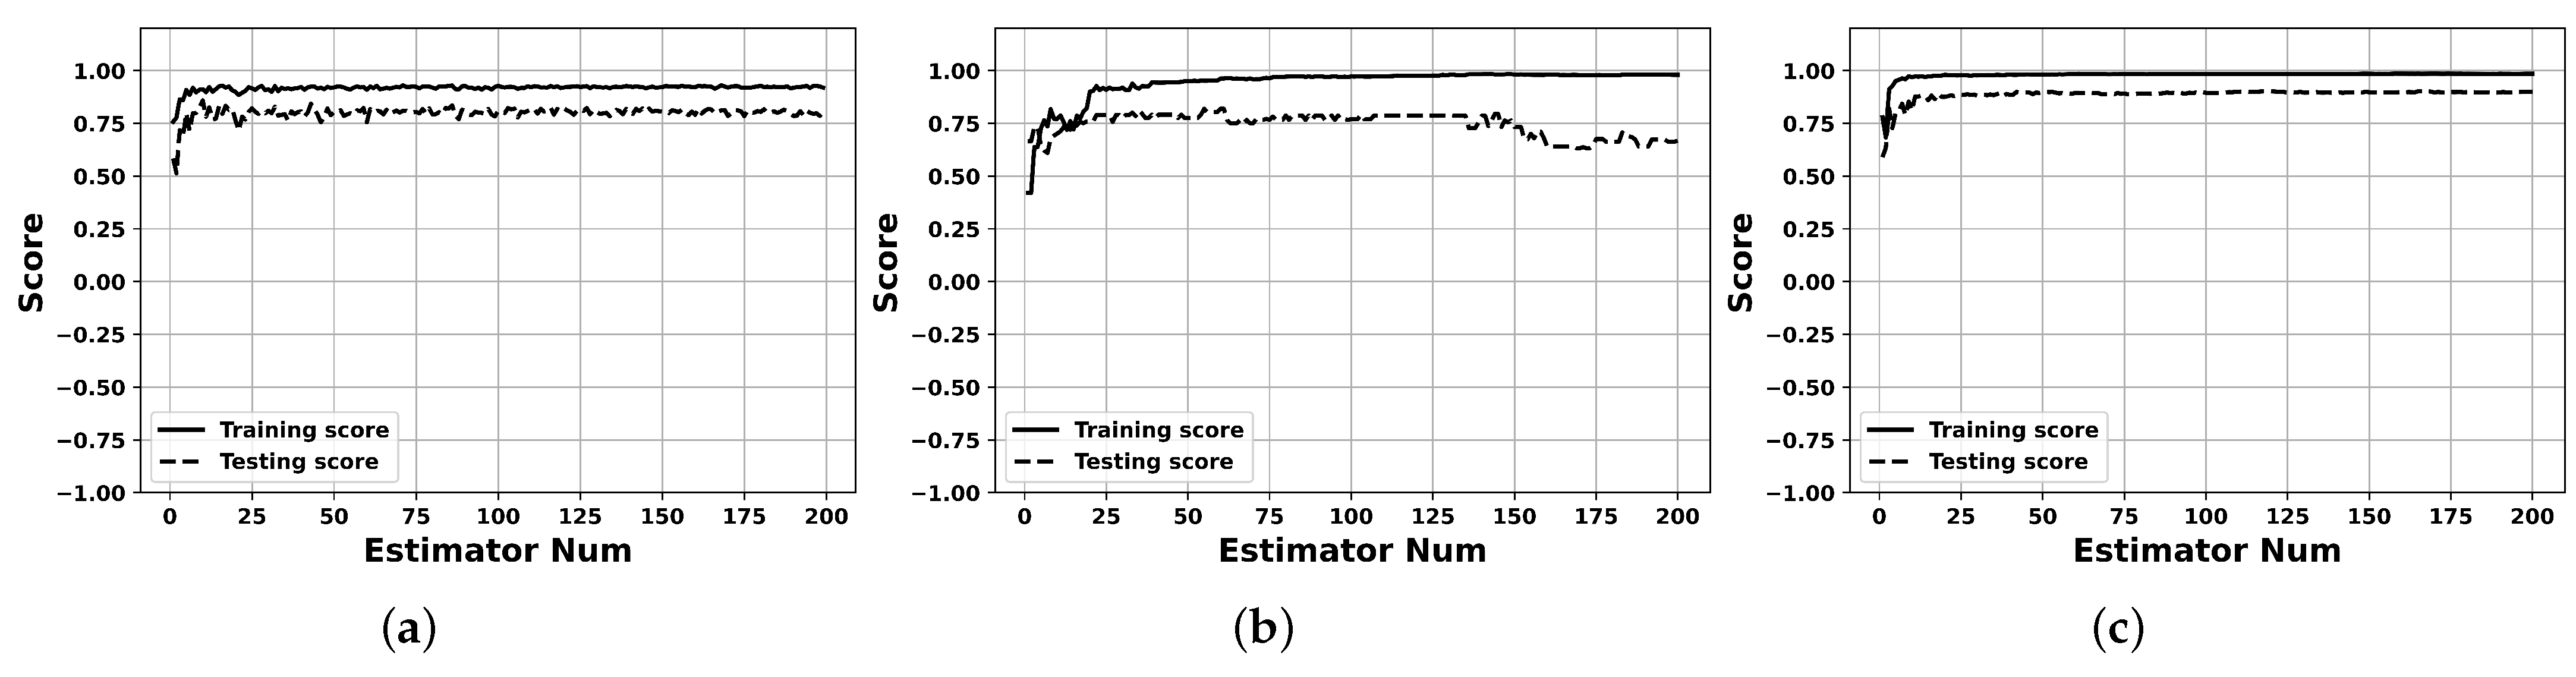
5.3. Experiment Results
6. Conclusions
Author Contributions
Funding
Data Availability Statement
Conflicts of Interest
References
- Le, Q.; Hu, H.; Xiong, Y. Research on Students’ Learning Behavior in Smart Classroom Teaching Mode. China Educ. Technol. Equip. 2020, 483, 39–41. [Google Scholar]
- Chen, X. Analysis of Student Behavior in Data Mining Based on Decision Tree. Intell. Comput. Appl. 2020, 10, 127–130. [Google Scholar]
- Yalan, D.; Kuanming, Z. Analysis and Countermeasures of Online Education Quality Problems under the Background of “Internet+”. Comput. Knowl. Technol. 2022, 18, 134–136. [Google Scholar]
- Liu, H.; Zhu, Y.; Zang, T.; Xu, Y.; Yu, J.; Tang, F. Jointly Modeling Heterogeneous Student Behaviors and Interactions among Multiple Prediction Tasks. ACM Trans. Knowl. Discov. Data 2021, 16, 16. [Google Scholar] [CrossRef]
- Zhao, Y.; Li, H.; Yu, Y. A correlational study of the learners online learning behavior and their academic achievements. J. Shijiazhuang Univ. Appl. 2022, 34, 1–8. [Google Scholar]
- Öğütcü, S. Student Performance Score Prediction Using Artificial Neural Network with the Support of Exploratory Factor Analysis and Clustering. In Proceedings of the 2020 IEEE Third International Conference on Data Stream Mining and Processing (DSMP), Lviv, Ukraine, 21– 25 August 2020; pp. 90–95. [Google Scholar]
- Li, F. An Empirical Study on Influences of College Students’ Learning Behavior Input on Academic Performance—From the Perspective of Intermediary Effect of Curriculum Cognition Goal and Learning or Weariness of Learning. J. Chang. Univ. 2022, 32, 26–36. [Google Scholar]
- Li, T.; Fu, G. An Overall View of the Educational Data Mining Domain. Mod. Educ. Technol. 2010, 20, 21–25. [Google Scholar]
- Jin, Y.; Chen, H. Value Orientations, Realistic Limitations and Effective Strategies of Big Data Mining for Education. Theory Pract. Educ. 2021, 41, 3–8. [Google Scholar]
- Tarid, W.; Surina, H.; Okan, B. A Comparison of Undersampling, Oversampling, and SMOTE Methods for Dealing with Imbalanced Classification in Educational Data Mining. Information 2023, 14, 54. [Google Scholar]
- Fei, L.; Zhan, Z. Learning Results of Large Scale Network Courses Based on Downsampled Heap Models Predicting. Comput. Appl. Softw. 2018, 35, 131–137. [Google Scholar]
- Zhang, Q.; Dai, H. Student Performance Prediction Model Based on Data Preprocessing Technology. J. Hubei Univ. Sci. 2019, 41, 8. [Google Scholar]
- Cao, X.; Cao, W.; Li, Z.; Sun, J. Prediction Method of College Students’ Scores toward Uncertain Missing Data. Mod. Electron. Tech. 2018, 41, 145–149. [Google Scholar]
- Jiang, Z.; Zhang, Y.; Li, X. Learning Behavior Analysis and Prediction Based on MOOC Data. J. Comput. Res. Dev. 2015, 52, 614–628. [Google Scholar]
- Xu, W.; Li, W.; Zhan, X.; Xu, X.; Chen, X. Research on the Performance Prediction Methods Based on Classroom Learning Behavior. Mod. Educ. Technol. 2021, 31, 104–111. [Google Scholar]
- Song, D.; Liu, D.; Feng, X. Course Performance Prediction and Course Early Warning Research Based on Multi-source Data Analysis. Res. High. Educ. Eng. 2020, 1, 89–194. [Google Scholar]
- de Oliveira, C.F.; Rolland, S.S.; João, F.M.; Fernando, M. How Does Learning Analytics Contribute to Prevent Students’ Dropout in Higher Education: A Systematic Literature Review. Big Data Cogn. Comput. 2021, 5, 64. [Google Scholar] [CrossRef]
- Ali, Y.; Çevik, M. Prediction of academic achievements of vocational and technical high school (VTS) students in science courses through artificial neural networks (comparison of Turkey and Malaysia). Educ. Inf. Technol. 2019, 24, 2147–2167. [Google Scholar]
- You, J.; Sun, Z. Predictions of and interventions in university students’ academic achievement on cloud-based learning platforms. Chin. J. Distance Educ. 2016, 9, 14–20. [Google Scholar]
- Chen, M.; Bian, K.; He, Y.; Li, Z.; Zheng, H. Enhanced Learning and Forgetting Behavior for Contextual Knowledge Tracing. Information 2023, 14, 168. [Google Scholar] [CrossRef]
- Li, M.; Wang, X.; Ruan, S.; Zhang, K.; Liu, Q. Student Performance Prediction Model Based on Two-Way Attention Mechanism. J. Comput. Res. Dev. 2020, 57, 17–29. [Google Scholar]
- Luo, Y.; Hang, X. A Model for Predicting Student Performance in Hybrid Courses Based on Incremental Learning Algorithm. E-Educ. Res. 2021, 42, 83–90. [Google Scholar]
- Chen, X.; Mei, G.; Zhang, J.; Xu, W. Student Grade Prediction Method Based on Knowledge Graph and Collaborative Filtering. J. Comput. Appl. 2020, 40, 595–601. [Google Scholar]
- Zhang, Y.; Lu, M.; Zheng, Y.; Li, H. Student Grade Prediction Based on Graph Auto-Encoder Model. Comput. Eng. Appl. 2021, 57, 251–257. [Google Scholar]
- Chen, Z.; Zhu, X. Research on Prediction Model of Online Learners’ Academic Achievement Based on Educational Data Mining. China Educ. Technol. 2017, 12, 75–81. [Google Scholar]
- Toprak, E.; Gelbal, S. Comparison of Classification Performances of Mathematics Achievement at PISA 2012 with the Artificial Neural Network, Decision Trees and Discriminant Analysis. Int. J. Assess. Tools Educ. 2020, 7, 773–799. [Google Scholar] [CrossRef]
- Nuankaew, P.; Nuankaew, W.; Teeraputon, D.; Phanniphong, K.; Bussaman, S. Prediction Model of Student Achievement in Business Computer Disciplines. Int. J. Emerg. Technol. Learn. (iJET) 2020, 15, 160–181. [Google Scholar] [CrossRef]
- Lykourentzou, I.; Giannoukos, I.; Mpardis, G.; Nikolopoulos, V.; Loumos, V. Early and dynamic student achievement prediction in e-learning courses using neural networks. J. Am. Soc. Inf. Sci. Technol. 2009, 60, 372–380. [Google Scholar] [CrossRef]
- Peng, Z. Research on Feature Analysis Technology for Small Sample Data. Diploma Thesis, University of Electronic Science and Technology of China, Chengdu, China, 2021. [Google Scholar]
- Wei, B. Research on Classification of High-dimensional Small Sample Data based on Bayesian Deep Learning. Diploma Thesis, North China Electric Power University, Beijing, China, 2020. [Google Scholar]
- Huang, J. Comparative Study on Classification Methods of Two High-Dimensional and Small Sample Data. Diploma Thesis, Huazhong University of Science and Technology, Wuhan, China, 2018. [Google Scholar]
- Zhang, J. Classification and Feature Selection on High-dimensional and Small-Sampling Data. Diploma Thesis, Hefei University of Technology, Hefei, China, 2014. [Google Scholar]
- Wang, Z.H.E.; Wu, C.; Zheng, K.; Niu, X.; Wang, X. SMOTETomek-Based Resampling for Personality Recognition. IEEE Access 2019, 7, 129678–129689. [Google Scholar] [CrossRef]
- Li, D.; Liu, J.; Liu, J. NNI-SMOTE-XGBoost: A Novel Small Sample Analysis Method for Properties Prediction of Polymer Materials. Macromol. Theory Simul. 2021, 30, 2100010. [Google Scholar] [CrossRef]
- Dey, I. Class attendance and academic performance: A subgroup analysis. Int. Rev. Econ. Educ. 2018, 28, 29–40. [Google Scholar] [CrossRef]
- Xu, P.; Ji, X.; Li, M.; Lu, W. Small data machine learning in materials science. npj Comput. Mater. 2023, 9, 42. [Google Scholar] [CrossRef]
- Huang, Z. Research on the Method of Predicting Students’ Dropout Behavior in MOOC. Master’s Thesis, South China University of Technology, Guangzhou, China, 2021. [Google Scholar]


| Attribute | Description | Range |
|---|---|---|
| Gender | Gender of the student | |
| Student number | Identification of the student | String |
| Online test score | An online test score | |
| In-class test score | An in-class test score | |
| Attendance rate | Students’ attendance rate | |
| Origin | The provinces or metropolises where students come from | Int |
| Initial score in Mathematics | The student’s entrance score in Mathematics | [0, 100] |
| Initial score in English | The student’s entrance score in English | |
| Final score | The student’s final score in the selected course of the university | |
| Online video completion | The student’s completion in the learning of MOOC |
| Variables | Note |
|---|---|
| Sum of product of x and y | |
| , | Sum of product of x, y |
| , | Eigenvalues (model input variables, such as test scores, place of origin, etc.) |
| , | The average value of x, y |
| The correlation coefficient of x and y | |
| The corresponding value on the trend line of | |
| n | The amount of samples. |
| 239.194 | 0.0485 | 10190.42 | 156.7751 |
| Model | |
|---|---|
| Single model with DTR | 0.3012 |
| Random Forest | 0.6221 |
| Ensemble model with GNB | 0.6572 |
| BDTR-SP | 0.9324 |
| Differences in Attributes | Random Forest | Ensemble Model with GNB | BDTR-SP |
|---|---|---|---|
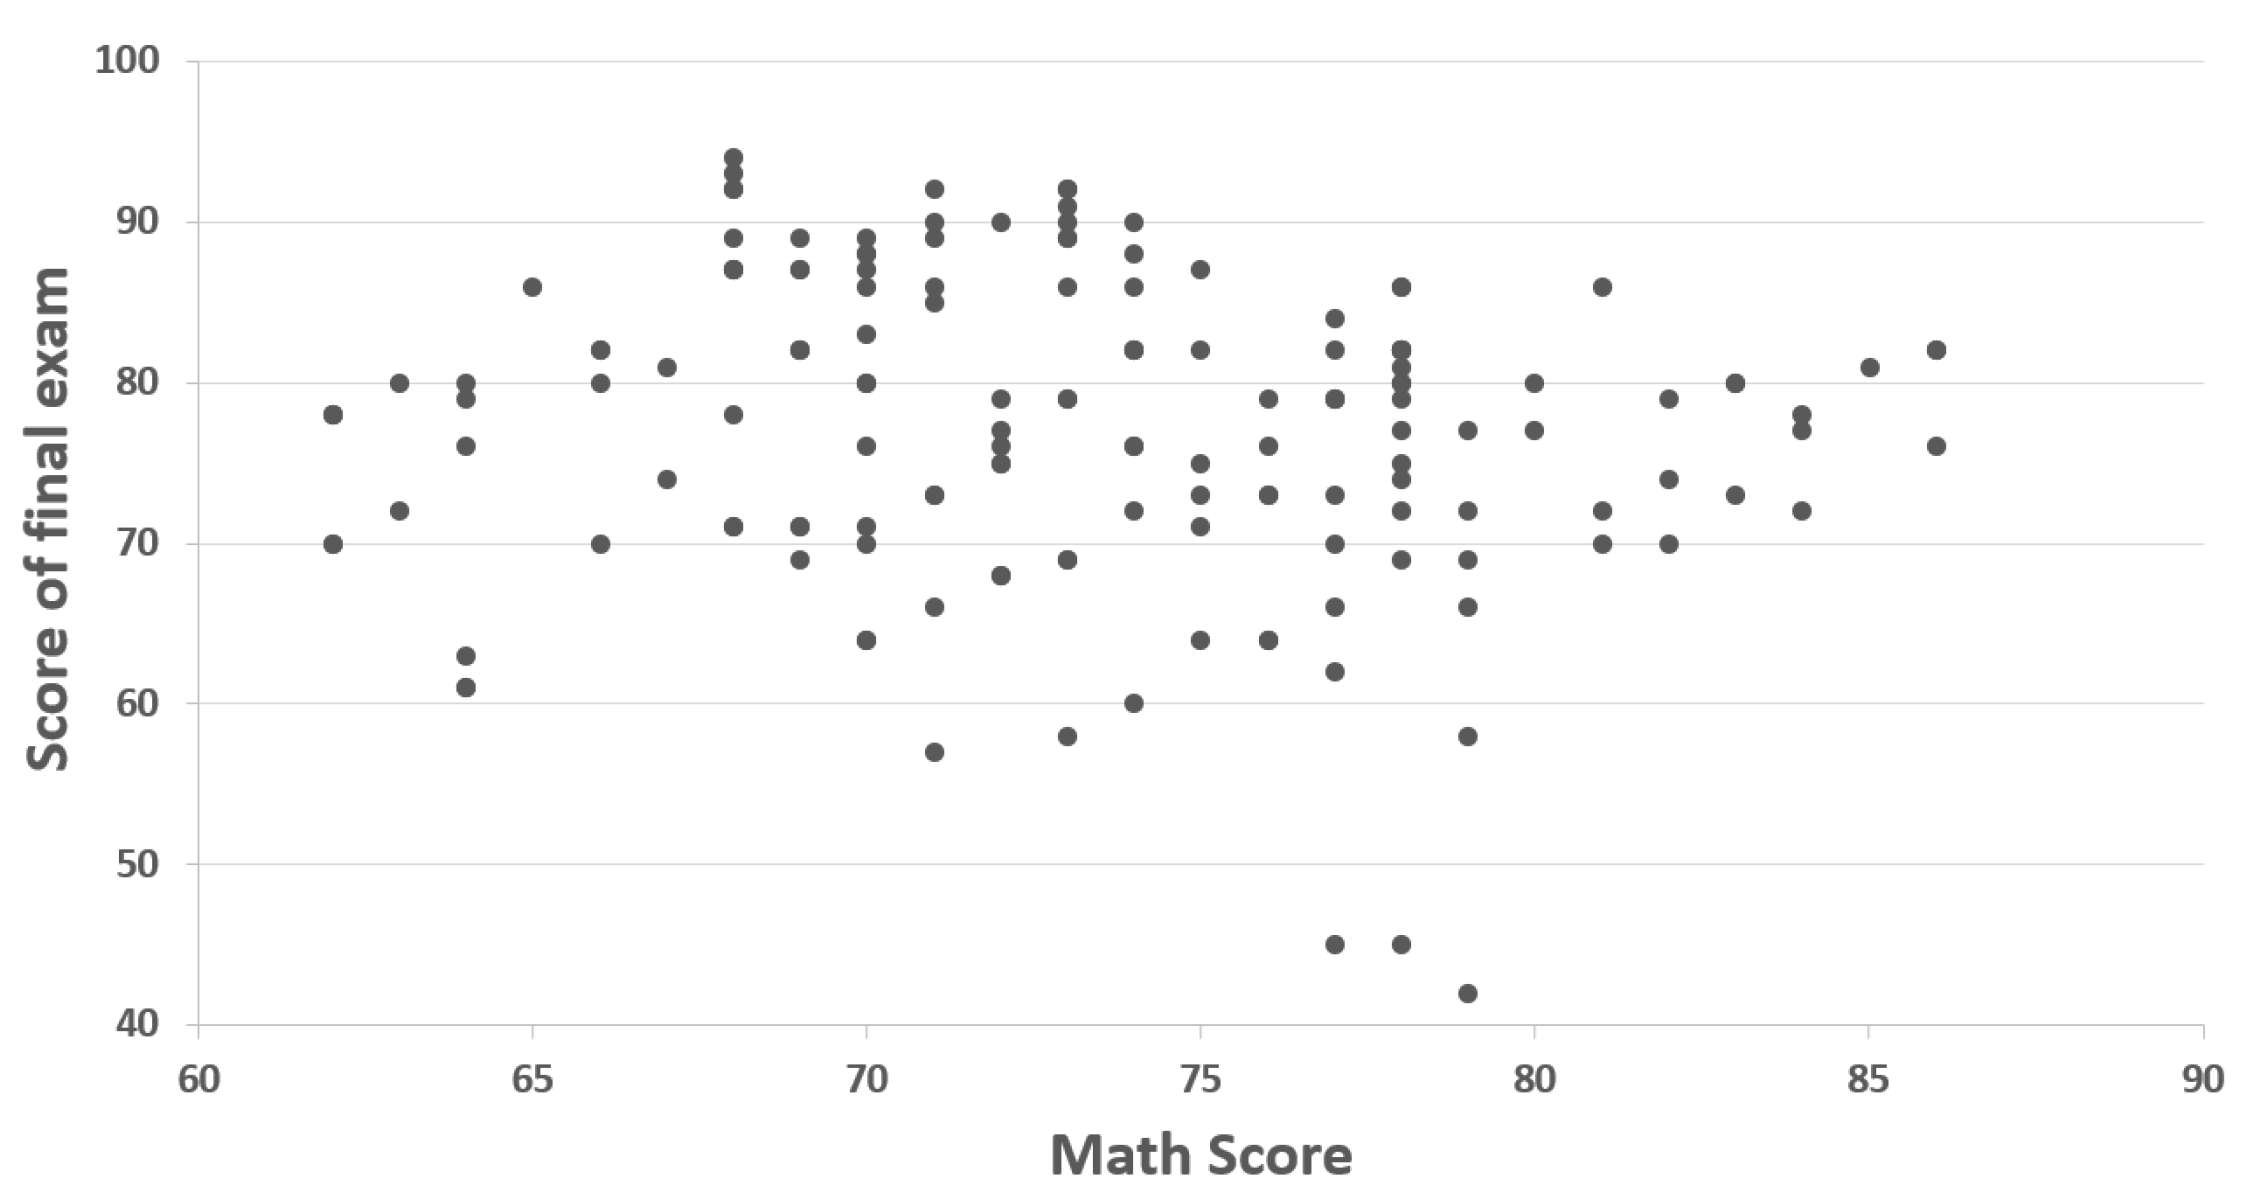
| Cases with math scores | 0.6221 | 0.7249 | 0.8676 |
| Cases without math scores | 0.6051 | 0.7400 | 0.8800 |
| Differences in Attributes | Random Forest | Ensemble Model with GNB | BDTR-SP |
|---|---|---|---|
| Cases with origins | 0.6221 | 0.7484 | 0.8521 |
| Cases without origins | 0.6077 | 0.6848 | 0.8290 |
Disclaimer/Publisher’s Note: The statements, opinions and data contained in all publications are solely those of the individual author(s) and contributor(s) and not of MDPI and/or the editor(s). MDPI and/or the editor(s) disclaim responsibility for any injury to people or property resulting from any ideas, methods, instructions or products referred to in the content. |
© 2023 by the authors. Licensee MDPI, Basel, Switzerland. This article is an open access article distributed under the terms and conditions of the Creative Commons Attribution (CC BY) license (https://creativecommons.org/licenses/by/4.0/).
Share and Cite
Zhu, L.; Liu, G.; Lv, S.; Chen, D.; Chen, Z.; Li, X. An Intelligent Boosting and Decision-Tree-Regression-Based Score Prediction (BDTR-SP) Method in the Reform of Tertiary Education Teaching. Information 2023, 14, 317. https://doi.org/10.3390/info14060317
Zhu L, Liu G, Lv S, Chen D, Chen Z, Li X. An Intelligent Boosting and Decision-Tree-Regression-Based Score Prediction (BDTR-SP) Method in the Reform of Tertiary Education Teaching. Information. 2023; 14(6):317. https://doi.org/10.3390/info14060317
Chicago/Turabian StyleZhu, Ling, Guangyu Liu, Shuang Lv, Dongjie Chen, Zhihong Chen, and Xiang Li. 2023. "An Intelligent Boosting and Decision-Tree-Regression-Based Score Prediction (BDTR-SP) Method in the Reform of Tertiary Education Teaching" Information 14, no. 6: 317. https://doi.org/10.3390/info14060317